Embed Size (px)
Citation preview
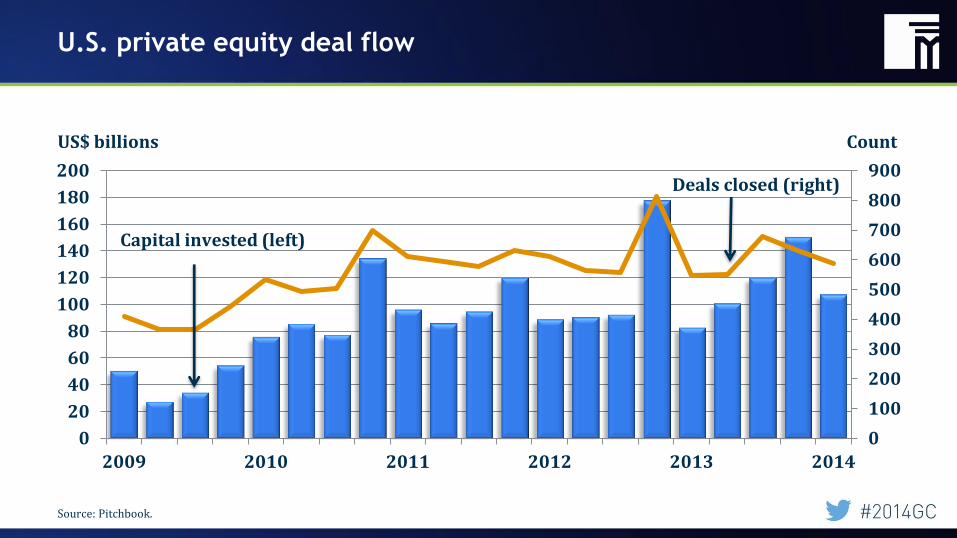
U.S. private equity deal flow
0
100
200
300
400
500
600
700
800
900
0
20
40
60
80
100
120
140
160
180
200
2009 2010 2011 2012 2013 2014
US$ billions Count
Capital invested (left)
Deals closed (right)
Source: Pitchbook.
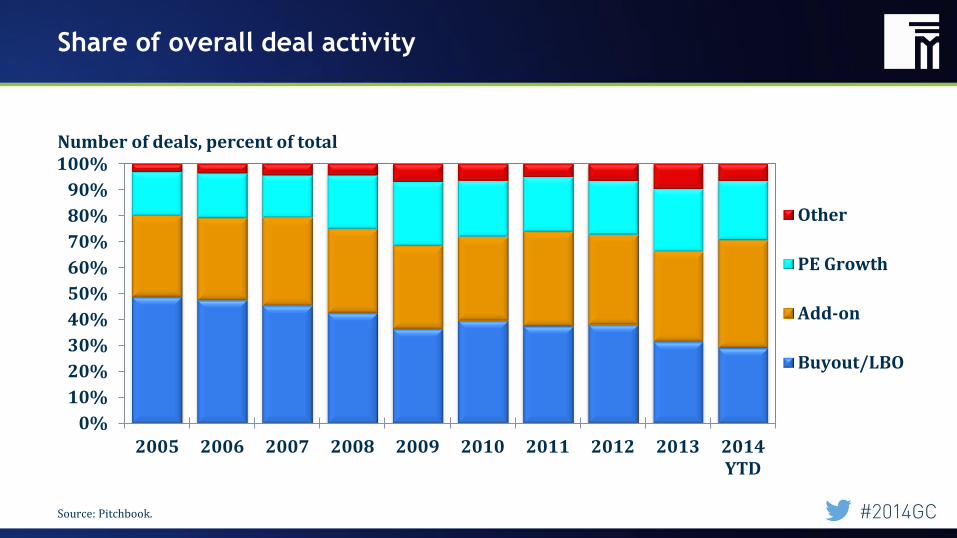
Share of overall deal activity
0%
10%
20%
30%
40%
50%
60%
70%
80%
90%
100%
2005 2006 2007 2008 2009 2010 2011 2012 2013 2014YTD
Other
PE Growth
Add-on
Buyout/LBO
Number of deals, percent of total
Source: Pitchbook.
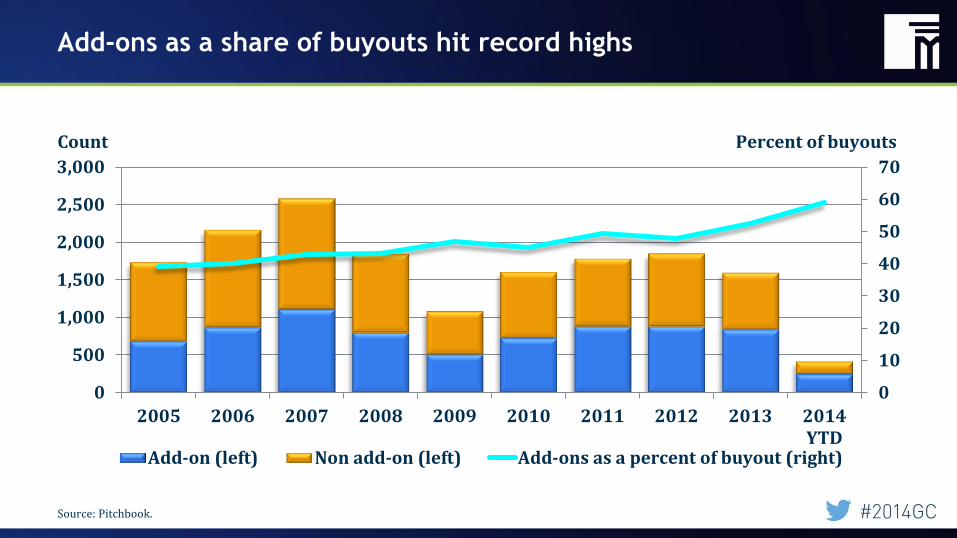
Add-ons as a share of buyouts hit record highs
0
10
20
30
40
50
60
70
0
500
1,000
1,500
2,000
2,500
3,000
2005 2006 2007 2008 2009 2010 2011 2012 2013 2014YTD
Add-on (left) Non add-on (left) Add-ons as a percent of buyout (right)
Count Percent of buyouts
Source: Pitchbook.
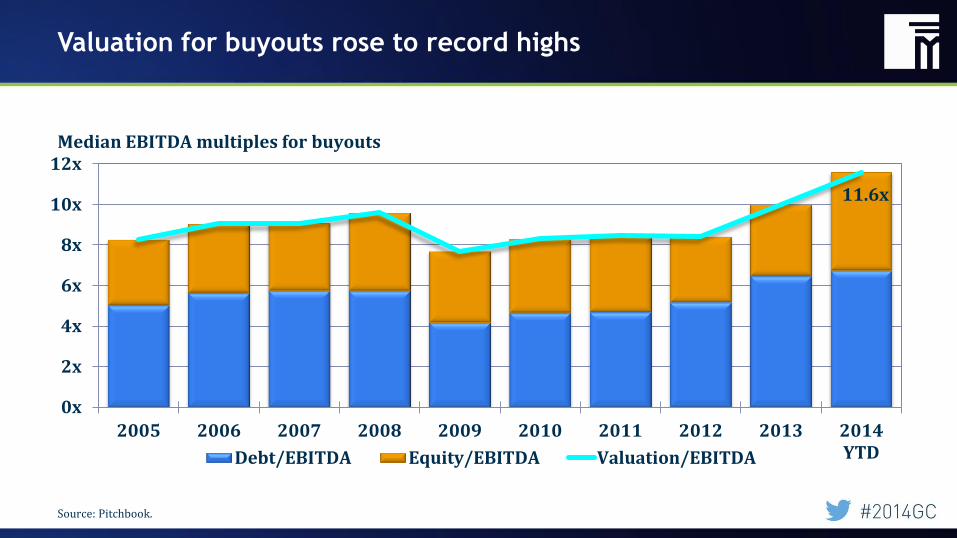
Valuation for buyouts rose to record highs
0x
2x
4x
6x
8x
10x
12x
2005 2006 2007 2008 2009 2010 2011 2012 2013 2014YTDDebt/EBITDA Equity/EBITDA Valuation/EBITDA
Median EBITDA multiples for buyouts
11.6x
Source: Pitchbook.
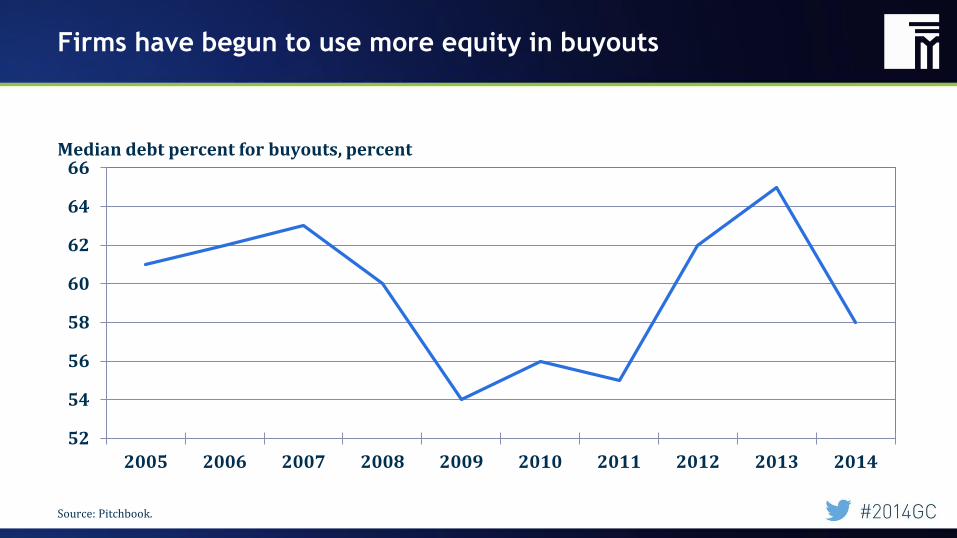
Firms have begun to use more equity in buyouts
52
54
56
58
60
62
64
66
2005 2006 2007 2008 2009 2010 2011 2012 2013 2014
Median debt percent for buyouts, percent
Source: Pitchbook.
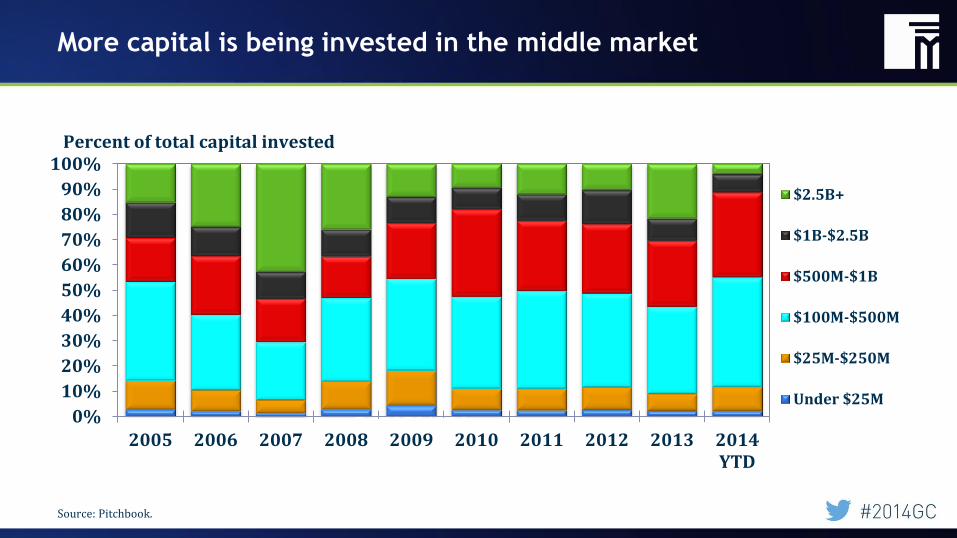
More capital is being invested in the middle market
8.197660441 9.821098686 10.94742011 9.657081486 7.069781081 9.334613163 9.607647915 11.36363048 9.957557606 2.305053263 0%
10%
20%
30%
40%
50%
60%
70%
80%
90%
100%
2005 2006 2007 2008 2009 2010 2011 2012 2013 2014YTD
$2.5B+
$1B-$2.5B
$500M-$1B
$100M-$500M
$25M-$250M
Under $25M
Percent of total capital invested
Source: Pitchbook.
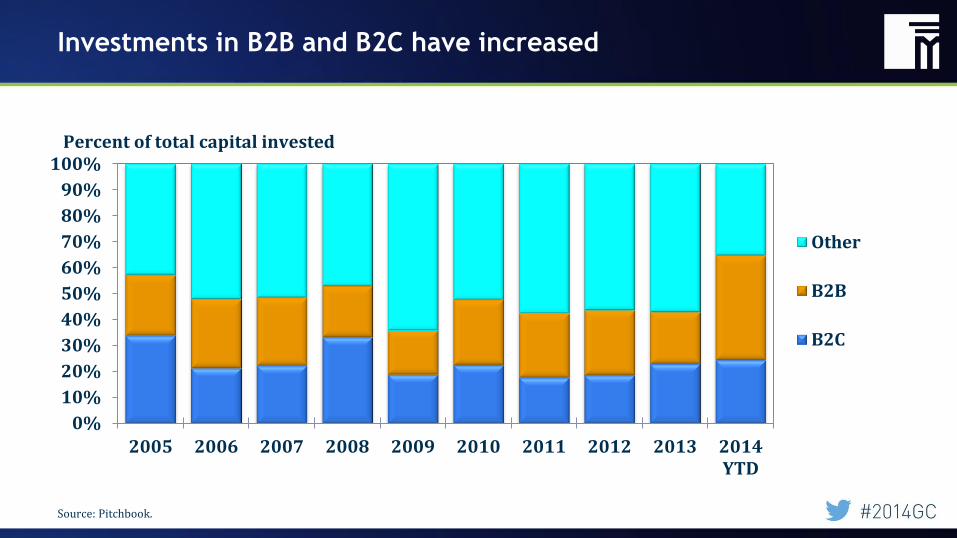
Investments in B2B and B2C have increased
0%
10%
20%
30%
40%
50%
60%
70%
80%
90%
100%
2005 2006 2007 2008 2009 2010 2011 2012 2013 2014YTD
Other
B2B
B2C
Percent of total capital invested
Source: Pitchbook.
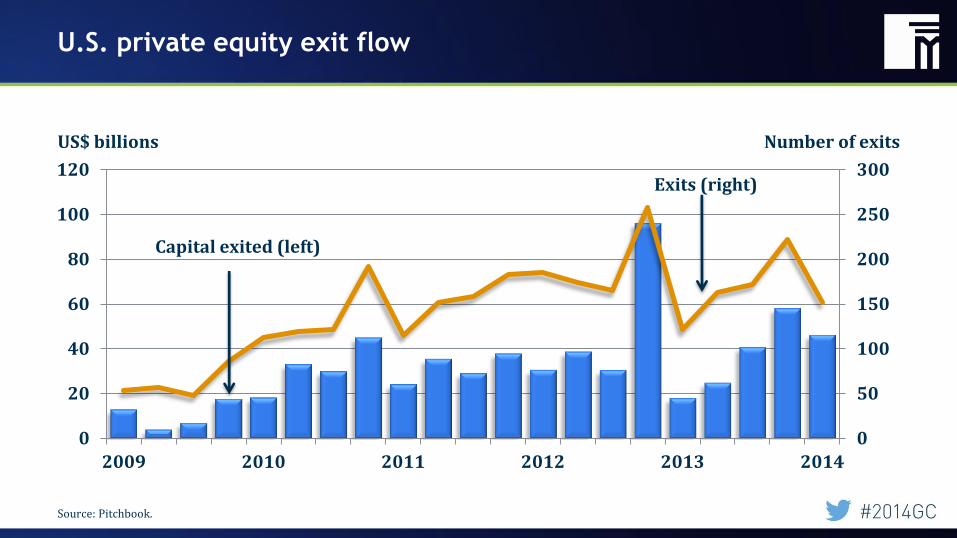
U.S. private equity exit flow
0
50
100
150
200
250
300
0
20
40
60
80
100
120
2009 2010 2011 2012 2013 2014
US$ billions Number of exits
Capital exited (left)
Exits (right)
Source: Pitchbook.
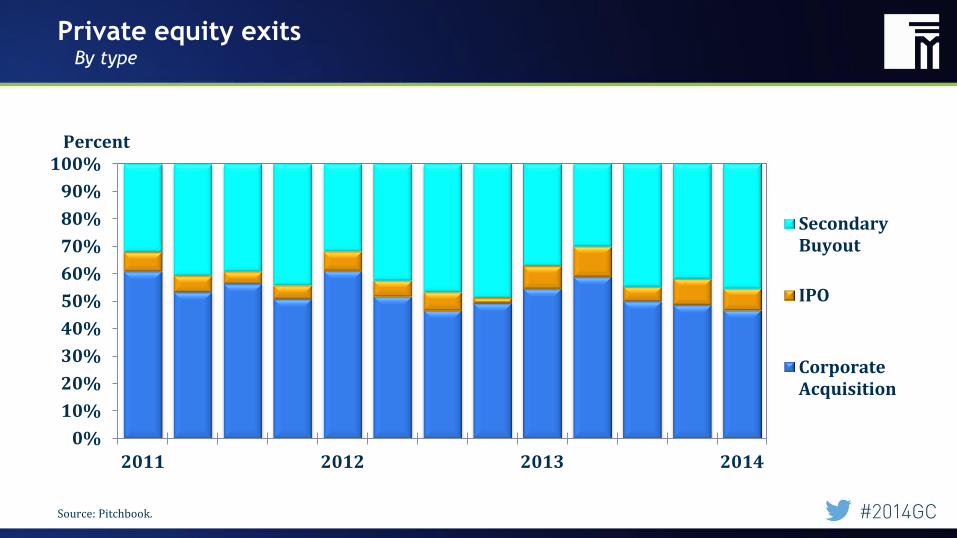
Private equity exits By type
0%
10%
20%
30%
40%
50%
60%
70%
80%
90%
100%
2011 2012 2013 2014
SecondaryBuyout
IPO
CorporateAcquisition
Percent
Source: Pitchbook.
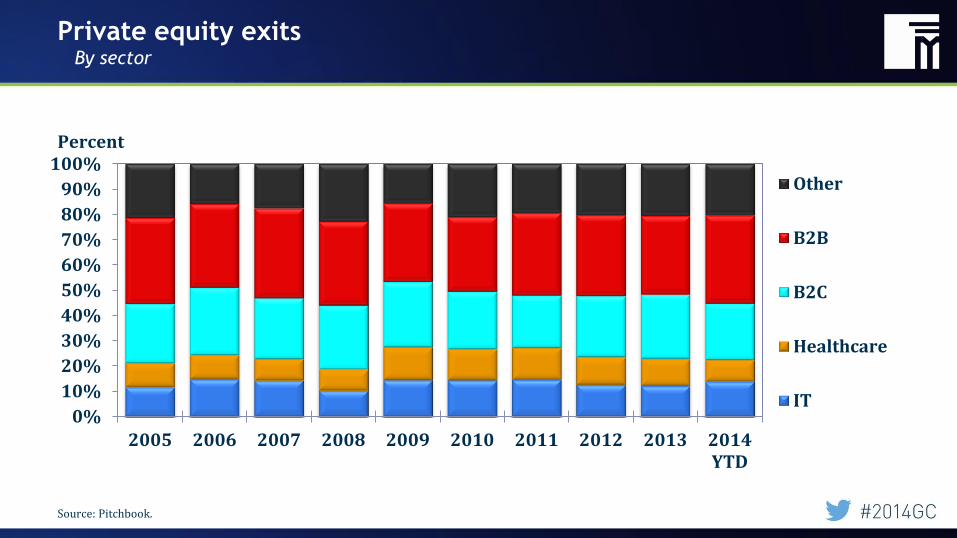
Private equity exits By sector
0%
10%
20%
30%
40%
50%
60%
70%
80%
90%
100%
2005 2006 2007 2008 2009 2010 2011 2012 2013 2014YTD
Other
B2B
B2C
Healthcare
IT
Percent
Source: Pitchbook.
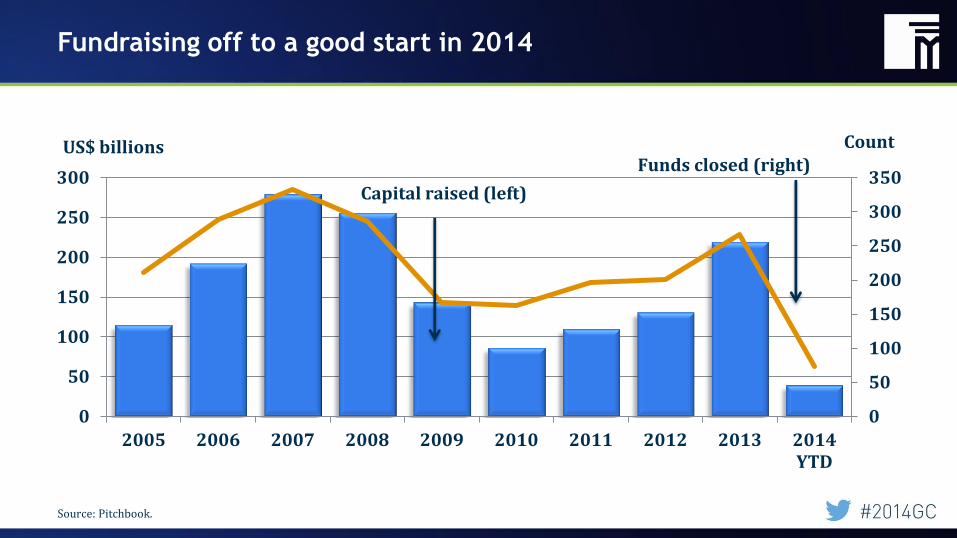
Fundraising off to a good start in 2014
0
50
100
150
200
250
300
350
0
50
100
150
200
250
300
2005 2006 2007 2008 2009 2010 2011 2012 2013 2014YTD
US$ billions Count
Capital raised (left)
Funds closed (right)
Source: Pitchbook.
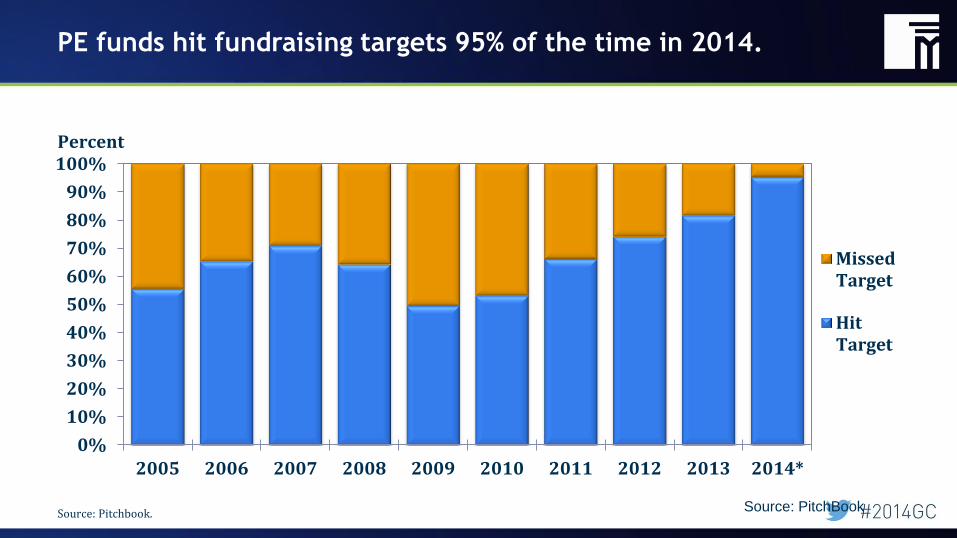
PE funds hit fundraising targets 95% of the time in 2014.
Source: PitchBook
0%
10%
20%
30%
40%
50%
60%
70%
80%
90%
100%
2005 2006 2007 2008 2009 2010 2011 2012 2013 2014*
MissedTarget
HitTarget
Percent
Source: Pitchbook.
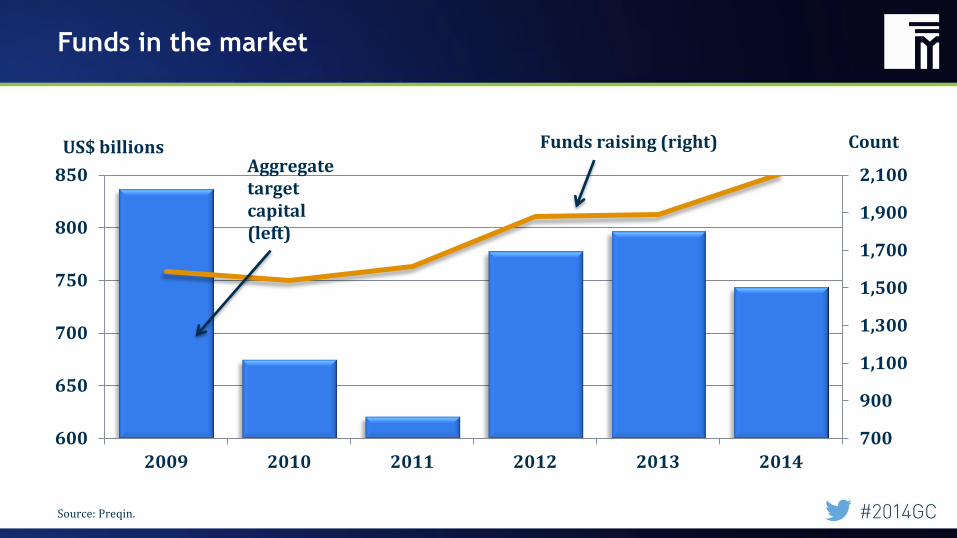
Funds in the market
700
900
1,100
1,300
1,500
1,700
1,900
2,100
600
650
700
750
800
850
2009 2010 2011 2012 2013 2014
US$ billions Aggregate target capital (left)
Funds raising (right) Count
Source: Preqin.
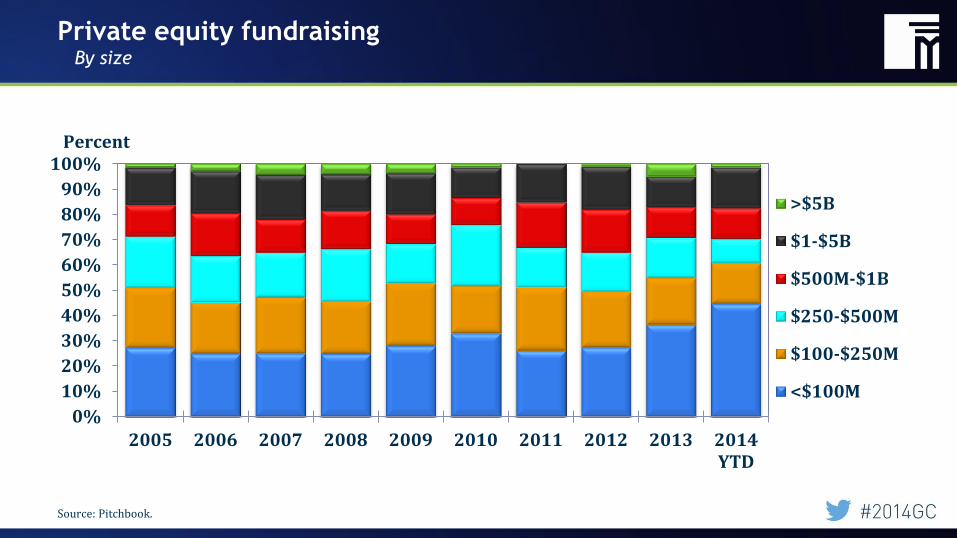
Private equity fundraising By size
0%
10%
20%
30%
40%
50%
60%
70%
80%
90%
100%
2005 2006 2007 2008 2009 2010 2011 2012 2013 2014YTD
>$5B
$1-$5B
$500M-$1B
$250-$500M
$100-$250M
<$100M
Percent
Source: Pitchbook.
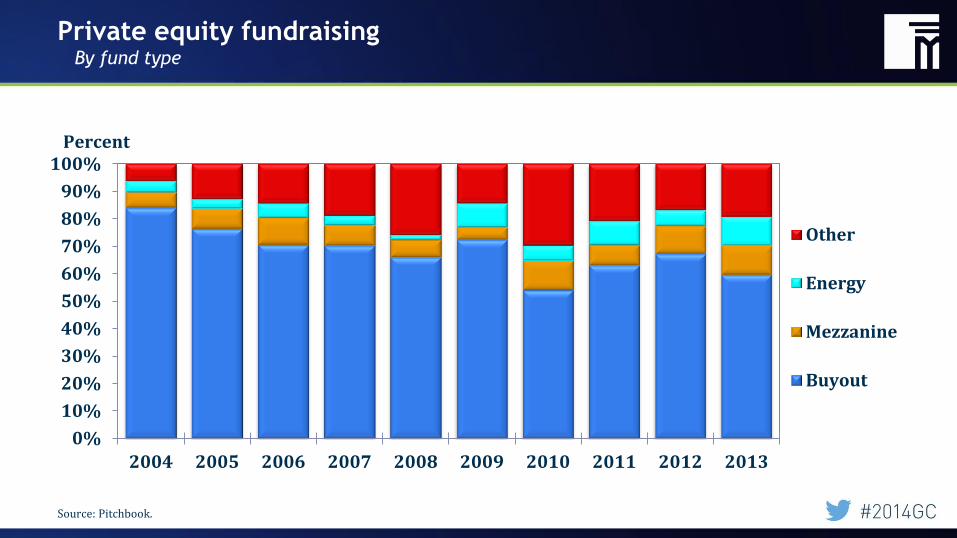
Private equity fundraising By fund type
0%
10%
20%
30%
40%
50%
60%
70%
80%
90%
100%
2004 2005 2006 2007 2008 2009 2010 2011 2012 2013
Other
Energy
Mezzanine
Buyout
Percent
Source: Pitchbook.
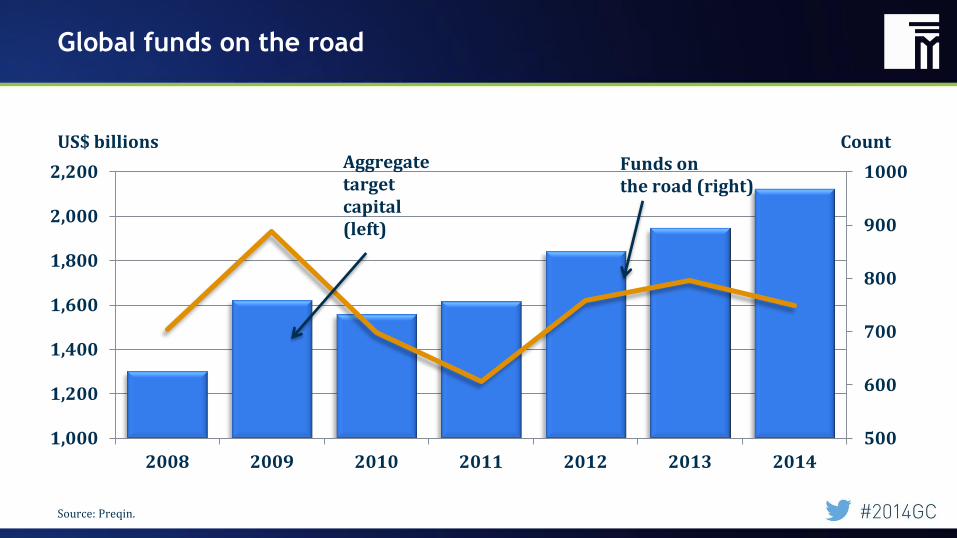
Global funds on the road
500
600
700
800
900
1000
1,000
1,200
1,400
1,600
1,800
2,000
2,200
2008 2009 2010 2011 2012 2013 2014
US$ billions Aggregate target capital (left)
Funds on the road (right)
Count
Source: Preqin.
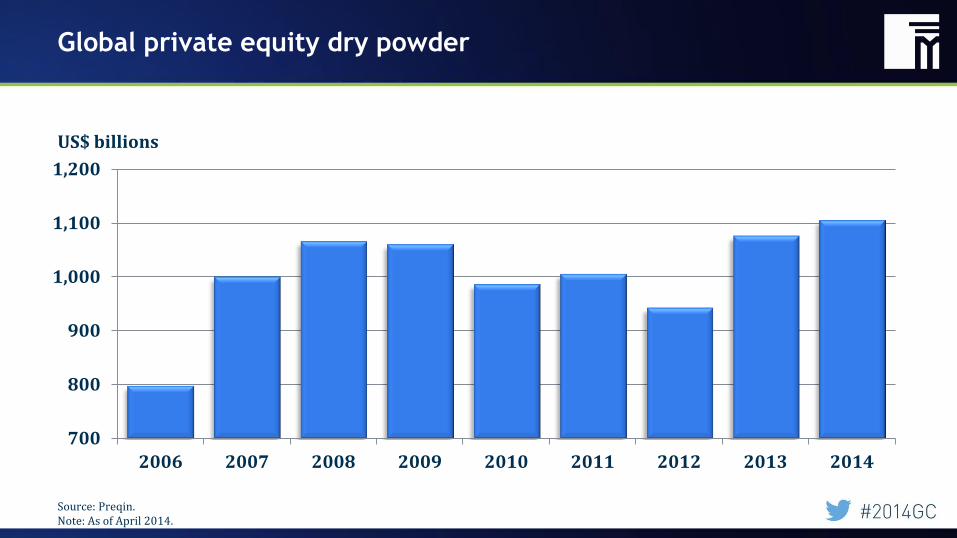
Global private equity dry powder
700
800
900
1,000
1,100
1,200
2006 2007 2008 2009 2010 2011 2012 2013 2014
US$ billions
Source: Preqin. Note: As of April 2014.
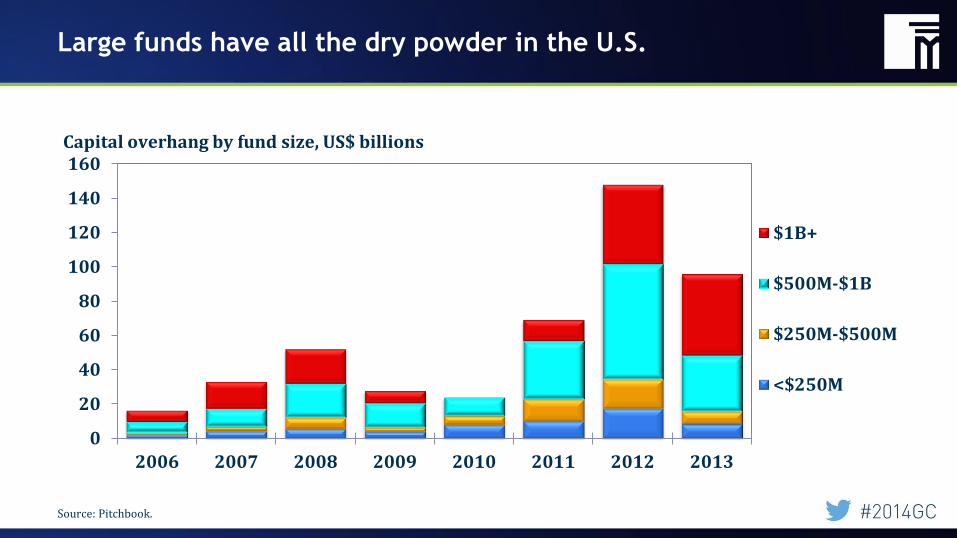
Large funds have all the dry powder in the U.S.
0
20
40
60
80
100
120
140
160
2006 2007 2008 2009 2010 2011 2012 2013
$1B+
$500M-$1B
$250M-$500M
<$250M
Capital overhang by fund size, US$ billions
Source: Pitchbook.
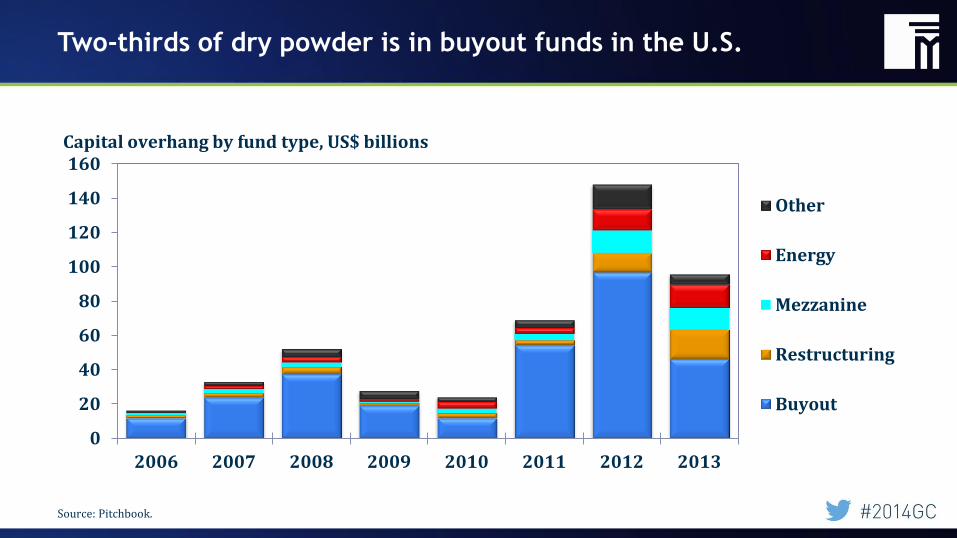
Two-thirds of dry powder is in buyout funds in the U.S.
0
20
40
60
80
100
120
140
160
2006 2007 2008 2009 2010 2011 2012 2013
Other
Energy
Mezzanine
Restructuring
Buyout
Capital overhang by fund type, US$ billions
Source: Pitchbook.
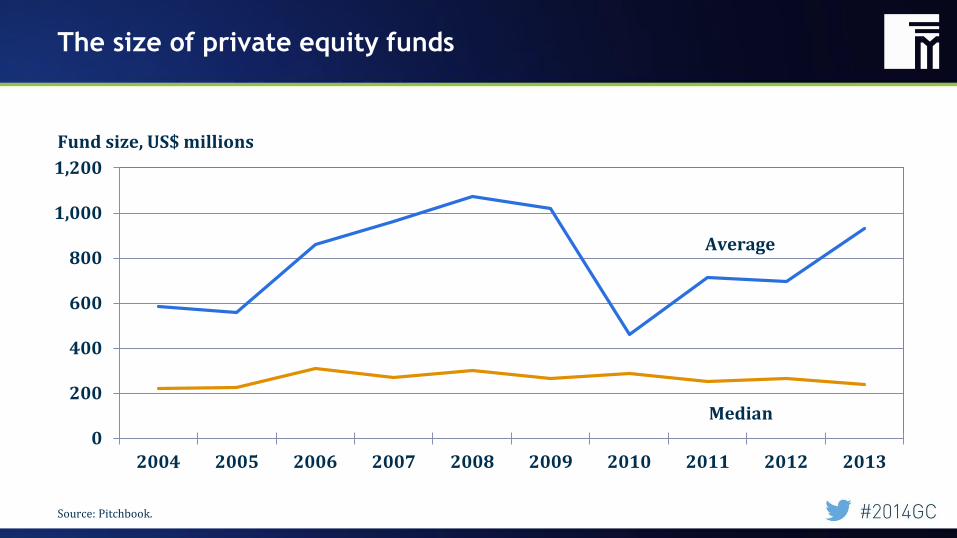
The size of private equity funds
0
200
400
600
800
1,000
1,200
2004 2005 2006 2007 2008 2009 2010 2011 2012 2013
Fund size, US$ millions
Median
Average
Source: Pitchbook.
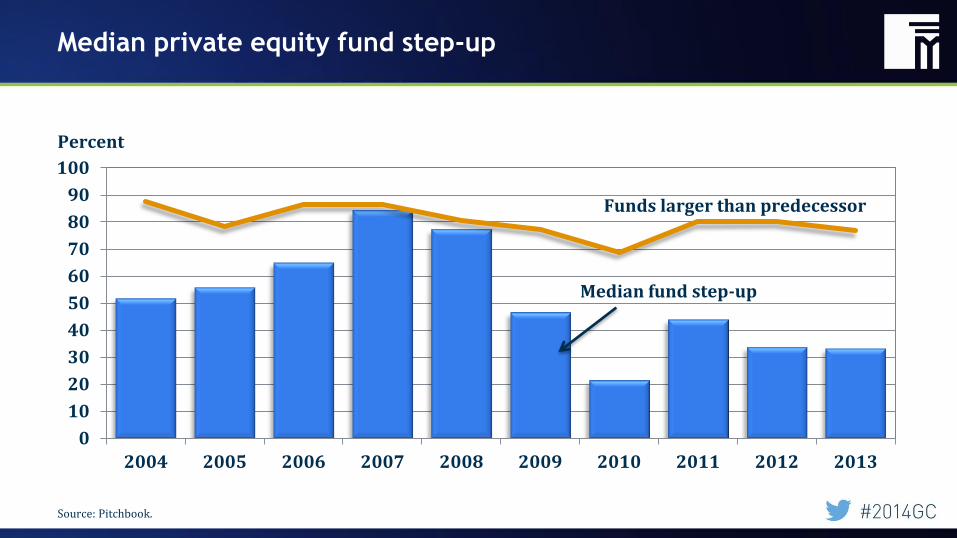
Median private equity fund step-up
0
10
20
30
40
50
60
70
80
90
100
2004 2005 2006 2007 2008 2009 2010 2011 2012 2013
Percent
Funds larger than predecessor
Median fund step-up
Source: Pitchbook.
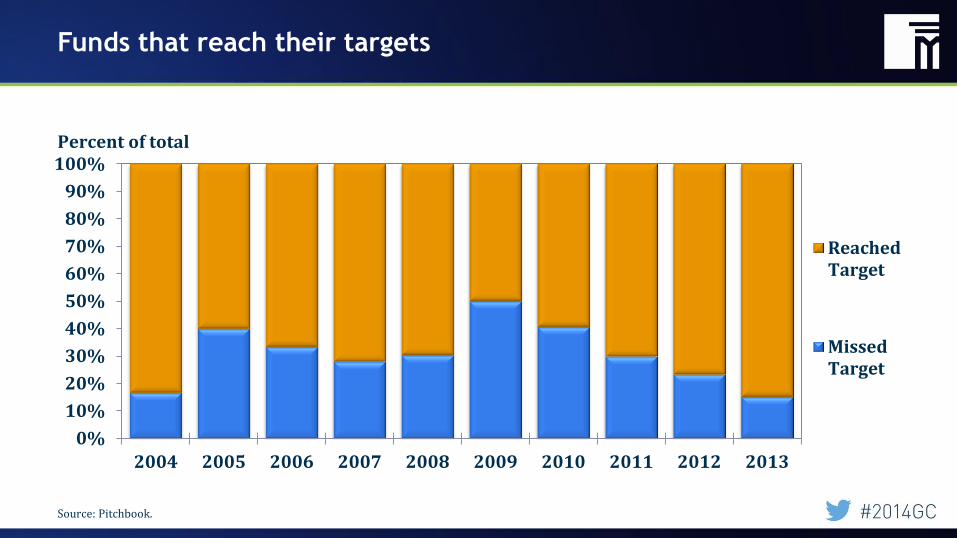
Funds that reach their targets
0%
10%
20%
30%
40%
50%
60%
70%
80%
90%
100%
2004 2005 2006 2007 2008 2009 2010 2011 2012 2013
ReachedTarget
MissedTarget
Percent of total
Source: Pitchbook.
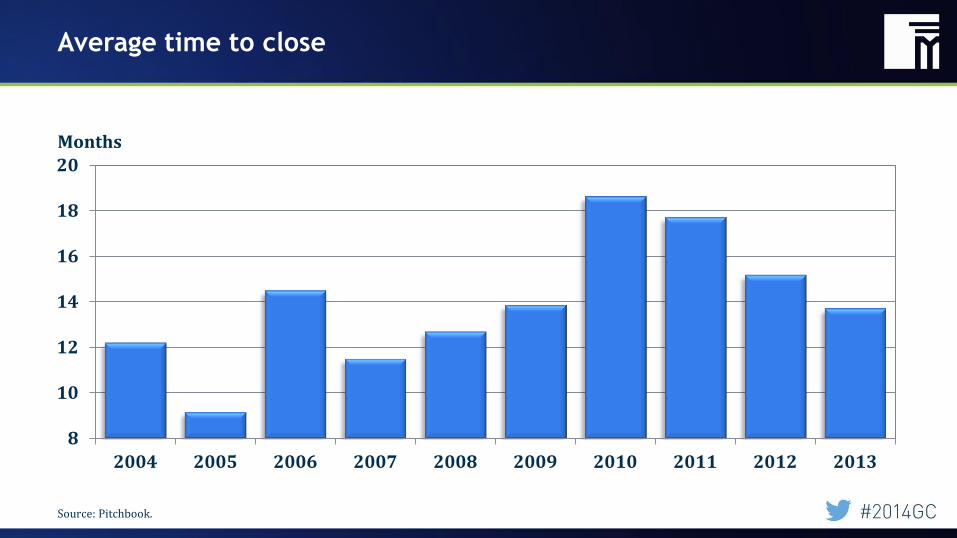
Average time to close
8
10
12
14
16
18
20
2004 2005 2006 2007 2008 2009 2010 2011 2012 2013
Months
Source: Pitchbook.
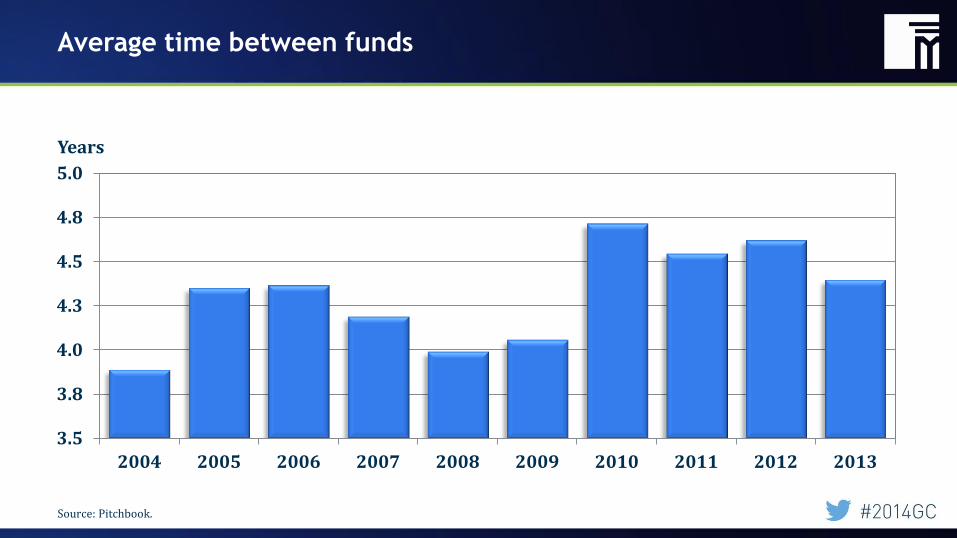
Average time between funds
3.5
3.8
4.0
4.3
4.5
4.8
5.0
2004 2005 2006 2007 2008 2009 2010 2011 2012 2013
Years
Source: Pitchbook.
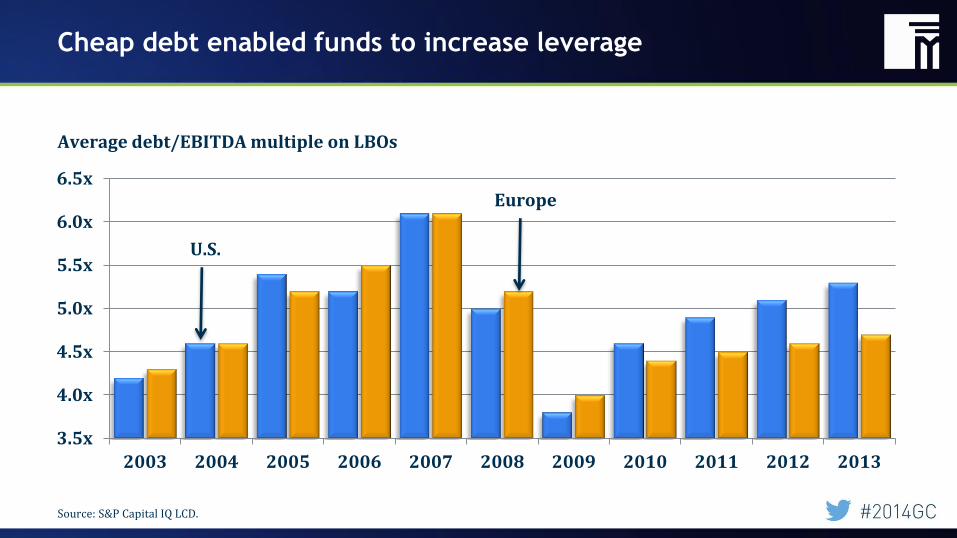
Cheap debt enabled funds to increase leverage
3.5x
4.0x
4.5x
5.0x
5.5x
6.0x
6.5x
2003 2004 2005 2006 2007 2008 2009 2010 2011 2012 2013
Average debt/EBITDA multiple on LBOs
U.S.
Europe
Source: S&P Capital IQ LCD.
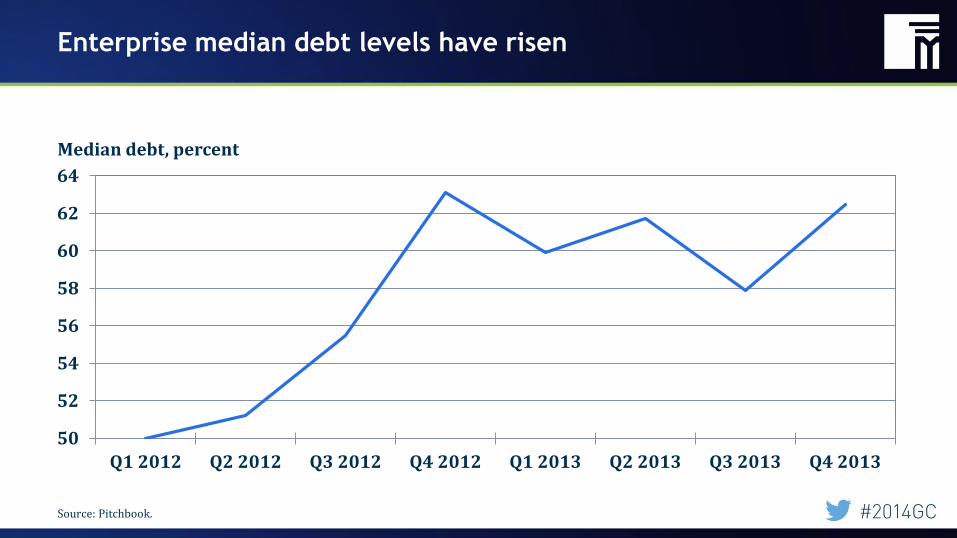
Enterprise median debt levels have risen
50
52
54
56
58
60
62
64
Q1 2012 Q2 2012 Q3 2012 Q4 2012 Q1 2013 Q2 2013 Q3 2013 Q4 2013
Median debt, percent
Source: Pitchbook.
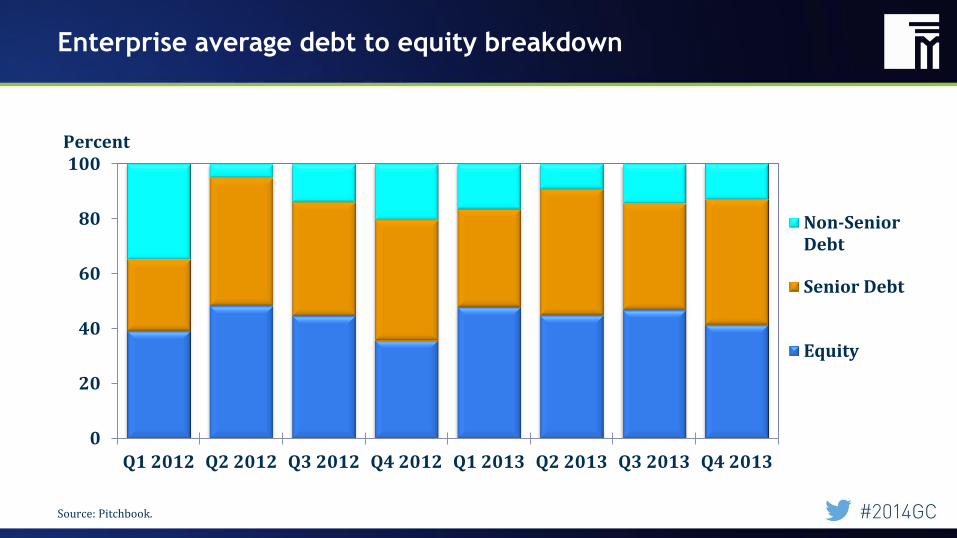
Enterprise average debt to equity breakdown
0
20
40
60
80
100
Q1 2012 Q2 2012 Q3 2012 Q4 2012 Q1 2013 Q2 2013 Q3 2013 Q4 2013
Non-SeniorDebt
Senior Debt
Equity
Percent
Source: Pitchbook.
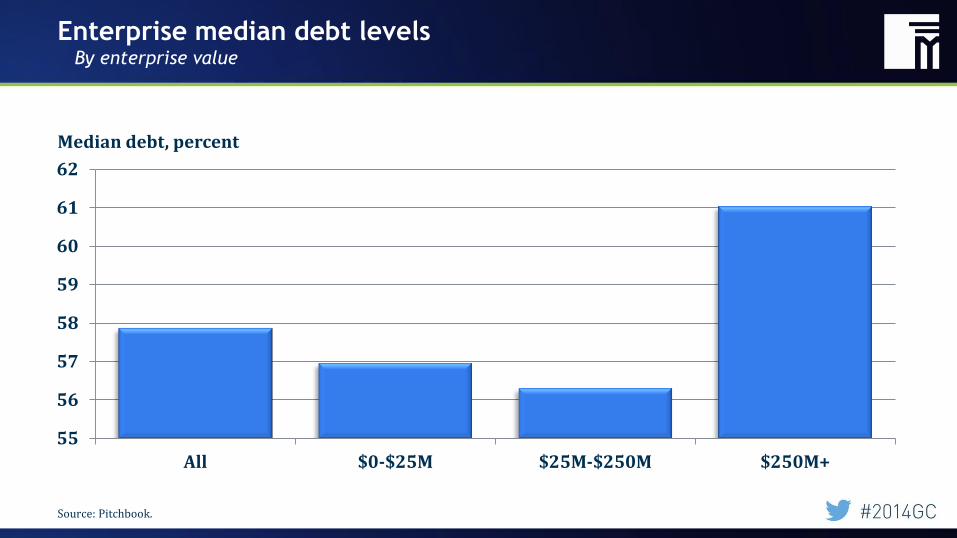
Enterprise median debt levels By enterprise value
55
56
57
58
59
60
61
62
All $0-$25M $25M-$250M $250M+
Median debt, percent
Source: Pitchbook.
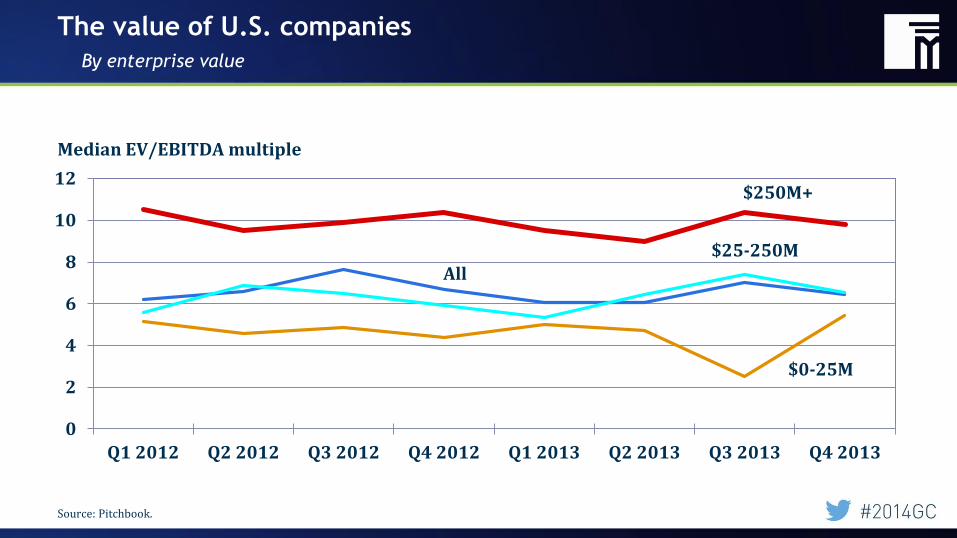
The value of U.S. companies
By enterprise value
0
2
4
6
8
10
12
Q1 2012 Q2 2012 Q3 2012 Q4 2012 Q1 2013 Q2 2013 Q3 2013 Q4 2013
Median EV/EBITDA multiple
All $25-250M
$0-25M
$250M+
Source: Pitchbook.
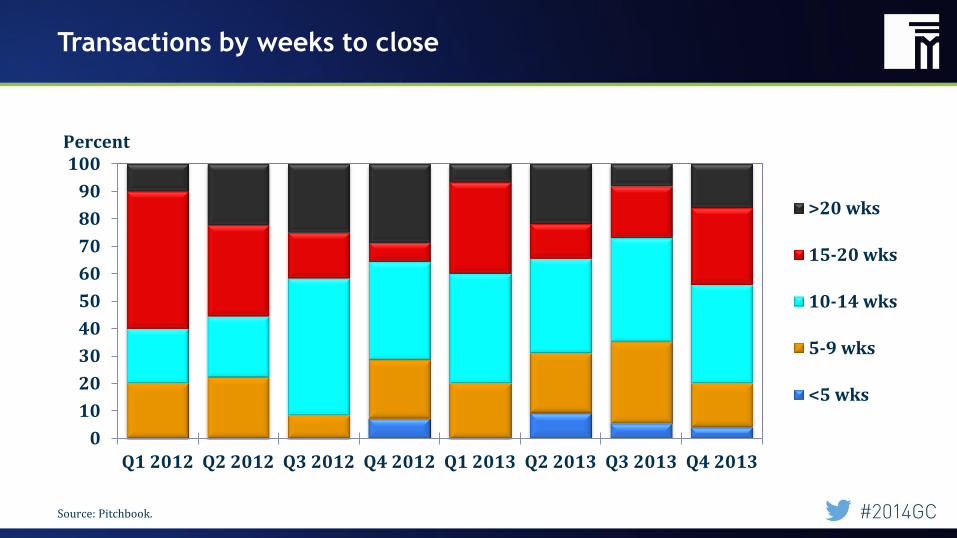
Transactions by weeks to close
0
10
20
30
40
50
60
70
80
90
100
Q1 2012 Q2 2012 Q3 2012 Q4 2012 Q1 2013 Q2 2013 Q3 2013 Q4 2013
>20 wks
15-20 wks
10-14 wks
5-9 wks
<5 wks
Percent
Source: Pitchbook.
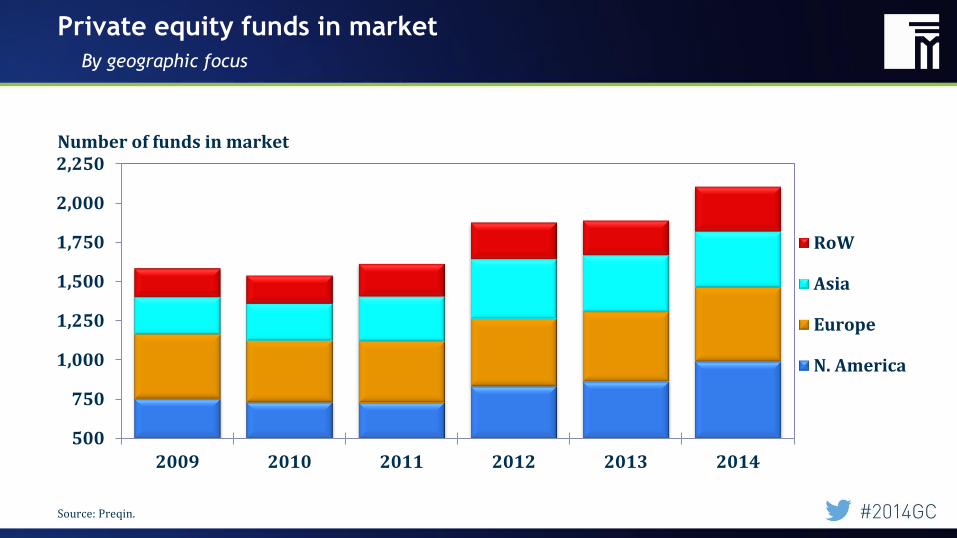
Private equity funds in market
By geographic focus
500
750
1,000
1,250
1,500
1,750
2,000
2,250
2009 2010 2011 2012 2013 2014
RoW
Asia
Europe
N. America
Number of funds in market
Source: Preqin.
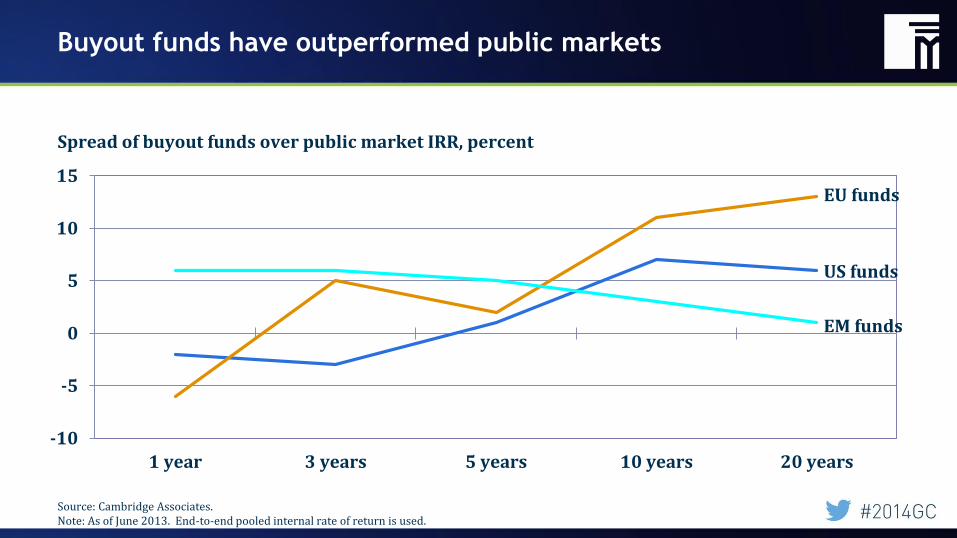
Buyout funds have outperformed public markets
-10
-5
0
5
10
15
1 year 3 years 5 years 10 years 20 years
Spread of buyout funds over public market IRR, percent
EU funds
US funds
EM funds
Source: Cambridge Associates. Note: As of June 2013. End-to-end pooled internal rate of return is used.
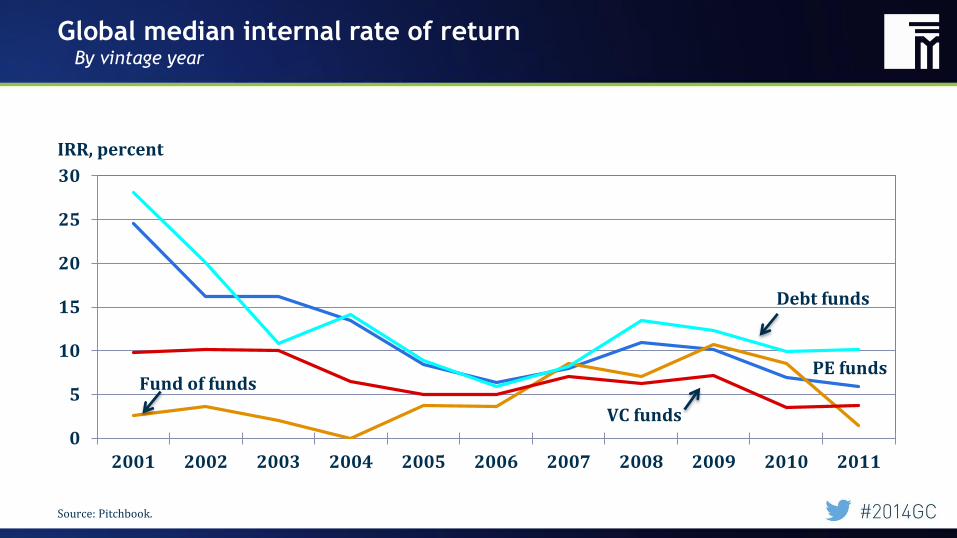
Global median internal rate of return By vintage year
0
5
10
15
20
25
30
2001 2002 2003 2004 2005 2006 2007 2008 2009 2010 2011
IRR, percent
VC funds
PE funds Fund of funds
Debt funds
Source: Pitchbook.
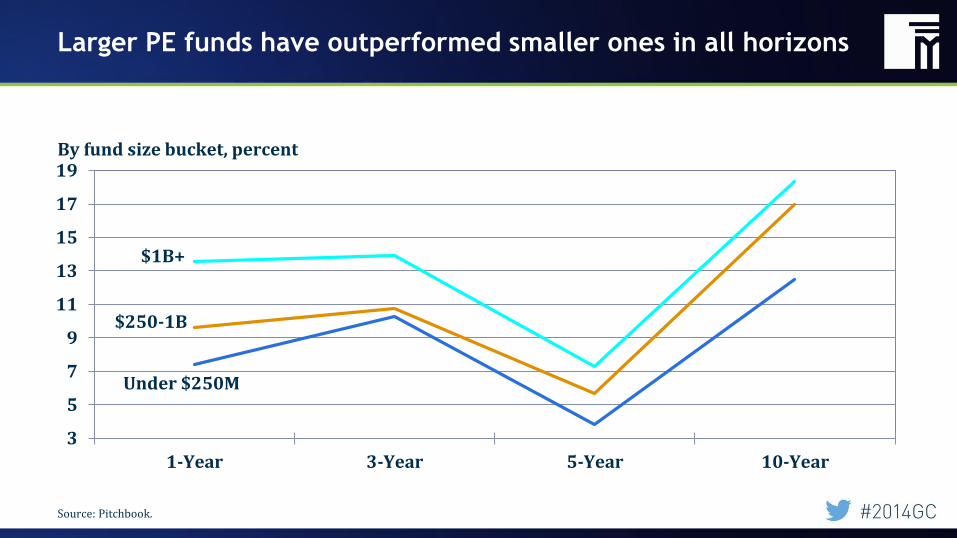
Larger PE funds have outperformed smaller ones in all horizons
3
5
7
9
11
13
15
17
19
1-Year 3-Year 5-Year 10-Year
By fund size bucket, percent
$1B+
$250-1B
Under $250M
Source: Pitchbook.
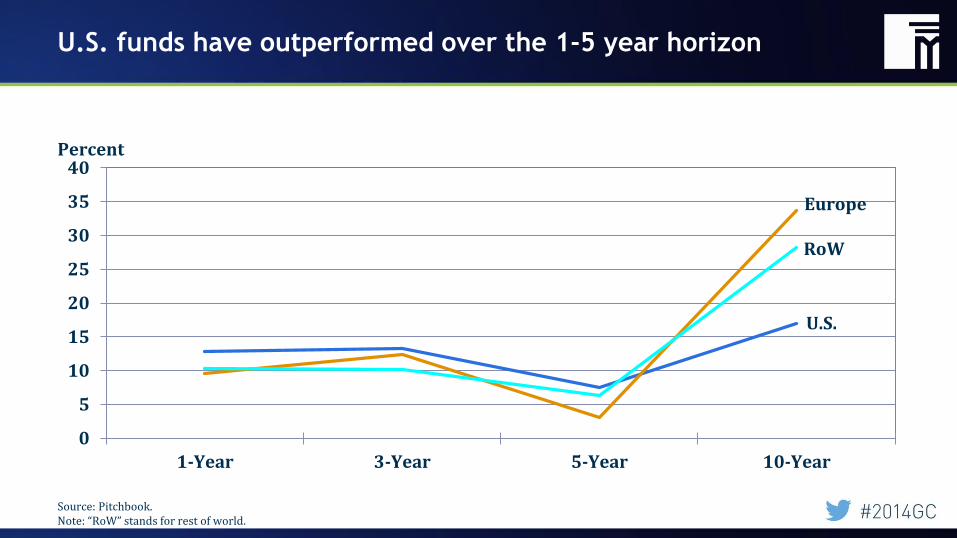
U.S. funds have outperformed over the 1-5 year horizon
0
5
10
15
20
25
30
35
40
1-Year 3-Year 5-Year 10-Year
Percent
U.S.
RoW
Europe
Source: Pitchbook. Note: “RoW” stands for rest of world.
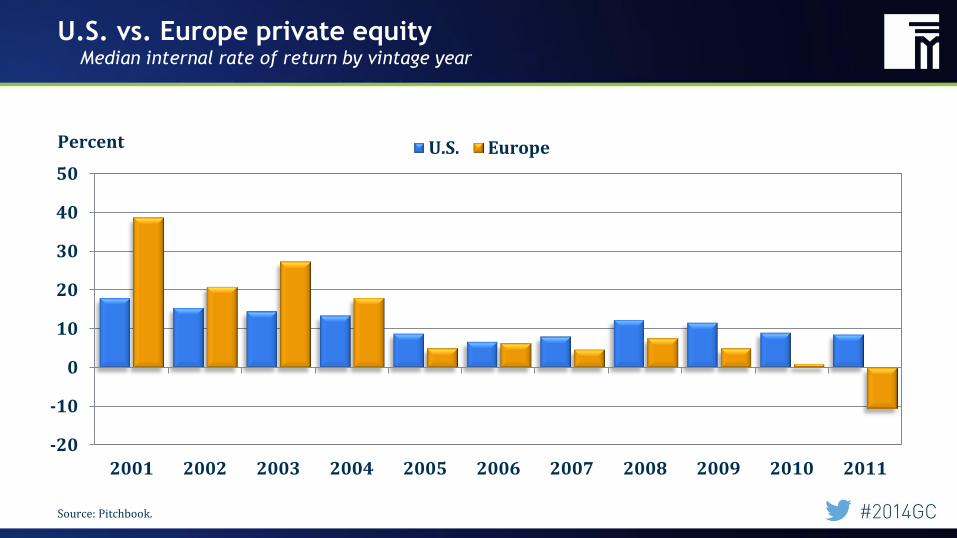
U.S. vs. Europe private equity Median internal rate of return by vintage year
-20
-10
0
10
20
30
40
50
2001 2002 2003 2004 2005 2006 2007 2008 2009 2010 2011
U.S. EuropePercent
Source: Pitchbook.
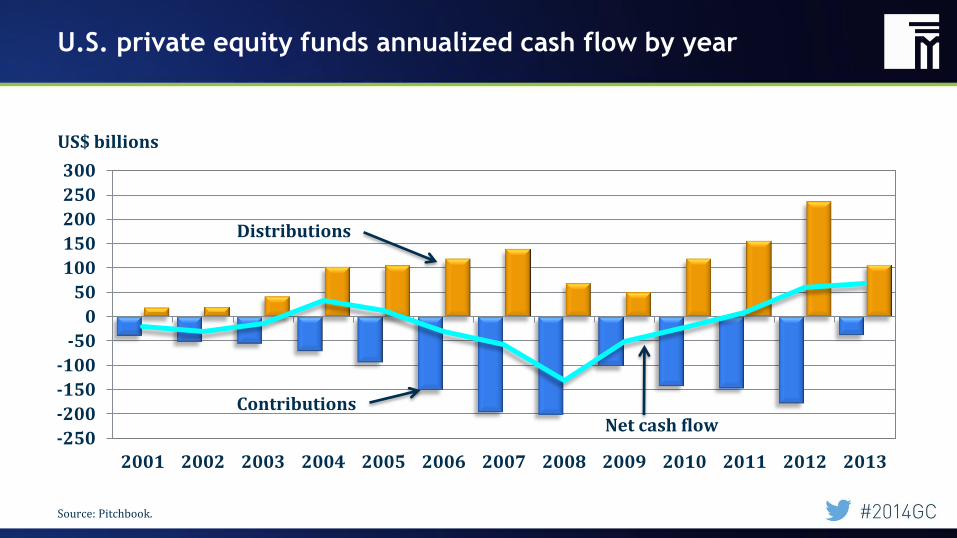
U.S. private equity funds annualized cash flow by year
-250
-200
-150
-100
-50
0
50
100
150
200
250
300
2001 2002 2003 2004 2005 2006 2007 2008 2009 2010 2011 2012 2013
US$ billions
Contributions
Distributions
Net cash flow
Source: Pitchbook.


![SRZ 2011 Private Equity Buyer Public Target MA Deal Study 3rd Quarter[1]](https://img.pdfslide.us/doc/110x75/5448d9e6b1af9f5b618b4c1f/srz-2011-private-equity-buyer-public-target-ma-deal-study-3rd-quarter1.jpg)