Embed Size (px)
Citation preview

Contact us
Name SurnameSector nameT: + 44 (0) 00 0000 0000 E: [email protected]
Name SurnameSector nameT: + 44 (0) 00 0000 0000 E: [email protected]
Name SurnameSector nameT: + 44 (0) 00 0000 0000 E: [email protected]
Lorem ipsum et www.kpmg.com
© 20XX KPMG LLP, a Delaware limited liability partnership and the U.S. member firm of the KPMG network of independent member firms affiliated with KPMG International Cooperative (“KPMG International”), a Swiss entity. All rights reserved. Printed in the U.S.A. The KPMG name, logo and “cutting through complexity” are registered trademarks or trademarks of KPMG International. <Insert DOC ID>
KPMG GLOBAL ENERGY INSTITUTE
U.S. Power & Utilities
Outlookkpmgglobalenergyinstitute.com

© 2012 KPMG International Cooperative (“KPMG International”), a Swiss entity. Member firms of the KPMG network of independent firms are affiliated with KPMG International. KPMG International provides no client services. No member firm has any authority to obligate or bind KPMG International or any other member firm vis-à-vis third parties, nor does KPMG International have any such authority to obligate or bind any member firm. All rights reserved. NDPPS 104793
Table of Contents
Executive summary
Outlook for demand and the implications for capacity
Emerging technologies
Transportation and electricity
Infrastructure investment
Key regulatory issues
Energy sustainability
Regulated utility M&A
Conclusion
1
5
8
12
2
7
10
13
13
1
© 2012 KPMG International Cooperative (“KPMG International”), a Swiss entity. Member firms of the KPMG network of independent firms are affiliated with KPMG International. KPMG International provides no client services. No member firm has any authority to obligate or bind KPMG International or any other member firm vis-à-vis third parties, nor does KPMG International have any such authority to obligate or bind any member firm. All rights reserved. NDPPS 104793
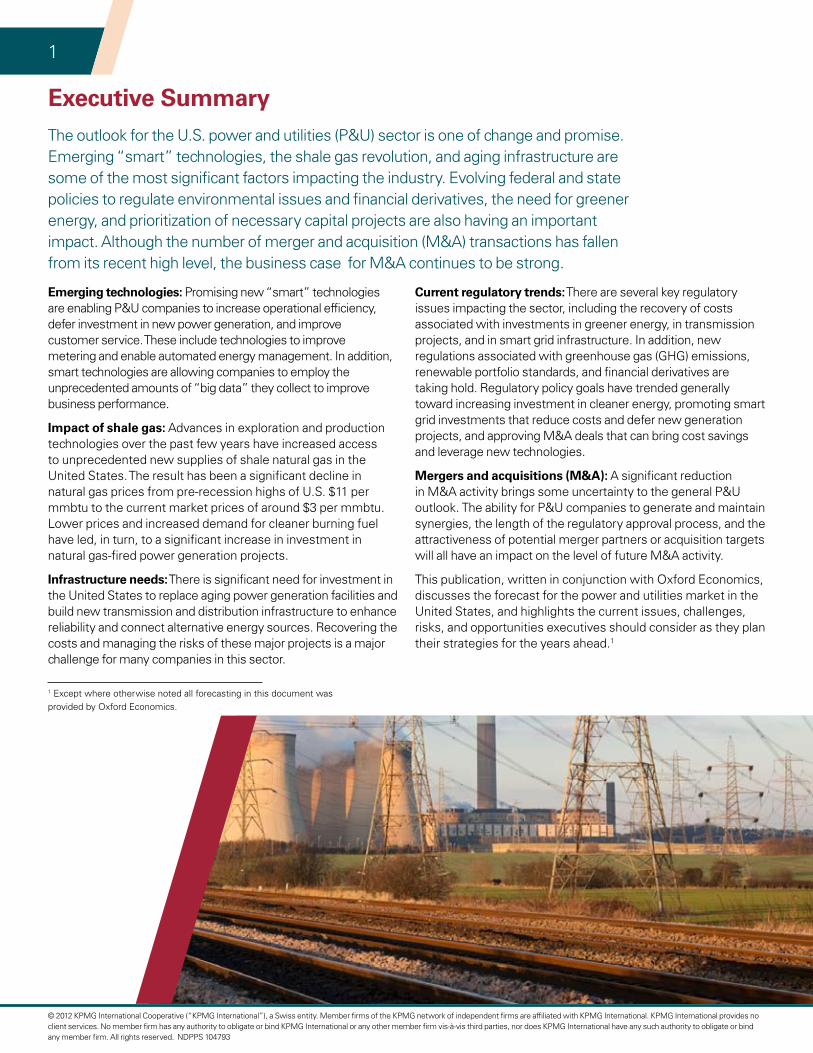
Executive SummaryThe outlook for the U.S. power and utilities (P&U) sector is one of change and promise. Emerging “smart” technologies, the shale gas revolution, and aging infrastructure are some of the most significant factors impacting the industry. Evolving federal and state policies to regulate environmental issues and financial derivatives, the need for greener energy, and prioritization of necessary capital projects are also having an important impact. Although the number of merger and acquisition (M&A) transactions has fallen from its recent high level, the business case for M&A continues to be strong.
Emerging technologies: Promising new “smart” technologies are enabling P&U companies to increase operational efficiency, defer investment in new power generation, and improve customer service. These include technologies to improve metering and enable automated energy management. In addition, smart technologies are allowing companies to employ the unprecedented amounts of “big data” they collect to improve business performance.
Impact of shale gas: Advances in exploration and production technologies over the past few years have increased access to unprecedented new supplies of shale natural gas in the United States. The result has been a significant decline in natural gas prices from pre-recession highs of U.S. $11 per mmbtu to the current market prices of around $3 per mmbtu. Lower prices and increased demand for cleaner burning fuel have led, in turn, to a significant increase in investment in natural gas-fired power generation projects.
Infrastructure needs: There is significant need for investment in the United States to replace aging power generation facilities and build new transmission and distribution infrastructure to enhance reliability and connect alternative energy sources. Recovering the costs and managing the risks of these major projects is a major challenge for many companies in this sector.
Current regulatory trends: There are several key regulatory issues impacting the sector, including the recovery of costs associated with investments in greener energy, in transmission projects, and in smart grid infrastructure. In addition, new regulations associated with greenhouse gas (GHG) emissions, renewable portfolio standards, and financial derivatives are taking hold. Regulatory policy goals have trended generally toward increasing investment in cleaner energy, promoting smart grid investments that reduce costs and defer new generation projects, and approving M&A deals that can bring cost savings and leverage new technologies.
Mergers and acquisitions (M&A): A significant reduction in M&A activity brings some uncertainty to the general P&U outlook. The ability for P&U companies to generate and maintain synergies, the length of the regulatory approval process, and the attractiveness of potential merger partners or acquisition targets will all have an impact on the level of future M&A activity.
This publication, written in conjunction with Oxford Economics, discusses the forecast for the power and utilities market in the United States, and highlights the current issues, challenges, risks, and opportunities executives should consider as they plan their strategies for the years ahead.1
1 Except where otherwise noted all forecasting in this document was provided by Oxford Economics.

2
© 2012 KPMG International Cooperative (“KPMG International”), a Swiss entity. Member firms of the KPMG network of independent firms are affiliated with KPMG International. KPMG International provides no client services. No member firm has any authority to obligate or bind KPMG International or any other member firm vis-à-vis third parties, nor does KPMG International have any such authority to obligate or bind any member firm. All rights reserved. NDPPS 104793
Outlook for demand and the implications for capacityU.S. electricity consumption is forecast to recover from the cyclical downturn seen in 2008–2009 and grow by an average of 0.4 percent per year through 2014.2 In absolute terms, this is expected to result in total consumption reaching 3.9 million GWh, just above the 2007 peak.
During 2002–2007, industrial demand declined by around 1.2 percent per year, driven primarily by declines in consumption in the machinery, nonspecified industry, and transportation and equipment sectors.3 Not all sectors reduced their power demand, however. Output demand growth in the metallurgy sectors increased the sector’s energy consumption by more than 2 percent per year during that time. The transportation sector experienced a significant increase in its electricity use (albeit from a very low base), from 4,200GWh in 2002 to 8,200 GWh in 2007.
Commercial buildings and residences are the two biggest consumers of electricity in absolute terms due to the relatively high income level of U.S. households. Together, they will continue to account for the majority of total consumption (68.8 percent). These sectors will also drive consumption growth over the next three years due to the cyclical nature of demand from industrial producers.4 The commercial buildings sector is expected to grow
Chart 1.1: U.S. electricity consumption
-5 5 10 150
Transport
Industry
Commercial &Public Services
Energyextraction
Residential
Agriculture
CAGR 2002-07 CAGR 2012-14
%
Source: Oxford Economics/IEA
at an average rate of 3.2 percent, and residential use is expected to grow at an average rate of 1.6 percent. The continued electrification of transportation will lead to fast growth in that sector (around 2.0 percent annually through 2014).
At the margin, demand from industry will be the key growth driver, accounting for 50 percent of the increase in total consumption. Power demand will increase in most industrial sectors, but there are significant differences across sectors: demand in wood and wood products, transportation and equipment, and nonmetallic minerals is expected to increase significantly as a result of their recovery from the recession, the increased use of electric vehicles, and relatively energy-intensive production processes. By contrast, the paper, pulp, printing, and nonferrous metals sectors are likely to see falling electricity consumption as a result of improvements in energy efficiency and forecasts of stagnant or declining output in these industries.
Chart 1.2: U.S. industrial electricity consumption
-4 4 6-2 20
Non-metallic minerals
Wood & wood products
Transportation and equipment
Nonspecified*
Machinery
Chemicals
Non-ferrous metals
Food & tobacco
Iron & steel
Mining & quarrying
Paper, pulp & printing
Textiles & leather
CAGR 2002-07 CAGR, 2012-14
%
Source: Oxford Economics/IEA
*2002-07 CAGR = -32.8%
2 Electricity demand can be split into six key sectors: agriculture, energy extraction, industry, commercial buildings, residential usage, and transportation. The biggest consumers of electricity within industry are the metallurgy; chemicals; paper, pulp, and printing; and machinery.
3 Note that due to improvements in the quality of data, some of the decline in the nonspecified industry category is likely to be because of a reclassification of demand in this sector.
4 In contrast to commercial buildings and residential usage, where the bulk of electricity consumption is fixed (i.e. independent of income/output), industrial users vary their consumption much more according to the economic cycle.

3
© 2012 KPMG International Cooperative (“KPMG International”), a Swiss entity. Member firms of the KPMG network of independent firms are affiliated with KPMG International. KPMG International provides no client services. No member firm has any authority to obligate or bind KPMG International or any other member firm vis-à-vis third parties, nor does KPMG International have any such authority to obligate or bind any member firm. All rights reserved. NDPPS 104793
5 Energy intensity is the amount of energy needed to produce one unit of output.6 Note that because many sources of renewable power are weather-dependent (e.g. wind power), renewables share of capacity is significantly
higher than their share of actual production.
Energy intensity and portfolio: U.S. energy intensity has declined as a result of improvements in technology, and the transition away from heavy industry and toward services.5 This trend can be seen over the past decade, as the electricity intensity of GDP declined by around 0.7 percent annually between 2000 and 2010 (see Chart 1.3). It is expected that the deployment of smart-grid technologies will further decrease energy intensity as businesses and utilities more fully leverage these technologies to improve energy efficiency.
Chart 1.3: U.S. electricity production and intensity
330
335
340
345
350
355
360
365
2000 2001 2002 2003 2004 2005 2006 2007 2008 2009 2010
3,700,000
3,800,000
3,900,000
4,000,000
4,100,000
4,200,000
4,300,000
4,400,000
4,500,000
GWh/2005 US$ Bn
Source: Oxford Economics/IEA
Electricity production (RHS)
Electricity intensity (LHS)
GWh
While coal has remained the dominant energy source for electricity production over the past decade, accounting for 46 percent of total production in 2010, natural gas has increased its share of total production from 16 percent in 2000 to 23 percent in 2010 (see Chart 1.4). This is due primarily to the increased access to shale natural gas reserves, technological improvements to reduce extraction costs, and the reduction in retail natural gas prices. The share of electricity produced by renewable energy also increased to approximately 10 percent by 2010 in response to demand for cleaner energy sources coupled with state and federal programs to encourage their use.
Chart 1.4: U.S. electricity sources
0 10 20 30 40 50 60
Coal
Gas
Nuclear
Renewables
Other
2000 2005 2010 Source: Oxford Economics/IEA
Capacity developments: With U.S. electricity demand forecast to grow slowly, capacity will need to increase by only a small amount to keep pace. U.S. capacity is projected to grow by 5.7 percent from 2008 to 2014, while demand is projected to grow by 5.2 percent. Known U.S. electricity generation capacity developments are expected to increase capacity by about 2 percent between 2010 and 2014, from 1,014 GW to 1,036 GW. “In parts of the country where the economic recovery will be more robust, electricity generation capacity will likely increase at a greater rate,” says John Kunasek, KPMG’s U.S. sector leader for Energy.
Renewable sources will likely see the biggest increase, with capacity rising from 145 GW to 158 GW over the next few years.6 In addition, low natural gas prices are increasing the
4
© 2012 KPMG International Cooperative (“KPMG International”), a Swiss entity. Member firms of the KPMG network of independent firms are affiliated with KPMG International. KPMG International provides no client services. No member firm has any authority to obligate or bind KPMG International or any other member firm vis-à-vis third parties, nor does KPMG International have any such authority to obligate or bind any member firm. All rights reserved. NDPPS 104793
7 Based on current plans, new gas combined cycle plants will be the single biggest contributor to new generation capacity over the next 25 years, with capacity at these plants set to grow by around 1.2 percent per annum.
8 In those areas where wind power has become a significant source of electricity (Electric Reliability Council of Texas, Midwest Independent Transmission System Operator, and Northeast Power Coordinating Council), the amount of regulating (reliable) production reserves must also be increased to compensate for wind’s high level of variability.
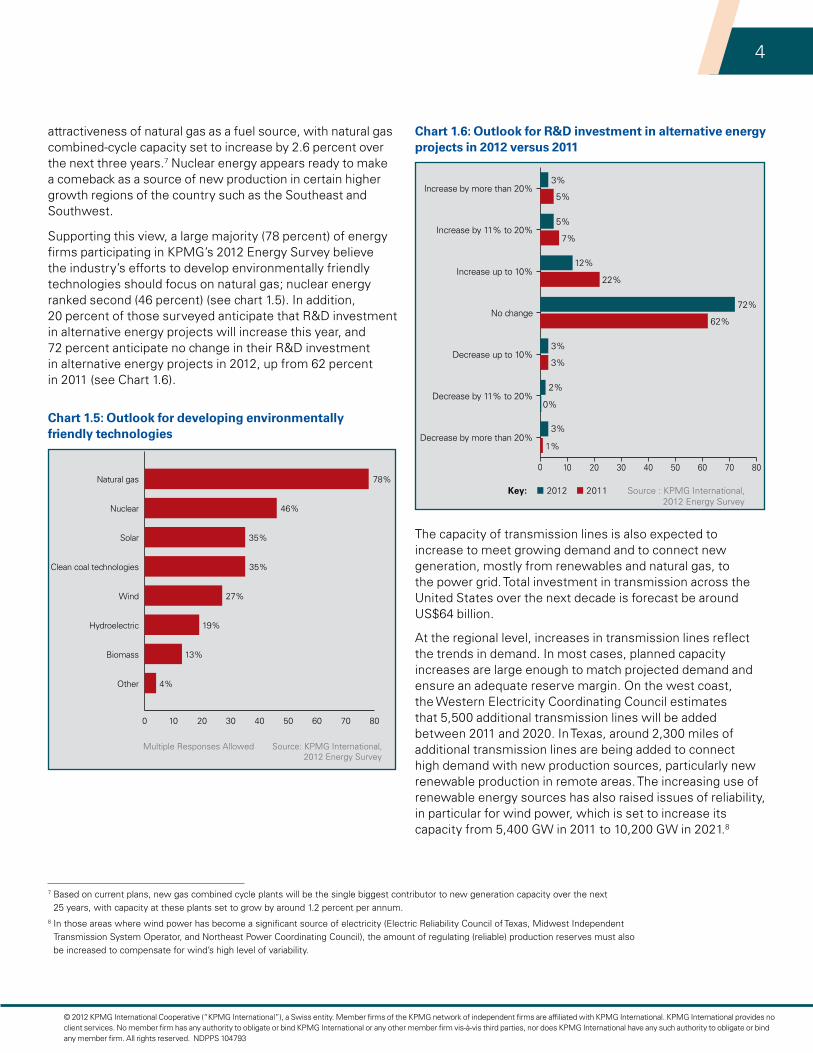
attractiveness of natural gas as a fuel source, with natural gas combined-cycle capacity set to increase by 2.6 percent over the next three years.7 Nuclear energy appears ready to make a comeback as a source of new production in certain higher growth regions of the country such as the Southeast and Southwest.
Supporting this view, a large majority (78 percent) of energy firms participating in KPMG’s 2012 Energy Survey believe the industry’s efforts to develop environmentally friendly technologies should focus on natural gas; nuclear energy ranked second (46 percent) (see chart 1.5). In addition, 20 percent of those surveyed anticipate that R&D investment in alternative energy projects will increase this year, and 72 percent anticipate no change in their R&D investment in alternative energy projects in 2012, up from 62 percent in 2011 (see Chart 1.6).
Chart 1.5: Outlook for developing environmentally friendly technologies
Multiple Responses Allowed Source: KPMG International, 2012 Energy Survey
0 10 20 30 40 50 60 70 80
78%
46%
35%
35%
27%
19%
13%
4%
Natural gas
Nuclear
Solar
Clean coal technologies
Wind
Hydroelectric
Biomass
Other
Chart 1.6: Outlook for R&D investment in alternative energy projects in 2012 versus 2011
Source : KPMG International, 2012 Energy Survey
0 10 20 30 40 50 60 70 80
3%
5%
5%
7%
12%
22%
72%
62%
3%
3%
2%
0%
3%
1%
Increase by more than 20%
Increase by 11% to 20%
Increase up to 10%
No change
Decrease up to 10%
Decrease by 11% to 20%
Decrease by more than 20%
2012Key: 2011
The capacity of transmission lines is also expected to increase to meet growing demand and to connect new generation, mostly from renewables and natural gas, to the power grid. Total investment in transmission across the United States over the next decade is forecast be around US$64 billion.
At the regional level, increases in transmission lines reflect the trends in demand. In most cases, planned capacity increases are large enough to match projected demand and ensure an adequate reserve margin. On the west coast, the Western Electricity Coordinating Council estimates that 5,500 additional transmission lines will be added between 2011 and 2020. In Texas, around 2,300 miles of additional transmission lines are being added to connect high demand with new production sources, particularly new renewable production in remote areas. The increasing use of renewable energy sources has also raised issues of reliability, in particular for wind power, which is set to increase its capacity from 5,400 GW in 2011 to 10,200 GW in 2021.8

5
© 2012 KPMG International Cooperative (“KPMG International”), a Swiss entity. Member firms of the KPMG network of independent firms are affiliated with KPMG International. KPMG International provides no client services. No member firm has any authority to obligate or bind KPMG International or any other member firm vis-à-vis third parties, nor does KPMG International have any such authority to obligate or bind any member firm. All rights reserved. NDPPS 104793
“Some companies will end up performing better than others, because they’ve leveraged the technologies better,” Kunasek says. “The technology defers electricity generation into the future, allowing customers to have more choice, and it provides more data for businesses to be run more efficiently”. Kunasek notes that some state commissions have concluded that the business case for smart grid technology has become strong enough for companies to begin making significant investments.
Emerging business trends: Smart grid technologies are significantly changing the way the power and utilities industry does business. With the catalyst of smart grid investment grants provided by the American Recovery and Reinvestment Act of 2009 (ARRA), the pace of development and implementation of smart grid technologies has increased significantly. There was almost $53 billion in smart grid investment in the United States through 2010 with an additional estimated $150 billion to be spent between 2011 to 2015.
This growth in the deployment of smart grid technologies is leading to a transformation that affects business operations, resources management, infrastructure deployment, systems requirements, and data analytics. These new technologies increase operational efficiency, enhance relationships with customers, and improve power management capabilities.
From an operational perspective, smart grid technologies are helping to reduce costs, increase automation, and streamline processes. Initial observations indicate that smart grid technologies are changing the business of distributing and controlling electricity, though reengineering will be required to leverage new capabilities. These new capabilities should further advance outage response, workforce mobility, and asset optimization.
The nature of the utility-customer relationship is also changing. Utilities are beginning to expand their relationships with customers, both in terms of their knowledge of customers’ habits, usage patterns, and the increased levels of information available to customers that allow them to make more informed decisions regarding electricity usage.
Smart grid technologies are also bringing P&U companies advanced power management capabilities. Newly available data on interval demand, meter condition, and grid status can be a source of potential business value. New grid management infrastructure and applications should enable greater distribution automation, self-repair capabilities, and more efficient power generation and dispatch. This can help power and utilities companies reduce outages, improve restoration times, and lower generation costs.
Emerging technologiesSmart grid technology should further relieve capacity pressures by better balancing supply and demand. Enhanced asset optimization, cost savings, and improved efficiency are among the benefits of smart technology cited in KPMG’s 2012 Energy Survey. Most energy firms (58 percent) cited the significant up-front investment as one of the main impediments to the implementation of the smart grid, according to the survey (see Chart 2.1). Other significant impediments were the ability to justify the business case for implementing the smart grid (48 percent) and lack of customer interest and knowledge (40 percent).
Chart 1.7: Possible barriers preventing smart grid implementation
Source: KPMG International, 2012 Energy Survey
Multiple Responses Allowed
0 10 20 30 40 50 60
57%
48%
40%
25%
25%
17%
16%
16%
16%
12%
5%
3%
Significant up-front investment
Justifying the business case
Customer lack of interest and knowledge
Regulators will oppose and/or delay
Technology development
Uncertainty regarding funding after stimulus plan
Customer privacy concerns
Maintaining commitment to implementation over time
Compliance with regulations will hurt ROI
Consumer advocates will oppose
Large customers will oppose
Other

6
© 2012 KPMG International Cooperative (“KPMG International”), a Swiss entity. Member firms of the KPMG network of independent firms are affiliated with KPMG International. KPMG International provides no client services. No member firm has any authority to obligate or bind KPMG International or any other member firm vis-à-vis third parties, nor does KPMG International have any such authority to obligate or bind any member firm. All rights reserved. NDPPS 104793
Challenges and risks: P&U companies that are deploying smart grid technologies can expect to face several challenges and risks. These include security, data management, quality assurance, regulatory compliance, and third-party vendor management.
• Security: Smart grid technologies enable information sharing over the Internet in a controlled manner. Each physical device and each movement of information represents a potential vulnerability, which makes data security a priority. Other aspects of smart grid security include physical security and telecommunication security.
• Datamanagement: Data integrity and data ownership has become an important factor in the smart grid expansion. The communication chain has become more complex, with the introduction of new technology to manage and transport large amounts of information for new business and new user needs. Data management architecture is changing, as many other company functions are tied directly to the meter data.
• Qualityassurance: Smart grid implementation projects are large and take a significant amount of time, and companies can easily lose focus on project goals. Internal quality points and key metrics, as well as ongoing quality assurance and monitoring programs, are often needed to keep projects focused.
• Regulatorycompliance: The Smart Grid Investment Grant (SGIG) program established reporting and compliance requirements and began an effort to drive consensus on cyber security and interoperability standards. Multiple sources of applicable federal guidance have created several broad categories of compliance obligations.9 Ongoing reporting and compliance requirements under the SGIG include project status and incident reporting; data collection for project metrics, costs, and benefits; and cyber security assurances. Additionally, state regulators are increasingly concerned with measuring the ultimate benefits of smart grid deployments and are beginning to press for more metrics reporting to validate this large investment.
• Third-partyvendormanagement: There are relatively few smart grid technology vendors, and market power resides with the suppliers as a result of increased demand, changing requirements, and limited supplies. Additionally, utilities are facing deployments that require multiple vendors to realize their vision, substantially increasing the complexity of implementations.
Overall, smart grid technologies represent a transformation in infrastructure, business, and technology on an unprecedented scale. Managing a transformation this size, breadth, and complexity will continue to be a significant challenge for P&U companies.
9 “Smart Grid’s $200 Billion Investment Lures Cisco, ABB,” BusinessWeek, September 23, 2010 (http://www.businessweek.com/investor/content/sep2010/pi20100923_666771.htm); “Smart Grid Investment to Total $200 Billion Worldwide by 2015,” December 28 2009. (http://www.pikeresearch.com/newsroom/smartgrid-investment-to-total-200-billion-worldwide-by-2015); ARRA reporting and compliance requirements include 2 CFR Part 176: Framework for stimulus requirements; Section 1512: Quarterly and annual reporting and registration requirements; Section 1605: “Buy American” requirements; Section 1606: Wage rate requirements (Davis-Bacon Act); and 10 CFR Part 600: Costs allowable and associated cost principles.
7
© 2012 KPMG International Cooperative (“KPMG International”), a Swiss entity. Member firms of the KPMG network of independent firms are affiliated with KPMG International. KPMG International provides no client services. No member firm has any authority to obligate or bind KPMG International or any other member firm vis-à-vis third parties, nor does KPMG International have any such authority to obligate or bind any member firm. All rights reserved. NDPPS 104793
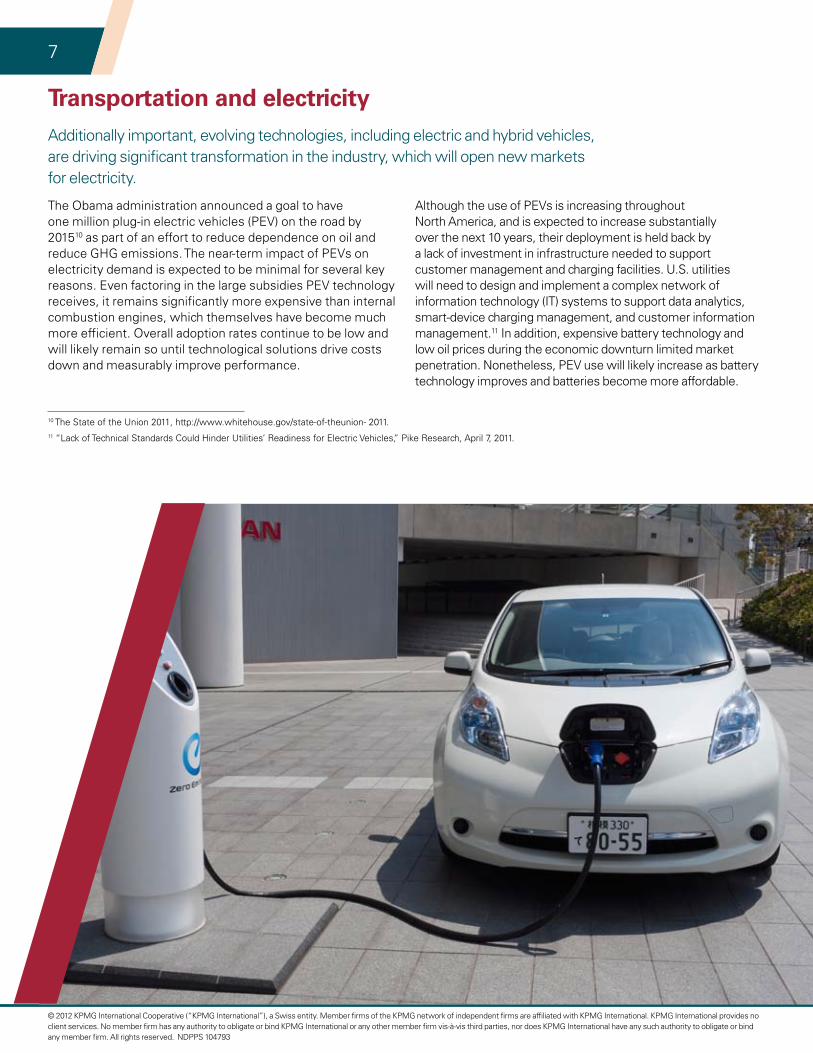
The Obama administration announced a goal to have one million plug-in electric vehicles (PEV) on the road by 201510 as part of an effort to reduce dependence on oil and reduce GHG emissions. The near-term impact of PEVs on electricity demand is expected to be minimal for several key reasons. Even factoring in the large subsidies PEV technology receives, it remains significantly more expensive than internal combustion engines, which themselves have become much more efficient. Overall adoption rates continue to be low and will likely remain so until technological solutions drive costs down and measurably improve performance.
Although the use of PEVs is increasing throughout North America, and is expected to increase substantially over the next 10 years, their deployment is held back by a lack of investment in infrastructure needed to support customer management and charging facilities. U.S. utilities will need to design and implement a complex network of information technology (IT) systems to support data analytics, smart-device charging management, and customer information management.11 In addition, expensive battery technology and low oil prices during the economic downturn limited market penetration. Nonetheless, PEV use will likely increase as battery technology improves and batteries become more affordable.
Transportation and electricity Additionally important, evolving technologies, including electric and hybrid vehicles, are driving significant transformation in the industry, which will open new markets for electricity.
10 The State of the Union 2011, http://www.whitehouse.gov/state-of-theunion- 2011.11 “Lack of Technical Standards Could Hinder Utilities’ Readiness for Electric Vehicles,” Pike Research, April 7, 2011.

8
© 2012 KPMG International Cooperative (“KPMG International”), a Swiss entity. Member firms of the KPMG network of independent firms are affiliated with KPMG International. KPMG International provides no client services. No member firm has any authority to obligate or bind KPMG International or any other member firm vis-à-vis third parties, nor does KPMG International have any such authority to obligate or bind any member firm. All rights reserved. NDPPS 104793
Major infrastructure projects – risk management and controls: P&U companies are seeing an increase in the planning and execution of major infrastructure projects to meet growing energy demand and comply with emerging GHG and carbon emissions regulations. These projects, budgeted at $1 billion or more, require years of planning, design, and construction. As the global economy emerges from recession, projects initiated in 2011 and later will face a unique set of challenges. These challenges include investors demanding higher returns, public agencies and regulatory bodies increasing oversight, and lenders lowering their risk appetite and expecting stronger program and risk management controls. All of these must be managed against a backdrop of potential infrastructure failures.
To meet these challenges, power generation companies and public utilities must focus on ways to increase the likelihood of project success. CFOs, internal audit directors, audit committees, and boards of directors are quickly learning the language of program and project management and recognizing the value added by experienced project management teams and world-class policies, procedures, and controls. Now more than ever, there is a move by energy companies involved in infrastructure construction to focus on strategic planning, procurement, risk management, audit and compliance, and executive-level project reporting.
Strategic planning: Projects begin with the identification of new business opportunities or the need to expand existing facilities based on market demand. The purpose of the strategic planning phase is to align opportunities and needs with business goals and to ensure that capital investment in projects is based on strategic business decisions. Initially, the strategic planning process is used to screen out projects that are not aligned with corporate objectives and are unlikely to be viable. Projects that are promising are analyzed further through
concept planning and feasibility studies. Before the decision is made to proceed from planning to project delivery, the project sponsors and stakeholders complete a detailed review of the scope, schedule, project delivery method, budget, financing plan, and business case associated with the project. Upon completion of a rigorous strategic planning process, a full authorization for the project is issued through corporate channels.
Project delivery/procurement: To improve their project delivery/procurement practices, energy companies are seeking to better align their sourcing, selection, and contracting strategies to the risk profile of each unique project. One current trend involves obtaining approval from senior management and members of the board of directors to establish master agreements with preferred contractors and suppliers following competitive negotiations. Some companies involve the corporate procurement department at the start of a large capital project to review solicitations, prequalify vendors, develop and negotiate contracts, and assist in contract administration. Other trends include the use of centralized electronic contract administration systems, implementation of supplier management programs, including regular vendor evaluations, and direct procurement of all major equipment and bulk materials by the owner.
Risk management: Improvements in risk management include establishing a project risk manager role, developing project risk management standards, conducting risk management workshops, assigning risk management project working groups, preparing project risk reports, and performing quantitative risk analysis to determine the potential financial impact of known and unknown risks to the successful completion of the project.
Infrastructure investmentIn addition to investing in new generation capacity, there is a need to devote significant capital budgets to maintaining, replacing, and improving traditional P&U infrastructure. The areas with the highest investment needs include generation, transmission, and distribution. Shareholder-owned utilities are projected to deploy nearly $250 billion in the electricity infrastructure sector over the next three years. Such large capital expenditures will strain utility balance sheets.

9
© 2012 KPMG International Cooperative (“KPMG International”), a Swiss entity. Member firms of the KPMG network of independent firms are affiliated with KPMG International. KPMG International provides no client services. No member firm has any authority to obligate or bind KPMG International or any other member firm vis-à-vis third parties, nor does KPMG International have any such authority to obligate or bind any member firm. All rights reserved. NDPPS 104793
Audit and compliance: Failure to meet project budgets and completion time lines wastes limited resources, complicates company operations, and damages a company’s reputation. As pressures mount to deliver successful results on construction contracts, it becomes important—now more than ever—for P&U companies to demonstrate sound project management and cost control practices. More P&U companies are viewing auditing and compliance as an effective tool to do more with less and help eliminate wasteful spending and cost overruns. There are several steps that power generation companies and public utilities can take to address the audit and compliance challenges of major infrastructure projects. These include assigning subject matter professionals, integrating the audit and compliance activities with corporate policies and procedures, developing a customized strategy for delivery, having routine project risk assessments, having phased contract compliance, and monitoring the regulatory requirements.
Project reporting: The project owner’s team responsible for managing the infrastructure project must be capable of supporting extensive regulatory, financial, management, and other stakeholder reporting requirements. Implementing an effective project reporting system is one of the most difficult project management challenges, as project reporting requires coordinated and integrated information from all project phases, including engineering, procurement, construction, commissioning, and start-up. The project reporting system must have transparency, accuracy, and clearly defined objectives, and produce effective project reports tailored to the various project stakeholders at the appropriate level. Executive level status reports can prove invaluable if designed and presented in an effective manner. These reports include project dashboards, management reports, cost reports, and milestone schedule reports along with brief narratives and graphics identifying the major risks and their potential impacts on successful project completion.12
12 “The Great Global Infrastructure Opportunity, Global Construction Survey 2012” KPMG International; “Powering Up,” FTI Consulting, September 2010; “Canada’s power grid needs $293B infusion: report,” CBCNews, April 7, 2011; Canada’s Electricity Infrastructure: Building a case for Investment, The Conference Board of Canada, April 2011.

10
© 2012 KPMG International Cooperative (“KPMG International”), a Swiss entity. Member firms of the KPMG network of independent firms are affiliated with KPMG International. KPMG International provides no client services. No member firm has any authority to obligate or bind KPMG International or any other member firm vis-à-vis third parties, nor does KPMG International have any such authority to obligate or bind any member firm. All rights reserved. NDPPS 104793
Regulations on GHG emissions: The U.S. Environmental Protection Agency (EPA) issued its Final Rule on the mandatory reporting of GHG emissions in September 2009. In 2010, the EPA finalized the Greenhouse Gas Emissions “Tailoring Rule,” which mandates that projects that produce significant amounts of GHG emissions will require an air permit. More specifically, power plants that emit at least 75,000 short tons per year of GHG emissions, and that are required to get permits for other pollutants, must now use so-called best available control technology (BACT) when expanding or doing major retooling. An additional part of the Tailoring Rule will require any source emitting at least 100,000 short tons per year to obtain the permits for both BACT and polluting GHGs, even if they have not had to get permits for other pollutants. The EPA has also proposed performance standards on GHG emissions for both new and existing plants, starting in July 2011 for power generators and in December 2011 for oil refineries.
In addition, the EPA has mandated that large polluters submit annual reports to the agency about their emissions. The polluters have been required to measure their emissions since January 2010. The new rule covers global warming pollutants, including carbon dioxide, methane, and nitrous oxide. (Plants and factories that pollute less than 50,000 short tons of GHGs a year will not be regulated until 2016.)
In line with these efforts to reduce emissions, federal and state legislatures are encouraging the use of wind, solar, geothermal, and hydro sources to generate power. In several states with deregulated energy markets, companies are successfully marketing power produced exclusively from renewable, nonpolluting sources.
However, with the upcoming presidential and key congressional elections, the U.S. Congress is likely to consider stopping or curtailing federal regulation of GHG emissions from power plants and refineries amid concerns that these regulations might increase energy costs or reduce energy reliability. Votes in the U.S. Senate will be the deciding factor, as the Republican
majority in the U.S. House of Representatives has stated its intent to pass legislation to stop EPA regulation of GHGs and has introduced several bills to do so.
Renewable Portfolio Standards: In an attempt to reduce GHG emissions and promote the use of alternative energy, many U.S. states have set requirements for a specific amount of electricity that electric utilities must produce from renewable or alternative energy sources. Most of these requirements take the form of renewable portfolio standards (RPS) or alternative energy portfolio standards (AEPS). These standards range from modest to ambitious and qualifying energy sources vary. Some states also include “carve-outs,” which are requirements that a certain percentage of the portfolio be generated from a specific energy source, such as solar power, as well as other incentives to encourage the development of particular resources.13
RPSs and AEPSs are not without challenges. At present, 29 U.S. states and the District of Columbia require utilities to meet certain thresholds of renewable energy in their portfolios. Legislators in Montana, Colorado, Minnesota, and Missouri are separately trying to weaken or dismantle the RPS in their states,14 arguing that the laws increase energy costs and hurt consumers. Groups that support alternative energy counter that lowering the requirements for state renewable energy policies will stifle new investment and reduce jobs. In the past two years, states such as California, New York, Nevada, and Colorado have voted to increase or even double their RPS requirements.15
Cyber security on the power grid: In addition to environmental regulations, the government has mandated new regulations on cyber security in the U.S. power grid. The Energy Policy Act of 2005 gave the Federal Energy Regulatory Commission (FERC) jurisdiction to conduct oversight of the bulk power system, including the approval of mandatory cyber security and reliability standards. FERC, in turn, authorized the North American Electric Reliability Corporation (NERC) to establish detailed cyber security and operational reliability standards
Key regulatory issuesIn this environment of slow demand growth and needed infrastructure investment, the P&U industry also faces a number of regulations that could add significant costs to doing business. Major environmental statutes, emissions regulations, and renewable portfolio standards could require increased investment in renewable energy. New cyber security standards could also require new investment. In addition, P&U companies that rely on over-the-counter (OTC) swap products to hedge financial risk may see significant changes to this aspect of their business from the Dodd-Frank Act.
13 Renewable & Alternative Energy Portfolio Standards, updated on April 7, 2011.14 Renewable & Alternative Energy Portfolio Standards, Pew Center on Global Climate Change, April 7, 2011.15 “State Renewable Energy Standards Under Attack from GOP Legislators,” Reuters, February 9, 2011.

11
© 2012 KPMG International Cooperative (“KPMG International”), a Swiss entity. Member firms of the KPMG network of independent firms are affiliated with KPMG International. KPMG International provides no client services. No member firm has any authority to obligate or bind KPMG International or any other member firm vis-à-vis third parties, nor does KPMG International have any such authority to obligate or bind any member firm. All rights reserved. NDPPS 104793
along with a time line for mandatory compliance, subject to audit verification. However, an audit conducted by the Department of Energy’s Office of the Inspector General (OIG) claims that the power grid cyber security standards approved by FERC did not include a number of cyber security controls recommended for government and industry systems. NERC-CIP standards are being updated, and affected electric market participants are implementing programs to comply with the updated standards.
The Dodd-Frank Act: The Dodd-Frank Wall Street Reform andConsumer Protection Act will bring changes to the marketfor over-the-counter (OTC) swap products that many U.S.companies use to hedge their business risk. The law addressesmany important financial and regulatory matters, includingincreasing transparency, regulating systemic risk, and theresolution (e.g. “living wills”) of institutions that are “too bigto fail.” One of the most relevant aspects of the Dodd-FrankAct to energy companies is the new regulation of OTC derivative markets. The law is potentially far-reaching, and new regulations could affect the hedging and trading strategies, processes, information technology (IT), data requirements, and liquidity needs of energy companies.
The effective date of OTC derivatives regulation is October 12, 2012. The Commodity Futures Trading Commission (CFTC) has finalized most rules related to OTC derivatives, and it has established compliance dates based on entity classification (e.g., swap dealer, major swap participant, non-swap dealer /
non-major swap participant). The CFTC’s rules related to OTC derivatives include:
• Real-time reporting and record-keeping requirements — including historical swaps
• Swap dealer and major swap participants’ duties
• Registration and business conduct requirements
• Mandatory clearing and margining
• End-user exception from mandatory clearing
• Capital requirements
New regulation almost always brings change to a company’sbusiness. Energy companies that have engaged in OTC swapswill likely need to rethink those activities from both a strategicand tactical perspective. From a strategic point of view, theywill likely need to trade new compliance risks against themarket risks that they have been managing. The changingmarket landscape will no doubt present new opportunities forthose who can best manage the compliance burdens. Froma tactical point of view, companies will likely need to evaluatethe current state of their systems (data, reporting, etc.) andprocesses from the perspective of their ability to meet therequirements in the Dodd-Frank Act. The new landscape willalso present new opportunities for those companies that can meet the new requirements.

12
© 2012 KPMG International Cooperative (“KPMG International”), a Swiss entity. Member firms of the KPMG network of independent firms are affiliated with KPMG International. KPMG International provides no client services. No member firm has any authority to obligate or bind KPMG International or any other member firm vis-à-vis third parties, nor does KPMG International have any such authority to obligate or bind any member firm. All rights reserved. NDPPS 104793
Emissions from electric power generation now account for about a third of the total GHG emissions in the United States.13 At the same time, P&U companies have the opportunity to support, enable, and increase gains in sustainability, both now and in the years ahead, through renewable energy deployments and a slow transition to natural gas and clean coal. President Barack Obama has highlighted the industry’s prominence in energy sustainability issues by challenging Congress to mandate that 80 percent of the nation’s electricity be generated from a clean energy portfolio by 2035.16
There are significant economic and systemic concerns involved with increasing the use of clean energy and reducing GHG emissions. Overall, such a change must be done in an economically sustainable manner. Notably, EPA regulations are driving a transition from coal to natural gas through a variety of new and proposed rules that could contribute to a change in the composition of electricity generation sources. The presence of shale gas also has the potential to change the investment landscape for power generation. In addition, combustion technologies such as clean coal and carbon capture and storage (CCS) technologies are rapidly advancing.
A lower-carbon economy poses the primary challenge for utilities, specifically in improving operational efficiency. It also creates opportunities to leverage tax incentives and new technologies while building a sustainable supply chain and new business models.
Improving operational performance: Sustainability should focus on reducing both a company’s costs and its environmental footprint. This is accomplished not only through the deployment of renewable energy, but also through an overall focus on efficiency and cost savings.
Enabling sustainability performance requires establishing targets that align to the overall commitments of the enterprise and are monitored with key performance indicators (KPIs). The P&U industry is deeply immersed in improving operations and enabling clean power through the additions of renewables, fuel switching, combustion efficiency upgrades, and emissions
technology deployments. In addition, utilities promote IT sustainability by deploying smart grids, enabling customer energy efficiency programs, assessing plug-in electric vehicle (PEV) readiness, and implementing necessary upgrades to accommodate vehicle charging.
Leveraging tax incentives: A well-designed sustainability strategy can take advantage of current U.S. tax policy, which encourages investment in sustainability projects. There is an array of federal, state, and local tax incentives to promote the development of energy and sustainability projects. Current U.S. federal tax incentives include:
• A Production Tax Credit (PTC) for the production of electricity from alternative energy sources
• An Investment Tax Credit (ITC) for installation of renewable energy property
• Qualifying alternative energy and energy efficiency property that can receive direct federal grants in lieu of tax credits
• Incentives for the creation or expansion of energy efficiency equipment such as combined heat and power projects
• Numerous state incentives for renewable energy and energy-efficient investments.
Overall, sustainability initiatives can help P&U companies enhance their competitiveness while also advancing the economic and social conditions in the communities in which they operate. Companies that embrace sustainability as an opportunity to improve their performance and enhance their competitiveness could realize a number of benefits, including cost reduction, increased resource and operational efficiency, enhanced enterprise risk management, reputation enhancement, market recognition as a responsible enterprise, regulatory compliance and avoidance of fines and penalties, and enhanced recruitment and retention of talent. Although P&U companies face significant challenges in meeting current and future regulations and in helping transition to a lower carbon economy in a cost-effective manner, they also have the opportunity to support, enable, and increase gains in sustainability, both now and in the years ahead.17
Energy sustainabilityThere has been an increased focus on reducing GHG emissions and transitioning to a lower carbon economy, and the power and utilities industry has the potential to facilitate this transition if cost-effective means are employed. Energy sustainability can also provide opportunities for P&U companies to improve operational performance and take advantage of tax incentives designed to promote sustainability investment.
16 The State of the Union 2011, http://www.whitehouse.gov/state-of-theunion- 2011.17 Climate Analysis Indicators Tool (CAIT US) Version 4.0, World Resources Institute, 2010. Based on 2007 data.

13
© 2012 KPMG International Cooperative (“KPMG International”), a Swiss entity. Member firms of the KPMG network of independent firms are affiliated with KPMG International. KPMG International provides no client services. No member firm has any authority to obligate or bind KPMG International or any other member firm vis-à-vis third parties, nor does KPMG International have any such authority to obligate or bind any member firm. All rights reserved. NDPPS 104793
On the demand side, large utilities will likely continue to seek opportunities to increase share prices via strategic acquisitions that provide enhanced scale and operational flexibility. Additionally, financial investors (including infrastructure and pension funds), which have been relatively quiet since 2007, have a significant amount of equity capital and remain keenly interested in the long-term, stable cash flows associated with regulated utility assets.
However, the supply side of the market continues to ebb and flow, based on the availability and retention of deal synergies, regulatory approval uncertainties, and a limited number of viable targets.
Availability and retention of deal synergies: Like most M&A transactions, recent deals in the utility sector rely on anticipated financial and operational synergies. For example, some utilities have reduced costs through the optimization of their generation fleet and through reductions in maintenance, corporate, and back-office expenses.
Regulatory approval uncertainties: Contrary to many large deals in the past, the recent transactions have generally received more favorable regulatory treatment, including shorter deal approval time lines and fewer unfavorable deal approval stipulations and conditions (e.g., bill credits, stay-out provisions,
CAPEX and employment commitments, capital structure requirements, etc.). From a broader perspective, the regulatory approval process has seemingly been streamlined and made less uncertain since the 2004 to 2006 period, when seven potential deals were either denied or withdrawn due to regulatory approval issues.
A limited number of viable targets: Excluding co-ops and municipal systems, the United States currently has 187 individual gas and electric utilities that are owned by approximately 100 holding companies (79 of which are publicly traded). When considering the various screening factors that a potential buyer uses to evaluate targets (e.g., the need for transparent and M&A friendly regulatory approval processes, contiguous service territories, load/rate base growth opportunities, motivated management and shareholder groups, favorable deal economics, etc.), the population of 187 potential targets can be reduced somewhat quickly to only a short list of practical candidates.
Outlook: The level of deal activity in the future will likely be driven mostly by the factors discussed above. Additional factors include the possibility of a continued decline in return on equity in an environment of rising interest rates and that the price of potential targets becomes too expensive, given the recent bull market in utility stocks.
Regulated Utility M&AAfter the announcement of seven significant deals involving regulated utilities in 2010 and early 2011, there have been only two deals involving regulated utilities in the past year.
However, the activity in 2010 and in early 2011 could be viewed as a catch-up for the limited M&A that occurred in 2008 and 2009, and a supply and demand imbalance may continue to exist in the utility M&A market.
ConclusionTechnological innovation, aging infrastructure, a desire for cleaner sources of energy, and a recovering economy are all forces shaping the industry in dramatic and unpredictable ways over the next several years. Significant new challenges, risks, and opportunities are a given in a changing industry. Successful companies can use these changes as an opportunity to serve their customers better in the years to come.

Where can you find the latest industry insights?
Here.When you need to learn the latest about energy issues and emerging trends that may affect you, visit the KPMG Global Energy Institute (GEI). Since 2007, GEI has been providing energy financial professionals with a forum where industry executives can share knowledge, gain insights, and access thought leadership across the globe. Our 23,000 GEI members get updates on key industry issues, trends, and opportunities in many formats, including:
– KPMG’s Annual Global Energy Conference
– Webcasts
– Share forums
– Thought leadership publications
– iTunes® podcasts
– Executive education program
– Quarterly newsletters
Start taking advantage of all GEI has to offer by becoming a member today. Visit www.kpmgglobalenergyinstitute.com.
Follow us on:
@KPMG_US hashtag #KPMG_Energy
© 2012 KPMG International Cooperative (“KPMG International”), a Swiss entity. Member firms of the KPMG network of independent firms are affiliated with KPMG International. KPMG International provides no client services. No member firm has any authority to obligate or bind KPMG International or any other member firm vis-à-vis third parties, nor does KPMG International have any such authority to obligate or bind any member firm. All rights reserved. 52703DAL

Contact us
John KunasekPartner, U.S. Sector Leader for Energy, Natural Resources and ChemicalsKPMG LLP (U.S.) T: 713-319-3513 E: [email protected]
Regina Mayor Principal, U.S. Energy and Natural Resources Advisory Leader KPMG LLP (U.S.) T: 713-319-3137 E: [email protected]
Rod AndersonPartner, U.S. Power & Utilities Tax LeaderKPMG LLP (U.S.) T: 402-661-8740 E: [email protected]
Darin Kempke Partner, U.S. Power & Utilities Audit Leader KPMG LLP (U.S.) T: 267-256-1640 E: [email protected]
kpmg.com
The information contained herein is of a general nature and is not intended to address thecircumstances of any particular individual or entity. Although we endeavor to provide accurate andtimely information, there can be no guarantee that such information is accurate as of the date it isreceived or that it will continue to be accurate in the future. No one should act upon such informationwithout appropriate professional advice after a thorough examination of the particular situation.
© 2012 KPMG International Cooperative (“KPMG International”), a Swiss entity. Member firms of theKPMG network of independent firms are affiliated with KPMG International. KPMG International providesno client services. No member firm has any authority to obligate or bind KPMG International or any othermember firm vis-à-vis third parties, nor does KPMG International have any such authority to obligateor bind any member firm. All rights reserved. The KPMG name, logo and “cutting through complexity”are registered trademarks or trademarks of KPMG International. NDPPS 104793
KPMG is a global network of professional firms providing Audit, Tax and Advisory services.We operate in 152 countries and have 145,000 people working in member firms around the world.The independent member firms of the KPMG network are affiliated with KPMG InternationalCooperative (“KPMG International”), a Swiss entity. Each KPMG firm is a legally distinct andseparate entity and describes itself as such.