Embed Size (px)
Citation preview

U.S. Department of EducationInstitute of Education SciencesNCES 2004–455
HST
SH
STS High
SchoolTranscript Study
HighSchoolTranscript Study
A Decade of Change inCurricula and Achievement, 1990-2000
The High SchoolTranscript Study
The H
igh Sc
hoo
l Transc
ript Stud
y - A D
ec
ad
e o
f Cha
nge
in Curric
ula a
nd A
chie
vem
ent, 1990-2000
2004
U.S. Department of EducationED Pubs8242-B Sandy CourtJessup, MD 20794-1398
Official BusinessPenalty for Private Use, $300
U.S. POSTAGE PAIDU.S. DEPARTMENTOF EDUCATION
PERMIT NO. G-17
Darvin M. Winick, ChairPresidentWinick & Associates, Inc.Dickinson, Texas
Honorable Jo Ann Pottorff, Vice ChairState LegislatorTopeka, Kansas
Amanda P. AvalloneAssistant Principal and
Eighth-Grade TeacherSummit Middle SchoolBoulder, Colorado
Barbara Byrd-BennettChief Executive OfficerCleveland Municipal
School DistrictCleveland, Ohio
Carl A. CohnClinical ProfessorRossier School of EducationUniversity of Southern CaliforniaLos Angeles, California
Shirley V. DicksonProgram Director, Literacy
Education Commission of theStates
Denver, Colorado
Edward DonleyFormer ChairmanAir Products & Chemicals, Inc.Allentown, Pennsylvania
John Q. EastonExecutive DirectorConsortium on Chicago School
ResearchChicago, Illinois
Honorable Dwight EvansState LegislatorPhiladelphia, Pennsylvania
Sheila M. FordPrincipalHorace Mann Elementary SchoolWashington, DC
David W. GordonSuperintendent of SchoolsElk Grove Unified School DistrictElk Grove, California
Catherine M. HarveyPrincipalBethesda-Chevy Chase High SchoolBethesda, Maryland
Juanita H. HaugenLocal School Board MemberPleasanton, California
Honorable Dirk A. KempthorneGovernor of IdahoBoise, Idaho
Kathi M. KingTwelfth-Grade TeacherMessalonskee High SchoolOakland, Maine
Kim Kozbial-HessFourth-Grade TeacherFall-Meyer Elementary SchoolToledo, Ohio
Honorable Ronnie MusgroveJackson, Mississippi
Diane RavitchSenior Research ScholarNew York UniversityNew York, New York
Mark D. ReckaseProfessorMeasurement and Quantitative
MethodsMichigan State UniversityEast Lansing, Michigan
Sister Lourdes M. Sheehan, R.S.M.Associate General SecretaryUnited States Catholic ConferenceWashington, DC
John H. StevensExecutive DirectorTexas Business and Education
CoalitionAustin, Texas
Honorable Michael E. WardState Superintendent of Public
InstructionNorth Carolina Public SchoolsRaleigh, North Carolina
Eileen L. WeiserMember, State Board of EducationLansing, Michigan
Dennie Palmer WolfDirector of Opportunity
and Accountability InitiativesAnnenberg Institute for School
ReformProvidence, Rhode Island
Honorable Grover (Russ) Whitehurst(Ex-Officio)DirectorInstitute of Education SciencesU.S. Department of EducationWashington, DC
Charles E. SmithExecutive Director, NAGBWashington, DC
What is The National Assessment of Educational Progress?The National Assessment of Educational Progress (NAEP) is a nationally representative and continuingassessment of what America’s students know and can do in various subject areas. Since 1969, assessmentshave been conducted periodically in reading, mathematics, science, writing, history, geography, andother fields. By making objective information on student performance available to policymakers at thenational, state, and local levels, NAEP is an integral part of our nation’s evaluation of the condition andprogress of education. Only information related to academic achievement is collected under this programNAEP guarantees the privacy of individual students and their families.
NAEP is a congressionally mandated project of the National Center for Education Statistics within theInstitute of Education Sciences of the U.S. Department of Education. The Commissioner of EducationStatistics is responsible, by law, for carrying out the NAEP project through competitive awards to qualifiedorganizations.
In 1988, Congress established the National Assessment Governing Board (NAGB) to oversee and setpolicy for NAEP. The Board is responsible for: selecting the subject areas to be assessed; setting appropriatestudent achievement levels; developing assessment objectives and test specifications; developing a processfor the review of the assessment; designing the assessment methodology; developing guidelines forreporting and disseminating NAEP results; developing standards and procedures for interstate, regional,and national comparisons; determining the appropriateness of all assessment items and ensuring theassessment items are free from bias and are secular, neutral, and non-ideological; taking actions to improvethe form, content, use, and reporting of results of the National Assessment; and planning and executingthe initial public release of National Assessment of Educational Progress reports.
The National Assessment Governing Board

U.S. Department of Education Rod Paige Secretary
Institute of Education Sciences Grover J. Whitehurst Director
National Center for Education Statistics Robert Lerner Commissioner The National Center for Education Statistics (NCES) is the primary federal entity for collecting, analyzing, and reporting data related to education in the United States and other nations. It fulfills a congressional mandate to collect, collate, analyze, and report full and complete statistics on the condition of education in the United States; conduct and publish reports and specialized analyses of the meaning and significance of such statistics; assist state and local education agencies in improving their statistical systems; and review and report on education activities in foreign countries. NCES activities are designed to address high priority education data needs; provide consistent, reliable, complete, and accurate indicators of education status and trends; and report timely, useful, and high quality data to the U.S. Department of Education, the Congress, the states, other education policymakers, practitioners, data users, and the general public.
We strive to make our products available in a variety of formats and in language that is appropriate to a variety of audiences. You, as our customer, are the best judge of our success in communicating information effectively. If you have any comments or suggestions about this or any other NCES product or report, we would like to hear from you. Please direct your comments to:
National Center for Education Statistics Institute of Education Sciences U.S. Department of Education 1990 K Street NW Washington, DC 20006
March 2004
The NCES World Wide Web Home Page is: http://nces.ed.gov The NCES World Wide Web Electronic Catalog is: http://nces.ed.gov/pubsearch
Suggested Citation U.S. Department of Education, National Center for Education Statistics. The High School Transcript Study: A Decade of Change in Curricula and Achievement, 1990–2000. NCES 2004–455, by Robert Perkins, Brian Kleiner, Stephen Roey, and Janis Brown. Project Officer: Janis Brown. Washington, DC: 2004.
For ordering information on this report, write:
U.S. Department of Education ED Pubs P.O. Box 1398 Jessup, MD 20794–1398
Call toll free 1–877–4ED–Pubs; or order online at http://www.edpubs.org
Content Contact: Janis Brown (202) 502–7482 [email protected]
iii
ACKNOWLEDGMENTS
The authors appreciate the comprehensive review of this report by the following adjudication panel members: Albert Beaton, James Carlson, Mary Crovo, Larry Feinberg, Ray Fields, Gary Hoachlander, Lisa Hudson, Andrew Kolstad, Carolyn Lee, Andrew Malizio, Karen O’Conor, and Jeffrey Owings.
The authors of this report are indebted to all the schools that participated in the study and
thus provided the information that made this report possible. At Westat, in addition to the authors, Nancy Caldwell, Lloyd Hicks, Yan Yun Liu, Keith Rust, Neha Singh, Michael Stock, and Barbara Brickman contributed to the production of this report.

iv
v
FOREWORD
The 2000 High School Transcript Study (HSTS) was conducted by Westat for the U.S. Department of Education’s National Center for Education Statistics. This study provides the Department of Education and other educational policymakers with information regarding current course offerings and students’ coursetaking patterns in the nation’s secondary schools. Since similar studies were conducted on the coursetaking patterns of 1982, 1987, 1990, 1994, and 1998 graduates, one research objective was to study changes in these patterns. Another research objective was to compare coursetaking patterns to study results on the 2000 National Assessment of Educational Progress (NAEP). NAEP is a federally funded, ongoing, periodic assessment of educational achievement in the various subject areas and disciplines taught in the nation’s schools. Since 1969, NAEP has gathered nationwide information about the levels of educational achievement of elementary and secondary school students.
The 2000 High School Transcript Study is documented in three reports:
The High School Transcript Study: A Decade of Change in Curricula and Achievement, 1990–2000 – This summary report highlights major findings from the HSTS 2000 and examines the trends and changes in high school curriculum and student coursetaking patterns for the decade between 1990 and 2000.
The 2000 High School Transcript Study User’s Guide and Technical Report – The User’s Guide and Technical Report documents the procedures used to collect and summarize the data. It also provides information needed to use all publicly released data files produced by the study.
The 2000 High School Transcript Study Tabulations: Comparative Data on Credits Earned and Demographics for 2000, 1998, 1994, 1990, 1987, and 1982 High School Graduates – The Tabulations Report provides a large number of tables that summarize the coursetaking patterns of 2000 high school graduates and compare them to those of their counterparts in 1982, 1987, 1990, 1994, and 1998. The report also provides data tables describing the relationship of the coursetaking patterns of 2000 graduates to their proficiencies in mathematics and science as measured by the 2000 National Assessment of Educational Progress.
It is expected that there will be a diverse audience interested in the potential of HSTS data for educational research. The summary report will introduce researchers to the HSTS data, as well as provide highlights from the HSTS 2000 data. Some readers will be interested in a more in-depth discussion of the technical aspects of the HSTS, while other readers may wish to obtain further information on the HSTS findings. These readers are referred to the User’s Guide and Technical Report and the Tabulations Report, respectively, to locate such information.

vi

vii
EXECUTIVE SUMMARY
Background
Over the years, various reform efforts have sought to improve the quality of education across the nation. In the early 1980s, the focus was on statewide curricula in core courses, a response to the report A Nation at Risk (National Commission on Excellence in Education 1983). Since then, to address issues of a quality education, efforts have emphasized courses in specific subject areas (mathematics and science, for example), the number of courses completed, and the timeline for course completion.
Transcript studies serve as a barometer for changes in high school student coursetaking
patterns which, in combination with school course offerings, provide valuable information about the rigor of high school curricula across the nation. One such transcript study, the High School Transcript Study (HSTS), periodically surveys the curricula being offered in our nation’s high schools and the coursetaking patterns of high school students.
This report presents findings from the HSTS 2000 and examines the trends and changes in
high school curriculum and student coursetaking patterns for the past decade. The results from the HSTS 2000 are presented with respect to earned course credits, grade point average, and education achievement, as measured by the NAEP 2000 mathematics and science assessments.1 In addition, results are compared across the transcript studies between 1990 and 2000 (HSTS 1990, HSTS 1994, HSTS 1998, and HSTS 2000). Findings are viewed throughout the report by selected student and school characteristics, including student gender, student race/ethnicity, school type (public vs. nonpublic), and region of the country.
Additional transcript studies were conducted by the National Center for Education Statistics
(NCES) in 1982 in conjunction with the first follow-up survey of the High School and Beyond Study, in 1987 as a study of the 11th-grade cohort of the 1986 NAEP, and in 1992 in conjunction with the second follow-up of the National Education Longitudinal Study of 1988 (NELS:88). For documentation about these studies, see chapter 6 (References). This report looks at the HSTS from 1990 to 2000 conducted in conjunction with NAEP. For this report, only the NAEP-based transcript studies are used, because it is only for these studies that the target population remains the same. 1For HSTS 2000, NCES conducted a national survey of high school transcripts of 12th-grade students in conjunction with the 2000 National Assessment of Educational Progress (NAEP) mathematics and science assessments. The irregular frequency of the HSTS transcript studies prevents the comparisons of HSTS data with the NAEP main mathematics and science assessments from previous years. The NAEP main assessments associated with HSTS 1994 and HSTS 1998 covered neither mathematics nor science. A NAEP main mathematics assessment occurred in 1990, but the design of HSTS 1990 linked HSTS with NAEP data at the school level, not at the student level.
viii
It should also be noted that trends in the relationship between coursetaking patterns and student achievement (as measured by NAEP) are not presented, since the corresponding NAEP assessment subjects differ across years. However, comparisons of coursetaking patterns are possible, due to the comparable analysis and course classification methodologies across the HSTS. The 2000 transcript study was conducted from May through October of 2000 after the administration of NAEP. Transcripts were collected for 12th-grade students who graduated high school by the end of the collection period. Most students also participated in the NAEP assessments earlier that same year.
The differences between the estimates discussed in the report take into account the standard
errors associated with the estimates. Comparisons are based on statistical tests that consider both the magnitude of the difference between the estimates and the standard errors of those statistics. The statistical tests used in the analysis included Bonferroni-adjusted t-tests and correlations (see appendix A for further detail). Throughout this report, differences between estimates are pointed out only when they are significant from a statistical perspective. All differences reported are significant at the 0.05 alpha level.
Key Findings
Course Credits Earned
Overall, the number of course credits2 earned by high school graduates increased throughout the 1990s. In 2000, high school graduates earned an average of 26.2 course credits, compared to an average of 23.6 in 1990 (see figure 1 in chapter 2).
The average number of credits earned in the core academic subject fields (mathematics, science, English, and social studies) increased from 13.7 to 15.0 credits between 1990 and 2000 (see figure 3 in chapter 2).
High school graduates increased their number of earned credits in computer-related vocational courses from 0.4 in 1990 to 0.7 in 2000 (see figure 4 in chapter 2). In the same 10-year span, the number of credits earned by high school graduates decreased in noncomputer-related vocational courses (3.5 in 1990, 3.1 in 2000).
Public high school graduates increased their number of earned course credits from 1990 (23.5) to 2000 (26.2) (see figure 8 in chapter 2).
2Schools participating in the HSTS varied widely in their assignments of credits to their courses. The transcript study standardized the credits across schools such that one credit equals one Carnegie unit. One Carnegie unit equals a class period (45 to 60 minutes) that occurs once per day across the entire school year. Standardization to Carnegie units allows for an accurate comparison of course credits across schools within a transcript study and also allows for an accurate comparison between transcript studies over time.
ix
Grade Point Average
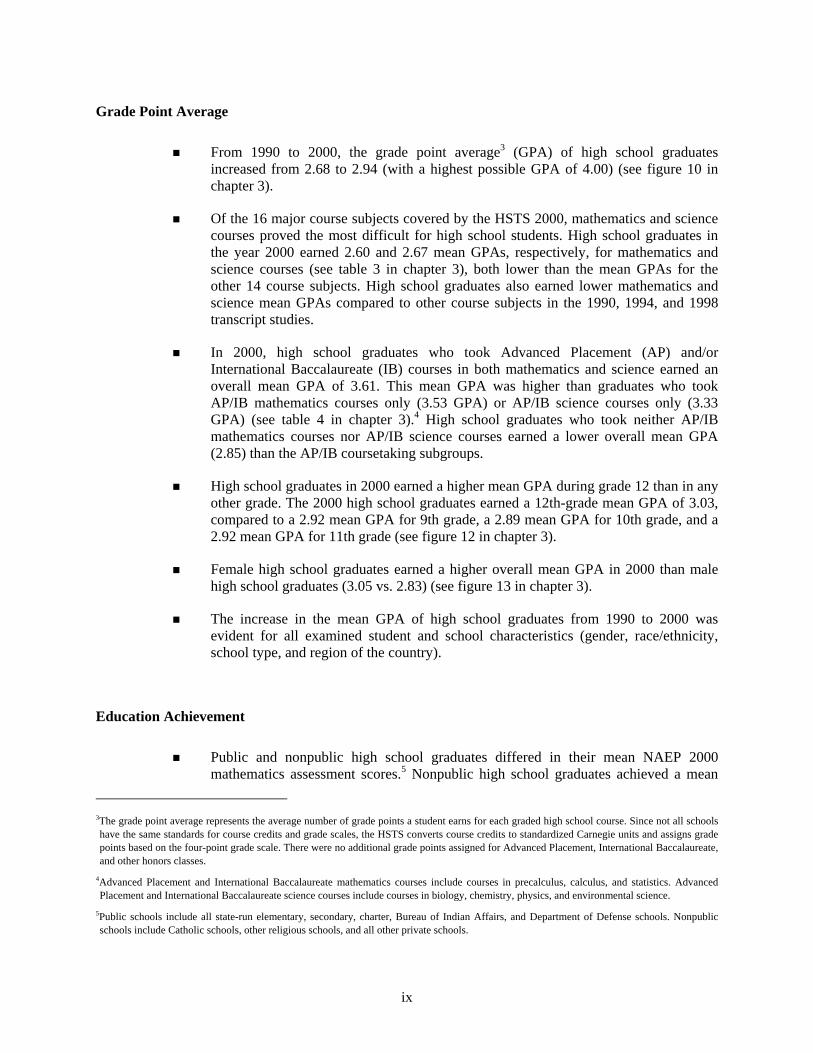
From 1990 to 2000, the grade point average3 (GPA) of high school graduates increased from 2.68 to 2.94 (with a highest possible GPA of 4.00) (see figure 10 in chapter 3).
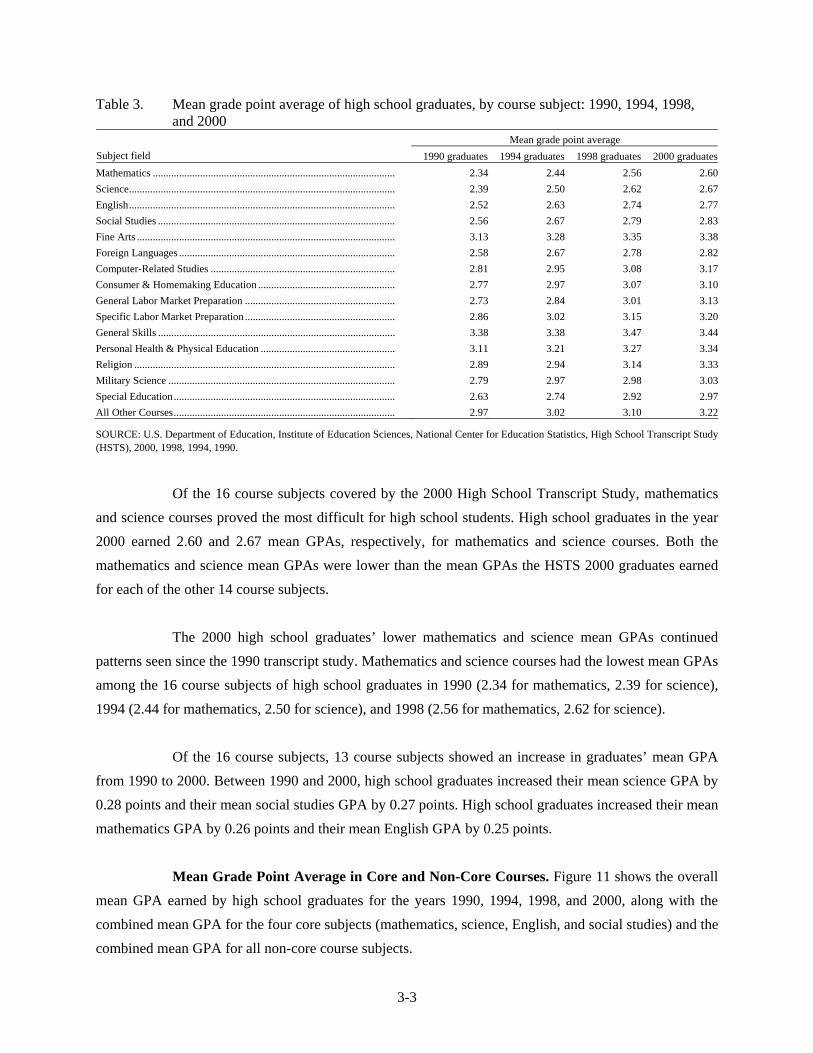
Of the 16 major course subjects covered by the HSTS 2000, mathematics and science courses proved the most difficult for high school students. High school graduates in the year 2000 earned 2.60 and 2.67 mean GPAs, respectively, for mathematics and science courses (see table 3 in chapter 3), both lower than the mean GPAs for the other 14 course subjects. High school graduates also earned lower mathematics and science mean GPAs compared to other course subjects in the 1990, 1994, and 1998 transcript studies.
In 2000, high school graduates who took Advanced Placement (AP) and/or International Baccalaureate (IB) courses in both mathematics and science earned an overall mean GPA of 3.61. This mean GPA was higher than graduates who took AP/IB mathematics courses only (3.53 GPA) or AP/IB science courses only (3.33 GPA) (see table 4 in chapter 3).4 High school graduates who took neither AP/IB mathematics courses nor AP/IB science courses earned a lower overall mean GPA (2.85) than the AP/IB coursetaking subgroups.
High school graduates in 2000 earned a higher mean GPA during grade 12 than in any other grade. The 2000 high school graduates earned a 12th-grade mean GPA of 3.03, compared to a 2.92 mean GPA for 9th grade, a 2.89 mean GPA for 10th grade, and a 2.92 mean GPA for 11th grade (see figure 12 in chapter 3).
Female high school graduates earned a higher overall mean GPA in 2000 than male high school graduates (3.05 vs. 2.83) (see figure 13 in chapter 3).
The increase in the mean GPA of high school graduates from 1990 to 2000 was evident for all examined student and school characteristics (gender, race/ethnicity, school type, and region of the country).
Education Achievement
Public and nonpublic high school graduates differed in their mean NAEP 2000 mathematics assessment scores.5 Nonpublic high school graduates achieved a mean
3The grade point average represents the average number of grade points a student earns for each graded high school course. Since not all schools have the same standards for course credits and grade scales, the HSTS converts course credits to standardized Carnegie units and assigns grade points based on the four-point grade scale. There were no additional grade points assigned for Advanced Placement, International Baccalaureate, and other honors classes.
4Advanced Placement and International Baccalaureate mathematics courses include courses in precalculus, calculus, and statistics. Advanced Placement and International Baccalaureate science courses include courses in biology, chemistry, physics, and environmental science.
5Public schools include all state-run elementary, secondary, charter, Bureau of Indian Affairs, and Department of Defense schools. Nonpublic schools include Catholic schools, other religious schools, and all other private schools.
x
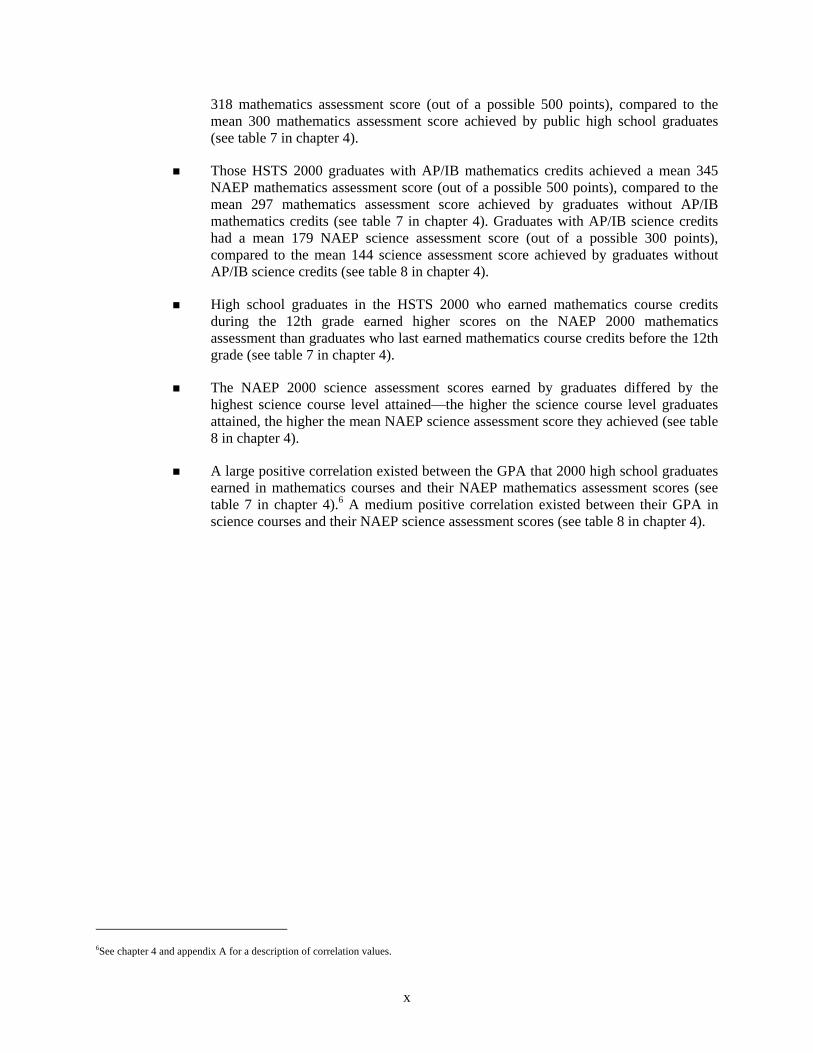
318 mathematics assessment score (out of a possible 500 points), compared to the mean 300 mathematics assessment score achieved by public high school graduates (see table 7 in chapter 4).
Those HSTS 2000 graduates with AP/IB mathematics credits achieved a mean 345 NAEP mathematics assessment score (out of a possible 500 points), compared to the mean 297 mathematics assessment score achieved by graduates without AP/IB mathematics credits (see table 7 in chapter 4). Graduates with AP/IB science credits had a mean 179 NAEP science assessment score (out of a possible 300 points), compared to the mean 144 science assessment score achieved by graduates without AP/IB science credits (see table 8 in chapter 4).
High school graduates in the HSTS 2000 who earned mathematics course credits during the 12th grade earned higher scores on the NAEP 2000 mathematics assessment than graduates who last earned mathematics course credits before the 12th grade (see table 7 in chapter 4).
The NAEP 2000 science assessment scores earned by graduates differed by the highest science course level attained—the higher the science course level graduates attained, the higher the mean NAEP science assessment score they achieved (see table 8 in chapter 4).
A large positive correlation existed between the GPA that 2000 high school graduates earned in mathematics courses and their NAEP mathematics assessment scores (see table 7 in chapter 4).6 A medium positive correlation existed between their GPA in science courses and their NAEP science assessment scores (see table 8 in chapter 4).
6See chapter 4 and appendix A for a description of correlation values.
xi
TABLE OF CONTENTS
Chapter Page ACKNOWLEDGMENTS ............................................................................... iii FOREWORD................................................................................................... v EXECUTIVE SUMMARY ............................................................................. vii 1 INTRODUCTION ........................................................................................... 1-1
Overview of the 2000 High School Transcript Study...................................... 1-1 The High School Transcript Study Framework: The Classification of Secondary School Courses............................................................................... 1-2 High School Transcript Study Instruments...................................................... 1-2 Description of the Samples .............................................................................. 1-3 Target Population............................................................................................. 1-4 Reporting Results............................................................................................. 1-4 Caution in Interpreting Results ........................................................................ 1-5 Structure of the Report..................................................................................... 1-6
2 COURSE CREDITS EARNED....................................................................... 2-1 Total Course Credits Earned............................................................................ 2-1 Course Credits Earned in Course Subjects ...................................................... 2-2 Total Course Credits Earned, by Student and School Characteristics ............. 2-8 Summary.......................................................................................................... 2-14
3 GRADE POINT AVERAGE........................................................................... 3-1
Mean Grade Point Average.............................................................................. 3-1 Mean Grade Point Average, by Course Subject .............................................. 3-2 Mean Grade Point Average, by Grade Level................................................... 3-5 Mean Grade Point Average, by Student and School Characteristics ............... 3-7 Summary.......................................................................................................... 3-14
4 COMPARISON OF HSTS 2000 RESULTS WITH NAEP 2000 ASSESSMENT SCORES................................................................................ 4-1
Mean NAEP Mathematics Assessment Scores................................................ 4-4 Mean NAEP Science Assessment Scores ........................................................ 4-7 Correlation of NAEP 2000 Mathematics Assessment Scores and Mathematics Grade Point Averages................................................................. 4-9 Correlation of NAEP 2000 Science Assessment Scores and Science Grade Point Averages......................................................................... 4-11 Summary.......................................................................................................... 4-13
5 CONCLUSIONS ............................................................................................. 5-1
xii
TABLE OF CONTENTS (CONTINUED)
Chapter Page
6 REFERENCES ................................................................................................ 6-1
List of Appendixes
Appendix Page
A SURVEY METHODOLOGY ......................................................................... A-1 B ANALYSIS TABLES...................................................................................... B-1 C STANDARD ERROR TABLES ..................................................................... C-1 D GLOSSARY .................................................................................................... D-1
List of Tables
Table Page
1 State-level course credit graduation requirements: 1987 and 2000 ................. 2-3 2 Percentage of high school graduates earning AP and IB mathematics and science course credits: 1990, 1994, 1998, and 2000........................................ 2-7 3 Mean grade point average of high school graduates, by course subject: 1990, 1994, 1998, and 2000............................................................................. 3-3 4 Mean grade point average of high school graduates, by AP and IB course status: 1990, 1994, 1998, and 2000.................................................................. 3-5 5 Definitions of mathematics course levels ........................................................ 4-3 6 Definitions of science course levels................................................................. 4-3 7 Mean NAEP mathematics assessment scores for HSTS high school graduates, by student and school characteristics: 2000.................................... 4-5 8 Mean NAEP science assessment scores for HSTS high school graduates, by student and school characteristics: 2000.................................... 4-8
xiii
TABLE OF CONTENTS (CONTINUED)
List of Tables (Continued)
Table Page 9 Correlation of NAEP mathematics assessment scores of high school graduates with mathematics grade point average, by student and school characteristics: 2000 ........................................................................................ 4-10 10 Correlation of NAEP science assessment scores of high school graduates with science grade point average, by student and school characteristics: 2000 ........................................................................................ 4-12
A-1 Total sampled schools and students for the HSTS study: 2000....................... A-7 A-2 Numeric grade conversion ............................................................................... A-14 A-3 Percentage distribution of high school graduates, by student and school characteristics: 1990, 1994, 1998, and 2000.................................................... A-21 A-4 Census region definitions................................................................................. A-22 B-1 Distribution of high school graduates by student and school characteristics: 1990, 1994, 1998, and 2000............................................................................. B-2 B-2 Distribution of high school graduates’ earned course credits (Carnegie units) by student and school characteristics: 1990, 1994, 1998, and 2000 ................ B-3 B-3 Mean number of credits (Carnegie units) earned in course subjects by high school graduates: 1990, 1994, 1998, and 2000 ................................................ B-4 B-4 Distribution of high school graduates’ grade point average by student and school characteristics: 1990, 1994, 1998, and 2000 ........................................ B-5 B-5 Mean grade point average of high school graduates by course subject: 1990, 1994, 1998, and 2000............................................................................. B-6 B-6 Mean NAEP mathematics proficiency estimates of HSTS high school graduates by student and school characteristics: 2000..................................... B-7 B-7 Mean NAEP science proficiency estimates of HSTS high school graduates by student and school characteristics: 2000..................................................... B-8 B-8 Correlation of NAEP mathematics proficiency estimates of HSTS high
school graduates with mathematics grade point average by student and school characteristics: 2000 ............................................................................. B-9
xiv
TABLE OF CONTENTS (CONTINUED)
List of Tables (Continued)
Table Page B-9 Correlation of NAEP science proficiency estimates of HSTS high school
graduates with science grade point average by student and school characteristics: 2000 ........................................................................................ B-10 C-1 Estimates and standard errors for chapter 2 figures......................................... C-2 C-2 Estimates and standard errors for chapter 3 figures......................................... C-6 C-3 Standard error of percentage of high school graduates earning AP and IB mathematics and science course credits: 1990, 1994, 1998, and 2000 ............ C-10 C-4 Standard error of mean grade point average of high school graduates by course subject: 1990, 1994, 1998, and 2000.................................................... C-11 C-5 Standard error of mean grade point average of high school graduates by AP and IB course status: 1990, 1994, 1998, and 2000 .......................................... C-12 C-6 Standard error of mean NAEP mathematics assessment scores for HSTS high school graduates by school and student characteristics: 2000 ................. C-13 C-7 Standard error of mean NAEP science assessment scores for HSTS high school graduates by school and student characteristics: 2000 ......................... C-14 C-8 Standard error of correlation of NAEP mathematics assessment scores of high school graduates with mathematics grade point average by school and student characteristics: 2000 ............................................................................ C-15 C-9 Standard error of correlation of NAEP science assessment scores of high school graduates with mathematics grade point average by school and student characteristics: 2000 ............................................................................ C-16 C-10 Standard error of distribution of high school graduates by student and school characteristics: 1990, 1994, 1998, and 2000 ........................................ C-17
List of Figures
Figure Page
1 Mean course credits earned by high school graduates: 1990, 1994, 1998, and 2000........................................................................................................... 2-2
xv
TABLE OF CONTENTS (CONTINUED)
List of Figures (Continued)
Figure Page 2 Mean course credits earned by high school graduates, by core academic subject: 1990, 1994, 1998, and 2000 ............................................................... 2-4 3 Mean core and non-core course credits earned by high school graduates: 1990, 1994, 1998, and 2000 ........................................................... 2-5 4 Mean vocational credits, computer-related vocational credits, and
noncomputer-related vocational credits earned by high school graduates: 1990, 1994, 1998, and 2000............................................................................. 2-6
5 Mean course credits earned by high school graduates, by gender: 1990, 1994, 1998, and 2000....................................................................................... 2-8 6 Mean core and non-core course credits earned by high school graduates, by gender: 1990, 1994, 1998, and 2000.......................................... 2-10 7 Mean course credits earned by high school graduates, by race/ethnicity: 1990, 1994, 1998, and 2000............................................................................. 2-11 8 Mean course credits earned by high school graduates, by school type: 1990, 1994, 1998, and 2000............................................................................. 2-12 9 Mean course credits earned by high school graduates, by region of the country: 1990, 1994, 1998, and 2000 .............................................................. 2-13 10 Mean grade point average of high school graduates: 1990, 1994, 1998, and 2000................................................................................................. 3-2 11 Mean overall, core, and non-core grade point averages of high school graduates: 1990, 1994, 1998, and 2000............................................................................. 3-4 12 Mean grade point average of high school graduates, by grade level: 1990, 1994, 1998, and 2000............................................................................. 3-6 13 Mean grade point average of high school graduates, by gender: 1990, 1994, 1998, and 2000............................................................................. 3-7 14 Mean grade point average of high school graduates, by race/ethnicity: 1990, 1994, 1998, and 2000............................................................................. 3-9 15 Mean grade point average of high school graduates, by school type: 1990, 1994, 1998, and 2000............................................................................. 3-10
xvi
TABLE OF CONTENTS (CONTINUED)
List of Figures (Continued)
Figure Page 16 Mean grade point average of high school graduates, by gender and school type: 1990, 1994, 1998, and 2000 ........................................................ 3-11 17 Mean grade point average of high school graduates, by region of the country: 1990, 1994, 1998, and 2000 .............................................................. 3-13
1-1
1. INTRODUCTION
Over the years, various reform efforts have changed the direction or emphasis of education, but the goal has remained the same—to provide a quality education to students. In the early 1980s, attention turned to statewide curricula. With the publication of A Nation at Risk (National Commission on Excellence in Education 1983), core curricula were established that were intended to ensure student preparedness for college entrance and global competitiveness in technology. Around the same time, the National Center for Education Statistics (NCES) was developing plans for its first transcript study, which was conducted in 1982 and has been conducted periodically ever since, in order to survey the coursetaking patterns of high school students across the nation. This report presents findings from the 2000 High School Transcript Study (HSTS 2000) and examines the trends and changes in high school curriculum and student coursetaking patterns for the past decade from 1990 to 2000.
Overview of the High School Transcript Study
The High School Transcript Study (HSTS) gathers information from the transcripts of 12th-grade students in public and nonpublic high schools nationwide.7 The information gathered is used to inform the education community on current course offerings and coursetaking patterns in the nation’s secondary schools. Also, the HSTS transcript studies, most of which were conducted with the National Assessment of Educational Progress (NAEP), allow the relationship between coursetaking patterns and student achievement to be explored.8 This report focuses on highlights from the HSTS 2000 study. These highlights include course credits earned, grade point average, and NAEP assessment scores. This report also looks at changes that have occurred in course credits earned and grade point average for high school graduates listed in the HSTS studies from 1990 to 2000.
Additional transcript studies were conducted by NCES in 1982 in conjunction with the first
follow-up survey of the High School and Beyond Study, in 1987 as a study of the 11th-grade cohort of the 1986 NAEP, and in 1992 in conjunction with the second follow-up of the National Education Longitudinal Study of 1988 (NELS:88). For documentation about these studies, see chapter 6 (References). This report looks at the HSTS from 1990 to 2000 conducted in conjunction with NAEP. For
7Public schools include all state-run elementary, secondary, charter, Bureau of Indian Affairs, and Department of Defense schools. Nonpublic schools include Catholic schools, other religious schools, and all other private schools.
8The purpose of NAEP is to measure student achievement in the context of instructional experiences and to track change in achievement of 4th-, 8th-, and 12th-graders over time in selected content domains.
1-2
this report, only the NAEP-based transcript studies are used, because it is only across all of these studies that the target population remains the same.
The High School Transcript Study Framework: The Classification of Secondary School Courses
High school courses across the country vary by content and level even when the course title is similar. Therefore, to compare transcripts from different schools and to ensure that each course is uniquely identified, a common course coding system, the Classification of Secondary School Courses (CSSC), was employed. The CSSC is a modification of the Classification of Instructional Programs (CIP) that is used for classifying college courses. Each course that appears on a student transcript is assigned a unique six-digit code based on the course content and level. Course catalogs and other materials from the participating schools are used to determine the content and level of courses at each school.
For analysis and data presentation purposes, the CSSC is used to aggregate courses into
more general categories, such as English, mathematics, and science. More detailed categories are used, for example, to report findings on such courses as Composition, General Mathematics, and Advanced Placement (AP) Chemistry. All of the courses in each of the transcript studies were coded using the CSSC. Therefore, the coursetaking patterns of the 1990, 1994, 1998, and 2000 high school graduates can be compared across years.
High School Transcript Study Instruments
The HSTS collects authentic transcripts of students graduating in the year of the study. In addition to the course name, grade, and credit received, student information such as gender, grade level, age, graduation status, race/ethnicity, grade point average, and class rank are also collected, when available. Additional information for students with disabilities (SD) and limited English proficient (LEP) students was collected.
To provide a context for the transcript data collected, information was also collected about
school, teacher, and home factors that may be related to student course taking and achievement via the NAEP School Questionnaire. As part of the NAEP data collection, a school official, usually the principal, completes the School Questionnaire. A School Information Form (SIF) is also completed for each participating school, by the data collections field staff or a school staff member. The SIF is used to gather information about the general school characteristics, sources of information within the school, the course
1-3
description materials, school graduation requirements and grading practices, and the format of the school’s transcripts. This information is valuable during the data entry and coding phases of the Transcript Study.
NCES makes a concerted effort to collect information on students with special needs in all of
their studies. Beginning in 1996, as a part of the NAEP assessments, information is collected from school staff about students with disabilities and limited English proficient students via the NAEP SD/LEP Questionnaire. The SD/LEP Questionnaire is completed for students sampled for NAEP and identified by the school as having a disability and/or as limited English proficient. For students who are not sampled for the NAEP assessments, this information is collected from the student transcript.
Description of the Samples
The HSTS 2000 was conducted with a nationally representative sample of 20,931 high school graduates from 277 schools (both public and nonpublic). Twelfth-grade students, whose transcript indicated that they graduated between January 1, 2000, and October 31, 2000, the final date of data collection, were included in the study. Approximately 96 percent of sampled students in the HSTS 2000 transcript study were enrolled in schools that participated in the NAEP assessments. The remaining 4 percent were enrolled in schools that were sampled for NAEP but declined to participate. These schools, however, did participate in the HSTS. The school response rate for the HSTS 2000 was 80.8 percent, while the student response rate was 98.9 percent.
The 1998 HSTS had a nationally representative sample of 24,904 high school graduates
from 264 schools. The school response rate for the HSTS 1998 was 81.5 percent, with a student response rate of 98.6 percent. The 1994 HSTS had a nationally representative sample of 25,364 graduates from 340 schools. The school response rate for the HSTS 1994 was 89.7 percent, with a student response rate of 99.5 percent. The 1990 HSTS had a nationally representative sample of 21,435 graduates from 330 schools. The school response rate for the HSTS 1990 was 87.1 percent, with a student response rate of 99.6 percent.
The 1990, 1994, 1998, and 2000 High School Transcript Studies have similar features with
respect to sampling, including complex sample design, sample sizes, and weighting techniques. For detailed information, see The 2000 High School Transcript Study User’s Guide and Technical Report (U.S. Department of Education 2004b).
1-4
Target Population
The target populations for all analyses in this report were high school graduates for each HSTS year (1990, 1994, 1998, and 2000). To assure that the analyses included just high school graduates, only student transcripts that indicated that a regular/standard or honors diploma was obtained were included. In addition, only students with 16 or more earned course credits (Carnegie units9) and a positive number of English course credits were included. Transcripts that did not include detailed course data for at least three full years of high school and those indicating that a special education diploma or a certificate of attendance was obtained were excluded from the reported findings. For HSTS 2000, these inclusion criteria resulted in 20,272 student transcripts, which represented a weighted total of 2,961,741 high school graduates.
Reporting Results
The results from the HSTS 2000 are presented with respect to coursetaking patterns, grade point average, and the relationship between course taking and grade point average to student achievement in the NAEP 2000. In addition, results are compared across the transcript studies between 1990 and 2000 (HSTS 1990, HSTS 1994, HSTS 1998, and HSTS 2000). Findings are viewed throughout the report by selected student and school characteristics, including gender, race/ethnicity,10 school type (public vs. nonpublic), and region.
The irregular frequency of the HSTS transcript studies prevents the comparisons of HSTS
data with the NAEP national main mathematics and science assessments from previous years. The NAEP national main assessments associated with HSTS 1994 and HSTS 1998 covered neither mathematics nor science. A NAEP national main mathematics assessment occurred in 1990, but the design of HSTS 1990 linked HSTS with NAEP data at the school level, not at the student level. NCES also provides NAEP long-term trend assessments in mathematics and science as measures of educational progress over time. The HSTS works in association with the NAEP main assessments, however, and results from the main assessments and trend assessments are not comparable. More information about the NAEP long-term trend assessments can be found in NAEP 1999 Trends in Academic Progress: Three Decades of Student
9One Carnegie unit equals a class period (45 to 60 minutes) that occurs once per day across the entire school year. Standardization to Carnegie units allows for a valid comparison of course credits across schools within a transcript study, and for a reliable comparison between transcript studies over time.
10The HSTS defines a student’s race/ethnicity as “White,” “Black,” “Hispanic,” “Asian/Pacific Islander,” “Native American,” “Other race,” or “Not reported.” “The terms “White” and “Black” are abbreviated labels for “White, non-Hispanic” and “Black, non-Hispanic,” respectively.
1-5
Performance (U.S. Department of Education 2000). For this report, the term “assessment scores” refers to scores from the NAEP national main assessments.
The NAEP assessment results presented in this report reflect the findings from those HSTS
2000 students that met the criteria for analyses. These criteria included a standard or honors diploma, at least 16 earned course credits, and a positive number of earned English course credits. These results do not reflect the NAEP sample as a whole.
Caution in Interpreting Results
The results pertaining to course credits earned and grade point average presented in this report are estimates because they are based on samples of students rather than on entire populations. Likewise, the NAEP average scores are also estimates of student performance. In addition, the results are subject to a measure of uncertainty due to sampling and measurement error. These measures of uncertainty are reflected in the standard error of the estimates. The standard errors for the estimates in this report are provided in appendix C.
The differences between the estimates discussed in the following chapters take into account
the standard errors associated with the estimates. Comparisons are based on statistical tests that consider both the magnitude of the difference between the estimates and the standard errors of those statistics. Throughout this report, differences between estimates are pointed out only when they are significant from a statistical perspective. All differences reported are significant at the 0.05 alpha level. The term significant is not intended to imply a judgment about the absolute magnitude or the educational relevance of the differences, but rather to identify statistically dependable population differences to help inform dialogue among policymakers, educators, and the public.
Readers are cautioned against interpreting transcript study results in a causal manner.
Inferences related to student subgroup performance or to the effectiveness of public and nonpublic schools, for example, should take into consideration the many socioeconomic and educational factors that may also affect coursetaking patterns and academic performance. An increase or decrease in overall GPA may result from a number of factors. The change could reflect either the growth or decline of high school graduates’ academic achievement. It could also reflect changes in teachers’ standards for grading, changes in material taught for courses, or other factors that cannot be measured by the HSTS.
1-6
Structure of the Report
The results from the HSTS 2000, as well as the HSTS 1990, HSTS 1994, and HSTS 1998, are presented in the following chapters. Chapter 2 of this report details the coursetaking patterns of high school graduates. Chapter 3 presents findings related to grade point average, and chapter 4 details the relationship between course taking, grade point average, and achievement, as measured by average NAEP scale scores. Chapters 2 and 3 detail trends from 1990 to 2000, while chapter 4 concentrates solely on the 2000 transcript data. Chapter 5 provides a summary and conclusions, and chapter 6 lists the references for the report.
This report also contains appendixes that support or augment the results presented. Appendix
A describes the study methodology. Appendix B presents many of the findings from figures within the body of the report in tabular form, and appendix C includes standard error tables for the data presented in the report. Appendix D contains a glossary of terms.
2-1
2. COURSE CREDITS EARNED
Course credits provide a relevant measure of high school coursetaking patterns. Examining the number of course credits high school graduates earned, and in what course subjects graduates earned them, sheds light on the content of their high school education. Are high school students taking more or fewer courses? Are high school students earning more or fewer credits in the core course subjects, such as mathematics and science? What vocational course subjects, if any, are high school students taking for their electives? An analysis of earned course credits taken from high school transcripts can answer these questions.
This chapter discusses trends in earned course credits from 1990 to 2000. Data for this
chapter comes from analyses of the 1990, 1994, 1998, and 2000 High School Transcript Studies (HSTS). Each section in the chapter highlights HSTS 2000 results and compares these results with results from the previous transcript studies. Unless otherwise noted, only statistically significant findings are discussed. Figures and tables present the mean number of course credits earned, either by all high school graduates or by subgroups of selected student and school characteristics. The student characteristics include gender and race/ethnicity, and the school-based characteristics include school type (public or nonpublic school) and region of the country.11
Schools participating in the HSTS varied widely in their assignments of credits to their
courses. The transcript study standardized the credits across schools such that one credit equals one Carnegie unit. One Carnegie unit equals a class period (45 to 60 minutes) that occurs once per day across the entire school year. Standardization to Carnegie units not only allows for a meaningful comparison of course credits across schools within a transcript study, but also allows for a meaningful comparison between transcript studies over time. In this report, “course credits” refer to the standardized Carnegie units, not the credits as reported on the transcripts.
Total Course Credits Earned
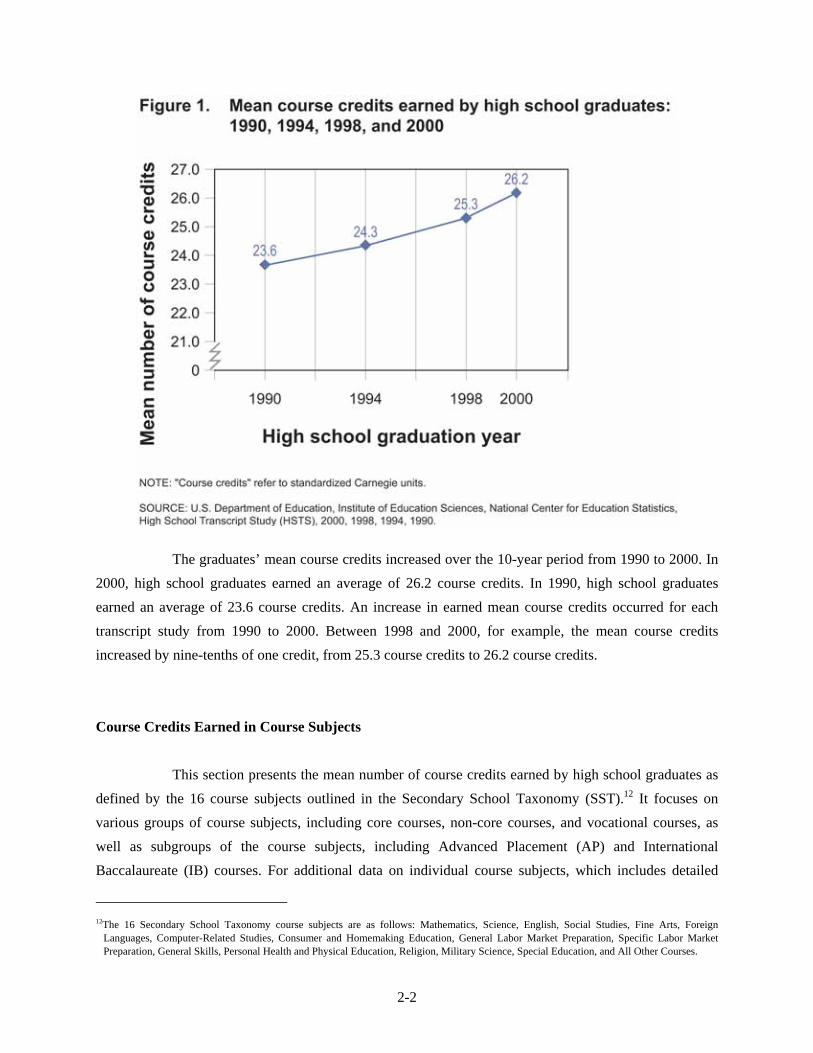
Figure 1 shows the mean number of course credits earned by high school graduates for the years 1990, 1994, 1998, and 2000.
11In this report, public schools include all state-run elementary, secondary, charter, Bureau of Indian Affairs, and Department of Defense schools.
Nonpublic schools include Catholic schools, other religious schools, and all other private schools. The term “region of the country” refers to the Census-defined geographic regions: Northeast, South, Midwest, and West. See appendix A for more information.
2-2
The graduates’ mean course credits increased over the 10-year period from 1990 to 2000. In 2000, high school graduates earned an average of 26.2 course credits. In 1990, high school graduates earned an average of 23.6 course credits. An increase in earned mean course credits occurred for each transcript study from 1990 to 2000. Between 1998 and 2000, for example, the mean course credits increased by nine-tenths of one credit, from 25.3 course credits to 26.2 course credits.
Course Credits Earned in Course Subjects
This section presents the mean number of course credits earned by high school graduates as defined by the 16 course subjects outlined in the Secondary School Taxonomy (SST).12 It focuses on various groups of course subjects, including core courses, non-core courses, and vocational courses, as well as subgroups of the course subjects, including Advanced Placement (AP) and International Baccalaureate (IB) courses. For additional data on individual course subjects, which includes detailed
12The 16 Secondary School Taxonomy course subjects are as follows: Mathematics, Science, English, Social Studies, Fine Arts, Foreign
Languages, Computer-Related Studies, Consumer and Homemaking Education, General Labor Market Preparation, Specific Labor Market Preparation, General Skills, Personal Health and Physical Education, Religion, Military Science, Special Education, and All Other Courses.
2-3
cross-tabulations by student gender, student race/ethnicity, school type, and region of the country, see The 2000 High School Transcript Study Tabulations (U.S. Department of Education 2004a).
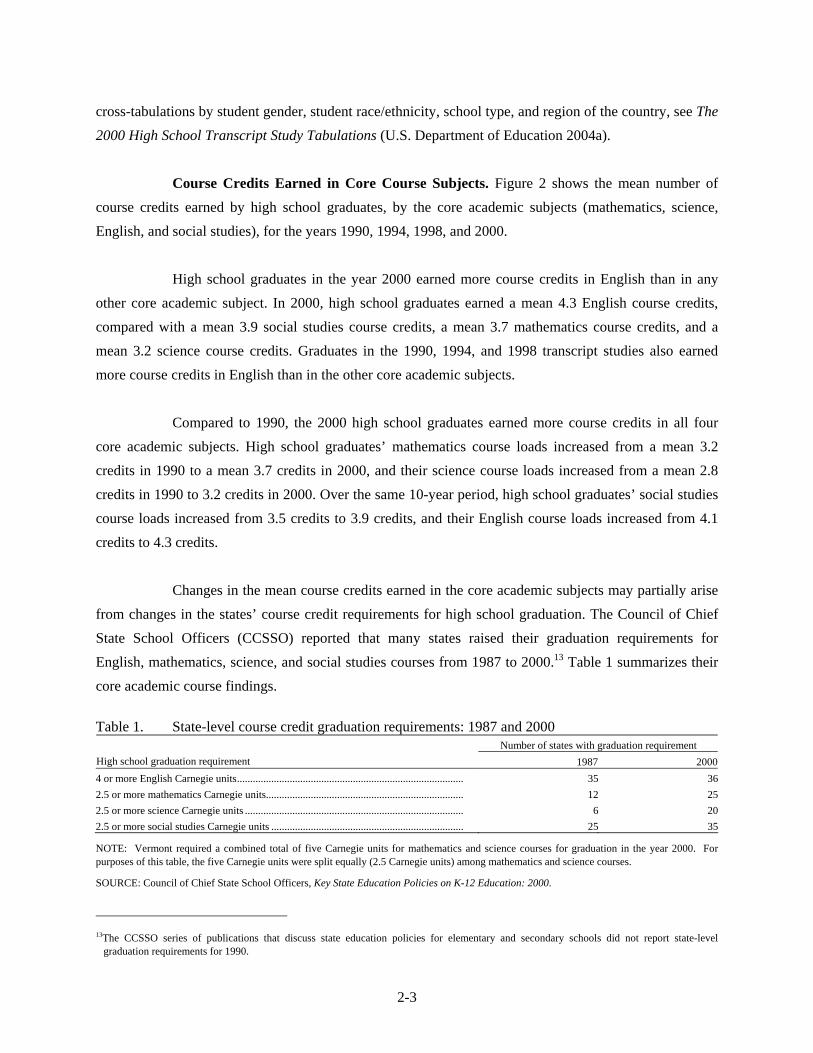
Course Credits Earned in Core Course Subjects. Figure 2 shows the mean number of course credits earned by high school graduates, by the core academic subjects (mathematics, science, English, and social studies), for the years 1990, 1994, 1998, and 2000.
High school graduates in the year 2000 earned more course credits in English than in any
other core academic subject. In 2000, high school graduates earned a mean 4.3 English course credits, compared with a mean 3.9 social studies course credits, a mean 3.7 mathematics course credits, and a mean 3.2 science course credits. Graduates in the 1990, 1994, and 1998 transcript studies also earned more course credits in English than in the other core academic subjects.
Compared to 1990, the 2000 high school graduates earned more course credits in all four
core academic subjects. High school graduates’ mathematics course loads increased from a mean 3.2 credits in 1990 to a mean 3.7 credits in 2000, and their science course loads increased from a mean 2.8 credits in 1990 to 3.2 credits in 2000. Over the same 10-year period, high school graduates’ social studies course loads increased from 3.5 credits to 3.9 credits, and their English course loads increased from 4.1 credits to 4.3 credits.
Changes in the mean course credits earned in the core academic subjects may partially arise
from changes in the states’ course credit requirements for high school graduation. The Council of Chief State School Officers (CCSSO) reported that many states raised their graduation requirements for English, mathematics, science, and social studies courses from 1987 to 2000.13 Table 1 summarizes their core academic course findings.
Table 1. State-level course credit graduation requirements: 1987 and 2000
Number of states with graduation requirement High school graduation requirement 1987 20004 or more English Carnegie units...................................................................................... 35 362.5 or more mathematics Carnegie units........................................................................... 12 252.5 or more science Carnegie units ................................................................................... 6 202.5 or more social studies Carnegie units ......................................................................... 25 35
NOTE: Vermont required a combined total of five Carnegie units for mathematics and science courses for graduation in the year 2000. For purposes of this table, the five Carnegie units were split equally (2.5 Carnegie units) among mathematics and science courses.
SOURCE: Council of Chief State School Officers, Key State Education Policies on K-12 Education: 2000.
13The CCSSO series of publications that discuss state education policies for elementary and secondary schools did not report state-level
graduation requirements for 1990.
2-4
The double-digit increases in the number of states requiring 2.5 or more mathematics, science, and social studies credits shown in table 1 help explain the rise in the mean course credits for
2-5
those subjects. As for English credits, the number of states requiring four Carnegie units of English for graduation rose by one (35 states in 1987, 36 states in 2000).
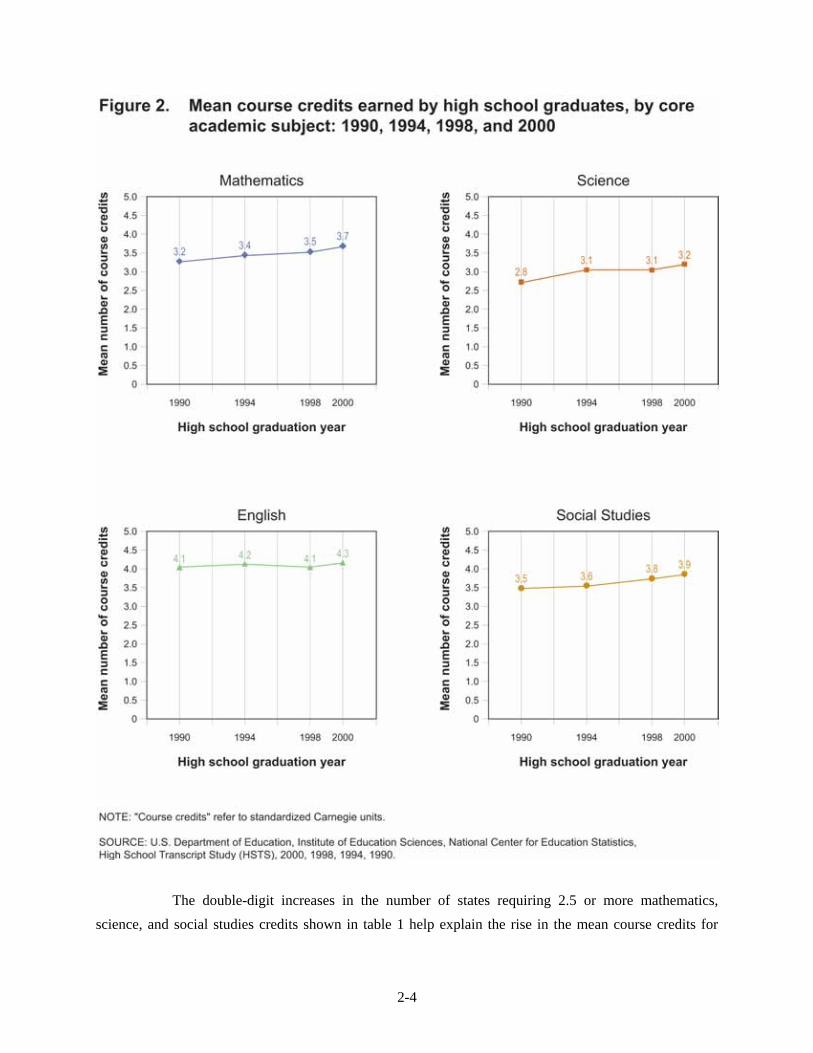
Figure 3 compares the mean number of core and non-core course credits earned by high
school graduates for the years 1990, 1994, 1998, and 2000. Core credits represent academic course credits earned in mathematics, science, English, and social studies courses.14 Non-core credits represent course credits earned in all course subjects other than the four core academic subjects.15
14The HSTS defines “core courses” as those course subjects that high school graduates need to take to earn a standard diploma. The state
graduation requirements reported by the Council of Chief Secondary School Officers (CCSSO) were used to set its definition. These “core courses” traditionally consist of English, social studies, mathematics, and science courses. In 2000, 48 states required one or more credits in these four course subject areas for a high school student to graduate. Fewer states required fine arts credits to graduate with a standard diploma, and far fewer states required foreign languages credits (although most states did require some foreign language credits for their Honors diplomas). For this reason, neither fine arts nor foreign languages courses were grouped in the core courses category.
15Non-core credits include the following Secondary School Taxonomy course subjects: Fine Arts, Foreign Languages, Computer-Related Studies, Consumer and Homemaking Education, General Labor Market Preparation, Specific Labor Market Preparation, General Skills, Personal Health and Physical Education, Religion, Military Science, Special Education, and All Other Courses.
2-6
Gains occurred in the mean number of earned course credits for both core and non-core subjects from 1990 to 2000. The 2000 high school graduates earned a mean 15.0 course credits in the four core academic subjects, compared with the mean 13.7 course credits earned by the 1990 high school graduates. The 2000 high school graduates earned a mean 11.1 course credits in all other course subjects, compared with the mean 10.0 course credits earned by the 1990 high school graduates.
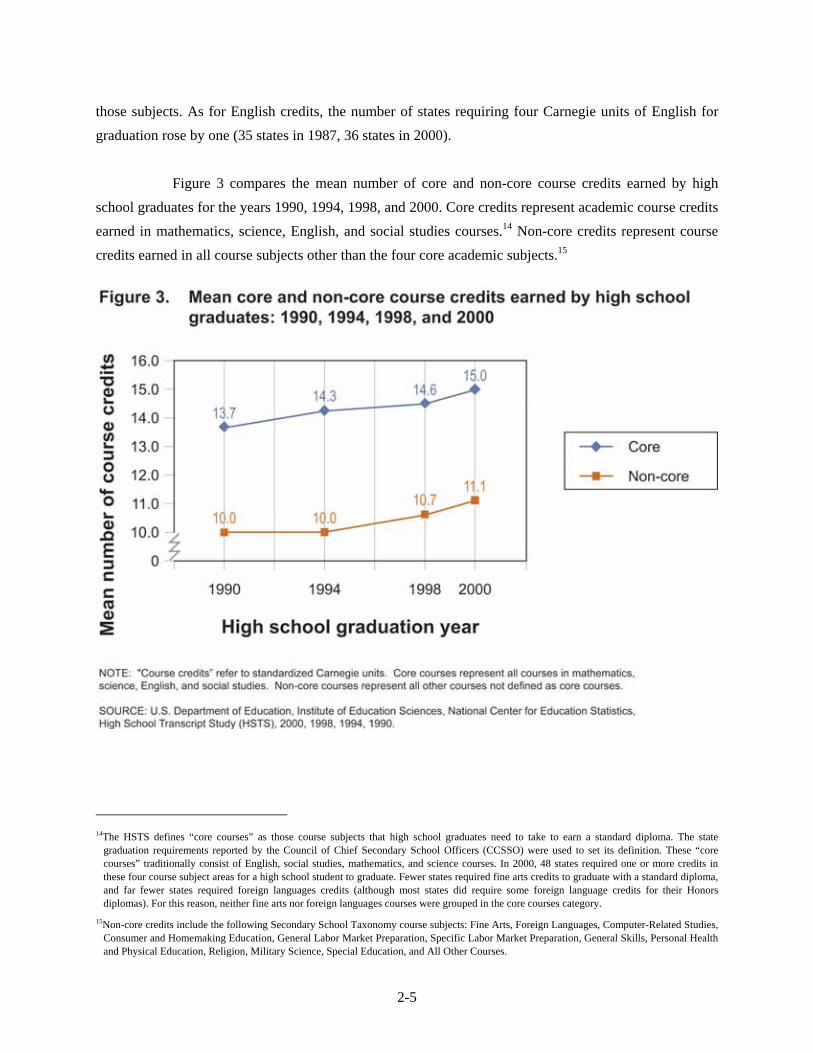
Course Credits Earned in Vocational Courses. Figure 4 shows the mean number of
vocational course credits earned by all high school graduates for the years 1990, 1994, 1998, and 2000. Vocational courses encompass courses that provide students with the academic and technical knowledge and skills needed for further education and/or careers requiring less than a bachelor’s degree. At the high school level, vocational courses include courses in consumer and homemaking education, general labor market preparation, and specific labor market preparation. The figure also shows the number of computer-related (CR) and noncomputer-related (NCR) vocational course credits earned by high school graduates for the same years. Computer-related vocational courses are vocational courses associated with clerical and data entry, computer applications, and computer science. Noncomputer-related vocational courses include all other vocational courses.
2-7
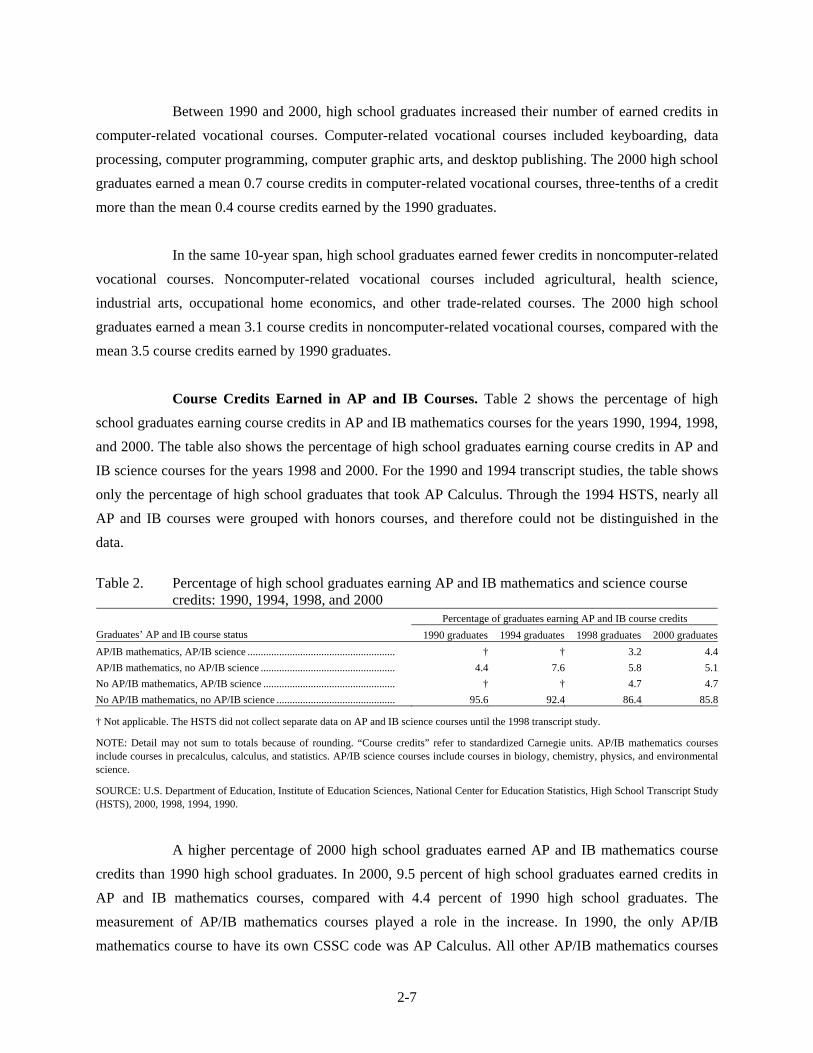
Between 1990 and 2000, high school graduates increased their number of earned credits in computer-related vocational courses. Computer-related vocational courses included keyboarding, data processing, computer programming, computer graphic arts, and desktop publishing. The 2000 high school graduates earned a mean 0.7 course credits in computer-related vocational courses, three-tenths of a credit more than the mean 0.4 course credits earned by the 1990 graduates.
In the same 10-year span, high school graduates earned fewer credits in noncomputer-related
vocational courses. Noncomputer-related vocational courses included agricultural, health science, industrial arts, occupational home economics, and other trade-related courses. The 2000 high school graduates earned a mean 3.1 course credits in noncomputer-related vocational courses, compared with the mean 3.5 course credits earned by 1990 graduates.
Course Credits Earned in AP and IB Courses. Table 2 shows the percentage of high
school graduates earning course credits in AP and IB mathematics courses for the years 1990, 1994, 1998, and 2000. The table also shows the percentage of high school graduates earning course credits in AP and IB science courses for the years 1998 and 2000. For the 1990 and 1994 transcript studies, the table shows only the percentage of high school graduates that took AP Calculus. Through the 1994 HSTS, nearly all AP and IB courses were grouped with honors courses, and therefore could not be distinguished in the data.
Table 2. Percentage of high school graduates earning AP and IB mathematics and science course
credits: 1990, 1994, 1998, and 2000 Percentage of graduates earning AP and IB course credits
Graduates’ AP and IB course status 1990 graduates 1994 graduates 1998 graduates 2000 graduatesAP/IB mathematics, AP/IB science ........................................................ † † 3.2 4.4AP/IB mathematics, no AP/IB science ................................................... 4.4 7.6 5.8 5.1No AP/IB mathematics, AP/IB science .................................................. † † 4.7 4.7No AP/IB mathematics, no AP/IB science ............................................. 95.6 92.4 86.4 85.8
† Not applicable. The HSTS did not collect separate data on AP and IB science courses until the 1998 transcript study.
NOTE: Detail may not sum to totals because of rounding. “Course credits” refer to standardized Carnegie units. AP/IB mathematics courses include courses in precalculus, calculus, and statistics. AP/IB science courses include courses in biology, chemistry, physics, and environmental science.
SOURCE: U.S. Department of Education, Institute of Education Sciences, National Center for Education Statistics, High School Transcript Study (HSTS), 2000, 1998, 1994, 1990.
A higher percentage of 2000 high school graduates earned AP and IB mathematics course
credits than 1990 high school graduates. In 2000, 9.5 percent of high school graduates earned credits in AP and IB mathematics courses, compared with 4.4 percent of 1990 high school graduates. The measurement of AP/IB mathematics courses played a role in the increase. In 1990, the only AP/IB mathematics course to have its own CSSC code was AP Calculus. All other AP/IB mathematics courses
2-8
were either included with regular or honors mathematics courses. In 2000, AP and IB mathematics courses with their own CSSC codes included courses in precalculus, calculus, and statistics.
Approximately 9.1 percent of the 2000 high school graduates earned credits in AP and IB
science courses. AP and IB science courses include courses in biology, chemistry, physics, and environmental science. In 1998, 7.8 percent of high school graduates earned credits in AP and IB science courses.
Total Course Credits Earned, by Student and School Characteristics
This section presents the mean number of course credits earned by high school graduates as defined by selected student and school characteristics. These characteristics include student gender, student race/ethnicity, school type (public or nonpublic school), and region of the country.
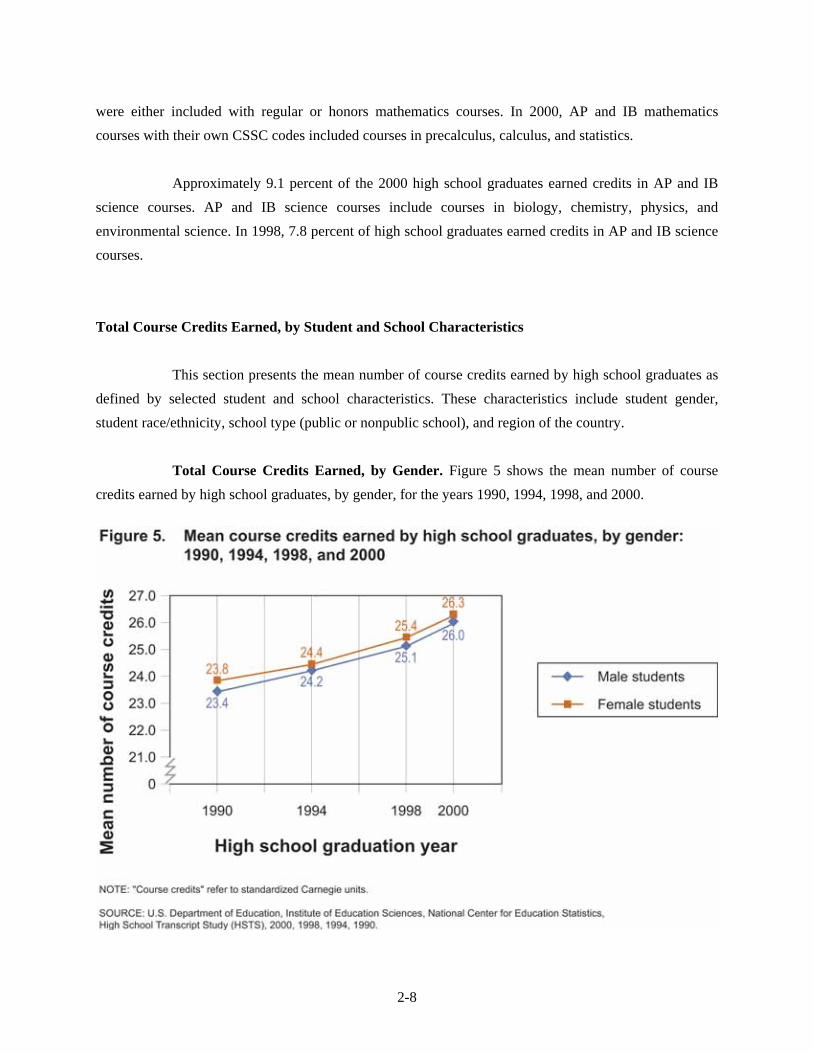
Total Course Credits Earned, by Gender. Figure 5 shows the mean number of course
credits earned by high school graduates, by gender, for the years 1990, 1994, 1998, and 2000.
2-9
Both males and females increased their numbers of earned course credits from 1990 to 2000. Male graduates earned a mean of 26.0 course credits in 2000, an 11 percent increase over the 23.4 mean course credits they earned in 1990. Female graduates earned a mean of 26.3 course credits in 2000, a 10 percent gain over the 23.8 mean course credits they earned in 1990.
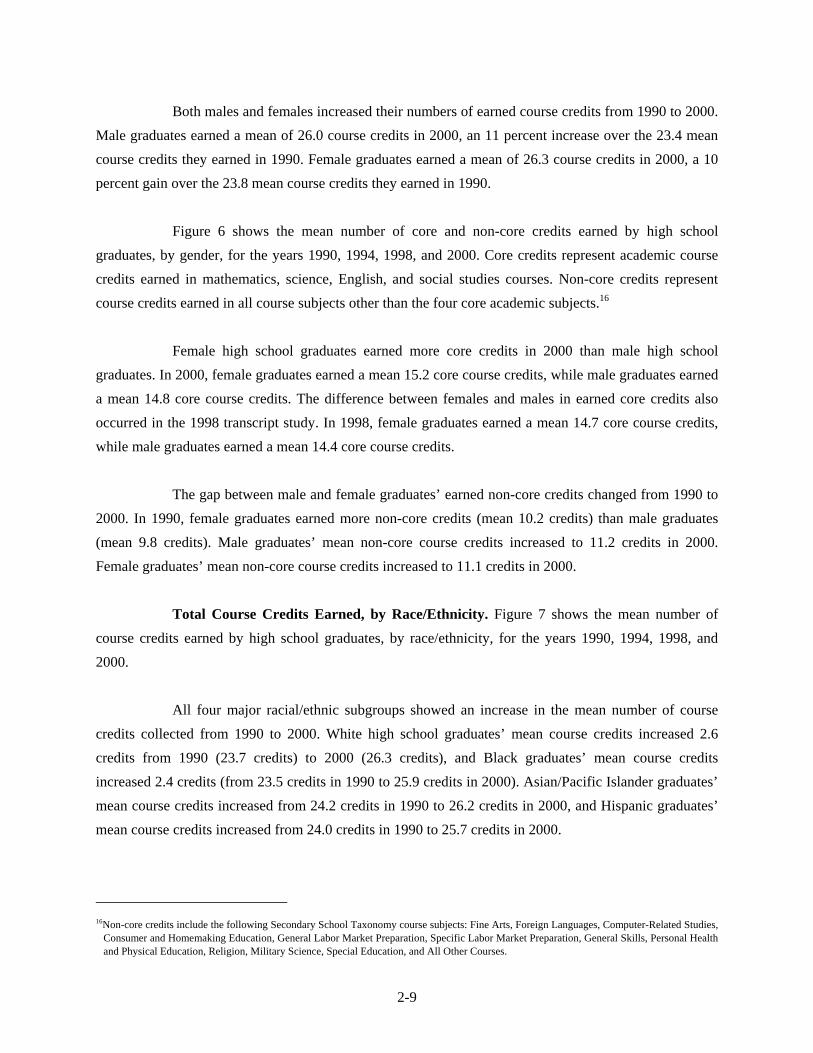
Figure 6 shows the mean number of core and non-core credits earned by high school
graduates, by gender, for the years 1990, 1994, 1998, and 2000. Core credits represent academic course credits earned in mathematics, science, English, and social studies courses. Non-core credits represent course credits earned in all course subjects other than the four core academic subjects.16
Female high school graduates earned more core credits in 2000 than male high school
graduates. In 2000, female graduates earned a mean 15.2 core course credits, while male graduates earned a mean 14.8 core course credits. The difference between females and males in earned core credits also occurred in the 1998 transcript study. In 1998, female graduates earned a mean 14.7 core course credits, while male graduates earned a mean 14.4 core course credits.
The gap between male and female graduates’ earned non-core credits changed from 1990 to
2000. In 1990, female graduates earned more non-core credits (mean 10.2 credits) than male graduates (mean 9.8 credits). Male graduates’ mean non-core course credits increased to 11.2 credits in 2000. Female graduates’ mean non-core course credits increased to 11.1 credits in 2000.
Total Course Credits Earned, by Race/Ethnicity. Figure 7 shows the mean number of
course credits earned by high school graduates, by race/ethnicity, for the years 1990, 1994, 1998, and 2000.
All four major racial/ethnic subgroups showed an increase in the mean number of course
credits collected from 1990 to 2000. White high school graduates’ mean course credits increased 2.6 credits from 1990 (23.7 credits) to 2000 (26.3 credits), and Black graduates’ mean course credits increased 2.4 credits (from 23.5 credits in 1990 to 25.9 credits in 2000). Asian/Pacific Islander graduates’ mean course credits increased from 24.2 credits in 1990 to 26.2 credits in 2000, and Hispanic graduates’ mean course credits increased from 24.0 credits in 1990 to 25.7 credits in 2000.
16Non-core credits include the following Secondary School Taxonomy course subjects: Fine Arts, Foreign Languages, Computer-Related Studies,
Consumer and Homemaking Education, General Labor Market Preparation, Specific Labor Market Preparation, General Skills, Personal Health and Physical Education, Religion, Military Science, Special Education, and All Other Courses.
2-10
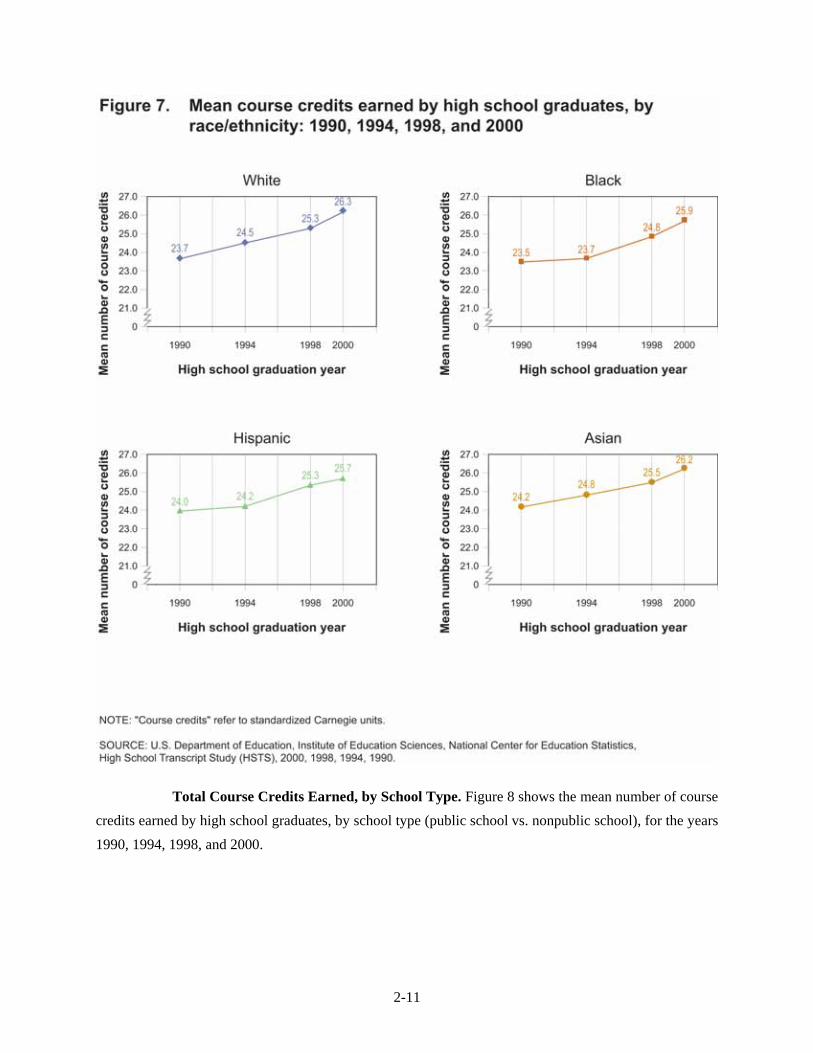
2-11
Total Course Credits Earned, by School Type. Figure 8 shows the mean number of course credits earned by high school graduates, by school type (public school vs. nonpublic school), for the years 1990, 1994, 1998, and 2000.
2-12
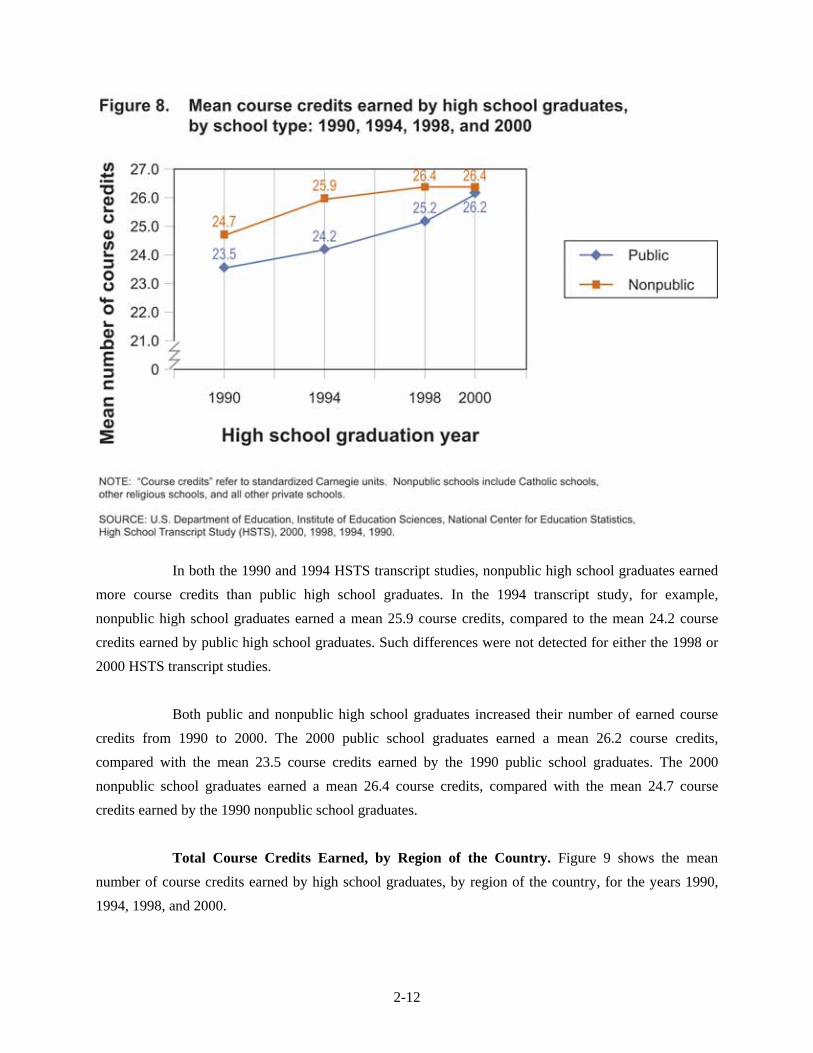
In both the 1990 and 1994 HSTS transcript studies, nonpublic high school graduates earned more course credits than public high school graduates. In the 1994 transcript study, for example, nonpublic high school graduates earned a mean 25.9 course credits, compared to the mean 24.2 course credits earned by public high school graduates. Such differences were not detected for either the 1998 or 2000 HSTS transcript studies.
Both public and nonpublic high school graduates increased their number of earned course
credits from 1990 to 2000. The 2000 public school graduates earned a mean 26.2 course credits, compared with the mean 23.5 course credits earned by the 1990 public school graduates. The 2000 nonpublic school graduates earned a mean 26.4 course credits, compared with the mean 24.7 course credits earned by the 1990 nonpublic school graduates.
Total Course Credits Earned, by Region of the Country. Figure 9 shows the mean
number of course credits earned by high school graduates, by region of the country, for the years 1990, 1994, 1998, and 2000.
2-13
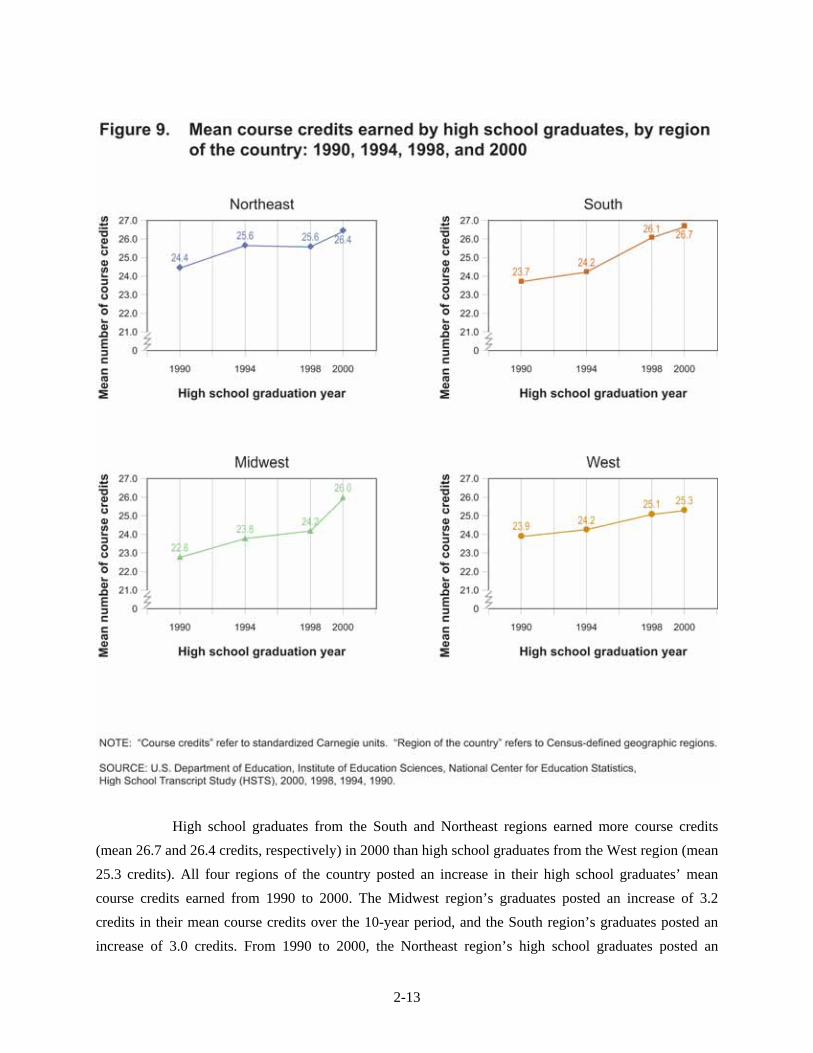
High school graduates from the South and Northeast regions earned more course credits (mean 26.7 and 26.4 credits, respectively) in 2000 than high school graduates from the West region (mean 25.3 credits). All four regions of the country posted an increase in their high school graduates’ mean course credits earned from 1990 to 2000. The Midwest region’s graduates posted an increase of 3.2 credits in their mean course credits over the 10-year period, and the South region’s graduates posted an increase of 3.0 credits. From 1990 to 2000, the Northeast region’s high school graduates posted an
2-14
increase of 2.0 credits in their mean course credits, and the West region’s graduates posted an increase of 1.4 credits.
Summary
The decade between 1990 and 2000 saw increases in the numbers of course credits earned by high school graduates. Each examined student and school subgroup—student gender, student race/ethnicity, school type, and region of the country—increased the number of course credits they earned. The number of core and non-core course credits also increased through the decade. Within the core academic courses, there was an increase in the percentage of students earning AP and IB mathematics courses from 1990 to 2000. There was an increase in the number of computer-related vocational course credits in that 10-year span, but there was also a decrease in the number of noncomputer-related vocational credits.

3-1
3. GRADE POINT AVERAGE
An investigation of the trends in academic achievement provides valuable information to measure the nation’s high school students’ academic performance. One common measure of academic achievement is the grade point average (GPA). Although the scale used to determine GPA varies from school to school, the most common scale is the four-point grade scale. In this scale, the letter grade “A” equals four points, the letter grade “B” equals three points, the letter grade “C” equals two points, the letter grade “D” equals one point, and the letter grade “F” equals zero points. It is the four-point grade scale in which the High School Transcript Study (HSTS) standardizes each student’s GPA.
This chapter discusses trends in grade point average from 1990 to 2000. Each section in the
chapter highlights HSTS 2000 results and compares these results with results from the previous transcript studies. Figures and tables present the mean grade point average, either of all high school graduates or of subgroups of selected student and school characteristics. The student characteristics include gender, race/ethnicity, and grade level, and the school-based characteristics include school type (public or nonpublic school) and region of the country.17
The GPA represents the average number of grade points a student earns for each graded high
school course. Grade points are points per course credit assigned to a passing grade, indicating the numerical value of the grade. Dividing a student’s total grade points earned by the total course credits attempted determines a student’s GPA. Courses in which a student does not receive a grade, such as pass/fail and audited courses, do not factor into the GPA calculation. Since not all schools have the same standards for course credits and grade scales, the HSTS converts course credits to standardized Carnegie units18 and assigns grade points based on the four-point grade scale. There were no additional grade points assigned for Advanced Placement, International Baccalaureate, and other honors classes.
Mean Grade Point Average
Figure 10 shows the overall mean GPA of high school graduates for the years 1990, 1994, 1998, and 2000.
17In this report, public schools include all state-run elementary, secondary, charter, Bureau of Indian Affairs, and Department of Defense schools.
Nonpublic schools include Catholic schools, other religious schools, and all other private schools. The term “region” refers to the Census-defined regions: Northeast, South, Midwest, and West. See appendix A for more information.
18One Carnegie unit equals a class period (45 to 60 minutes) that occurs once per day across the entire school year.

3-2
High school graduates earned a higher overall mean GPA in 2000 than in 1990. In 2000,
high school graduates earned a 2.94 overall mean GPA; in 1990, high school graduates earned a 2.68 overall mean GPA. Increases of 0.11 points occurred in the overall mean GPA between 1990 and 1994 and between 1994 and 1998.
Mean Grade Point Average, by Course Subject
Table 3 shows the mean GPA of high school graduates in the 16 course subjects19 covered by the 1990, 1994, 1998, and 2000 transcript studies.
19The High School Transcript Study uses the 16 course subjects established by the Secondary School Taxonomy. These course subjects are as
follows: Mathematics, Science, English, Social Studies, Fine Arts, Foreign Languages, Computer-Related Studies, Consumer and Homemaking Education, General Labor Market Preparation, Specific Labor Market Preparation, General Skills, Personal Health and Physical Education, Religion, Military Science, Special Education, and All Other Courses.
3-3
Table 3. Mean grade point average of high school graduates, by course subject: 1990, 1994, 1998, and 2000
Mean grade point average Subject field 1990 graduates 1994 graduates 1998 graduates 2000 graduatesMathematics ............................................................................................ 2.34 2.44 2.56 2.60Science..................................................................................................... 2.39 2.50 2.62 2.67English..................................................................................................... 2.52 2.63 2.74 2.77Social Studies .......................................................................................... 2.56 2.67 2.79 2.83Fine Arts .................................................................................................. 3.13 3.28 3.35 3.38Foreign Languages .................................................................................. 2.58 2.67 2.78 2.82Computer-Related Studies ...................................................................... 2.81 2.95 3.08 3.17Consumer & Homemaking Education .................................................... 2.77 2.97 3.07 3.10General Labor Market Preparation ......................................................... 2.73 2.84 3.01 3.13Specific Labor Market Preparation ......................................................... 2.86 3.02 3.15 3.20General Skills .......................................................................................... 3.38 3.38 3.47 3.44Personal Health & Physical Education ................................................... 3.11 3.21 3.27 3.34Religion ................................................................................................... 2.89 2.94 3.14 3.33Military Science ...................................................................................... 2.79 2.97 2.98 3.03Special Education.................................................................................... 2.63 2.74 2.92 2.97All Other Courses.................................................................................... 2.97 3.02 3.10 3.22
SOURCE: U.S. Department of Education, Institute of Education Sciences, National Center for Education Statistics, High School Transcript Study (HSTS), 2000, 1998, 1994, 1990.
Of the 16 course subjects covered by the 2000 High School Transcript Study, mathematics
and science courses proved the most difficult for high school students. High school graduates in the year 2000 earned 2.60 and 2.67 mean GPAs, respectively, for mathematics and science courses. Both the mathematics and science mean GPAs were lower than the mean GPAs the HSTS 2000 graduates earned for each of the other 14 course subjects.
The 2000 high school graduates’ lower mathematics and science mean GPAs continued
patterns seen since the 1990 transcript study. Mathematics and science courses had the lowest mean GPAs among the 16 course subjects of high school graduates in 1990 (2.34 for mathematics, 2.39 for science), 1994 (2.44 for mathematics, 2.50 for science), and 1998 (2.56 for mathematics, 2.62 for science).
Of the 16 course subjects, 13 course subjects showed an increase in graduates’ mean GPA
from 1990 to 2000. Between 1990 and 2000, high school graduates increased their mean science GPA by 0.28 points and their mean social studies GPA by 0.27 points. High school graduates increased their mean mathematics GPA by 0.26 points and their mean English GPA by 0.25 points.
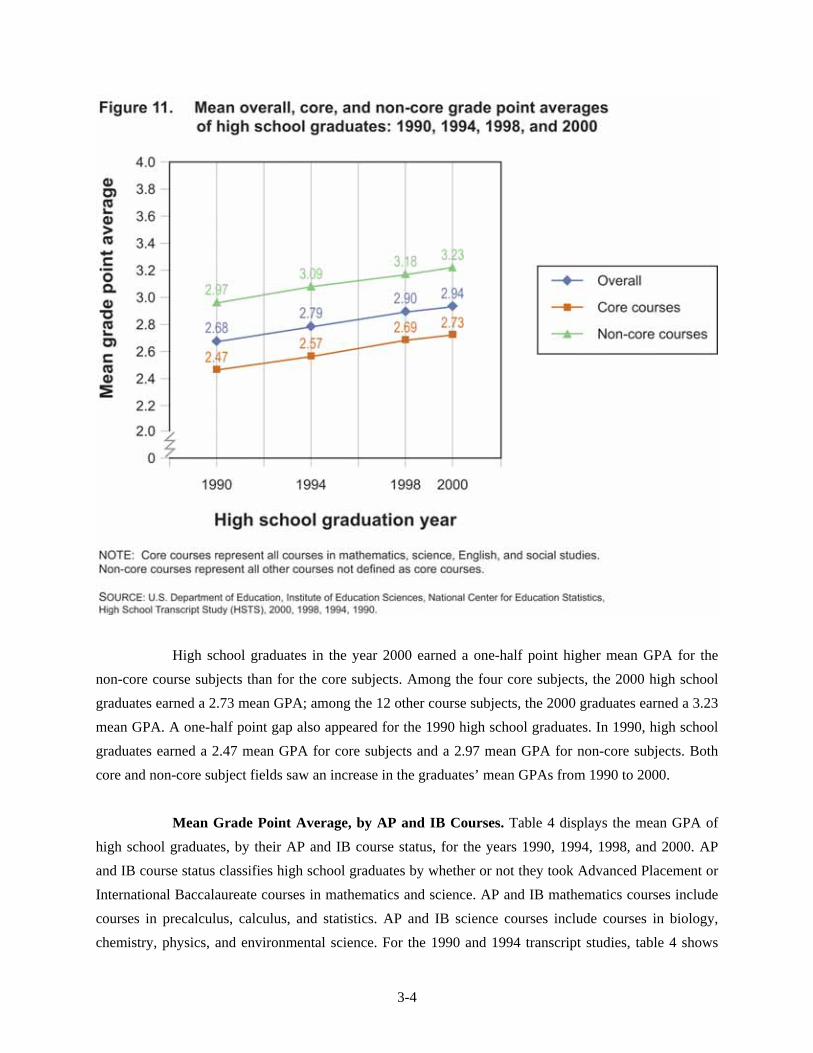
Mean Grade Point Average in Core and Non-Core Courses. Figure 11 shows the overall
mean GPA earned by high school graduates for the years 1990, 1994, 1998, and 2000, along with the combined mean GPA for the four core subjects (mathematics, science, English, and social studies) and the combined mean GPA for all non-core course subjects.
3-4
High school graduates in the year 2000 earned a one-half point higher mean GPA for the
non-core course subjects than for the core subjects. Among the four core subjects, the 2000 high school graduates earned a 2.73 mean GPA; among the 12 other course subjects, the 2000 graduates earned a 3.23 mean GPA. A one-half point gap also appeared for the 1990 high school graduates. In 1990, high school graduates earned a 2.47 mean GPA for core subjects and a 2.97 mean GPA for non-core subjects. Both core and non-core subject fields saw an increase in the graduates’ mean GPAs from 1990 to 2000.
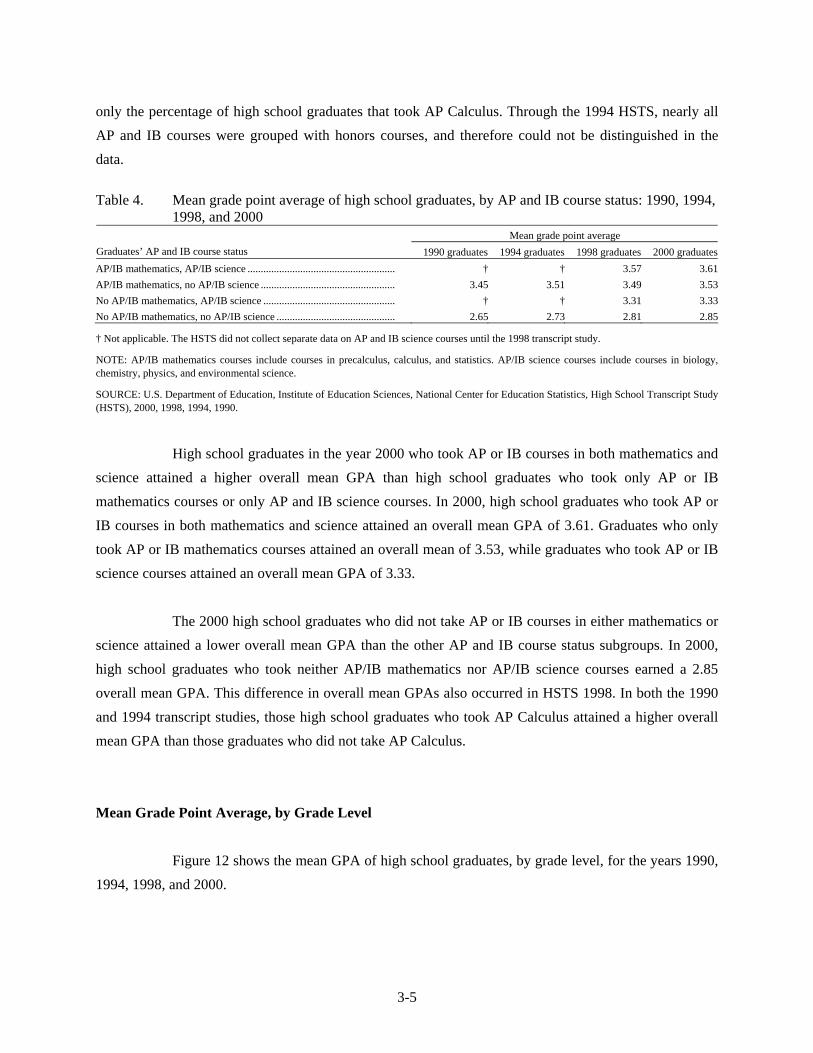
Mean Grade Point Average, by AP and IB Courses. Table 4 displays the mean GPA of
high school graduates, by their AP and IB course status, for the years 1990, 1994, 1998, and 2000. AP and IB course status classifies high school graduates by whether or not they took Advanced Placement or International Baccalaureate courses in mathematics and science. AP and IB mathematics courses include courses in precalculus, calculus, and statistics. AP and IB science courses include courses in biology, chemistry, physics, and environmental science. For the 1990 and 1994 transcript studies, table 4 shows
3-5
only the percentage of high school graduates that took AP Calculus. Through the 1994 HSTS, nearly all AP and IB courses were grouped with honors courses, and therefore could not be distinguished in the data.
Table 4. Mean grade point average of high school graduates, by AP and IB course status: 1990, 1994,
1998, and 2000 Mean grade point average
Graduates’ AP and IB course status 1990 graduates 1994 graduates 1998 graduates 2000 graduatesAP/IB mathematics, AP/IB science ........................................................ † † 3.57 3.61AP/IB mathematics, no AP/IB science ................................................... 3.45 3.51 3.49 3.53No AP/IB mathematics, AP/IB science .................................................. † † 3.31 3.33No AP/IB mathematics, no AP/IB science ............................................. 2.65 2.73 2.81 2.85
† Not applicable. The HSTS did not collect separate data on AP and IB science courses until the 1998 transcript study.
NOTE: AP/IB mathematics courses include courses in precalculus, calculus, and statistics. AP/IB science courses include courses in biology, chemistry, physics, and environmental science.
SOURCE: U.S. Department of Education, Institute of Education Sciences, National Center for Education Statistics, High School Transcript Study (HSTS), 2000, 1998, 1994, 1990.
High school graduates in the year 2000 who took AP or IB courses in both mathematics and
science attained a higher overall mean GPA than high school graduates who took only AP or IB mathematics courses or only AP and IB science courses. In 2000, high school graduates who took AP or IB courses in both mathematics and science attained an overall mean GPA of 3.61. Graduates who only took AP or IB mathematics courses attained an overall mean of 3.53, while graduates who took AP or IB science courses attained an overall mean GPA of 3.33.
The 2000 high school graduates who did not take AP or IB courses in either mathematics or
science attained a lower overall mean GPA than the other AP and IB course status subgroups. In 2000, high school graduates who took neither AP/IB mathematics nor AP/IB science courses earned a 2.85 overall mean GPA. This difference in overall mean GPAs also occurred in HSTS 1998. In both the 1990 and 1994 transcript studies, those high school graduates who took AP Calculus attained a higher overall mean GPA than those graduates who did not take AP Calculus.
Mean Grade Point Average, by Grade Level
Figure 12 shows the mean GPA of high school graduates, by grade level, for the years 1990, 1994, 1998, and 2000.
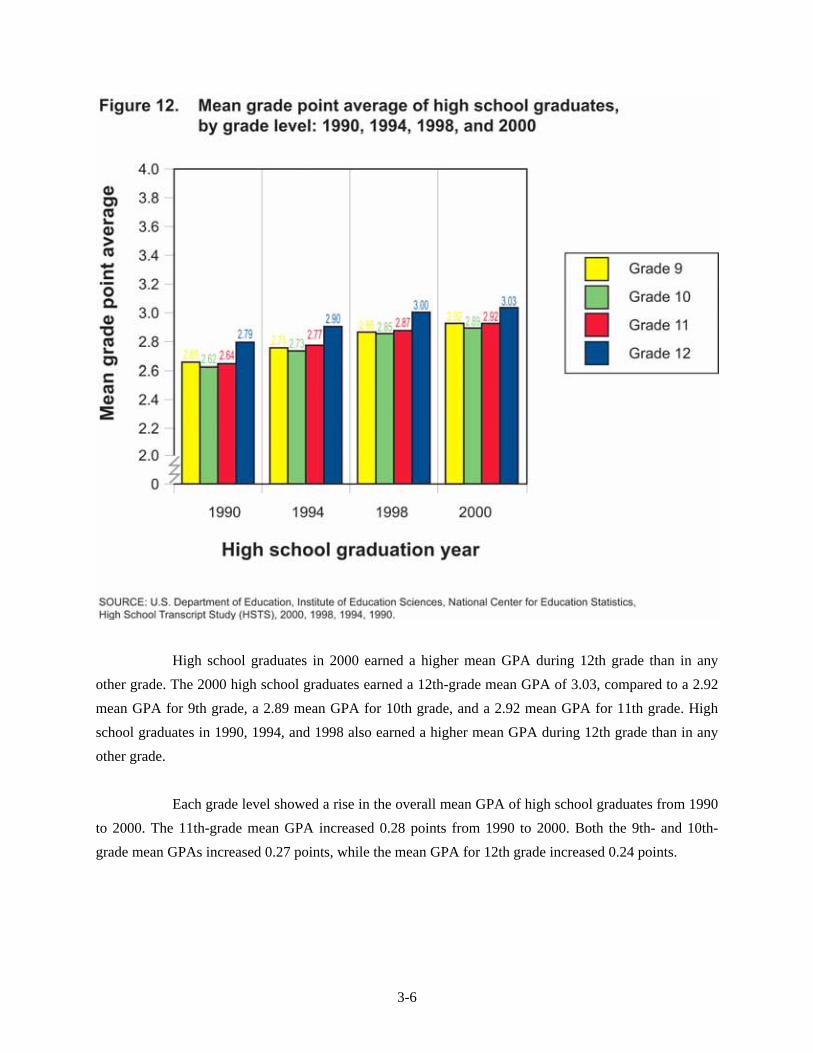
3-6
High school graduates in 2000 earned a higher mean GPA during 12th grade than in any
other grade. The 2000 high school graduates earned a 12th-grade mean GPA of 3.03, compared to a 2.92 mean GPA for 9th grade, a 2.89 mean GPA for 10th grade, and a 2.92 mean GPA for 11th grade. High school graduates in 1990, 1994, and 1998 also earned a higher mean GPA during 12th grade than in any other grade.
Each grade level showed a rise in the overall mean GPA of high school graduates from 1990
to 2000. The 11th-grade mean GPA increased 0.28 points from 1990 to 2000. Both the 9th- and 10th-grade mean GPAs increased 0.27 points, while the mean GPA for 12th grade increased 0.24 points.

3-7
Mean Grade Point Average, by Student and School Characteristics
This section presents the mean GPA earned by high school graduates as defined by selected student and school characteristics. These characteristics include student gender, student race/ethnicity, school type (public or nonpublic school), and region of the country.
Mean Grade Point Average, by Gender. Figure 13 shows the overall mean GPA of high
school graduates, by gender, for the years 1990, 1994, 1998, and 2000.
Female high school graduates attained a higher overall mean GPA in 2000 than male high
school graduates. In 2000, female graduates earned an overall mean GPA of 3.05, while male graduates earned an overall mean GPA of 2.83. The higher overall mean GPA for female graduates also occurred in the 1990, 1994, and 1998 transcript studies.
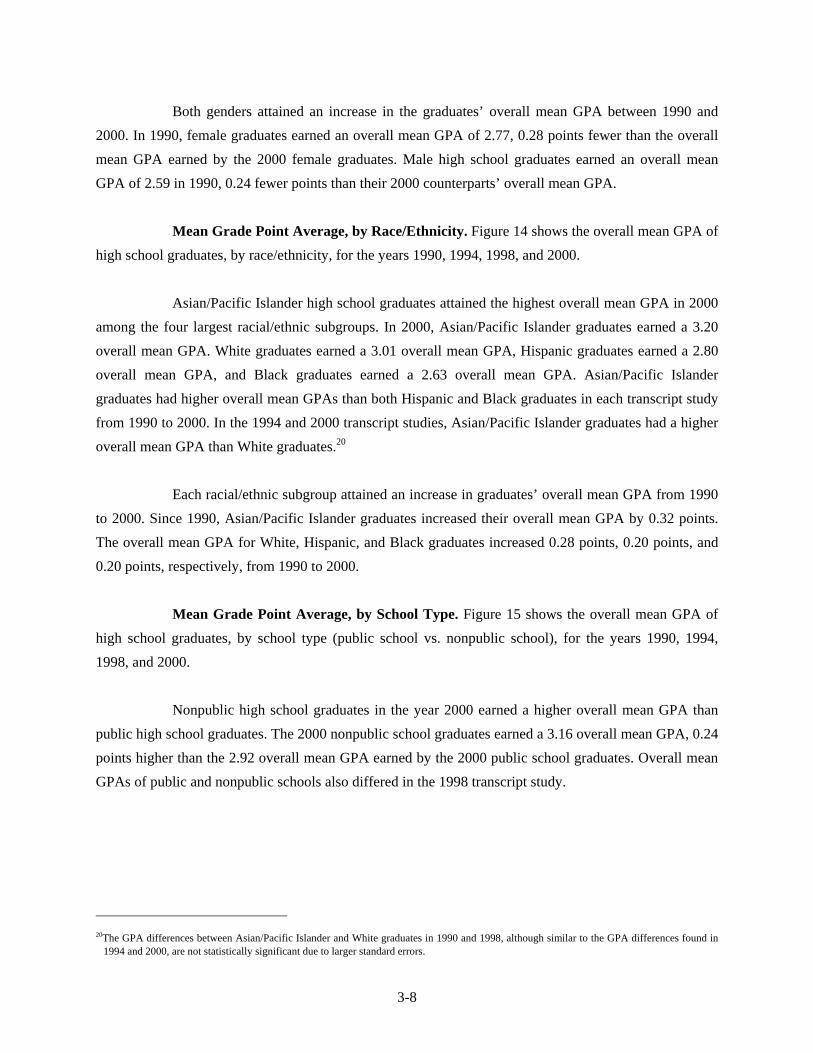
3-8
Both genders attained an increase in the graduates’ overall mean GPA between 1990 and 2000. In 1990, female graduates earned an overall mean GPA of 2.77, 0.28 points fewer than the overall mean GPA earned by the 2000 female graduates. Male high school graduates earned an overall mean GPA of 2.59 in 1990, 0.24 fewer points than their 2000 counterparts’ overall mean GPA.
Mean Grade Point Average, by Race/Ethnicity. Figure 14 shows the overall mean GPA of
high school graduates, by race/ethnicity, for the years 1990, 1994, 1998, and 2000. Asian/Pacific Islander high school graduates attained the highest overall mean GPA in 2000
among the four largest racial/ethnic subgroups. In 2000, Asian/Pacific Islander graduates earned a 3.20 overall mean GPA. White graduates earned a 3.01 overall mean GPA, Hispanic graduates earned a 2.80 overall mean GPA, and Black graduates earned a 2.63 overall mean GPA. Asian/Pacific Islander graduates had higher overall mean GPAs than both Hispanic and Black graduates in each transcript study from 1990 to 2000. In the 1994 and 2000 transcript studies, Asian/Pacific Islander graduates had a higher overall mean GPA than White graduates.20
Each racial/ethnic subgroup attained an increase in graduates’ overall mean GPA from 1990
to 2000. Since 1990, Asian/Pacific Islander graduates increased their overall mean GPA by 0.32 points. The overall mean GPA for White, Hispanic, and Black graduates increased 0.28 points, 0.20 points, and 0.20 points, respectively, from 1990 to 2000.
Mean Grade Point Average, by School Type. Figure 15 shows the overall mean GPA of
high school graduates, by school type (public school vs. nonpublic school), for the years 1990, 1994, 1998, and 2000.
Nonpublic high school graduates in the year 2000 earned a higher overall mean GPA than
public high school graduates. The 2000 nonpublic school graduates earned a 3.16 overall mean GPA, 0.24 points higher than the 2.92 overall mean GPA earned by the 2000 public school graduates. Overall mean GPAs of public and nonpublic schools also differed in the 1998 transcript study.
20The GPA differences between Asian/Pacific Islander and White graduates in 1990 and 1998, although similar to the GPA differences found in
1994 and 2000, are not statistically significant due to larger standard errors.

3-9
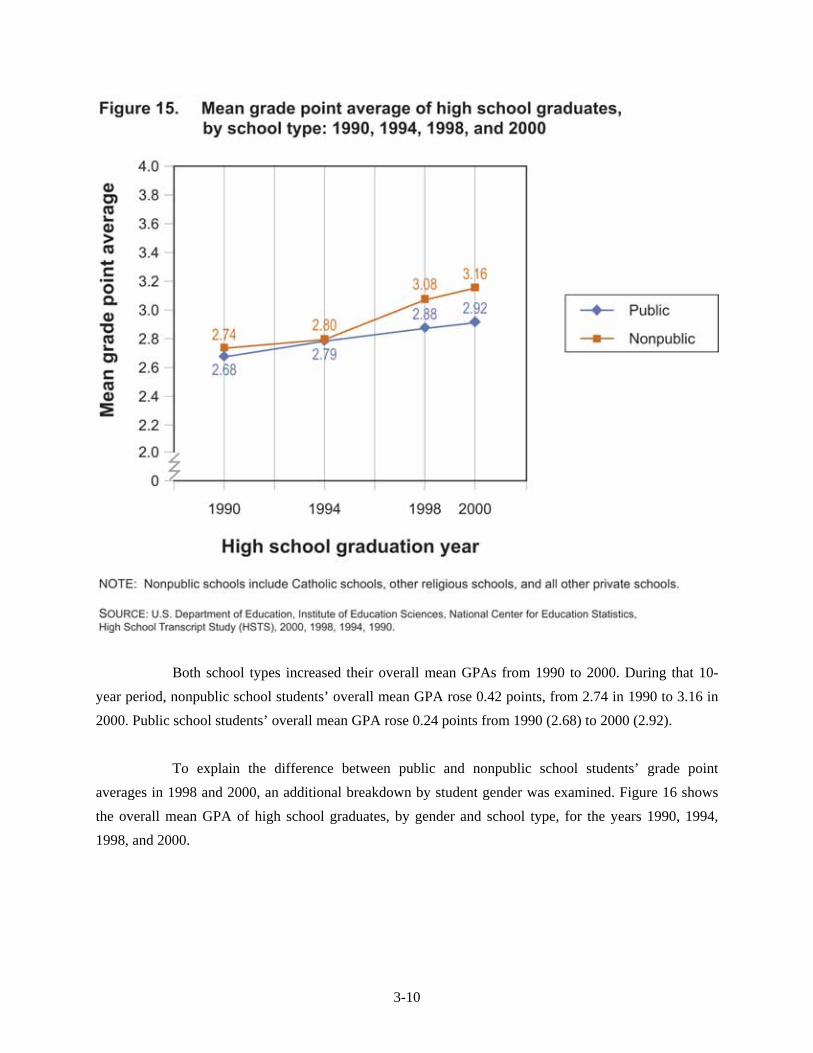
3-10
Both school types increased their overall mean GPAs from 1990 to 2000. During that 10-
year period, nonpublic school students’ overall mean GPA rose 0.42 points, from 2.74 in 1990 to 3.16 in 2000. Public school students’ overall mean GPA rose 0.24 points from 1990 (2.68) to 2000 (2.92).
To explain the difference between public and nonpublic school students’ grade point
averages in 1998 and 2000, an additional breakdown by student gender was examined. Figure 16 shows the overall mean GPA of high school graduates, by gender and school type, for the years 1990, 1994, 1998, and 2000.
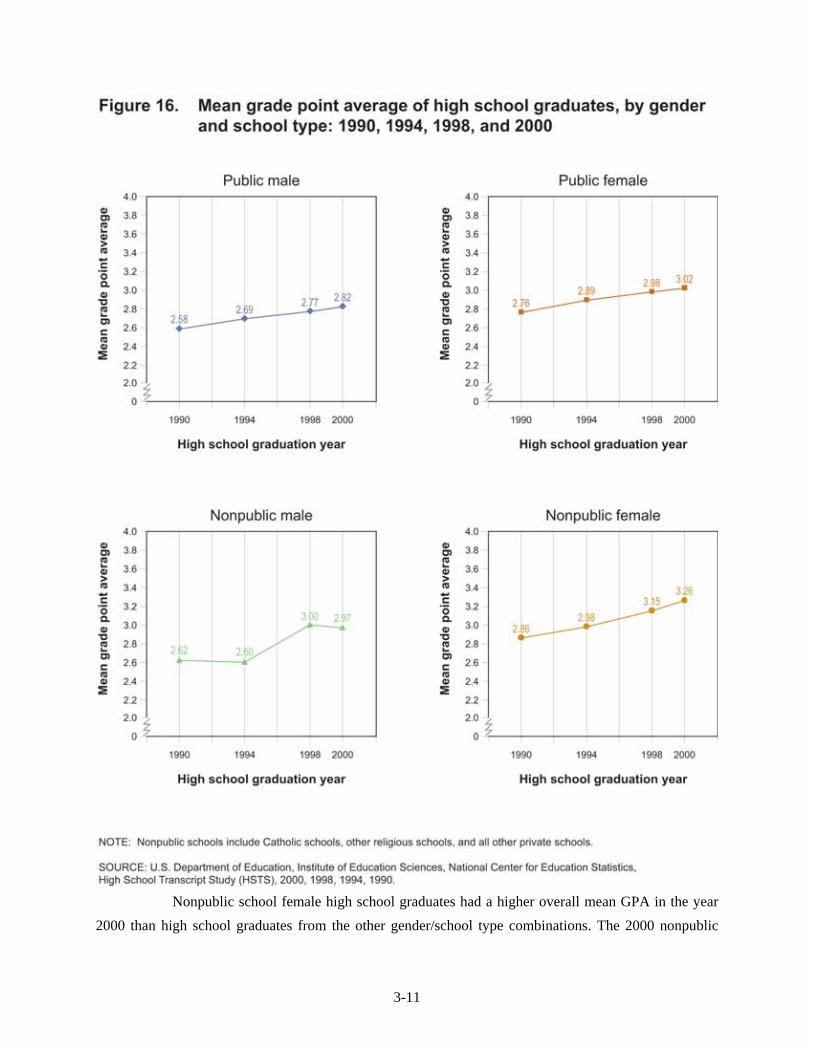
3-11
Nonpublic school female high school graduates had a higher overall mean GPA in the year
2000 than high school graduates from the other gender/school type combinations. The 2000 nonpublic
3-12
school female graduates earned an overall mean 3.26 GPA. Public school female graduates earned an overall mean 3.02 GPA, nonpublic school male graduates earned an overall mean 2.97 GPA, and public school male graduates earned an overall mean 2.82 GPA. Of the three previous transcript studies, only one study—HSTS 1990—showed nonpublic school female graduates with the significantly highest overall mean GPA among graduates of all gender/school type combinations.
Each gender/school type combination attained an increase in overall mean GPA from 1990
to 2000. Nonpublic school female graduates earned an overall mean 2.86 GPA in 1990, 0.40 points fewer than the overall mean GPA earned by their 2000 counterparts. The overall mean GPA for nonpublic school male, public school female, and public school male graduates increased 0.35 points, 0.26 points, and 0.24 points, respectively, from 1990 to 2000.
Among nonpublic school graduates, males showed an increase in their overall mean GPA
from 1994 to 1998. Male nonpublic school graduates earned a 3.00 overall mean GPA in 1998, 0.40 grade points higher than the 1994 overall mean GPA of 2.60. In comparison, the overall mean GPAs of female nonpublic school graduates rose 0.40 points from 1990 (2.86 overall mean GPA) to 2000 (3.26 overall mean GPA).
Mean Grade Point Average, by Region of the Country. Figure 17 shows the overall mean
GPA of high school graduates, by region of the country, for the years 1990, 1994, 1998, and 2000. High school graduates from the Northeast earned a lower overall mean GPA in 2000 than
graduates from the other three regions. Among the 2000 high school graduates, the Northeast region earned a 2.81 overall mean GPA. The West region earned a 2.99 overall mean GPA, the Midwest region earned a 2.97 overall mean GPA, and the South region earned a 2.96 overall mean GPA. In the three previous transcript studies, the West region consistently earned a higher overall mean GPA than the Northeast region.
The decade from 1990 to 2000 showed an increase in the mean GPA for all four regions of
the country. The Midwest high school graduates saw a 0.33 point increase in their overall mean GPA from 1990 to 2000. In that same time period, graduates from the South and West regions saw increases of 0.27 points and 0.22 points, respectively, in their overall mean GPAs. The Northeast high school graduates saw a 0.17 point increase in their overall mean GPA from 1990 to 2000.
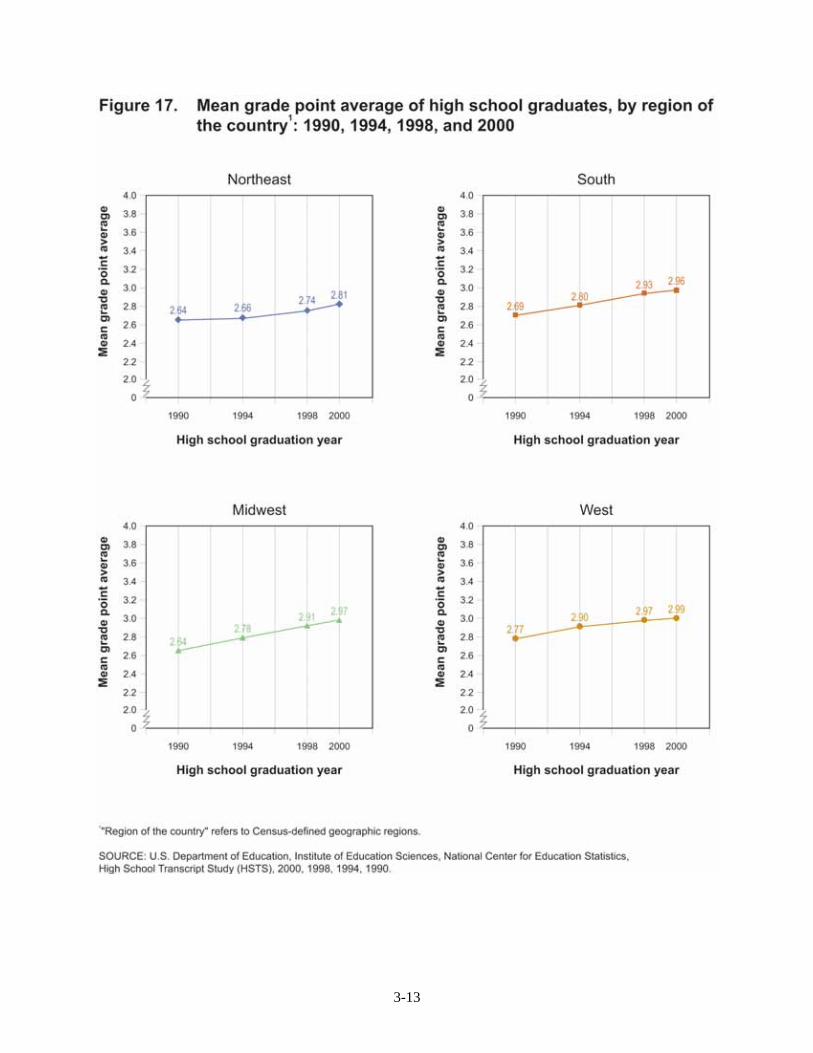
3-13
3-14
Summary
There was an increase in the overall mean GPA of high school graduates from 1990 to 2000 for the examined student and school subgroup—student gender, student race/ethnicity, school type, and region of the country. The mean GPA for each grade level also rose from 1990 to 2000, as did the mean GPA for each core subject field and the combined mean GPA for non-core subjects.
The 2000 high school graduates taking AP or IB courses in both mathematics and science
attained higher overall GPAs than those graduates who took AP and IB courses in only one of the two course subjects. The 2000 high school graduates who took neither AP/IB mathematics nor science courses attained lower GPAs than those graduates who took AP or IB courses in either or both course subjects.
A number of factors may explain the general increase in GPA from 1990 to 2000. The
increase could reflect the growth of high school graduates’ academic achievement during the decade. However, other factors, such as changes in teachers’ standards for grading, changes in material taught for courses, or other factors that cannot be measured by the HSTS, also could help explain the GPA increase. It is not the intent of the HSTS analyses to determine the cause of the overall GPA increase among high school graduates from 1990 to 2000.
4-1
4. COMPARISON OF HSTS 2000 RESULTS WITH NAEP 2000 ASSESSMENT SCORES
The High School Transcript Study (HSTS) focuses on high school graduates’ coursetaking patterns, which include what courses they took in different subject fields and the grades they received for those courses. It does not, however, independently assess graduates’ knowledge within the different subject fields. The National Assessment of Educational Progress (NAEP), also known as the Nation’s Report Card, measures educational achievement in various subject areas taught within the nation’s schools through ongoing and periodic assessments. Both the HSTS and NAEP education studies work in association with each other. The initial HSTS sample of schools comes from the sample of schools selected for the NAEP 12th grade assessment. By its design, then, the HSTS results can link with the NAEP assessment results. This link allows a comparison of student coursetaking patterns with their educational achievement in select course subjects, as measured by NAEP.
This chapter compares selected HSTS 2000 data with the NAEP 2000 assessment results in
mathematics and science. It first examines the NAEP mathematics and science assessment scores of the HSTS graduates. It then looks at the correlation of the NAEP assessment scores with such HSTS-developed measures as the graduates’ grade point averages (GPAs) in mathematics and science. Unless otherwise noted, the chapter discusses only statistically significant findings. Note that cross-sectional studies such as NAEP cannot make causal inferences between gains in achievement and coursetaking behavior (Rock and Pollack 1995). The NAEP assessment results presented in this report reflect the findings from those HSTS 2000 students that met the criteria for analyses. These criteria included a standard or honors diploma, at least 16 earned course credits, and a positive number of earned English course credits. These results do not reflect the NAEP sample as a whole.
The irregular frequency of the HSTS transcript studies prevents the comparisons of HSTS
data with the NAEP national main mathematics and science assessments from previous years. The NAEP national main assessments associated with HSTS 1994 and HSTS 1998 covered neither mathematics nor science. A NAEP national main mathematics assessment occurred in 1990, but the design of HSTS 1990 linked HSTS with NAEP data at the school level, not at the student level. NCES also provides NAEP long-term trend assessments in mathematics and science as measures of educational progress over time. The HSTS works in association with the NAEP main assessments, however, and results from the main assessments and trend assessments are not comparable. More information about the NAEP long-term trend assessments can be found in NAEP 1999 Trends in Academic Progress: Three Decades of Student Performance (U.S. Department of Education 2000). For this report, the term “assessment scores” refers to scores from the NAEP national main assessments.
4-2
Tables in this chapter present estimates for not only all high school graduates, but also by subgroups of selected student and school characteristics. The student characteristics include gender and race/ethnicity, and the school-based characteristics include school type (public or nonpublic school) and region of the country.21 The tables also provide estimates for high school graduates by whether or not they earned credits in Advanced Placement (AP) or International Baccalaureate (IB) mathematics and science courses,22 the highest level of mathematics and science courses in which they earned credits, and the last grade in which they earned credits in mathematics and science courses.
NAEP assessment results provide information about what students know within a given
subject. NAEP achievement levels provide information about what the students should know. The NAEP achievement levels measure how well students’ actual achievement matches the desired levels of achievement established by the National Assessment Governing Board (NAGB). There are three achievement levels for each subject and grade assessed by NAEP: Basic, Proficient, and Advanced. Their definitions follow:
Basic: A partial mastery of prerequisite knowledge and skills that are fundamental for
proficient work;
Proficient: A demonstrated competency of challenging subject matter, including subject-matter knowledge, application of such knowledge to real-world situations, and analytical skills appropriate to the subject matter; and
Advanced: Superior academic performance within the subject matter.
As provided by law, the achievement levels are to be used on a trial basis and should be interpreted and used with caution.
Each NAEP assessment uses a unique scale developed from item response theory (IRT). IRT
is a set of statistical procedures that summarizes student performance across a collection of test exercises that require similar knowledge and skills. For the NAEP 12th-grade mathematics assessment, the scale ranges from a minimum of 0 to a maximum of 500. An assessment score of 288 indicates the student has a basic grasp of mathematical skills. A score of 336 indicates proficient mathematical knowledge, while a score of 367 indicates advanced mathematical knowledge. For the NAEP 12th-grade science assessment, the scale ranges from a minimum of 0 to a maximum of 300. An assessment score of 146 indicates the
21In this report, the term “region of the country” refers to the Census-defined region: Northeast, South, Midwest, and West. See appendix A for
more information. 22AP/IB mathematics courses include courses in precalculus, calculus, and statistics. AP/IB science courses include courses in biology, chemistry,
physics, and environmental science.
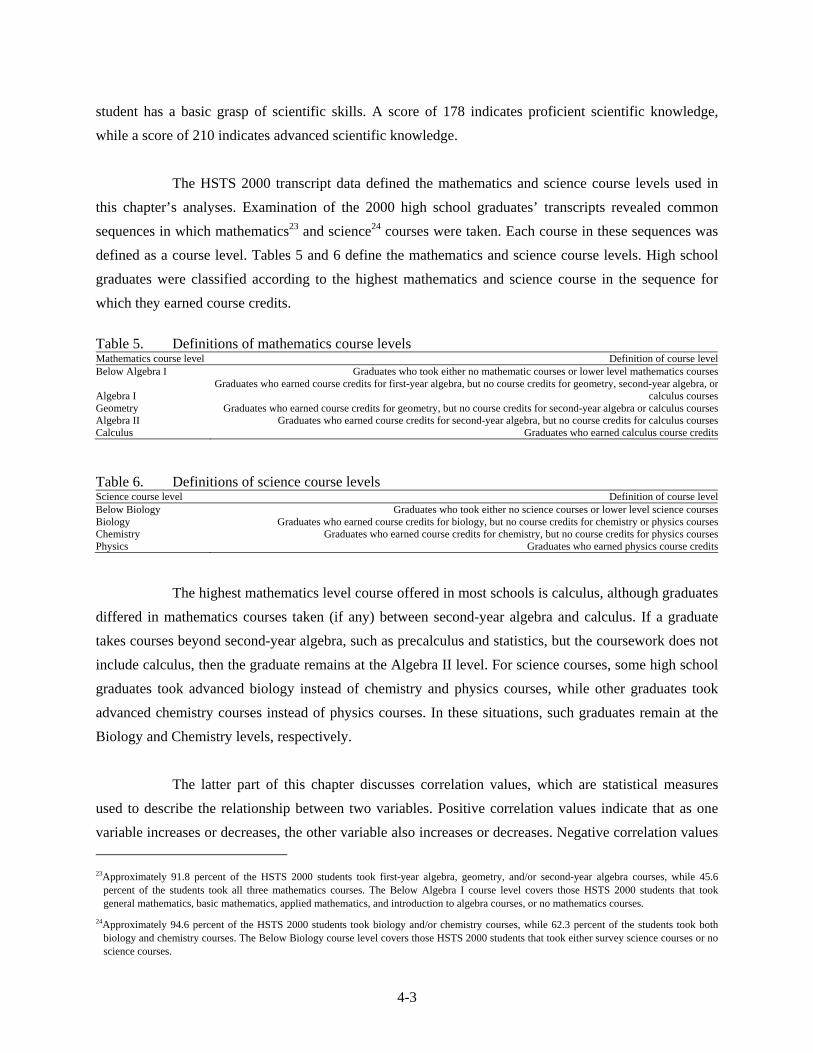
4-3
student has a basic grasp of scientific skills. A score of 178 indicates proficient scientific knowledge, while a score of 210 indicates advanced scientific knowledge.
The HSTS 2000 transcript data defined the mathematics and science course levels used in
this chapter’s analyses. Examination of the 2000 high school graduates’ transcripts revealed common sequences in which mathematics23 and science24 courses were taken. Each course in these sequences was defined as a course level. Tables 5 and 6 define the mathematics and science course levels. High school graduates were classified according to the highest mathematics and science course in the sequence for which they earned course credits.
Table 5. Definitions of mathematics course levels Mathematics course level Definition of course levelBelow Algebra I Graduates who took either no mathematic courses or lower level mathematics courses
Algebra I Graduates who earned course credits for first-year algebra, but no course credits for geometry, second-year algebra, or
calculus courses Geometry Graduates who earned course credits for geometry, but no course credits for second-year algebra or calculus coursesAlgebra II Graduates who earned course credits for second-year algebra, but no course credits for calculus coursesCalculus Graduates who earned calculus course credits Table 6. Definitions of science course levels Science course level Definition of course levelBelow Biology Graduates who took either no science courses or lower level science coursesBiology Graduates who earned course credits for biology, but no course credits for chemistry or physics courses Chemistry Graduates who earned course credits for chemistry, but no course credits for physics coursesPhysics Graduates who earned physics course credits
The highest mathematics level course offered in most schools is calculus, although graduates
differed in mathematics courses taken (if any) between second-year algebra and calculus. If a graduate takes courses beyond second-year algebra, such as precalculus and statistics, but the coursework does not include calculus, then the graduate remains at the Algebra II level. For science courses, some high school graduates took advanced biology instead of chemistry and physics courses, while other graduates took advanced chemistry courses instead of physics courses. In these situations, such graduates remain at the Biology and Chemistry levels, respectively.
The latter part of this chapter discusses correlation values, which are statistical measures
used to describe the relationship between two variables. Positive correlation values indicate that as one variable increases or decreases, the other variable also increases or decreases. Negative correlation values 23Approximately 91.8 percent of the HSTS 2000 students took first-year algebra, geometry, and/or second-year algebra courses, while 45.6
percent of the students took all three mathematics courses. The Below Algebra I course level covers those HSTS 2000 students that took general mathematics, basic mathematics, applied mathematics, and introduction to algebra courses, or no mathematics courses.
24Approximately 94.6 percent of the HSTS 2000 students took biology and/or chemistry courses, while 62.3 percent of the students took both biology and chemistry courses. The Below Biology course level covers those HSTS 2000 students that took either survey science courses or no science courses.
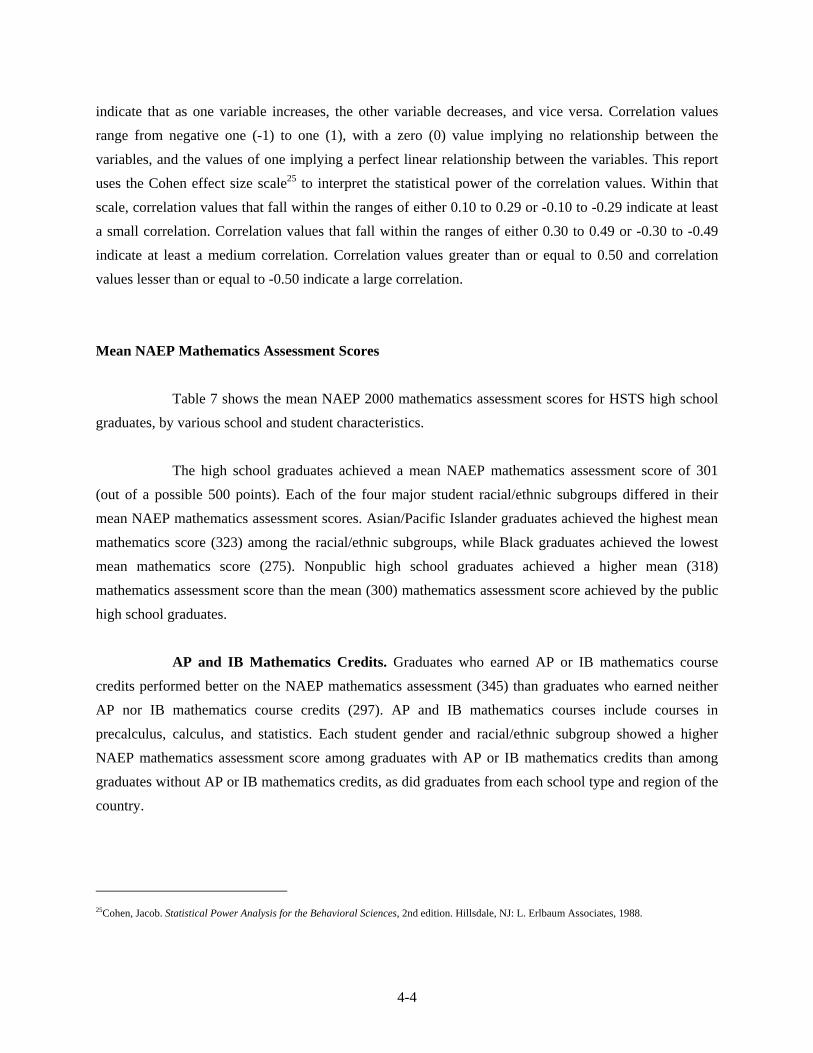
4-4
indicate that as one variable increases, the other variable decreases, and vice versa. Correlation values range from negative one (-1) to one (1), with a zero (0) value implying no relationship between the variables, and the values of one implying a perfect linear relationship between the variables. This report uses the Cohen effect size scale25 to interpret the statistical power of the correlation values. Within that scale, correlation values that fall within the ranges of either 0.10 to 0.29 or -0.10 to -0.29 indicate at least a small correlation. Correlation values that fall within the ranges of either 0.30 to 0.49 or -0.30 to -0.49 indicate at least a medium correlation. Correlation values greater than or equal to 0.50 and correlation values lesser than or equal to -0.50 indicate a large correlation.
Mean NAEP Mathematics Assessment Scores
Table 7 shows the mean NAEP 2000 mathematics assessment scores for HSTS high school graduates, by various school and student characteristics.
The high school graduates achieved a mean NAEP mathematics assessment score of 301
(out of a possible 500 points). Each of the four major student racial/ethnic subgroups differed in their mean NAEP mathematics assessment scores. Asian/Pacific Islander graduates achieved the highest mean mathematics score (323) among the racial/ethnic subgroups, while Black graduates achieved the lowest mean mathematics score (275). Nonpublic high school graduates achieved a higher mean (318) mathematics assessment score than the mean (300) mathematics assessment score achieved by the public high school graduates.
AP and IB Mathematics Credits. Graduates who earned AP or IB mathematics course
credits performed better on the NAEP mathematics assessment (345) than graduates who earned neither AP nor IB mathematics course credits (297). AP and IB mathematics courses include courses in precalculus, calculus, and statistics. Each student gender and racial/ethnic subgroup showed a higher NAEP mathematics assessment score among graduates with AP or IB mathematics credits than among graduates without AP or IB mathematics credits, as did graduates from each school type and region of the country.
25Cohen, Jacob. Statistical Power Analysis for the Behavioral Sciences, 2nd edition. Hillsdale, NJ: L. Erlbaum Associates, 1988.

4-5
Table 7. Mean NAEP mathematics assessment scores for HSTS high school graduates, by school and student characteristics: 2000 Mean NAEP mathematics assessment score
AP or IB mathematics
credits earned?
Highest mathematics course level taken
Last grade mathematics course taken
Characteristic All
graduates
No Yes Below
Algebra I Algebra I Geometry Algebra II Calculus Grade 9 Grade 10 Grade 11 Grade 12All graduates .......................... 301 297 345 260 269 285 304 342 ‡ 278 293 307 Student gender Male .................................... 303 297 349 261 271 285 306 345 ‡ 275 294 310 Female................................. 300 296 341 257 267 285 302 339 ‡ 281 292 305 Student race/ethnicity White................................... 308 303 347 263 273 292 310 345 ‡ 280 298 314 Black ................................... 275 273 325 250 255 268 278 323 ‡ 272 271 277 Hispanic .............................. 284 282 332 250 261 276 291 320 ‡ 267 279 288 Asian/Pacific Islander......... 323 313 347 ‡ ‡ ‡ 317 346 ‡ ‡ 310 327 School type Public .................................. 300 295 345 259 268 283 303 343 ‡ 278 291 306 Nonpublic ........................... 318 314 348 ‡ ‡ 306 315 337 ‡ ‡ 313 320 Region of the country1 Northeast............................. 303 298 348 263 274 296 304 344 ‡ 278 293 310 South ................................... 297 291 342 250 261 272 296 341 ‡ 279 288 302 Midwest .............................. 307 303 350 261 272 288 310 345 ‡ 279 299 315 West .................................... 301 297 344 264 269 283 311 337 ‡ 273 294 306
‡ Reporting standards not met. 1”Region of the country” refers to the Census-defined regions.
NOTE: Nonpublic schools include Catholic schools, other religious schools, and all other private schools. AP/IB mathematics courses include courses in precalculus, calculus, and statistics.
SOURCE: U.S. Department of Education, Institute of Education Sciences, National Center for Education Statistics, High School Transcript Study (HSTS), 2000.
4-6
Among the HSTS 2000 graduates earning AP or IB mathematics credits, male graduates had a higher NAEP mathematics assessment score than female graduates. Male graduates with AP/IB mathematics credits earned a mean 349 mathematics assessment score, while their female counterparts earned a mean 341 mathematics assessment score.
Highest Mathematics Course Level. Within the three highest mathematics course levels,
the HSTS 2000 high school graduates posted different mean NAEP mathematics assessment scores. Those HSTS 2000 graduates who earned credits in calculus courses achieved a mean 342 mathematics assessment score. Graduates at the Algebra II level achieved a mean 304 mathematics assessment score, while graduates at the Geometry level achieved a mean 285 mathematics assessment score. It is possible that higher mathematics proficiency enabled students to meet prerequisites for advanced mathematics courses.
Among three of the four basic school and student characteristics (student gender, student
race/ethnicity, and region of the country), each subgroup showed that HSTS 2000 graduates who earned credits in calculus courses posted a higher mean NAEP mathematics assessment score than graduates at either the Geometry or Algebra II levels. Public high school graduates who earned calculus course credits also performed better on the NAEP mathematics assessment (343) than graduates at either the Algebra II (303) or Geometry (283) levels.26
Last Grade Mathematics Taken. High school graduates in the HSTS 2000 who earned
mathematics course credits during the 12th grade earned higher scores on the NAEP 2000 mathematics assessment than graduates who last earned mathematics course credits before 12th grade. The HSTS 2000 graduates who earned 12th-grade mathematics credits achieved a mean 307 mathematics assessment score, compared to the mean 293 score for graduates who last earned mathematics credits in 11th grade.
The four major student racial/ethnic subgroups posted different mean NAEP mathematics
assessment scores among HSTS 2000 graduates who earned 12th grade mathematics course credits. Within the graduates who earned mathematics credits in the 12th grade, Asian/Pacific Islander graduates achieved the highest mean NAEP mathematics assessment score (327), while Black graduates achieved the lowest mean mathematics assessment score (277). White graduates achieved a mean 314 mathematics assessment score, while Hispanic graduates achieved a mean 288 mathematics assessment score.
26The differences in mean NAEP mathematics assessment scores between nonpublic graduates at the Algebra II (315) and Calculus (337) levels,
although apparently different, were not statistically significant due to small nonpublic graduate sample sizes (which led to larger standard errors).
4-7
Mean NAEP Science Assessment Scores
Table 8 shows the mean NAEP 2000 science assessment scores for HSTS high school graduates, by various school and student characteristics.
The high school graduates achieved a mean NAEP science assessment score of 147 (out of a
possible 300 points). Among the four major student racial/ethnic subgroups, Asian/Pacific Islander and White graduates achieved higher mean NAEP science assessment scores than either Hispanic or Black graduates. Asian/Pacific Islander and White graduates achieved mean NAEP science assessment scores, respectively, of 158 and 153. Hispanic graduates achieved a mean 130 science assessment score, while Black graduates achieved a mean 123 science score. Public and nonpublic high school graduates also differed in their mean NAEP science assessment scores. Nonpublic high school graduates achieved a mean 163 science assessment score, compared to the mean 146 science assessment score achieved by the public high school graduates.
AP and IB Science Credits. Graduates who earned AP or IB science course credits
performed better on the NAEP science assessment than graduates who earned neither AP nor IB science course credits. AP and IB science courses include courses in biology, chemistry, physics, and environmental science. Those HSTS 2000 graduates with AP or IB science credits achieved a mean 179 NAEP science assessment score, compared to the mean 144 science assessment score achieved by graduates without AP or IB science credits.
Highest Science Course Level. The NAEP science assessment scores earned by HSTS 2000
graduates differed by the highest science course level attained. The higher the science course level graduates attained, the higher mean NAEP science assessment score they achieved. Those HSTS 2000 graduates at the Physics level achieved a mean 164 science assessment score. Graduates at the Chemistry level achieved a mean 148 science assessment score, and graduates at the Biology level achieved a mean 126 science assessment score. Graduates at the Below Biology level achieved the lowest mean NAEP science assessment score (113) among the four science course levels.

4-8
Table 8. Mean NAEP science assessment scores for HSTS high school graduates, by school and student characteristics: 2000 Mean NAEP science assessment score
AP or IB science credits
earned?
Highest science course level taken
Last grade science course taken
Characteristic All graduates
No Yes
Below Biology Biology Chemistry Physics
Grade 9 Grade 10 Grade 11 Grade 12
All graduates .......................... 147 144 179 113 126 148 164 109 127 142 157 Student gender Male .................................... 149 145 182 114 128 149 167 106 129 144 159 Female................................. 146 143 176 112 124 147 162 ‡ 124 140 155 Student race/ethnicity White................................... 153 151 183 115 131 154 170 109 130 149 164 Black ................................... 123 121 156 105 107 124 135 ‡ 106 119 129 Hispanic .............................. 130 127 158 107 115 134 147 ‡ 116 126 138 Asian/Pacific Islander......... 158 144 184 ‡ 130 145 171 — ‡ 142 166 School type Public .................................. 146 143 178 113 125 146 164 109 126 140 156 Nonpublic ........................... 163 160 188 — 139 160 171 ‡ ‡ 157 170 Region of the country1 Northeast............................. 151 147 186 ‡ 125 147 167 ‡ 126 145 160 South ................................... 143 139 173 110 121 142 159 ‡ 123 136 153 Midwest .............................. 151 149 183 113 133 153 169 ‡ 132 146 161 West .................................... 147 143 180 113 125 152 167 ‡ 126 143 157
— Not available. Data were not collected or not reported.
‡ Reporting standards not met. 1”Region of the country” refers to the Census-defined regions.
NOTE: Nonpublic schools include Catholic schools, other religious schools, and all other private schools. AP/IB science courses include courses in biology, chemistry, physics, and environmental science.
SOURCE: U.S. Department of Education, Institute of Education Sciences, National Center for Education Statistics, High School Transcript Study (HSTS), 2000.
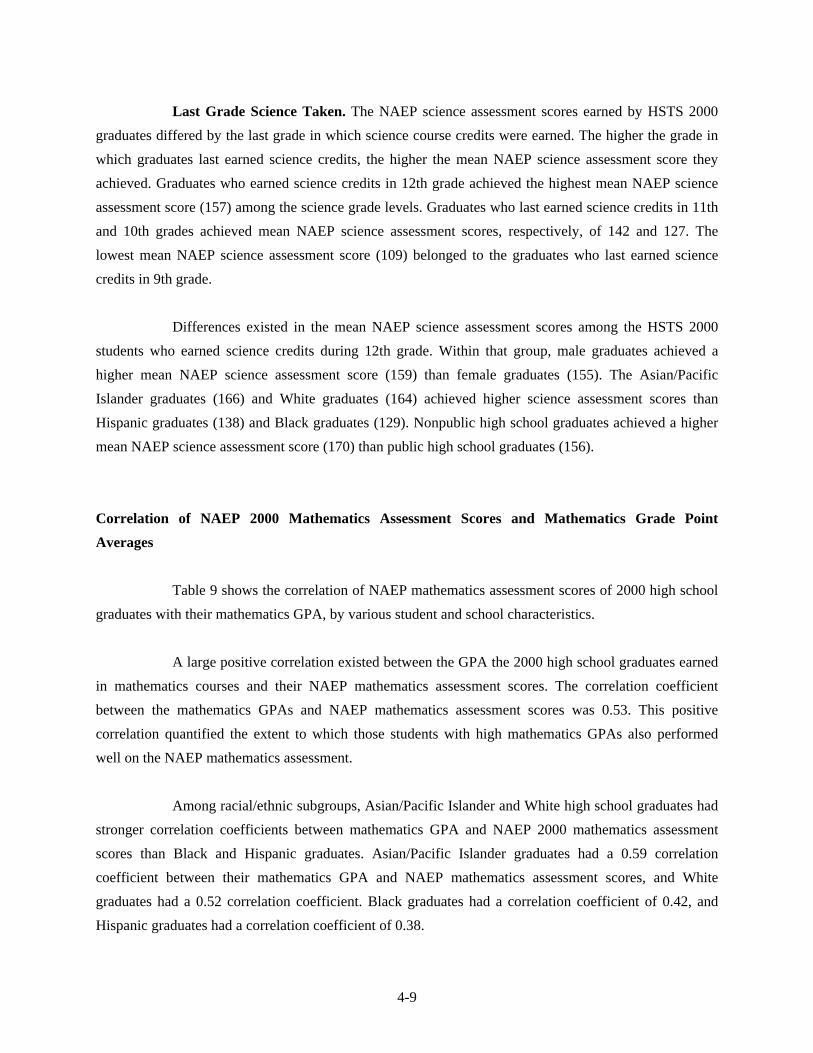
4-9
Last Grade Science Taken. The NAEP science assessment scores earned by HSTS 2000 graduates differed by the last grade in which science course credits were earned. The higher the grade in which graduates last earned science credits, the higher the mean NAEP science assessment score they achieved. Graduates who earned science credits in 12th grade achieved the highest mean NAEP science assessment score (157) among the science grade levels. Graduates who last earned science credits in 11th and 10th grades achieved mean NAEP science assessment scores, respectively, of 142 and 127. The lowest mean NAEP science assessment score (109) belonged to the graduates who last earned science credits in 9th grade.
Differences existed in the mean NAEP science assessment scores among the HSTS 2000
students who earned science credits during 12th grade. Within that group, male graduates achieved a higher mean NAEP science assessment score (159) than female graduates (155). The Asian/Pacific Islander graduates (166) and White graduates (164) achieved higher science assessment scores than Hispanic graduates (138) and Black graduates (129). Nonpublic high school graduates achieved a higher mean NAEP science assessment score (170) than public high school graduates (156).
Correlation of NAEP 2000 Mathematics Assessment Scores and Mathematics Grade Point Averages
Table 9 shows the correlation of NAEP mathematics assessment scores of 2000 high school graduates with their mathematics GPA, by various student and school characteristics.
A large positive correlation existed between the GPA the 2000 high school graduates earned
in mathematics courses and their NAEP mathematics assessment scores. The correlation coefficient between the mathematics GPAs and NAEP mathematics assessment scores was 0.53. This positive correlation quantified the extent to which those students with high mathematics GPAs also performed well on the NAEP mathematics assessment.
Among racial/ethnic subgroups, Asian/Pacific Islander and White high school graduates had
stronger correlation coefficients between mathematics GPA and NAEP 2000 mathematics assessment scores than Black and Hispanic graduates. Asian/Pacific Islander graduates had a 0.59 correlation coefficient between their mathematics GPA and NAEP mathematics assessment scores, and White graduates had a 0.52 correlation coefficient. Black graduates had a correlation coefficient of 0.42, and Hispanic graduates had a correlation coefficient of 0.38.
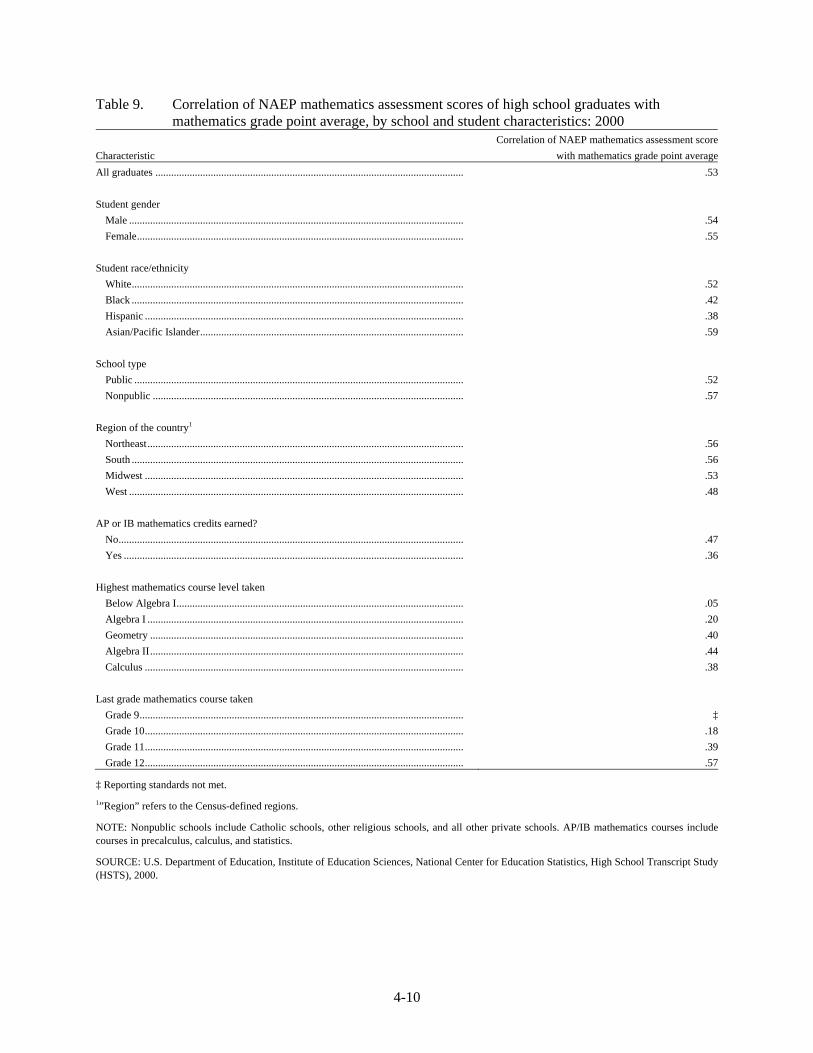
4-10
Table 9. Correlation of NAEP mathematics assessment scores of high school graduates with mathematics grade point average, by school and student characteristics: 2000
Characteristic Correlation of NAEP mathematics assessment score
with mathematics grade point averageAll graduates ..................................................................................................................... .53 Student gender Male ............................................................................................................................... .54 Female............................................................................................................................ .55 Student race/ethnicity White.............................................................................................................................. .52 Black .............................................................................................................................. .42 Hispanic ......................................................................................................................... .38 Asian/Pacific Islander.................................................................................................... .59 School type Public ............................................................................................................................. .52 Nonpublic ...................................................................................................................... .57 Region of the country1 Northeast........................................................................................................................ .56 South .............................................................................................................................. .56 Midwest ......................................................................................................................... .53 West ............................................................................................................................... .48 AP or IB mathematics credits earned? No................................................................................................................................... .47 Yes ................................................................................................................................. .36 Highest mathematics course level taken Below Algebra I............................................................................................................. .05 Algebra I ........................................................................................................................ .20 Geometry ....................................................................................................................... .40 Algebra II....................................................................................................................... .44 Calculus ......................................................................................................................... .38 Last grade mathematics course taken Grade 9........................................................................................................................... ‡ Grade 10......................................................................................................................... .18 Grade 11......................................................................................................................... .39 Grade 12......................................................................................................................... .57
‡ Reporting standards not met. 1”Region” refers to the Census-defined regions.
NOTE: Nonpublic schools include Catholic schools, other religious schools, and all other private schools. AP/IB mathematics courses include courses in precalculus, calculus, and statistics.
SOURCE: U.S. Department of Education, Institute of Education Sciences, National Center for Education Statistics, High School Transcript Study (HSTS), 2000.
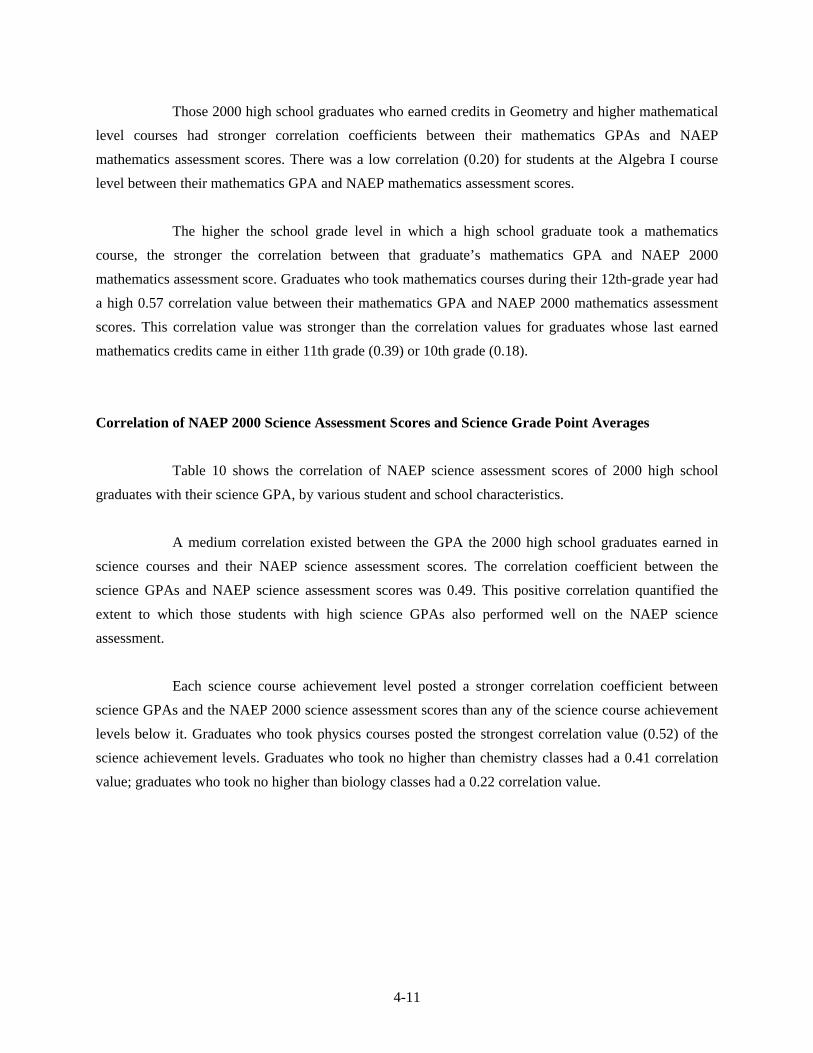
4-11
Those 2000 high school graduates who earned credits in Geometry and higher mathematical level courses had stronger correlation coefficients between their mathematics GPAs and NAEP mathematics assessment scores. There was a low correlation (0.20) for students at the Algebra I course level between their mathematics GPA and NAEP mathematics assessment scores.
The higher the school grade level in which a high school graduate took a mathematics
course, the stronger the correlation between that graduate’s mathematics GPA and NAEP 2000 mathematics assessment score. Graduates who took mathematics courses during their 12th-grade year had a high 0.57 correlation value between their mathematics GPA and NAEP 2000 mathematics assessment scores. This correlation value was stronger than the correlation values for graduates whose last earned mathematics credits came in either 11th grade (0.39) or 10th grade (0.18).
Correlation of NAEP 2000 Science Assessment Scores and Science Grade Point Averages
Table 10 shows the correlation of NAEP science assessment scores of 2000 high school graduates with their science GPA, by various student and school characteristics.
A medium correlation existed between the GPA the 2000 high school graduates earned in
science courses and their NAEP science assessment scores. The correlation coefficient between the science GPAs and NAEP science assessment scores was 0.49. This positive correlation quantified the extent to which those students with high science GPAs also performed well on the NAEP science assessment.
Each science course achievement level posted a stronger correlation coefficient between
science GPAs and the NAEP 2000 science assessment scores than any of the science course achievement levels below it. Graduates who took physics courses posted the strongest correlation value (0.52) of the science achievement levels. Graduates who took no higher than chemistry classes had a 0.41 correlation value; graduates who took no higher than biology classes had a 0.22 correlation value.
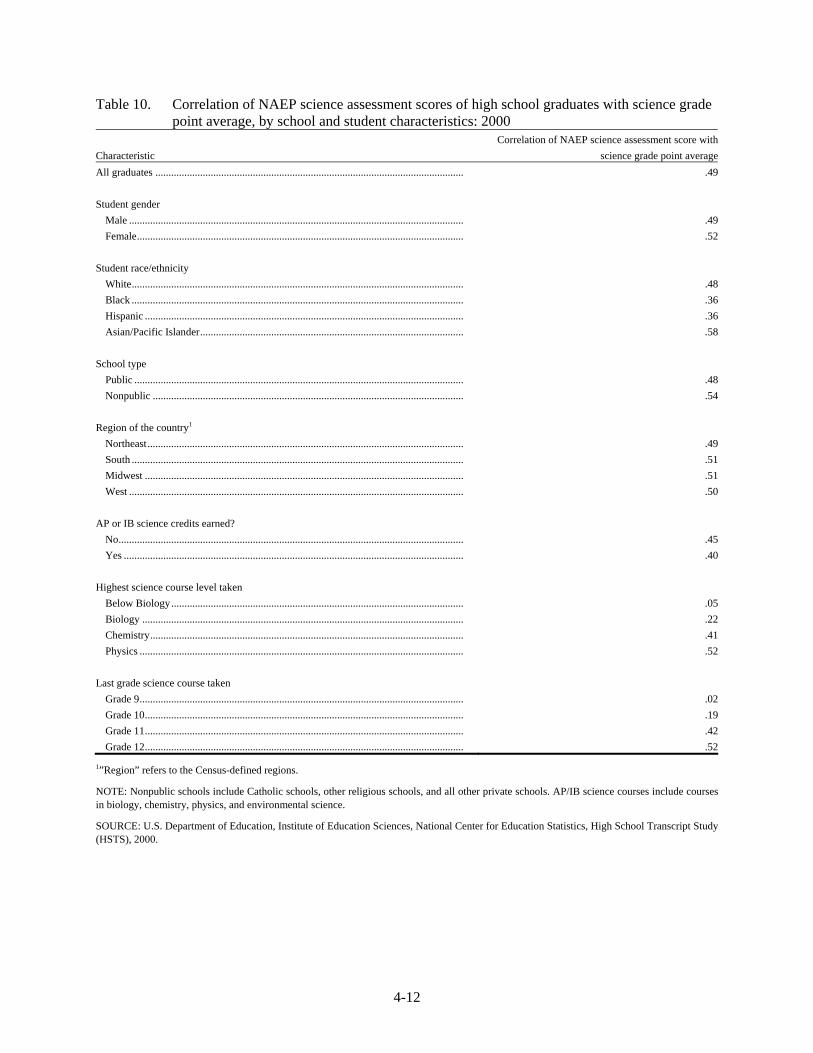
4-12
Table 10. Correlation of NAEP science assessment scores of high school graduates with science grade point average, by school and student characteristics: 2000
Characteristic Correlation of NAEP science assessment score with
science grade point averageAll graduates ..................................................................................................................... .49 Student gender Male ............................................................................................................................... .49 Female............................................................................................................................ .52 Student race/ethnicity White.............................................................................................................................. .48 Black .............................................................................................................................. .36 Hispanic ......................................................................................................................... .36 Asian/Pacific Islander.................................................................................................... .58 School type Public ............................................................................................................................. .48 Nonpublic ...................................................................................................................... .54 Region of the country1 Northeast........................................................................................................................ .49 South .............................................................................................................................. .51 Midwest ......................................................................................................................... .51 West ............................................................................................................................... .50 AP or IB science credits earned? No................................................................................................................................... .45 Yes ................................................................................................................................. .40 Highest science course level taken Below Biology............................................................................................................... .05 Biology .......................................................................................................................... .22 Chemistry....................................................................................................................... .41 Physics ........................................................................................................................... .52 Last grade science course taken Grade 9........................................................................................................................... .02 Grade 10......................................................................................................................... .19 Grade 11......................................................................................................................... .42 Grade 12......................................................................................................................... .52
1”Region” refers to the Census-defined regions.
NOTE: Nonpublic schools include Catholic schools, other religious schools, and all other private schools. AP/IB science courses include courses in biology, chemistry, physics, and environmental science.
SOURCE: U.S. Department of Education, Institute of Education Sciences, National Center for Education Statistics, High School Transcript Study (HSTS), 2000.
4-13
Among school grade levels, high school graduates who earned science credits during the 12th grade had the strongest correlation between science GPA and NAEP 2000 science assessment scores. Graduates who took science course takers in the 12th grade had a high 0.52 correlation between their science GPA and NAEP 2000 science assessment scores. Graduates who last earned science credits in 11th and 10th grades had correlation values, respectively, of 0.42 and 0.19. These findings suggest that the science GPAs of graduates who earned science credits in 12th grade strongly reflected their scores on the NAEP 2000 science assessment.
Summary
The mean NAEP mathematics and science assessment scores achieved by the HSTS 2000 high school graduates revealed that graduates taking higher level mathematics and science courses and/or at the higher grade levels generally scored higher on the NAEP assessments.
The 2000 high school graduates’ mathematics GPAs showed a high positive correlation with graduates’ NAEP 2000 mathematics assessment scores, as did the graduates’ science GPAs with the graduates’ NAEP 2000 science assessment scores. Subgroups of high school graduates that showed the weakest correlation values between GPA and assessment scores included graduates who last took mathematics and/or science courses in the 10th grade.

4-14
5-1
5. CONCLUSIONS
The 2000 High School Transcript Study (HSTS 2000) provided evidence of changes with respect to coursetaking patterns in the nation’s secondary schools. From 1990 to 2000, secondary school students earned increasing numbers of course credits and appear to have augmented their load of both core courses (mathematics, science, English, and social studies) and non-core courses. These consistent increases were evident for all examined subgroups of student and school characteristics (i.e., gender, race/ethnicity, school type, and region).27
Increases also were detected with respect to grade point average (GPA) in the nation’s
secondary schools. From 1990 to 2000, the overall mean GPA of secondary students increased from 2.68 in 1990 to 2.94 in 2000. These increases in GPA were consistently present among all examined subgroups across years. In addition, the increases occurred across 13 of the 16 subject areas, including all four core academic fields.
While increases were consistent for most subgroups, there were also differences in mean
GPA across subgroups, by examined student and school characteristics. For example, female students earned higher mean GPAs than male students between 1990 and 2000. In 2000, Asian/Pacific Islander graduates earned an overall higher mean GPA than White, Black, and Hispanic graduates. In 1998 and 2000, nonpublic secondary school graduates earned higher GPAs than public secondary school graduates.
High school graduates earned a higher mean GPA in grade 12 than in any other grade in
1990, 1994, 1998, and 2000. Further, findings showing the overall mean GPA by course subject revealed that students had the most difficulty with mathematics and science courses across all study years. For example, high school graduates in the year 2000 earned 2.60 and 2.67 mean GPAs, respectively, for mathematics and science courses, significantly lower than the mean GPAs for the other 14 course subjects.
A number of factors may explain the general increase in GPA from 1990 to 2000. The
increase could reflect the growth of high school graduates’ academic achievement during the decade. However, other factors, such as changes in teachers’ standards for grading, changes in material taught for courses, or other factors that cannot be measured by the HSTS, also could help explain the GPA increase.
27That no differences were found across years for nonpublic schools may be due to smaller sample sizes for this population.
5-2
This report also examined the NAEP 2000 mathematics and science assessment scores of the HSTS graduates with respect to student and school characteristics, student coursework, and such HSTS-developed measures as the graduates’ grade point averages in mathematics and science. Findings showed that graduates who earned AP or IB mathematics course credits performed better on the NAEP mathematics assessment than graduates who earned neither AP nor IB mathematics course credits. Similarly, graduates who earned AP or IB science course credits performed better on the NAEP science assessment than graduates who earned neither AP nor IB science course credits.
Other factors involving coursework were related to the NAEP 2000 mathematics and science
assessment scores. For example, the higher the mathematics and science course levels that graduates attained, the higher the respective mean NAEP mathematics and science assessment scores they achieved. In addition, graduates who last took a mathematics or science course in the 12th grade performed better on the respective NAEP 2000 mathematics and science assessments than graduates who last took such courses in grades 9, 10 or 11.
There was a high positive correlation between the mean GPA earned in mathematics courses
by the 2000 high school graduates and their NAEP mathematics assessment scores. A medium positive correlation existed between the mean GPA of 2000 high school graduates earned in science courses and these graduates’ NAEP science assessment scores.
In conclusion, the High School Transcript Study series from 1990 to 2000 provided evidence
of increases across the decade with respect to important measures of curricula and the achievement of secondary students. Across the nation’s secondary schools, from 1990 to 2000, students earned more credits and higher GPAs. The HSTS 2000 also provided some insight into results of the NAEP 2000 mathematics and science assessments—among other things, scores were related to factors such as GPA in mathematics and science courses, AP and IB course taking, highest level of courses taken in mathematics and science, and the last year in which mathematics and science courses were taken.
6-1
6. REFERENCES
Cohen, Jacob. (1988). Statistical Power Analysis for the Behavioral Sciences, 2nd edition. Hillsdale, NJ: L. Erlbaum Associates.
Council of Chief State School Officers. (2000). Key State Education Policies on K-12 Education: 2000. Washington, DC.
Gifford, A.G., Hoachlander, E.G., and Tuma, J.E. (1994). The Secondary School Taxonomy Final Report. Washington, DC: U.S. Department of Education, National Assessment of Vocational Education, Final Report to Congress, Volume II, Chapter 1. February 1989.
Ludwig, M.J., Olivetti, L., Sandberg, N., and Waite, B. (1982). A Classification of Secondary School Courses. Alexandria, VA: Evaluation Technologies, Inc.
National Commission on Excellence in Education. (1983). A Nation at Risk: The Imperative for Educational Reform. Washington, DC: U.S. Government Printing Office.
Rock, D. and Pollack, J. (1995). Psychometric Report for the NELS:88 Base Year (1988) Through Second Follow-Up (1992), Washington, DC: National Center for Education Statistics.
U.S. Department of Commerce, U.S. Census Bureau. (2000). Census 2000 American FactFinder. Online publication, http://www.census.gov/main/www/cen2000.html.
U.S. Department of Education, National Center for Education Statistics. (1993). User’s Manual: 1990 High School Transcript Study (NCES 93–416). Washington, DC: U.S. Government Printing Office.
U.S. Department of Education, National Center for Education Statistics. (1995). User’s Manual: NELS:88 Second Follow-Up: Transcript Data Component File (NCES 95–377). Washington, DC: U.S. Government Printing Office.
U.S. Department of Education, National Center for Education Statistics. (1997). The 1994 High School Transcript Study Technical Report (NCES 97–262). Washington, DC: U.S. Government Printing Office.
U.S. Department of Education, National Center for Education Statistics. (1998). The 1994 High School Transcript Study Tabulations: Comparative Data on Credits Earned and Demographics for 1994, 1990, 1987, and 1982 High School Graduates (NCES 98–532). Washington, DC: U.S. Government Printing Office.
U.S. Department of Education, National Center for Education Statistics. (2000). NAEP 1999 Trends in Academic Progress: Three Decades of Student Performance (NCES 2000–469). Washington, DC: U.S. Government Printing Office.
U.S. Department of Education, National Center for Education Statistics. (2001). The 1998 High School Transcript Study User’s Guide and Technical Report (NCES 2001–477). Washington, DC: U.S. Government Printing Office.
6-2
U.S. Department of Education, National Center for Education Statistics. (2001). The 1998 High School Transcript Study Tabulations: Comparative Data on Credits Earned and Demographics for 1998, 1994, 1990, 1987, and 1982 High School Graduates (NCES 2001–498). Washington, DC: U.S. Government Printing Office.
U.S. Department of Education, National Center for Education Statistics. (2001). The Nation’s Report Card: Mathematics 2000 (NCES 2001–517). Washington, DC: U.S. Government Printing Office.
U.S. Department of Education, National Center for Education Statistics. (2003). Overview and Inventory of State Education Reforms: 1990 to 2000 (NCES 2003–020). Washington, DC: U.S. Government Printing Office.
U.S. Department of Education, National Center for Education Statistics. (2003). The Nation’s Report Card: Science 2000 (NCES 2003–453). Washington, DC: U.S. Government Printing Office.
U.S. Department of Education, National Center for Education Statistics. (2004a). The 2000 High School Transcript Study Tabulations: Comparative Data on Credits Earned and Demographics for 2000, 1998, 1994, 1990, 1987, and 1982 High School Graduates. Online publication, http://nces.ed.gov.
U.S. Department of Education, National Center for Education Statistics. (2004b). The 2000 High School Transcript Study User’s Guide and Technical Report. Online publication, http://nces.ed.gov.
Wolter, K. (1985). Introduction to Variance Estimation. New York: Springer-Verlag.
Zahs, D., Pedlow, S., Morrissey, M., Marnell, P., and Nichols, B. (1995). High School and Beyond Fourth Follow-Up Methodology Report. Prepared by the National Opinion Research Center for the National Center for Education Statistics.

A-1
Appendix A
Survey Methodology

A-2

A-3
Table of Contents Page
The 2000 High School Transcript Study .............................................................................. A-5 Sample Design ...................................................................................................................... A-5 Response Rates ..................................................................................................................... A-7 Data Collection ..................................................................................................................... A-9 Data Processing .................................................................................................................... A-11 NAEP Assessment Scores .................................................................................................... A-14 Weighting and Variance Estimation ..................................................................................... A-16 The HSTS Sample Weights .................................................................................................. A-17 The HSTS NAEP-Linked Weights ....................................................................................... A-17 Variances ......................................................................................................................... A-18 Test Statistics ........................................................................................................................ A-18 Description of Previous High School Transcript Studies ..................................................... A-19 Student and School Characteristics....................................................................................... A-20 Definitions of Analysis Variables......................................................................................... A-22
Appendix Tables
Table Page A-1 Total sampled school and students for the HSTS study: 2000.................................... A-7 A-2 Numeric grade conversion .......................................................................................... A-14 A-3 Percentage distribution of high school graduates, by student and school
characteristics: 1990, 1994, 1998, and 2000 .............................................................. A-21 A-4 Census region definitions ............................................................................................ A-22

A-4
A-5
SURVEY METHODOLOGY
The 2000 High School Transcript Study
The 2000 High School Transcript Study (HSTS 2000) is the latest in a series of National Assessment of Educational Progress (NAEP) transcript studies that have been conducted for the National Center for Education Statistics (NCES). This study provides the Department of Education and other educational policymakers with information regarding current course offerings and coursetaking patterns in the nation’s secondary schools. The HSTS 2000 provides researchers with the coursetaking patterns of a nationally representative sample of students who graduated from American public and nonpublic high schools in 2000. It was designed so that data on students’ coursetaking patterns can be linked to the NAEP 2000 assessment results.28 Since studies similar to the HSTS 2000 were conducted in 1990, 1994, and 1998, changes in these patterns and relationships to NAEP performance in these years also can be examined. This appendix describes features of the HSTS 2000 study methodology, including sample design, data collection and data processing procedures, weighting, and analysis variables. Greater detail on any of these topics may be found in The 2000 High School Transcript Study User’s Guide and Technical Report (U.S. Department of Education 2004b).
Sample Design
The HSTS 2000 is based on a subsample of the schools and students included in the NAEP 2000. Approximately 96 percent of the students included in the HSTS 2000 participated in the NAEP assessment. The NAEP 2000 used a multistage probability sample design. Counties or groups of counties were the first-stage sampling units, and elementary and secondary schools were the second-stage units. The third stage of sampling consisted of the assignment of sessions by type to sampled schools and the assignment of sample types to sampled schools. The session type refers to the subject(s) being assessed, while the sample type refers to the specific criteria for inclusion that were applied to the session. The fourth stage involved selection of students within schools and their assignment to session types.
A total of 94 out of 1,000 PSUs were selected for sample in NAEP 2000. The 22 largest
PSUs were included with certainty. The remaining smaller PSUs were grouped into 72 noncertainty strata
28The purpose of NAEP is to gather information that will aid educators, legislators, and others in improving the education experience of youth in
the United States. Its primary goals are to measure the current status of the educational attainment of young Americans and to report changes and long-term trends in those attainments.
A-6
and one PSU was selected from each stratum with probability proportional to the estimated grade-specific enrollment of the schools. The noncertainty strata were defined by region, metropolitan status, and various socioeconomic characteristics.
The second-stage of sampling involved the selection of schools within the sampled PSUs.
High-minority public schools and private schools were oversampled to enhance the reliability of NAEP estimates for Black and Hispanic students as well as various types of private school students. High-minority public schools were given double the probability of selection of low-minority public schools. Private schools were heavily oversampled to meet explicit target sample sizes for the reporting group (Catholic, Lutheran, Conservative Christian, Other religious, Nonsectarian, and Independent). Schools were selected (without replacement) across all PSUs systematically with probability proportional to size in terms of grade enrollment.
For NAEP, grade 12 schools were assigned two types of sessions, mathematics and science.
Schools with 25 or more students were assigned both session types; schools smaller than that were assigned only one session. For the smaller private schools, half of them were assigned mathematics and the other half science. For the smaller public schools, 7 out of 16 were assigned mathematics and 9 out of 16 were assigned science. To determine the effect of using different criteria for excluding students from the assessment, two different sample types (S2 and S3) were assigned to schools. In sample type 3 schools, accommodations were offered to students with disabilities (SD) and limited English proficient (LEP) students. In sample type 2 schools, no assessment accommodations were offered to SD/LEP students. Sample type was assigned to schools so that 50 percent of the schools were assigned sample type 2 and 50 percent were assigned sample type 3.
The fourth stage of sampling for NAEP involved the selection of students within the
sampled schools. The student samples included oversampling of Black and Hispanic students in low minority public schools and SD/LEP students in all schools.
The HSTS 2000 school sample comprised all 319 public schools and a subsample of the 621
private schools selected for NAEP. The HSTS private school sample, which consisted of 60 schools, was selected in a way to reverse the oversample in NAEP so that the private school students in the HSTS were represented in proportion to their prevalence in the general grade 12 student population.
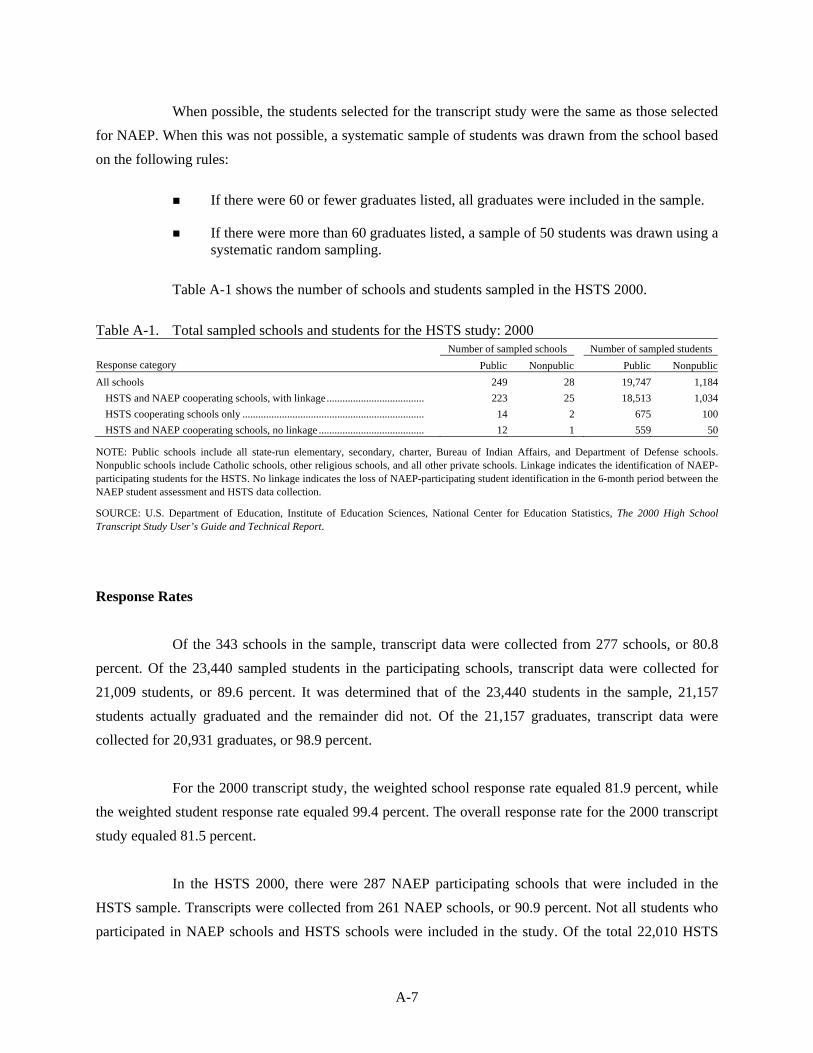
A-7
When possible, the students selected for the transcript study were the same as those selected for NAEP. When this was not possible, a systematic sample of students was drawn from the school based on the following rules:
If there were 60 or fewer graduates listed, all graduates were included in the sample.
If there were more than 60 graduates listed, a sample of 50 students was drawn using a systematic random sampling.
Table A-1 shows the number of schools and students sampled in the HSTS 2000.
Table A-1. Total sampled schools and students for the HSTS study: 2000 Number of sampled schools Number of sampled students
Response category Public Nonpublic Public NonpublicAll schools 249 28 19,747 1,184 HSTS and NAEP cooperating schools, with linkage..................................... 223 25 18,513 1,034 HSTS cooperating schools only ..................................................................... 14 2 675 100 HSTS and NAEP cooperating schools, no linkage ........................................ 12 1 559 50
NOTE: Public schools include all state-run elementary, secondary, charter, Bureau of Indian Affairs, and Department of Defense schools. Nonpublic schools include Catholic schools, other religious schools, and all other private schools. Linkage indicates the identification of NAEP-participating students for the HSTS. No linkage indicates the loss of NAEP-participating student identification in the 6-month period between the NAEP student assessment and HSTS data collection.
SOURCE: U.S. Department of Education, Institute of Education Sciences, National Center for Education Statistics, The 2000 High School Transcript Study User’s Guide and Technical Report.
Response Rates
Of the 343 schools in the sample, transcript data were collected from 277 schools, or 80.8 percent. Of the 23,440 sampled students in the participating schools, transcript data were collected for 21,009 students, or 89.6 percent. It was determined that of the 23,440 students in the sample, 21,157 students actually graduated and the remainder did not. Of the 21,157 graduates, transcript data were collected for 20,931 graduates, or 98.9 percent.
For the 2000 transcript study, the weighted school response rate equaled 81.9 percent, while
the weighted student response rate equaled 99.4 percent. The overall response rate for the 2000 transcript study equaled 81.5 percent.
In the HSTS 2000, there were 287 NAEP participating schools that were included in the
HSTS sample. Transcripts were collected from 261 NAEP schools, or 90.9 percent. Not all students who participated in NAEP schools and HSTS schools were included in the study. Of the total 22,010 HSTS
A-8
students linked to NAEP, 19,691 students actually graduated and the remaining 2,319 students did not graduate. Of the 19,691 graduates, the study collected transcripts from 19,547 graduates, or 99.3 percent.
For the NAEP-participating schools in the 2000 transcript study, the weighted school
response rate equaled 93.3 percent, while their weighted student response rate equaled 99.4 percent. The overall response rate for the 2000 transcript study’s NAEP students equaled 92.7 percent.
The 2000 NAEP 12th-grade assessment attained both school and student response rates that
were below 85 percent. Following completion of the weighting for the NAEP assessments, tables showing weighted distributions of school and student characteristics for respondents and nonrespondents were provided to NCES. These tables, prepared to NCES specifications, were used in the adjudication of the NAEP 2000 assessment results. The school nonresponse bias was less than 5.2 percent for the items evaluated, and the student nonresponse bias was less than 1.9 percent for the items evaluated. It was determined that the effects of school and student nonresponse were not sufficient as to result in suppression or annotation of the NAEP 12th-grade results. For more information about this bias analysis, see The 2000 High School Transcript Study User's Guide and Technical Report (U.S. Department of Education 2004b).
To be consistent with previous published analyses of the NAEP HSTS data, the analysis
presented in this report includes only students with regular diplomas or honors diplomas. Of the 23,440 sampled students, 2,936 students (12.5 percent) earned neither a regular nor honors graduation diploma. The analysis excludes students with Special Education diplomas, Certificates of Completion, or Certificates of Attendance. It also limits the transcripts to those high school graduates with 16 or more earned Carnegie credits and a nonzero number of English Carnegie credits. An additional 232 students (1.0 percent) failed to have either at least 16 Carnegie credits of courses on their transcripts or a nonzero number of English Carnegie credits. These restrictions, meant to maximize the probability that the HSTS analyses will include only detailed high school graduate transcripts, limited the HSTS 2000 analysis to 20,272 students.
The student transcripts involved with the HSTS analyses are complete transcripts. These
transcripts all have CSSC codes, Carnegie course credits, and standardized grades for each listed course. Both the Carnegie course credits and standardized grades are derived into variables that were analyzed in this report (coursetaking categories and GPA, respectively).
Item response rates for the demographic variables included in this report—student gender,
student race/ethnicity, school type, and region of the country—can be found in table A-3 within this
A-9
appendix. Across all survey years, both school type and region of the country had a 100 percent item response rate. Student gender had a 98.7 percent or better item response rate in all of the study years. Student race/ethnicity item response rates ranged from 94.6 percent in 1994 to 98.3 percent in 2000. For more detailed information on school and student response rates, see chapter 3 of The 2000 High School Transcript Study User’s Guide and Technical Report (U.S. Department of Education 2004b).
Data Collection
The field workers for the HSTS 2000 were drawn from the pool of NAEP field supervisors. They were trained in the data collection procedures for HSTS in December 1999. This training was conducted by the HSTS Curriculum Specialist/Coding Supervisor and took place over one full day. The training consisted of three sessions. The purpose of the first session was to establish the background knowledge needed to help field workers to make informed decisions when collecting information in the schools, and to explain why attention to detail and accuracy would be crucial in ensuring the quality of HSTS data. The second training session was held to familiarize field workers with the HSTS materials and forms, and with the variety of materials they could expect to find in the schools. The third session provided an opportunity for field workers to work with sample catalogs and transcripts, and to fill out practice forms, as they would do using the actual materials for the HSTS.
In September 1999, superintendents and principals were notified about the transcript study
through the Summary of School Tasks which was included in a mailout to all schools selected for NAEP. This summary included information on several aspects of the main NAEP study, as well as the notification of the transcript study. In December 1999, district superintendents of participating 12th-grade schools sampled for the main NAEP and selected for the HSTS 2000 were mailed additional information concerning the HSTS.
Eligible schools participating in NAEP were informed about the HSTS 2000 when they
received information about NAEP. Schools were provided with information about participating in the HSTS, including procedures that would be used to ensure confidentiality of the data, and the amount and nature of school staff time required for participating in HSTS. For eligible schools that agreed to cooperate, students sampled for NAEP were included in the HSTS sample, and a brightly-colored Disclosure Notice was placed in their folder by a NAEP field worker or school staff member.
Once participation in the study was authorized by the district, individual schools were
contacted. The contact letter for NAEP, for all schools in which 12th-grade students were assessed,
A-10
provided information about the HSTS 2000. Initial HSTS information requested from schools and collected by NAEP field workers at the time of the NAEP assessment included information that they were asked to provide on a School Information Form (SIF), as well as their school’s course catalogs for the four most recent school years, including 1999-2000, and three sample transcripts. They also were asked to provide a complete transcript for each graduate in the HSTS sample as soon as graduation information was posted on the transcripts. Information provided on the SIF indicated the appropriate date for the field workers to obtain the transcripts. Schools that were eligible for the HSTS 2000 but that had chosen not to participate in the 2000 NAEP assessment were contacted near the end of the school year.
Obtaining Course Catalogs, Sample Transcripts, and Other School-Level Information. Field workers requested sample materials for the HSTS when they first contacted a school and collected these materials when they visited the school for sampling. There were 261 schools that participated in NAEP and also participated in the HSTS (although 13 of these schools did not maintain the NAEP-HSTS links). There were also 16 schools from the original school sample that participated in the HSTS, but did not participate in NAEP. The sample materials included, preferably, a course catalog (a list of courses) offered for each of four consecutive years, from 1996-97 through 1999-2000; a completed School Information Form; and three sample transcripts, representing a “regular” student, one with honors courses, and one with special education courses. Since these materials were unique to each school, acquiring them before the collection of the actual transcripts enabled study staff to examine them and call a field worker or the school (i.e., before school personnel left for the summer) with any questions that arose during the school year.
The field worker gathered general information about class periods, credits, graduation
requirements, and other aspects of school policy. Sometimes this information was documented in the course catalog and at other times in a separate school policy document. The School Information Form (see User’s Guide) was completed by the field worker or a school staff member or sometimes by both. The completed SIF contained information about the school in general, about sources of information within the school (if needed to complete HSTS data collection), about the course description materials, about graduation requirements and grading practices at the school, and about the format of the school’s transcripts. The NAEP 2000 School Questionnaire also was collected from the schools. This questionnaire was completed by a school official and provided information about school, teacher, and home factors that might relate to student achievement.
Obtaining Transcripts. The HSTS 2000 used the NAEP sample for selecting schools and
students in NAEP-participating schools. For schools that participated in NAEP, the student sample was
A-11
recorded on the NAEP Administration Schedules. For schools that did not participate in NAEP, the field worker drew a sample of students at the school.
In originally nonparticipating NAEP schools, notification to the schools stated that the intent
was to select a sample of up to 50 students and to provide the same confidentiality safeguards with these samples as with all NAEP students. That is, student names would be removed from any papers that left the school. Field workers also emphasized that a school’s participation in the HSTS would not involve any student time.
Transcripts were requested for all students who were assessed, for sampled students who
were absent during assessment, and for the SD/LEP students who were sampled but excluded by the school from participating in the NAEP assessment.
Data Processing
A system was developed to handle all of the needs and requirements for entering, editing, and reviewing the transcript data. Components of the system included the Computer Assisted Data Entry (CADE) system and the Computer Assisted Coding and Editing (CACE) system. The system integrates all of the data entry activities allowing for concurrent users to process and review the data.
CADE System Component for Entering Transcript Data. The CADE system allowed for
entering student-level information (date of birth, date of graduation, type of diploma, etc.), data on any honors received, scores on standardized tests, and course data from the transcripts. Course data included course title, grade, credits received, year taken, and a number of “flags” or special features.
The CADE system checked each entry to verify that it was within an allowed range and
flagged the clerk when a problem occurred. Clerks entered data exactly as it appeared on the transcript, using the Transcript Format Checklist as a guide to look for specific needed information on transcripts from a given school. The checklist included students’ birth date, race/ethnicity and gender, SD/LEP status, graduation date, type of diploma awarded, details about an individual course, total number of credits received, and whether abbreviations or codes were used on the transcript.
All transcript data were 100 percent verified in the CADE system by a staff member other
than the one who initially entered the data. The verification portion of the CADE system is essentially a “re-do and match” process where data are re-entered (blind to the first entry), and the computer stops
A-12
when a nonmatch between the original data and the current data is encountered. Verifiers can then either accept the original entry or override it with the verified entry.
All fields were rekeyed except the course name field, test name field, and honors name field.
These three fields were displayed and reviewed by verifiers but were not key verified. As the three “name” fields were not used for any automated analyses and required the greatest number of key strokes to enter, it was felt that the most cost-effective use of resources was to perform a visual verification rather than a rekeying. In addition, allowing the verifier to see the name of the course, test, or honors being entered greatly simplified the task of ensuring that the verifier entered data in the same sequence as the original keyer.
CACE System for Coding and Editing Course Catalog. The Computer Aided Coding and
Editing (CACE) System is an ACCESS-database system specifically created for coding high school catalogs. It consists of two major components: (1) a component for selecting and entering the most appropriate Classification of Secondary School Courses (CSSC) code and “flags” for each course in a catalog, and (2) a component for matching each entry on a transcript with an entry in the corresponding school’s list of course offerings. The system also provided for data selection and entry, maintained file consistency, and produced output files suitable for further analysis and manipulation. CACE’s user interface was designed to reduce the likelihood of coding errors by encouraging selection from a list rather than key entry of data items.
Classification of Secondary School Courses. High school courses across the country vary
by content and level, even when the course title is similar. To compare transcripts from different schools and ensure that each course is uniquely identified, a common course coding system, the HSTS employed the Classification of Secondary School Courses (CSSC). The CSSC is a modification of the Classification of Instructional Programs (CIP) that is used for classifying college courses. Each course that appears on a student transcript is assigned a unique six-digit code based on the course content and level. Course catalogs and other materials from the participating schools are used to determine the content and level of courses at each school. The system is adaptable so that new or revised courses are easily incorporated. The use of the CSSC provides for the standardization of analysis across years for the NAEP HSTS studies.
The high school curriculum may change each year or every few years. New courses are
added, old courses are taken out of the curriculum, and some courses are combined with others to produce new courses. For every HSTS, the need arises to examine the list of CSSC codes and decide whether all the courses that were offered in that particular year have a matching CSSC code that can adequately
A-13
describe it. The CSSC was first developed in 1982 and has been updated with each NAEP HSTS study. In 1989, the CSSC was modified significantly to reflect the changes found in the breadth and types of courses taken by students in the 1987 HSTS. Most of the changes were the addition of special education courses. In 1994, 12 new CSSC codes were added to the list. In 1998, the computer science curriculum changed dramatically. New courses such as Web Design, Java Programming, and C++ Programming were added, courses that did not exist previously. Additionally, many courses that were labeled as honor courses in the past were reclassified as AP courses. Many IB (International Baccalaureate) courses were added as well. In all, a total of 83 new or revised codes were added to the CSSC in 1998. In 2000, two new or revised CSSC codes were added to the classification system, one in science and one in computer-related studies.
The CSSC code list now contains more than 2200 codes and descriptions of courses offered
by high schools nationwide. With this many codes, it is generally impractical to do analysis based upon individual codes. The HSTS 1987 developed a taxonomy used for its tabulations, with an emphasis on strictly limiting the content of “academic” courses to academic courses. This taxonomy used the Secondary School Taxonomy (SST) as its basis. The taxonomy divides high school coursework into three distinct curricula: Academic, Vocational, and Personal Enrichment/Other. Academic curricula include six course subjects: Mathematics, Science, English, Social Studies, Fine Arts, and Foreign Languages. Vocational curricula include three course subjects: Consumer and Homemaking Education, General Labor Market Preparation, and Specific Labor Market Preparation. Personal Enrichment/Other curricula include five course subjects: General Skills, Personal Health and Physical Education, Religion, Military Science, and All Other Courses. Over time, the HSTS added two additional course subjects to this taxonomy: Computer-related Studies (under Academic) and Special Education (under Personal Enrichment/Other).
The HSTS school course taxonomy was applied to data from the 1982 High School and
Beyond (HS&B) First Follow-up Study and the HSTS 1987 data. Both of these data sets were coded using the CSSC. The HSTS 1990 used a slightly expanded version of the same taxonomy in its reports. A major revision on the SST was made for the HSTS 1994, and there have been minor revisions since then. Changes over time in the design of the SST are applied to all previous HSTS in order to maintain valid comparisons over time.
Standardizing Credits and Grades. Since credit and grade information reported on
transcripts varied considerably among schools, districts, and states, it was necessary to standardize this information so that valid student- and school-level comparisons could be made. Standardized credit information was based on the Carnegie Unit, which was defined as the number of credits a student
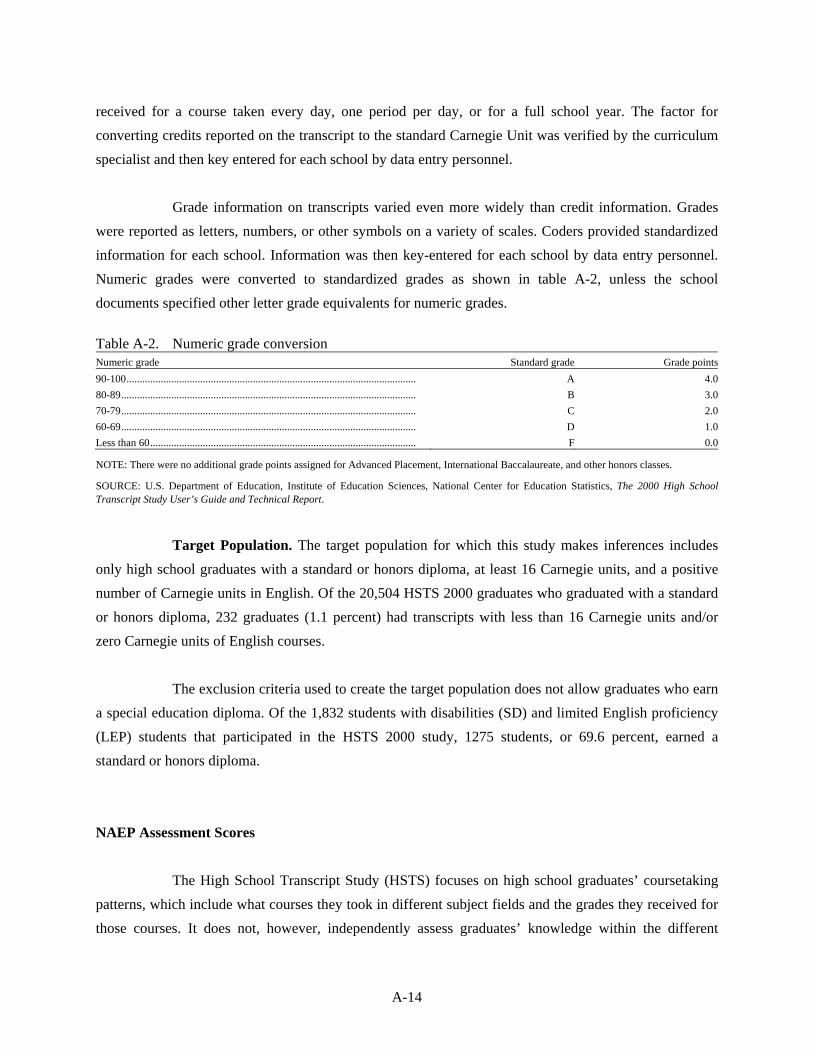
A-14
received for a course taken every day, one period per day, or for a full school year. The factor for converting credits reported on the transcript to the standard Carnegie Unit was verified by the curriculum specialist and then key entered for each school by data entry personnel.
Grade information on transcripts varied even more widely than credit information. Grades
were reported as letters, numbers, or other symbols on a variety of scales. Coders provided standardized information for each school. Information was then key-entered for each school by data entry personnel. Numeric grades were converted to standardized grades as shown in table A-2, unless the school documents specified other letter grade equivalents for numeric grades.
Table A-2. Numeric grade conversion Numeric grade Standard grade Grade points90-100.............................................................................................................. A 4.080-89................................................................................................................ B 3.070-79................................................................................................................ C 2.060-69................................................................................................................ D 1.0Less than 60..................................................................................................... F 0.0
NOTE: There were no additional grade points assigned for Advanced Placement, International Baccalaureate, and other honors classes.
SOURCE: U.S. Department of Education, Institute of Education Sciences, National Center for Education Statistics, The 2000 High School Transcript Study User’s Guide and Technical Report.
Target Population. The target population for which this study makes inferences includes
only high school graduates with a standard or honors diploma, at least 16 Carnegie units, and a positive number of Carnegie units in English. Of the 20,504 HSTS 2000 graduates who graduated with a standard or honors diploma, 232 graduates (1.1 percent) had transcripts with less than 16 Carnegie units and/or zero Carnegie units of English courses.
The exclusion criteria used to create the target population does not allow graduates who earn
a special education diploma. Of the 1,832 students with disabilities (SD) and limited English proficiency (LEP) students that participated in the HSTS 2000 study, 1275 students, or 69.6 percent, earned a standard or honors diploma.
NAEP Assessment Scores
The High School Transcript Study (HSTS) focuses on high school graduates’ coursetaking patterns, which include what courses they took in different subject fields and the grades they received for those courses. It does not, however, independently assess graduates’ knowledge within the different
A-15
subject fields. The National Assessment of Educational Progress (NAEP), also known as the Nation’s Report Card, measures educational achievement in various subject areas taught within the nation’s schools through ongoing and periodic assessments. Both the HSTS and NAEP education studies work in association with each other. The initial HSTS sample of schools comes from the sample of schools selected for the NAEP 12th grade assessment. By its design, then, the HSTS results can link with the NAEP assessment results. This link allows a comparison of student coursetaking patterns with their educational achievement in select course subjects, as measured by NAEP.
The irregular frequency of the HSTS transcript studies prevents the comparisons of HSTS
data with the NAEP national main mathematics and science assessments from previous years. The NAEP national main assessments associated with HSTS 1994 and HSTS 1998 covered neither mathematics nor science. A NAEP national main mathematics assessment occurred in 1990, but the design of HSTS 1990 linked HSTS with NAEP data at the school level, not at the student level. NCES also provides NAEP long-term trend assessments in mathematics and science as measures of educational progress over time. The HSTS works in association with the NAEP main assessments, however, and results from the main assessments and trend assessments are not comparable. More information about the NAEP long-term trend assessments can be found in NAEP 1999 Trends in Academic Progress: Three Decades of Student Performance (U.S. Department of Education 2000). For this report, the term “assessment scores” refers to scores from the NAEP national main assessments.
NAEP assessment results provide information about what students know within a given
subject. NAEP achievement levels provide information about what the students should know. The NAEP achievement levels measure how well students’ actual achievement matches the desired levels of achievement established by the National Assessment Governing Board (NAGB). There are three achievement levels for each subject and grade assessed by NAEP: Basic, Proficient, and Advanced. Their definitions follow:
Basic: A partial mastery of prerequisite knowledge and skills that are fundamental for
proficient work;
Proficient: A demonstrated competency of challenging subject matter, including subject-matter knowledge, application of such knowledge to real-world situations, and analytical skills appropriate to the subject matter; and
Advanced: Superior academic performance within the subject matter.
As provided by law, the achievement levels are to be used on a trial basis and should be interpreted and used with caution.

A-16
Each NAEP assessment uses a unique scale developed from item response theory (IRT). IRT is a set of statistical procedures that summarizes student performance across a collection of test exercises that require similar knowledge and skills. For the NAEP 12th-grade mathematics assessment, the scale ranges from a minimum of 0 to a maximum of 500. An assessment score of 288 indicates the student has a basic grasp of mathematical skills. A score of 336 indicates proficient mathematical knowledge, while a score of 367 indicates advanced mathematical knowledge. For the NAEP 12th-grade science assessment, the scale ranges from a minimum of 0 to a maximum of 300. An assessment score of 146 indicates the student has a basic grasp of scientific skills. A score of 178 indicates proficient scientific knowledge, while a score of 210 indicates advanced scientific knowledge.
The NAEP assessment results presented in this report reflect the findings from those HSTS
2000 students that met the criteria for analyses. These criteria included a standard or honors diploma, at least 16 earned course credits, and a positive number of earned English course credits. These results do not reflect the NAEP sample as a whole.
Weighting and Variance Estimation
The HSTS 2000 used a complex multistage sample design involving the sampling of certain subpopulations (SD/LEP, Black, and Hispanic students) at higher rates. Various estimation techniques (such as nonresponse and poststratification) were also employed to improve precision. To account for the differential sampling and the various weighting adjustments, each student was assigned a sampling weight for each population of analysis. Sampling weights are needed to make valid inferences from the student sample to the respective populations from which they were drawn.
Sampling weights are factors assigned to each transcript that are used in any aggregations of
transcript characteristics. Heuristically, these weights can be seen as being the number of students in the population that the sampled transcript “represents.” A transcript with a sampling weight of 100 represents 1 sampled student and 99 other nonsampled (or sampled but nonresponding) students in the population. A transcript with a sampling weight of 1 represents only the sampled student.
Two types of HSTS weights, HSTS sample weights and NAEP-linked weights, are needed
for these data. HSTS sample weights are designed for any aggregations, including all of the transcripts in the study, whether or not they correspond to assessed NAEP students. NAEP-linked weights are designed for any aggregations that only include transcripts from students who were in a particular NAEP assessment.
A-17
The HSTS Sample Weights
The HSTS sample weights reflect the probability sampling scheme used to arrive at the sample of students for whom transcripts were requested. The HSTS weights were constructed without regard to the NAEP participation or nonparticipation status of schools and students. The weights also reflect the impact of sample nonresponse at the school and the student level, and make adjustments for these groups to decrease the potential bias that might arise through differential nonresponse across population subgroups. Finally, improvements to the precision of weighted estimates result from the application of poststratification factors to the sample weights.
The HSTS NAEP-Linked Weights
The HSTS NAEP-linked weights allow users to analyze the relationship between students’ proficiencies, as measured by their NAEP assessment outcomes, and students’ coursetaking in their high school careers. Twelfth-grade students in these populations of analyses are those that participated in a given NAEP assessment, with a completed transcript, and graduated as determined by the HSTS. Four sets of NAEP-linked weights were computed separately, one for each assessment (mathematics and science) for each reporting population (accommodated and nonaccommodated).29 Each set of linked weights was computed separately using a weighting procedure similar to the HSTS sample weights as described above.
The students in the linked database requires a different set of sampling weights than those in
the HSTS database alone, as the set of students that qualify for these databases is a subset of the larger HSTS set. In particular, the school and student nonresponse adjustments will be larger for the linked weights than for the HSTS weights. This is so because a student or school had to participate in both the NAEP and the HSTS surveys to qualify as a “respondent” for the linked database. This reduced the number of school and student responses, thereby increasing the nonresponse adjustment factors.
29The nonaccommodated reporting population is the traditional NAEP reporting population that reflects the set of administration rules that do not
provide accommodations to SD/LEP students with special needs. The accommodated reporting population, which became the standard NAEP reporting population starting in 2002, reflects the set of administration rules that provide accommodations for certain SD/LEP students.
A-18
Variances
Student estimates based on the HSTS are subject to sampling error because they are derived from a sample, rather than the whole population. The variance is a measure of sampling error and, for the most part, determines the reliability of an estimate. Sampling variance indicates how much the population estimate for a given statistic is likely to change if had been based on another, equivalent, sample of individuals drawn in exactly the same manner as the achieved sample. Since the HSTS used a complex sample design with multistage sampling and unequal selection probabilities along with complex weighting procedures, standard textbook formulas cannot be used for estimating variances. Instead variances were estimated using jackknife replication methods.
As with any replication method, jackknife replication involves constructing a number of
subsamples (replicates) from the full sample and computing the statistic of interest for each replicate. The mean square error of the replicate estimates around the full sample estimate provides an estimate of the variances of the statistics. To construct the replicates, 62 stratified subsamples of the full sample were created and then dropped one at a time to define 62 jackknife replicates. A computer program (WesVar4.0) was used to calculate the estimates of standard errors. WesVar4.0 is a stand-alone Windows application that computes sampling errors for a wide variety of statistics (totals, percents, ratios, log-odds ratios, general functions of estimates in tables, linear regression parameters, and logistic regression parameters).
Test Statistics
The test statistics used in the analysis were calculated using the jackknife variances and thus appropriately reflected the complex nature of the sample design. Bonferroni adjustments were made to control for multiple comparisons where appropriate. For example, for an “experiment-wise” comparison involving g pairwise comparisons, each difference was tested at the 0.05/g significance level to control for the fact that g differences were simultaneously tested. The Bonferroni adjustment results in a more conservative critical value being used when judging statistical significance. This means that a comparison that would have been significant with a critical value of 1.96 may not be significant with the more conservative critical value. For example, the critical value for comparisons between any two of the four categories of region is 2.64, rather than 1.96, which would be used for two categories. This means that there must be a larger difference between the estimates when there are multiple pairs of comparisons for there to be a statistically significant difference.
A-19
Another statistical measure used in the report (chapter 4) was the correlation, which is used to describe the relationship between two variables. Positive correlation values imply that as one variable increases or decreases, the other variable also increases or decreases. Negative correlation values imply that as one variable increases, the other variable decreases, and vice versa. Correlation values range from negative one (-1) to one (1), with a zero (0) value implying no relationship between the variables, and the values of one implying a perfect linear relationship between the variables. This report uses the Cohen effect size scale30 to interpret the statistical power of the correlation values. Within that scale, values of 0.1 or -0.1 indicate at least a small correlation. Values of 0.3 or -0.3 indicate at least a medium correlation, and values of 0.5 or -0.5 indicate a large correlation.
Description of Previous High School Transcript Studies
1998 High School Transcript Study. The HSTS 1998 was conducted with a nationally representative sample of students and schools, which included 24,904 students graduating in 1998 from 264 American high schools. In the summer and fall of 1998, Westat collected high school transcripts for students who graduated from public and nonpublic high schools that were sampled for the 1998 National Assessment of Educational Progress (NAEP). The sample of schools is nationally representative of all schools teaching grade 12 in the United States, and the sample of students is representative of graduating seniors from each school. While the NAEP sample includes students who were enrolled in the 12th grade at the time of the NAEP sampling, the transcript study included only those students whose transcripts indicate that they graduated between January 1, 1998 and November 21, 1998, the date the final transcripts were collected. Approximately 94 percent of the sampled students in the transcript study come from schools that participated in NAEP and retain student ID linking information. The remaining students were sampled specifically for the HSTS either because their schools did not agree to participate in the NAEP study, or because the schools participated in NAEP but did not retain their administration materials linking student identification numbers to student names.
To be consistent with other published analyses, Westat included only students with regular
diplomas or honors diplomas and excluded students with special education diplomas, certificates of completion, or certificates of attendance. Westat also excluded students whose transcripts showed no Carnegie units in English courses or fewer than 16 total Carnegie units. These restrictions reduced the number of 1998 graduates represented in the published analyses to 24,206 graduates.
30Cohen, Jacob. Statistical Power Analysis for the Behavioral Sciences, 2nd edition. Hillsdale, NJ: L. Erlbaum Associates, 1988.
A-20
1994 High School Transcript Study. Between May and November 1994, Westat collected high school transcripts from 25,364 students who graduated from high school in 1994. To be consistent with other published analyses, Westat included only students with regular diplomas or honors diplomas and excluded students with special education diplomas or certificates of attendance. Westat also excluded students whose transcripts showed no Carnegie units in English or fewer than 16 total Carnegie units. These restrictions reduced the number of 1994 graduates represented in the published analyses to 25,082 graduates. These students attended 340 schools that had previously been sampled for NAEP 1994. The sample of schools was nationally representative of schools teaching grade 12 (380 schools were selected for the sample; one school had no 12th-grade students). The sample of students was representative of graduating seniors from each school. Approximately 90 percent of the sampled students had participated in NAEP assessments in 1994. The remaining students attended schools that did not participate in NAEP or that did not retain the lists linking student names to NAEP identification numbers.
1990 High School Transcript Study. In the spring of 1991, Westat collected high school
transcripts from 21,435 students who graduated from high school in 1990. Of these students, 21,145 students received regular or honors diplomas, earned at least 16 Carnegie units of course credits, and had at least some English Carnegie units. They attended 330 schools that had previously been sampled for NAEP. The sample of schools was nationally representative of schools teaching grade 12 (379 schools were selected for the sample; eight schools had no 12th-grade students). The sample of students was representative of graduating seniors from each school. Approximately three-fourths of the sampled students had participated in NAEP assessments in 1990. The remaining students attended schools that did not participate in NAEP or did not retain the lists linking student names to NAEP IDs.
Student and School Characteristics
Table A-3 lists the percentage distribution of high school graduates in the years 1990, 1994, 1998, and 2000 by various student and school characteristics. These characteristics include gender, race/ethnicity, school type (public or nonpublic school), and region of the country.
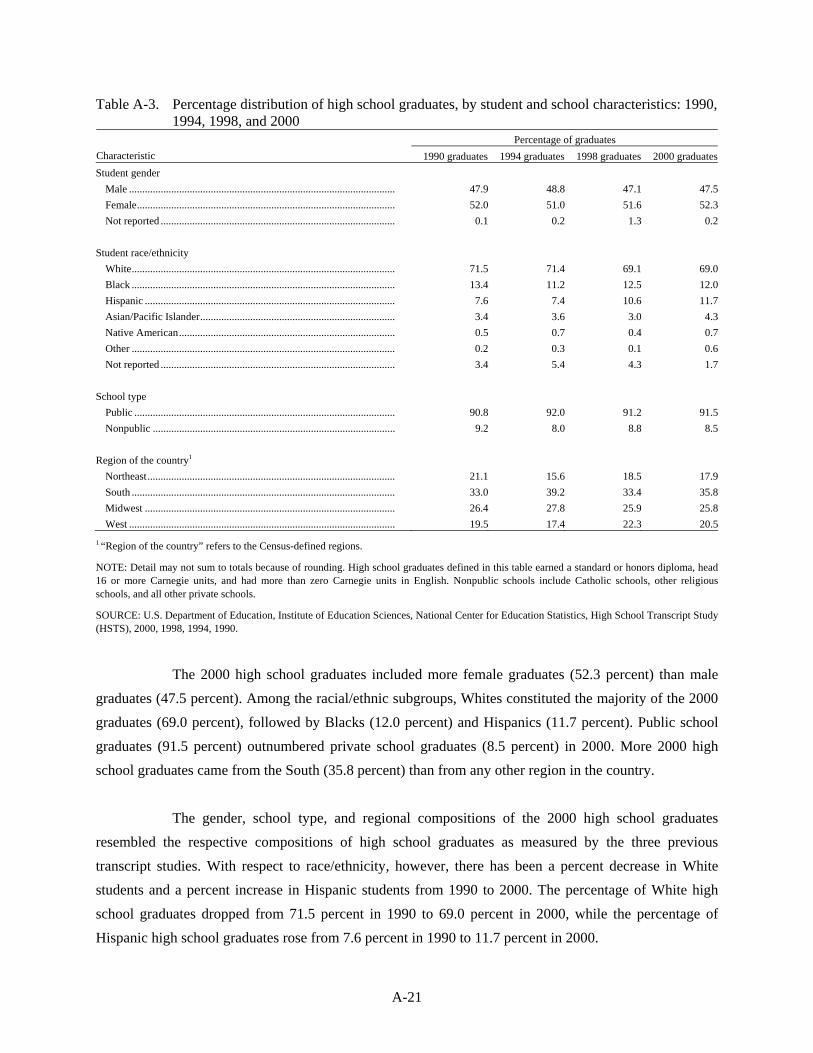
A-21
Table A-3. Percentage distribution of high school graduates, by student and school characteristics: 1990, 1994, 1998, and 2000
Percentage of graduates Characteristic 1990 graduates 1994 graduates 1998 graduates 2000 graduatesStudent gender Male ..................................................................................................... 47.9 48.8 47.1 47.5 Female.................................................................................................. 52.0 51.0 51.6 52.3 Not reported ......................................................................................... 0.1 0.2 1.3 0.2 Student race/ethnicity White.................................................................................................... 71.5 71.4 69.1 69.0 Black .................................................................................................... 13.4 11.2 12.5 12.0 Hispanic ............................................................................................... 7.6 7.4 10.6 11.7 Asian/Pacific Islander.......................................................................... 3.4 3.6 3.0 4.3 Native American.................................................................................. 0.5 0.7 0.4 0.7 Other .................................................................................................... 0.2 0.3 0.1 0.6 Not reported ......................................................................................... 3.4 5.4 4.3 1.7 School type Public ................................................................................................... 90.8 92.0 91.2 91.5 Nonpublic ............................................................................................ 9.2 8.0 8.8 8.5 Region of the country1 Northeast.............................................................................................. 21.1 15.6 18.5 17.9 South .................................................................................................... 33.0 39.2 33.4 35.8 Midwest ............................................................................................... 26.4 27.8 25.9 25.8 West ..................................................................................................... 19.5 17.4 22.3 20.51 “Region of the country” refers to the Census-defined regions.
NOTE: Detail may not sum to totals because of rounding. High school graduates defined in this table earned a standard or honors diploma, head 16 or more Carnegie units, and had more than zero Carnegie units in English. Nonpublic schools include Catholic schools, other religious schools, and all other private schools.
SOURCE: U.S. Department of Education, Institute of Education Sciences, National Center for Education Statistics, High School Transcript Study (HSTS), 2000, 1998, 1994, 1990.
The 2000 high school graduates included more female graduates (52.3 percent) than male
graduates (47.5 percent). Among the racial/ethnic subgroups, Whites constituted the majority of the 2000 graduates (69.0 percent), followed by Blacks (12.0 percent) and Hispanics (11.7 percent). Public school graduates (91.5 percent) outnumbered private school graduates (8.5 percent) in 2000. More 2000 high school graduates came from the South (35.8 percent) than from any other region in the country.
The gender, school type, and regional compositions of the 2000 high school graduates
resembled the respective compositions of high school graduates as measured by the three previous transcript studies. With respect to race/ethnicity, however, there has been a percent decrease in White students and a percent increase in Hispanic students from 1990 to 2000. The percentage of White high school graduates dropped from 71.5 percent in 1990 to 69.0 percent in 2000, while the percentage of Hispanic high school graduates rose from 7.6 percent in 1990 to 11.7 percent in 2000.
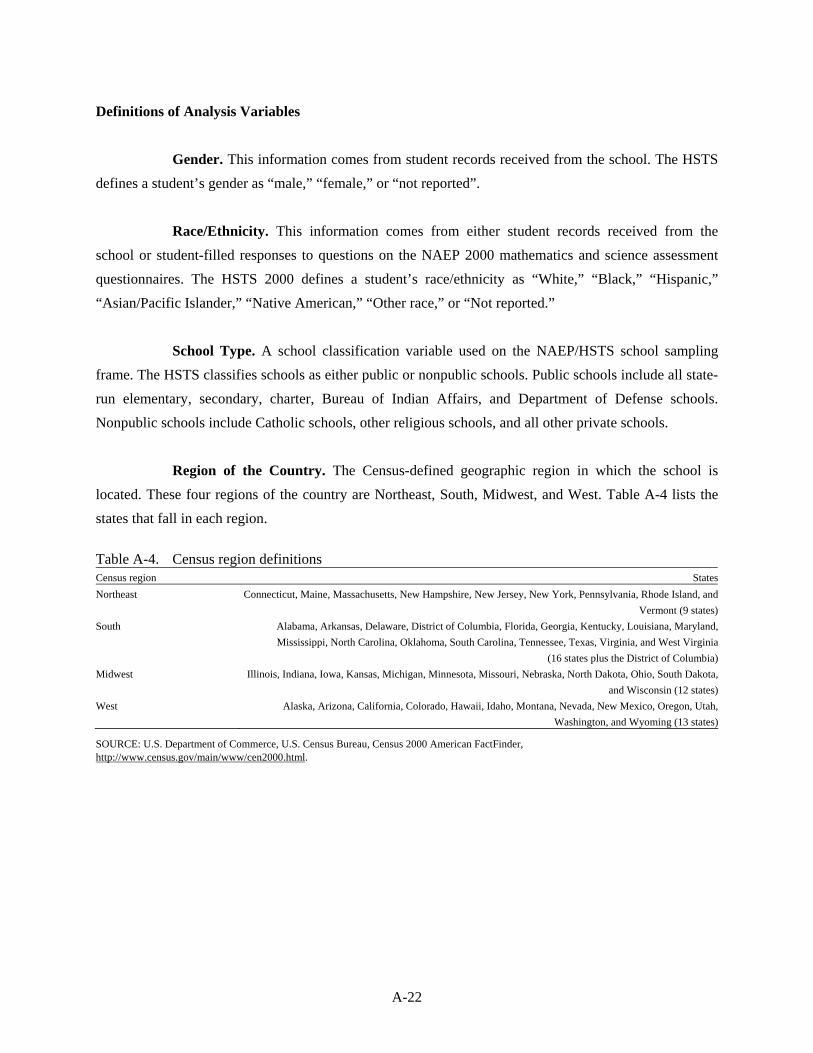
A-22
Definitions of Analysis Variables
Gender. This information comes from student records received from the school. The HSTS defines a student’s gender as “male,” “female,” or “not reported”.
Race/Ethnicity. This information comes from either student records received from the
school or student-filled responses to questions on the NAEP 2000 mathematics and science assessment questionnaires. The HSTS 2000 defines a student’s race/ethnicity as “White,” “Black,” “Hispanic,” “Asian/Pacific Islander,” “Native American,” “Other race,” or “Not reported.”
School Type. A school classification variable used on the NAEP/HSTS school sampling
frame. The HSTS classifies schools as either public or nonpublic schools. Public schools include all state-run elementary, secondary, charter, Bureau of Indian Affairs, and Department of Defense schools. Nonpublic schools include Catholic schools, other religious schools, and all other private schools.
Region of the Country. The Census-defined geographic region in which the school is
located. These four regions of the country are Northeast, South, Midwest, and West. Table A-4 lists the states that fall in each region.
Table A-4. Census region definitions Census region StatesNortheast Connecticut, Maine, Massachusetts, New Hampshire, New Jersey, New York, Pennsylvania, Rhode Island, and
Vermont (9 states)South Alabama, Arkansas, Delaware, District of Columbia, Florida, Georgia, Kentucky, Louisiana, Maryland,
Mississippi, North Carolina, Oklahoma, South Carolina, Tennessee, Texas, Virginia, and West Virginia(16 states plus the District of Columbia)
Midwest Illinois, Indiana, Iowa, Kansas, Michigan, Minnesota, Missouri, Nebraska, North Dakota, Ohio, South Dakota,and Wisconsin (12 states)
West Alaska, Arizona, California, Colorado, Hawaii, Idaho, Montana, Nevada, New Mexico, Oregon, Utah, Washington, and Wyoming (13 states)
SOURCE: U.S. Department of Commerce, U.S. Census Bureau, Census 2000 American FactFinder, http://www.census.gov/main/www/cen2000.html.

B-1
Appendix B
Analysis Tables
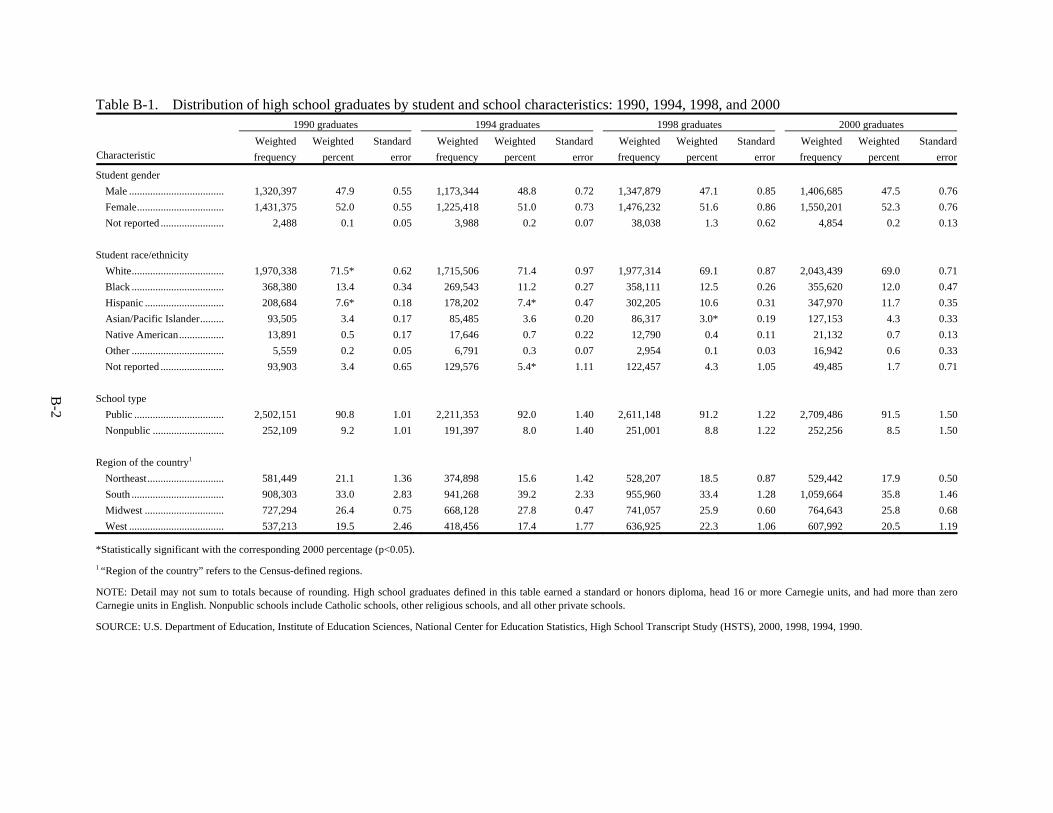
B-2
Table B-1. Distribution of high school graduates by student and school characteristics: 1990, 1994, 1998, and 2000 1990 graduates 1994 graduates 1998 graduates 2000 graduates
Characteristic Weighted frequency
Weighted percent
Standard error
Weighted frequency
Weighted percent
Standard error
Weighted frequency
Weighted percent
Standard error
Weighted frequency
Weighted percent
Standard error
Student gender Male .................................... 1,320,397 47.9 0.55 1,173,344 48.8 0.72 1,347,879 47.1 0.85 1,406,685 47.5 0.76 Female................................. 1,431,375 52.0 0.55 1,225,418 51.0 0.73 1,476,232 51.6 0.86 1,550,201 52.3 0.76 Not reported ........................ 2,488 0.1 0.05 3,988 0.2 0.07 38,038 1.3 0.62 4,854 0.2 0.13 Student race/ethnicity White................................... 1,970,338 71.5* 0.62 1,715,506 71.4 0.97 1,977,314 69.1 0.87 2,043,439 69.0 0.71 Black ................................... 368,380 13.4 0.34 269,543 11.2 0.27 358,111 12.5 0.26 355,620 12.0 0.47 Hispanic .............................. 208,684 7.6* 0.18 178,202 7.4* 0.47 302,205 10.6 0.31 347,970 11.7 0.35 Asian/Pacific Islander......... 93,505 3.4 0.17 85,485 3.6 0.20 86,317 3.0* 0.19 127,153 4.3 0.33 Native American................. 13,891 0.5 0.17 17,646 0.7 0.22 12,790 0.4 0.11 21,132 0.7 0.13 Other ................................... 5,559 0.2 0.05 6,791 0.3 0.07 2,954 0.1 0.03 16,942 0.6 0.33 Not reported ........................ 93,903 3.4 0.65 129,576 5.4* 1.11 122,457 4.3 1.05 49,485 1.7 0.71 School type Public .................................. 2,502,151 90.8 1.01 2,211,353 92.0 1.40 2,611,148 91.2 1.22 2,709,486 91.5 1.50 Nonpublic ........................... 252,109 9.2 1.01 191,397 8.0 1.40 251,001 8.8 1.22 252,256 8.5 1.50 Region of the country1 Northeast............................. 581,449 21.1 1.36 374,898 15.6 1.42 528,207 18.5 0.87 529,442 17.9 0.50 South ................................... 908,303 33.0 2.83 941,268 39.2 2.33 955,960 33.4 1.28 1,059,664 35.8 1.46 Midwest .............................. 727,294 26.4 0.75 668,128 27.8 0.47 741,057 25.9 0.60 764,643 25.8 0.68 West .................................... 537,213 19.5 2.46 418,456 17.4 1.77 636,925 22.3 1.06 607,992 20.5 1.19
*Statistically significant with the corresponding 2000 percentage (p<0.05). 1 “Region of the country” refers to the Census-defined regions.
NOTE: Detail may not sum to totals because of rounding. High school graduates defined in this table earned a standard or honors diploma, head 16 or more Carnegie units, and had more than zero Carnegie units in English. Nonpublic schools include Catholic schools, other religious schools, and all other private schools.
SOURCE: U.S. Department of Education, Institute of Education Sciences, National Center for Education Statistics, High School Transcript Study (HSTS), 2000, 1998, 1994, 1990.

B-3
Table B-2. Distribution of high school graduates’ earned course credits (Carnegie units) by student and school characteristics: 1990, 1994, 1998, and 2000
Earned course credits 1990 graduates 1994 graduates 1998 graduates 2000 graduates
Characteristic Mean Standard
error MeanStandard
error MeanStandard
error MeanStandard
error
All graduates ...................... 23.6* 0.12 24.3* 0.14 25.3* 0.17 26.2 0.20 Student gender Male ................................ 23.4* 0.12 24.2* 0.16 25.1* 0.18 26.0 0.21 Female............................. 23.8* 0.13 24.4* 0.14 25.4* 0.17 26.3 0.21 Student race/ethnicity White............................... 23.7* 0.12 24.5* 0.17 25.3* 0.17 26.3 0.26 Black ............................... 23.5* 0.24 23.7* 0.13 24.8* 0.25 25.9 0.23 Hispanic .......................... 24.0* 0.20 24.2* 0.12 25.3 0.25 25.7 0.34 Asian/Pacific Islander..... 24.2* 0.22 24.8* 0.19 25.5 0.24 26.2 0.32 School type Public .............................. 23.5* 0.13 24.2* 0.14 25.2* 0.16 26.2 0.20 Nonpublic ....................... 24.7* 0.32 25.9 0.64 26.4 0.61 26.4 0.58 Region of the country1 Northeast......................... 24.4* 0.20 25.6 0.34 25.6 0.47 26.4 0.34 South ............................... 23.7* 0.25 24.2* 0.14 26.1 0.27 26.7 0.44 Midwest .......................... 22.8* 0.20 23.8* 0.41 24.2* 0.30 26.0 0.41 West ................................ 23.9* 0.19 24.2* 0.21 25.1 0.29 25.3 0.26
*Statistically significant with the corresponding 2000 mean (p<0.05). 1 “Region of the country” refers to the Census-defined regions.
NOTE: “Course credits” refer to standardized Carnegie units. Nonpublic schools include Catholic schools, other religious schools, and all other private schools.
SOURCE: U.S. Department of Education, Institute of Education Sciences, National Center for Education Statistics, High School Transcript Study (HSTS), 2000, 1998, 1994, 1990.
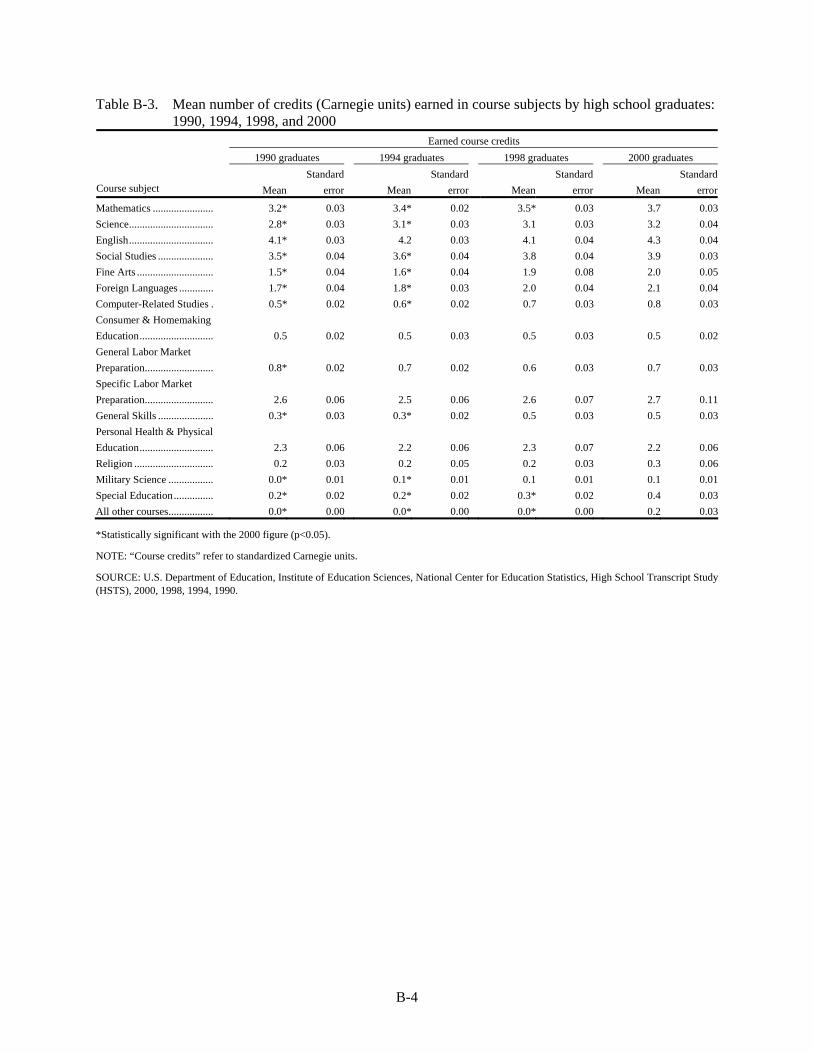
B-4
Table B-3. Mean number of credits (Carnegie units) earned in course subjects by high school graduates: 1990, 1994, 1998, and 2000
Earned course credits 1990 graduates 1994 graduates 1998 graduates 2000 graduates
Course subject Mean Standard
error MeanStandard
error MeanStandard
error MeanStandard
error
Mathematics ....................... 3.2* 0.03 3.4* 0.02 3.5* 0.03 3.7 0.03Science................................ 2.8* 0.03 3.1* 0.03 3.1 0.03 3.2 0.04English................................ 4.1* 0.03 4.2 0.03 4.1 0.04 4.3 0.04Social Studies ..................... 3.5* 0.04 3.6* 0.04 3.8 0.04 3.9 0.03Fine Arts ............................. 1.5* 0.04 1.6* 0.04 1.9 0.08 2.0 0.05Foreign Languages ............. 1.7* 0.04 1.8* 0.03 2.0 0.04 2.1 0.04Computer-Related Studies . 0.5* 0.02 0.6* 0.02 0.7 0.03 0.8 0.03Consumer & Homemaking Education............................ 0.5 0.02 0.5 0.03 0.5 0.03 0.5 0.02General Labor Market Preparation.......................... 0.8* 0.02 0.7 0.02 0.6 0.03 0.7 0.03Specific Labor Market Preparation.......................... 2.6 0.06 2.5 0.06 2.6 0.07 2.7 0.11General Skills ..................... 0.3* 0.03 0.3* 0.02 0.5 0.03 0.5 0.03Personal Health & Physical Education............................ 2.3 0.06 2.2 0.06 2.3 0.07 2.2 0.06Religion .............................. 0.2 0.03 0.2 0.05 0.2 0.03 0.3 0.06Military Science ................. 0.0* 0.01 0.1* 0.01 0.1 0.01 0.1 0.01Special Education............... 0.2* 0.02 0.2* 0.02 0.3* 0.02 0.4 0.03All other courses................. 0.0* 0.00 0.0* 0.00 0.0* 0.00 0.2 0.03
*Statistically significant with the 2000 figure (p<0.05).
NOTE: “Course credits” refer to standardized Carnegie units.
SOURCE: U.S. Department of Education, Institute of Education Sciences, National Center for Education Statistics, High School Transcript Study (HSTS), 2000, 1998, 1994, 1990.

B-5
Table B-4. Distribution of high school graduates’ grade point average by student and school characteristics: 1990, 1994, 1998, and 2000
Grade point average 1990 graduates 1994 graduates 1998 graduates 2000 graduates
Characteristic Mean Standard
error MeanStandard
error MeanStandard
error MeanStandard
error
All graduates ...................... 2.68* 0.012 2.79* 0.013 2.90 0.018 2.94 0.013 Student gender Male ................................ 2.59* 0.015 2.68* 0.014 2.79 0.019 2.83 0.016 Female............................. 2.77* 0.012 2.90* 0.014 3.00 0.019 3.05 0.014 Student race/ethnicity White............................... 2.73* 0.013 2.84* 0.014 2.97 0.019 3.01 0.015 Black ............................... 2.43* 0.020 2.47* 0.023 2.60 0.031 2.63 0.014 Hispanic .......................... 2.60* 0.023 2.70 0.042 2.75 0.043 2.80 0.042 Asian/Pacific Islander..... 2.88* 0.083 3.01* 0.056 3.06 0.061 3.20 0.031 School type Public .............................. 2.68* 0.012 2.79* 0.013 2.88 0.018 2.92 0.015 Nonpublic ....................... 2.74* 0.035 2.80* 0.062 3.08 0.066 3.16 0.039 Region of the country1 Northeast......................... 2.64* 0.037 2.66 0.043 2.74 0.044 2.81 0.051 South ............................... 2.69* 0.027 2.80* 0.025 2.93 0.032 2.96 0.020 Midwest .......................... 2.64* 0.017 2.78* 0.021 2.91 0.034 2.97 0.023 West ................................ 2.77* 0.027 2.90* 0.020 2.97 0.035 2.99 0.022
*Statistically significant with the corresponding 2000 mean (p<0.05). 1 “Region of the country” refers to the Census-defined regions.
NOTE: Nonpublic schools include Catholic schools, other religious schools, and all other private schools.
SOURCE: U.S. Department of Education, Institute of Education Sciences, National Center for Education Statistics, High School Transcript Study (HSTS), 2000, 1998, 1994, 1990.
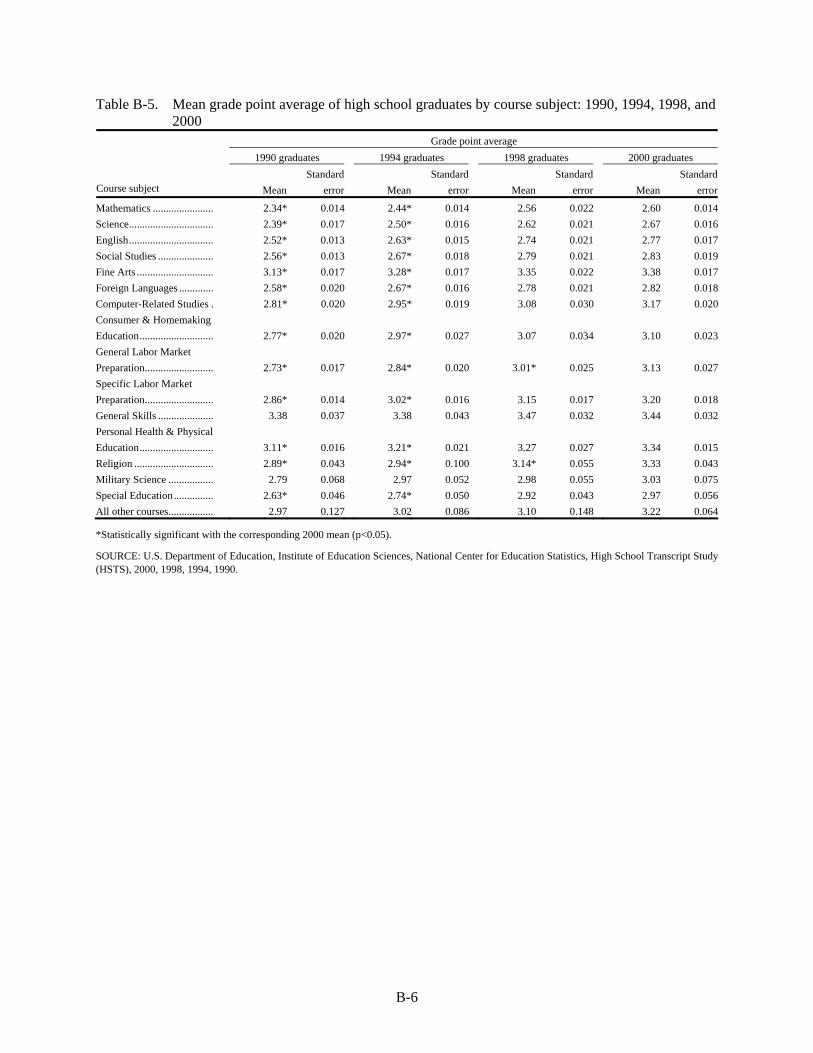
B-6
Table B-5. Mean grade point average of high school graduates by course subject: 1990, 1994, 1998, and 2000
Grade point average 1990 graduates 1994 graduates 1998 graduates 2000 graduates
Course subject Mean Standard
error MeanStandard
error MeanStandard
error MeanStandard
error
Mathematics ....................... 2.34* 0.014 2.44* 0.014 2.56 0.022 2.60 0.014Science................................ 2.39* 0.017 2.50* 0.016 2.62 0.021 2.67 0.016English................................ 2.52* 0.013 2.63* 0.015 2.74 0.021 2.77 0.017Social Studies ..................... 2.56* 0.013 2.67* 0.018 2.79 0.021 2.83 0.019Fine Arts ............................. 3.13* 0.017 3.28* 0.017 3.35 0.022 3.38 0.017Foreign Languages ............. 2.58* 0.020 2.67* 0.016 2.78 0.021 2.82 0.018Computer-Related Studies . 2.81* 0.020 2.95* 0.019 3.08 0.030 3.17 0.020Consumer & Homemaking Education............................ 2.77* 0.020 2.97* 0.027 3.07 0.034 3.10 0.023General Labor Market Preparation.......................... 2.73* 0.017 2.84* 0.020 3.01* 0.025 3.13 0.027Specific Labor Market Preparation.......................... 2.86* 0.014 3.02* 0.016 3.15 0.017 3.20 0.018General Skills ..................... 3.38 0.037 3.38 0.043 3.47 0.032 3.44 0.032Personal Health & Physical Education............................ 3.11* 0.016 3.21* 0.021 3.27 0.027 3.34 0.015Religion .............................. 2.89* 0.043 2.94* 0.100 3.14* 0.055 3.33 0.043Military Science ................. 2.79 0.068 2.97 0.052 2.98 0.055 3.03 0.075Special Education............... 2.63* 0.046 2.74* 0.050 2.92 0.043 2.97 0.056All other courses................. 2.97 0.127 3.02 0.086 3.10 0.148 3.22 0.064
*Statistically significant with the corresponding 2000 mean (p<0.05).
SOURCE: U.S. Department of Education, Institute of Education Sciences, National Center for Education Statistics, High School Transcript Study (HSTS), 2000, 1998, 1994, 1990.
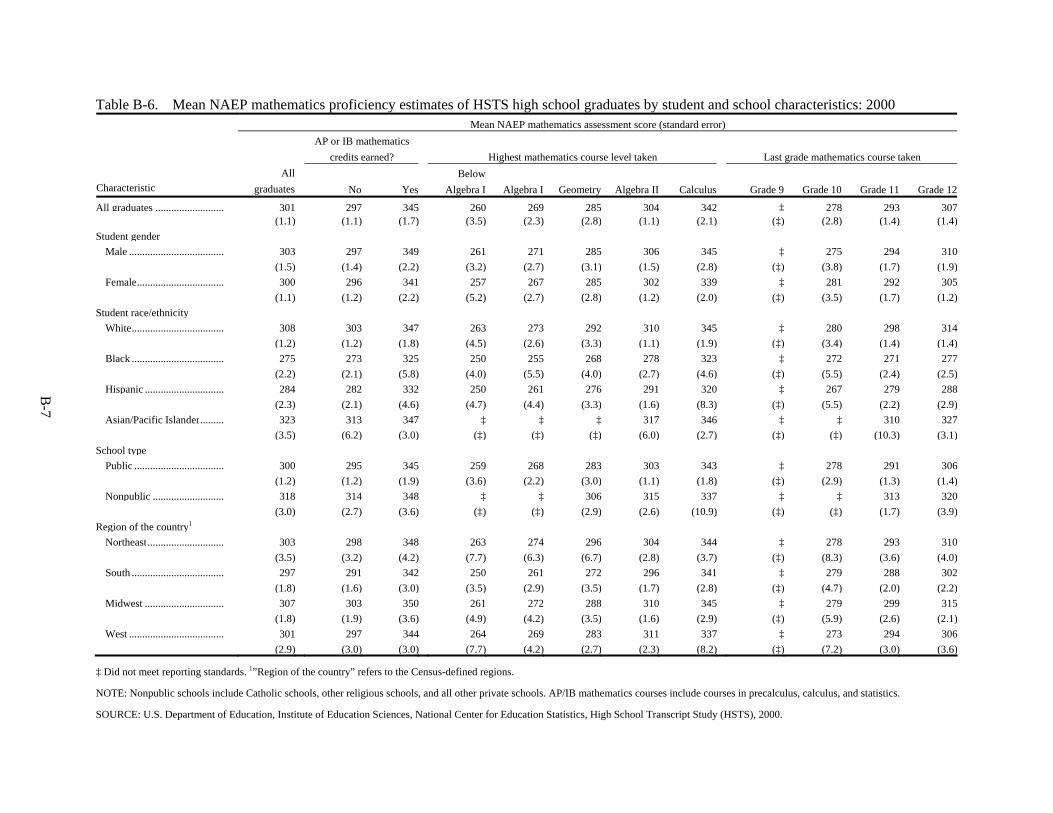
B-7
Table B-6. Mean NAEP mathematics proficiency estimates of HSTS high school graduates by student and school characteristics: 2000 Mean NAEP mathematics assessment score (standard error)
AP or IB mathematics
credits earned? Highest mathematics course level taken Last grade mathematics course taken
Characteristic All
graduates
No YesBelow
Algebra I Algebra I Geometry Algebra II Calculus Grade 9 Grade 10 Grade 11 Grade 12
All graduates .......................... 301 297 345 260 269 285 304 342 ‡ 278 293 307 (1.1) (1.1) (1.7) (3.5) (2.3) (2.8) (1.1) (2.1) (‡) (2.8) (1.4) (1.4)Student gender Male .................................... 303 297 349 261 271 285 306 345 ‡ 275 294 310 (1.5) (1.4) (2.2) (3.2) (2.7) (3.1) (1.5) (2.8) (‡) (3.8) (1.7) (1.9) Female................................. 300 296 341 257 267 285 302 339 ‡ 281 292 305 (1.1) (1.2) (2.2) (5.2) (2.7) (2.8) (1.2) (2.0) (‡) (3.5) (1.7) (1.2)Student race/ethnicity White................................... 308 303 347 263 273 292 310 345 ‡ 280 298 314 (1.2) (1.2) (1.8) (4.5) (2.6) (3.3) (1.1) (1.9) (‡) (3.4) (1.4) (1.4) Black ................................... 275 273 325 250 255 268 278 323 ‡ 272 271 277 (2.2) (2.1) (5.8) (4.0) (5.5) (4.0) (2.7) (4.6) (‡) (5.5) (2.4) (2.5) Hispanic .............................. 284 282 332 250 261 276 291 320 ‡ 267 279 288 (2.3) (2.1) (4.6) (4.7) (4.4) (3.3) (1.6) (8.3) (‡) (5.5) (2.2) (2.9) Asian/Pacific Islander......... 323 313 347 ‡ ‡ ‡ 317 346 ‡ ‡ 310 327 (3.5) (6.2) (3.0) (‡) (‡) (‡) (6.0) (2.7) (‡) (‡) (10.3) (3.1)School type Public .................................. 300 295 345 259 268 283 303 343 ‡ 278 291 306 (1.2) (1.2) (1.9) (3.6) (2.2) (3.0) (1.1) (1.8) (‡) (2.9) (1.3) (1.4) Nonpublic ........................... 318 314 348 ‡ ‡ 306 315 337 ‡ ‡ 313 320 (3.0) (2.7) (3.6) (‡) (‡) (2.9) (2.6) (10.9) (‡) (‡) (1.7) (3.9)Region of the country1 Northeast............................. 303 298 348 263 274 296 304 344 ‡ 278 293 310 (3.5) (3.2) (4.2) (7.7) (6.3) (6.7) (2.8) (3.7) (‡) (8.3) (3.6) (4.0) South ................................... 297 291 342 250 261 272 296 341 ‡ 279 288 302 (1.8) (1.6) (3.0) (3.5) (2.9) (3.5) (1.7) (2.8) (‡) (4.7) (2.0) (2.2) Midwest .............................. 307 303 350 261 272 288 310 345 ‡ 279 299 315 (1.8) (1.9) (3.6) (4.9) (4.2) (3.5) (1.6) (2.9) (‡) (5.9) (2.6) (2.1) West .................................... 301 297 344 264 269 283 311 337 ‡ 273 294 306 (2.9) (3.0) (3.0) (7.7) (4.2) (2.7) (2.3) (8.2) (‡) (7.2) (3.0) (3.6)
‡ Did not meet reporting standards. 1”Region of the country” refers to the Census-defined regions.
NOTE: Nonpublic schools include Catholic schools, other religious schools, and all other private schools. AP/IB mathematics courses include courses in precalculus, calculus, and statistics.
SOURCE: U.S. Department of Education, Institute of Education Sciences, National Center for Education Statistics, High School Transcript Study (HSTS), 2000.
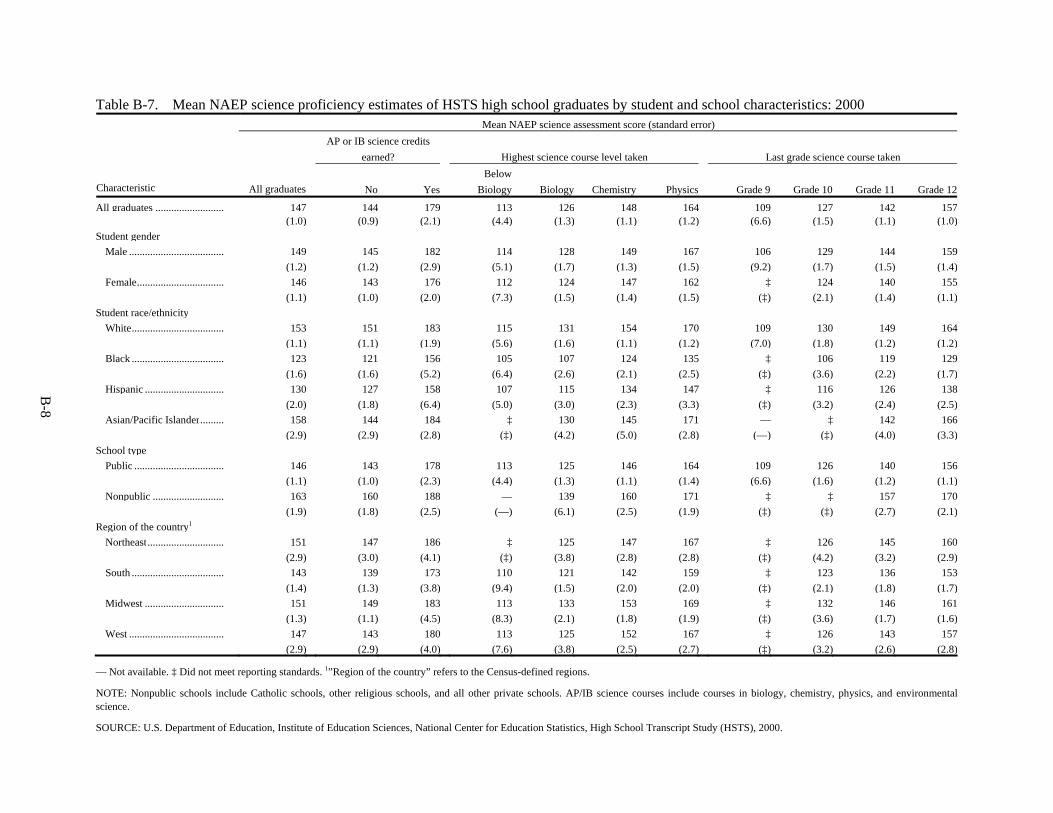
B-8
Table B-7. Mean NAEP science proficiency estimates of HSTS high school graduates by student and school characteristics: 2000 Mean NAEP science assessment score (standard error)
AP or IB science credits
earned?
Highest science course level taken
Last grade science course taken
Characteristic All graduates
No YesBelow
Biology Biology Chemistry Physics Grade 9 Grade 10 Grade 11 Grade 12
All graduates .......................... 147 144 179 113 126 148 164 109 127 142 157 (1.0) (0.9) (2.1) (4.4) (1.3) (1.1) (1.2) (6.6) (1.5) (1.1) (1.0)Student gender Male .................................... 149 145 182 114 128 149 167 106 129 144 159 (1.2) (1.2) (2.9) (5.1) (1.7) (1.3) (1.5) (9.2) (1.7) (1.5) (1.4) Female................................. 146 143 176 112 124 147 162 ‡ 124 140 155 (1.1) (1.0) (2.0) (7.3) (1.5) (1.4) (1.5) (‡) (2.1) (1.4) (1.1)Student race/ethnicity White................................... 153 151 183 115 131 154 170 109 130 149 164 (1.1) (1.1) (1.9) (5.6) (1.6) (1.1) (1.2) (7.0) (1.8) (1.2) (1.2) Black ................................... 123 121 156 105 107 124 135 ‡ 106 119 129 (1.6) (1.6) (5.2) (6.4) (2.6) (2.1) (2.5) (‡) (3.6) (2.2) (1.7) Hispanic .............................. 130 127 158 107 115 134 147 ‡ 116 126 138 (2.0) (1.8) (6.4) (5.0) (3.0) (2.3) (3.3) (‡) (3.2) (2.4) (2.5) Asian/Pacific Islander......... 158 144 184 ‡ 130 145 171 — ‡ 142 166 (2.9) (2.9) (2.8) (‡) (4.2) (5.0) (2.8) (—) (‡) (4.0) (3.3)School type Public .................................. 146 143 178 113 125 146 164 109 126 140 156 (1.1) (1.0) (2.3) (4.4) (1.3) (1.1) (1.4) (6.6) (1.6) (1.2) (1.1) Nonpublic ........................... 163 160 188 — 139 160 171 ‡ ‡ 157 170 (1.9) (1.8) (2.5) (—) (6.1) (2.5) (1.9) (‡) (‡) (2.7) (2.1)Region of the country1 Northeast............................. 151 147 186 ‡ 125 147 167 ‡ 126 145 160 (2.9) (3.0) (4.1) (‡) (3.8) (2.8) (2.8) (‡) (4.2) (3.2) (2.9) South ................................... 143 139 173 110 121 142 159 ‡ 123 136 153 (1.4) (1.3) (3.8) (9.4) (1.5) (2.0) (2.0) (‡) (2.1) (1.8) (1.7) Midwest .............................. 151 149 183 113 133 153 169 ‡ 132 146 161 (1.3) (1.1) (4.5) (8.3) (2.1) (1.8) (1.9) (‡) (3.6) (1.7) (1.6) West .................................... 147 143 180 113 125 152 167 ‡ 126 143 157 (2.9) (2.9) (4.0) (7.6) (3.8) (2.5) (2.7) (‡) (3.2) (2.6) (2.8)
— Not available. ‡ Did not meet reporting standards. 1”Region of the country” refers to the Census-defined regions.
NOTE: Nonpublic schools include Catholic schools, other religious schools, and all other private schools. AP/IB science courses include courses in biology, chemistry, physics, and environmental science.
SOURCE: U.S. Department of Education, Institute of Education Sciences, National Center for Education Statistics, High School Transcript Study (HSTS), 2000.
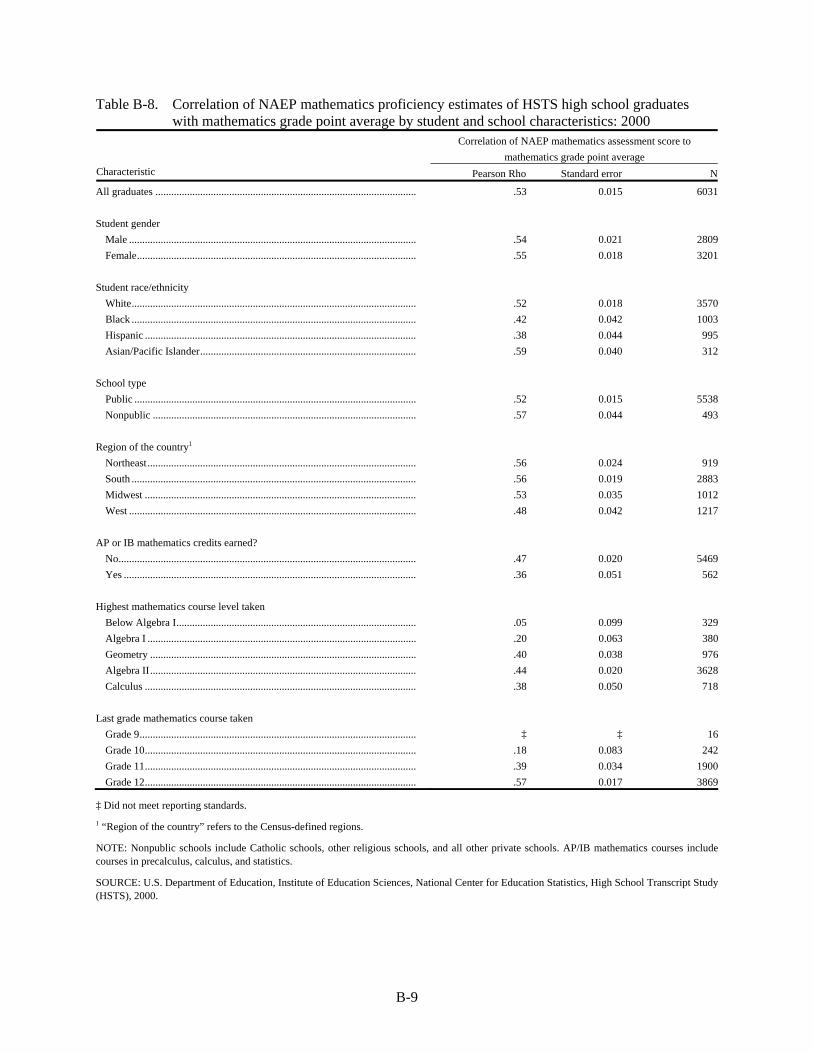
B-9
Table B-8. Correlation of NAEP mathematics proficiency estimates of HSTS high school graduates with mathematics grade point average by student and school characteristics: 2000
Correlation of NAEP mathematics assessment score to mathematics grade point average
Characteristic Pearson Rho Standard error N
All graduates ................................................................................................... .53 0.015 6031 Student gender Male ............................................................................................................. .54 0.021 2809 Female.......................................................................................................... .55 0.018 3201 Student race/ethnicity White............................................................................................................ .52 0.018 3570 Black ............................................................................................................ .42 0.042 1003 Hispanic ....................................................................................................... .38 0.044 995 Asian/Pacific Islander.................................................................................. .59 0.040 312 School type Public ........................................................................................................... .52 0.015 5538 Nonpublic .................................................................................................... .57 0.044 493 Region of the country1 Northeast...................................................................................................... .56 0.024 919 South ............................................................................................................ .56 0.019 2883 Midwest ....................................................................................................... .53 0.035 1012 West ............................................................................................................. .48 0.042 1217 AP or IB mathematics credits earned? No................................................................................................................. .47 0.020 5469 Yes ............................................................................................................... .36 0.051 562 Highest mathematics course level taken Below Algebra I........................................................................................... .05 0.099 329 Algebra I ...................................................................................................... .20 0.063 380 Geometry ..................................................................................................... .40 0.038 976 Algebra II..................................................................................................... .44 0.020 3628 Calculus ....................................................................................................... .38 0.050 718 Last grade mathematics course taken Grade 9......................................................................................................... ‡ ‡ 16 Grade 10....................................................................................................... .18 0.083 242 Grade 11....................................................................................................... .39 0.034 1900 Grade 12....................................................................................................... .57 0.017 3869
‡ Did not meet reporting standards. 1 “Region of the country” refers to the Census-defined regions.
NOTE: Nonpublic schools include Catholic schools, other religious schools, and all other private schools. AP/IB mathematics courses include courses in precalculus, calculus, and statistics.
SOURCE: U.S. Department of Education, Institute of Education Sciences, National Center for Education Statistics, High School Transcript Study (HSTS), 2000.
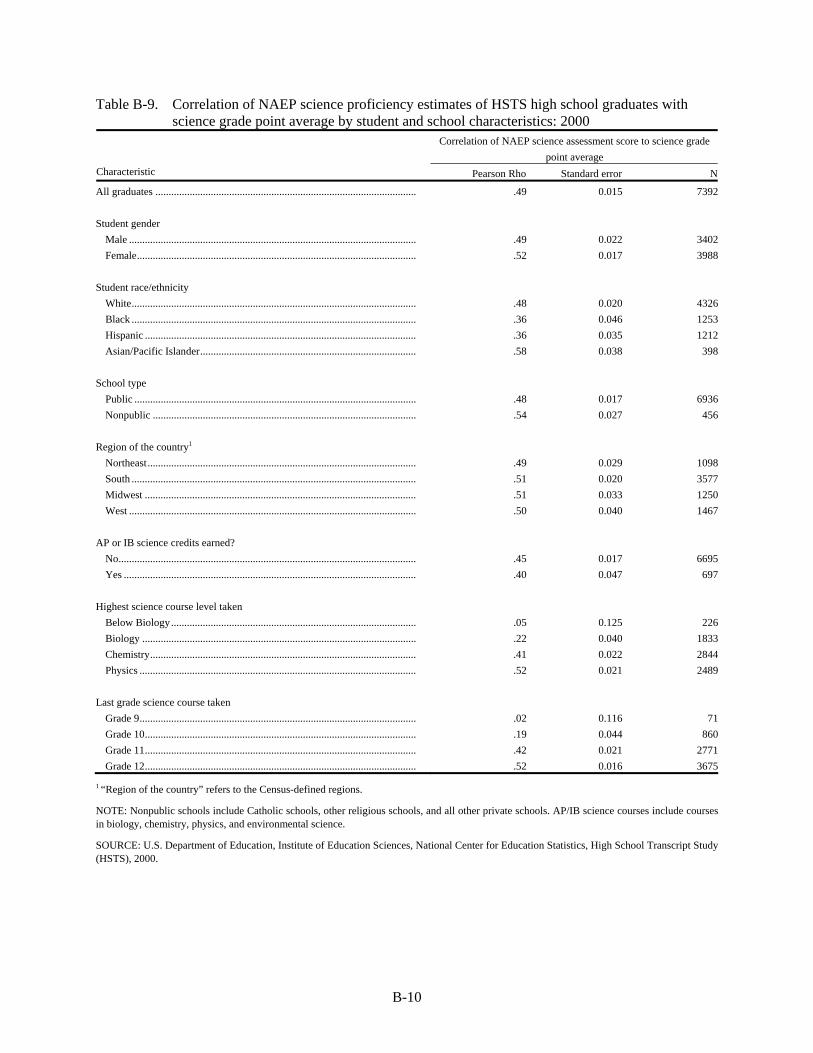
B-10
Table B-9. Correlation of NAEP science proficiency estimates of HSTS high school graduates with science grade point average by student and school characteristics: 2000
Correlation of NAEP science assessment score to science grade point average
Characteristic Pearson Rho Standard error N
All graduates ................................................................................................... .49 0.015 7392 Student gender Male ............................................................................................................. .49 0.022 3402 Female.......................................................................................................... .52 0.017 3988 Student race/ethnicity White............................................................................................................ .48 0.020 4326 Black ............................................................................................................ .36 0.046 1253 Hispanic ....................................................................................................... .36 0.035 1212 Asian/Pacific Islander.................................................................................. .58 0.038 398 School type Public ........................................................................................................... .48 0.017 6936 Nonpublic .................................................................................................... .54 0.027 456 Region of the country1 Northeast...................................................................................................... .49 0.029 1098 South ............................................................................................................ .51 0.020 3577 Midwest ....................................................................................................... .51 0.033 1250 West ............................................................................................................. .50 0.040 1467 AP or IB science credits earned? No................................................................................................................. .45 0.017 6695 Yes ............................................................................................................... .40 0.047 697 Highest science course level taken Below Biology............................................................................................. .05 0.125 226 Biology ........................................................................................................ .22 0.040 1833 Chemistry..................................................................................................... .41 0.022 2844 Physics ......................................................................................................... .52 0.021 2489 Last grade science course taken Grade 9......................................................................................................... .02 0.116 71 Grade 10....................................................................................................... .19 0.044 860 Grade 11....................................................................................................... .42 0.021 2771 Grade 12....................................................................................................... .52 0.016 3675
1 “Region of the country” refers to the Census-defined regions.
NOTE: Nonpublic schools include Catholic schools, other religious schools, and all other private schools. AP/IB science courses include courses in biology, chemistry, physics, and environmental science.
SOURCE: U.S. Department of Education, Institute of Education Sciences, National Center for Education Statistics, High School Transcript Study (HSTS), 2000.

C-1
Appendix C
Standard Error Tables
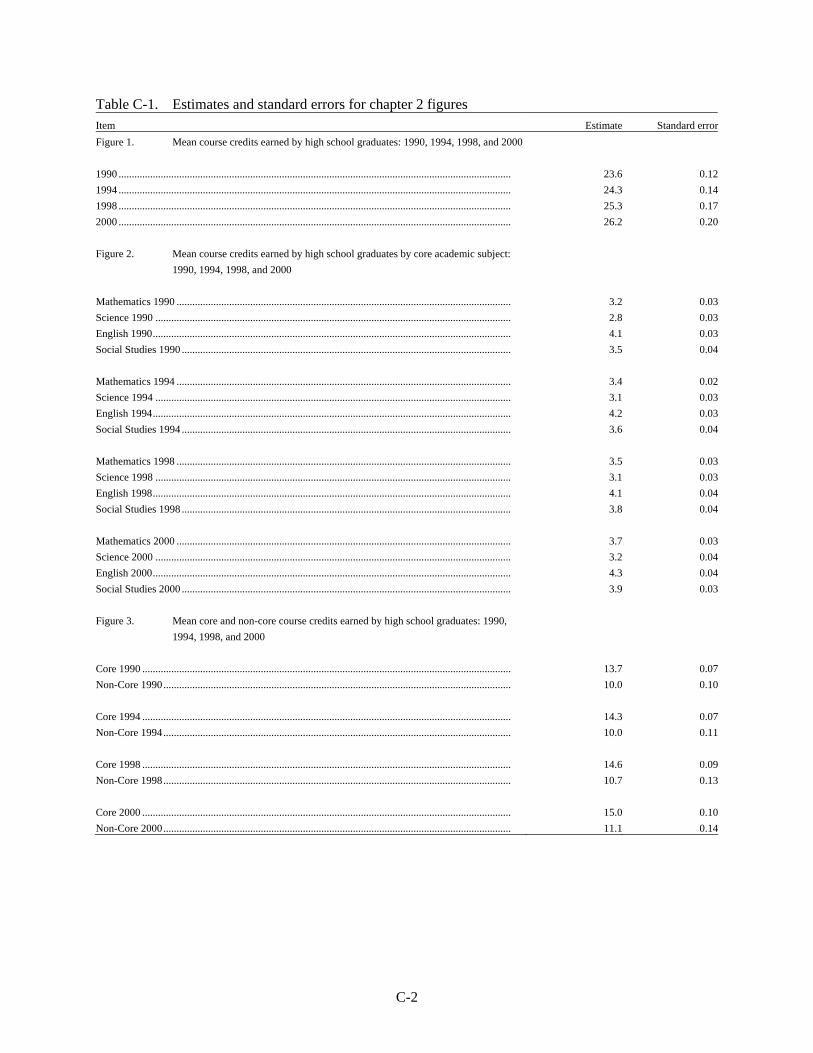
C-2
Table C-1. Estimates and standard errors for chapter 2 figures Item Estimate Standard errorFigure 1. Mean course credits earned by high school graduates: 1990, 1994, 1998, and 2000 1990 ..................................................................................................................................................... 23.6 0.121994 ..................................................................................................................................................... 24.3 0.141998 ..................................................................................................................................................... 25.3 0.172000 ..................................................................................................................................................... 26.2 0.20 Figure 2. Mean course credits earned by high school graduates by core academic subject:
1990, 1994, 1998, and 2000 Mathematics 1990 ............................................................................................................................... 3.2 0.03Science 1990 ....................................................................................................................................... 2.8 0.03English 1990........................................................................................................................................ 4.1 0.03Social Studies 1990 ............................................................................................................................. 3.5 0.04 Mathematics 1994 ............................................................................................................................... 3.4 0.02Science 1994 ....................................................................................................................................... 3.1 0.03English 1994........................................................................................................................................ 4.2 0.03Social Studies 1994 ............................................................................................................................. 3.6 0.04 Mathematics 1998 ............................................................................................................................... 3.5 0.03Science 1998 ....................................................................................................................................... 3.1 0.03English 1998........................................................................................................................................ 4.1 0.04Social Studies 1998 ............................................................................................................................. 3.8 0.04 Mathematics 2000 ............................................................................................................................... 3.7 0.03Science 2000 ....................................................................................................................................... 3.2 0.04English 2000........................................................................................................................................ 4.3 0.04Social Studies 2000 ............................................................................................................................. 3.9 0.03 Figure 3. Mean core and non-core course credits earned by high school graduates: 1990,
1994, 1998, and 2000 Core 1990 ............................................................................................................................................ 13.7 0.07Non-Core 1990.................................................................................................................................... 10.0 0.10 Core 1994 ............................................................................................................................................ 14.3 0.07Non-Core 1994.................................................................................................................................... 10.0 0.11 Core 1998 ............................................................................................................................................ 14.6 0.09Non-Core 1998.................................................................................................................................... 10.7 0.13 Core 2000 ............................................................................................................................................ 15.0 0.10Non-Core 2000.................................................................................................................................... 11.1 0.14
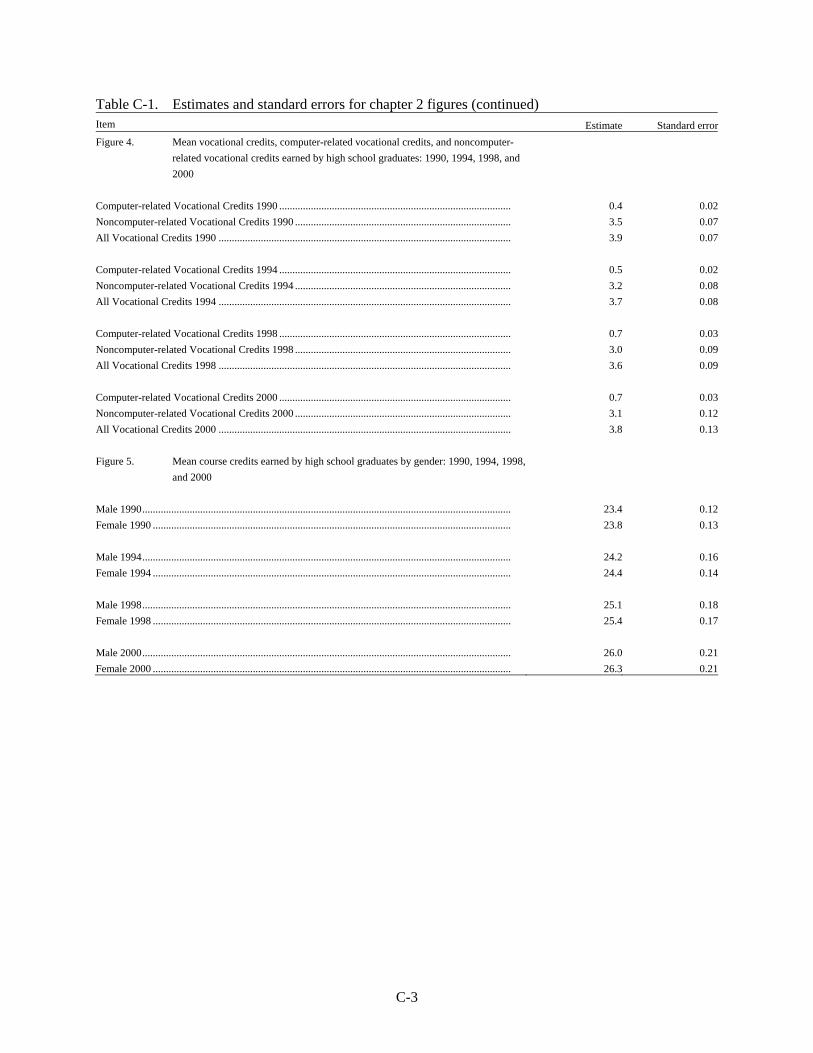
C-3
Table C-1. Estimates and standard errors for chapter 2 figures (continued) Item Estimate Standard errorFigure 4. Mean vocational credits, computer-related vocational credits, and noncomputer-
related vocational credits earned by high school graduates: 1990, 1994, 1998, and 2000
Computer-related Vocational Credits 1990 ........................................................................................ 0.4 0.02Noncomputer-related Vocational Credits 1990 .................................................................................. 3.5 0.07All Vocational Credits 1990 ............................................................................................................... 3.9 0.07 Computer-related Vocational Credits 1994 ........................................................................................ 0.5 0.02Noncomputer-related Vocational Credits 1994 .................................................................................. 3.2 0.08All Vocational Credits 1994 ............................................................................................................... 3.7 0.08 Computer-related Vocational Credits 1998 ........................................................................................ 0.7 0.03Noncomputer-related Vocational Credits 1998 .................................................................................. 3.0 0.09All Vocational Credits 1998 ............................................................................................................... 3.6 0.09 Computer-related Vocational Credits 2000 ........................................................................................ 0.7 0.03Noncomputer-related Vocational Credits 2000 .................................................................................. 3.1 0.12All Vocational Credits 2000 ............................................................................................................... 3.8 0.13 Figure 5. Mean course credits earned by high school graduates by gender: 1990, 1994, 1998,
and 2000 Male 1990............................................................................................................................................ 23.4 0.12Female 1990 ........................................................................................................................................ 23.8 0.13 Male 1994............................................................................................................................................ 24.2 0.16Female 1994 ........................................................................................................................................ 24.4 0.14 Male 1998............................................................................................................................................ 25.1 0.18Female 1998 ........................................................................................................................................ 25.4 0.17 Male 2000............................................................................................................................................ 26.0 0.21Female 2000 ........................................................................................................................................ 26.3 0.21
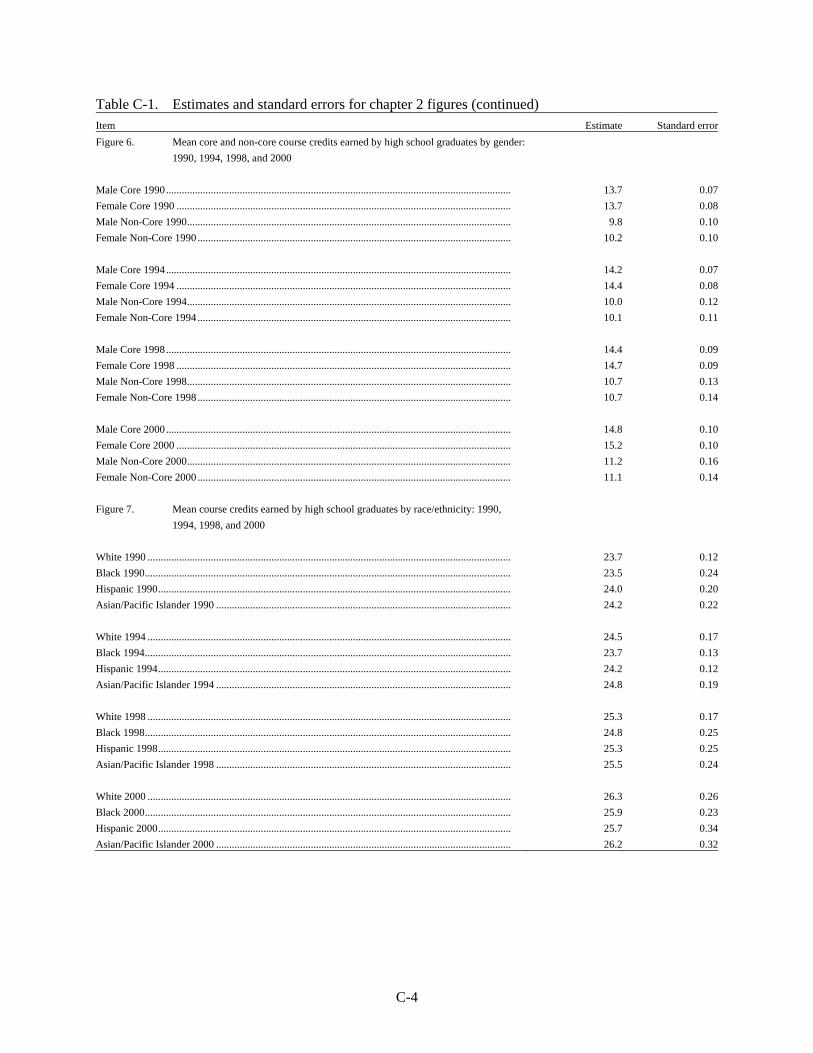
C-4
Table C-1. Estimates and standard errors for chapter 2 figures (continued) Item Estimate Standard errorFigure 6. Mean core and non-core course credits earned by high school graduates by gender:
1990, 1994, 1998, and 2000 Male Core 1990................................................................................................................................... 13.7 0.07Female Core 1990 ............................................................................................................................... 13.7 0.08Male Non-Core 1990........................................................................................................................... 9.8 0.10Female Non-Core 1990 ....................................................................................................................... 10.2 0.10 Male Core 1994................................................................................................................................... 14.2 0.07Female Core 1994 ............................................................................................................................... 14.4 0.08Male Non-Core 1994........................................................................................................................... 10.0 0.12Female Non-Core 1994 ....................................................................................................................... 10.1 0.11 Male Core 1998................................................................................................................................... 14.4 0.09Female Core 1998 ............................................................................................................................... 14.7 0.09Male Non-Core 1998........................................................................................................................... 10.7 0.13Female Non-Core 1998 ....................................................................................................................... 10.7 0.14 Male Core 2000................................................................................................................................... 14.8 0.10Female Core 2000 ............................................................................................................................... 15.2 0.10Male Non-Core 2000........................................................................................................................... 11.2 0.16Female Non-Core 2000 ....................................................................................................................... 11.1 0.14 Figure 7. Mean course credits earned by high school graduates by race/ethnicity: 1990,
1994, 1998, and 2000 White 1990 .......................................................................................................................................... 23.7 0.12Black 1990........................................................................................................................................... 23.5 0.24Hispanic 1990...................................................................................................................................... 24.0 0.20Asian/Pacific Islander 1990 ................................................................................................................ 24.2 0.22 White 1994 .......................................................................................................................................... 24.5 0.17Black 1994........................................................................................................................................... 23.7 0.13Hispanic 1994...................................................................................................................................... 24.2 0.12Asian/Pacific Islander 1994 ................................................................................................................ 24.8 0.19 White 1998 .......................................................................................................................................... 25.3 0.17Black 1998........................................................................................................................................... 24.8 0.25Hispanic 1998...................................................................................................................................... 25.3 0.25Asian/Pacific Islander 1998 ................................................................................................................ 25.5 0.24 White 2000 .......................................................................................................................................... 26.3 0.26Black 2000........................................................................................................................................... 25.9 0.23Hispanic 2000...................................................................................................................................... 25.7 0.34Asian/Pacific Islander 2000 ................................................................................................................ 26.2 0.32
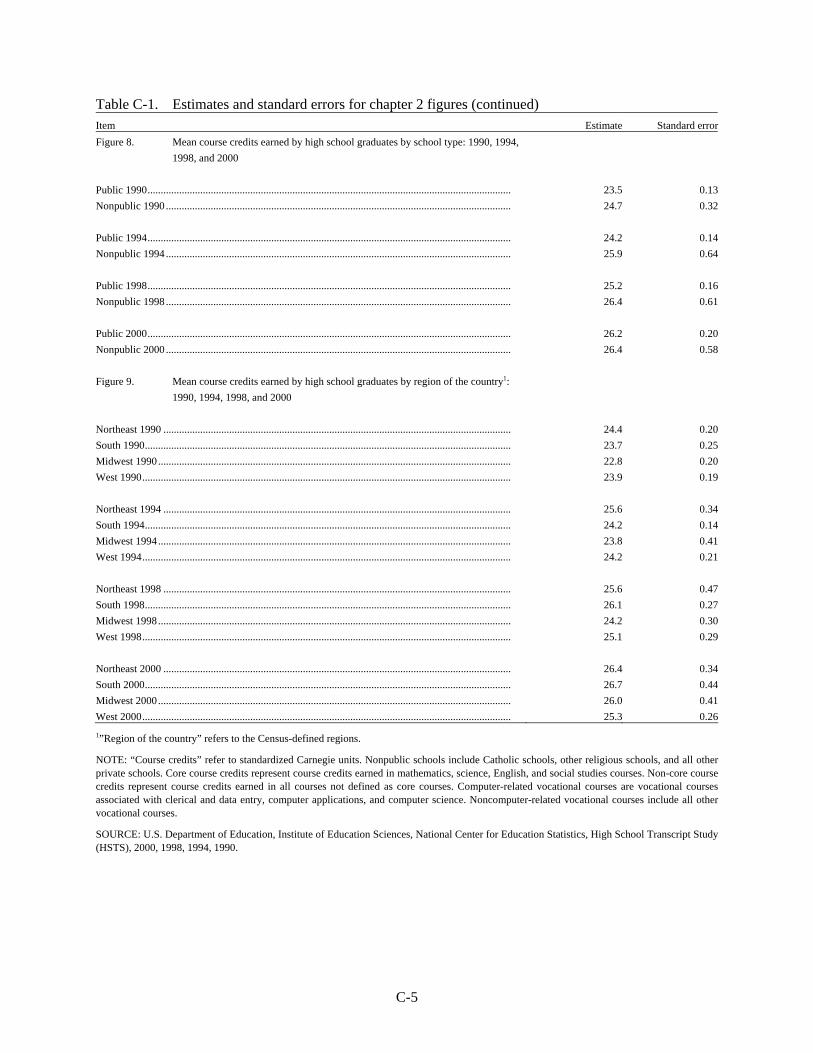
C-5
Table C-1. Estimates and standard errors for chapter 2 figures (continued) Item Estimate Standard errorFigure 8. Mean course credits earned by high school graduates by school type: 1990, 1994,
1998, and 2000 Public 1990.......................................................................................................................................... 23.5 0.13Nonpublic 1990 ................................................................................................................................... 24.7 0.32 Public 1994.......................................................................................................................................... 24.2 0.14Nonpublic 1994 ................................................................................................................................... 25.9 0.64 Public 1998.......................................................................................................................................... 25.2 0.16Nonpublic 1998 ................................................................................................................................... 26.4 0.61 Public 2000.......................................................................................................................................... 26.2 0.20Nonpublic 2000 ................................................................................................................................... 26.4 0.58 Figure 9. Mean course credits earned by high school graduates by region of the country1:
1990, 1994, 1998, and 2000 Northeast 1990 .................................................................................................................................... 24.4 0.20South 1990........................................................................................................................................... 23.7 0.25Midwest 1990...................................................................................................................................... 22.8 0.20West 1990............................................................................................................................................ 23.9 0.19 Northeast 1994 .................................................................................................................................... 25.6 0.34South 1994........................................................................................................................................... 24.2 0.14Midwest 1994...................................................................................................................................... 23.8 0.41West 1994............................................................................................................................................ 24.2 0.21 Northeast 1998 .................................................................................................................................... 25.6 0.47South 1998........................................................................................................................................... 26.1 0.27Midwest 1998...................................................................................................................................... 24.2 0.30West 1998............................................................................................................................................ 25.1 0.29 Northeast 2000 .................................................................................................................................... 26.4 0.34South 2000........................................................................................................................................... 26.7 0.44Midwest 2000...................................................................................................................................... 26.0 0.41West 2000............................................................................................................................................ 25.3 0.261”Region of the country” refers to the Census-defined regions.
NOTE: “Course credits” refer to standardized Carnegie units. Nonpublic schools include Catholic schools, other religious schools, and all other private schools. Core course credits represent course credits earned in mathematics, science, English, and social studies courses. Non-core course credits represent course credits earned in all courses not defined as core courses. Computer-related vocational courses are vocational courses associated with clerical and data entry, computer applications, and computer science. Noncomputer-related vocational courses include all other vocational courses.
SOURCE: U.S. Department of Education, Institute of Education Sciences, National Center for Education Statistics, High School Transcript Study (HSTS), 2000, 1998, 1994, 1990.
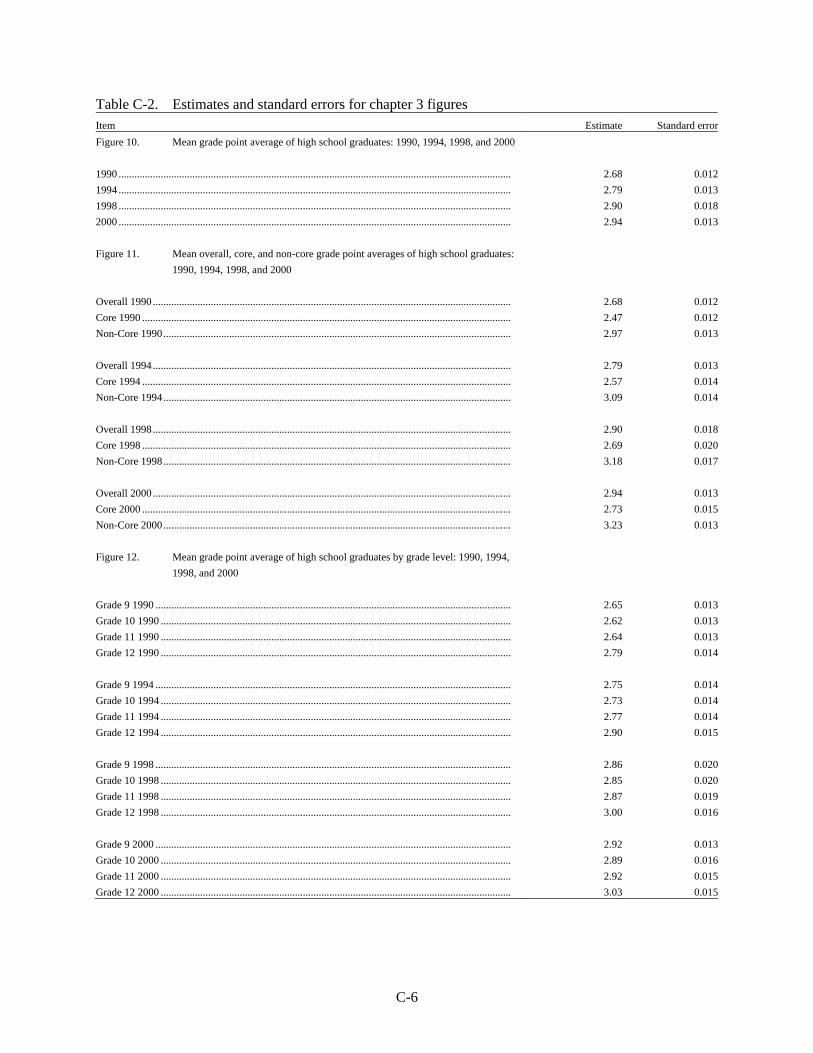
C-6
Table C-2. Estimates and standard errors for chapter 3 figures Item Estimate Standard errorFigure 10. Mean grade point average of high school graduates: 1990, 1994, 1998, and 2000 1990 ..................................................................................................................................................... 2.68 0.0121994 ..................................................................................................................................................... 2.79 0.0131998 ..................................................................................................................................................... 2.90 0.0182000 ..................................................................................................................................................... 2.94 0.013 Figure 11. Mean overall, core, and non-core grade point averages of high school graduates:
1990, 1994, 1998, and 2000 Overall 1990........................................................................................................................................ 2.68 0.012Core 1990 ............................................................................................................................................ 2.47 0.012Non-Core 1990.................................................................................................................................... 2.97 0.013 Overall 1994........................................................................................................................................ 2.79 0.013Core 1994 ............................................................................................................................................ 2.57 0.014Non-Core 1994.................................................................................................................................... 3.09 0.014 Overall 1998........................................................................................................................................ 2.90 0.018Core 1998 ............................................................................................................................................ 2.69 0.020Non-Core 1998.................................................................................................................................... 3.18 0.017 Overall 2000........................................................................................................................................ 2.94 0.013Core 2000 ............................................................................................................................................ 2.73 0.015Non-Core 2000.................................................................................................................................... 3.23 0.013 Figure 12. Mean grade point average of high school graduates by grade level: 1990, 1994,
1998, and 2000 Grade 9 1990 ....................................................................................................................................... 2.65 0.013Grade 10 1990 ..................................................................................................................................... 2.62 0.013Grade 11 1990 ..................................................................................................................................... 2.64 0.013Grade 12 1990 ..................................................................................................................................... 2.79 0.014 Grade 9 1994 ....................................................................................................................................... 2.75 0.014Grade 10 1994 ..................................................................................................................................... 2.73 0.014Grade 11 1994 ..................................................................................................................................... 2.77 0.014Grade 12 1994 ..................................................................................................................................... 2.90 0.015 Grade 9 1998 ....................................................................................................................................... 2.86 0.020Grade 10 1998 ..................................................................................................................................... 2.85 0.020Grade 11 1998 ..................................................................................................................................... 2.87 0.019Grade 12 1998 ..................................................................................................................................... 3.00 0.016 Grade 9 2000 ....................................................................................................................................... 2.92 0.013Grade 10 2000 ..................................................................................................................................... 2.89 0.016Grade 11 2000 ..................................................................................................................................... 2.92 0.015Grade 12 2000 ..................................................................................................................................... 3.03 0.015
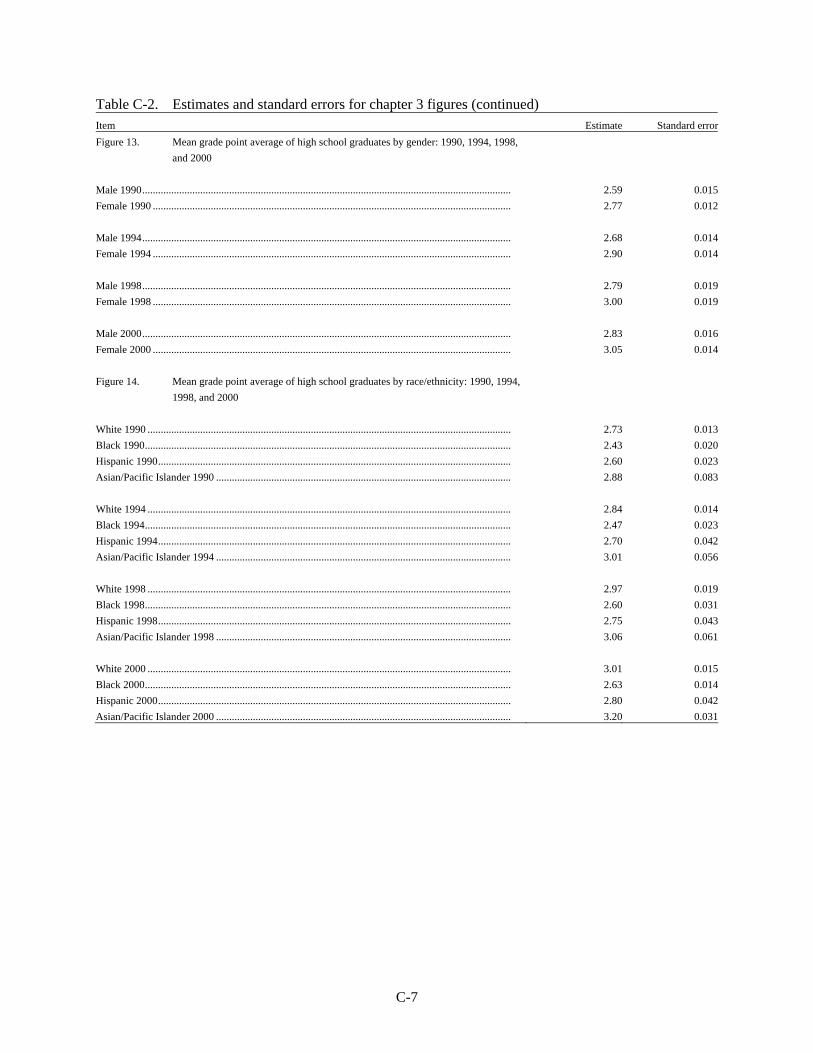
C-7
Table C-2. Estimates and standard errors for chapter 3 figures (continued) Item Estimate Standard errorFigure 13. Mean grade point average of high school graduates by gender: 1990, 1994, 1998,
and 2000 Male 1990............................................................................................................................................ 2.59 0.015Female 1990 ........................................................................................................................................ 2.77 0.012 Male 1994............................................................................................................................................ 2.68 0.014Female 1994 ........................................................................................................................................ 2.90 0.014 Male 1998............................................................................................................................................ 2.79 0.019Female 1998 ........................................................................................................................................ 3.00 0.019 Male 2000............................................................................................................................................ 2.83 0.016Female 2000 ........................................................................................................................................ 3.05 0.014 Figure 14. Mean grade point average of high school graduates by race/ethnicity: 1990, 1994,
1998, and 2000 White 1990 .......................................................................................................................................... 2.73 0.013Black 1990........................................................................................................................................... 2.43 0.020Hispanic 1990...................................................................................................................................... 2.60 0.023Asian/Pacific Islander 1990 ................................................................................................................ 2.88 0.083 White 1994 .......................................................................................................................................... 2.84 0.014Black 1994........................................................................................................................................... 2.47 0.023Hispanic 1994...................................................................................................................................... 2.70 0.042Asian/Pacific Islander 1994 ................................................................................................................ 3.01 0.056 White 1998 .......................................................................................................................................... 2.97 0.019Black 1998........................................................................................................................................... 2.60 0.031Hispanic 1998...................................................................................................................................... 2.75 0.043Asian/Pacific Islander 1998 ................................................................................................................ 3.06 0.061 White 2000 .......................................................................................................................................... 3.01 0.015Black 2000........................................................................................................................................... 2.63 0.014Hispanic 2000...................................................................................................................................... 2.80 0.042Asian/Pacific Islander 2000 ................................................................................................................ 3.20 0.031

C-8
Table C-2. Estimates and standard errors for chapter 3 figures (continued) Item Estimate Standard errorFigure 15. Mean grade point average of high school graduates by school type: 1990, 1994,
1998, and 2000 Public 1990.......................................................................................................................................... 2.68 0.012Nonpublic 1990 ................................................................................................................................... 2.74 0.035 Public 1994.......................................................................................................................................... 2.79 0.013Nonpublic 1994 ................................................................................................................................... 2.80 0.062 Public 1998.......................................................................................................................................... 2.88 0.018Nonpublic 1998 ................................................................................................................................... 3.08 0.066 Public 2000.......................................................................................................................................... 2.92 0.015Nonpublic 2000 ................................................................................................................................... 3.16 0.039 Figure 16. Mean grade point average of high school graduates by gender and school type:
1990, 1994, 1998, and 2000 Public Male 1990 ................................................................................................................................ 2.58 0.015Public Female 1990............................................................................................................................. 2.76 0.013Nonpublic Male 1990.......................................................................................................................... 2.62 0.040Nonpublic Female 1990 ...................................................................................................................... 2.86 0.034 Public Male 1994 ................................................................................................................................ 2.69 0.014Public Female 1994............................................................................................................................. 2.89 0.014Nonpublic Male 1994.......................................................................................................................... 2.60 0.074Nonpublic Female 1994 ...................................................................................................................... 2.98 0.065 Public Male 1998 ................................................................................................................................ 2.77 0.018Public Female 1998............................................................................................................................. 2.98 0.018Nonpublic Male 1998.......................................................................................................................... 3.00 0.074Nonpublic Female 1998 ...................................................................................................................... 3.15 0.075 Public Male 2000 ................................................................................................................................ 2.82 0.016Public Female 2000............................................................................................................................. 3.02 0.015Nonpublic Male 2000.......................................................................................................................... 2.97 0.060Nonpublic Female 2000 ...................................................................................................................... 3.26 0.031
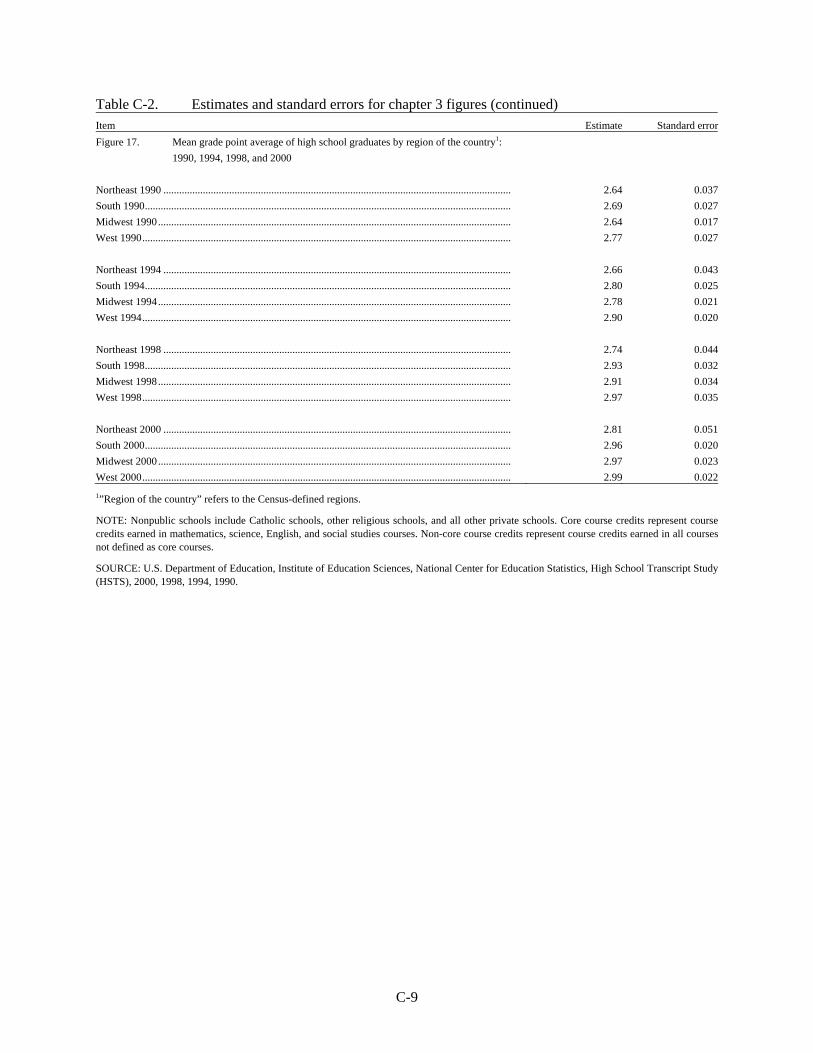
C-9
Table C-2. Estimates and standard errors for chapter 3 figures (continued) Item Estimate Standard errorFigure 17. Mean grade point average of high school graduates by region of the country1:
1990, 1994, 1998, and 2000 Northeast 1990 .................................................................................................................................... 2.64 0.037South 1990........................................................................................................................................... 2.69 0.027Midwest 1990...................................................................................................................................... 2.64 0.017West 1990............................................................................................................................................ 2.77 0.027 Northeast 1994 .................................................................................................................................... 2.66 0.043South 1994........................................................................................................................................... 2.80 0.025Midwest 1994...................................................................................................................................... 2.78 0.021West 1994............................................................................................................................................ 2.90 0.020 Northeast 1998 .................................................................................................................................... 2.74 0.044South 1998........................................................................................................................................... 2.93 0.032Midwest 1998...................................................................................................................................... 2.91 0.034West 1998............................................................................................................................................ 2.97 0.035 Northeast 2000 .................................................................................................................................... 2.81 0.051South 2000........................................................................................................................................... 2.96 0.020Midwest 2000...................................................................................................................................... 2.97 0.023West 2000............................................................................................................................................ 2.99 0.0221”Region of the country” refers to the Census-defined regions.
NOTE: Nonpublic schools include Catholic schools, other religious schools, and all other private schools. Core course credits represent course credits earned in mathematics, science, English, and social studies courses. Non-core course credits represent course credits earned in all courses not defined as core courses.
SOURCE: U.S. Department of Education, Institute of Education Sciences, National Center for Education Statistics, High School Transcript Study (HSTS), 2000, 1998, 1994, 1990.
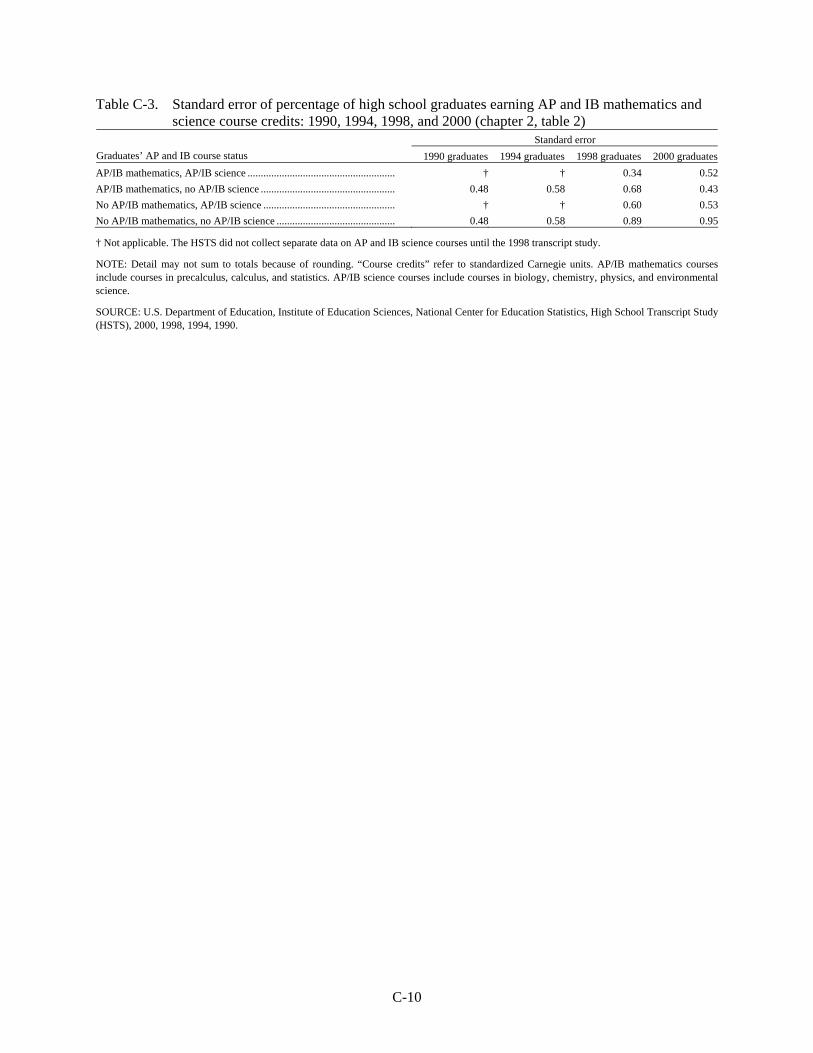
C-10
Table C-3. Standard error of percentage of high school graduates earning AP and IB mathematics and science course credits: 1990, 1994, 1998, and 2000 (chapter 2, table 2)
Standard error Graduates’ AP and IB course status 1990 graduates 1994 graduates 1998 graduates 2000 graduatesAP/IB mathematics, AP/IB science ........................................................ † † 0.34 0.52AP/IB mathematics, no AP/IB science ................................................... 0.48 0.58 0.68 0.43No AP/IB mathematics, AP/IB science .................................................. † † 0.60 0.53No AP/IB mathematics, no AP/IB science ............................................. 0.48 0.58 0.89 0.95
† Not applicable. The HSTS did not collect separate data on AP and IB science courses until the 1998 transcript study.
NOTE: Detail may not sum to totals because of rounding. “Course credits” refer to standardized Carnegie units. AP/IB mathematics courses include courses in precalculus, calculus, and statistics. AP/IB science courses include courses in biology, chemistry, physics, and environmental science.
SOURCE: U.S. Department of Education, Institute of Education Sciences, National Center for Education Statistics, High School Transcript Study (HSTS), 2000, 1998, 1994, 1990.
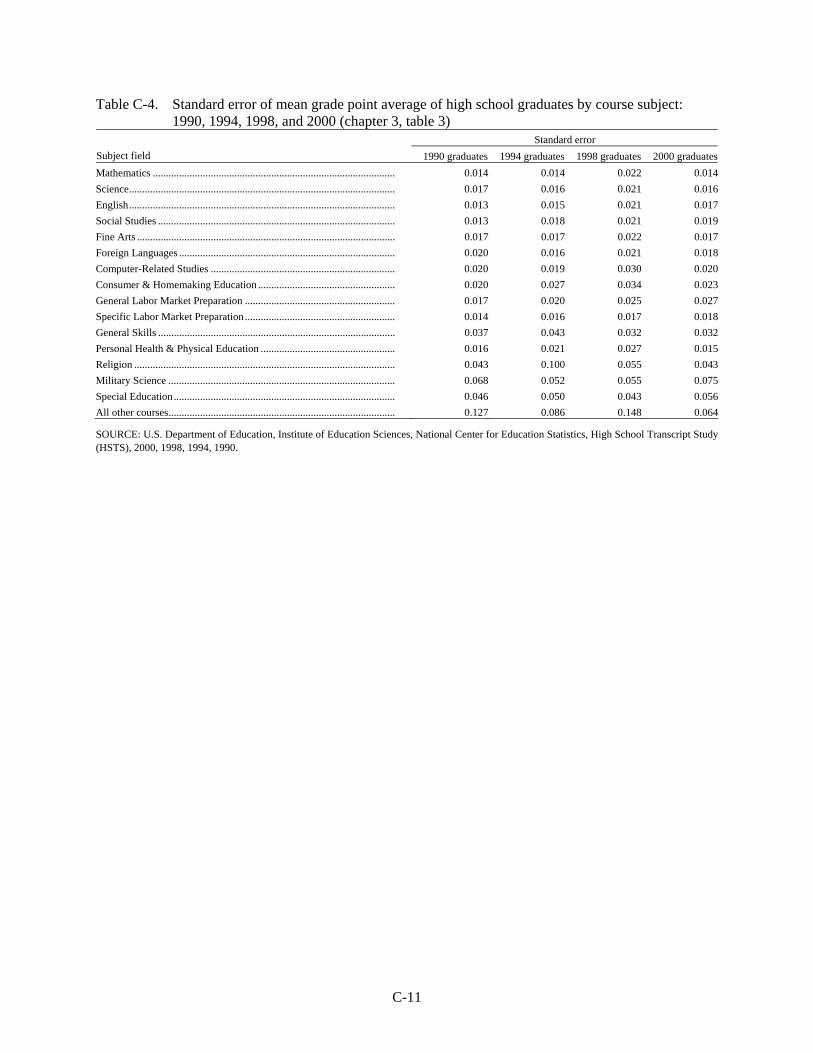
C-11
Table C-4. Standard error of mean grade point average of high school graduates by course subject: 1990, 1994, 1998, and 2000 (chapter 3, table 3)
Standard error Subject field 1990 graduates 1994 graduates 1998 graduates 2000 graduatesMathematics ............................................................................................ 0.014 0.014 0.022 0.014Science..................................................................................................... 0.017 0.016 0.021 0.016English..................................................................................................... 0.013 0.015 0.021 0.017Social Studies .......................................................................................... 0.013 0.018 0.021 0.019Fine Arts .................................................................................................. 0.017 0.017 0.022 0.017Foreign Languages .................................................................................. 0.020 0.016 0.021 0.018Computer-Related Studies ...................................................................... 0.020 0.019 0.030 0.020Consumer & Homemaking Education .................................................... 0.020 0.027 0.034 0.023General Labor Market Preparation ......................................................... 0.017 0.020 0.025 0.027Specific Labor Market Preparation ......................................................... 0.014 0.016 0.017 0.018General Skills .......................................................................................... 0.037 0.043 0.032 0.032Personal Health & Physical Education ................................................... 0.016 0.021 0.027 0.015Religion ................................................................................................... 0.043 0.100 0.055 0.043Military Science ...................................................................................... 0.068 0.052 0.055 0.075Special Education.................................................................................... 0.046 0.050 0.043 0.056All other courses...................................................................................... 0.127 0.086 0.148 0.064
SOURCE: U.S. Department of Education, Institute of Education Sciences, National Center for Education Statistics, High School Transcript Study (HSTS), 2000, 1998, 1994, 1990.
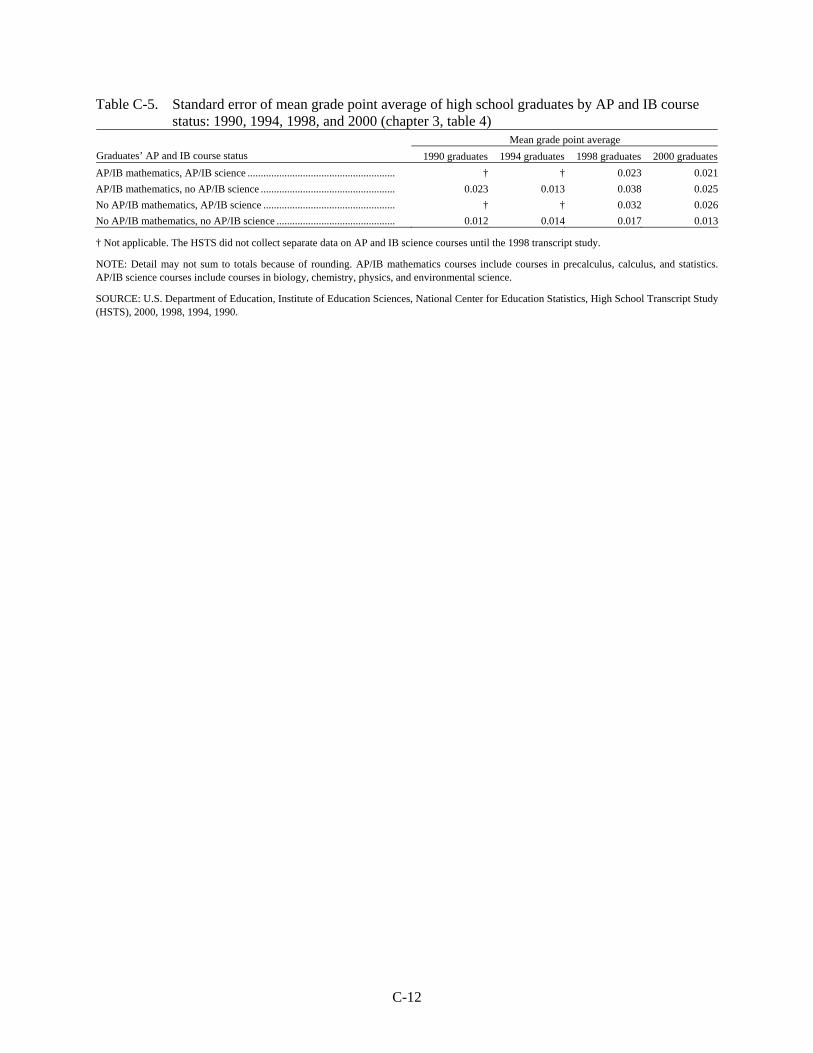
C-12
Table C-5. Standard error of mean grade point average of high school graduates by AP and IB course status: 1990, 1994, 1998, and 2000 (chapter 3, table 4)
Mean grade point average Graduates’ AP and IB course status 1990 graduates 1994 graduates 1998 graduates 2000 graduatesAP/IB mathematics, AP/IB science ........................................................ † † 0.023 0.021AP/IB mathematics, no AP/IB science ................................................... 0.023 0.013 0.038 0.025No AP/IB mathematics, AP/IB science .................................................. † † 0.032 0.026No AP/IB mathematics, no AP/IB science ............................................. 0.012 0.014 0.017 0.013
† Not applicable. The HSTS did not collect separate data on AP and IB science courses until the 1998 transcript study.
NOTE: Detail may not sum to totals because of rounding. AP/IB mathematics courses include courses in precalculus, calculus, and statistics. AP/IB science courses include courses in biology, chemistry, physics, and environmental science.
SOURCE: U.S. Department of Education, Institute of Education Sciences, National Center for Education Statistics, High School Transcript Study (HSTS), 2000, 1998, 1994, 1990.
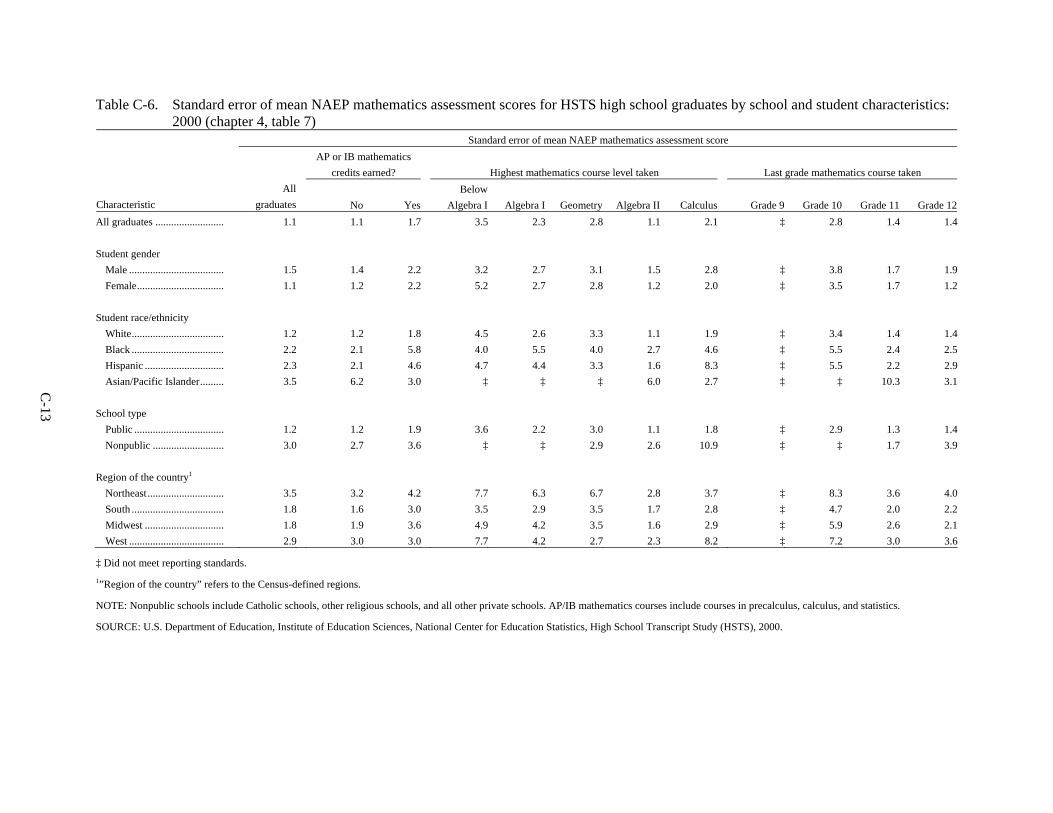
C-13
Table C-6. Standard error of mean NAEP mathematics assessment scores for HSTS high school graduates by school and student characteristics: 2000 (chapter 4, table 7)
Standard error of mean NAEP mathematics assessment score
AP or IB mathematics
credits earned? Highest mathematics course level taken Last grade mathematics course taken
Characteristic All
graduates
No YesBelow
Algebra I Algebra I Geometry Algebra II Calculus Grade 9 Grade 10 Grade 11 Grade 12All graduates .......................... 1.1 1.1 1.7 3.5 2.3 2.8 1.1 2.1 ‡ 2.8 1.4 1.4 Student gender Male .................................... 1.5 1.4 2.2 3.2 2.7 3.1 1.5 2.8 ‡ 3.8 1.7 1.9 Female................................. 1.1 1.2 2.2 5.2 2.7 2.8 1.2 2.0 ‡ 3.5 1.7 1.2 Student race/ethnicity White................................... 1.2 1.2 1.8 4.5 2.6 3.3 1.1 1.9 ‡ 3.4 1.4 1.4 Black ................................... 2.2 2.1 5.8 4.0 5.5 4.0 2.7 4.6 ‡ 5.5 2.4 2.5 Hispanic .............................. 2.3 2.1 4.6 4.7 4.4 3.3 1.6 8.3 ‡ 5.5 2.2 2.9 Asian/Pacific Islander......... 3.5 6.2 3.0 ‡ ‡ ‡ 6.0 2.7 ‡ ‡ 10.3 3.1 School type Public .................................. 1.2 1.2 1.9 3.6 2.2 3.0 1.1 1.8 ‡ 2.9 1.3 1.4 Nonpublic ........................... 3.0 2.7 3.6 ‡ ‡ 2.9 2.6 10.9 ‡ ‡ 1.7 3.9 Region of the country1 Northeast............................. 3.5 3.2 4.2 7.7 6.3 6.7 2.8 3.7 ‡ 8.3 3.6 4.0 South ................................... 1.8 1.6 3.0 3.5 2.9 3.5 1.7 2.8 ‡ 4.7 2.0 2.2 Midwest .............................. 1.8 1.9 3.6 4.9 4.2 3.5 1.6 2.9 ‡ 5.9 2.6 2.1 West .................................... 2.9 3.0 3.0 7.7 4.2 2.7 2.3 8.2 ‡ 7.2 3.0 3.6
‡ Did not meet reporting standards. 1”Region of the country” refers to the Census-defined regions.
NOTE: Nonpublic schools include Catholic schools, other religious schools, and all other private schools. AP/IB mathematics courses include courses in precalculus, calculus, and statistics.
SOURCE: U.S. Department of Education, Institute of Education Sciences, National Center for Education Statistics, High School Transcript Study (HSTS), 2000.

C-14
Table C-7. Standard error of mean NAEP science assessment scores for HSTS high school graduates by school and student characteristics: 2000 (chapter 4, table 8)
Standard error of mean NAEP science assessment score
AP or IB science credits
earned?
Highest science course level taken
Last grade science course taken
Characteristic All graduates
No YesBelow
Biology Biology Chemistry Physics Grade 9 Grade 10 Grade 11 Grade 12All graduates .......................... 1.0 0.9 2.1 4.4 1.3 1.1 1.2 6.6 1.5 1.1 1.0 Student gender Male .................................... 1.2 1.2 2.9 5.1 1.7 1.3 1.5 9.2 1.7 1.5 1.4 Female................................. 1.1 1.0 2.0 7.3 1.5 1.4 1.5 ‡ 2.1 1.4 1.1 Student race/ethnicity White................................... 1.1 1.1 1.9 5.6 1.6 1.1 1.2 7.0 1.8 1.2 1.2 Black ................................... 1.6 1.6 5.2 6.4 2.6 2.1 2.5 ‡ 3.6 2.2 1.7 Hispanic .............................. 2.0 1.8 6.4 5.0 3.0 2.3 3.3 ‡ 3.2 2.4 2.5 Asian/Pacific Islander......... 2.9 2.9 2.8 ‡ 4.2 5.0 2.8 — ‡ 4.0 3.3 School type Public .................................. 1.1 1.0 2.3 4.4 1.3 1.1 1.4 6.6 1.6 1.2 1.1 Nonpublic ........................... 1.9 1.8 2.5 — 6.1 2.5 1.9 ‡ ‡ 2.7 2.1 Region of the country1 Northeast............................. 2.9 3.0 4.1 ‡ 3.8 2.8 2.8 ‡ 4.2 3.2 2.9 South ................................... 1.4 1.3 3.8 9.4 1.5 2.0 2.0 ‡ 2.1 1.8 1.7 Midwest .............................. 1.3 1.1 4.5 8.3 2.1 1.8 1.9 ‡ 3.6 1.7 1.6 West .................................... 2.9 2.9 4.0 7.6 3.8 2.5 2.7 ‡ 3.2 2.6 2.8
— Not available.
‡ Did not meet reporting standards. 1”Region of the country” refers to the Census-defined regions.
NOTE: Nonpublic schools include Catholic schools, other religious schools, and all other private schools. AP/IB science courses include courses in biology, chemistry, physics, and environmental science.
SOURCE: U.S. Department of Education, Institute of Education Sciences, National Center for Education Statistics, High School Transcript Study (HSTS), 2000.

C-15
Table C-8. Standard error of correlation of NAEP mathematics assessment scores of high school graduates with mathematics grade point average by school and student characteristics: 2000 (chapter 4, table 9)
Characteristic Standard error of correlation of NAEP mathematics
assessment score with mathematics grade point averageAll graduates ..................................................................................................................... 0.015 Student gender Male ............................................................................................................................... 0.021 Female............................................................................................................................ 0.018 Student race/ethnicity White.............................................................................................................................. 0.018 Black .............................................................................................................................. 0.042 Hispanic ......................................................................................................................... 0.044 Asian/Pacific Islander.................................................................................................... 0.040 School type Public ............................................................................................................................. 0.015 Nonpublic ...................................................................................................................... 0.044 Region of the country1 Northeast........................................................................................................................ 0.024 South .............................................................................................................................. 0.019 Midwest ......................................................................................................................... 0.035 West ............................................................................................................................... 0.042 AP or IB mathematics credits earned? No................................................................................................................................... 0.020 Yes ................................................................................................................................. 0.051 Highest mathematics course level completed Before Algebra I ............................................................................................................ 0.099 Algebra I ........................................................................................................................ 0.063 Geometry ....................................................................................................................... 0.038 Algebra II....................................................................................................................... 0.020 Calculus ......................................................................................................................... 0.050 Last grade mathematics course taken Grade 9........................................................................................................................... ‡ Grade 10......................................................................................................................... 0.083 Grade 11......................................................................................................................... 0.034 Grade 12......................................................................................................................... 0.017
‡ Did not meet reporting standards. 1”Region” refers to the Census-defined regions.
NOTE: Nonpublic schools include Catholic schools, other religious schools, and all other private schools. AP/IB mathematics courses include courses in precalculus, calculus, and statistics.
SOURCE: U.S. Department of Education, Institute of Education Sciences, National Center for Education Statistics, High School Transcript Study (HSTS), 2000.
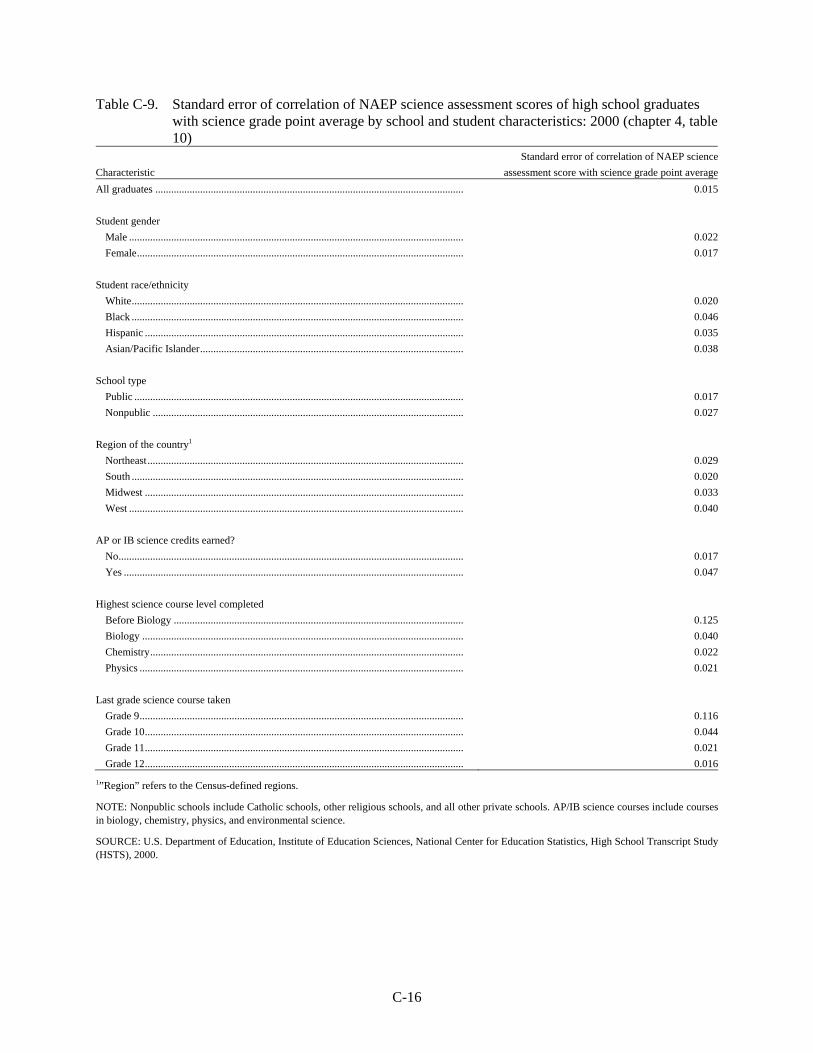
C-16
Table C-9. Standard error of correlation of NAEP science assessment scores of high school graduates with science grade point average by school and student characteristics: 2000 (chapter 4, table 10)
Characteristic Standard error of correlation of NAEP science
assessment score with science grade point averageAll graduates ..................................................................................................................... 0.015 Student gender Male ............................................................................................................................... 0.022 Female............................................................................................................................ 0.017 Student race/ethnicity White.............................................................................................................................. 0.020 Black .............................................................................................................................. 0.046 Hispanic ......................................................................................................................... 0.035 Asian/Pacific Islander.................................................................................................... 0.038 School type Public ............................................................................................................................. 0.017 Nonpublic ...................................................................................................................... 0.027 Region of the country1 Northeast........................................................................................................................ 0.029 South .............................................................................................................................. 0.020 Midwest ......................................................................................................................... 0.033 West ............................................................................................................................... 0.040 AP or IB science credits earned? No................................................................................................................................... 0.017 Yes ................................................................................................................................. 0.047 Highest science course level completed Before Biology .............................................................................................................. 0.125 Biology .......................................................................................................................... 0.040 Chemistry....................................................................................................................... 0.022 Physics ........................................................................................................................... 0.021 Last grade science course taken Grade 9........................................................................................................................... 0.116 Grade 10......................................................................................................................... 0.044 Grade 11......................................................................................................................... 0.021 Grade 12......................................................................................................................... 0.0161”Region” refers to the Census-defined regions.
NOTE: Nonpublic schools include Catholic schools, other religious schools, and all other private schools. AP/IB science courses include courses in biology, chemistry, physics, and environmental science.
SOURCE: U.S. Department of Education, Institute of Education Sciences, National Center for Education Statistics, High School Transcript Study (HSTS), 2000.
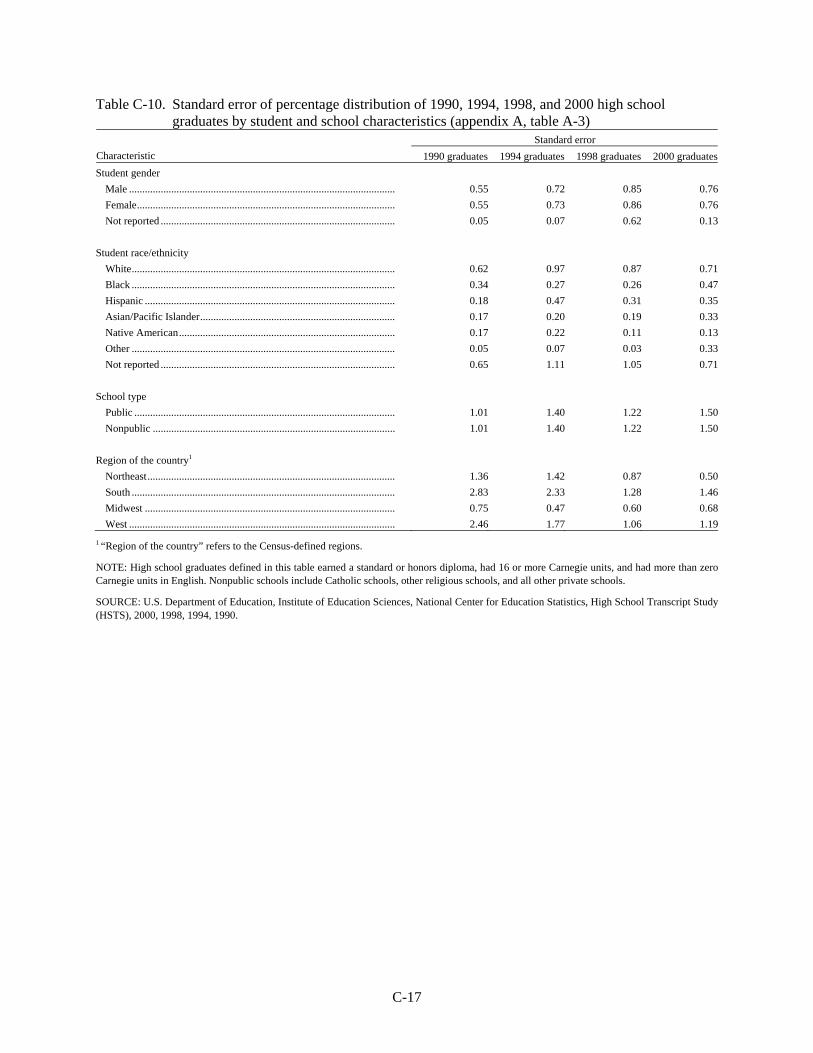
C-17
Table C-10. Standard error of percentage distribution of 1990, 1994, 1998, and 2000 high school graduates by student and school characteristics (appendix A, table A-3)
Standard error Characteristic 1990 graduates 1994 graduates 1998 graduates 2000 graduatesStudent gender Male ..................................................................................................... 0.55 0.72 0.85 0.76 Female.................................................................................................. 0.55 0.73 0.86 0.76 Not reported ......................................................................................... 0.05 0.07 0.62 0.13 Student race/ethnicity White.................................................................................................... 0.62 0.97 0.87 0.71 Black .................................................................................................... 0.34 0.27 0.26 0.47 Hispanic ............................................................................................... 0.18 0.47 0.31 0.35 Asian/Pacific Islander.......................................................................... 0.17 0.20 0.19 0.33 Native American.................................................................................. 0.17 0.22 0.11 0.13 Other .................................................................................................... 0.05 0.07 0.03 0.33 Not reported ......................................................................................... 0.65 1.11 1.05 0.71 School type Public ................................................................................................... 1.01 1.40 1.22 1.50 Nonpublic ............................................................................................ 1.01 1.40 1.22 1.50 Region of the country1 Northeast.............................................................................................. 1.36 1.42 0.87 0.50 South .................................................................................................... 2.83 2.33 1.28 1.46 Midwest ............................................................................................... 0.75 0.47 0.60 0.68 West ..................................................................................................... 2.46 1.77 1.06 1.191 “Region of the country” refers to the Census-defined regions.
NOTE: High school graduates defined in this table earned a standard or honors diploma, had 16 or more Carnegie units, and had more than zero Carnegie units in English. Nonpublic schools include Catholic schools, other religious schools, and all other private schools.
SOURCE: U.S. Department of Education, Institute of Education Sciences, National Center for Education Statistics, High School Transcript Study (HSTS), 2000, 1998, 1994, 1990.

C-18

D-1
Appendix D
Glossary

D-2
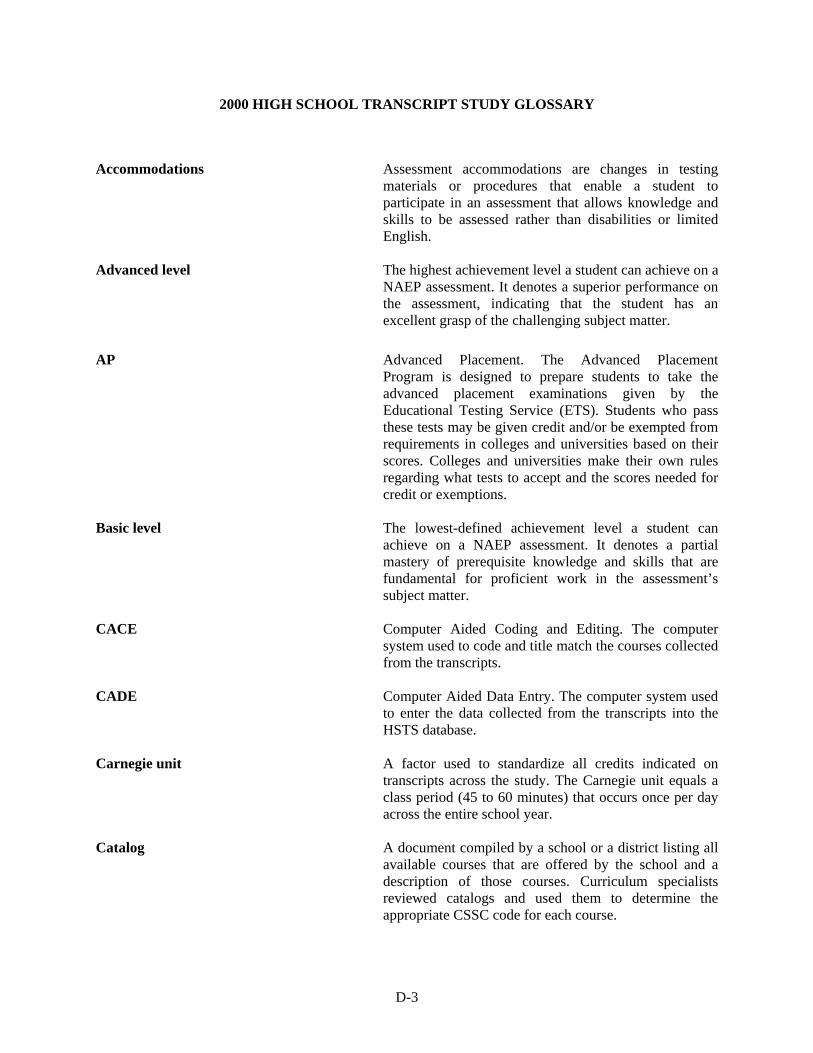
D-3
2000 HIGH SCHOOL TRANSCRIPT STUDY GLOSSARY
Accommodations Assessment accommodations are changes in testing materials or procedures that enable a student to participate in an assessment that allows knowledge and skills to be assessed rather than disabilities or limited English.
Advanced level The highest achievement level a student can achieve on a
NAEP assessment. It denotes a superior performance on the assessment, indicating that the student has an excellent grasp of the challenging subject matter.
AP Advanced Placement. The Advanced Placement
Program is designed to prepare students to take the advanced placement examinations given by the Educational Testing Service (ETS). Students who pass these tests may be given credit and/or be exempted from requirements in colleges and universities based on their scores. Colleges and universities make their own rules regarding what tests to accept and the scores needed for credit or exemptions.
Basic level The lowest-defined achievement level a student can
achieve on a NAEP assessment. It denotes a partial mastery of prerequisite knowledge and skills that are fundamental for proficient work in the assessment’s subject matter.
CACE Computer Aided Coding and Editing. The computer
system used to code and title match the courses collected from the transcripts.
CADE Computer Aided Data Entry. The computer system used
to enter the data collected from the transcripts into the HSTS database.
Carnegie unit A factor used to standardize all credits indicated on
transcripts across the study. The Carnegie unit equals a class period (45 to 60 minutes) that occurs once per day across the entire school year.
Catalog A document compiled by a school or a district listing all
available courses that are offered by the school and a description of those courses. Curriculum specialists reviewed catalogs and used them to determine the appropriate CSSC code for each course.
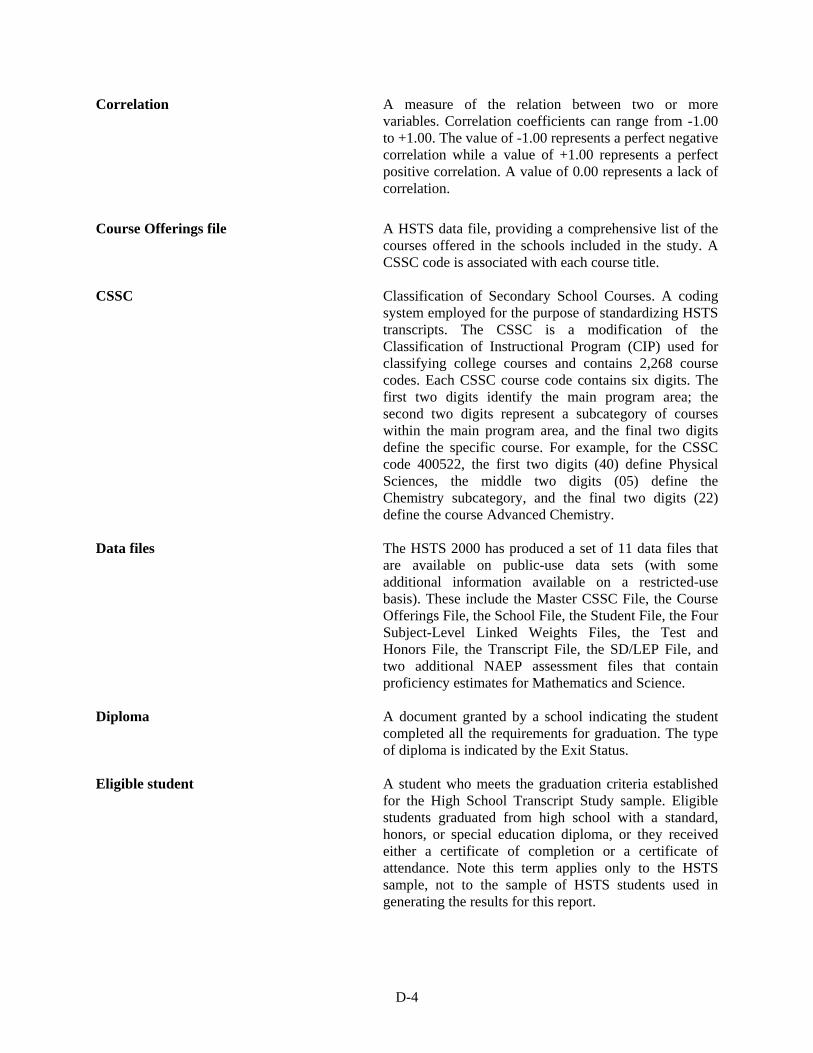
D-4
Correlation A measure of the relation between two or more variables. Correlation coefficients can range from -1.00 to +1.00. The value of -1.00 represents a perfect negative correlation while a value of +1.00 represents a perfect positive correlation. A value of 0.00 represents a lack of correlation.
Course Offerings file A HSTS data file, providing a comprehensive list of the
courses offered in the schools included in the study. A CSSC code is associated with each course title.
CSSC Classification of Secondary School Courses. A coding
system employed for the purpose of standardizing HSTS transcripts. The CSSC is a modification of the Classification of Instructional Program (CIP) used for classifying college courses and contains 2,268 course codes. Each CSSC course code contains six digits. The first two digits identify the main program area; the second two digits represent a subcategory of courses within the main program area, and the final two digits define the specific course. For example, for the CSSC code 400522, the first two digits (40) define Physical Sciences, the middle two digits (05) define the Chemistry subcategory, and the final two digits (22) define the course Advanced Chemistry.
Data files The HSTS 2000 has produced a set of 11 data files that
are available on public-use data sets (with some additional information available on a restricted-use basis). These include the Master CSSC File, the Course Offerings File, the School File, the Student File, the Four Subject-Level Linked Weights Files, the Test and Honors File, the Transcript File, the SD/LEP File, and two additional NAEP assessment files that contain proficiency estimates for Mathematics and Science.
Diploma A document granted by a school indicating the student
completed all the requirements for graduation. The type of diploma is indicated by the Exit Status.
Eligible student A student who meets the graduation criteria established
for the High School Transcript Study sample. Eligible students graduated from high school with a standard, honors, or special education diploma, or they received either a certificate of completion or a certificate of attendance. Note this term applies only to the HSTS sample, not to the sample of HSTS students used in generating the results for this report.
D-5
ESL/ESOL English as a Second Language. An acronym for courses taught to students whose native tongue is not English, who require some special assistance with the language rather than the material taught.
Exclusion criteria Criteria adopted to exclude HSTS students who did not
meet the graduation requirements established for analyses found in this report. Students with special education diplomas, certificates of attendance, and certificates of completion were excluded, as were students with zero English credits and students with fewer than 16 Carnegie units.
Exit status A code that describes the type of diploma the student
received. Flags Markers used to indicate special features of a course,
such as its relationship to other courses within a sequence, the language of instruction for the course, the level of the course (honors, regular, or remedial), whether it was a combination course (a multisubject course requiring multiple codes such as art appreciation/music appreciation), the location where the course was taught, and any enrollment restrictions (regular or disabled students).
Frequency The number of times the value(s) of a variable appears
within a catalog. GSF Graduation Standardization Form. A form containing
school information regarding graduation requirements and the Carnegie Unit Factor which allows for a standardization of credits throughout the study.
High School and Beyond A longitudinal study following cohorts of 1980 high
school students from which the 1982 High School Transcript Study sample was drawn. Samples for subsequent studies were drawn from the corresponding NAEP samples.
HSTS High School Transcript Study. A periodic study
developed by NCES that provides the Department of Education and other education policymakers with information regarding current course offerings and students’ coursetaking patterns in the nation’s secondary schools.
IB International Baccalaureate. A nonprofit educational
foundation program consisting of a comprehensive two-year international curriculum that allows students to
D-6
fulfill the requirements of their national or state education systems.
Imputation Imputation is often used in surveys to compensate for
item nonresponse and involves replacing a missing value with a nonmissing value, typically generated from a statistical model. Imputation is used to reduce nonresponse bias in survey estimates, simplify analyses, and improve the consistency of results across analyses. Imputations should also preserve multivariate distributions.
Jackknife method A method of replication used to compute the variance of
statistics from complex samples. The High School Transcript Study used a paired jackknife method. This method divides the sample into subsamples by excluding one unit at a time from a pair sampled within a stratum.
Linked Weights files Four HSTS data files that provide weights for use when
performing analyses relating transcript data to NAEP assessment results.
Master CSSC file An HSTS data file that includes all modifications made
to the original (1982) CSSC during the 1987, 1990, 1994, and 1998 transcript studies. This file has separate variables for the CSSC code, the disability flag, the sequence flag, and the course title.
NAEP National Assessment of Education Progress. A federally
funded, ongoing, periodic assessment of educational achievement in the various subject areas and disciplines taught in the nation’s schools. It was developed by NCES.
NAEP assessment files Two data files that contain proficiency estimates (also
described as plausible values) for each student who participated in the NAEP assessment. The files are the 2000 NAEP Mathematics Data File and the 2000 NAEP Science Data File. These files contain NAEP scores for the total number of 2000 graduates who participated in both the specific NAEP assessment and the transcript study. However, students who did not meet the graduation requirements were later excluded from the transcript study. Their data are present only in the NAEP assessment files and not in the transcript data files.
NAEP ID The 10-digit NAEP assessment booklet number used as
an HSTS student ID number for students in schools fully linked to the NAEP assessment.

D-7
NAEP-linked A reference to students or schools that maintained their unique NAEP ID or school ID.
NCES National Center for Education Statistics. The primary
federal entity for collecting, analyzing, and reporting data related to education in the United States.
NELS:88 National Education Longitudinal Study of 1988. A major
longitudinal effort designed to provide trend data about critical transitions experienced by students as they leave middle school or junior high school, and progress through high school and into postsecondary institutions or the work force. It started as a nationally representative sample survey of 8th-graders in 1988, with follow-up surveys in the years 1990, 1992, 1994, and 2000.
NSLP National School Lunch Program. A program providing
free or reduced-priced school meals to children from households meeting federal income guidelines.
Percentage A relative measure of how often the value(s) of a
variable appears within a category as compared to all values of that variable.
Poststratification An estimation method that adjusts the sampling weights
so that they add to specified population totals corresponding to the levels of a particular response variable.
Proficient level An achievement level on the NAEP assessment that
indicates a solid academic performance. Students reaching this level demonstrate competency over challenging subject matter, including subject matter knowledge, application of such knowledge to real-world situations, and analytical skills appropriate to the subject matter.
PSU Primary sampling unit or the first stage in a multistage
sample. Replicate estimate An estimate of the population quantity based on the
replicate subsample using the same estimation methods used to compute the full sample estimate.
Replicate sample A sample derived by deleting a subsample of the
originally observed sample where the subsampling procedure depends on the replicate method.
Replicate weight The weight assigned to an observation for a particular
replicate subsample.

D-8
Replicates A term often used to refer to either the replicate sample or the replicate estimate, depending on context.
Replication method A method of drawing a replicate subsample and
weighting the observations that includes balanced repeated replication, jackknife replication, and bootstrap replication.
Response A possible value, or set of possible values, for a catalog
variable, as defined by the Electronic Codebook (ECB) software. For continuous variables, which have an infinite set of possible values, a category will list a range of values. For discrete variables, which have a finite set of possible values, a category most likely will represent a single value, but it can also represent a range of values.
Sampling error The standard deviation of the estimate, used to measure
the precision of the estimate. School file An HSTS data file providing detailed information on the
schools from which students were sampled. School Questionnaire A 54-item survey form that collects information about
school, teacher, and home factors that might relate to student achievement. It was completed by a school official (usually the principal) as part of NAEP for the NAEP participating schools.
SD/LEP file An HSTS data file that provides detailed information on
students with disabilities and/or limited English proficiency.
SD/LEP Questionnaire Formerly known as the Individualized Education
Plan/Limited English Proficiency (IEP/LEP) Questionnaire, this survey form includes information collected from school staff about students with disabilities and students with limited English proficiency. The SD/LEP Questionnaire was completed for students sampled for NAEP and identified by the school as having a disability and/or limited English proficiency. Schools were asked to have the person most knowledgeable about a student complete the questionnaire. In large schools, this person was typically a counselor, a special education teacher, or a teacher of English as a Second Language. In smaller schools, this person was typically a classroom teacher.
Secondary School Taxonomy The framework initially used by the High School
Transcript Study for analyzing transcript data. The taxonomy divides high school coursework into three distinct curricula: Academic, Vocational, and Personal
D-9
Enrichment/Other. Academic curricula include six course subjects: Mathematics, Science, English, Social Studies, Fine Arts, and Foreign Languages. Vocational curricula include three course subjects: Consumer and Homemaking Education, General Labor Market Preparation, and Specific Labor Market Preparation. Personal Enrichment/Other curricula include five course subjects: General Skills, Personal Health and Physical Education, Religion, Military Science, and All Other Courses. The HSTS added two additional course subjects: Computer-related Studies (under Academic) and Special Education (under Personal Enrichment/Other).
SIF The School Information Form. The SIF was completed
by the field worker or a school staff member or sometimes by both. The completed SIF contained information about the school in general, about sources of information within the school (if needed to complete HSTS data collection), about the course description materials, about graduation requirements and grading practices at the school, and about the format of the school’s transcripts.
Stub A CSSC category. With 2,268 codes in the CSSC, it is
neither practical nor desirable to include estimates of each possible code in each of the tables. Instead, it is often more useful to analyze the courses in larger groups such as English, Social Studies, Mathematics, or Science. There are 16 main stubs that represent each subject area category represented by the Secondary School Taxonomy. As there is also interest in finer divisions of these groups (e.g. Biology, Chemistry, and Physics within Science), along with combinations of core curricula credits, there are 84 additional stubs that provide more specific course categories.
Student file An HSTS data file providing demographic information
on all students in the study, as well as sampling weights and summaries of their coursetaking histories.
Student ID number A 10-digit ID number used to track students in the
HSTS. For schools fully linked to NAEP, this number matches the NAEP assessment booklet number. For students in schools where the link to NAEP was lost and for students in schools that did not participate in NAEP, this is a unique 10-digit number beginning with 990.
Student Sampling Information System The data processing procedure used to extract and verify
data from the School Information Form and the
D-10
Transcript Request Form. This process was also used in producing student ID control lists.
Summary Report A High School Transcript Study report providing tables
summarizing the coursetaking patterns of 2000 high school graduates and comparing them to those of their counterparts in 1990, 1994, and 1998. The report also provides tables describing the relationship of the coursetaking patterns of 2000 graduates to their proficiencies in mathematics and science as measured by the 2000 National Assessment of Educational Progress (NAEP 2000).
Taxonomy The classification of items into larger categories. In the
High School Transcript Study, the items are specific secondary school courses (e.g., composition, first-year algebra, Advanced Placement biology, American government) that are classified into 16 course subject categories, as organized according to the Secondary School Taxonomy, based on course content and level.
Test and Honors file An HSTS data file providing a list of honors and
standardized test results that were included on the transcripts.
Transcript A student’s secondary school record containing courses
taken, grades, graduation status, and attendance. In addition, it often includes assessments such as PSAT, SAT, ACT, and honors.
Transcript file An HSTS data file providing a complete list of all
courses appearing on the transcripts of students in the study.
TRF Transcript Request Form. For each school, the field
worker was given a TRF. In addition to the ID, it contained columns for entering graduation status (Exit Status) and the student’s gender, birth month and year, race/ethnicity, SD status, LEP status, Title 1 services receipt, and National School Lunch Program participation. The TRF was used in the data entry, verification, quality control, and other stages of the study. There are two versions of the form, one used for schools with a link to NAEP (Version 1) and one for non-NAEP participating schools (Version 2).
User’s Guide and Technical Report A document detailing procedures used to collect and
summarize the data. It also provides information needed to use all publicly released data files produced by the study.
D-11
Vocational course A school course that provides students with the academic and technical knowledge and skills needed for further education and/or careers requiring less than a bachelor’s degree. At the high school level, vocational courses include courses in consumer and homemaking education, general labor market preparation, and specific labor market preparation.
Weighted frequency The number of times the value(s) of a variable appears
within a catalog, as defined by the weights assigned to the data file records.
Weighted percentage A relative measure of how often the value(s) of a
variable appears within a catalog as compared to all values of that variable, as defined by the weights assigned to the data file records.