Embed Size (px)
Citation preview
2017 1Q
US PE Breakdown
In partnership with
Co-sponsored by
© Merrill Communications LLC. All rights reserved.
RAISE CAPITAL,
FACILITATE THE M&A PROCESS,
MANAGE REGULATORY FILINGS
AND DELIVER REGULATED
COMMUNICATIONS
As your business grows and thrives, Merrill Corporation can help you:
+ Accelerate the due diligence process for business transactions
+ Navigate your financial disclosure obligations including IPOs, periodic reporting, notice and proxy
+ Deliver precise and compliant brand communications
We secure solutions at every phase of the business lifecycle, so you can secure ongoing impact and growth.
For more information, please contact us at 888.311.4100 or at [email protected].
merrillcorp.com
FINANCIAL TRANSACTIONS & REPORTING | MARKETING & COMMUNICATIONS FOR REGULATED INDUSTRY | CUSTOMER CONTENT & COLLABORATION SOLUTIONS
+ COLLABORATE with Merrill DataSite®
+ NAVIGATE with our cloud-based platform
+ DELIVER with Merrill Connect®
Credits & ContactPitchBook Data, Inc.
JOHN GABBERT Founder, CEO
ADLEY BOWDEN Vice President,
Market Development & Analysis
Content
DYLAN E. COX Analyst
BRYAN HANSON Data Analyst
NIZAR TARHUNI Analysis Manager
GARRETT JAMES BLACK Publisher
JENNIFER SAM Senior Graphic Designer
Contact PitchBook pitchbook.com
RESEARCH
EDITORIAL
SALES
COPYRIGHT © 2017 by PitchBook Data, Inc. All rights reserved. No part of this publication may be reproduced in any form or by any means—graphic, electronic, or mechanical, including photocopying, recording, taping, and information storage and retrieval systems—without the express written permission of PitchBook Data, Inc. Contents are based on information from sources believed to be reliable, but accuracy and completeness cannot be guaranteed. Nothing herein should be construed as any past, current or future recommendation to buy or sell any security or an offer to sell, or a solicitation of an offer to buy any security. This material does not purport to contain all of the information that a prospective investor may wish to consider and is not to be relied upon as such or used in substitution for the exercise of independent judgment.
Introduction 4
Overview 5-6
Q&A: Merrill Corporation 7
Deals by Size & Sector 8
Exits 9-10
Q&A: Murray Devine 11-12
Fundraising 13-14
League Tables 15
Contents
ABOUT MERRILL CORPORATION
Merrill Corporation provides technology-enabled platforms for secure content sharing, regulated communications and disclosure
services. Clients trust Merrill’s innovative applications and deep subject expertise to successfully navigate the secure sharing of their
most sensitive content, perfect and distribute critical financial and regulatory disclosures, and create customized communications
across stakeholders. With more than 3,800 people in 41 locations worldwide, clients turn to Merrill when their need to manage
complex content intersects with the need to collaborate securely around the globe.
IN PARTNERSHIP WITH
3 PITCHBOOK 1Q 2017 US PE BREAKDOWN
CO-SPONSORED BY
IntroductionKey takeaways
» After reaching new highs in 2016, M&A multiples inched higher in the first
quarter of this year. The median EV/EBITDA multiple hit 10.8x in 1Q 2017, up
from 10.7x last year.
» US private equity fundraising is still on a tear. Capital commitments totaled
$55.8 billion across 57 vehicles in 1Q 2017—on track for a 15.8% year-over-
year increase in dollar value.
» PE firms are showing more interest in tech than ever before. One-fifth of all
PE deals in the first quarter involved companies in the IT sector.
The US PE industry faces a complex dealmaking environment that could turn
unfriendly if current trends hold. Company inventory and dry powder have
ballooned, while deal flow and fundraising carry on at historic levels. Meanwhile,
fewer portfolio companies are switching hands, which only adds to the industry’s
heft. Certain trends have evolved recently—most notable are PE’s interest in the
tech sector and extended fund lifecycles.
In the following pages, we’ll examine each phase of the industry’s cycle and
investigate the factors most relevant to investors. We hope this report is useful in
your practice. Please feel free to contact us at [email protected] with any
questions or comments.
DYLAN E. COX
Analyst
Look up a company.
And its cap table.
And its investors.
And its EBITDA
multiples.
And its board
members.
In seconds.
The PitchBook Platform
has the data you need
to close your next deal.
Learn more at
pitchbook.com
The PitchBook PlatformThe data in this report comes from the PitchBook Platform–our data software for
VC, PE and M&A. Contact [email protected] to request a free trial.
IN PARTNERSHIP WITH
4 PITCHBOOK 1Q 2017 US PE BREAKDOWN CO-SPONSORED BY
Strong deal flow expectedOverview
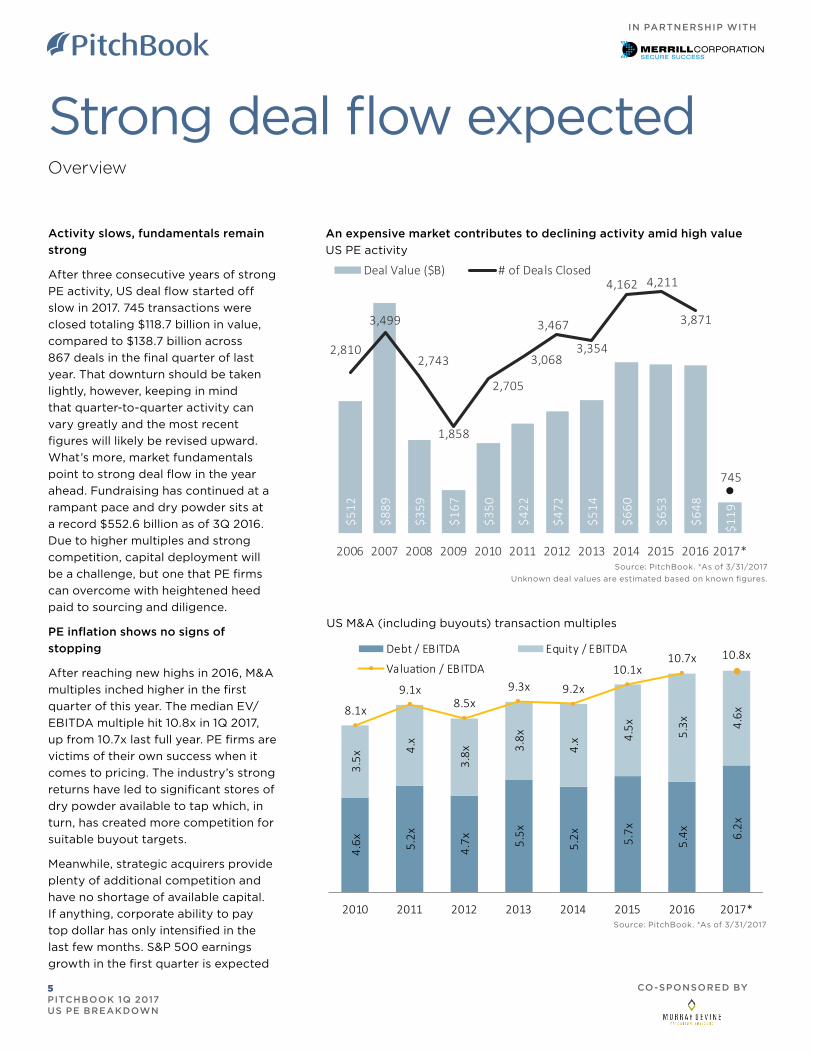
Activity slows, fundamentals remain
strong
After three consecutive years of strong
PE activity, US deal flow started off
slow in 2017. 745 transactions were
closed totaling $118.7 billion in value,
compared to $138.7 billion across
867 deals in the final quarter of last
year. That downturn should be taken
lightly, however, keeping in mind
that quarter-to-quarter activity can
vary greatly and the most recent
figures will likely be revised upward.
What’s more, market fundamentals
point to strong deal flow in the year
ahead. Fundraising has continued at a
rampant pace and dry powder sits at
a record $552.6 billion as of 3Q 2016.
Due to higher multiples and strong
competition, capital deployment will
be a challenge, but one that PE firms
can overcome with heightened heed
paid to sourcing and diligence.
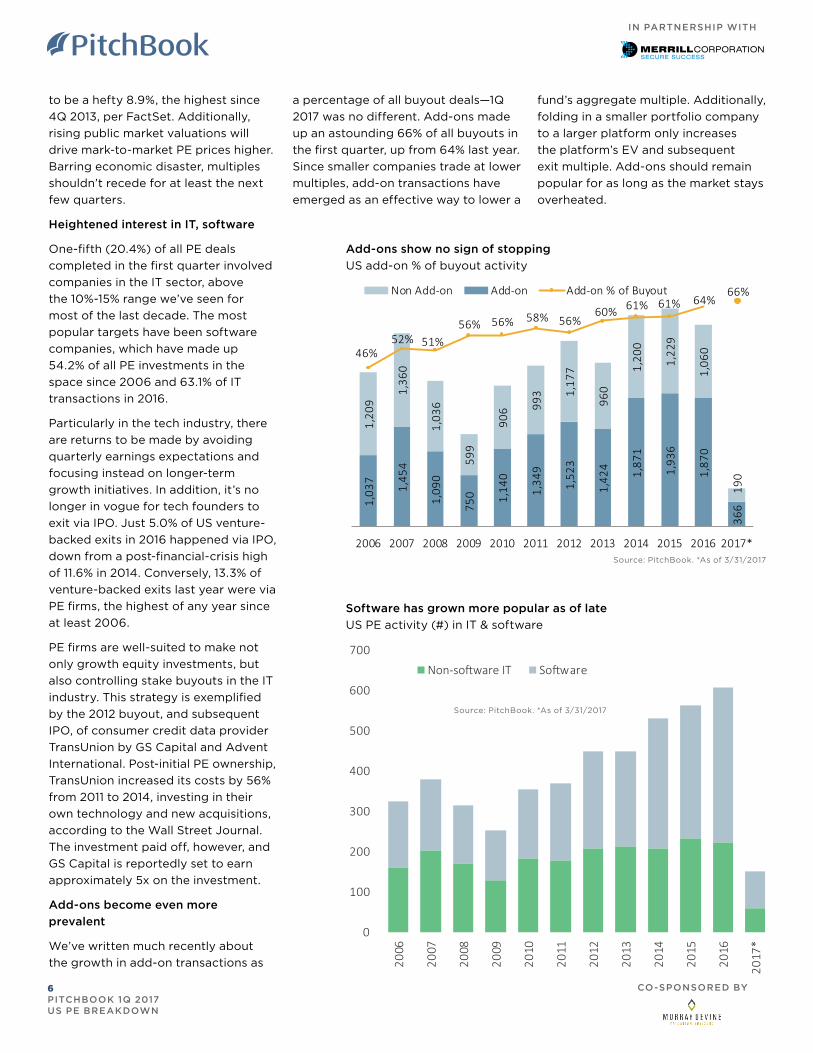
PE inflation shows no signs of
stopping
After reaching new highs in 2016, M&A
multiples inched higher in the first
quarter of this year. The median EV/
EBITDA multiple hit 10.8x in 1Q 2017,
up from 10.7x last full year. PE firms are
victims of their own success when it
comes to pricing. The industry’s strong
returns have led to significant stores of
dry powder available to tap which, in
turn, has created more competition for
suitable buyout targets.
Meanwhile, strategic acquirers provide
plenty of additional competition and
have no shortage of available capital.
If anything, corporate ability to pay
top dollar has only intensified in the
last few months. S&P 500 earnings
growth in the first quarter is expected
An expensive market contributes to declining activity amid high value
US PE activity
Source: PitchBook. *As of 3/31/2017
Unknown deal values are estimated based on known figures.
US M&A (including buyouts) transaction multiples
$512
$889
$359
$167
$350
$422
$472
$514
$660
$653
$648
$119
2,810
3,499
2,743
1,858
2,705
3,068
3,467
3,354
4,162 4,211
3,871
745
2006 2007 2008 2009 2010 2011 2012 2013 2014 2015 2016 2017*
Deal Value ($B) # of Deals Closed
4.6x 5.
2x
4.7x 5.
5x
5.2x 5.7x
5.4x 6.
2x
3.5x
4.x
3.8x 3.
8x
4.x 4.
5x 5.3x 4.
6x8.1x
9.1x8.5x
9.3x 9.2x10.1x
10.7x 10.8x
2010 2011 2012 2013 2014 2015 2016 2017*
Debt / EBITDA Equity / EBITDA
Valua�on / EBITDA
Source: PitchBook. *As of 3/31/2017
IN PARTNERSHIP WITH
5 PITCHBOOK 1Q 2017 US PE BREAKDOWN
CO-SPONSORED BY
Add-ons show no sign of stopping
US add-on % of buyout activity
to be a hefty 8.9%, the highest since
4Q 2013, per FactSet. Additionally,
rising public market valuations will
drive mark-to-market PE prices higher.
Barring economic disaster, multiples
shouldn’t recede for at least the next
few quarters.
Heightened interest in IT, software
One-fifth (20.4%) of all PE deals
completed in the first quarter involved
companies in the IT sector, above
the 10%-15% range we’ve seen for
most of the last decade. The most
popular targets have been software
companies, which have made up
54.2% of all PE investments in the
space since 2006 and 63.1% of IT
transactions in 2016.
Particularly in the tech industry, there
are returns to be made by avoiding
quarterly earnings expectations and
focusing instead on longer-term
growth initiatives. In addition, it’s no
longer in vogue for tech founders to
exit via IPO. Just 5.0% of US venture-
backed exits in 2016 happened via IPO,
down from a post-financial-crisis high
of 11.6% in 2014. Conversely, 13.3% of
venture-backed exits last year were via
PE firms, the highest of any year since
at least 2006.
PE firms are well-suited to make not
only growth equity investments, but
also controlling stake buyouts in the IT
industry. This strategy is exemplified
by the 2012 buyout, and subsequent
IPO, of consumer credit data provider
TransUnion by GS Capital and Advent
International. Post-initial PE ownership,
TransUnion increased its costs by 56%
from 2011 to 2014, investing in their
own technology and new acquisitions,
according to the Wall Street Journal.
The investment paid off, however, and
GS Capital is reportedly set to earn
approximately 5x on the investment.
Add-ons become even more
prevalent
We’ve written much recently about
the growth in add-on transactions as
Software has grown more popular as of late
US PE activity (#) in IT & software
1,03
7
1,45
4
1,09
0
750 1,14
0
1,34
9
1,52
3
1,42
4 1,87
1
1,93
6
1,87
0
366
1,20
9
1,36
0
1,03
6
599
906 99
3 1,17
7
960
1,20
0
1,22
9
1,06
0
190
46%52% 51%
56% 56% 58% 56%60% 61% 61% 64%
66%
2006 2007 2008 2009 2010 2011 2012 2013 2014 2015 2016 2017*
Non Add-on Add-on Add-on % of Buyout
Source: PitchBook. *As of 3/31/2017
0
100
200
300
400
500
600
700
2006
2007
2008
2009
2010
2011
2012
2013
2014
2015
2016
2017
*
Non-so�ware IT So�ware
Source: PitchBook. *As of 3/31/2017
a percentage of all buyout deals—1Q
2017 was no different. Add-ons made
up an astounding 66% of all buyouts in
the first quarter, up from 64% last year.
Since smaller companies trade at lower
multiples, add-on transactions have
emerged as an effective way to lower a
fund’s aggregate multiple. Additionally,
folding in a smaller portfolio company
to a larger platform only increases
the platform’s EV and subsequent
exit multiple. Add-ons should remain
popular for as long as the market stays
overheated.
IN PARTNERSHIP WITH
6 PITCHBOOK 1Q 2017 US PE BREAKDOWN
CO-SPONSORED BY
In the wake of the AHCA failing to
pass, how are dealmakers grappling
with the level of uncertainty around
key policies and regulations in the US
healthcare industry?
On an anecdotal basis, many targets
are still getting assessed as they would
in the past, simply through more
protracted and rigorous processes.
Looking at completed deal volume
even on the broader M&A front,
it’s clear that the closing rate of
Richard A. Martin, Jr. Senior Director
Merrill Corporation
Richard A. Martin, Jr. is a Senior Director at Merrill Corporation, responsible for Merrill DataSite’s global marketing group. His 18 years of marketing experience working and residing in the US, U.K. and Europe has developed Martin’s understanding of disparate business cultures and the global financial industry, evidenced by a successful record of growing businesses. Martin currently works closely with financial professionals to provide first class virtual data room (VDR) solutions for their transaction and due diligence needs. Prior to joining Merrill, Martin led the hedge fund marketing strategy group at Morgan Stanley Capital International and the global equity product strategy group at Reuters International, London. He received his B.A. from Dartmouth College, a marketing certificate from the University of Michigan Business School and currently resides in New York City with his wife and children.
In the context of Medicare Access and
CHIP Reauthorization Act (MACRA) of
2015 being implemented in 2017, what
will be the impact of new reporting/
documentation requirements to
document patient outcomes on the
industry in general as they increase
time spent on reporting and filing
requirements?
Many businesses have already begun
preparations to fully prepare for
additional compliance and quality-
based efforts. Others may well fall
behind. Larger networks will likely
move to address lower-performing
centers or performers by either
divesting or reallocating resources;
consolidation will be encouraged as
well among some. Greater emphasis
will be placed on reducing the overall
cost in terms of time and dollars spent
complying with new requirements,
leading to investment in product suites
that can help expedite documentation.
McKinsey recently posited that
corporate divestitures could represent
a worthwhile opportunity for PE
buyers. What’s your take?
Especially as M&A within the
healthcare sector slows by tally of
completed transactions, those still
seeking to win regulatory approval
more swiftly will only be further
motivated to sell non-core units, which
could prove a boon to PE investors,
as the McKinsey piece notes. What I’d
add on to the McKinsey analysis is the
fact larger PE firms that have steadily
grown their own capabilities in IT and
sales channels can compare favorably
in terms of cost infrastructure to
corporate bidders, and thus, should
they find the typical PE deal making
environs challenging enough they
broaden their focus, there could be
an uptick in healthcare corporate
divestitures to PE sponsors.
transactions and consequent deal
flow has been impacted, as activity
has been sliding. That said, certain
segments will still enjoy plenty of
interest, especially on a geographic
basis. Many key regulations are
implemented state by state, and thus
can provide a sort of geographically
focused building of platforms in
fragmented arenas such as behavioral
health. Especially if companies can
provide clear pathways toward
lowering costs of providing services or
products, they will be hunted avidly by
PE buyers.
Much of PE firms’ interest in the
past has been focused upon rolling
up smaller care providers within
niche segments such as behavioral
healthcare. Have you seen any
substantive shifts to that strategy?
The degree of fragmentation is so
extensive within particular segments
of the industry that the level of supply
has yet to diminish due to PE’s inroads.
And as a tried-and-true strategy,
platform building remains consistently
popular. The only new developments
within this arena I’d expect would be
potential shifts of focus to additional
niches as they emerge.
Which of the industry-specific
developments, such as the growing
emphasis on population health
management and “consumerizing”
treatments, are still perceived as most
important by investors?
Those businesses that enable
population health management
more effectively will be the most
sought after by investors. Areas of
particular interest could range from
telemedicine-based products and
revamps of back-end processes to
render check-ins, post-care check-
ups and billing more convenient, to
renovation of the often-daunting web
portals of care and product providers
to enable greater transparency and
fluidity of ease.
SPONSORED BY
7 PITCHBOOK 1Q 2017 US PE BREAKDOWN
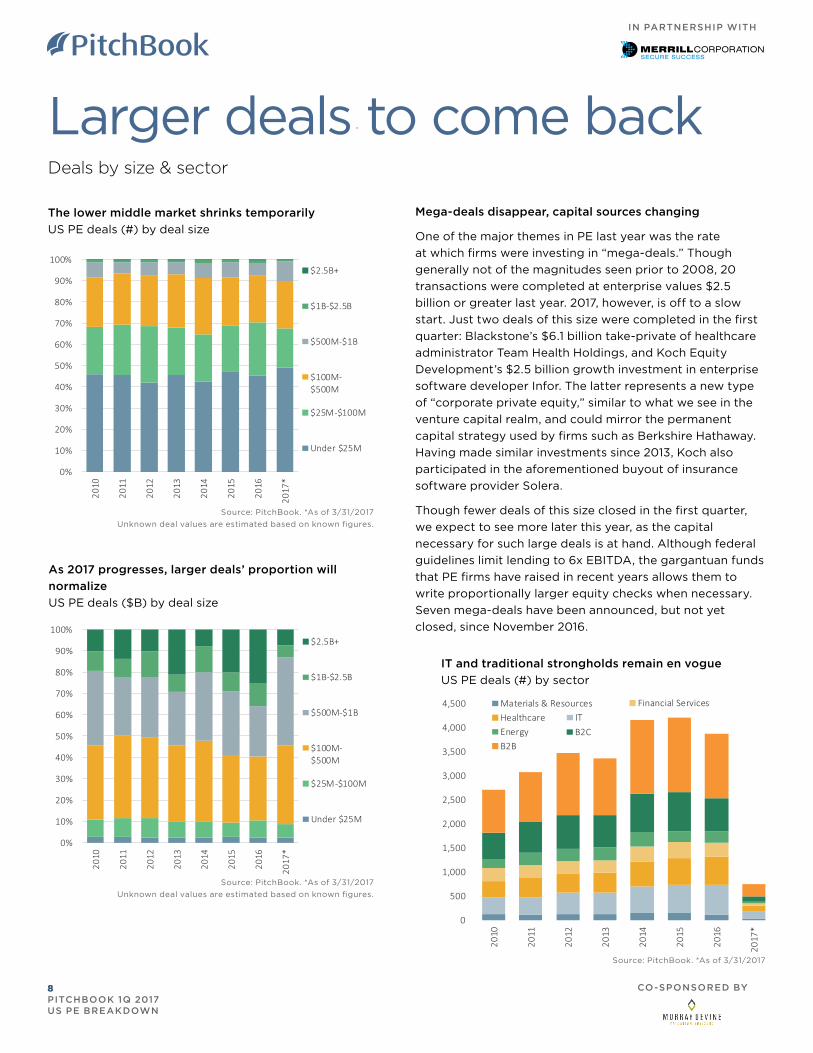
IT and traditional strongholds remain en vogue
US PE deals (#) by sector
The lower middle market shrinks temporarily
US PE deals (#) by deal size
As 2017 progresses, larger deals’ proportion will
normalize
US PE deals ($B) by deal size
Source: PitchBook. *As of 3/31/2017
Unknown deal values are estimated based on known figures.
Larger deals to come backDeals by size & sector
0%
10%
20%
30%
40%
50%
60%
70%
80%
90%
100%
2010
2011
2012
2013
2014
2015
2016
2017
*$2.5B+
$1B-$2.5B
$500M-$1B
$100M-$500M
$25M-$100M
Under $25M
0%
10%
20%
30%
40%
50%
60%
70%
80%
90%
100%
2010
2011
2012
2013
2014
2015
2016
2017
*
$2.5B+
$1B-$2.5B
$500M-$1B
$100M-$500M
$25M-$100M
Under $25M
Source: PitchBook. *As of 3/31/2017
Unknown deal values are estimated based on known figures.
0
500
1,000
1,500
2,000
2,500
3,000
3,500
4,000
4,500
2010
2011
2012
2013
2014
2015
2016
2017
*
Materials & ResourcesITHealthcare
Financial Services
Energy B2CB2B
Source: PitchBook. *As of 3/31/2017
Mega-deals disappear, capital sources changing
One of the major themes in PE last year was the rate
at which firms were investing in “mega-deals.” Though
generally not of the magnitudes seen prior to 2008, 20
transactions were completed at enterprise values $2.5
billion or greater last year. 2017, however, is off to a slow
start. Just two deals of this size were completed in the first
quarter: Blackstone’s $6.1 billion take-private of healthcare
administrator Team Health Holdings, and Koch Equity
Development’s $2.5 billion growth investment in enterprise
software developer Infor. The latter represents a new type
of “corporate private equity,” similar to what we see in the
venture capital realm, and could mirror the permanent
capital strategy used by firms such as Berkshire Hathaway.
Having made similar investments since 2013, Koch also
participated in the aforementioned buyout of insurance
software provider Solera.
Though fewer deals of this size closed in the first quarter,
we expect to see more later this year, as the capital
necessary for such large deals is at hand. Although federal
guidelines limit lending to 6x EBITDA, the gargantuan funds
that PE firms have raised in recent years allows them to
write proportionally larger equity checks when necessary.
Seven mega-deals have been announced, but not yet
closed, since November 2016.
IN PARTNERSHIP WITH
8 PITCHBOOK 1Q 2017 US PE BREAKDOWN
CO-SPONSORED BY
Exits remain a question markExits
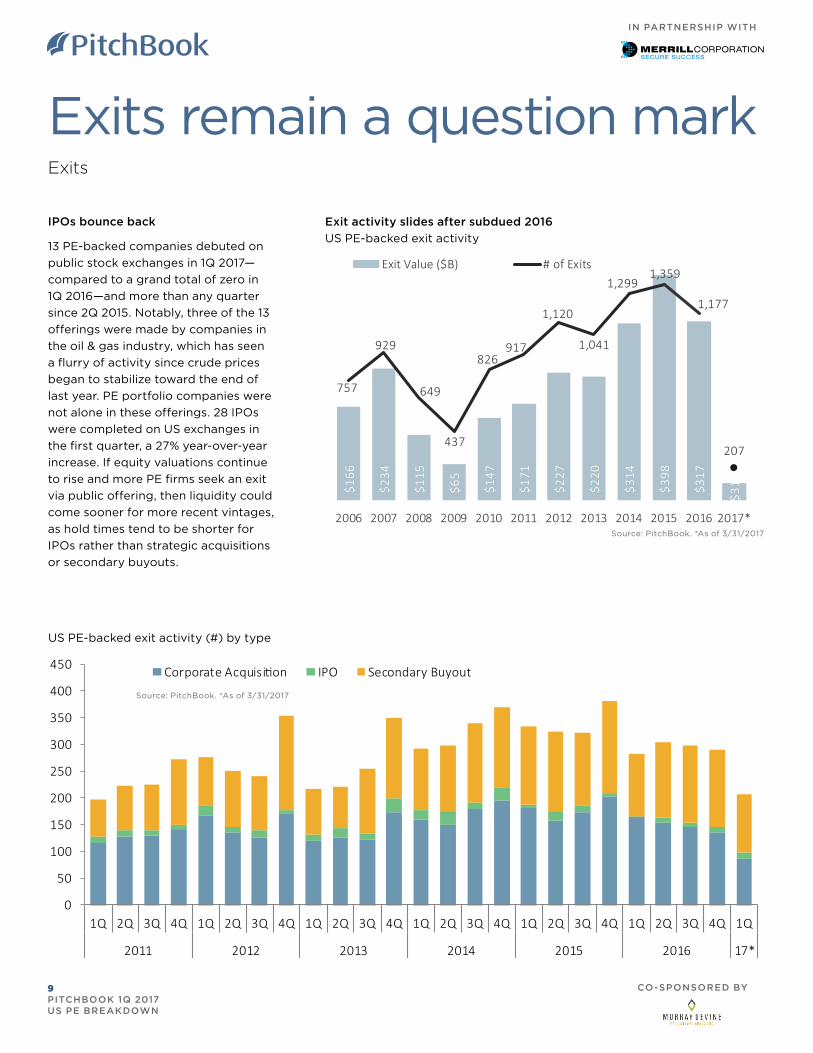
IPOs bounce back
13 PE-backed companies debuted on
public stock exchanges in 1Q 2017—
compared to a grand total of zero in
1Q 2016—and more than any quarter
since 2Q 2015. Notably, three of the 13
offerings were made by companies in
the oil & gas industry, which has seen
a flurry of activity since crude prices
began to stabilize toward the end of
last year. PE portfolio companies were
not alone in these offerings. 28 IPOs
were completed on US exchanges in
the first quarter, a 27% year-over-year
increase. If equity valuations continue
to rise and more PE firms seek an exit
via public offering, then liquidity could
come sooner for more recent vintages,
as hold times tend to be shorter for
IPOs rather than strategic acquisitions
or secondary buyouts.
US PE-backed exit activity (#) by type
Exit activity slides after subdued 2016
US PE-backed exit activity
$166
$234
$115
$65
$147
$171
$227
$220
$314
$398
$317
$31
757
929
649
437
826917
1,120
1,041
1,2991,359
1,177
207
2006 2007 2008 2009 2010 2011 2012 2013 2014 2015 2016 2017*
Exit Value ($B) # of Exits
0
50
100
150
200
250
300
350
400
450
1Q 2Q 3Q 4Q 1Q 2Q 3Q 4Q 1Q 2Q 3Q 4Q 1Q 2Q 3Q 4Q 1Q 2Q 3Q 4Q 1Q 2Q 3Q 4Q 1Q
2011 2012 2013 2014 2015 2016 17*
Corporate Acquisi�on IPO Secondary Buyout
Source: PitchBook. *As of 3/31/2017
Source: PitchBook. *As of 3/31/2017
IN PARTNERSHIP WITH
9 PITCHBOOK 1Q 2017 US PE BREAKDOWN
CO-SPONSORED BY
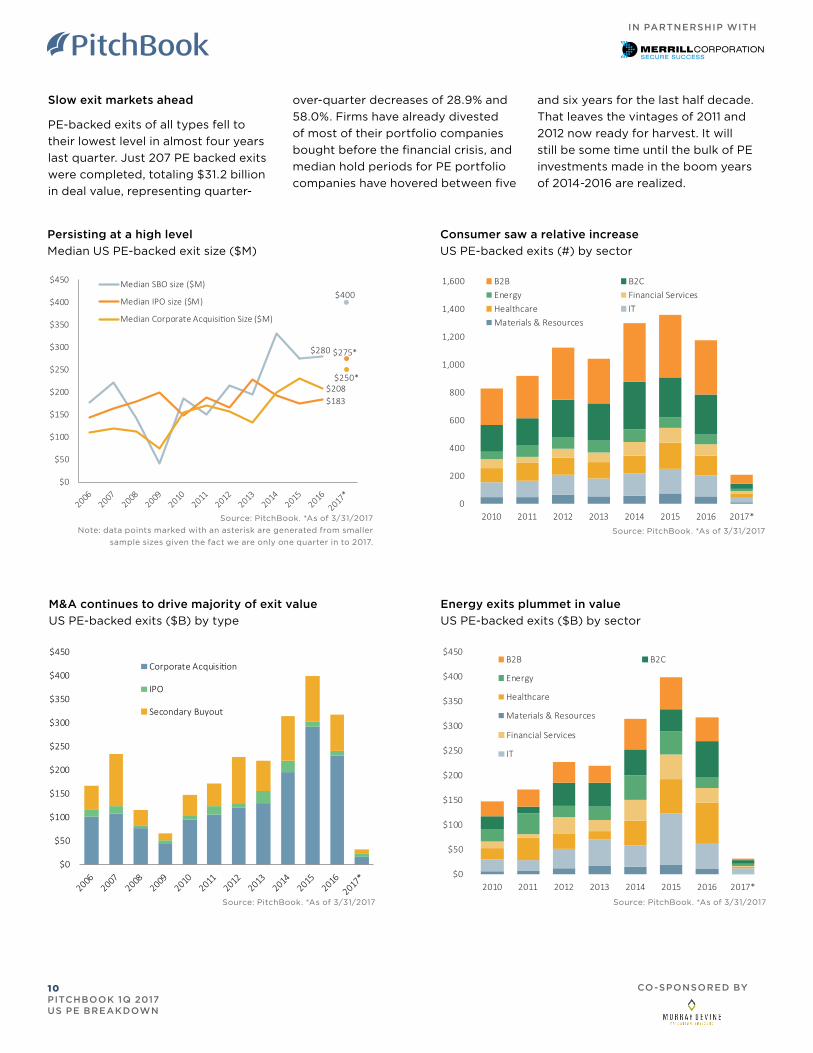
Slow exit markets ahead
PE-backed exits of all types fell to
their lowest level in almost four years
last quarter. Just 207 PE backed exits
were completed, totaling $31.2 billion
in deal value, representing quarter-
over-quarter decreases of 28.9% and
58.0%. Firms have already divested
of most of their portfolio companies
bought before the financial crisis, and
median hold periods for PE portfolio
companies have hovered between five
and six years for the last half decade.
That leaves the vintages of 2011 and
2012 now ready for harvest. It will
still be some time until the bulk of PE
investments made in the boom years
of 2014-2016 are realized.
$280
$400
$275*
$250*
$0
$50
$100
$150
$200
$250
$300
$350
$400
$450 Median SBO size ($M)
Median IPO size ($M)
Median Corporate Acquisi�on Size ($M)
$208$183
Source: PitchBook. *As of 3/31/2017
Note: data points marked with an asterisk are generated from smaller
sample sizes given the fact we are only one quarter in to 2017.
0
200
400
600
800
1,000
1,200
1,400
1,600
2010 2011 2012 2013 2014 2015 2016 2017*
B2B B2CEnergy Financial ServicesHealthcare ITMaterials & Resources
Source: PitchBook. *As of 3/31/2017
$0
$50
$100
$150
$200
$250
$300
$350
$400
$450Corporate Acquisi�on
IPO
Secondary Buyout
Source: PitchBook. *As of 3/31/2017
$0
$50
$100
$150
$200
$250
$300
$350
$400
$450
2010 2011 2012 2013 2014 2015 2016 2017*
B2B B2C
Energy
Financial Services
Healthcare
IT
Materials & Resources
Source: PitchBook. *As of 3/31/2017
IN PARTNERSHIP WITH
10 PITCHBOOK 1Q 2017 US PE BREAKDOWN
CO-SPONSORED BY
Energy exits plummet in value
US PE-backed exits ($B) by sector
Consumer saw a relative increase
US PE-backed exits (#) by sector
M&A continues to drive majority of exit value
US PE-backed exits ($B) by type
Persisting at a high level
Median US PE-backed exit size ($M)
Looking back at the first quarter,
this was the first full period in which
dealmakers and investors had
clarity about the direction of the
president’s policy agenda. From an
M&A perspective, how would you
characterize the market’s reaction so
far?
It’s interesting, because from
the perspective of public market
investors, the policy agenda of the
new administration served as a major
catalyst for stocks. Expectations for
tax reform, increased infrastructure
spending, regulatory rollbacks and
other initiatives were viewed in a
largely positive light, and domestic
equities hit new highs in Q1 as a result.
This kind of unbridled optimism,
however, doesn’t necessarily extend
to the PE market on an apples-to-
apples basis, but dealmakers seem as
confident as they had been last year
and in 2015.
As a general rule, PE investors,
business owners and lenders tend to
be far more deliberate as it relates
to synthesizing macro-economic
developments and then acting on
these views. With that said, many
dealmakers are generally operating as
if the new administration has extended
Neil Khettry Director
Murray Devine
Neil Khettry joined Murray Devine in 2007. His responsibilities include financial analysis and advisory services relating to financial opinions, portfolio valuations, collateralized debt obligation funds, and the valuation of business enterprises. Prior to arriving at Murray Devine, Neil was an Economic Research Analyst at the Federal Reserve Bank of Philadelphia. He received a Bachelor of Arts degree in Economics cum laude from the University of Pennsylvania in 2004 and a Masters in Business Administration with a concentration in Finance from Temple University in 2007. He is also a Chartered Financial Analyst (CFA) charterholder.
the legislation in March, nobody really
knows for sure whether or not the
administration will revisit these efforts
or if they’ll be successful.
But investors and operators in
healthcare have had to continually
adapt to a regulatory environment
that has been in constant flux. To
some degree, investors are probably
somewhat inured to the legislative
back and forth that characterizes
the space. At the same time, they’ve
also tailored their approach to
accommodate a more ambiguous
regulatory backdrop than most other
sectors.
If you look at where PE firms operate
within healthcare, for instance, they’re
primarily focused on companies that
provide services, where their exposure
to reimbursement rates or even
development risk tends to be muted.
Recall the nursing home bankruptcies
from the late 1990s, which were
triggered by significant changes in the
Medicare reimbursement rates. This
is why financial buyers are so keen to
steer clear of these types of assets,
whose fortunes rest on the political
tenor at any given point in time.
the M&A market cycle. From a deal
volume and valuation perspective,
the market has been pretty heated
for some time now. There wasn’t
necessarily an uptick in deal volume or
valuations, but the momentum of 2016
certainly carried into the first quarter.
In the first quarter, the 745 PE deals
completed represented a slight
pullback from 4Q, which is often the
case to start the year. From a high
level, the election eliminated some of
the uncertainty that had been top of
mind, but new questions will always
emerge, and we saw that in 1Q. The
number of exits, for instance, were
down significantly, which also probably
underscores that the smart money
sees more runway ahead to hold onto
assets and create added value.
Can you speak to some of the
lingering uncertainty that faces the
deal market today?
There are still a number of unresolved
questions around specific industries
that tend to be more exposed to
developments in Washington. Look at
what happened with the GOP’s efforts
to “repeal and replace” the Affordable
Care Act. Even after lawmakers pulled
Deal Flow & Valuations
Maintain Strength in 1QOngoing activity in the healthcare sector, in particular, reflects the ability of GPs to stay the course amid an evolving regulatory backdrop
IN PARTNERSHIP WITH
11 PITCHBOOK 1Q 2017 US PE BREAKDOWN
CO-SPONSORED BY
A lot of sponsors have also built
their investment theses in healthcare
around reducing costs. They’re
looking to back rollups of physician
practice management companies to
instill economies of scale and drive
multiple expansion. They’re also active
in the revenue-cycle management
segment, which allows healthcare
providers to focus on their core
competencies. This same theme is
driving activity in outsourced services
for pharmaceutical and biotech
companies. As a result, contract
research organizations, or CROs, that
provide outsourced clinical trials have
become popular among sponsors.
These types of strategies provide
exposure to the appealing
demographic trends of the sector,
without the risk of an unsettled
regulatory environment. Moreover,
healthcare has traditionally been
considered a safe haven that is less
correlated to the broader economy,
so that typically offers support for
valuations across market cycles.
How would you describe the impact of
the efforts to replace Obamacare on
healthcare deal flow?
We saw some landmark deals in the
large market that were abandoned
altogether, such as Cigna’s $54 billion
acquisition of Anthem and the $34
billion merger between Aetna and
Humana. Both deals ran into antitrust
scrutiny, so it’s hard to blame it on
uncertainty around the ACA.
Deal flow in the small and middle
market remains strong, particularly
among PE investors. If there have
been any reservations among buyers,
it’s probably attributable to the rich
valuations that companies are fetching
in the space. The number of PE-backed
healthcare deals in the first quarter, at
118, was down slightly, but the amount
of capital invested in the sector was
more than any other quarter over the
previous three years.
So many firms have developed
specializations within the healthcare
sector. This is a trend that ultimately
supports deal flow. Ten years ago,
when there were more generalist firms
in the market, we think some of this
regulatory uncertainty might have
scared off some of the tourists in the
sector. Today, buyers are approaching
the space with a far greater
understanding around the opportunity
and risks, which provides them with
the conviction needed to stay active.
This is also probably why the higher
valuations haven’t scared investors
off either, because they’re coming in
with a value-creation plan and backing
executives who have gone through
market cycles before.
As you look ahead to the second
quarter and even the second half of
2017, how do you see the rest of the
year shaping up as it relates to the
broader deal market?
That’s a good question. The transition
to the new administration will continue
to generate headlines, but I think
dealmakers will be more attuned to the
economic picture and the continued
appetite among lenders.
We perform valuation services
for a number of leading business
development companies, for instance,
and their portfolios look strong. This
speaks to their continued appetite to
lend to growing companies. As long as
there is liquidity in the debt markets,
sponsors will stay active. Globally,
PE firms also have more than $750
billion of dry powder at their disposal,
according to PitchBook’s most recent
fundraising report. So barring any
unforeseen developments, we think the
deal market should show continued
strength throughout the year.
Look up a company.
And its cap table.
And its investors.
And its EBITDA
multiples.
And its board
members.
In seconds.
The PitchBook Platform
has the data you need
to close your next deal.
Learn more at
pitchbook.com
IN PARTNERSHIP WITH
12 PITCHBOOK 1Q 2017 US PE BREAKDOWN CO-SPONSORED BY
Will the fundraising cycle slow?Fundraising
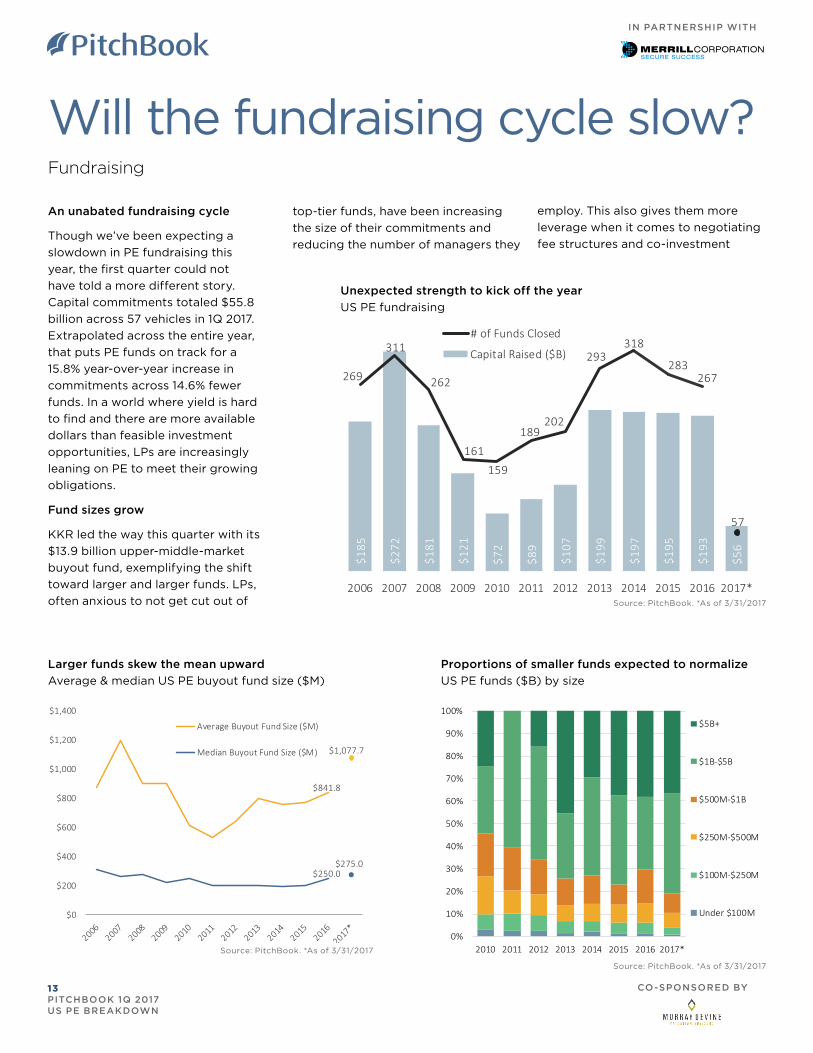
An unabated fundraising cycle
Though we’ve been expecting a
slowdown in PE fundraising this
year, the first quarter could not
have told a more different story.
Capital commitments totaled $55.8
billion across 57 vehicles in 1Q 2017.
Extrapolated across the entire year,
that puts PE funds on track for a
15.8% year-over-year increase in
commitments across 14.6% fewer
funds. In a world where yield is hard
to find and there are more available
dollars than feasible investment
opportunities, LPs are increasingly
leaning on PE to meet their growing
obligations.
Fund sizes grow
KKR led the way this quarter with its
$13.9 billion upper-middle-market
buyout fund, exemplifying the shift
toward larger and larger funds. LPs,
often anxious to not get cut out of
Unexpected strength to kick off the year
US PE fundraising
Larger funds skew the mean upward
Average & median US PE buyout fund size ($M)
top-tier funds, have been increasing
the size of their commitments and
reducing the number of managers they
employ. This also gives them more
leverage when it comes to negotiating
fee structures and co-investment
Proportions of smaller funds expected to normalize
US PE funds ($B) by size
$185
$272
$181
$121
$72
$89
$107
$199
$197
$195
$193
$56
269
311
262
161159
189202
293318
283267
57
2006 2007 2008 2009 2010 2011 2012 2013 2014 2015 2016 2017*
Capital Raised ($B)
# of Funds Closed
Source: PitchBook. *As of 3/31/2017
$841.8
$1,077.7
$250.0$275.0
$0
$200
$400
$600
$800
$1,000
$1,200
$1,400
Average Buyout Fund Size ($M)
Median Buyout Fund Size ($M)
Source: PitchBook. *As of 3/31/2017
0%
10%
20%
30%
40%
50%
60%
70%
80%
90%
100%
2010 2011 2012 2013 2014 2015 2016 2017*
$5B+
$1B-$5B
$500M-$1B
$250M-$500M
$100M-$250M
Under $100M
Source: PitchBook. *As of 3/31/2017
IN PARTNERSHIP WITH
13 PITCHBOOK 1Q 2017 US PE BREAKDOWN
CO-SPONSORED BY
A new peak in fundraising success of the past decade
US PE funds (#) to hit target
Given larger funds, an uptick in time taken to close
aligns with expectations
US PE fund time metrics (months)
opportunities. PE firms are then
able to wager more, both in terms of
their targeted commitments and the
subsequent equity checks written for
investments. Fund sizes increased
yet again in 1Q 2017, particularly for
buyout vehicles, which saw median
fund size increase to $275 million. If
this figure holds through the rest of the
year, it will be the highest since 2008,
when median buyout fund size was an
equivalent $275 million.
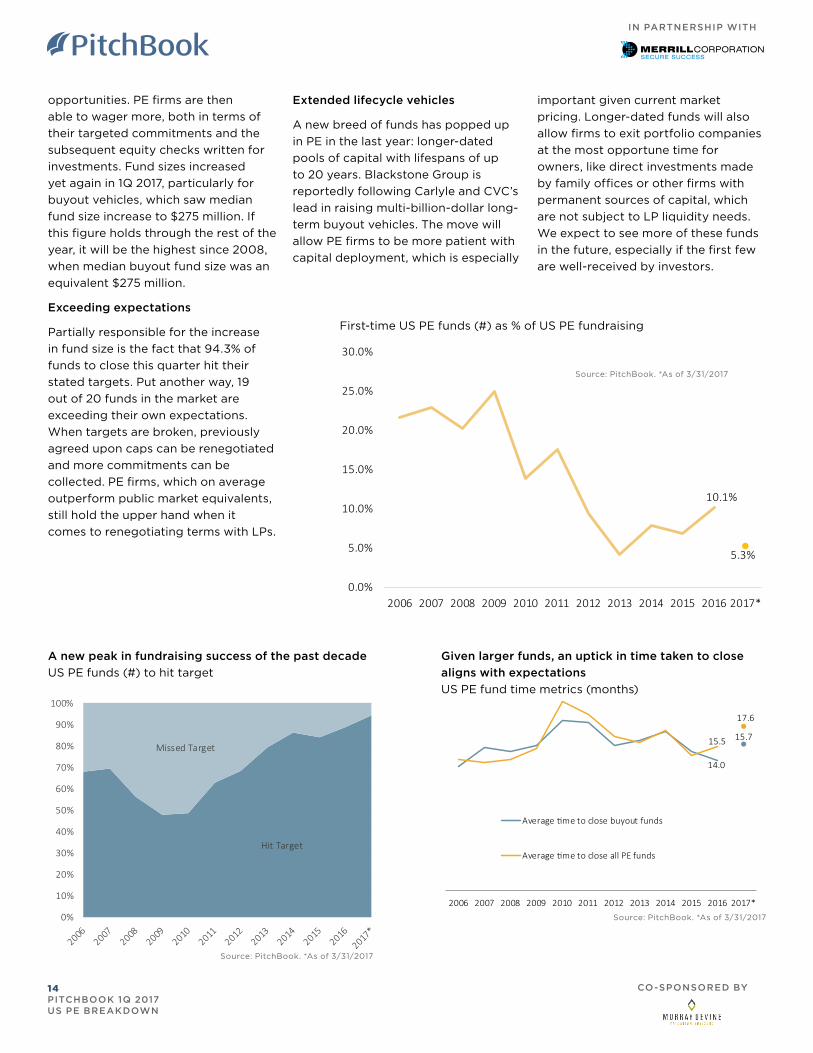
Exceeding expectations
Partially responsible for the increase
in fund size is the fact that 94.3% of
funds to close this quarter hit their
stated targets. Put another way, 19
out of 20 funds in the market are
exceeding their own expectations.
When targets are broken, previously
agreed upon caps can be renegotiated
and more commitments can be
collected. PE firms, which on average
outperform public market equivalents,
still hold the upper hand when it
comes to renegotiating terms with LPs.
First-time US PE funds (#) as % of US PE fundraising
Extended lifecycle vehicles
A new breed of funds has popped up
in PE in the last year: longer-dated
pools of capital with lifespans of up
to 20 years. Blackstone Group is
reportedly following Carlyle and CVC’s
lead in raising multi-billion-dollar long-
term buyout vehicles. The move will
allow PE firms to be more patient with
capital deployment, which is especially
important given current market
pricing. Longer-dated funds will also
allow firms to exit portfolio companies
at the most opportune time for
owners, like direct investments made
by family offices or other firms with
permanent sources of capital, which
are not subject to LP liquidity needs.
We expect to see more of these funds
in the future, especially if the first few
are well-received by investors.
10.1%
5.3%
0.0%
5.0%
10.0%
15.0%
20.0%
25.0%
30.0%
2006 2007 2008 2009 2010 2011 2012 2013 2014 2015 2016 2017*
0%
10%
20%
30%
40%
50%
60%
70%
80%
90%
100%
Hit Target
Missed Target
Source: PitchBook. *As of 3/31/2017
Source: PitchBook. *As of 3/31/2017
Source: PitchBook. *As of 3/31/2017
14.0
15.715.5
17.6
2006 2007 2008 2009 2010 2011 2012 2013 2014 2015 2016 2017*
Average �me to close buyout funds
Average �me to close all PE funds
IN PARTNERSHIP WITH
14 PITCHBOOK 1Q 2017 US PE BREAKDOWN
CO-SPONSORED BY
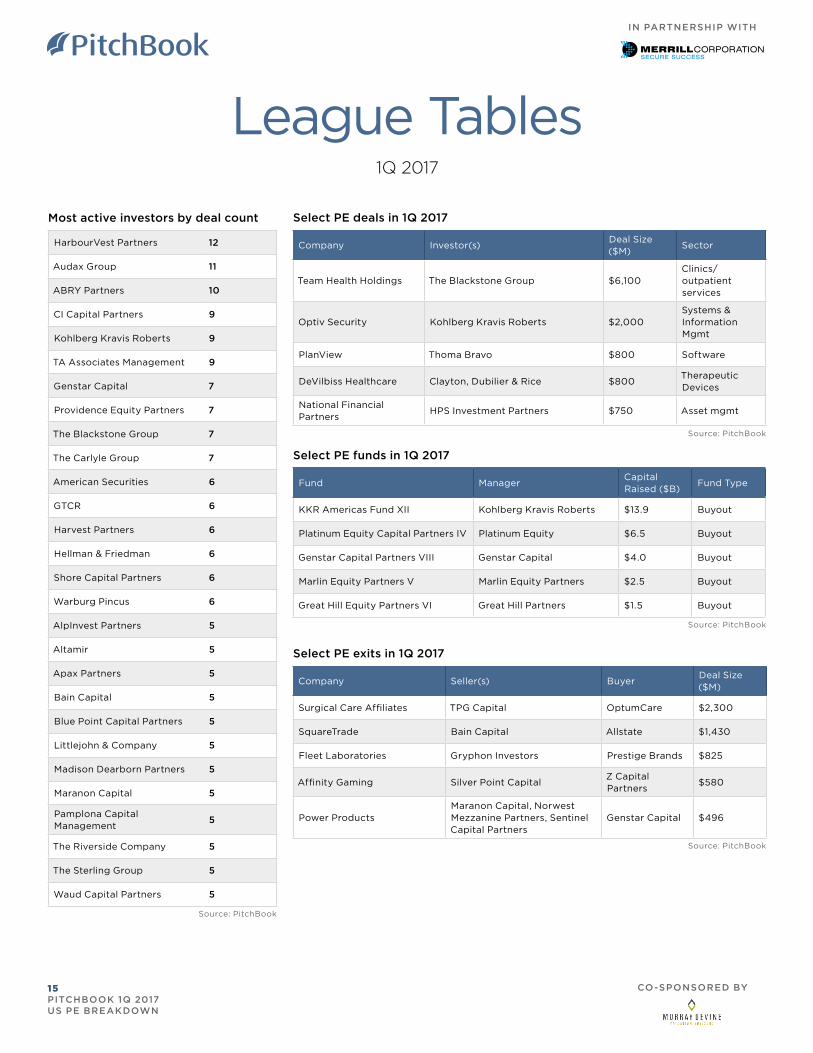
League Tables1Q 2017
HarbourVest Partners 12
Audax Group 11
ABRY Partners 10
CI Capital Partners 9
Kohlberg Kravis Roberts 9
TA Associates Management 9
Genstar Capital 7
Providence Equity Partners 7
The Blackstone Group 7
The Carlyle Group 7
American Securities 6
GTCR 6
Harvest Partners 6
Hellman & Friedman 6
Shore Capital Partners 6
Warburg Pincus 6
AlpInvest Partners 5
Altamir 5
Apax Partners 5
Bain Capital 5
Blue Point Capital Partners 5
Littlejohn & Company 5
Madison Dearborn Partners 5
Maranon Capital 5
Pamplona Capital Management
5
The Riverside Company 5
The Sterling Group 5
Waud Capital Partners 5
Most active investors by deal count Select PE deals in 1Q 2017
Source: PitchBook
Company Investor(s)Deal Size ($M)
Sector
Team Health Holdings The Blackstone Group $6,100Clinics/outpatient services
Optiv Security Kohlberg Kravis Roberts $2,000Systems & Information Mgmt
PlanView Thoma Bravo $800 Software
DeVilbiss Healthcare Clayton, Dubilier & Rice $800Therapeutic Devices
National Financial Partners
HPS Investment Partners $750 Asset mgmt
Fund ManagerCapital Raised ($B)
Fund Type
KKR Americas Fund XII Kohlberg Kravis Roberts $13.9 Buyout
Platinum Equity Capital Partners IV Platinum Equity $6.5 Buyout
Genstar Capital Partners VIII Genstar Capital $4.0 Buyout
Marlin Equity Partners V Marlin Equity Partners $2.5 Buyout
Great Hill Equity Partners VI Great Hill Partners $1.5 Buyout
Source: PitchBook
Select PE funds in 1Q 2017
Source: PitchBook
Company Seller(s) BuyerDeal Size ($M)
Surgical Care Affiliates TPG Capital OptumCare $2,300
SquareTrade Bain Capital Allstate $1,430
Fleet Laboratories Gryphon Investors Prestige Brands $825
Affinity Gaming Silver Point CapitalZ Capital Partners
$580
Power ProductsMaranon Capital, Norwest Mezzanine Partners, Sentinel Capital Partners
Genstar Capital $496
Select PE exits in 1Q 2017
Source: PitchBook
IN PARTNERSHIP WITH
15 PITCHBOOK 1Q 2017 US PE BREAKDOWN
CO-SPONSORED BY

See how the PitchBook Platform can
help your private equity firm close your
next deal.
We do EBITDA multiples,private comps,valuations,market trends,growth metrics.
You build a better portfolio.