Embed Size (px)
Citation preview

U.S. Oil & Gas Industry
Chartbook
BBVA Research USA
Houston, TX March 2015
DISCLAIMER This document was prepared by Banco Bilbao Vizcaya (BBVA) BBVA Research U.S. on behalf of itself and its affiliated companies (each BBVA Group Company) for distribution in the United States and the rest of the world and is provided for information purposes only. Within the US, BBVA operates primarily through its subsidiary Compass Bank. The information, opinions, estimates and forecasts contained herein refer to the specific date and are subject to changes without notice due to market fluctuations. The information, opinions, estimates and forecasts contained in this document have been gathered or obtained from public sources, believed to be correct by the Company concerning their accuracy, completeness, and/or correctness. This document is not an offer to sell or a solicitation to acquire or dispose of an interest in securities.

Bottom Line
• The drastic fall in oil in prices continues to remain at the forefront of economic activity, with the potential for faster economic growth (via higher consumption)
• Although prices appear to be stabilizing, the continued imbalance between supply and demand is expected to keep oil prices low in the short-run
• There are downside risks for energy-dependent industries and states, such as Texas, but there will ultimately be a rebalancing among states and regions
• The decline in oil prices is a net positive to the U.S. economy, benefiting consumers and energy-intensive industries

3
Oil Prices

4
Spot Prices U.S. Crude Oil and Natural Gas Spot Prices (avg, $/bbl & $/MMBTU)
Source: Haver Analytics
0
2
4
6
8
10
12
14
16
18
0
20
40
60
80
100
120
140
160
2005 2006 2007 2008 2009 2010 2011 2012 2013 2014 2015
WTI (lhs)
Natural gas (rhs)
Great Recession
U,.S economy expands 2.9% between 2004-2007 U.S. production of crude oil goes from 4.9
million B/D to 9 million B/D

5
Spot Prices U.S. WTI Spot Price (avg, $/bbl)
Source: Haver Analytics
0
20
40
60
80
100
120
Jun-14 Jul-14 Aug-14 Sep-14 Oct-14 Nov-14 Dec-14 Jan-15 Feb-15 Mar-15
Saudi Arabia refusal to boost
production
China reports faster GDP growth U.S. sanctions to Russia
OPEC announces weaker demand U.S. production reaches record
high
EIA cuts its oil price forecasts
Libyan production increases by more than 300% from June 2014. Iraqi production increases by 24%
from previous year.
Eurozone GDP flat in Q2 14 due to shock contraction in
Germany
Rig count falls to lowest level since
July 2011
WTI at $49.61 as of March 6, 2015

6 Projections are generated by simulation of the EIA Regional Short-Term Energy Model Source: Energy Information Administration/ Haver Analytics
Prices WTI Historical and EIA Forecast ($/bbl)
0
20
40
60
80
100
120
Forecast

7 Source: Haver Analytics
Futures Prices WTI Futures ($/bbl)
40
50
60
70
80
90
100
110
1st expiring contract (nearby) 2-month
3-month 4-month
6-month 1-year
2-year
8
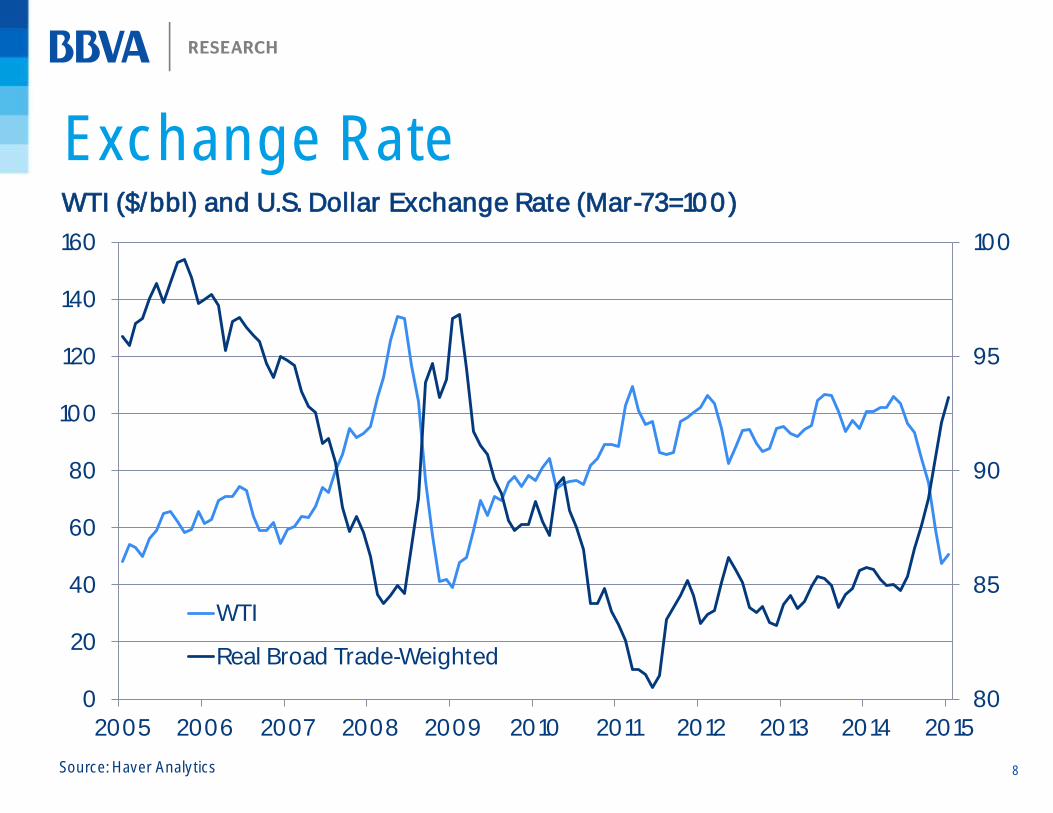
Exchange Rate WTI ($/bbl) and U.S. Dollar Exchange Rate (Mar-73=100)
Source: Haver Analytics
80
85
90
95
100
0
20
40
60
80
100
120
140
160
2005 2006 2007 2008 2009 2010 2011 2012 2013 2014 2015
WTI
Real Broad Trade-Weighted
9
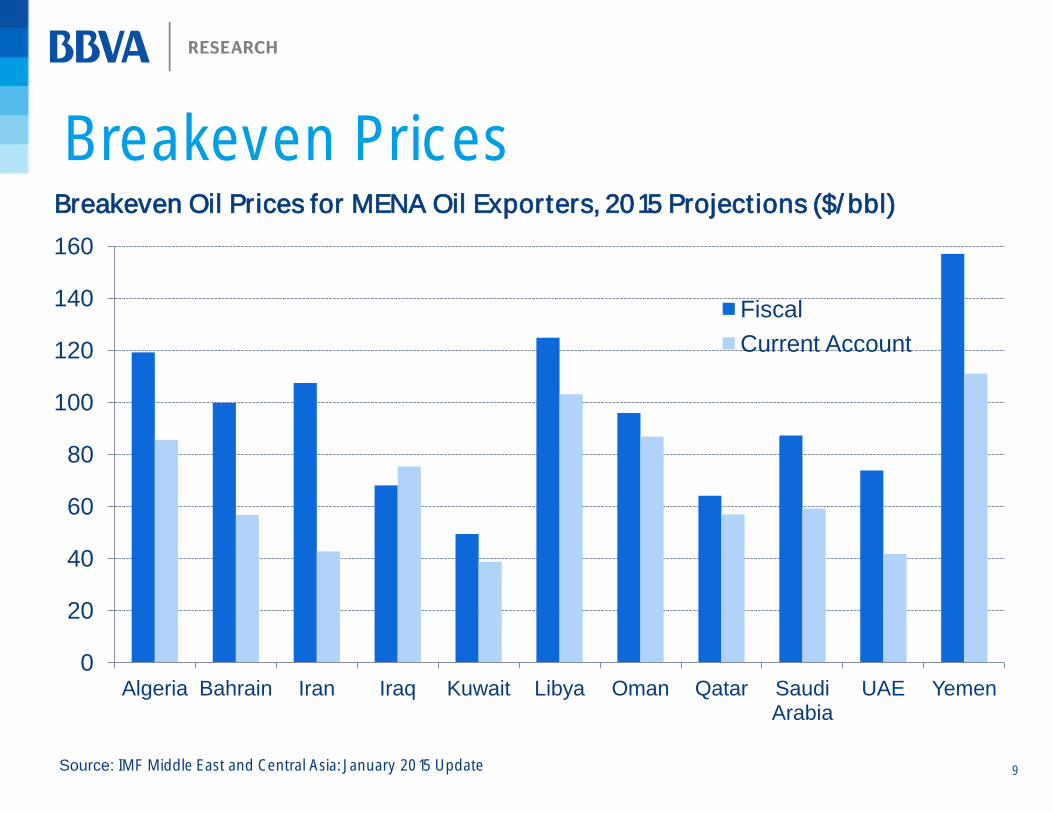
Breakeven Prices
0
20
40
60
80
100
120
140
160
Algeria Bahrain Iran Iraq Kuwait Libya Oman Qatar Saudi Arabia
UAE Yemen
Fiscal
Current Account
Breakeven Oil Prices for MENA Oil Exporters, 2015 Projections ($/bbl)
Source: IMF Middle East and Central Asia: January 2015 Update

10
Global
Supply &
Demand
11
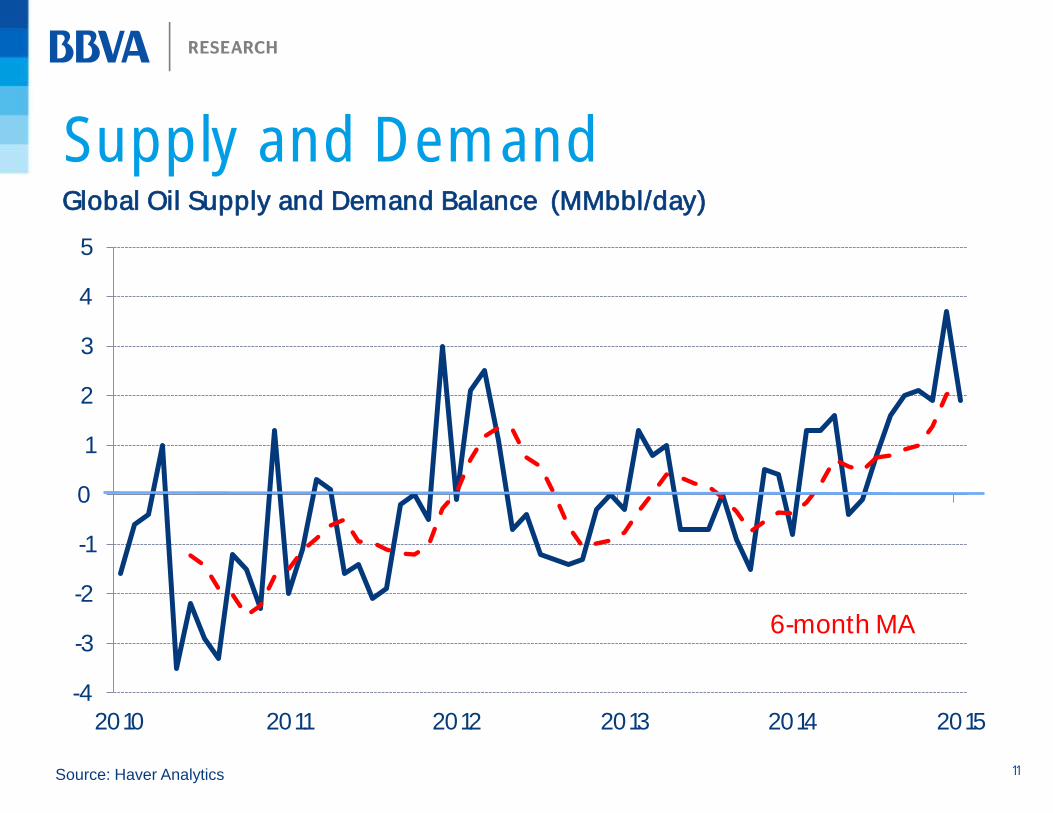
Supply and Demand Global Oil Supply and Demand Balance (MMbbl/day)
Source: Haver Analytics
-4
-3
-2
-1
0
1
2
3
4
5
2010 2011 2012 2013 2014 2015
6-month MA

12
Production Crude Oil Production (Mbbl/day, yoy % change)
Source: Haver Analytics
-10%
-5%
0%
5%
10%
15%
20%
25%
2010 2011 2012 2013 2014
OPEC U.S. Other Non-OPEC

13
Supply by Region Proved Crude Oil Reserves in 2013
(share of total, %)
Worldwide Production in 2013
(share of total, %)
Source: 2014 BP Statistical Review of World Energy & BP Energy Outlook 2035
19%
9%
20% 32%
10% 9%
North America Central and South America Europe Middle East Africa Asia Pacific
14%
20%
9% 48%
8%
2%
North America
Central and South America
Europe
Middle East
Africa
Asia Pacific
14
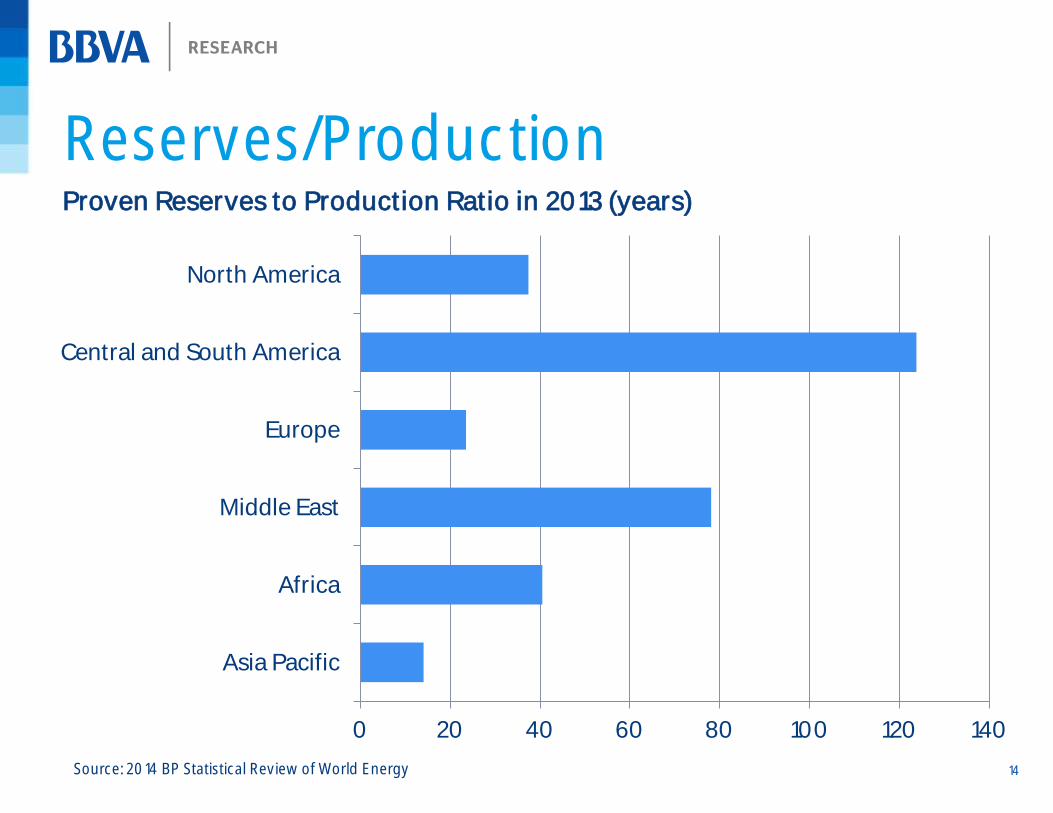
Reserves/Production Proven Reserves to Production Ratio in 2013 (years)
Source: 2014 BP Statistical Review of World Energy
0 20 40 60 80 100 120 140
Asia Pacific
Africa
Middle East
Europe
Central and South America
North America

15
Demand Oil Product Demand for Selected Regions (MMbbl/day)
Source: Haver Analytics
0
5
10
15
20
25
2005 2006 2007 2008 2009 2010 2011 2012 2013 2014 2015
China EU-15 U.S. LatAm
16
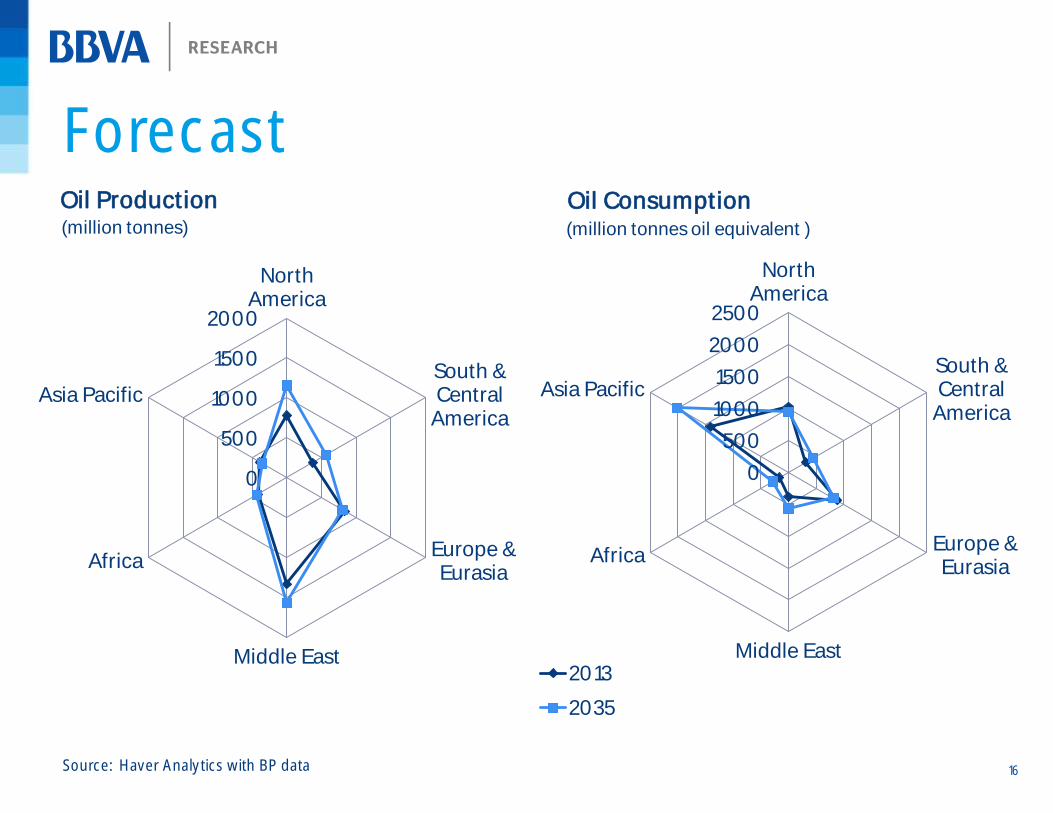
Forecast
Source: Haver Analytics with BP data
0
500
1000
1500
2000
North America
South & Central
America
Europe & Eurasia
Middle East
Africa
Asia Pacific
2013
2035
0
500
1000
1500
2000
2500
North America
South & Central
America
Europe & Eurasia
Middle East
Africa
Asia Pacific
Oil Production Oil Consumption (million tonnes) (million tonnes oil equivalent )

17
U.S. Supply
& Demand

18
Production U.S. Crude Oil Field Production (MMbbl/day)
Source: Haver Analytics
0
1000
2000
3000
4000
5000
6000
7000
8000
9000
10000
2005 2006 2007 2008 2009 2010 2011 2012 2013 2014 2015
Texas U.S.

19
Production U.S. Active Rig Count
Source: Haver Analytics
0
200
400
600
800
1000
1200
1400
2005 2006 2007 2008 2009 2010 2011 2012 2013 2014 2015
Horizontal Vertical

20
Net Imports
100
150
200
250
300
350
2004 2005 2006 2007 2008 2009 2010 2011 2012 2013 2014
Net Imports
Production
U.S. Production and Net Imports of Crude Oil (MMbbl/month)
Source: Haver Analytics
21
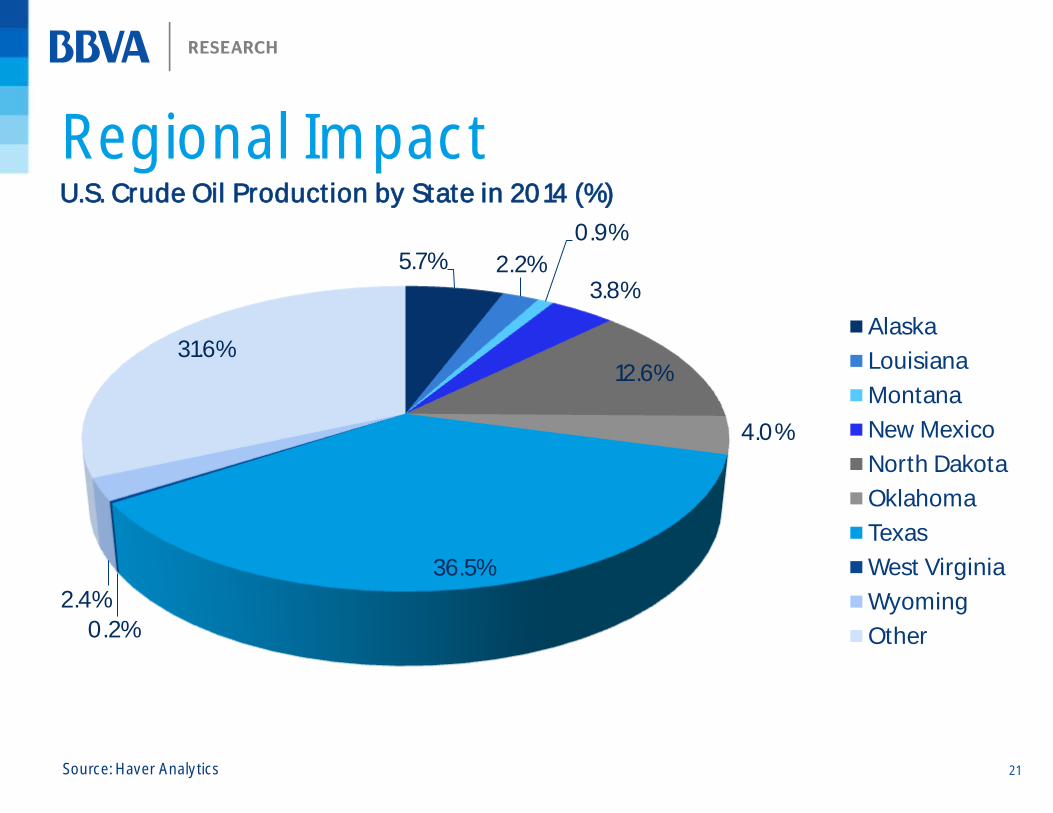
5.7% 2.2%
0.9%
3.8%
12.6%
4.0%
36.5%
0.2% 2.4%
31.6% Alaska
Louisiana
Montana
New Mexico
North Dakota
Oklahoma
Texas
West Virginia
Wyoming
Other
Regional Impact U.S. Crude Oil Production by State in 2014 (%)
Source: Haver Analytics

22
Impact on
U.S.
Economy

23
Consumer Spending U.S. Average Retail Gasoline Price vs. Real Retail Sales and Food Services (yoy % change)
Source: Haver Analytics
-14%
-12%
-10%
-8%
-6%
-4%
-2%
0%
2%
4%
6%
8%
-60%
-40%
-20%
0%
20%
40%
60%
80%
2004 2005 2006 2007 2008 2009 2010 2011 2012 2013 2014
Gas Price (lhs)
Sales (rhs)

24
Consumer Sentiment Consumer Sentiment (NSA, q1-66=100) vs. Average Retail Gasoline Prices ($/gallon)
Source: Haver Analytics
0.0
0.5
1.0
1.5
2.0
2.5
3.0
3.5
4.0
4.5
50
55
60
65
70
75
80
85
90
95
100
2004 2005 2006 2007 2008 2009 2010 2011 2012 2013 2014
Consumer Sentiment (lhs)
Gas Price (rhs)

25
Vehicle Miles Traveled
-50%
-40%
-30%
-20%
-10%
0%
10%
20%
30%
40%
50%
-4.0%
-3.0%
-2.0%
-1.0%
0.0%
1.0%
2.0%
3.0%
2004 2005 2006 2007 2008 2009 2010 2011 2012 2013 2014
Vehicle Miles of Travel (lhs)
Gas Prices (rhs)
Gasoline Prices and Vehicle Miles Traveled (yoy % change, 6-month MA)
Source: Haver Analytics
26
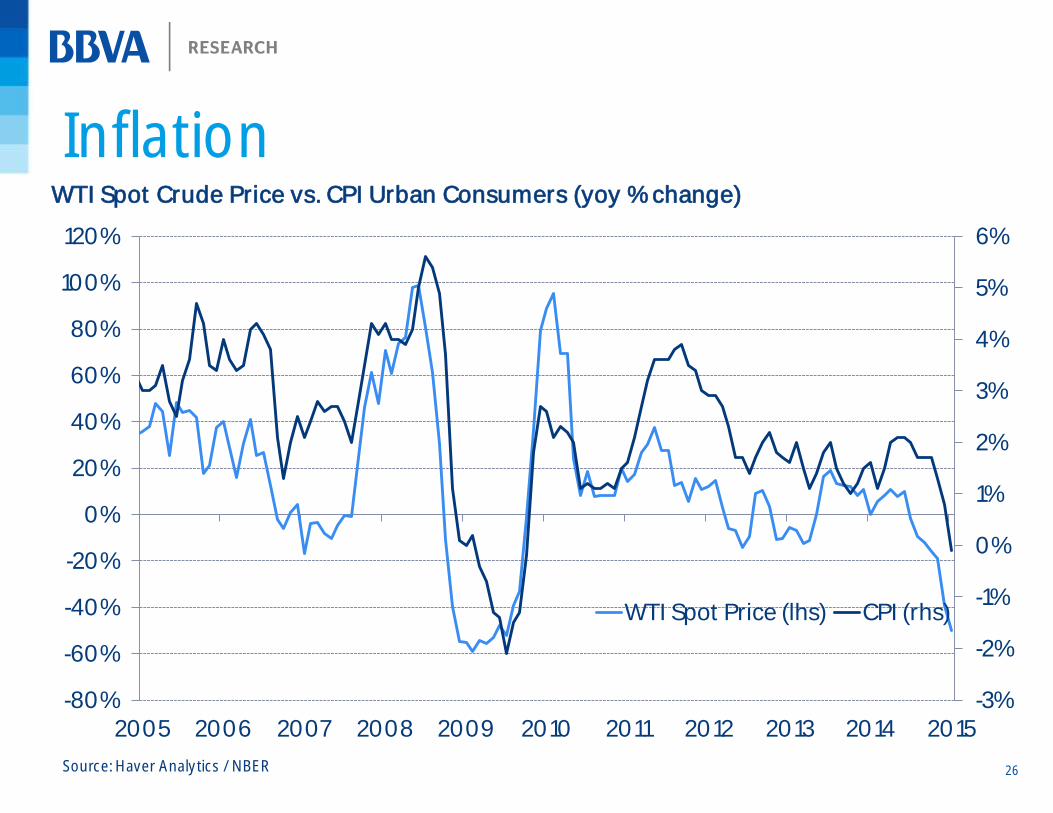
Inflation WTI Spot Crude Price vs. CPI Urban Consumers (yoy % change)
Source: Haver Analytics / NBER
-3%
-2%
-1%
0%
1%
2%
3%
4%
5%
6%
-80%
-60%
-40%
-20%
0%
20%
40%
60%
80%
100%
120%
2005 2006 2007 2008 2009 2010 2011 2012 2013 2014 2015
WTI Spot Price (lhs) CPI (rhs)
27
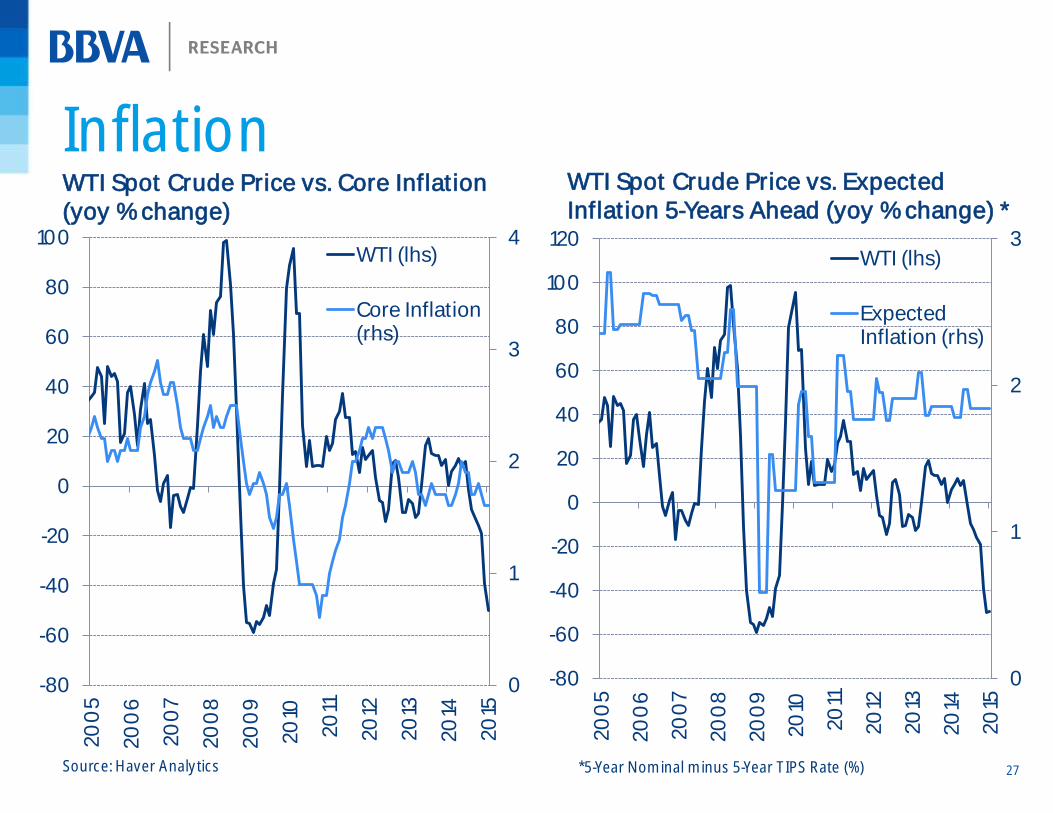
Inflation
Source: Haver Analytics
0
1
2
3
4
-80
-60
-40
-20
0
20
40
60
80
100
20
05
20
06
20
07
20
08
20
09
20
10
20
11
20
12
20
13
20
14
20
15
WTI (lhs)
Core Inflation (rhs)
0
1
2
3
-80
-60
-40
-20
0
20
40
60
80
100
120
20
05
20
06
20
07
20
08
20
09
20
10
20
11
20
12
20
13
20
14
20
15
WTI (lhs)
Expected Inflation (rhs)
WTI Spot Crude Price vs. Core Inflation (yoy % change)
WTI Spot Crude Price vs. Expected Inflation 5-Years Ahead (yoy % change) *
*5-Year Nominal minus 5-Year TIPS Rate (%)

28
Regional Impact Severance Tax as a Share of State Revenue for Selected States in 2013
Source: Haver Analytics/ Pew Charitable Trusts
0%
5%
10%
15%
20%
25%
30%
35%
Severance Tax: Tax imposed by state governments on the
removal of nonrenewable resources such as crude oil and
natural gas at their market value.
.
Share of TX State & Local Revenue from Oil and Gas Industry*
Sources: Haver Analytics, Texas Comptroller of Public Accounts, Texas Oil & Gas Association, BBVA Research
0%
2%
4%
6%
8%
10%
12%
14%
1982 1987 1992 1997 2002 2007 2012
*Includes property tax, sales and gross receipts, franchise tax,
severance tax, and land income
29
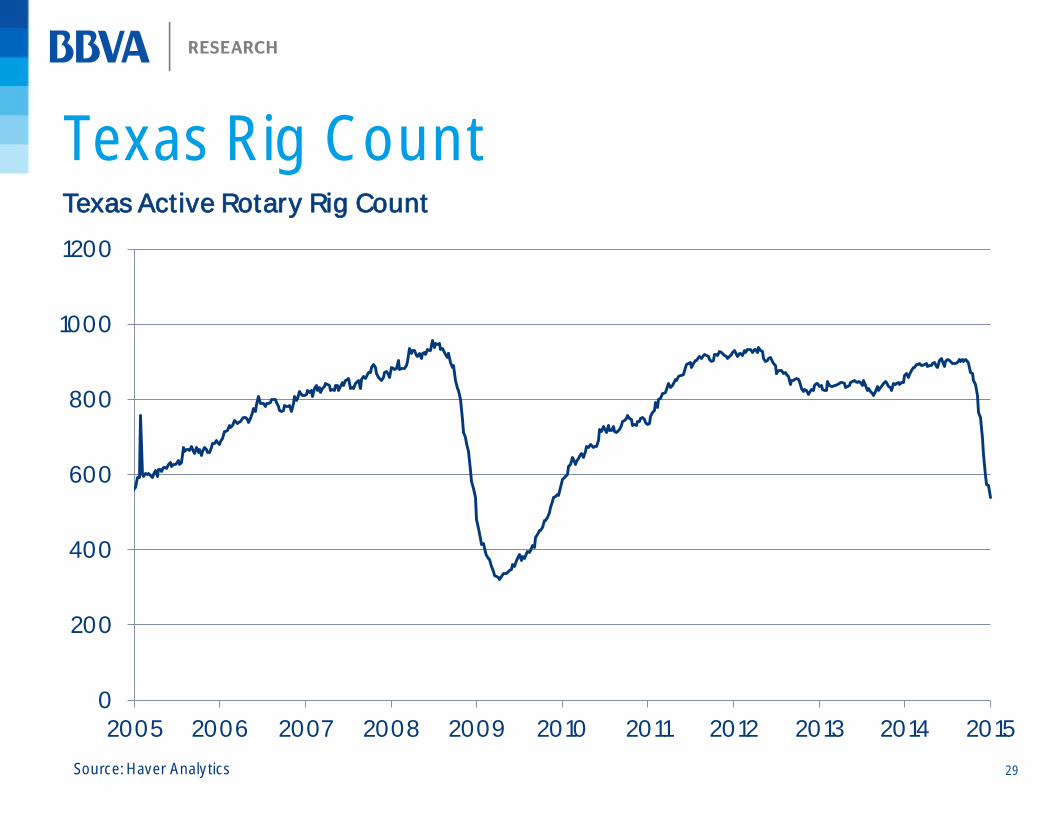
Texas Rig Count Texas Active Rotary Rig Count
Source: Haver Analytics
0
200
400
600
800
1000
1200
2005 2006 2007 2008 2009 2010 2011 2012 2013 2014 2015

30
Texas Employment Location Quotients %
Location Quotients %
0% 20% 40% 60% 80%
100% 120% 140% 160% 180%
Construction
Manufacturing
Trade, Transp & Utilities
Information
Financial Activities
Professional & Business Svc
Educational & Health Services
Leisure & Hospitality
Other Services
Government
2014 2004 1994 0
2
4
6
8
10
12
14
16
Oil & Gas Extraction Support Activities for Mining
2014
2004
1994
Source: Haver Analytics
31
Energy
Industry

32
Debt High Yield Bonds (option adjusted spreads relative to U.S. treasuries)
0
200
400
600
800
1000
1200
Energy Total
Source: Bloomberg

33
Stock Markets S&P Daily Stock Market Capitalization (Bill.$)
Source: Haver Analytics
200
250
300
350
400
450
500
550
14000
15000
16000
17000
18000
19000
20000
S&P 500 (lhs)
E&P Index (rhs)

34
Stock Markets Market Weightings, S&P 500, 2015
Source: S&P Dow Jones Indices, Seeking Alpha
IT Financials
Healthcare Consumer Discretionary
Industrials Consumer Staples
Energy Utilities
Materials Telecom
0%
2%
4%
6%
8%
10%
12%
14%
20
05
20
06
20
07
20
08
20
09
20
10
20
11
20
12
20
13
20
14
20
15
%
Historical S&P Weighting, Energy Sector

35
M&A Activity U.S. M&A Number of Deals and Volume
Source: Bloomberg
0
5E+09
1E+10
1.5E+10
2E+10
2.5E+10
3E+10
3.5E+10
4E+10
4.5E+10
5E+10
0
20
40
60
80
100
120
2010 2011 2012 2013 2014
Deal Count (lhs)
Volume (rhs)
U.S. Oil & Gas Industry
Chartbook
BBVA Research USA
Houston, TX March 2015
DISCLAIMER This document was prepared by Banco Bilbao Vizcaya (BBVA) BBVA Research U.S. on behalf of itself and its affiliated companies (each BBVA Group Company) for distribution in the United States and the rest of the world and is provided for information purposes only. Within the US, BBVA operates primarily through its subsidiary Compass Bank. The information, opinions, estimates and forecasts contained herein refer to the specific date and are subject to changes without notice due to market fluctuations. The information, opinions, estimates and forecasts contained in this document have been gathered or obtained from public sources, believed to be correct by the Company concerning their accuracy, completeness, and/or correctness. This document is not an offer to sell or a solicitation to acquire or dispose of an interest in securities.