Embed Size (px)
Citation preview
U.S. NfH fMR DRVELOPM nT CfflTfi11OHNSVILLE•, PENNSYLVANIA
Aeronautteal Electronic and Electrical Laboratory
REPORT NO. NADC-EL-5675" 10 OCT 1956
PHASE REPORT NO. 2DEVELOPMENT OF DEFINITIONS AND LIMITS FOR
FREQUENCY TRANSIENTS ANDFREQUENCY MODULATION IN
AIRCRAFT 380- TO 420-CPS ELECTRIC SYSTEMS
BUREAU OF AERONAUTICSTED Project No. ADC EL-52043
Reported by: e-"c4 -
0. MarkowitzElectrical Division
Approved by: . 0'K. R. Smythe, 6'' erintendentElectrical Division
"FOR FF"LU ' ; , : 'l AND -T17ATloN,
iidcopy~i Mi•.~T~chi, " A. C. Packard
$j3.o,, - i2s.3•3 Director
to =nlimited. u I
Best Available CopyT-.
DOCUMENT RELEASE-STATUS AD hvf!
NAVWEPSjise'' FOA39/ (E. -4
CLASSIFItA1 ON UfRIGI?.'.t:%G AG. %CY REPORT SERIES AND0 NUMBER
~i'~~'RTTIILDeivelopuient of definiti ~ REPRDT
and iiziits for frequenc~y tramaients aL=OE ,..
DeeseDc~nato Cner frequency moduu lation in airraft _10 - *oaW mtUNCLASSIFIE7' WHEN ENCLOSURE IS REM(%VEt to~t? CONTRACT`- *IJET TAS4 a*UMBER
for Scie, ~~'& PEC oiect CLSIIAINo kWLSChn i
and Technical Jnformation (DOC) EUIYCASFATO ul aot
-Bldg. N3, Cam ro~ Station REPORT
L Alexandria, Virginia 22314 _JTITLE OR SUBJECT
ABTACT OR SUMMARY
Enclosure, is forwarded for distributione subject to limitations checked below. Beus Dnme eisre nsaeabove; oneco iY of this letter be returned to originating activity if shown below; an d two copie! be sent to Chief, Bureau of Naval Weapons. I
Qualfie reuesersmayobtan cpie ofthi reort U.S. Government Agencies may obtain copies of this-reportdirect from DDC.A
direct from DDC. Other qualified DMC users should request
Quaifid rquet' rs e Ly otai11 CoiesOfthrough no source. (Not available to non-Government DDCQwiifed eqestrsmayobain coiesofthis report users.)
direct frem DDC. Foreign announcement and dissemination
of this report by DIE is not authorized.
U US. Military Agencies may obtain copies of this reportU.S. Government Agencieýi may obtain copies of this report direct from DDC. Other qualified DDC users should-requestdirect from DDC. Other qualified'DDC users shutild requesot through no source. (Not-' available to non-military DDCCthirough the- Chief, Btires~c of Naval Weapons, Washington. users.) -
D.C. 20360.
US. 'I obtain, copies or thts report All distribution of this report is controlled.- Qual Iifiedthroug h t'he Chief, Bureau of Naval Weapons, Washington,DIusr shld eqst hogh heCif Brauf
X Distribution of this document is unlimited.
r1Commanding Officer C!2ech. Lib.)U. S. Naval kir DeVelopnent Center4L W~~5i~e arminster, Pa. Y8974,-
F.) J.U MBY dwu" .
SIGNATURE TIMi~nrtItn O g
r AJANI~Chief, Bureau of Naval Weapons (Di.I.302) @.ASIII.FICMIOOW
Navy Department U C A ii ~ i~Wasilington. D.C. 20360 UNC1
L .
UNCLASSI FIED WHEN INCLOIURC 18 RCM)VID
Aeronautical Electi'odic and Electrical Laboratory
'EP DR . NAC- EL-5675REPORT 57
SUMMARY AND CONCLUSIONS
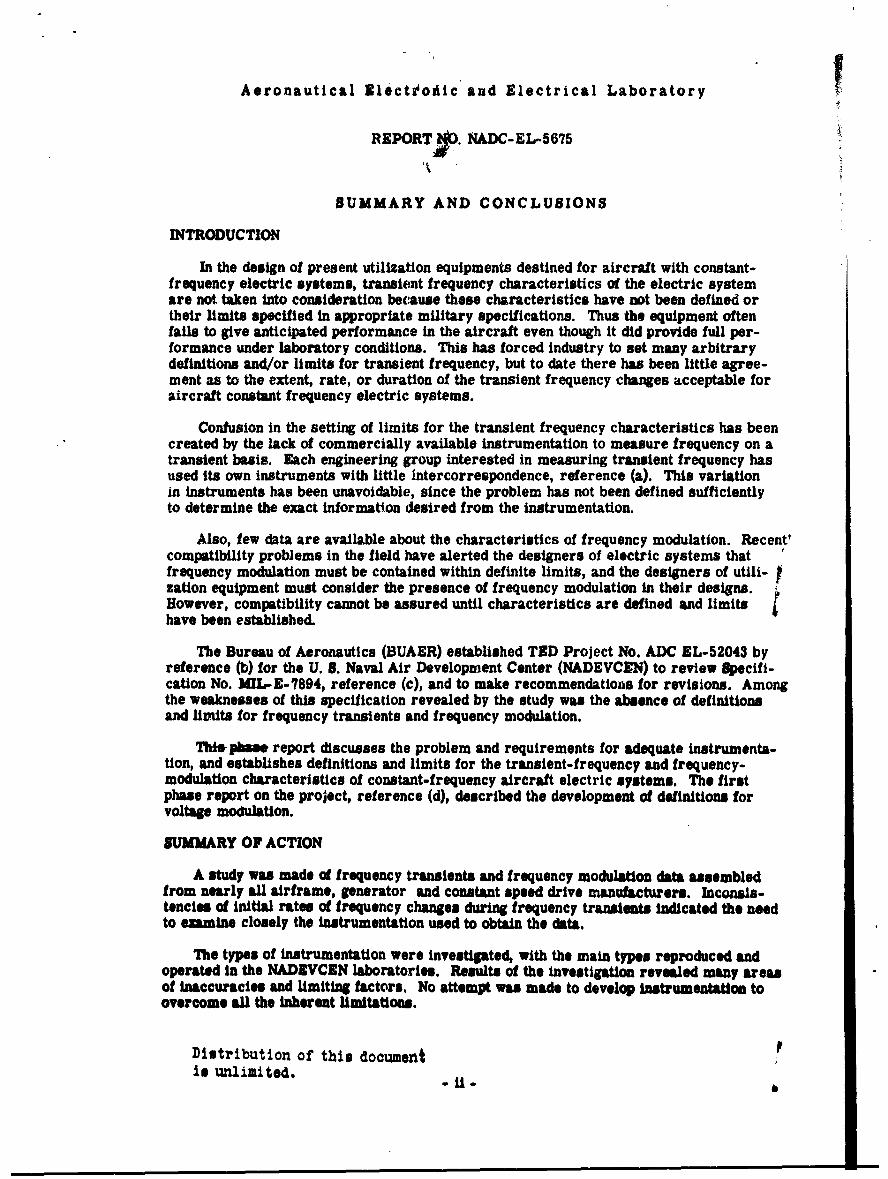
INTRODUCTION
In the design of present utilization equipments destined for aircraft with constant-frequency electric systems, transient frequency characteristics of the electric systemare not taken into consideration because these characteristics have not been defined ortheir limits specified in appropriate military specifications. Thus the equipment oftenfails to give anticipated performance in the aircraft even though it did provide full per-formance under laboratory conditions. This has forced industry to set many arbitrarydefinitions and/or limits for transient frequency, but to date there has been little agree-ment as to the extent, rate, or duration of the transient frequency changes acceptable foraircraft constant frequency electric systems.
Confusion in the setting of limits for the transient frequency characteristics has been"created by the lack of commercially available instrumentation to measure frequency on atransient basis. Each engineering group interested in measuring transient frequency hasused its own instruments with little Intercorrespondence, reference (a). This variationin instruments has been unavoidable, since the problem has not been defined sufficientlyto determine the exact information desired from the instrumentation.
Also, few data are available about the characteristics of frequency modulation. Recent'compatibility problems in the field have alerted the designers of electric systems thatfrequency modulation must be contained within definite limits, and the designers of utili-zation equipment must consider the presence of frequency modulation in their designs.However, compatibility cannot be assured until characteristics are defined and limitshave been established.
Ite Bureau of Aeronautics (BUAER) established TED Project No. ADC EL-52043 byreference (b) for the U. 8. Naval Air Development Center (NADEVCEN) to review Specifi-cation No. MIL-E-7894, reference (c), and to make recommendations for revisions. Amongthe weaknesses of this specification revealed by the study was the absence of definitionsand limits for frequency transients and frequency modulation.
TM& phas report discusses the problem and requirements for adequate instrumenta-tion, and establishes definitions and limits for the transient-frequency and frequency-modulation characteristics of constant-frequency aircraft electric systems. The firstphase report on the project, reference (d), described the development of definitions forvoltage moulation.
SUMMARY OF ACTION
A study was made of frequency transients and frequency modulation data assembledfrom nearly all airframe, generator and constant speed drive manufacturers. Inconsis-tencies of initial rates of frequency changes during frequency transients indicated the needto examine closely the instrumentation used to obtain the data.
The types of instrumentation were Investigated, with the main types reproduced andoperated In the NADEVCEN laboratories. Results of the investigation revealed many areasof inaccuracies and limiting factors. No attempt was made to develop instrumentation toovercome all the inherent limitations.
Distribution of this documentis unlimited.
Aeronautical Electronic and Electrical Laboratory
REPORT NO. NADC-EL-5675
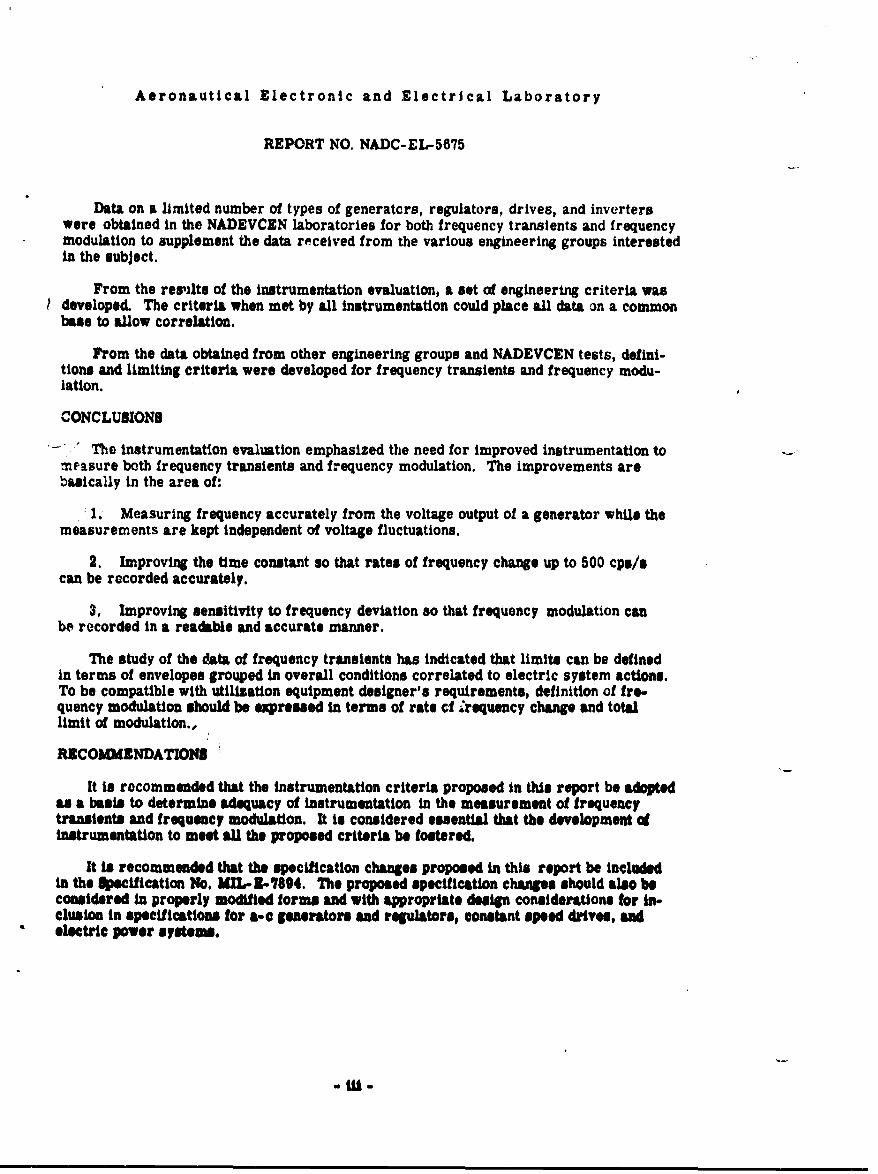
Data on a limited number of types of generators, regulators, drives, and inverterswere obtained in the NADEVCEN laboratories for both frequency transients and frequencymodulation to supplement the data received from the various engineering groups interestedin the subject.
From the resilts of the instrumentation evaluation, a net of engineering criteria wasI developed. The criteria when met by all instrumentation could place all data on a common
base to allow correlation.
From the data obtained from other engineering groups and NADEVCEN tests, defini-tions and limiting criteria were developed for frequency transients and frequency modu-lation.
"CONCLUSIONS
S.. The instrumentation evaluation emphasized the need for improved instrumentation tomeasure both frequency transients and frequency modulation. The improvements arebasically in the area of:
S 1. Measuring frequency accurately from the voltage output of a generator while themeasurements are kept independent of voltage fluctuations.
2. Improving the time constant so that rates of frequency change up to 500 cps/scan be recorded accurately.
3, Improving sensitivity to frequency deviation so that frequency modulation canbe recorded in a readable and accurate manner.
The study of the data of frequency transients has indicated that limits can be definedin terms of envelopes grouped in overall conditions correlated to electric system actions.To be compatible with utilization equipment designer's requirements, definition of fre-quency modulation should be expressed in terms of rate ef ;equency change and totallimit of modulation.,
RXCOMMENDATIONS
It is recommended that the instrumentation criteria proposed in this report be adoptedas a basis to determine adequacy of instrumentation in the measurement of frequencytransients and frequency modulation. It is considered essential that the development cfinstrumentation to meet all the proposed criteria be fostered.
It is recommended that the specification changes proposed in this report be Includedin the Specification No. MIL-Z.7894. The proposed specification changes should also beconsidered In properly modified forms and with appropriate design considerations for in-clusion in specifications for a-c generators and regulators, constant speed drives, sadelectric power systems.
.111.
Aeronautical Electronic and Electrical Laboratory
REPORT NO. NADC-EL-5675
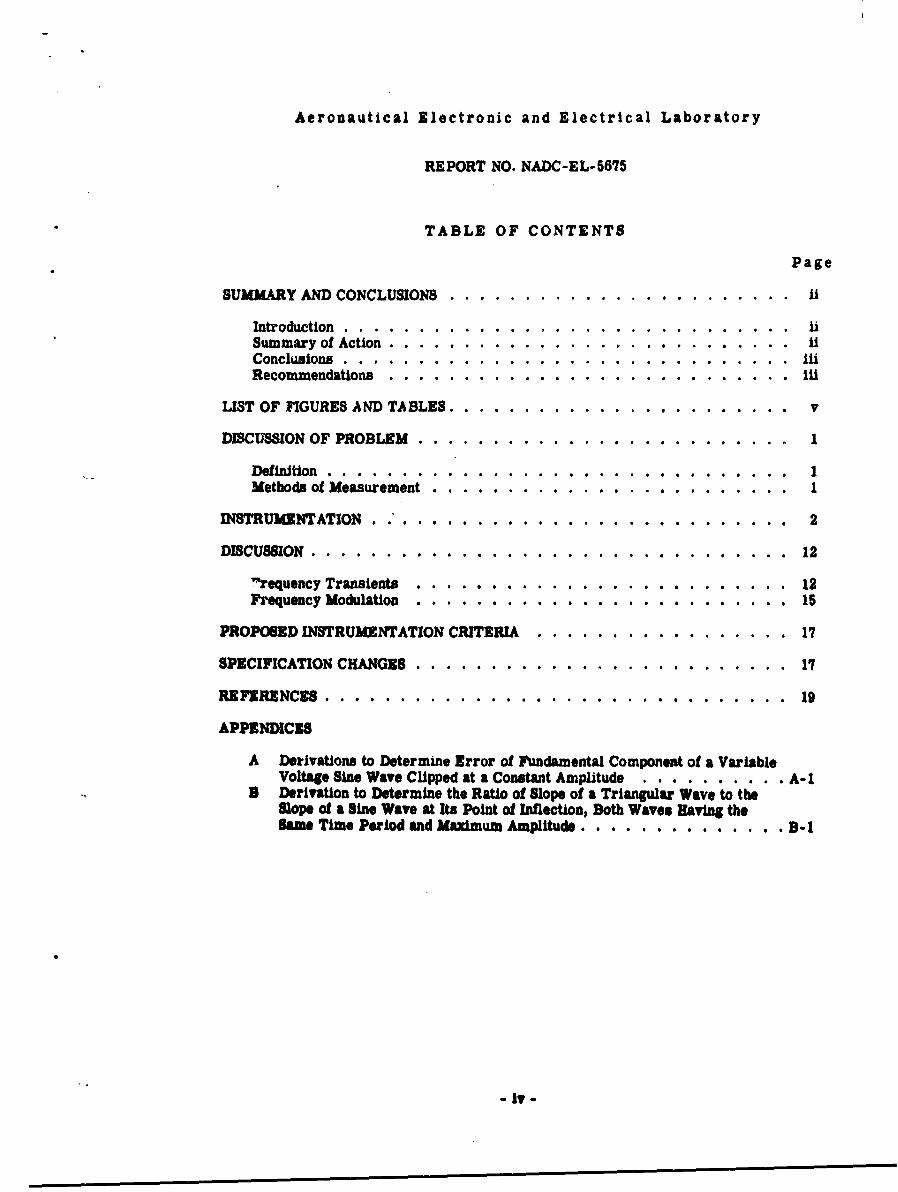
TABLE OF CONTENTS
Page
SUMMARY AND CONCLUSIONS .............. ...................... ii
Introduction ......................... ............... iiSummary of Action ............. ....................... .Conclusions ............ ........................... . . .Recommendations ..... .......................... i.
LIST OF FIGURES AND TABLES ................... ........... v
DISCUSSION OF PROBLEM ..................................... 1
Definition .................................. 1Methods of Measurement ..... ............ ......... 1
ISITRUMENTATION . ................................ 2
DISCUSSION ........ ............................... 12
"trequency Transients . . . . ...................... 12Frequency Modulation ............... . . . ......... 15
PROPOSED INSTRUMENTATION CRITERIA ...... ................. 17
SPECIFICATION CHANGES . ................................... 17
REFERENCE8 . . .............. ..... ......... 19
APPENDICES
A Derivations to Determine Error of Fundamental Component of a VariableVoltage Sine Wave Clipped at a Constant Amplitude . . . . . . . . . . A-1
3 Derivation to Determine the Ratio of Slope of a Triangular Wave to theSlope of a Sine Wave at Its Point of Inflection, Both Waves Having theSame Time Period and Mauxmum Amplitude. . . . . . . . . . . . . .B-1
- iv -
Aeronautical Electronic and Electrical Laboratoiry
REPORT NO. NADC-EL-5675
LIST OF FIGURES AND TABLES
Figure Title Page
1 Fundamental Voltage-Frequency Relationships for a FrequencyDiscriminator ....... ......................... 3
2 Frequency Sensing Circuit (Courtesy of Westinghouse ElectricCorporation, Lima, Ohio) ........ ................... 4
3 Diagram of Instrumentation for the Measurement of FrequencyTransients and Modulation ...... ... .................. 5
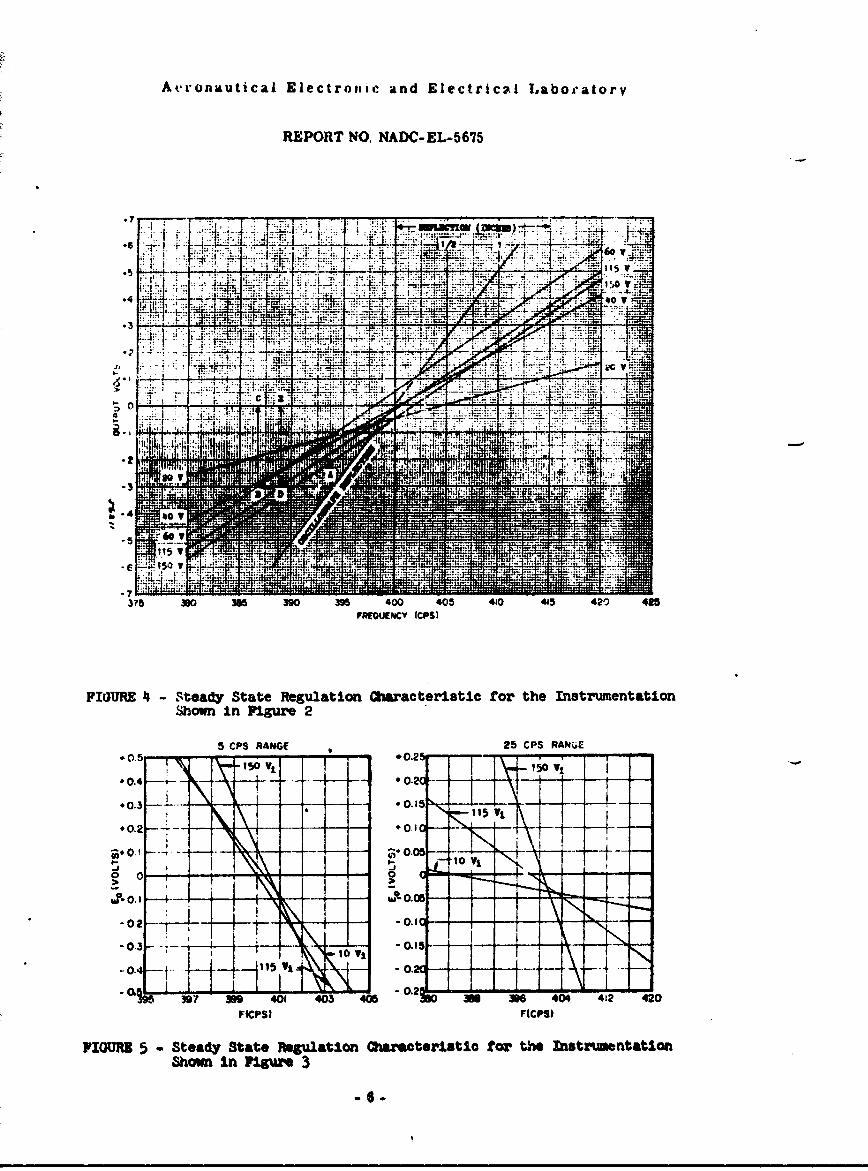
4 Steady State Regulation Characteristic for the Instrumentation Shownin Figure 2 ...... ... ... .......................... 6
5 Steady State Regulation Characteristic for the Instrumentation Shownin Figure 3 .... .. ... ...... ........................ 6
6 Fundamental Error Introduced in Clipping a Sine Wave ........... 77 Transient Characteristics of the Instrumentation Shown in Figure 2 . 88 Phase Discriminator Instrumentation and Calibration .... ....... 109 Recording of Frequency Modulation with Navy Type E-1614-1,
2500-VA Inverter ...... ... ...................... .. 1010 Recording of Frequency Modulation with a Navy Type E-1737,
1500-VA Inverter ...... ... ..................... .. 11it Recording of Frequency Modulation with a Hydraulic Constant Speed
Drive to a 40-KVA Generator ...... ................ .. 1112 Proposed Transient Frequency Limits .... ............. .. 18
Table
Electric System Compatibility Relationships for FrequencyTransients Between Aircraft Electric Systems and UtilizationEquipments ....... ..... ......................... 20
II Utilization Equipment Compatibility Relationships for FrequencyTransients Between Aircraft Electric Systems and UtilizationEquipments . . ................. .................... . . . 20
-V

Aeronautical Electronic and Electrical Laboratory
REPORT NO. NADC-EL-5675
DISCUSSION OF PROBLEM
DEFINITION
In aircraft electric power systems of the so-called constant frequency types, the fre-quency does not remain constant but varies during quiescent operation within some fre-quency band, such as 380 to 420 cps, called the steady state limit. Sudden changes infrequency within and beyond this band can occur during load disturbances or drive systeminput disturbances. When the disturbances are transient in nature, corresponding fre-quency variations including the return to steady state limits due to regulation controls,are called transient frequency characteristics. Until the characteristics of all frequencyvariations are defined within specified limits, designers of utilization equipment cannotassure compatibility of their equipment with aircraft electric systems.
In accordance with general usage, frequency variations fall within the following threebroad categories, classified by virtue of the extent, rate, and duration of frequency changes:
1. A transient frequency change, which implies a sudden change in frequency withinthe definition of transient, deviates a large amount and with a high rate of change. Thedeviation and return to steady state is within a short time, perhaps one second.
2. Frequency modulation ie the cyclic and random constant or dynamic variation offrequency about a mean frequency during steady state system operation. The frequencymodulation is normally within narrow frequency limits and occurs as a result of speedvariations in the generator armature due to dynamic operation of drive and armaturecoupling. Rates of frequency changes in frequency modulation are much lower than thosedue to transient frequency changes. The mean frequency can change as a result of fre-quency drift.
3. Frequency drift, which is the slow and random variation in frequency within thesteady state limits, occurs as a result of environmental or service effects on the electricpower drive system. The rates of frequency change are much lower than the other cate-gories of frequency variations.
This report deals with transient frequency changes and frequency modulation defined
in I and 2 above.
METHOD8 OF MEULREMENT
Measurement of transient frequency is accomplished generally by using a voltageanalog of the deviation from a given frequency. The voltage analog is then fed to a re-corder having satisfactory response time. Since the frequency transients occur as aresult of disturbances which simultaneously create voltage transients, the frequencyanalog has to be insensitive to voltage changes over extremely wide Umits, even thoughthe voltagie is used to provide the frequency information. Enamination of various instru-ments used in the past have indicated that none are sufficiently nsesitIve to voltagechange to give accurate indication of the frequency changes for all conditions of electricsystem operation.
Many utilization equipment designers have indicated that their equipment is affectedby the degree of transient frequency excursion and also by the rate af frequency changeduring the excursion. This, It becomes important to emamine this rate characteristic of
Aeronautical Elactronic and Electrical Laboratory
REPORT NO. NADC-EL-5675
frequency transients and contain it within specified limits. Since information about rateof frequency change has not been required from the instruments used to provide transientfrequency recordings, such instruments vary in their ability to show high rates of fre-quency change.
Another method used to measure frequency deviations is to make direct tachometerconnection to the generator drive equipment. The tachometer voltage output is a functionof speed, allowing the output voltage to be calibrated in terms of frequency. This methodcannot be used universally since tachometers cannot be mounted easily on drives or gen-erators except for some laboratory operations. This method also has other disadvantagesin that data involving small frequency deviations are difficult to obtain and generator tran-sient flux shifts and shaft torsions are not seen. Based on these inherent limitations,this type of instrumentation was not included in this project Investigation.
Considerable data have been published sho 'ng oscillograms of frequency transientsin constant frequency systems. The data, when a-, "embled and integrated, could providea basis for the preparation of defined limits for the transient frequency characteristics.However, the data cannot be considered valid until the instrumentation for each set of datais verified in the light of projected definitions and limits for the frequency transients.
There are not enough data on frequency modulation to provide a firm basis for estab-lishing limits of frequency modulation or for establishing definite design criteria whichcould be used with component and system design. Limited tests to obtain data on frequencymodulation were made at NADEVCZN to establish a starting base for developing the desireddefinitions and limits.
INSTRUMXNTATY.ON
Because of the diverse instruments used to measure frequency transients and fre-quency modulation, obtained data have not been amenable for correlation. By bringing tolight the variations and Inaccuracies of present instrumentatIon and in establisting specificrequirements for all future instruments, it is hoped that the future will provide consisttand accurate data for correlation.
The approach to measuring frequency transients has been to use a hrequency di-criminator centered at 400 cps to obtain a voltage analog of the frequeny cheaep from400 cps. There has been sufficient experience in the wse of frequency dicrtminators Isgeneral and for 400 cps It particular so that it should not be dLfftclt to obtain discrim-Isaters with good Unearity tivao reasonable frequency changes. However, the diacrim-WNWr by itelt daunt provide the complete pature of transient equcy charges.
tIutnation of composet eharacteristics pi atreraft .osato speed electrk systemshas revealed:
1. The steady saM operating frequency is usualy near 400 cps and ms be sy-were Is te bead betwe e 80 to 420 pes.
L. ?rumcy b ieaa my7 bvel for the most exrme sos* to 120 or40 aps. This represaui &* perce tchange from a 400-cpa base.
Aeronautical Electronic and Electrical Laboratory
REPORT NO. NADC-EL-5675
3. Disturbances which cause transient frequencies also cause simultaneous voltagetransients. The conditions which cause the widest extremes in frequency transients gen-erally also cause the widest extremes in voltage transients.
4. Rates of frequency change during frequency transients may be high, perhaps asmuch as 500 cps/s.
These are the system characteristics which should be used as the bases for instrumenta-tion requirements in the measurement of the frequency transients.
During extreme faults in the electric system, system voltage available for the meas-urement of frequency may drop to as low as S V, and during recovery of the fault thevoltage transient may rise as high as 200 V. These are line-to-neutral rms values.Any frequency measuring instrument which uses line voltage as input should maintainits output proportional to frequency change but remain unaffected by the wide input vol-tage swings. This is a severe requirement not met completely by known instrumentation.
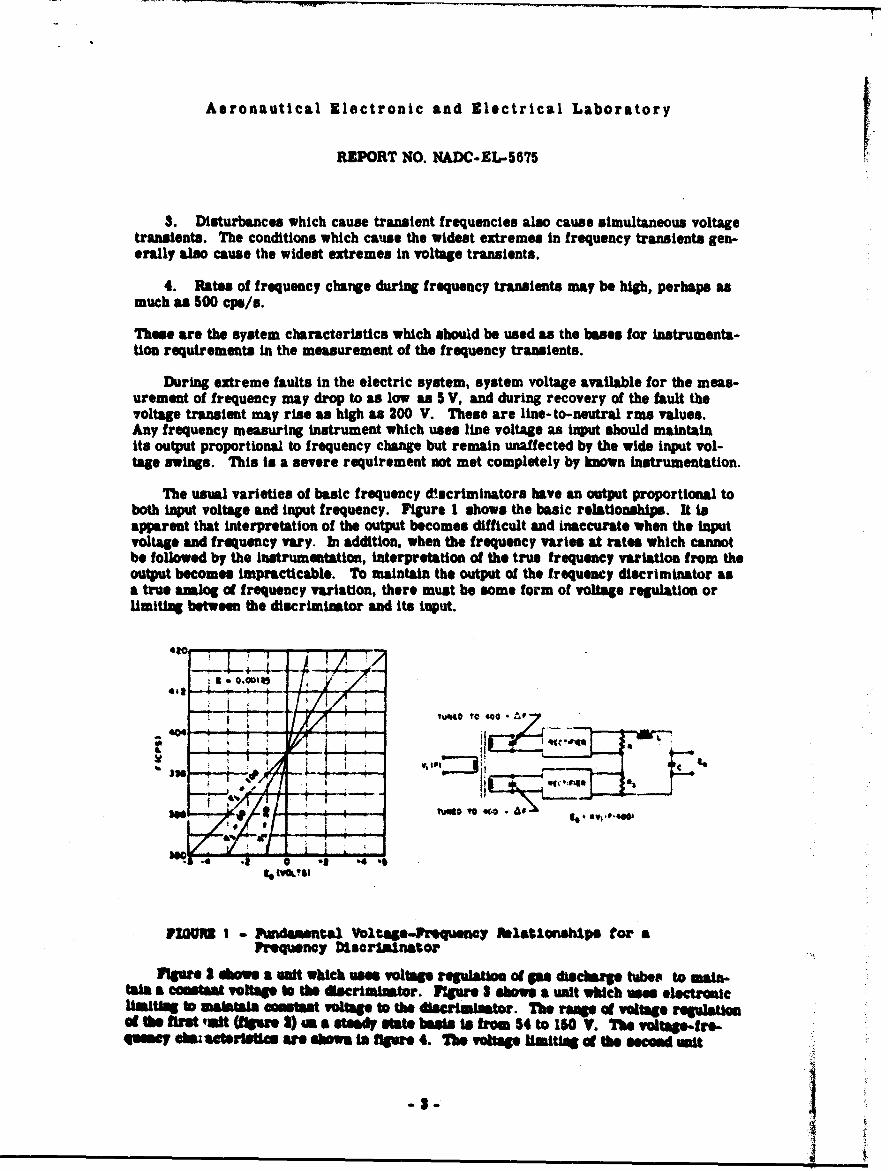
The usual varieties of basic frequency d€scriminators have an output proportional toboth input voltage and input frequency. Figure 1 shows the basic relationships. It isapparent that interpretation of the output becomes difficult and inaccurate when the inputvoltage and frequency vary. In addition, when the frequency varies at rates which cannotbe followed by the instrumentation, interpretation of the true frequency variation from theoutput becomes impracticable. Tb maintain the output of the frequency discriminator asa true analog of frequency variation, there must be some form of voltage regulation orlimiting between the discriminator and its input.
"T" 7 T
"to To ct L
Me *tuft* '0 4,0 66A
to 4
nou I - Amdamentla Vob1t"*o-?eq y balatlosths for a
Ptquncy Diserianator
Flgure 2 osb n a unit which use voltauge regulato of p8s discgWe tubes to main-Wi La COtst voltap to the 4scrimintor. Igure 3 shows a unit which uses eletraoclmitUi8 to m ai commat vola to the dcrimlmtr. Tne rue of volta reguWatiofthefrst 'ant (fIgure ) i sta ysestebs Is om 54 to 160 V. Te voltageNr-I-qumCY ehzacteriM we ebm is tlwe 4. Th vobage Imitit• of the oecod uni
-$.-?
Aeronautical Electronic and Electrical Laboratory
REPORT NO. NADC-EL-5675
/t , K 2 • V1!¶S' (VARZD.,Z) r -
111 5 X 25 WATT (vARIABLE) _
t2 1001 1WATT
INPUT NEC. NICR, "- I1¢.
082 0lL 2CI
Smiii OUTPUT I
C1 .25 M.I., ItC Vt-C 11
L2 WC V1-C 19MC. I RUIN= -
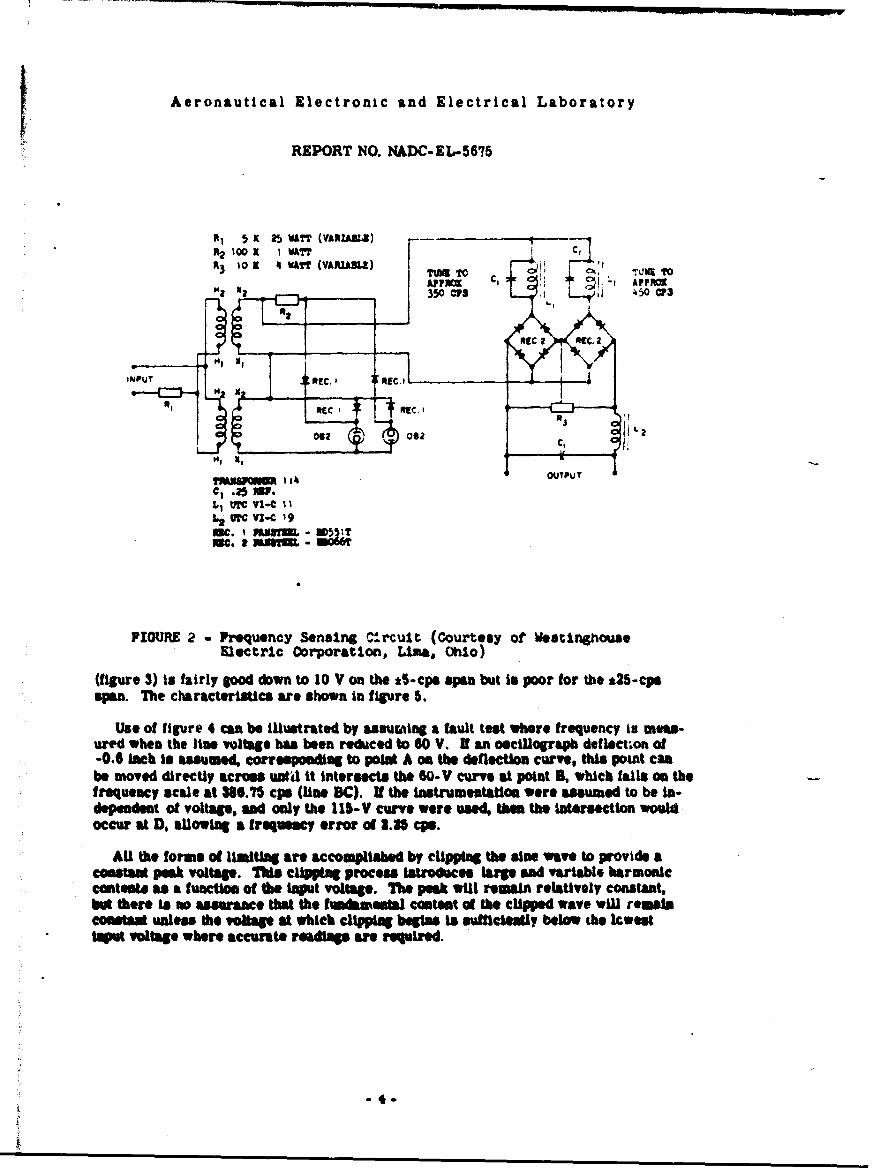
FIGURE 2 Preuency SonsIng Ci.rcuit (courtesy of WestinghouseElectric 0corporation, Ltma, Ohio)
(figure 3) to fairly pood down to 10 V on the a5-cps span but is poor for the *25-cpsspan. The characteristics are shown in figure 5.
Use of figure 4 can be Ilustrated by assumring a fault test where frequency is mew-ured when the live volts#e has been reduced to 60 V. N an oscllograph deflection of-0.6 Inch Is asuamed, correspodatg to poltt A on the deflection curve, th pouit canbe moved directly across untd it Intersects the GO-V curve at point B, which falls on thefrequency scale at 386.75 cps (line SQ). If the instrumentatlon were msumed to be is-dependent of voltage, md only the 11-V curve were used, tU the totersection woultoccur at D, allowing a frequwny error of 2.38 cpa4
AU the forms of liiting are accomplished by clipping the sine wae to provide acoastsm peak voltage. This clipping process introote large and variable harmoniccontets as a functio of the Input voltage. The peak will remain relatively constant,but there is no assurce that the fsumental content of the clipped wave will reiaslcona -,st Wles the motae at which clipping begins Is suffIciently below ihe lewwtInpt voltage wbere accurate readings au requied.

Aeronautical Electronic and Electrical Laboratory
REPORT NO. NADC-EL-.5675
- --- 77r,
'.4 -- w,
.~ I
2 .... VON,
' * T-7
F4
OII2 I>
T?
4 .1 '
- -- ' '. ""
I
%W
55.
ii
Aeronautical Electronic and Electrical Laboratory
REPORT NO. NADC-EL-5675
.1-*-.N
1.1
-3
376~~ .18 .6 . 9 .9 .0 .0 .1 .4 .2 .4...
44 1 tIV
.- - -- - -- -
l11 5V 1
Shw In Figr2
*0-2f - -01
;-0.3 1 ---, zoo-j-0-
*G02-i- -.1
W~9 M0 401 403 41056 40 1 42
F(CPSR F(CPS)
FIG=R 5 -Steady State Regulation Characteristic for' the InstrurientationShown in Figure 3
Aeronautic&l Electronic and Elecirical Laboratory
REPORT NO. NADC-EL-5675
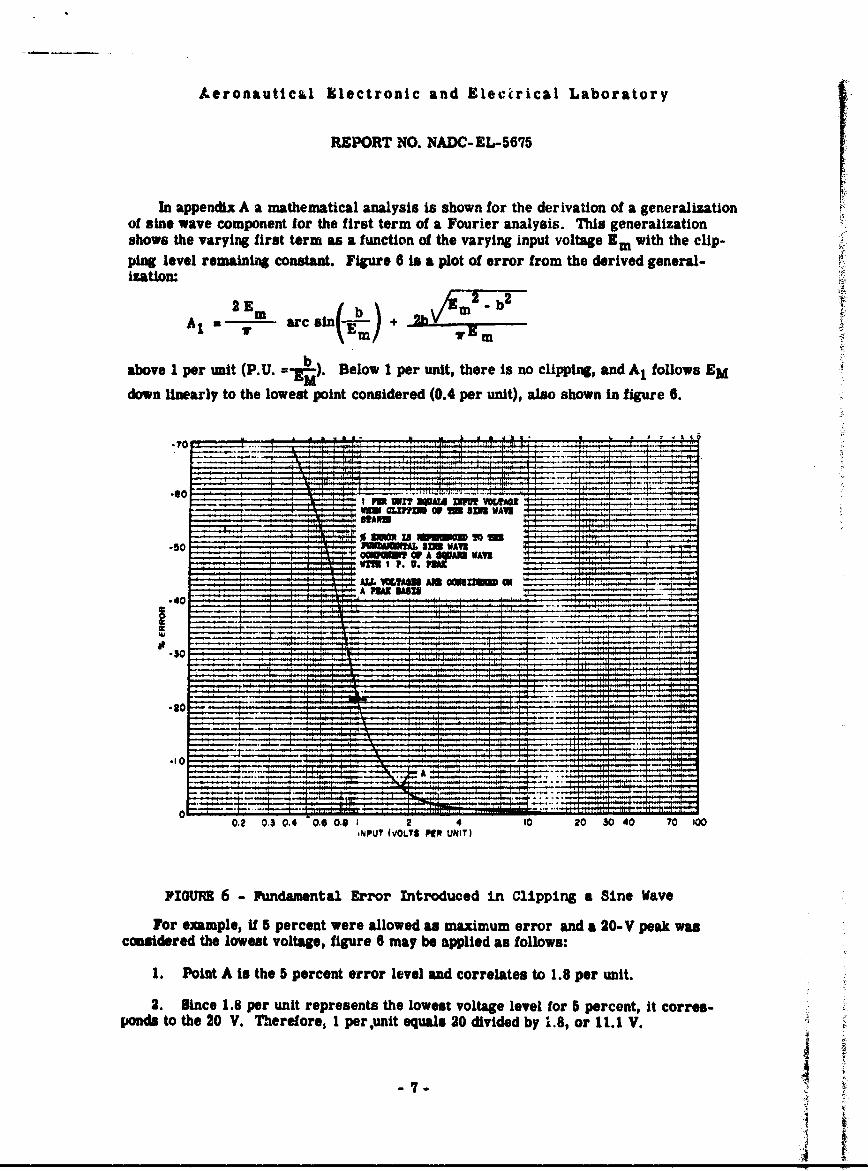
In appendix A a mathematical analysis is shown for the derivation of a generalizationof sine wave component for the first term of a Fourier analysis. This generalizationshows the varying first term as a function of the varying input voltage Em with the clip-ping level remaining constant. Figure 6 is a plot of error from the derived general-ization:
A1 Zm (bA, I arcesin f_) +
above I per unit (P.U. =-M). Below 1 per unit, there is no clipping, and A1 follows EM
down linearly to the lowest point considered (0.4 per unit), also shown in figure 6.
---------- WM =Pn OFI• {M 333M 8• AVI
WMP I P. U. PIP WU
FG E6-Fuaen al Ero ntroduce in Clipping Sin av
A 20-V paIk was
----
A
00.2 0.3 0.4 '0.6S 0.0 2 4 10 20 3 0 4 0 7 0 100
AIPUT (V/OLTS PER UNIT)
FIOUMB 6 - Fundamental Er'ror Introduced I~n Clipping a Sine Wave
For example, if 5 percent were allowed an maximum error and a 20-V peak wasconsidered the lowest voltage, figure 6 may be applied as follows:
1. Point A in the 5 percent error level and correlates to 1.8 per unit.
2. Bince 1.8 per unit represents the lowest voltage level for 5 percent, it corres- ,ponds to the 20 V. Therefore, I per~unit equals 20 divided by 1.8, or 11.1 V. • •
7-!
4'.
Aeronautical Electronic and Electrical Laboratory
REPORT NO. NADC-EL-5675
3. The resultant 11.1 V is the voltage at which clipping would have to begirn tomaintain a minimum of 5 percent accuracy (factor due to clipping only) at the assumedlow- voltage operating point.
The instrumentation discriminator outputs are rectified a-c from the frequencyresponsive circuits. Ripple content in this output is generally filtered to provide cleand-c output. The filter can be of the RC or LC var'Lety. If it is of the LC type, caremust be exercised to assure sufficient loading for at least critical damping, otherwisesudden changes in input introduce a transient into the output not representing an actualfrequency change. The unit in figure 2 has an LC filter and when its output is fed to aBrush amplifier-recorder, which has negligible loading, a sudden change in input fre-quency (or voltage) may introduce distortions in the recording of a frequency. This unitcan be critically damped with a load of 12,500 ohms. In the output circuits which haveRC filters, critical dampening is not a consideration.
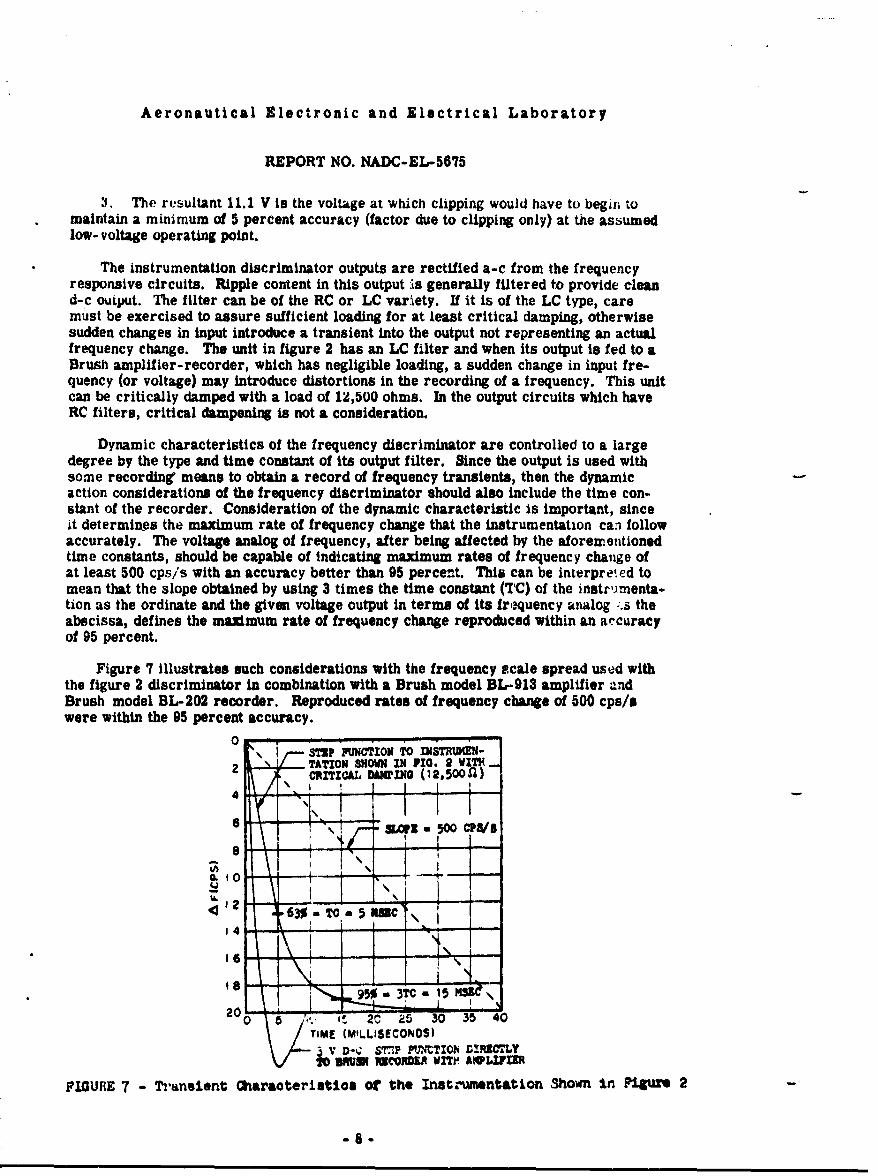
Dynamic characteristics of the frequency discriminator are controlled to a largedegree by the type and time constant of its output filter. Since the output is used withsome recording means to obtain a record of frequency transients, then the dynamicaction considerations of the frequency discriminator should also include the time con-stant of the recorder. Consideration of the dynamic characteristic is important, sinceit determines the maximum rate of frequency change that the instrumentation can followaccurately. The voltage analog of frequency, after being affected by the aforementionedtime constants, should be capable of indicating maximum rates of frequency change ofat least 500 cps/s with an accuracy better than 95 percent. This can be interpreted tomean that the slope obtained by using 3 times the time constant (TC) of the instr,'menta-tion as the ordinate and the given voltage output in terms of its frequency analog -.s theabscissa, defines the maximum rate of frequency change reproduced within an accuracyof 95 percent.
Figure 7 illustrates such considerations with the frequency scale spread used withthe figure 2 discriminator in combination with a Brush model BL-913 amplifier a'ndBrush model BL-202 recorder. Reproduced rates of frequency change of 500 cps/swere within the 95 percent accuracy.
0 r--SI"P -IPaNC"uO i TO INSTRWiEN-
2 TATION SHOWN IN FIO. 2 WITHTCRITICAL DAMING (12,50011)
4
6 h114.,16
20o 84I • 2C ;5 30 35 40
TIME (M'LLISECOP4OS)
I0 3RUIOMRV0~AI II
lFIOUR•E 7 - Trt•nslent; Qharaoteritstlos 0of 1he ITnstrzumentation Showrn 1rn Pi• 2
-8-
Aeronautical Electronic and Electrical Laboratory
REPORT NO. NADC-EL-5675
It is apparent that by increasing the frequency scale span, higher rates of frequencychange can be reproduced with a g;iven set of equipment. This is consistent with the gen-eral requirements, since the larger rates of frequency changes are experienced duringthe transients which also result in the largest frequency swings. The instrumentationshown in figure 3 has a discriminator output filter which does not allow for accuratereproduction at the required high rates.
To summarize, instrumentation for recording frequency transients in 380- to 420-cps systems should have the following characteristics:
1 It should provide a true analog of frequency change relatively independent ofany signal input voltage change between 5 and 200 V rms. This voltage range might beextended from 3 to 200 V for added facility while frequency transients are checked dur-ing extreme faults closer to the point of fault.
2 It should provide the frequency change information in the form of positive andnegative outputs representing the frequency variations above and below a nominal fre-quency as zero output. The accuracy of any final frequency steady state deviation fromnominal should be within 2 percent. For ease in reading a recording, more than onerange in the calibrated frequency spans might be used. Buggested ranges are *4, *20,and *80 cps. It would also be helpful if the center frequency, nominally considered as400 cps, could be readily shifted in a calibrated manner within the band between 380 and420 cpu while any given frequency span is maintained.
S. It should be capable of reproducing rates of frequency change up to 500 cps/swithin a 5 percent accuracy. It would be acceptable foz any full scale span of *20 cpsor les to have at least 5 percent accuracy with rates of frequency change up to 125 cpe/s.
4. The frequency discriminator portion of the instrumentation should be capable ofa *5-V output for each frequency span with an internal impedance of not more than 5000ohms. This would allow reasonable matching of the output to most commercial oscillo-graphs. Also this part of the instrumentation should have at least critical dampeningregardless of what recording meoas are used.
Frequency modulation can be measured by the use of the equipment previously dis-cussed. This equipment has its limitations for this purpose in that the frequency modu.lation for all normal conditions consists of small frequency deviations and representsonly 5 to 25 percent of full-scale deflection on a sensitive range such as *4 cps. Thus,the same reasonable levels of interference possibly present during measurement of fre-quency transients might blank useful information during measurement for frequencymodulation. N span sensitivity can be increased without increasing the minimum levelsof interference correspondingly, and "ringing" can be avoided with increase of IV* inthe discriminator tuned networks, then a span of *2 cps would be adequate for directmeasurement of frequency modulation.
Another approach for measurement of frequency modulation is to obtain a voltageanalog of phase difference between the measured frequency and an arbitrary frequencystandard. The standard would have to be maintained accurately and conveniently towithin 1/20 cps ol the mean of the measured frequency for the duratica of Ul', measure-ment. Ths allows full scale operation of the instrumentation for small values of fre-quescy modulation; interference levels are very low because of inherent rejection olnoise by a phase denofultor. This scheme is compromised in flexibility of measure-ment by the standard having a fixed frequency which cannot be varied or a variable fre-quency which cannot be varied in small enough increments.
Aeronautical Electronic and Electrical Laboratory
REPORT NO. NADC-EL-5675
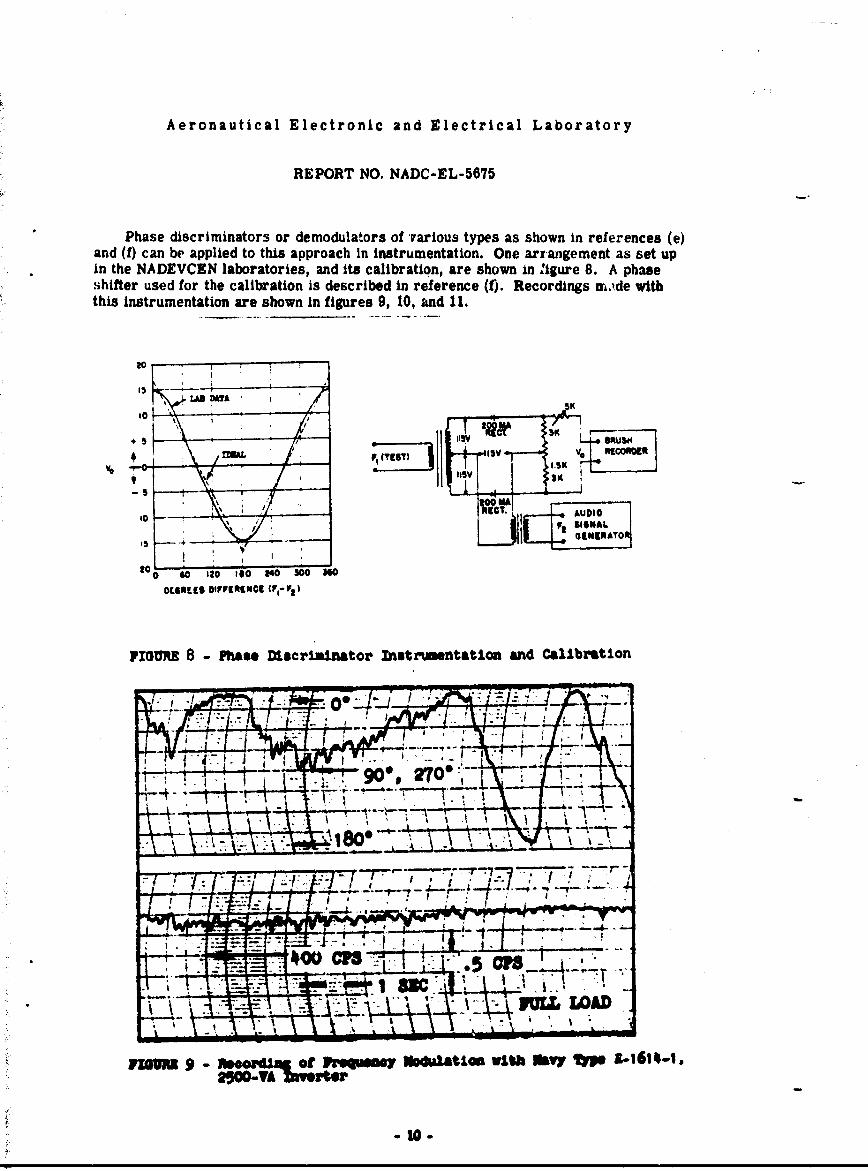
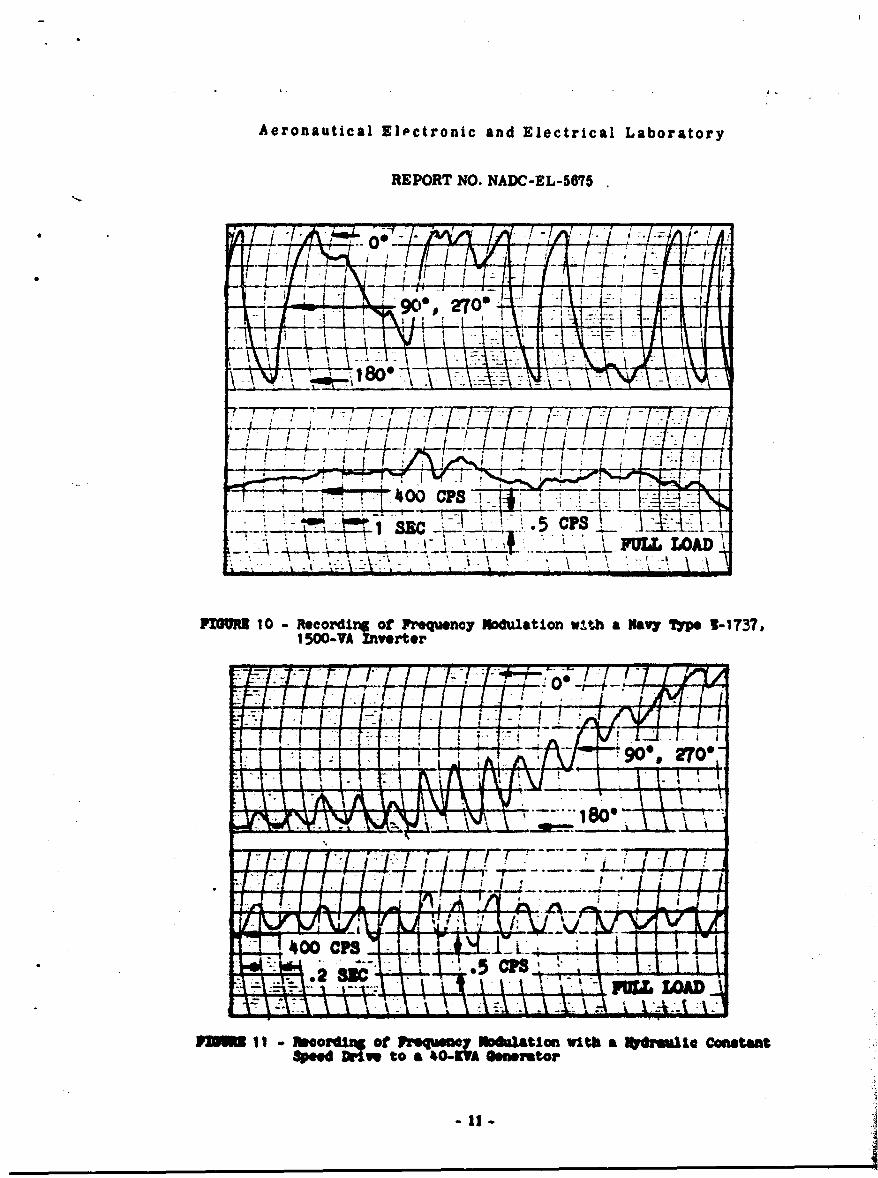
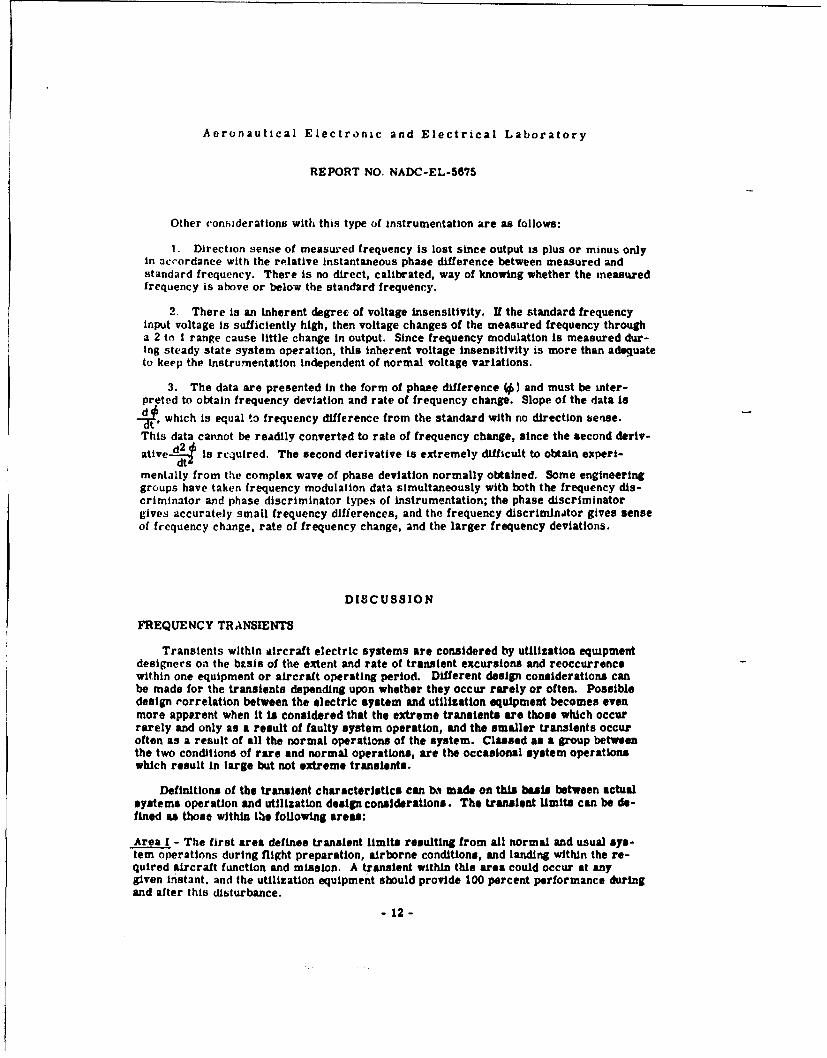
Phase discriminators or demodulators of 'various types as shown in references (e)and (f) can be applied to this approach In instrumentation. One arrangement as set upIn the NADEVCEN laboratories, and its calibration, are shown in Zigure 8. A phaseshifter used for the calibration is described in re ference (f). Recordings M.ide withthis Instrumentation are shown in figures 9, 10, and 11.
20
115V11wr 3K5 LI
f 3K'v imccmc
115V SK-. 45-
ve .10- - S) 1.-
Aeronautical Electronic and Electrical Laboratory
REPORT NO. NADC-EL-5875
.5 ti
1500-V -A At~
f 13
Aeronautical Electronic and Electrical Laboratory
REPORT NO. NADC-EL-5675
Other considerations with this type of instrumentation are as follows:
I. Direction sense of measured frequency is lost since output is plus or minus onlyin accordance with the re~latlve instantaneous phase difference between measured andstandard frequency. There is no direct, calibrated, way of knowing whether the measuredfrequency is above or below the standard frequency.
2. There is an inherent degree of voltage insensitivity. If the standard frequencyinput voltage is sufficiently high, then voltage changes of the measured frequency througha 2 to 1 range cause little change in output. Since frequency modulation is measured dur-Ing steady state system operation, this inherent voltage insensitivity is more than adequateto keep the instrumentation independent of normal voltage variations.
3. The data are presented in the form of phaae difference () and must be inter-
preted to obtain frequency deviation and rate of frequency change. Slope of the data is
-_t, which Is equal to frequency difference from the standard with no direction sense.This data cannot be readily converted to rate of frequency change, since the second deriv-
ative d-2 is required. The second derivative is extremely difficult to obtain experi-
mentally from the complex wave of phase deviation normally obtained. Some engineeringgroups have taken frequency modulation data simultaneously with both the frequency dis-criminator and phase discriminator types of instrumentation; the phase discriminatorgives accurately small frequency differences, and the frequency discriminator gives senseof frequency change, rate of frequency change, and the larger frequency deviations.
DISCUSSION
FREQUENCY TRANSIENTS
Transients within aircraft electric systems are considered by utilization equipmentdesigners on the b.sis of the extent and rate of transient excursions and reoccurrencewithin one equipment or aircraft operating period. Different design considerations canbe made for the transients depending upon whether they occur rarely or often. Possibledesign rorrelation between the electric system and utilization equipment becomes evenmore apparent when It Is considered that the extreme transients are those which occurrarely and only as a result of faulty system operation, and the smaller transients occuroften as a result of all the normal operations of the system. Classed as a group betweenthe two conditions of rare and normal operations, are the occasional system operationswhich result in large but not extreme transients.
Definitions of the transient characteristics can b,• made on this basis between actualsystems operation and utilization design considerations. The transient limits can be de-fined as those within tLe following areas:
Area I - The first area defines transient limits resulting from all normal and usual sys-tem operations during flight preparation, airborne conditions, and landing within the re-quired aircraft function and mission. A transient within this area could occur at anygiven instant, and the utilizatlon equipment should provide 100 percent performance duringand after this disturbance.
- 12-
Aeronautical Electronic and Electrical Laboratory
REPORT NO. NADC-EL-5675
Area II - The second area defines above-normal transients resulting from normal butextremely heavy load changes required for function of the electric system. These tran-sients occur occasionally (three or four times) during any one aircraft operational periodas a result of a ccntrolled operaticn within the electric system. An aircraft operationalperiod can be defized as the time interval from the start of preparation for flight to thepostflight engine shutdown and deactivation of the electric system. These transientsusually occur upon specific aircraft operations. If the utilization equipment were per-mitted degraded performance for the period of this transient, it should be only to theextent allowed by the detail specification for that equipment. In any case, by the end ofthe transient, the utilization equipment should be fully recovered to 100 percent perfor-mance with unimpaired reliability.
Area IM - The third area defines the larger transients resulting from unexpected systemactions. These transients rarely occur, perhaps never during the life of an aircraft, andthe exact moment of occurrence is not usually anticipated. For this area of transients,correlation with utilization equipment could mean:
1. If any performance is required, it should be specified in the equipment detailapecification.
2. After the transient, automatic return to 100 percent performance may not be
required by the detail specification.
3. Effect on reliability should be negligible.
4. No unsafe condition should arise.
Area IV - The fourth area covers the entirely unanticipated extreme transient. Theelectric system designer is responsible for providing an electric system in which thetransients will be confined within the specified limits of the previous three areas. Inthe event that a transient does go beyond the widest limit, contrary to all the designefforts, no responsibility can be expected of the utilization equipment except to remainin a afe condition and precipitate no adverse conditions other than the natural loss ofthe equipment function. After such a transient, the equipment would not be required toreturn to operation automatically. Also, when the equipmnent is manually returned tonormal operation, reliability could be impaired.
The approach in defining the four areas places responsibility on the electric systemdeesigers without confining the individual design aspects which contribute toward makingibe overall charactoristics.
Ihormation on frequency transients made available to NADEVCIN from four air-frame manufacturers and six drive or power equipment manufactuwre was evaluated interms of the Iistrumentation used to obtain the data. In general, for frequency transientsinvolvinq siramltanous heavy voltage swings, the data could not be considered accurate.
The curves shows it figure 13 were prepared to define the overall characteristic offroujecy transients for 380- to 420-cps systems In terms of the frequency excursionlimits as a fuwcton of time. The curves represent a composite frequency tranestcharacteristic for all constast-frequeacy types of aircraft systems powered by the foMow-Lag types of contnt apeed drves:
- 13-
Aeronautical Electronic and Electrical Laboratory
REPORT NO. NADC-EL-5675
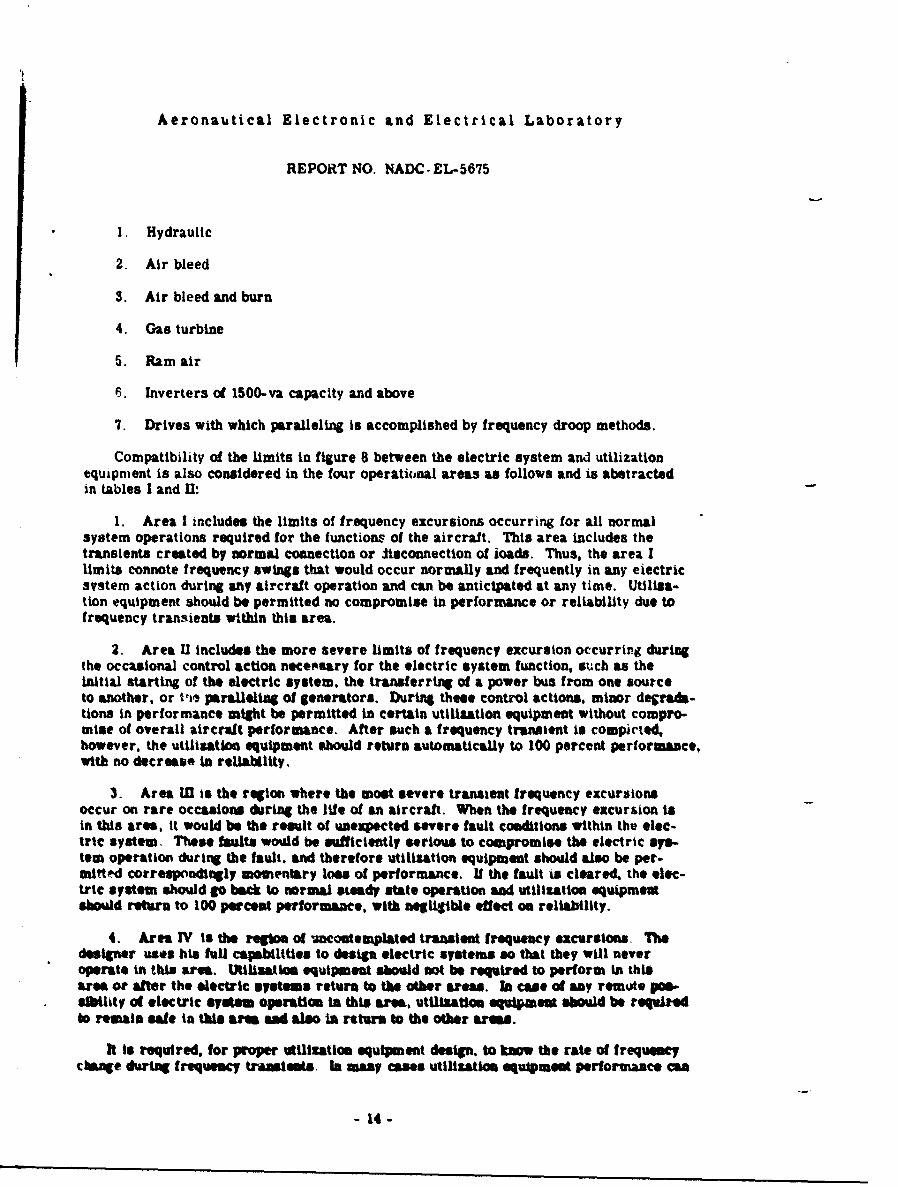
1. Hydraulic
2. Air bleed
3. Air bleed and burn
4. Gas turbine
5. Ram air
6. Inverters of 1500-va capacity and above
7. Drives with which paralleling is accomplished by frequency droop methods.
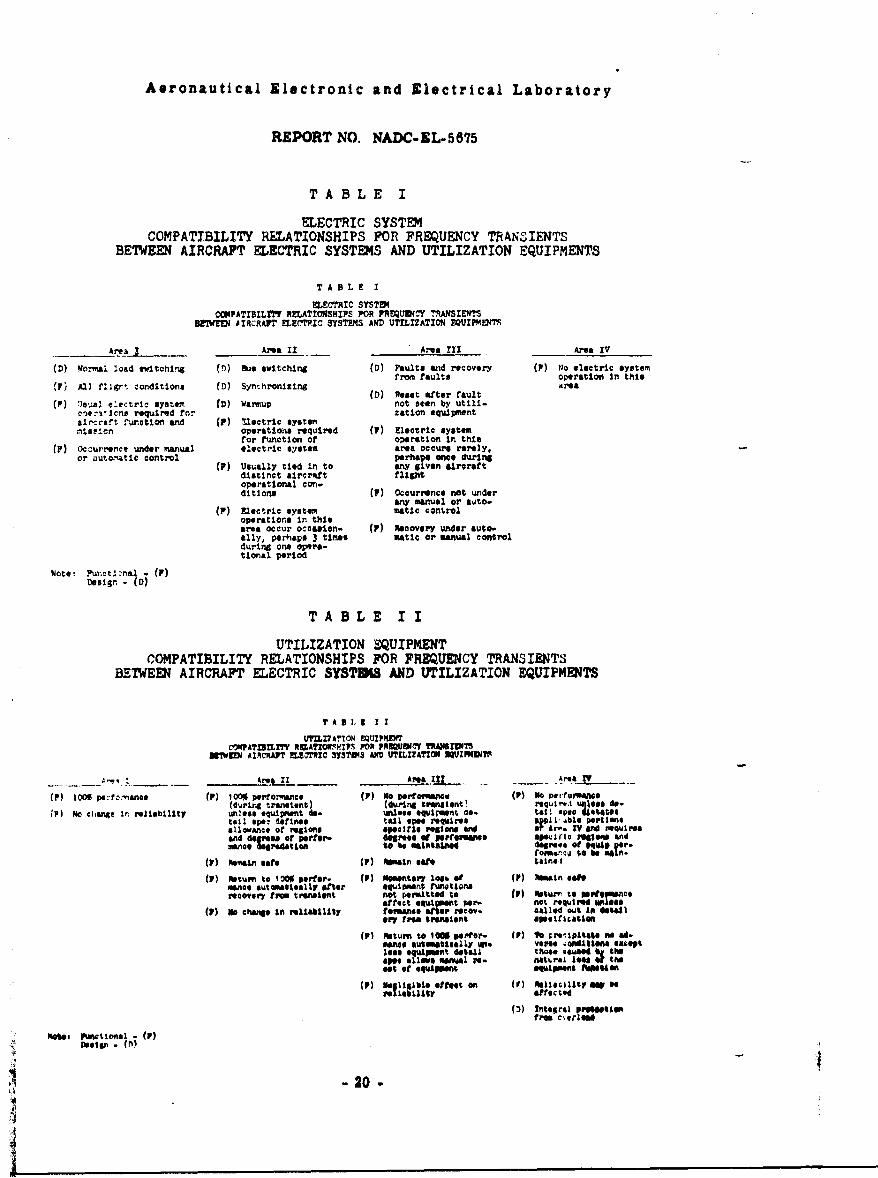
Compatibility of the limits in figure 8 between the electric system and utilizationequipment is also considered in the four operational areas as follows and is abstractedin tables I and n1:
1. Area I includes the limits of frequency excursions occurring for all normalsystem operations required for the functions of the aircraft. This area includes thetransients created by normal connection or lisconnection of joads. Thus, the area Ilimits connote frequency swings that would occur normally and frequently in any eiectricsystem action during any aircraft operation and can be anticipated at any time. Utilisa-tion equipment should be permitted no compromise in performance or reliability due tofrequency transients within this area.
2. Area U includes the more severe limits of frequency excursion occurring duringthe occasional control action necepsary for the electric system function, such as theinitial starting of the electric system, the transferring of a power bus from one sourceto another, or et, paralleling of generators. During these control actions, minor defrads-tions in performance might be permitted in certain utilisation equipment without compro-mise of overall aircraft performasnce. After such a frequency transient Is compirted,however, the utilization equipment should return automatically to 100 percent performance,with no decrees. in retiaillty,
3- Area II is the region where the most severe transient frequency excursionsoccur on rare occasions during the life of an aircraft. When the frequency excursion isin this ares, it would be the result of unexpected severe fault conditions within the elec-tric system. These faults would be sufficiently serious to compromise the electric sys-tem operation during the fault, and therefore utilization equipment should also be per.mittrd correspondingly momentary loss of performance. Uf the fault is cleared, the elec-tric system should go back to normal stuady state operation and utilization equipmentshould return to 100 percent performance, with newligible effect on reliability.
4. Area IV is the regon of 3ncoutemplated transient frequency excursions Thedesigner uses his kuU capmbilitlea to design electric systems so that they will neveroperate in this a•re. Utllzation equipment should not be required to perform In thisarea or after the electric systems return to the other areas. In came of any remote pos.ability of electric system operatio in this arem, utlization equipment should be roquitedto reu•al sade in this am and also In return to the other areas.
It ts required, for proper utilization equipment desig, to know the rate of frequencychange during frequency transmts In many caes utilization equipment perforance can
- 14-
Aeronautical Electronic and Electrical Laboratory
REPORT NO. NADC-EL-5675
be Influenced more by small transient frequency excursions at high rates of change thanby large transient frequency excursions at low rates of change.
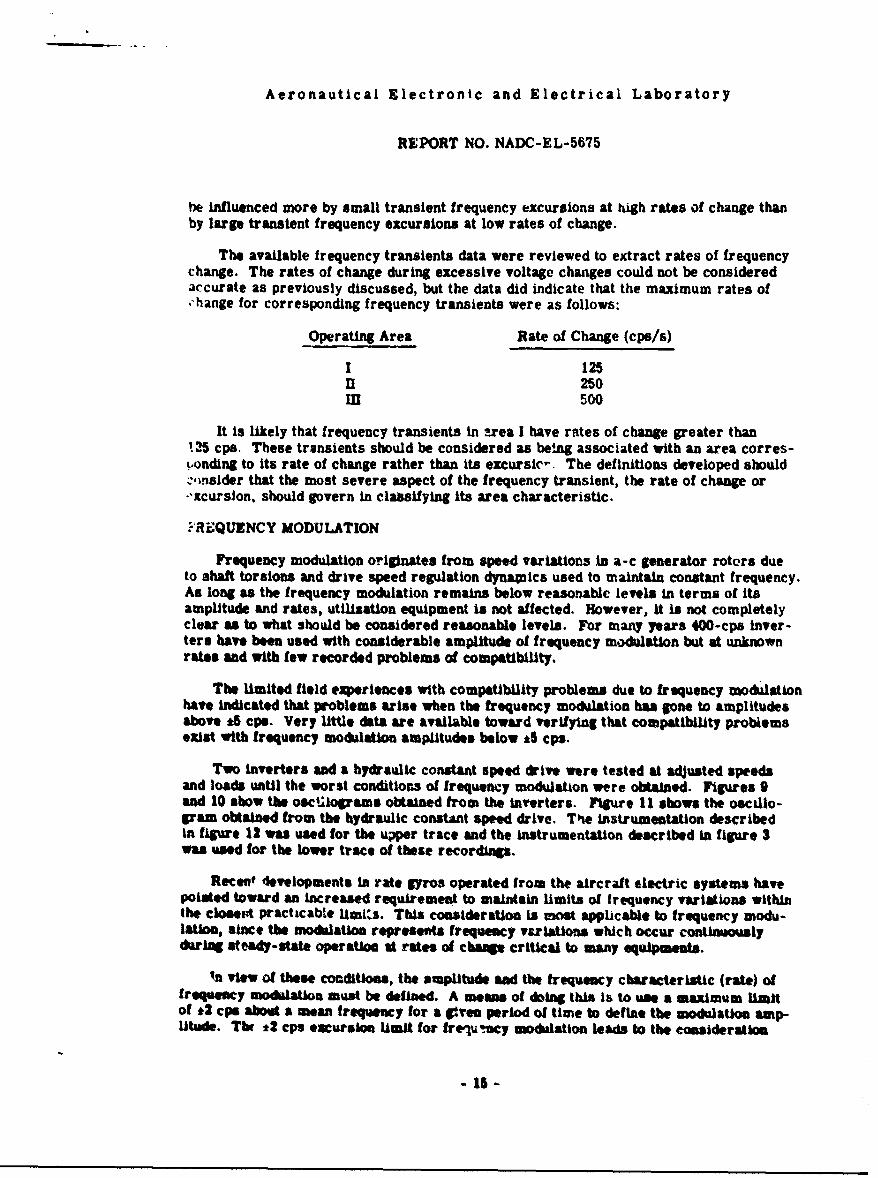
The available frequency transients data were reviewed to extract rates of frequencychange. The rates of change during excessive voltage changes could not be consideredaccurate as previously discussed, but the data did indicate that the maximum rates of.-hange for corresponding frequency transients were as follows:
Operating Area Rate of Change (cps/a)
I 125[1 250111 500
It is likely that frequency transients in area I have rates of change greater than125 cps. These transients should be considered as being associated with an area corres-bonding to its rate of change rather than its excursic-. The definitions developed shouldc-insider that the most severe aspect of the frequency transient, the rate of change orS"xcurslon, should govern in classifying its area characteristic.
"*REQUENCY MODULATION
Frequency modulation originates from speed variations In a-c generator rotors dueto shaft torsions and drive speed regulation dynagnics used to maintain constant frequency.As long as the frequency modulation remains below reasonable levels in terms of itsamplitude and rates, utilization equipment is not affected. However, It is not completelyclear as to what should be considered reasonable levels. For many years 400-cps inver-ters have been used with considerable amplitude of frequency modulation but at unknownrates and with few recorded problems of compatibility.
The Ulmited field experiences with compatibility problems due to frequency modulationhave Indicated that problems arise when the frequency modulation has gone to amplitudesabove *5 cpe. Very little data are available toward verifying that compatibility probtemsexist with frequency modulation amplitudes below A5 cps.
Two Inverters and a hydraulic constant speed drive were tested at adjusted speedsand loads until the worst conditions of frequency modulation were obtained. Figures 9and 10 show the oscWdograms obtained from the inverters. Figure II shows the oscillo-gram obtained from the hydraulic constant speed drive. The instrumentation describedin figure 12 was used for the upper trace and the instrumentation described in figure 3was used for the lower trace of these recordings.
Recent developments In rate gyros operated from the aircraft electric systems havepointed toward an Increased requirement to maintain limits of frequency variations withinthe cloeset practicable Umitz. This consideraUon is most applicable to frequency modu-lation, since the modalation represents frequency variations which occur continuouslydurift steady-state operation at rate of chbane critical to many equipments.
n view of these conditions, the ampltude ad the frequency characterialtic (rate) offrequency moadatlon must be defined. A mems of doing this is to use a maximum limitof *2 cps about a mean frequency for a gires period of time to define the modulation amp-litude. TbK *2 cps excursioe limit for fre'lu.-ncy modulation leads to the eomaideratmo
- 15 -

Aeronautical Electronic and Electrical Laboratory
REPORT NO. NADC-EL-5675
that maximum rate of change permitted for any complex wave of frequency modulationshould be no worse than the maximum rate of change during a sine wave excursion offrequency modulation to the maximum allowed limits. If a continuous sine wave of fre-quency deviation with a 1-second period is considered as traveling to the extremes of-2 cps about a nominal frequency, the rates of freq'4ency change can be averaged as aslope going from one positive extreme of the frequency deviation to the adjacent negativeextreme. This slope has an ordinate of 4 cgs and an abscissa of 0.5 second, giving arate of 8 cps/s. As shown by the dertvatiorA in appendix B, there is a ratio betweenthe slopes of the sine wave and triangular wave of 1.571 to I at the zero axis. Maximumslope of the sine wave occurs at its zero aWes and is approximately equal to 12.6 cpu/s."Thus, a maximum rate of frequency change should be set correspondingly at 13 cpu/u.
The frequency characteristic of frequency modulation is generally random in itsnature until one factor predominates, such as instability in a speed regulator of a con-stant speed drive. Under usual conditions the randomness of this characteristic doesrot allow ready analysis of its sine wave components but it can be limited sufficientlyby z.iecifying the maitmum rate of frequency change. The maximum rate of frequencychange can be identified as a maximum slope of a recording of frequency deviation, andused as a means to determine conformance of the frequency characteristic.
When a phase discriminator such as shown in figure 8 is used to record and ana-lyze frequency modulation, correspondence must be obtained toward equivalent quanti-ties procured on a direct frequency scale. The actual shift in degrees differentiated in
respect to time . is the function of frequency difference between the measured fre-
quency and the standard frequency. The sense or direction of the frequency differencefrom the standard frequency is lost. A phase shift slope of 720 degrees per second cor-responds to a frequency deviation of 2 cps from the standard frequency. Rates of fre-quency change of the measured frequency corresponds to the change from one phase shiftslope to another and as such Is extremely awkward to handle. Because of this difficultyof Interpreting frequency data from phase shift data, It is considered that frequencyrather than phase instrumentation is most applicable for the measurement of frtý;uencymodulation,
- 16-
Aeronautical Electronic and Electrical Laboratory
REPORT NO. NADC-EL-5675
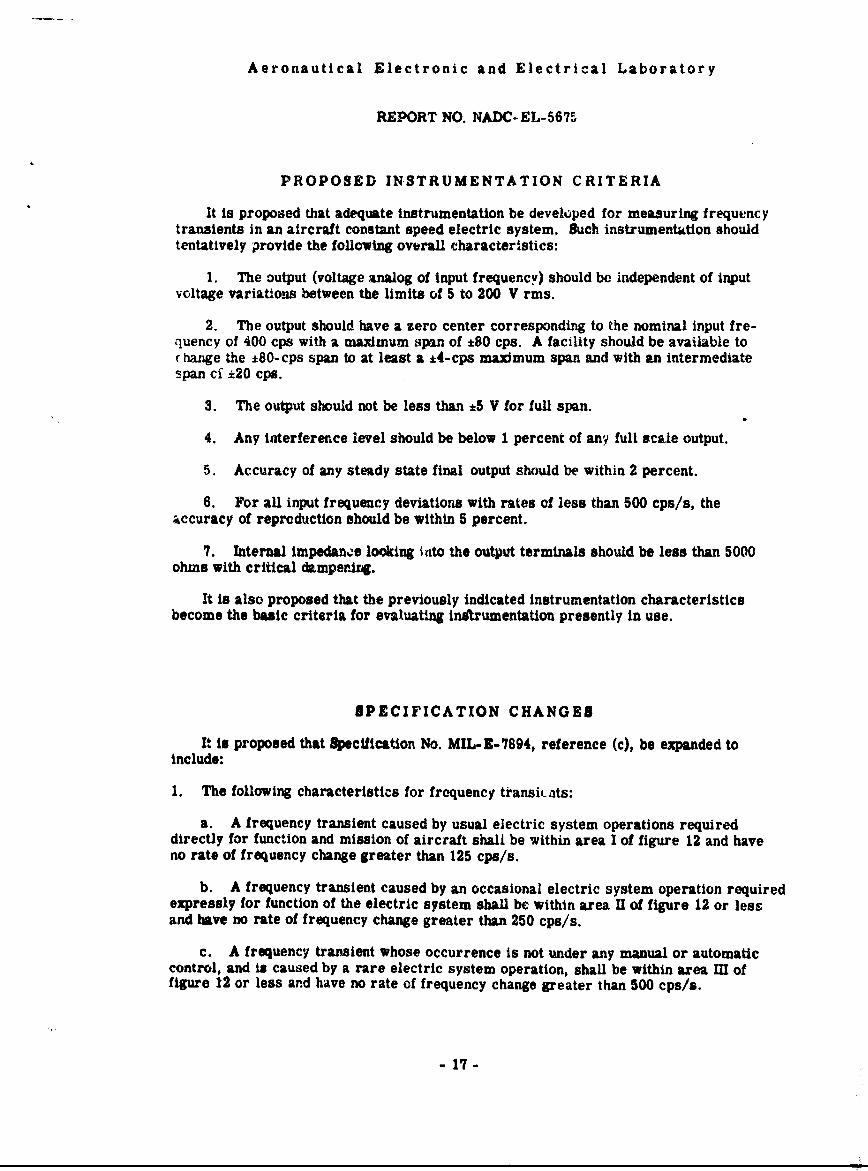
PROPOSED INSTRUMENTATION CRITERIA
It is proposed that adequate instrumentation be developed for measuring frequencytransients in an aircraft constant speed electric system. Such instrumentation shouldtentatively provide the following overall characteristics:
1. The output (voltage analog of input frequency) should be independent of inputvoltage variations between the limits of 5 to 200 V rms.
2. The output should have a zero center corresponding to the nominal input fre-quency of 400 cps with a maximum span of *80 cps. A facility should be available tor hange the 180-cps span to at least a *4-cps maximum span and with an intermediatespan cf *20 cps.
3. The output should not be less than *5 V for full span.
4. Any interference level should be below 1 percent of an,, full scale output.
5. Accuracy of any steady state final output should be within 2 percent.
6. For all input frequency deviations with rates of less than 500 cps/s, theaccuracy of reproduction should be within 5 percent.
7. Internal Impedance looking into the output terminals should be less than 5000ohms with critical ftmperxig.
It is also proposed that the previously indicated instrumentation characteristicsbecome the basic criteria for evaluating initrumentation presently in use.
SPECIFICATION CHANGES
It is proposed that Specification No. MIL-E-7894, reference (c), be expanded toinclude:
1. The following characteristics for frequency transi,_,ts:
a. A frequency transient caused by usual electric system operations requireddirectly for function and mission of aircraft shall be within area I of figure 12 and haveno rate of frequency change greater than 125 cps/s.
b. A frequency transient caused by an occasional electric system operation requiredexpressly for function of the electric system shall be within area 11 of figure 12 or lessand have no rate of frequency change greater than 250 cps/s.
c. A frequency transient whose occurrence is not under any manual or automaticcontrol, and is caused by a rare electric system operation, shall be within area MI offigure 12 or less ard have no rate of frequency change greater than 500 cps/a.
- 17-
Aeronautical Electronic and Electrical Laboratory
REPORT NO. NADC-EL-5675
. 0 . 0 0.00 480.0 0.00 4200 0.00 4ba0.0o.01 0.01 421.25 0.01 .4225 0.01 425.00.5 . .9.. 30: b 426.25 0.05 325 0 03. ..
O ~N .'a .J I r0.0.2 320.0 0.30 @ 10 0 2 4350 012 1 11 0.2 2
.0 0.0 0 :•. 1.0 452.0
u400'
420 _.Zaj2.
____________,__....___ -. . . .,.-.,
-A
26C _. _ . + + - +++__._________...__+/+ ..320 - - =22 . .. . .W=_ _ - += •- - -+ w- +
3+00
3260
0TiMl (1EC)
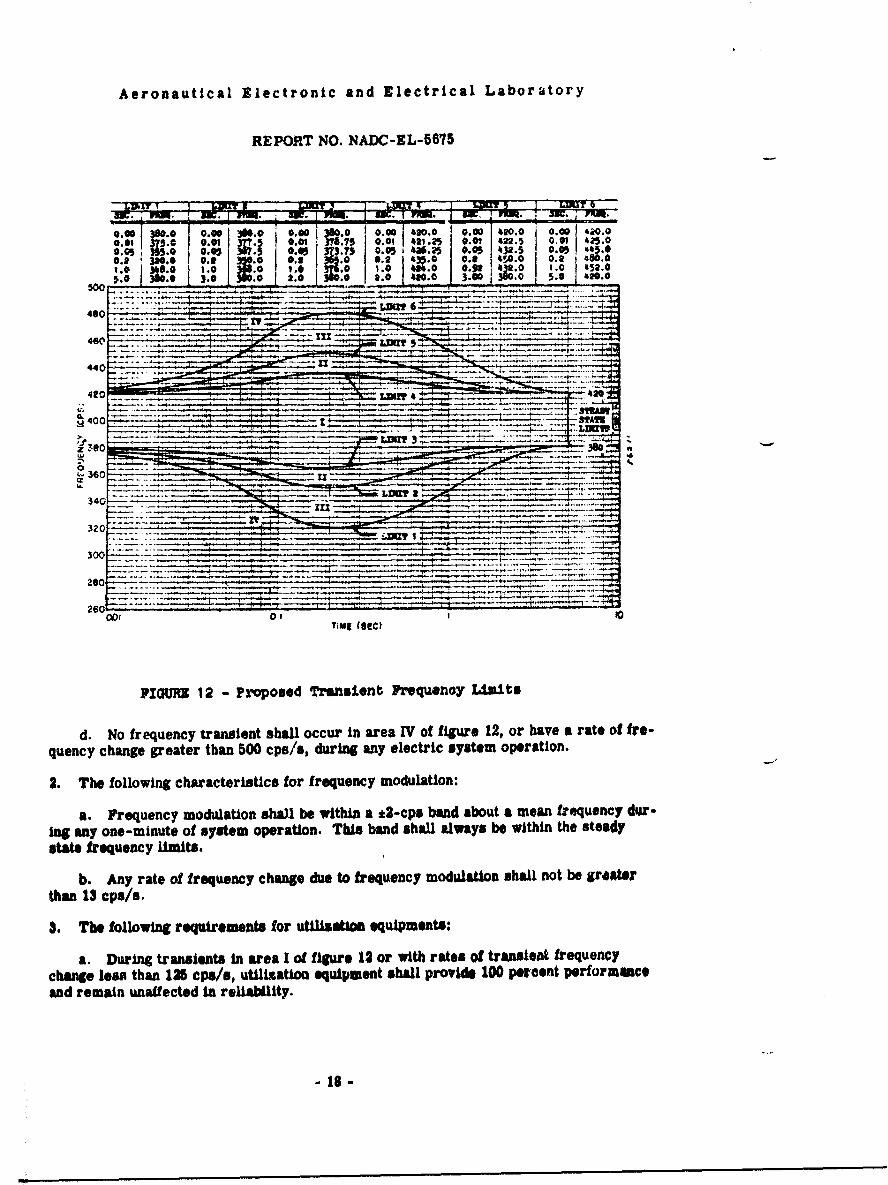
FIG=RE 12 - proposed Transient P•requenoy Lfiits
d. No frequency transient shall occur in area IV of figure 12, or have a rate of fre-
quency change greater than 500 cps/s, during any electric system operation.
2. The following characteristics for frequency modulation:
a. Frequency modulation sha)l be within a 12-cpa band about a mean frequency dur-
Ing any one-minute of system operation. This band shall always be within the steadystate frequency limits.
b. Any rate of frequency change due to frequency modulation shall not be greamr
than 18 cpa/s.
3. The following requirements for uttliastlon equipments:
a. During transients In area I of figure 12 or with rates of transient frequency
change less than 126 cps/a, utilization equipment shall provide 100 percent performeAceand remain unaffected In reliablty.
- 18 -
Aeronautical Electronic and Electrical Laboratory
REPORT NO. NADC-EL-5675
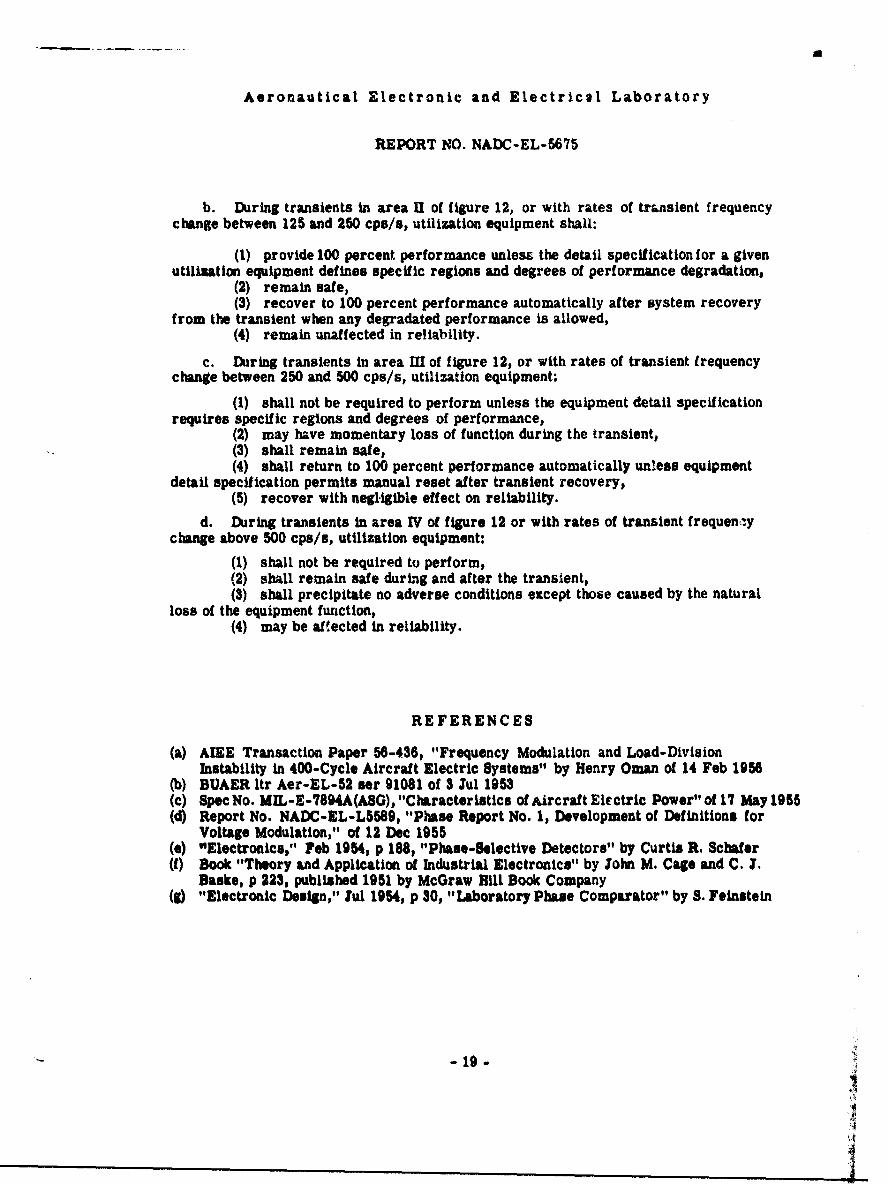
b. During transients in area 11 of figure 12, or with rates of transient frequencychange between 125 and 250 cps/s, utilization equipment shall:
(1) provide 100 percent performance unless the detail specification for a givenutilization equipment defines specific regions and degrees of performance degradations
(2) remain safe,(3) recover to 100 percent performance automatically after system recovery
from the transient when any degradated performance is allowed,(4) remain unaffected in reliability.
c. During transients in area MI of figure 12, or with rates of transient frequencychange between 250 and 500 cps/s, utilization equipment:
(1) shall not be required to perform unless the equipment detail specificationrequires specific regions and degrees of performance,
(2) may have momentary loss of function during the transient,(3) shall remain safe,(4) shall return to 100 percent performance automatically unless equipment
detail specification permits manual reset after transient recovery,(5) recover with negl-igible effect on reliability.
d. During transients in area IV of figure 12 or with rates of transient frequen•1ychange above 500 cps/s, utilization equipment:
(1) shall not be required to perform,(2) shall remain safe during and after the transient,(3) shall precipitate no adverse conditions except those caused by the natural
loss of the equipment function,(4) may be affected in reliability.
REFERENCES
(a) AMEE Transaction Paper 56-436, "Frequency Modulation and Load-DivisionInstability in 400-Cycle Aircraft Electric Systems" by Henry Oman of 14 Feb 1956
(b) BUAER Itr Aer-EL-52 ser 91081 of 3 Jul 1953(c) Spec No. MIL-E-7854A(ASG), "Characteristics of Aircraft Electric Power" of 17 May 1955(d) Report No. NADC-EL-L5569, "Phase Report No. 1, Development of Definitions for
Voltage Modulation," of 12 Dec 1955(e) "Electronics," Feb 1954, p 188, "Phase-Selective Detectors" by Curtis R. Schafer(f) Book "Theory and Application of Industrial Electronics" by John M. Cage and C. I.
Basks, p 233, published 1951 by McGraw Hill Book Company(g) "Electronic Design," Jul 1954, p 30, "Laboratory Phase Comparator" by S. Feinstein
- -19 -
Aeronautical Electronic and Electrical Laboratory
REPORT NO. NADC-EL-5675
TABLE I
ELECTRIC SYSTEMCOMPATIBILITY RELATIONSHIPS FOR FREQUENCY TRANSIENTS
BEWEEN AIRCRAFT ELECTRIC SYSTEMS AND UTILIZATION EQUIPMENTS
TABLE I
ELECTRIC SYSTEMCOMPATIBILM RELATIONSHXPS FOR ?REQUENCY TRASIENTS
BDym AIRcRAPT ELECTRIC SYSTEMS AND UTILIZATION EQUIPMaM.
Area I Area I Area II Area IV
(D) Normal load switching (D) Bus switching (D) Faults Auld recovery (P) No electric systemfrom faults operation In this
rF) Al fllgr. conditions (D) Synchronizing (D) Rst after aultare
(F) ue)sual e/ectric system, D) Wareup not seen by utili-oer-•'lcne required for zation equipmentaircra&ft funr.ction and ( E) Ilectric systemisseeon operations required (C) Electric system
for function of o;Wratlon in this(F) Ocaurrence under manual electric system area occur* rarely,
or autonatic control perhape once during(P) Usually tied in to any given alroraft
distinct aircrkft flightoperational con-ditione C?) Occurrence not under
any manual or auto-(W) Electric system matic control
operations In thisarea occur occasion- C) Recovery under auto-ally, perhaps 3 times matic or manual coetrolduring one opre-tional period
Note: Pui.ctl:nal W C?)Deslgr. D
TABLE II
UTILIZATION EQUIPMENTCOMPATIBILITY RELATIONSHIPS FOR FREQUENCY TRANSIENTS
BETWEEN AIRCRAFT ELECTRIC SYSTDMS AND UTILIZATION EQUIPMENTS
UTM1I7ATION PQUIPKMNCOIMATmU.XTW RIMATION HZPI FOR FRQDO YANIiaPTS
UWVY AIRCRAFT ,EiT•RC Sv$T3 3 40M UTIL1Z4TION UIPMOUTS
_____ ~Area 1!
W" 1009 perwcance (F) 00% performance (") No performance (y) "a ot prr'"' ms(ournl.gr transient) (during transient) requ.re.1 Uq%084 de-uP) No cnlee In reliability s6e elquipmt 4un. lless esqu•ent Os- tail Lpse "stAte@toe'l el de ~ tail spas e quires ofppi -Able I~potions
Guaow~nce or region@ selcitl'e rllesin n Ar lr~o IVnd reql roeeS/( degreosJ or perrel. "areasO at INPorrmlIww spd~l'oiat _eio, aNlnd
manes degradation to be maintainds derees of 0104p r.foarmorl O bo mhee -
(I) Remain safe (P) aRiSn ae talinoet
(P) Return to 10" Ferrer. (W) Momentary 1eek Of (P) Remain salemanes autamasleslly after egutiment tnotionsrecovery frwm trealsint net permitted to (VI Return to poprormacce
affect l pesot per. not requilrd lls(P) No ceawge in reliability fermanes aofer recov. sailed out In daltaI
er; from transient spes icalmi
(F) Return to 10OII pl• er- (r) To ;reo.lpitee rA ad.mano*oseauteialsally ype verse .cniidleeos eaeptless equAI9 t "etall those caused thespeo sese manual re. n oitsal 10e or theset of equAiment iIipent Ammonm
(F) on21141le (F) on molleclu sy O erelabllllll l affected
0D) Intessrl prot4esemfrom c er Soo
Nowe, PjActional - (W)tlesta . (i) ,2
- 20 -
Aeronautical Electronic and Electrical Laboratory
REPORT NO. NADC-EL-5675
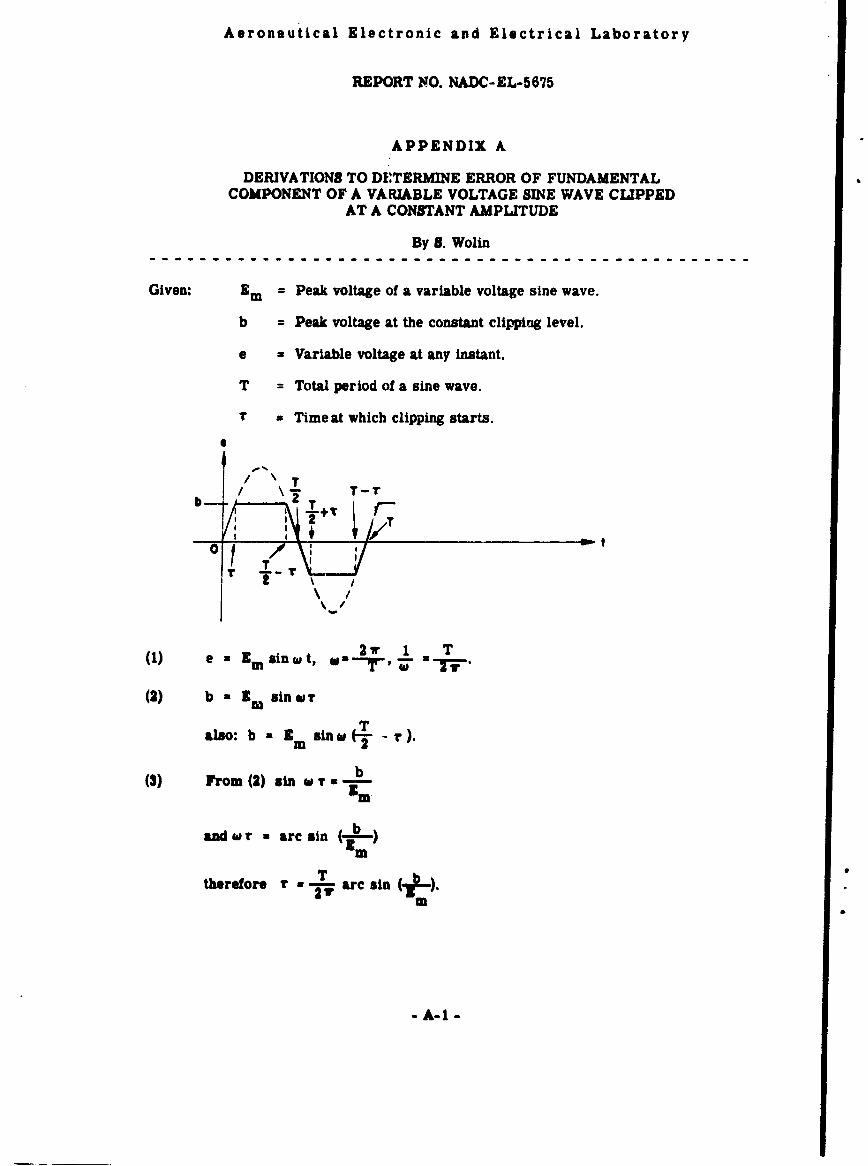
APPENDIX A
DERIVATIONS TO DETERMINE ERROR OF FUNDAMENTALCOMPONENT OF A VARIABLE VOLTAGE SINE WAVE CLIPPED
AT A CONSTANT AMPLITUDE
By 8. Wolin
Given: Em = Peak voltage of a variable voltage sine wave.
b = Peak voltage at the constant clipping level.
e = Variable voltage at any instant.
T = Total period of a sine wave.
T = Time at which clipping starts.
/ \T1/ T T-r
2 T
(1) e a E sinwt, 2v 1 - T
(2) b - Bra sin wv
also: b a•e sinm T r)"
(8) From (2) sin w T b
Sand w r - arc sin It- -)
-AnI
teeosra 2 arc sinm
-A-I -
Aeronautical Electronic and Electrical Labvatory
REPORT NO. NADC-EL-5675
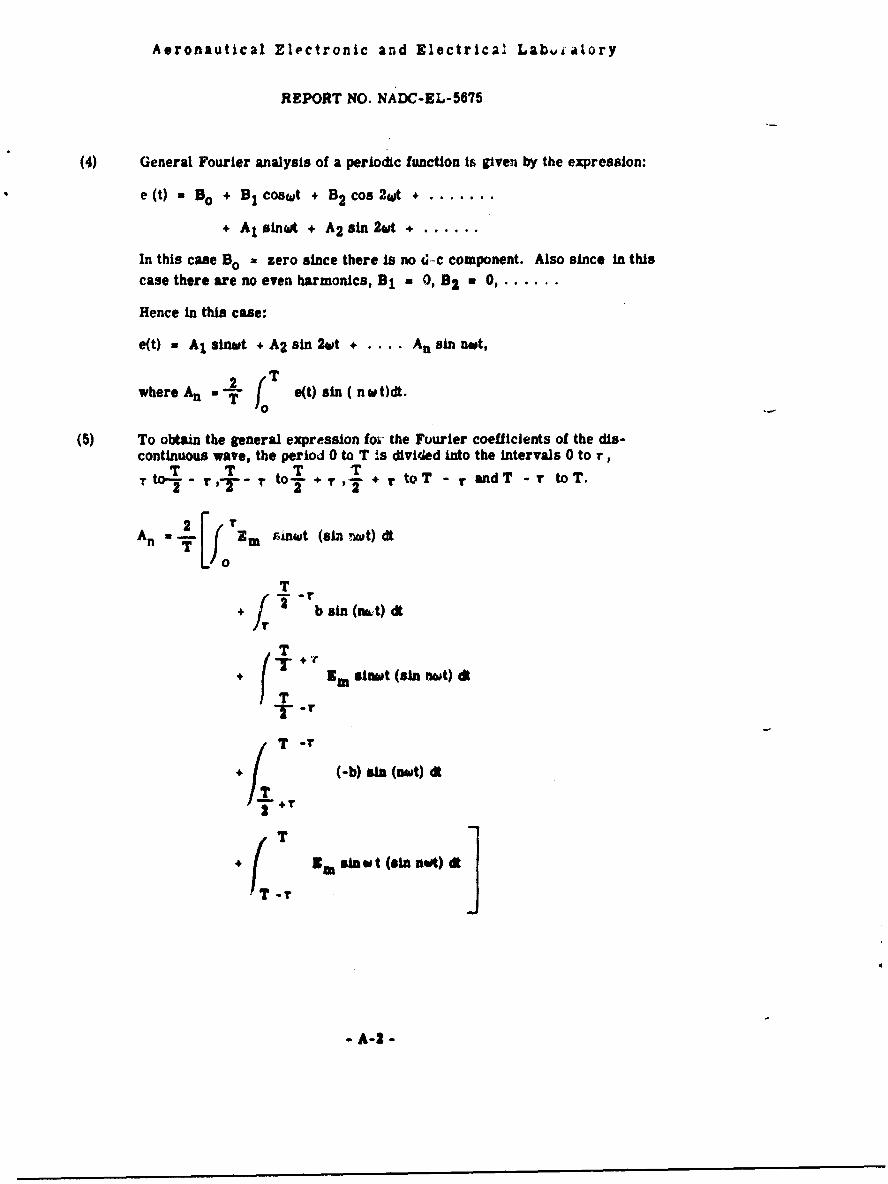
(4) General Fourier analysis of a periodic function is given by the expression:
e(t) a 90 + Bcoswt + B2 cos 2Wt . .......
+ Alsin(&t + A2 sin2wt +. ......
In this case B0 a zero since there is no d -c component. Also since in this
case there are no even harmonics, B1 = 0, 82 = 0, ......
Hence In this case:
e(t) = Aisinut +A2 sin 2t + .... Asin not,
where A0 a (T e(t) sin (nwt)d.0
(5) To obtain the general expression foi' the Fourier coefficients of the dis-continuous wave, the period 0 to T is divided into the intervals 0 to r,
T T T1 TtOW2- ,r1-y - to2 + ,'IT + r toT - r andT -r toT.
2n [f T •m't (sin .••)dt2
+ / 2 b sin (nkt) dt
fY + sM ut (sin nwt) dt
TT-
+ (-b) in (ant) dt
T
I - sIinbW t(slin nht) aJ
- A-2 -
Aeronautical Electronic and Electrical Laboratory
REPORr NO. NADC-EL-5675
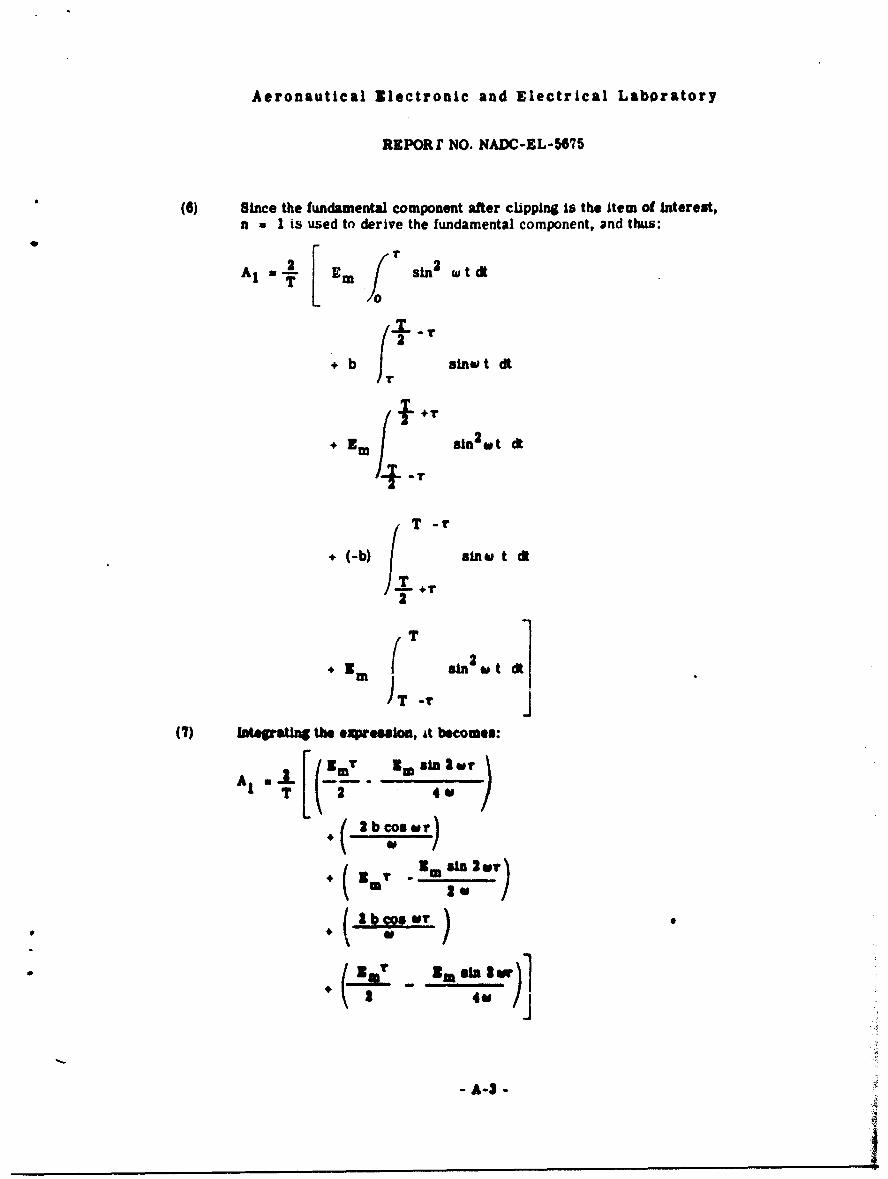
(6) Since the fundamental component after cLipping is the item of interest,n 1 1 is used to derive the fundamental component, and thus:
Or
A, .-- sin2 wtdtTM[Ef
2
+ b sinw t dt
+ Em sin2wt dk
/T -r
+ (-b) BMWn~ t dt
+T
T
T
SIn a£ sn& t dt)T -r
(7) Itegra the eUm ession, it becomes:
( 2bcoseir)
* ( ~310 sin ISV)
* *( 2 lu 4.]
A- --
- Ao$i
Aeronautical Electronic and Electrical Laboratory
REPORT NO. KADC-EL-5675
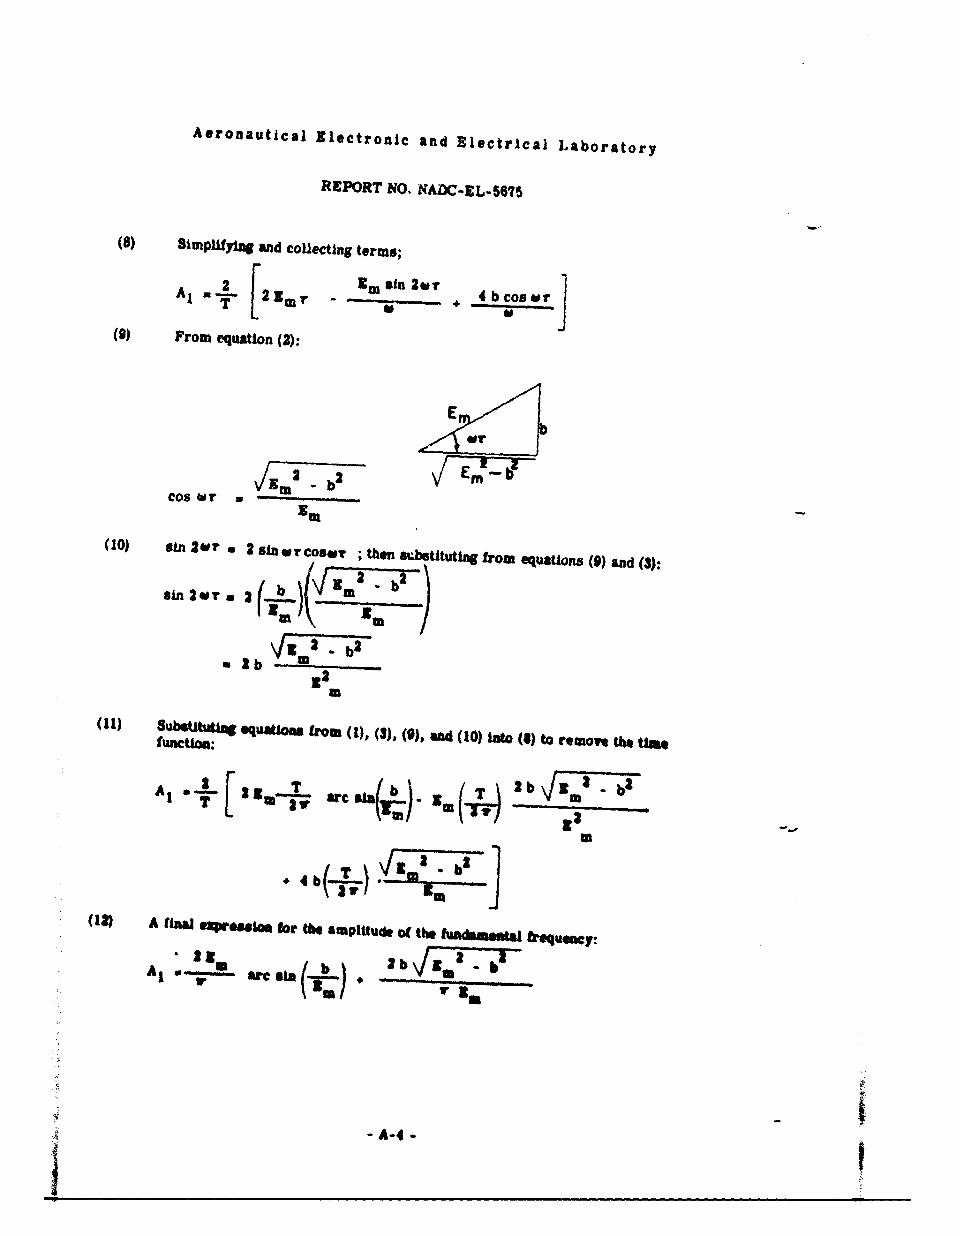
(8) SimplifyID9 and coUectIng terms;
A 2 E" s2 - 4bcosworA i a-
(9) From equation (2):
i~m 2 7b 2
cos or w
(10) sIn 2'Or - 2 sinw rcoswr ; then msbstituUng from equations (9) and (3):
sin 2wi. 2 (b(/m b
s•2ur. :1 m
- ib V -b 2b32
m
(11) SubsUbtit equations from (1), (3), (0), and (10) Into (8) to remove the tintfunctoua:
[3Z ( ( )
3A' SA It
Im
S- A-4 -
T -,-mI4b am.....A WNI"mfrteaptuko t
Aeronautical Electronic and Electrical Laboratory
REPORT NO. NADC-EL-5675
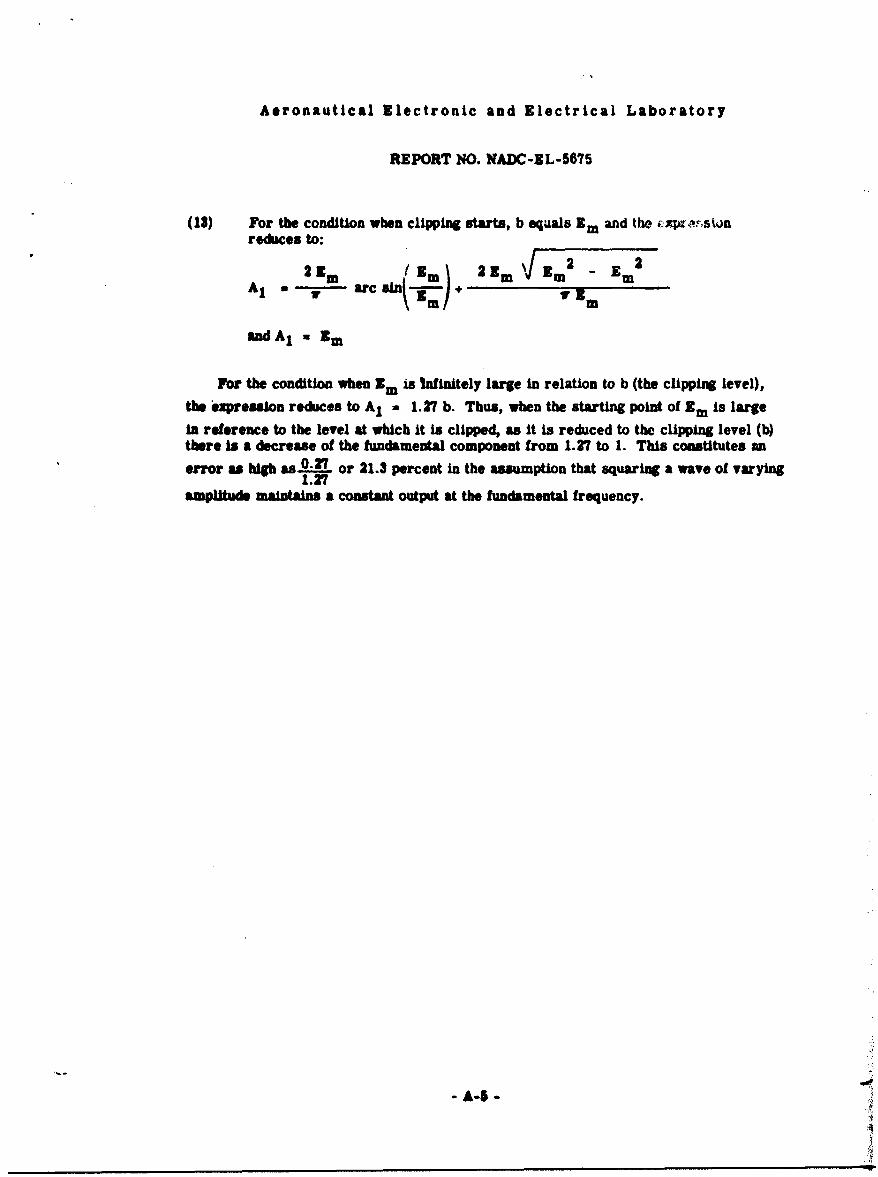
(13) For the condition when clipping starts, b equals Em and the izgwrstonreduces to:
21r mm Em2 - EmEA1 " r arc sin ' +j " i
and Al •gm
For the condition when Xm is Infinitely large in relation to b (the clipping level),
the expresasion reduces to A1 a 1.27 b. Thus, when the starting point of Em is largein reference to the level at whicb it is clipped, as it is reduced to the clipping level (b)there Is a decrease of the fundamental component from 1.27 to 1. This constitutes an
error as high as..qIL or 21.3 percent in the assumption that squaring a wave of varying1.27
amplithde maintains a constant outpu at the fundamental frequency.
-A-$ -
Aeronautical Electronic and Electrical Laboratory
REPORT NO. NADC-EL-5675
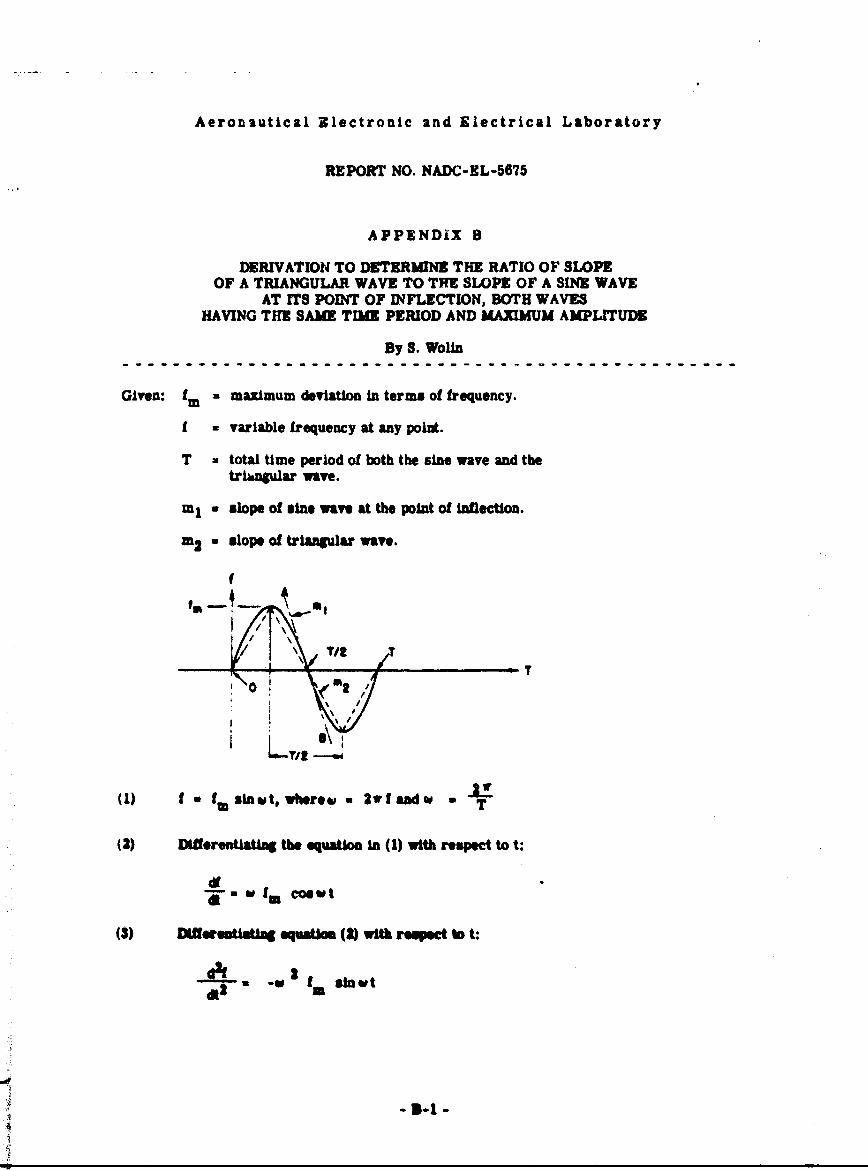
APPENDIX B
DERIVATION TO DETERMINE THE RATIO OF SLOPEOF A TRIANGULAR WAVE TO THE SLOPE OF A SINE WAVE
AT ITS POINT OF INFLECTION, BOTH WAVESHAVING THIE SAME TIME PERIOD AND MAXIMUM AMPLITUDE
By S. Wolin
Given: fm a maximum deviation In terms of frequency.
f - variable frequency at any point.
T z total time period of both the sine wave and thetriw*glar wave.
mI a slope of sin* wave at the point of Inflection.
m2 = slope of triangular wave.
f
LT/T
(1) f "fm sinwt, where w 2 wfandw - T
(2) Difrentlatrng the equation in (1) with respect to t:
di-*=s f* coest
(3) emf tisting equsila (2) with respect t:
•-W Its sin Wt
'• -s-1 t
Aeronautical Zlectronic and Electrical Laboratory
REPORT NO. NADC-EL-5675
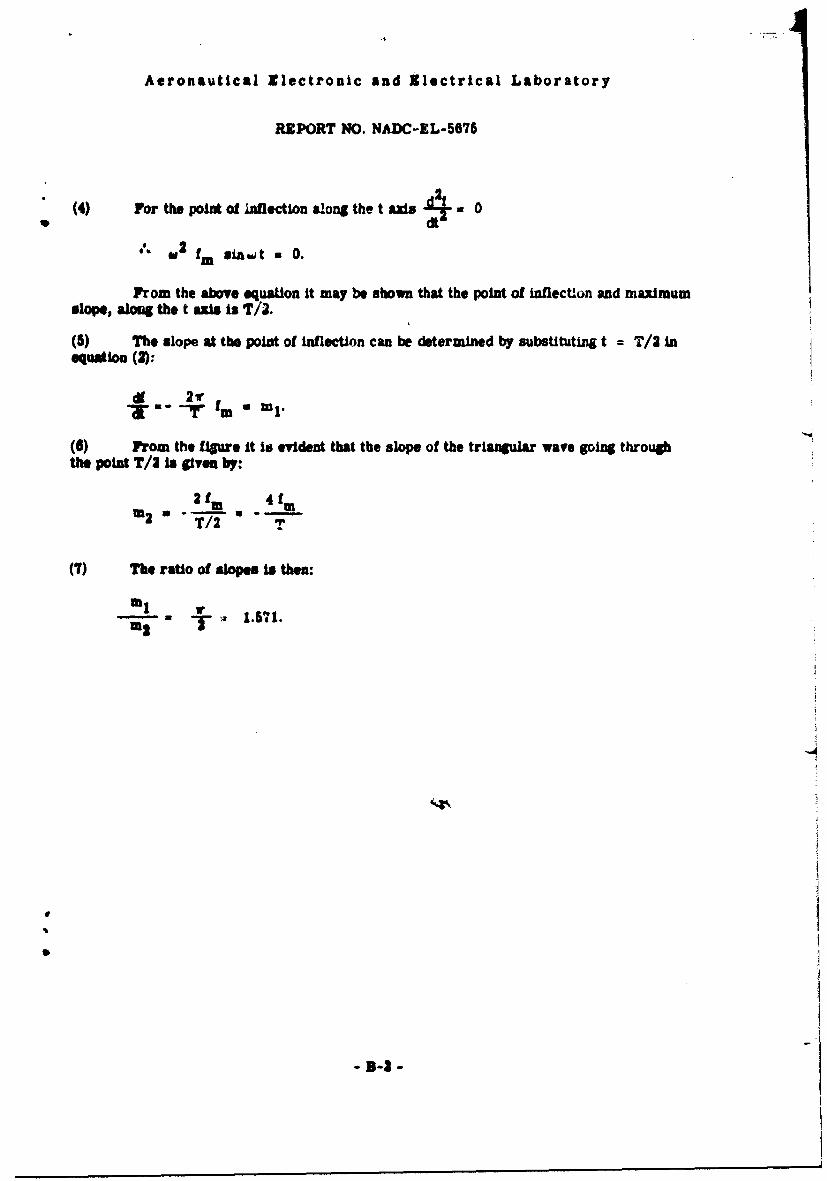
(4) For the point of Inflection along the t axis - 0
" 2 fm girelt a 0.
From the above equation it may be shown that the point of inflection and maximumslope, along the t axis is T/2.
(5) The slope at the point of inflection can be determined by substituting t = T/2 inequation (2):
dt 2 1 i 1
(6) From the figure it is evident that the slope of the triangular wave going throughthe point T/3 is given by:
2 fin 4 fmm2 T/2 -"
(7) The ratio of slopes, I then:
mI 1.
1571.
o 3-3l -