Embed Size (px)
Citation preview
DISPUT E S & INVES TI GATI O N S • ECONOM I C S • F INA N CI A L ADVIS O RY • MANAGE M E N T CONSU LT I NG
©2010 Navigant Consulting, Inc.
Confidential and proprietary. Do not distribute or copy.
December 9, 2010
US Natural Gas – A Responsible Choice
National Conference of State Legislatures – Fall Forum
Task Force on Energy Supply
Biltmore Hotel, Phoenix, Arizona
1©2010 Navigant Consulting, Inc.
Confidential and proprietary. Do not distribute or copy. E N E R G Y
Important Notice
This presentation was prepared by Navigant Consulting, Inc. exclusively for the benefit and internal use
of the National Conference of State Legislatures (NCSL) at its Fall Forum on December 8-10, 2010. The
presentation is intended for the use of NCSL and its members and no part of it may be circulated,
quoted, or reproduced for distribution outside these organization(s) without prior written approval from
Navigant Consulting, Inc. This presentation is incomplete without reference to, and should be viewed
solely in conjunction with the oral briefing provided by Navigant Consulting, Inc.
December 9, 2010
©2010 Navigant Consulting, Inc. All rights reserved. Navigant Consulting is not a certified public accounting firm and does not provide audit, attest, or public
accounting services. See www.navigantconsulting.com/licensing for a complete listing of private investigator licenses. Investment banking, private placement,
merger, acquisition and divestiture services offered through Navigant Capital Advisors, LLC., Member FINRA/SIPC.
2©2010 Navigant Consulting, Inc.
Confidential and proprietary. Do not distribute or copy. E N E R G Y
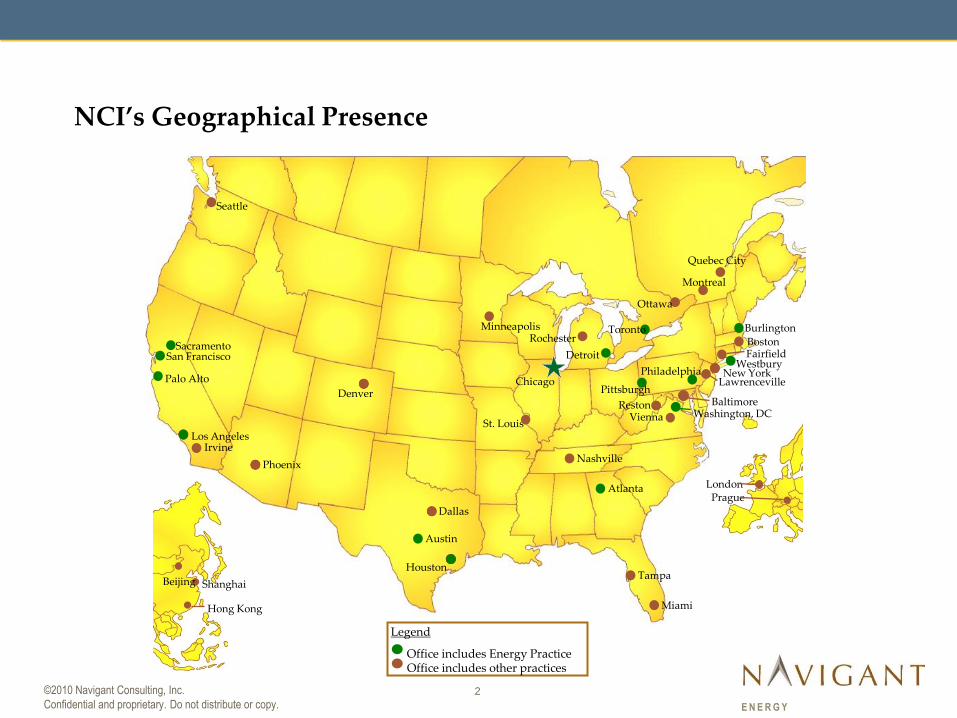
NCI’s Geographical Presence
SacramentoSan Francisco
Los Angeles
Phoenix
Dallas
Austin
Houston
Nashville
Atlanta
Tampa
Chicago
Toronto Burlington
Boston
Westbury
LawrencevillePhiladelphia
Pittsburgh
ViennaReston
Denver
Detroit
Seattle
Palo Alto
Minneapolis
New York
St. Louis
Fairfield
Ottawa
Irvine
Miami
Rochester
PragueLondon
Hong Kong
ShanghaiBeijing
Washington, DC
Legend
Office includes Energy PracticeOffice includes other practices
Baltimore
Montreal
Quebec City
3©2010 Navigant Consulting, Inc.
Confidential and proprietary. Do not distribute or copy. E N E R G Y
2
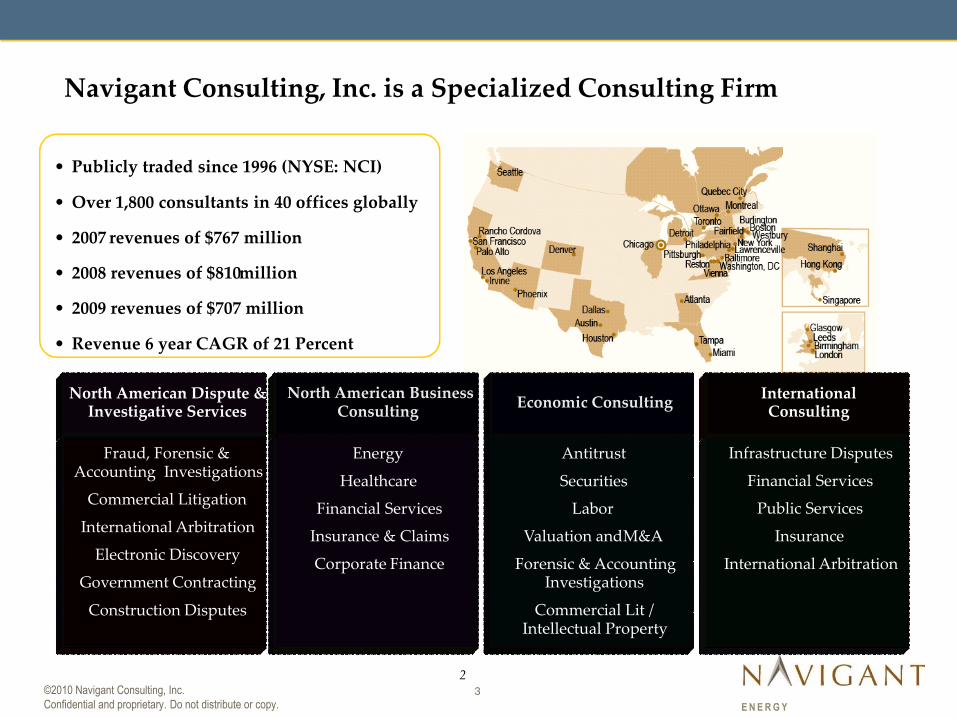
• Publicly traded since 1996 (NYSE: NCI)
• Over 1,800 consultants in 40 offices globally
• 2007 revenues of $767 million
• 2008 revenues of $810 million
• 2009 revenues of $707 million
• Revenue 6 year CAGR of 21 Percent
North American Dispute & Investigative Services
North American Business Consulting
International Consulting
Economic Consulting
Fraud, Forensic & Accounting Investigations
Commercial Litigation
International Arbitration
Electronic Discovery
Government Contracting
Construction Disputes
Energy
Healthcare
Financial Services
Insurance & Claims
Corporate Finance
Infrastructure Disputes
Financial Services
Public Services
Insurance
International Arbitration
Antitrust
Securities
Labor
Valuation and M&A
Forensic & Accounting Investigations
Commercial Lit / Intellectual Property
Navigant Consulting, Inc. is a Specialized Consulting Firm
4©2010 Navigant Consulting, Inc.
Confidential and proprietary. Do not distribute or copy. E N E R G Y
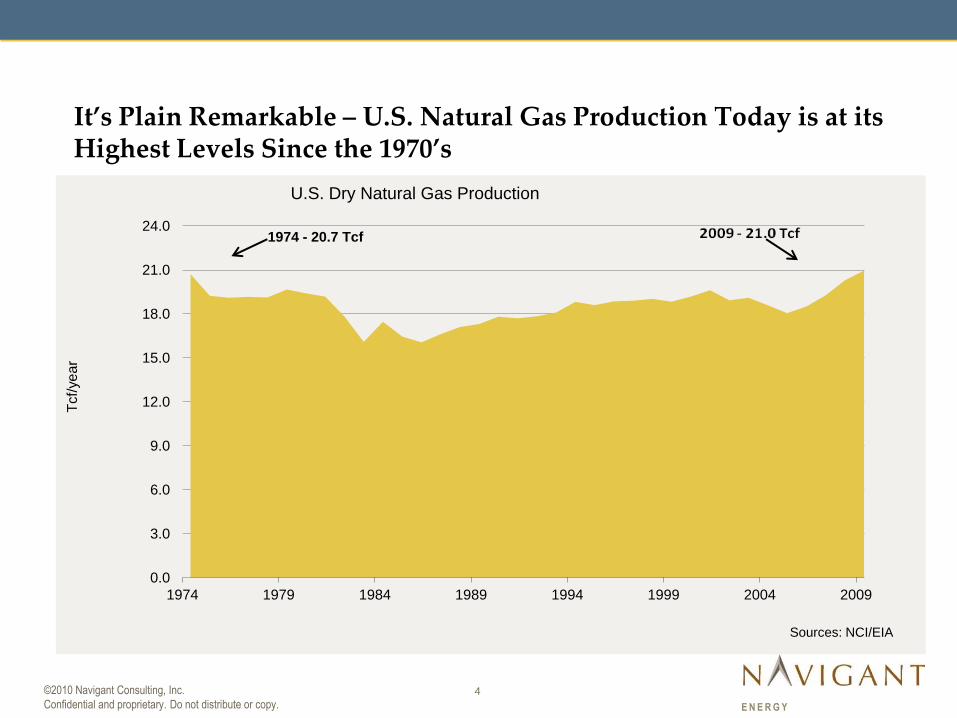
It’s Plain Remarkable – U.S. Natural Gas Production Today is at its Highest Levels Since the 1970’s
0.0
3.0
6.0
9.0
12.0
15.0
18.0
21.0
24.0
1974 1979 1984 1989 1994 1999 2004 2009
Tcf/
year
U.S. Dry Natural Gas Production
Sources: NCI/EIA
1974 - 20.7 Tcf
Dry Gas Production
5©2010 Navigant Consulting, Inc.
Confidential and proprietary. Do not distribute or copy. E N E R G Y
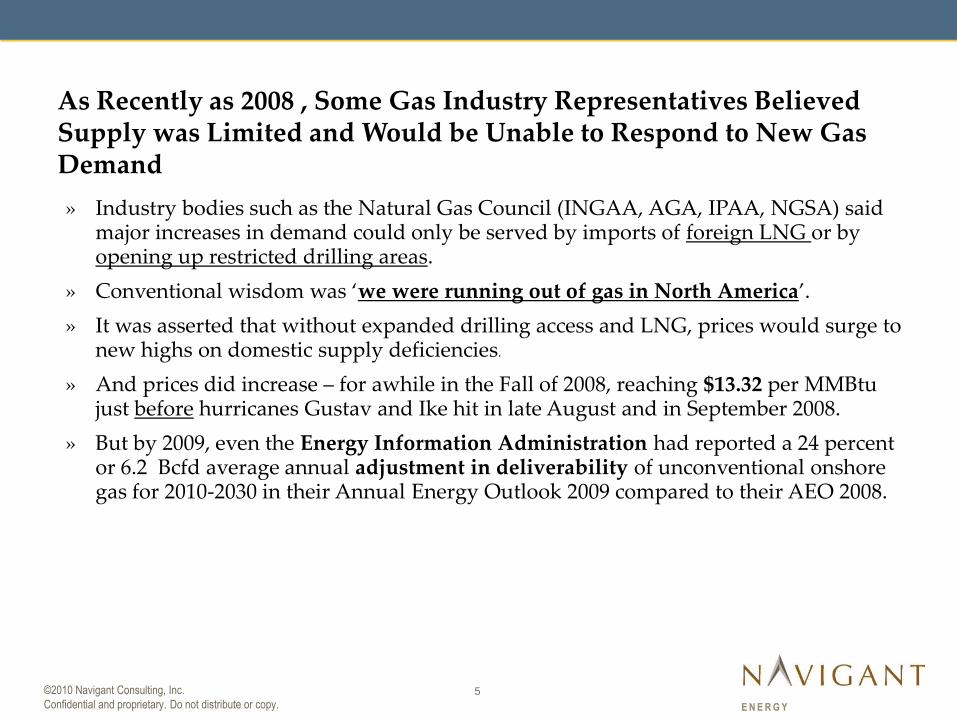
» Industry bodies such as the Natural Gas Council (INGAA, AGA, IPAA, NGSA) said major increases in demand could only be served by imports of foreign LNG or by opening up restricted drilling areas.
» Conventional wisdom was ‘we were running out of gas in North America’.
» It was asserted that without expanded drilling access and LNG, prices would surge to new highs on domestic supply deficiencies.
» And prices did increase – for awhile in the Fall of 2008, reaching $13.32 per MMBtujust before hurricanes Gustav and Ike hit in late August and in September 2008.
» But by 2009, even the Energy Information Administration had reported a 24 percent or 6.2 Bcfd average annual adjustment in deliverability of unconventional onshore gas for 2010-2030 in their Annual Energy Outlook 2009 compared to their AEO 2008.
As Recently as 2008 , Some Gas Industry Representatives Believed Supply was Limited and Would be Unable to Respond to New Gas Demand W
6©2010 Navigant Consulting, Inc.
Confidential and proprietary. Do not distribute or copy. E N E R G Y
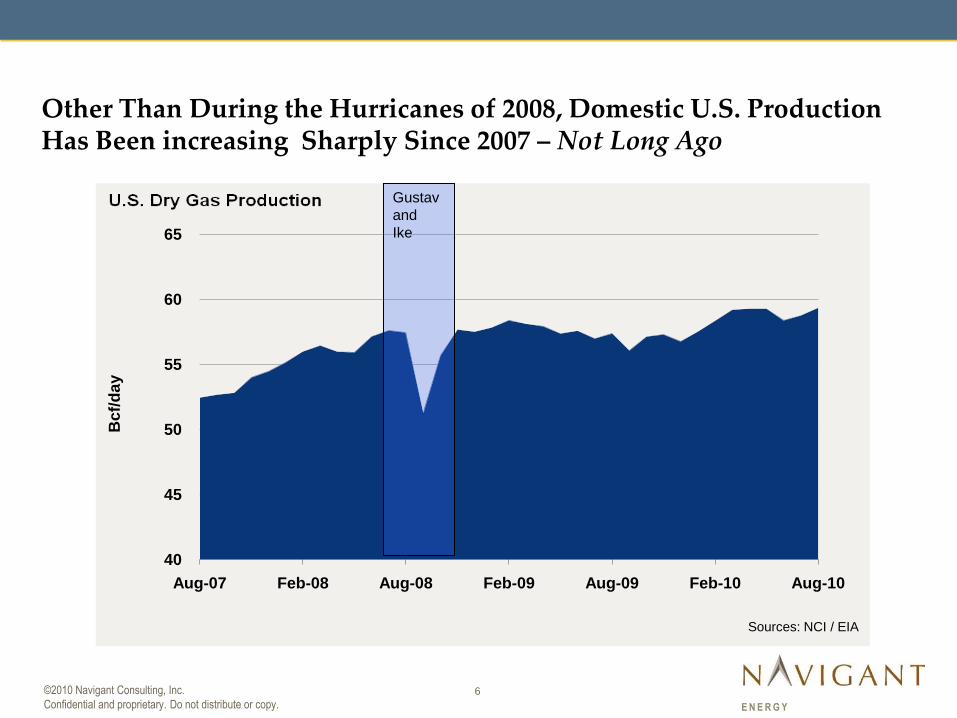
U.S. Dry Gas Production Is Still Increasing
Gustavand Ike
Other Than During the Hurricanes of 2008, Domestic U.S. Production Has Been increasing Sharply Since 2007 – Not Long Ago
40
45
50
55
60
65
Aug-07 Feb-08 Aug-08 Feb-09 Aug-09 Feb-10 Aug-10
Bcf/
da
y
Sources: NCI / EIA
Gustav
and
Ike
7©2010 Navigant Consulting, Inc.
Confidential and proprietary. Do not distribute or copy. E N E R G Y
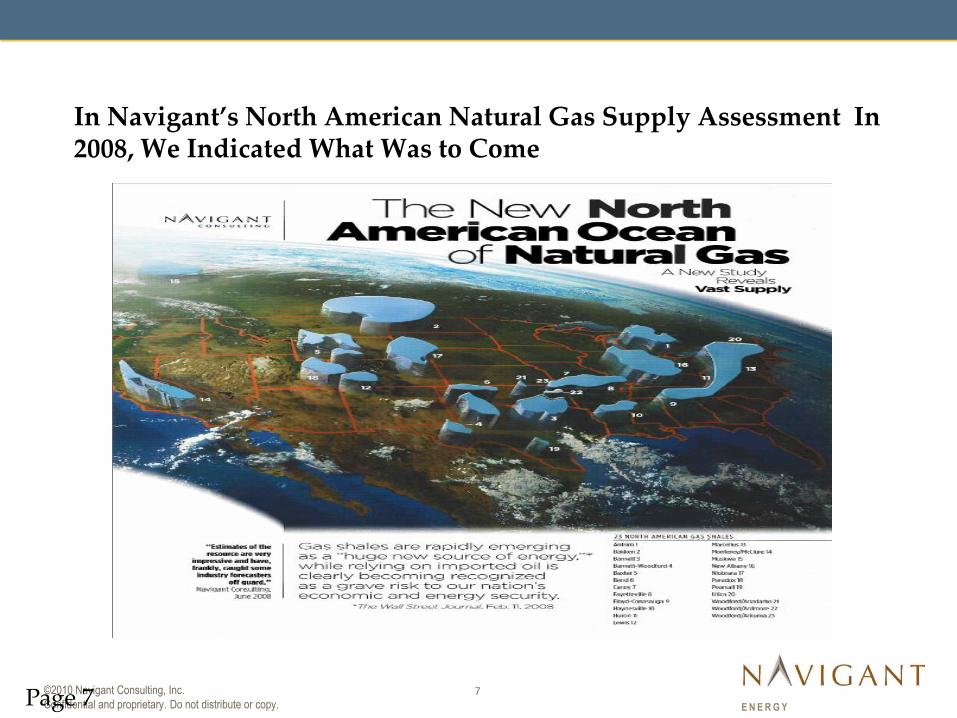
In Navigant’s North American Natural Gas Supply Assessment In 2008, We Indicated What Was to Come
Page 7
8©2010 Navigant Consulting, Inc.
Confidential and proprietary. Do not distribute or copy. E N E R G Y
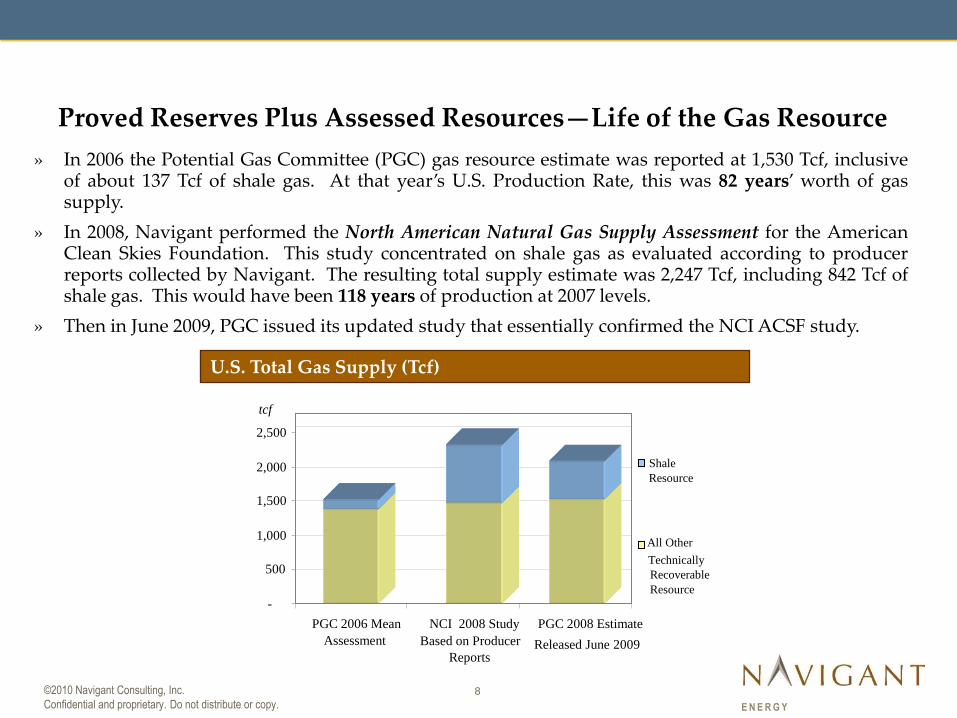
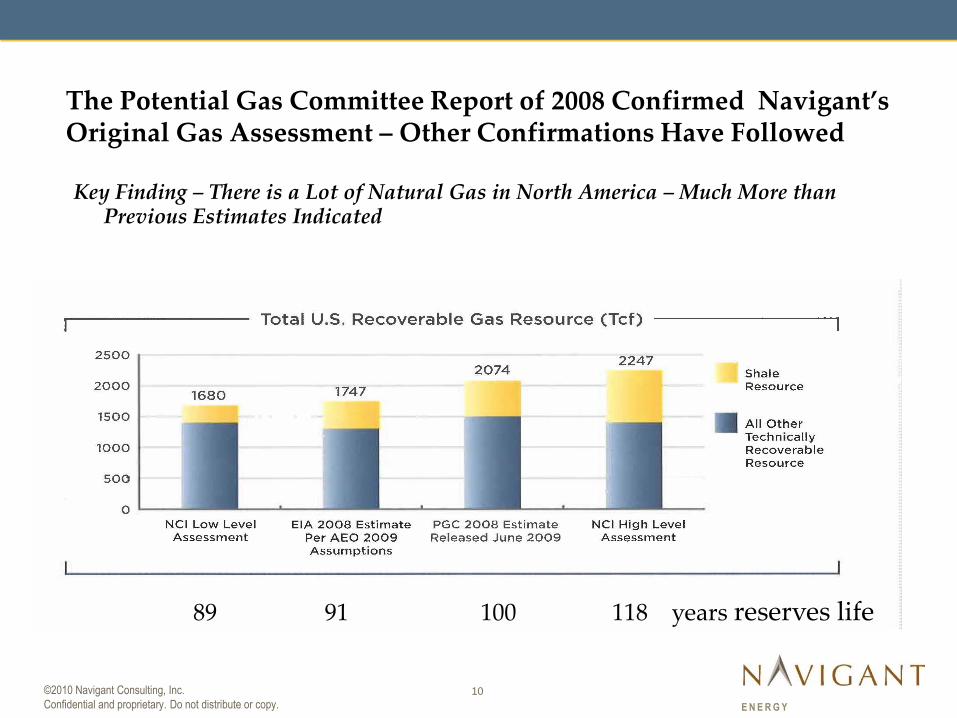
Proved Reserves Plus Assessed Resources—Life of the Gas Resource
» In 2006 the Potential Gas Committee (PGC) gas resource estimate was reported at 1,530 Tcf, inclusiveof about 137 Tcf of shale gas. At that year’s U.S. Production Rate, this was 82 years’ worth of gassupply.
» In 2008, Navigant performed the North American Natural Gas Supply Assessment for the AmericanClean Skies Foundation. This study concentrated on shale gas as evaluated according to producerreports collected by Navigant. The resulting total supply estimate was 2,247 Tcf, including 842 Tcf ofshale gas. This would have been 118 years of production at 2007 levels.
» Then in June 2009, PGC issued its updated study that essentially confirmed the NCI ACSF study.
U.S. Total Gas Supply (Tcf)
82 years at
2006 Prod. Rate
88 years at
2007 Prod. Rate
118 years at
2007 Prod. Rate
-
500
1,000
1,500
2,000
2,500
PGC 2006 Mean
Assessment
NCI 2008 Study
Based on Producer
Reports
PGC 2008 Estimate
Released June 2009
tcf
Shale
Resource
All Other
Technically
Recoverable
Resource
9©2010 Navigant Consulting, Inc.
Confidential and proprietary. Do not distribute or copy. E N E R G Y
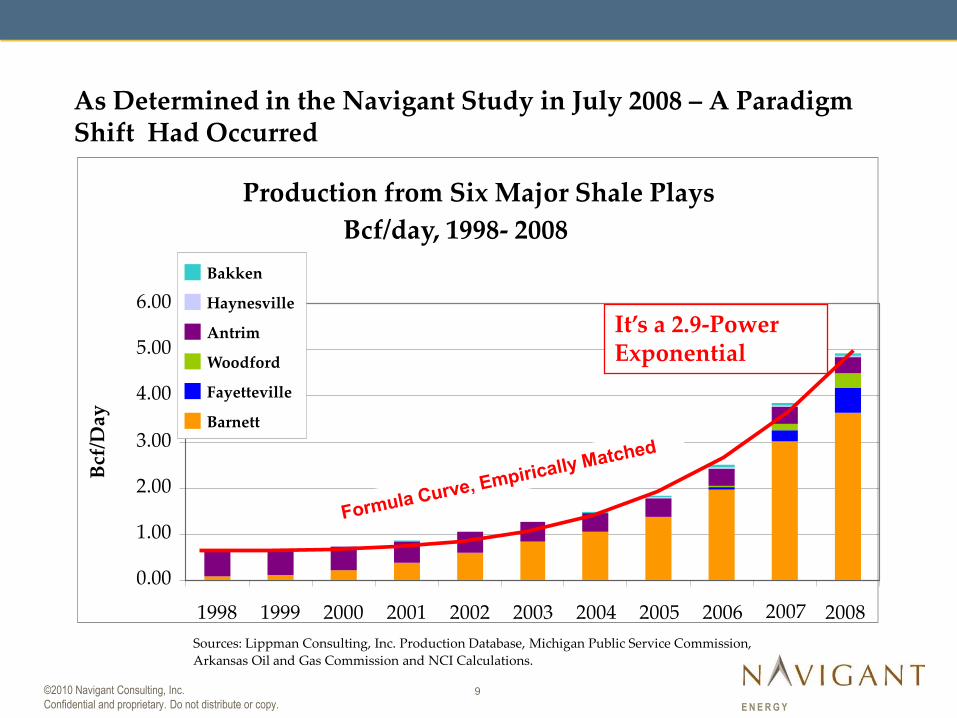
Production from Six Major Shale Plays
Bcf/day, 1998- 2008
0.00
1.00
2.00
3.00
4.00
5.00
6.00
1998 1999 2000 2001 2002 2003 2004 2005 2006 2007 2008
Bcf
/Day
Bakken
Haynesville
Antrim
Woodford
Fayetteville
Barnett
As Determined in the Navigant Study in July 2008 – A Paradigm Shift Had Occurred
The Accelerating Run-Up in Shale Production—An Exponential Curve
It’s a 2.9-Power Exponential
Sources: Lippman Consulting, Inc. Production Database, Michigan Public Service Commission,
Arkansas Oil and Gas Commission and NCI Calculations.
10©2010 Navigant Consulting, Inc.
Confidential and proprietary. Do not distribute or copy. E N E R G Y
The Potential Gas Committee Report of 2008 Confirmed Navigant’s Original Gas Assessment – Other Confirmations Have Followed
Key Finding – There is a Lot of Natural Gas in North America – Much More than Previous Estimates Indicated
89 91 100 118 years reserves life
11©2010 Navigant Consulting, Inc.
Confidential and proprietary. Do not distribute or copy. E N E R G Y
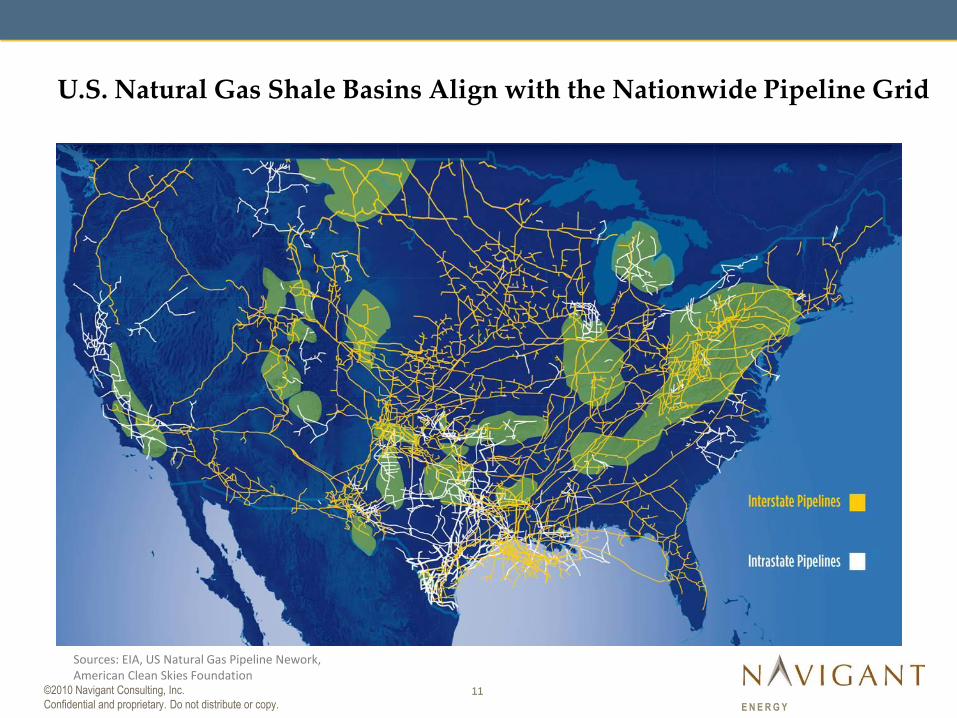
Sources: EIA, US Natural Gas Pipeline Nework, American Clean Skies Foundation
U.S. Natural Gas Shale Basins Align with the Nationwide Pipeline Grid
12©2010 Navigant Consulting, Inc.
Confidential and proprietary. Do not distribute or copy. E N E R G Y
40.00
42.00
44.00
46.00
48.00
50.00
52.00
54.00
56.00
58.00
60.00
Bc
f p
er
Da
y, d
ry
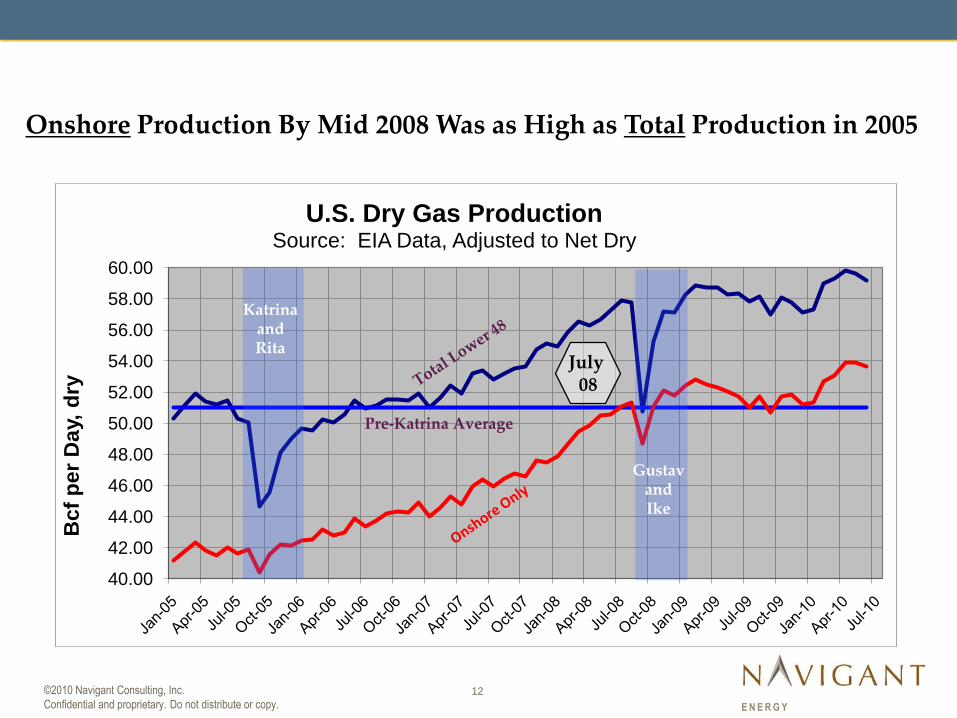
U.S. Dry Gas ProductionSource: EIA Data, Adjusted to Net Dry
KatrinaandRita
GustavandIke
Pre-Katrina Average
July 08
U.S. Gas Supply Increased To Record Levels
Onshore Production By Mid 2008 Was as High as Total Production in 2005
13©2010 Navigant Consulting, Inc.
Confidential and proprietary. Do not distribute or copy. E N E R G Y
600
800
1,000
1,200
1,400
1,600
2003 2004 2005 2006 2007 2008 2009 2010
Rigs
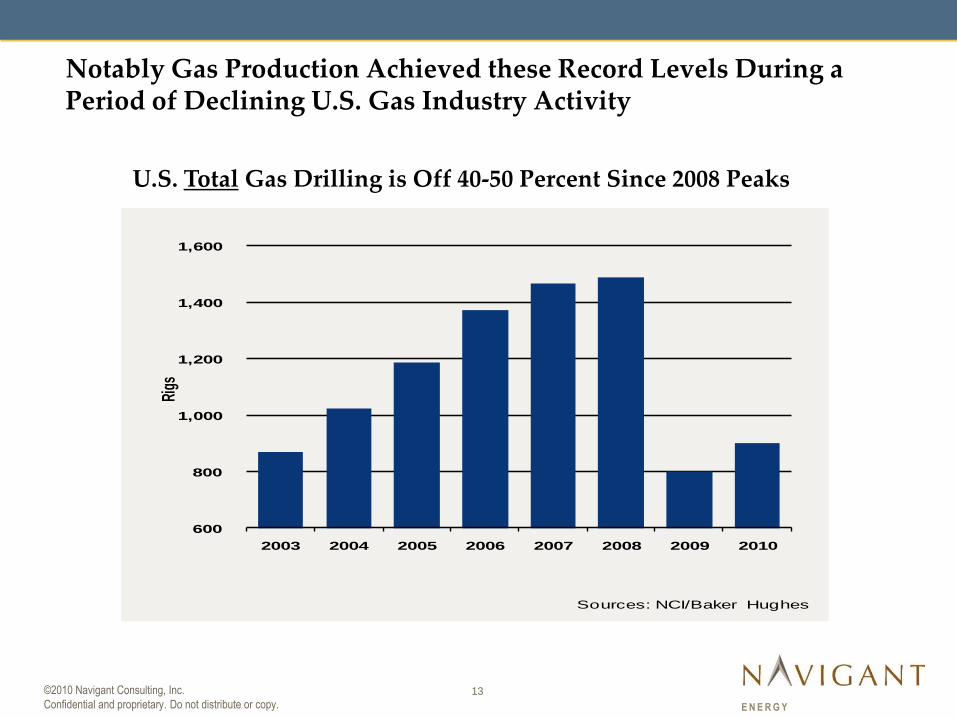
Sources: NCI/Baker Hughes
Notably Gas Production Achieved these Record Levels During a Period of Declining U.S. Gas Industry Activity
U.S. Total Gas Drilling is Off 40-50 Percent Since 2008 Peaks
14©2010 Navigant Consulting, Inc.
Confidential and proprietary. Do not distribute or copy. E N E R G Y
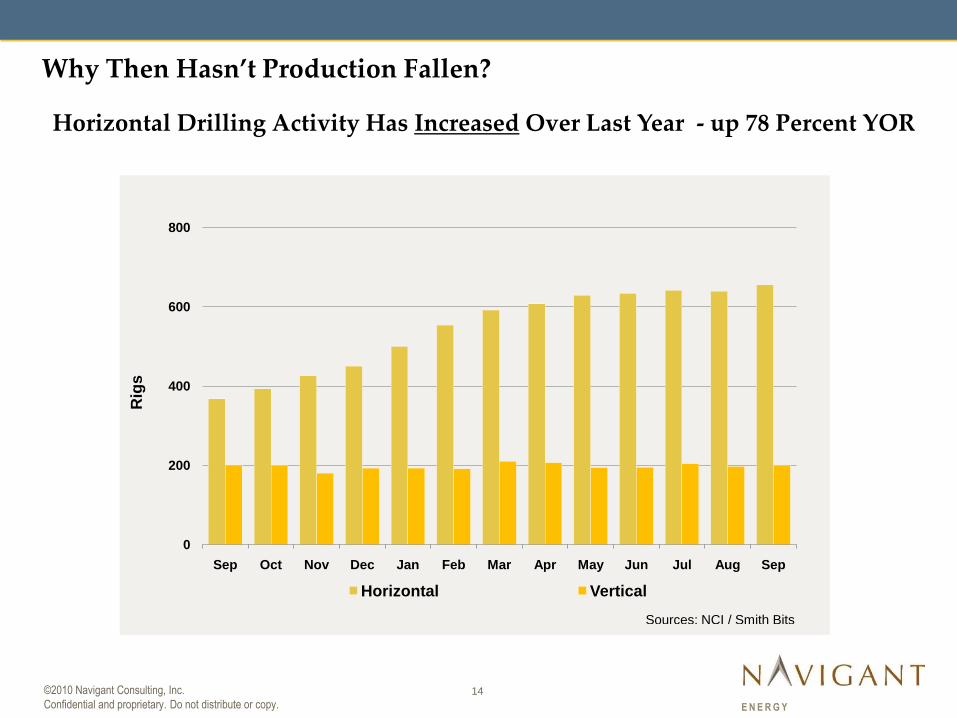
0
200
400
600
800
Sep Oct Nov Dec Jan Feb Mar Apr May Jun Jul Aug Sep
Rig
s
Horizontal Vertical
Sources: NCI / Smith Bits
Horizontal Drilling Activity Has Increased Over Last Year - up 78 Percent YOR
Why Then Hasn’t Production Fallen?
15©2010 Navigant Consulting, Inc.
Confidential and proprietary. Do not distribute or copy. E N E R G Y
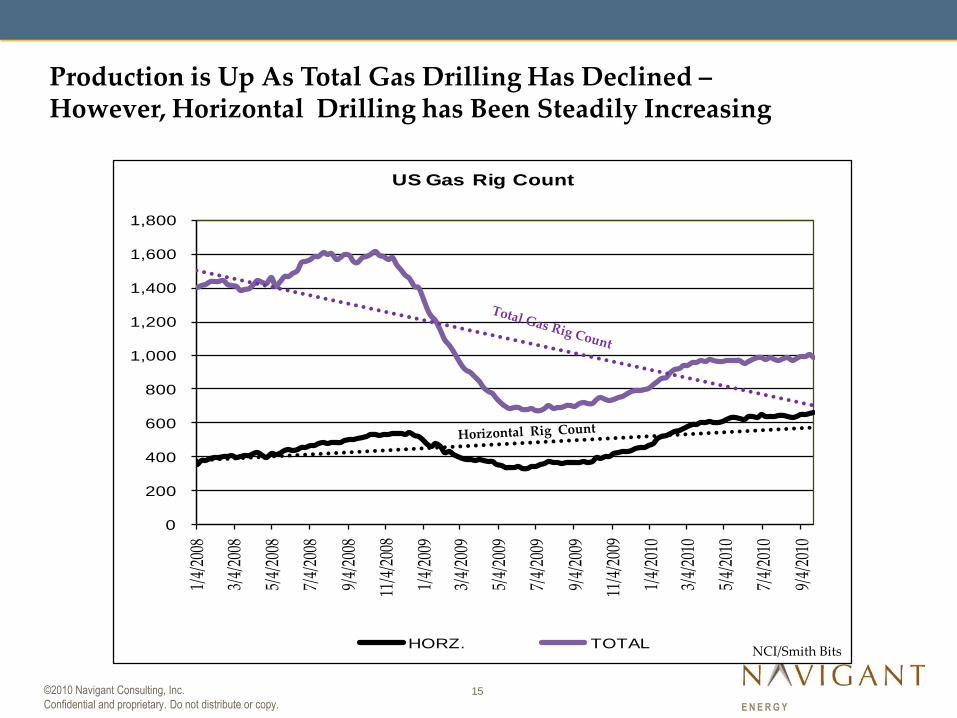
0
200
400
600
800
1,000
1,200
1,400
1,600
1,800
1/4/
2008
3/4/
2008
5/4/
2008
7/4/
2008
9/4/
2008
11/4
/200
8
1/4/
2009
3/4/
2009
5/4/
2009
7/4/
2009
9/4/
2009
11/4
/200
9
1/4/
2010
3/4/
2010
5/4/
2010
7/4/
2010
9/4/
2010
US Gas Rig Count
HORZ. TOTALNCI/Smith Bits
Production is Up As Total Gas Drilling Has Declined –However, Horizontal Drilling has Been Steadily Increasing
16©2010 Navigant Consulting, Inc.
Confidential and proprietary. Do not distribute or copy. E N E R G Y
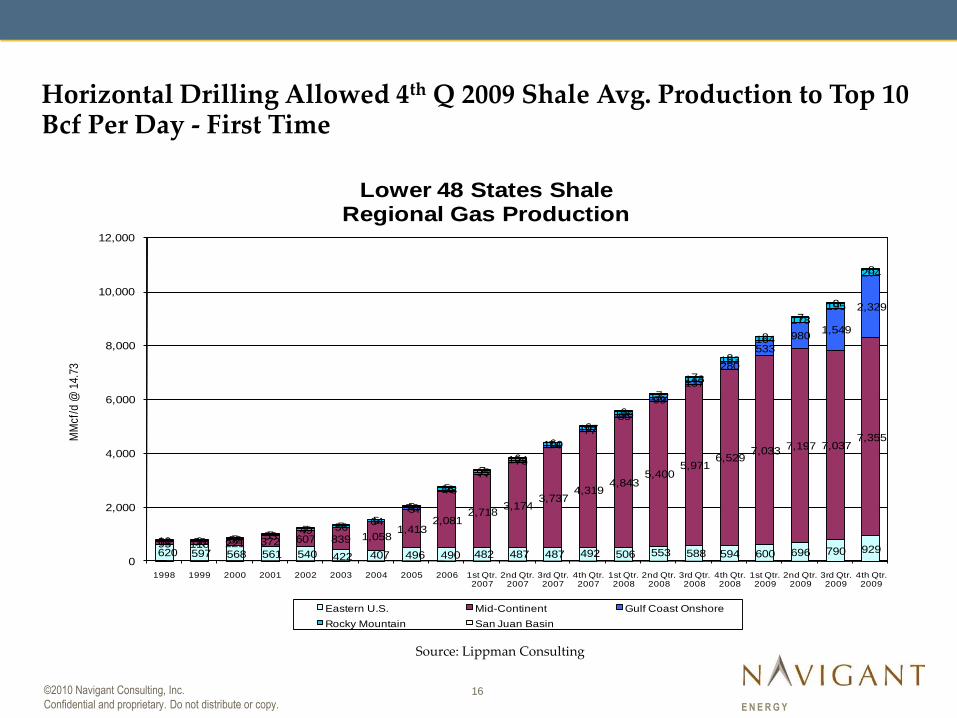
Horizontal Drilling Allowed 4th Q 2009 Shale Avg. Production to Top 10 Bcf Per Day - First Time
620 597 568 561 540 422 407 496 490 482 487 487 492 506 553 588 594 600 696 790 92995 118 221 372 607 839 1,058
1,4132,081
2,7183,174
3,7374,319
4,8435,400
5,9716,529
7,033 7,197 7,0377,355
57
78
77
73
74
77
85
99
137
280
533
9801,549
2,329
51 50 52 5349 56
64
78
86
95
104
100
107
116
132
148
153
164
178
195
204
10 9 7 77 7
5
5
5
7
6
6
6
6
7
7
8
8
7
8
8
0
2,000
4,000
6,000
8,000
10,000
12,000
1998 1999 2000 2001 2002 2003 2004 2005 2006 1st Qtr. 2007
2nd Qtr. 2007
3rd Qtr. 2007
4th Qtr. 2007
1st Qtr. 2008
2nd Qtr. 2008
3rd Qtr. 2008
4th Qtr. 2008
1st Qtr. 2009
2nd Qtr. 2009
3rd Qtr. 2009
4th Qtr. 2009
MM
cf/d
@ 1
4.73
Lower 48 States ShaleRegional Gas Production
Eastern U.S. Mid-Continent Gulf Coast Onshore
Rocky Mountain San Juan Basin
Source: Lippman Consulting
17©2010 Navigant Consulting, Inc.
Confidential and proprietary. Do not distribute or copy. E N E R G Y
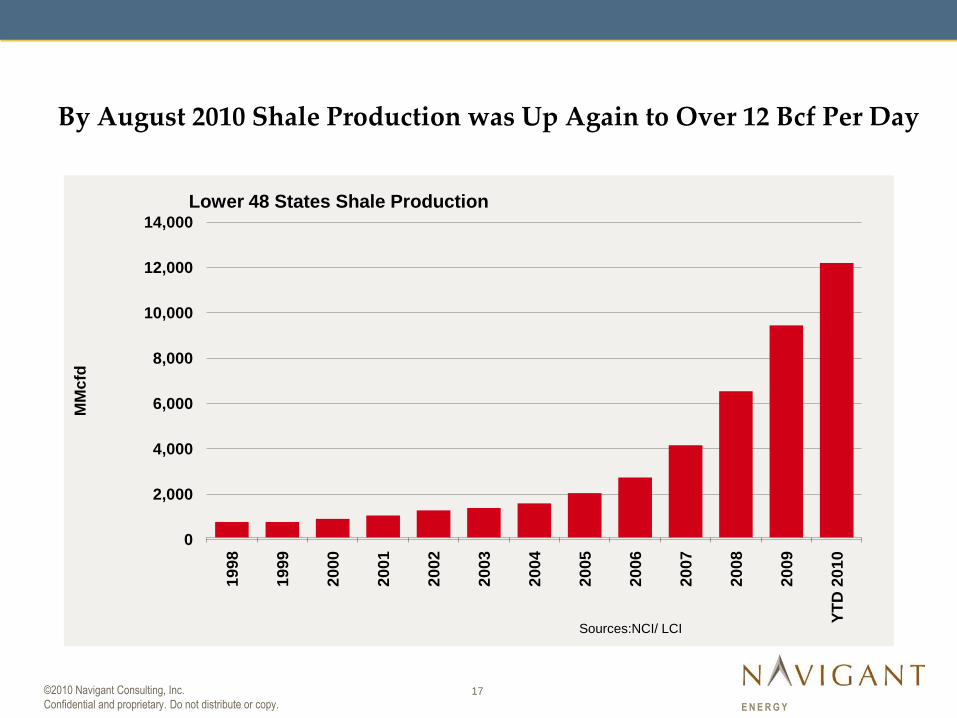
By August 2010 Shale Production was Up Again to Over 12 Bcf Per Day
By August 2010, Shale Production is Up Again to Over 12 Bcf Per Day
0
2,000
4,000
6,000
8,000
10,000
12,000
14,0001
99
8
19
99
20
00
20
01
20
02
20
03
20
04
20
05
20
06
20
07
20
08
20
09
YT
D 2
01
0
MM
cfd
Lower 48 States Shale Production
Sources:NCI/ LCI
18©2010 Navigant Consulting, Inc.
Confidential and proprietary. Do not distribute or copy. E N E R G Y
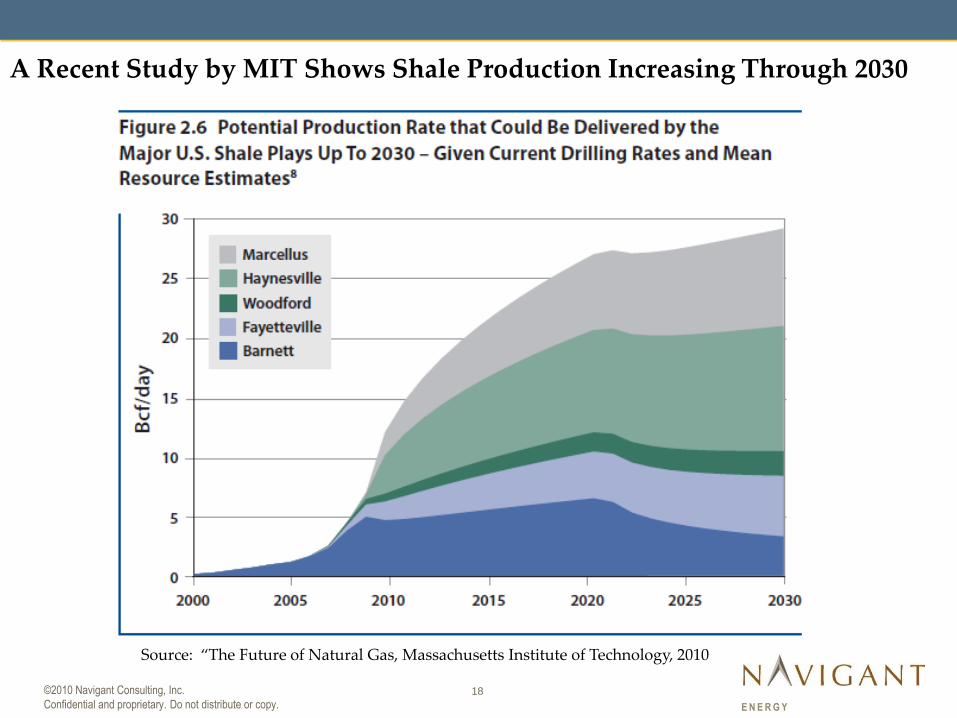
Source: ‚The Future of Natural Gas, Massachusetts Institute of Technology, 2010
A Recent Study by MIT Shows Shale Production Increasing Through 2030
19©2010 Navigant Consulting, Inc.
Confidential and proprietary. Do not distribute or copy. E N E R G Y
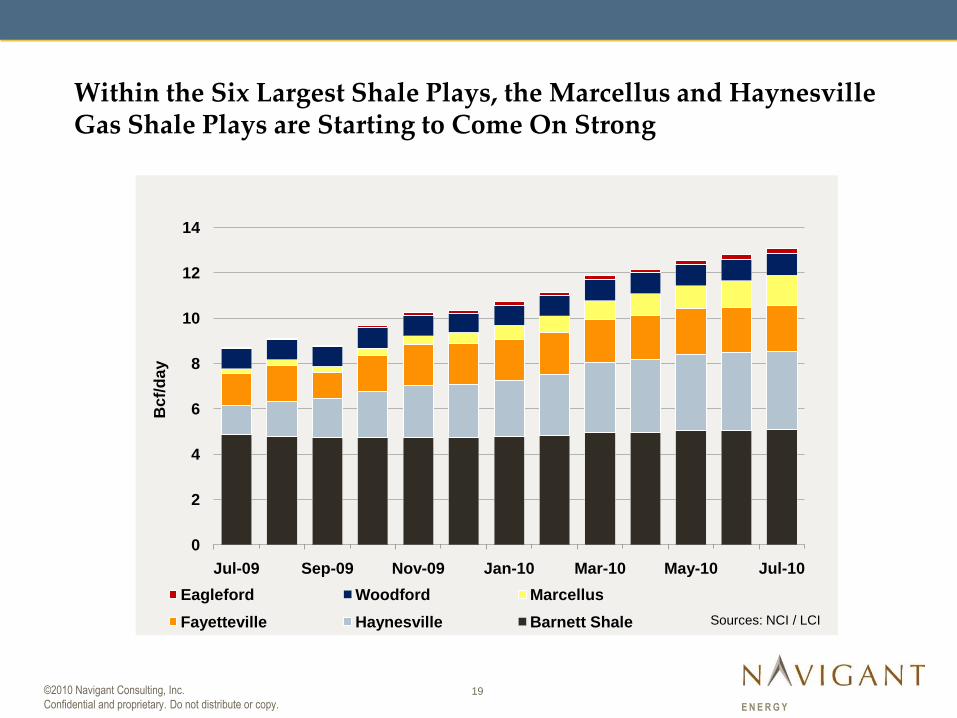
Within the Six Largest Shale Plays, the Marcellus and Haynesville Gas Shale Plays are Starting to Come On Strong
0
2
4
6
8
10
12
14
Jul-09 Sep-09 Nov-09 Jan-10 Mar-10 May-10 Jul-10
Bcf/
da
y
Eagleford Woodford Marcellus
Fayetteville Haynesville Barnett Shale Sources: NCI / LCI
US Shale Production
20©2010 Navigant Consulting, Inc.
Confidential and proprietary. Do not distribute or copy. E N E R G Y
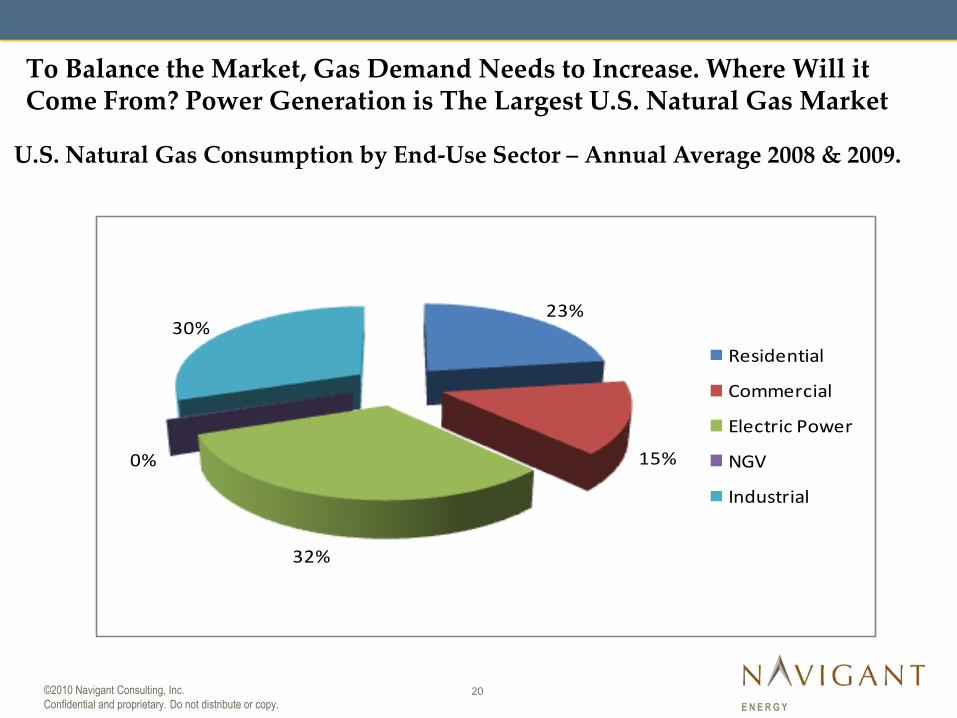
23%
15%
32%
0%
30%
Residential
Commercial
Electric Power
NGV
Industrial
To Balance the Market, Gas Demand Needs to Increase. Where Will it Come From? Power Generation is The Largest U.S. Natural Gas Market
U.S. Natural Gas Consumption by End-Use Sector – Annual Average 2008 & 2009.
21©2010 Navigant Consulting, Inc.
Confidential and proprietary. Do not distribute or copy. E N E R G Y
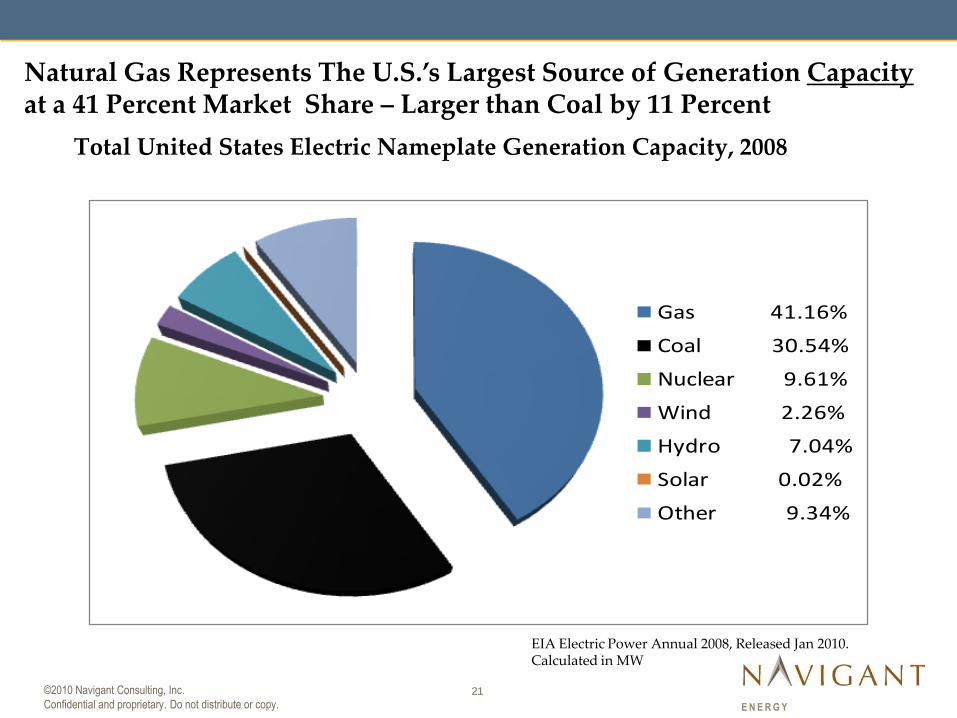
Total United States Electric Nameplate Generation Capacity, 2008
Natural Gas Represents The U.S.’s Largest Source of Generation Capacityat a 41 Percent Market Share – Larger than Coal by 11 Percent
EIA Electric Power Annual 2008, Released Jan 2010.Calculated in MW
Gas 41.16%
Coal 30.54%
Nuclear 9.61%
Wind 2.26%
Hydro 7.04%
Solar 0.02%
Other 9.34%
22©2010 Navigant Consulting, Inc.
Confidential and proprietary. Do not distribute or copy. E N E R G Y
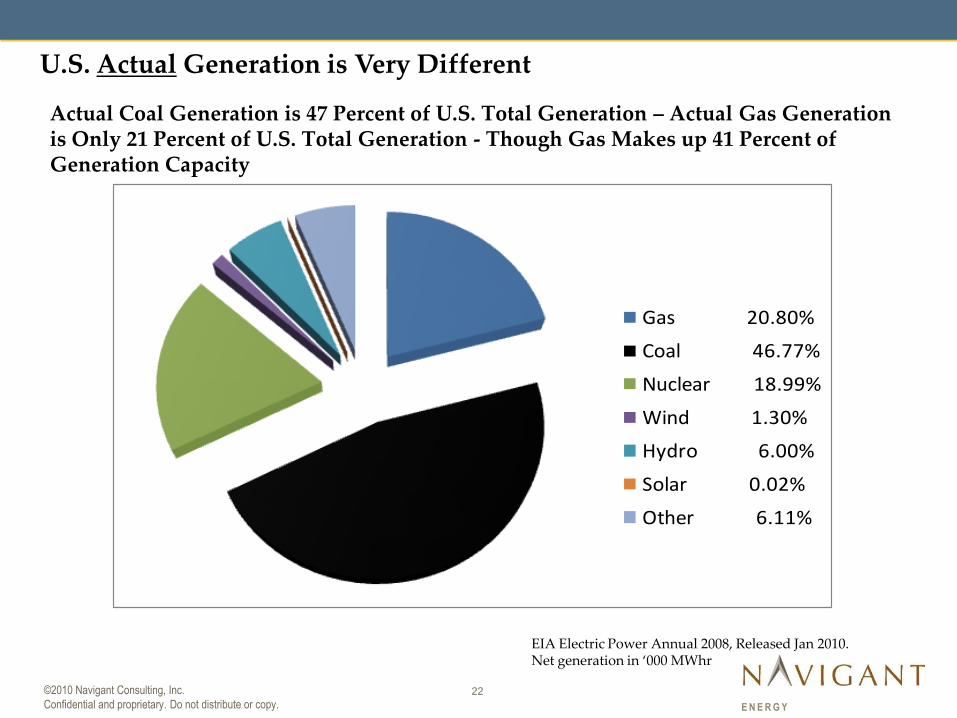
Actual Coal Generation is 47 Percent of U.S. Total Generation – Actual Gas Generation is Only 21 Percent of U.S. Total Generation - Though Gas Makes up 41 Percent of Generation Capacity
Gas 20.80%
Coal 46.77%
Nuclear 18.99%
Wind 1.30%
Hydro 6.00%
Solar 0.02%
Other 6.11%
U.S. Actual Generation is Very Different
EIA Electric Power Annual 2008, Released Jan 2010.Net generation in ‘000 MWhr
23©2010 Navigant Consulting, Inc.
Confidential and proprietary. Do not distribute or copy. E N E R G Y
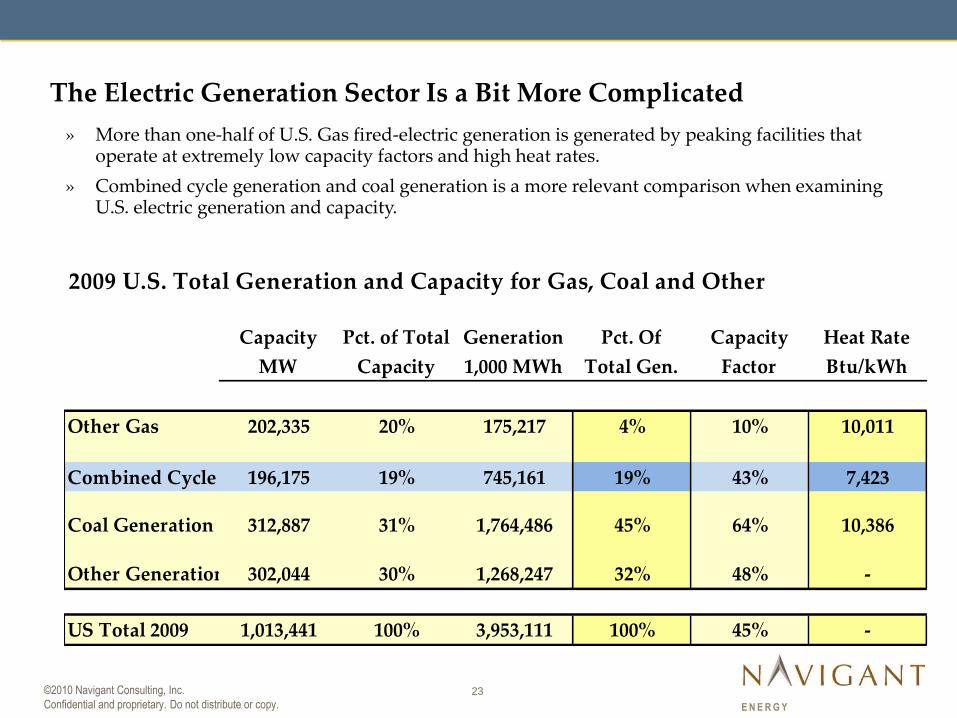
The Electric Generation Sector Is a Bit More Complicated
» More than one-half of U.S. Gas fired-electric generation is generated by peaking facilities that operate at extremely low capacity factors and high heat rates.
» Combined cycle generation and coal generation is a more relevant comparison when examining U.S. electric generation and capacity.
2009 U.S. Total Generation and Capacity for Gas, Coal and Other
Capacity Pct. of Total Generation Pct. Of Capacity Heat Rate
MW Capacity 1,000 MWh Total Gen. Factor Btu/kWh
Other Gas 202,335 20% 175,217 4% 10% 10,011
Combined Cycle 196,175 19% 745,161 19% 43% 7,423
Coal Generation 312,887 31% 1,764,486 45% 64% 10,386
Other Generation 302,044 30% 1,268,247 32% 48% -
US Total 2009 1,013,441 100% 3,953,111 100% 45% -
U.S. Generation Deserves Closer Scrutiny
24©2010 Navigant Consulting, Inc.
Confidential and proprietary. Do not distribute or copy. E N E R G Y
»Gas market demand— is like a manufacturing business, if the market doesn’t want it, it won’t be produced.
»Price — what will it take? Probably around $5 to $6 with wide variability across basins and operators, although the economics are a moving target – with price levels still trending down on efficiencies.
»Meanwhile, shale development requires hydraulic fracturing of the extremely tight formations.
– Concerns about high-pressure fracturing are causing legal/legislative/public uncertainty at both Federal and State levels.
– The industry must quiet these concerns through a combination of effective communication and embracing of ‘best practices’.
– The more forward-thinking producers are already doing both – such as Range Resources announcing a ‘voluntary disclosure initiative of Marcellus Shale hydraulic fracturing additives’ on a per well basis on July 14, 2010.
»Air-quality issues also have been raised as well around the Barnett development in Texas.
»Then on top of all that there’s tax policy – State and Federal. All jurisdictions want a share!
»In short, full, rapid development of gas supply has to clear some hurdles.
Opportunities in the Midst of Challenges
25©2010 Navigant Consulting, Inc.
Confidential and proprietary. Do not distribute or copy. E N E R G Y
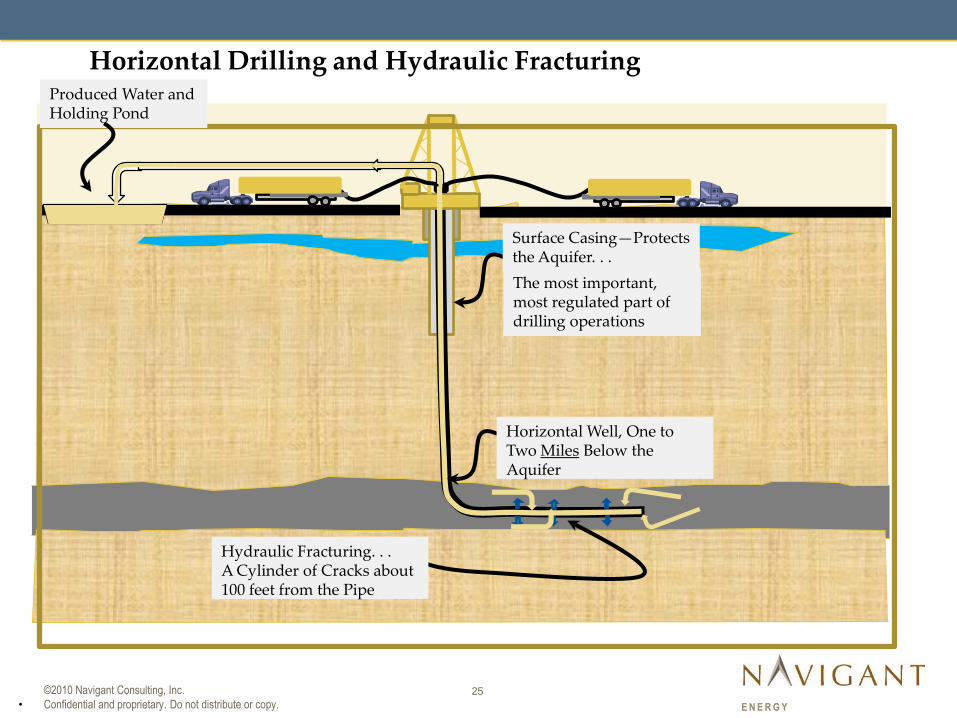
Surface Casing—Protects the Aquifer. . .
The most important, most regulated part of drilling operations
Horizontal Well, One to Two Miles Below the Aquifer
Hydraulic Fracturing. . .A Cylinder of Cracks about 100 feet from the Pipe
.
Produced Water and Holding Pond
Horizontal Drilling and Hydraulic Fracturing
26©2010 Navigant Consulting, Inc.
Confidential and proprietary. Do not distribute or copy. E N E R G Y
What New Technology Allows This to Work
» Advanced drilling and completion technologies consist primarily of horizontal drilling and multiple-stage hydraulic fracturing stimulation.
» Horizontal drilling also provides a reduced surface footprint by drilling multiple wells (6-10 sometimes) from a single surface location.
» 90 percent of oil and gas wells now require use of hydraulic fracturing allowing more energy from fewer wells.
» Bridge plugs confine hydraulic fracturing to specific horizontal depths or stages to allow better control of fracturing pressures and patterns.
» Fracturing fluids are at least 98 percent sand and water and other additives - many found in common consumer products.
» Calls for transparency of fracturing fluid content is currently resisted by some industry participants for competitive reasons.
» The compounds are injected into deep shale gas formations and are typically confined by many thousands of feet of rock layers – sometimes two miles or more.
» Industry adoption of ‘best practices’ is becoming more widely accepted in order to prevent against sloppy drilling practices and in seeing the ‘writing on the wall’ otherwise.
27©2010 Navigant Consulting, Inc.
Confidential and proprietary. Do not distribute or copy. E N E R G Y
» The development does not take government hand-outs.
» Unlike oil, it does not take expanded land or offshore access.
» And it will provide for less foreign energy dependence - at prices that serve as a economic advantage for the U.S. economy in the world market.
» An important facet of continued development of natural gas is support for natural gas Demand at a stable price and an endorsement through a positive political and policy statement of the role of natural gas can play ‘at least as a bridge‛ in setting the energy standard for electric generation as a means to clean and sustainable energy independence.
» This in recognition of the importance of natural gas in a carbon-constrained world to substantially lower GHG emissions – often at lower costs.
» Without ‘next generation’ gas power plants that have the potential to operate more efficiently with zero emissions and at even lower costs.
In Sum, The Potential for Natural Gas Supply is SubstantialSo, The Potential for Natural Gas Supply is Substantial
28©2010 Navigant Consulting, Inc.
Confidential and proprietary. Do not distribute or copy. E N E R G Y
Increased Gas-Fired Electric Generation Can Make a Significant DifferenceAs Shown Facts Say:
» Gas Combined-Cycle generation operating at a 43 percent capacity factor generated 19 percent of U.S. actual electric generation in 2009 (EIA).
» Coal operating at an 64 percent capacity factor generated 45 percent of actual U.S. electric generation in 2009 (EIA).
Which suggest:
» To generate the same amount of power with equal capacity factors, both Gas Combined Cycle and coal would operate at a 56.3 percent capacity factor - shifting 509,662 GWh from coal to gas.
» This shift of generation would require incremental gas demand of 10.3 Bcf per day, 17 percent of existing gas demand of 60.2 Bcfd – a meaningful yet seemingly achievable volume.
-----------------------------------------------------------------
Remember – Gas Combined Cycles emit only 39 percent as much CO2 as coal plants.
» The annual savings in CO2 emissions would be approximately 316 million metric tonnes, or a 15 percent reduction from the 2009 level of CO2 emissions from combined coal and gas fossil fuel electric generation - a significant positive contributor to climate change
All by simply raising Gas Combined-Cycle capacity factors by only 13 percent (43% to 56%)
GOOD NEWS - This shift in generation capacity coal to gas – is already happening!!
29©2010 Navigant Consulting, Inc.
Confidential and proprietary. Do not distribute or copy. E N E R G Y
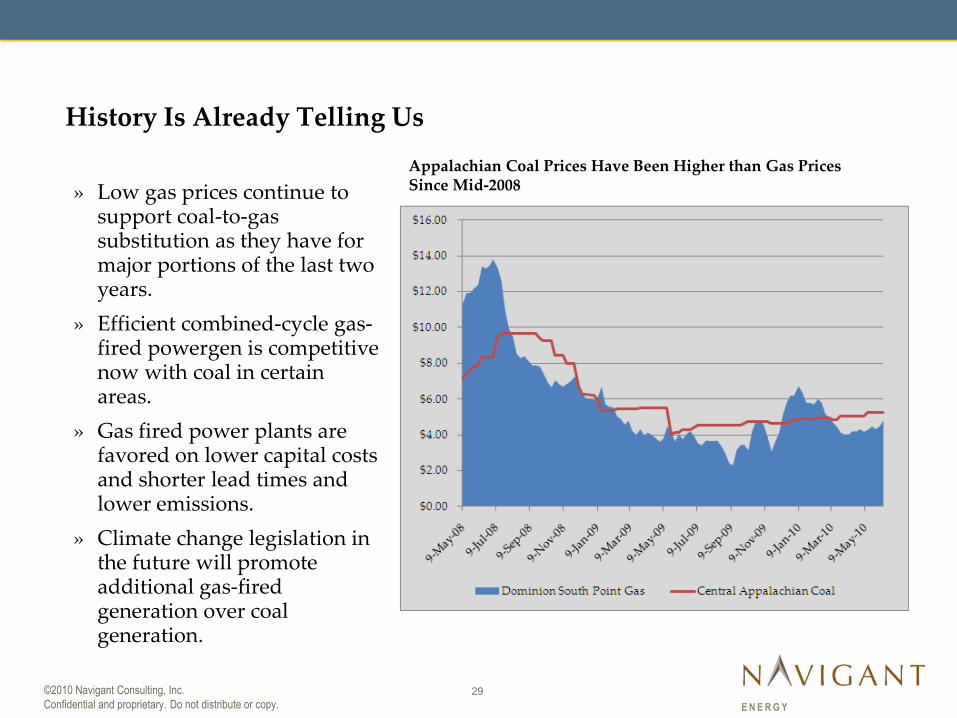
» Low gas prices continue to support coal-to-gas substitution as they have for major portions of the last two years.
» Efficient combined-cycle gas-fired powergen is competitive now with coal in certain areas.
» Gas fired power plants are favored on lower capital costs and shorter lead times and lower emissions.
» Climate change legislation in the future will promote additional gas-fired generation over coal generation.
It Appears Prices have Supported Switching for Some time – 2 Years
History Is Already Telling Us
Appalachian Coal Prices Have Been Higher than Gas PricesSince Mid-2008
30©2010 Navigant Consulting, Inc.
Confidential and proprietary. Do not distribute or copy. E N E R G Y
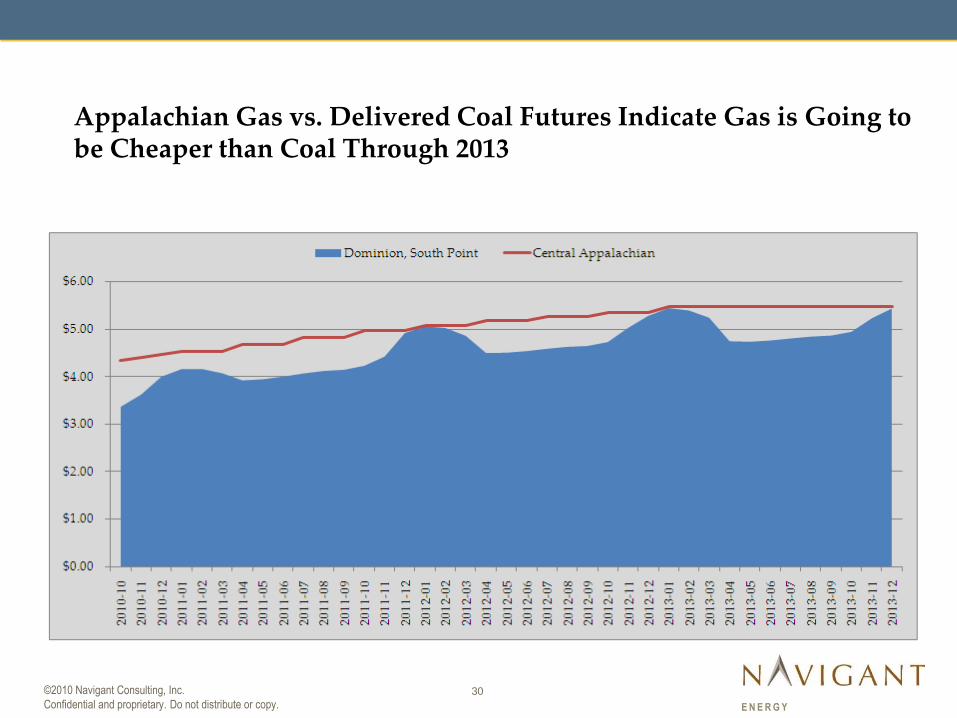
Appalachian Gas vs. Delivered Coal Futures Indicate Gas is Going to be Cheaper than Coal Through 2013
Expectations are that Gas Prices will be Below Coal in the Future
31©2010 Navigant Consulting, Inc.
Confidential and proprietary. Do not distribute or copy. E N E R G Y
Summary
» The key impacts of the ‘game changing’ that has occurred in the gas industry over the last few years are hard to ignore:
— A transformation of the country from gas shortage to abundance;
— Provision for less foreign energy dependence;
— Provision for a foundation for a low-carbon and cleaner energy environment of the future; and
— Stage setting for competitive gas prices as a competitive advantage for the US economy in the global market.
» The key now is to overcome challenges – some as to the perception of what gas shale development is and as to its risks.
» As gas shale has become headline making, the need for education and communication becomes critical.
» Regulatory policy will also be important to assure ‘best-practices’ are pursued by the producing industry while at the same time fostering the orderly development of this key energy resource that has crossed over to the center of debate of energy, security and climate issues – in other words for the good of the country!

KeyC O N T A C T S
©2010 Navigant Consulting, Inc.
Confidential and proprietary. Do not distribute or copy.
KeyC O N T A C T S
©2010 Navigant Consulting, Inc.
Confidential and proprietary. Do not distribute or copy.
KeyC O N T A C T S
©2010 Navigant Consulting, Inc.
Confidential and proprietary. Do not distribute or copy.
KeyC O N T A C T S
©2010 Navigant Consulting, Inc.
Confidential and proprietary. Do not distribute or copy.32
E N E R G Y
Gordon PickeringDirector, EnergyRancho Cordova, CA 95670 [email protected]