Embed Size (px)
Citation preview

U.S. National Bycatch Report First Edition Update 3
Lee R. Benaka, Daryl Bullock, Aimee L. Hoover, and Noelle A. Olsen (editors)
U.S. Department of Commerce National Oceanic and Atmospheric Administration National Marine Fisheries Service
NOAA Technical Memorandum NMFS-F/SPO-190 February 2019


U.S. National Bycatch Report First Edition Update 3
Lee R. Benaka, Daryl Bullock, Aimee L. Hoover, Noelle A. Olsen (editors)
NOAA Technical Memorandum NMFS-F/SPO-190
U.S. Department of Commerce Wilbur L. Ross, Jr., Secretary
National Oceanic and Atmospheric Administration RDML Tim Gallaudet, Ph.D., USN Ret., Acting NOAA Administrator
National Marine Fisheries Service Chris Oliver, Assistant Administrator for Fisheries
ii
Recommended citation:
Benaka, L.R., D. Bullock, A.L. Hoover, and N.A. Olsen (editors). U.S. National Bycatch Report First Edition Update 3. 2019. U.S. Dept. of Commerce, NOAA. NOAA Technical Memorandum NMFS-F/SPO-190, 95 p.
Copies of this report may be obtained from:
http://spo.nmfs.noaa.gov/tech-memos

iii
Table of Contents
List of Acronyms and Terms ......................................................................................................... iv
Executive Summary ........................................................................................................................ v
1. Introduction ................................................................................................................................. 1
2. National Overview ...................................................................................................................... 5
3. Greater Atlantic Overview .......................................................................................................... 8
4. Southeast Overview .................................................................................................................. 18
5. Alaska Overview ....................................................................................................................... 32
6. West Coast Overview ............................................................................................................... 46
7. Pacific Islands Overview .......................................................................................................... 59
8. References ................................................................................................................................. 69
Appendix 1. List of National Bycatch Report Fisheries ............................................................... 75
Appendix 2. Contributors to This Report .................................................................................... 94

iv
List of Acronyms and Terms
ABC Acceptable Biological Catch ACCSP Atlantic Coastal Cooperative Statistics Program ADF&G Alaska Department of Fish and Game ADP Annual Deployment Plan AFSC Alaska Fisheries Science Center AMMOP Alaska Marine Mammal Observer Program BSAI Bering Sea Aleutian Islands CV Coefficient of variation EEZ Exclusive economic zone ESA Endangered Species Act FMP Fishery management plan FSSI Fish Stock Sustainability Index GOA Gulf of Alaska HMS Highly migratory species IFQ Individual fishing quota MMPA Marine Mammal Protection Act MSA Magnuson-Stevens Fishery Conservation and Management Act NBR National Bycatch Report NMFS National Marine Fisheries Service NOAA National Oceanic and Atmospheric Administration PBR Potential biological removal PSC Prohibited Species Catch SBRM Standardized Bycatch Reporting Methodology SEFSC Southeast Fisheries Science Center TAC Total Allowable Catch Update 1 U.S. National Bycatch Report First Edition Update 1 Update 2 U.S. National Bycatch Report First Edition Update 2

v
Executive Summary
The National Bycatch Reports (NBR) published by NOAA’s National Marine Fisheries Service (NMFS) examine bycatch occurring across major fisheries managed under the Magnuson-Stevens Fishery Conservation and Management Act (MSA). For the purposes of the NBR, bycatch is defined as discarded catch of any living marine resource plus unobserved mortality due to a direct encounter with fishing gear. This definition is more expansive than the MSA definition of bycatch because the purpose of the NBR is to provide estimates not only of fish bycatch but also fishery interactions with marine mammals and seabirds.
Impacts from bycatch and bycatch mortality vary across fisheries and may have adverse biological, economic, and social consequences. Bycatch of fish can contribute to overfishing and impede efforts to rebuild fish stocks, or have negative economic and social impacts to fishermen and communities that rely on the economic benefits from a fishery or fish for food. By altering the availability of predators and prey, bycatch can affect marine ecosystems and fishery productivity. Bycatch of marine mammals and species listed under the Endangered Species Act can contribute to population declines and impede population recovery. Bycatch of habitat-forming benthic species like corals and sponges can damage important habitats for fish and other species. Working with its partners and stakeholders, NMFS has made advancements to improve the selectivity of fishing gear and modify fishing practices to reduce bycatch.
Since 2011, NMFS has published an NBR and three online updates. These reports provide information on overall bycatch and, in addition to stock assessments or other data on individual stocks and fisheries, may inform fishery monitoring, science, and management priorities.
Using observer data and self-reported logbook data, the First Edition of the National Bycatch Report (NMFS 2011) provided bycatch estimates for all fisheries for which this information was available in 2005. Update 1 included bycatch estimates based on 2010 data (NMFS 2013a). Update 2 had three sets of bycatch estimates based on data from 2011, 2012, and 2013 (NMFS 2016a). In instances where methodological or other errors have been identified in the NBR, NMFS has provided clarification and corrections in subsequent updates (e.g., see Section 4.3).
Update 3 includes two sets of bycatch estimates, based on data from 2014 and 2015. NMFS is publishing this third update instead of publishing an NBR Second Edition and is conducting a review of the NBR in light of the NMFS National Bycatch Reduction Strategy and other agency policies.
NMFS notes that NBR bycatch estimates generally are indicative of bycatch amounts in particular fisheries, or relative levels of bycatch across fisheries. Because data summary and analysis methods that are used in the NBR to produce comparable bycatch estimates across fisheries and regions do not reflect individual aspects of specific fisheries, the estimates may not represent the best available bycatch data for management purposes. Therefore, NBR data should not be used for day-to-day management of fisheries, but rather considered as a source of information on bycatch at a national level.
vi
Bycatch Summaries for NBR Update 3
In 2014, the commercial fisheries included in Update 3 (see Appendix 1) landed approximately 6,780.27 M lb and discarded an estimated 837.87 M lb. The fisheries included in this report for 2015 landed approximately 6,538.20 M lb and discarded an estimated 814.53 M lb.
In 2014, bycatch estimates for marine mammals were based on numbers of dead and seriously injured animals in 22 individual fisheries, as well as 23 fisheries from the Greater Atlantic and Alaska regions that were grouped for bycatch estimation purposes.
Marine mammal bycatch estimates for 2015 covered 26 individual fisheries, and 23 grouped fisheries from the Greater Atlantic and Alaska regions.
Sea turtle bycatch estimates are provided for 10 fisheries for 2014 and 12 fisheries for 2015, including the Gulf of Mexico Shrimp Trawl and Southern Atlantic Shrimp Trawl Fisheries. The NBR tables do not include new sea turtle bycatch estimates for Greater Atlantic Region fisheries for 2014 and 2015. However, NMFS published a Technical Memorandum that contained estimates of bycatch of sea turtles in sink gillnet gear (Murray 2018). These estimates are totals for 2012-2016 and are not annual estimates. The estimates also are spatially divided such that they do not align with fisheries listed in the NBR and therefore are presented in the text in Section 3.6 rather than in an NBR table.
For 2014, seabird bycatch estimates for 22 fisheries are reported, as well as two fishery groups from the Greater Atlantic Region. In addition, 2015 seabird bycatch estimates for 19 fisheries, as well as six fishery groups from the Greater Atlantic Region, are reported.
Improvements in Bycatch Estimation and Reduction
This report documents many improvements in bycatch monitoring and reductions in bycatch. For example, the Greater Atlantic section (page 15) includes 2014 and 2015 fish bycatch estimates for 34 and 35 commercial fisheries, respectively, compared with 24 fisheries for 2013 in the previous NBR Update. In addition, for 2014 and 2015, the list of fish species considered for estimation by the Greater Atlantic Region was expanded to well over 140 species for 2014 and 151 species for 2015, compared to 34 species for 2013.
The Southeast Region section includes first-time fish bycatch estimates in the NBR for the Southeastern Atlantic Shrimp Trawl Fishery. This section of the NBR also includes for the first time bycatch numbers for the Southeastern Atlantic and Gulf of Mexico Shark Bottom Longline Research Fishery, which has 100% observer coverage. In addition, the Southeast Region developed additional fishery and species bycatch ratios due to the publication of a NOAA Technical Memorandum that provided individual-to-weight conversion factors for particular species captured in longline fisheries from the Western North Atlantic (Gulak et al. 2017).
The Alaska Region section includes bycatch estimates for 10 crab fisheries in the Bering Sea and Aleutian Islands. These fisheries are under joint federal and state management.

vii
In the West Coast Region, the California Drift Gillnet Fishery for swordfish and thresher shark, which reports bycatch in terms of numbers, experienced bycatch decreases from 1,647 individuals in 2014 to 649 individuals in 2015. This reduction was due partly to lower fishing effort in 2015.

viii

1
1. Introduction
1.1 Definition of Bycatch
For purposes of the National Bycatch Report (NBR), NMFS defines bycatch as discarded catch of any living marine resource plus unobserved mortality1 due to a direct encounter with fishing gear. This definition is more expansive than the Magnuson-Stevens Fishery Conservation and Management Act (MSA) definition of bycatch because the purpose of the NBR is to provide estimates of fishery interactions with marine mammals and seabirds as well as fish bycatch.
NMFS manages bycatch and its impacts through several authorities, including the MSA, the Marine Mammal Protection Act (MMPA), the Endangered Species Act (ESA), and Executive Orders and international agreements. Although each of these authorities addresses bycatch differently, the NBR uses a broad definition of bycatch, with a recognition that the development and implementation of specific measures to address bycatch will occur in accordance with the appropriate statutory definitions and authorities.
Because information on unobserved mortality of fish is rarely available, it is not included here. Unobserved mortality is included in bycatch estimates for protected species if those data are available.
In some fisheries, especially in the Pacific Islands, incidental fish catch that might otherwise be discarded, and treated as bycatch, is retained. This retained incidental may be utilized for consumption, bait, or processing (e.g., to create fish meal), which can reduce bycatch rates. This incidental catch is not considered to be bycatch in the NBR.
Standardized bycatch reporting methodologies (SBRM) are required for fisheries managed under the MSA. In 2017, NMFS published a Final Rule (82 FR 6317) to interpret and provide guidance on the MSA requirement that all fishery management plans establish a standardized bycatch reporting methodology to assess the amount and type of bycatch occurring in a fishery. The Final Rule required establishment or review of SBRMs through a fishery-specific analysis that addresses the characteristics of bycatch occurring in the fishery, the feasibility of the methodology, the uncertainty of the data resulting from the methodology, and how the data resulting from the methodology are used to assess the amount and type of bycatch occurring in the fishery. Different bycatch reporting methodologies, and different degrees of uncertainty, may be appropriate based on the fishery-specific SBRM analysis.
1 Unobserved mortality is the mortality of living marine resources due to a direct encounter with fishing gear that does not result in the capture of the species. This includes mortality due to lost or discarded fishing gear, as well as fish and other species that escape from fishing gear before it is retrieved but die due to the stress or injury resulting from the encounter (NMFS 2004).

2
1.2 Purpose of This Report
The NBR and its updates provide a compilation of estimated bycatch information and national and regional overviews to document bycatch in fisheries over time. In addition to describing the “state of bycatch reporting and estimation,” these reports were designed as a resource to, along with other information sources (e.g., NMFS Marine Mammal Stock Assessment Reports), help address and prioritize sampling and estimation improvements in NMFS observer programs. Future reports will include additional bycatch estimates as new fisheries are monitored.
The NBR is the only national-level report published by NOAA Fisheries that summarizes fish, marine mammal, sea turtle, and seabird bycatch in major U.S. fisheries. The reports are designed to provide information on overall bycatch trends and, in addition to stock assessments or other data on individual stocks and fisheries, may inform fishery monitoring, science, and management priorities. In preparing the NBR and its updates, NMFS compiles information from numerous sources, including, but not limited to, observer data, logbooks, vessel trip reports, dealer reports, landing receipts, surveys, and stock assessments. In instances where methodological or other errors have been identified in the NBR, NMFS has provided clarification and corrections in subsequent updates (e.g., see Section 4.3).
However, NMFS does not routinely use NBR estimates to formulate actions to reduce bycatch in particular fisheries or for other fishery management purposes. NMFS is not required to produce the NBR under the MSA or other law. NMFS nonetheless produces this report to provide national-level information on bycatch that, in addition to stock assessments or other data on individual stocks and fisheries, may inform fishery monitoring, science, and management priorities.
In some cases, results presented here should be considered preliminary and subject to change. This is particularly true for Southeast Region reef fish and snapper-grouper fisheries that have estimates based on logbook data as opposed to more limited observer data. In other instances, NBR estimates may differ from stock assessment bycatch estimates because of differences in stratification, data used, mortality assumptions, and estimation methods and therefore may not be appropriate for use in management.
In the above instances, bycatch estimates presented in this report generally should be viewed as indicative of bycatch amounts in particular fisheries, or relative levels of bycatch across fisheries, as opposed to the best scientific information available for fishery conservation and management measures. NMFS does not use NBR data for day-to-day management of fisheries because the data summary and analysis methods that are used in the NBR to produce comparable bycatch estimates across fisheries and regions do not always reflect individual aspects of specific fisheries.
1.3 About the Estimates in This Report
The NBR presents extensive estimates of fish and protected species bycatch. Fish bycatch estimates are expressed mostly in pounds, but fish bycatch estimates in some fisheries are expressed in numbers due to various factors including challenges related to weighing large fish such as sharks and requirements to count numbers of protected fish species. In addition, bycatch

3
estimates for protected species such as marine mammals, sea turtles, and seabirds are expressed in terms of individual animals.
This report also presents numerous bycatch ratios. Bycatch ratios in the NBR are calculated as follows:2
Fishery bycatch ratio = Estimated fishery bycatch
Estimated fishery bycatch + fishery landings
Species bycatch ratio = Estimated species bycatch
Estimated species bycatch + landings of that species
According to the above equations, it is not possible to present bycatch ratios when bycatch estimates are calculated in numbers due to the difference in units required for the calculation (i.e., numbers versus pounds). NMFS continues to make progress in developing number-to-weight conversion factors (see Gulak et al. 2017) but has not developed conversions for all species that appear in the NBR.
Some bycatch estimates in this report’s various tables include a coefficient of variation (CV). A CV, which is given by the ratio of the square root of the variance of the bycatch estimate (i.e., the standard error) to the estimate itself, is a measure of precision commonly used in reference to estimates of bycatch. The lower the CV, the greater the level of precision. In addition, according to NMFS 2004, “The CV of an estimate can be decreased by increasing the number of bycatch observations which increases sampling costs…. [A]t some point a further increase in the number of observations cannot be justified in terms of the reduction in the CV and the associated benefits of the more precise estimate given the increase in sampling cost.”
Some Southeast Region fisheries in this report–specifically the Gulf of Mexico Coastal Migratory Troll, Gulf of Mexico Reef Fish Bottom Longline, Gulf of Mexico Reef Fish Vertical Line, Southeastern Atlantic Coastal Gillnet, Southeastern Atlantic Coastal Migratory Pelagic Troll, Southeastern Atlantic Snapper-Grouper Bottom Longline, and Southeastern Atlantic Snapper-Grouper Vertical Line Fisheries–include bycatch estimates with very high CVs because the estimates are based on self-reported fisherman logbook data (see Tables 4.4.1a and 4.4.2a). Section 4.1 describes the limitations of such data for bycatch estimation. Bycatch estimates for these fisheries should be considered preliminary and subject to change if more thorough analyses based on observer data are completed in the future. The bycatch species listed for the above fisheries in Tables 4.4.1a and 4.4.2a, although statistically imprecise, do reflect the diversity of species reported as discarded by fishermen in the Southeast Region.
For other fisheries in this report that have bycatch estimates based on observer coverage, CVs can be relatively low, but the CVs still will be higher or lower based on factors including the rarity of the bycatch species that is the subject of the estimate. Species that are encountered rarely by observers will have higher CVs associated with their bycatch estimates than species
2 In other NMFS documents, bycatch ratios may be described as number of fish per unit of effort (e.g., number of tow hours, hooks, or rods).
4
commonly encountered. This can be seen in several West Coast Region fisheries, including the West Coast Groundfish Non-Trawl Gear: Limited Entry Fishery (see Tables 6.4.1a and 6.4.1b), where many CVs are very low, but a handful of species that are rarely encountered–such as Pacific ocean perch - Pacific Coast (Sebastes alutus) and redstripe rockfish (Sebastes proriger)–have higher CVs.
5
2. National Overview
2.1 Data Sources for Estimating Bycatch
Data sources for the NBR vary among regions, as well as among fisheries, primarily due to differences in data-collection goals, objectives, and available resources. Likewise, commercial fisheries vary greatly in scale and fishing practice. Data sources for commercial landings in the various regions are as follows:
• Greater Atlantic Region, Maine through North Carolina (north of Cape Hatteras): Atlantic Coastal Cooperative Statistics Program (ACCSP) and NMFS Greater Atlantic Region Fisheries Office
• Southeast Region, North Carolina (south of Cape Hatteras) through Texas: ACCSP and NMFS Southeast Fisheries Science Center
• West Coast Region (Washington, Oregon, California): Pacific Fisheries Information Network
• Alaska: Alaska Fisheries Information Network and Alaska Department of Fish and Game
• Pacific Islands: Western Pacific Fisheries Information Network
The major sources of data used for the bycatch estimates presented in this update were observer data and self-reported logbook data, and in some cases landings data. The commercial landings data were derived from the most recent datasets available and have been checked by the NBR Steering Committee for accuracy. Species landings data were provided by NBR regional teams from regional landings databases.
Because landings data–like self-reported logbook data and observer data–are constantly updated as new information becomes available, readers should use caution when comparing landings data in this document to the first edition of the NBR or to other landings datasets for the same time period.
This update does not include certain landings data or bycatch estimates in order to maintain the confidentiality of that information as required under section 402(b) of the MSA, 16 U.S.C. § 1881a(b).
The NBR Regional Teams (see Appendix 2) uploaded bycatch estimates and footnotes into a database developed by the NMFS Office of Science and Technology. A version of this database, with the most recently published NBR bycatch estimates, is accessible by the public via a NMFS website. (Use “Guest Login” button for access.)

6
2.2 Bycatch and Landings Summary
Estimated fish bycatch for the U.S. commercial fisheries in the NBR for 2014 totaled approximately 837.87 M lb.3. Associated landings for these fisheries totaled approximately 6,780.27 M lb (Table 2.1).
Table 2.1 2014 total estimated fisheries bycatch and landings for each NMFS region for fisheries included in the NBR. Landings and bycatch in this table do not represent all regional fisheries but rather the fisheries for which this report provides bycatch estimates (see Appendix 1).
Region Fish Bycatch (lb) Fish Landings (lb) Greater Atlantic 223,451,897 1,440,615,471 Southeast 337,466,673 176,542,585 Alaska 245,608,078 4,504,058,022 West Coast 19,047,603 627,936,435 Pacific Islands 12,293,532 31,117,784 Totals 837,867,783 6,780,270,297
Estimated fish bycatch for the U.S. commercial fisheries in the NBR for 2015 totaled approximately 814.53 M lb. Associated landings for these fisheries totaled approximately 6.538.20 M lb (Table 2.2).
Tables 2.1 and 2.2 do not include individual fish bycatch estimates for Southeast and West Coast Regions. These regions estimate some bycatch in numbers of individuals due to the design of particular observer programs or because the bycatch consists of protected fish species. Please see Sections 4 (Southeast Region) and 6 (West Coast Region) for additional information.
Table 2.2 2015 total estimated fisheries bycatch and landings for each NMFS region for fisheries included in the NBR. Landings and bycatch in this table do not represent all regional fisheries but rather the fisheries for which this report provides bycatch estimates (see Appendix 1).
Region Fish Bycatch (lb) Fish Landings (lb) Greater Atlantic 219,452,252 1,375,202,155 Southeast 319,972,147 169,560,856 Alaska 245,673,877 4,567,757,475 West Coast 16,093,327 391,935,034 Pacific Islands 13,339,353 33,743,755 Totals 814,530,956 6,538,199,275
In 2014, bycatch estimates for marine mammals were based on numbers of deaths and serious injuries in 22 individual fisheries, as well as 23 fisheries from the Greater Atlantic and Alaska
3 Bycatch and landings weights are live weights as opposed to live and landed weights. Specifically, live weight refers to the weight of a fish when it is taken out of the water, whereas landed weight refers to the weight of a fish post-processing (for example, the weight of scallop meat after it has been removed from its shell).

7
regions that were grouped for bycatch estimation purposes. These marine mammal bycatch estimates in 2015 covered 26 individual fisheries, and 23 grouped fisheries from the Greater Atlantic and Alaska regions.
With some exceptions, marine mammal bycatch estimates reported here are primarily annual averages over five years, as recommended by NMFS’ guidelines for assessing marine mammal stocks (NMFS 2005). Interactions between individual fisheries and marine mammals are typically rare events, and several years of data are needed to provide statistically robust estimates. Multi-year averages also have been used for some other protected species for these reasons.
Sea turtle bycatch estimates are provided for eight fisheries for 2014 and 10 fisheries for 2015. The NBR tables do not include new sea turtle bycatch estimates for Greater Atlantic Region fisheries for 2014 and 2015. Nor do they include sea turtle bycatch estimates for the Gulf of Mexico Shrimp Trawl and Southern Atlantic Shrimp Trawl Fishery. However, two recent NMFS Technical Memoranda describe estimated sea turtle bycatch in Greater Atlantic Region sink gillnet gear (Murray 2018) and Southeast Region shrimp fisheries (Babcock et al. 2018).
For 2014, seabird bycatch estimates for 22 fisheries are reported, as well as two fishery groups from the Greater Atlantic Region. In addition, 2015 seabird bycatch estimates for 19 fisheries, as well as six fishery groups from the Greater Atlantic Region, are reported.
Appendix 1 provides a comprehensive list of fisheries identified by NBR regional team members. Shaded areas indicate the subset of fisheries that have fish/invertebrate, marine mammal, sea turtle, and/or seabird bycatch estimates. NMFS is not able to provide bycatch estimates for each of these fisheries for many reasons including lack of regulatory authority, resource limitations, and assumed low levels of bycatch (e.g., in the California Swordfish Harpoon Fishery, or the Caribbean trap/pot fisheries). As NMFS priorities and resources change over time, some of these lower-priority fisheries may be covered by pilot observer or electronic monitoring programs, with estimates included in future NBRs.

8
3. Greater Atlantic Overview
3.1 Summary of Fisheries
Fish bycatch estimates for 34 and 35 Greater Atlantic Region commercial fisheries are provided for 2014 and 2015, respectively (see Appendix 1; Tholke et al. 2017), compared with 24 fisheries for 2013 in Update 2 (NMFS 2016a).
Four fisheries were added to reflect Vessel Trip Report (VTR) activity in 2014: Mid-Atlantic Twin Trawl, New England Small-Mesh Ruhle Otter Trawl, New England Small-Mesh Haddock Separator Otter Trawl, and New England Closed Area Mid-Water Otter Trawl. (For more information, see Tholke et al. 2017).
Bycatch estimates for eight fisheries were added in 2014 due to increased observer coverage: 1. Mid-Atlantic Bottom Longline 2. Mid-Atlantic Handline 3. Mid-Atlantic General Category Closed Area Scallop Dredge 4. Mid-Atlantic Fish Pots and Traps 5. New England Fish Pots and Traps 6. Mid-Atlantic Conch Pots and Traps 7. New England Conch Pots and Traps 8. Mid-Atlantic Lobster Pots and Traps
Two fisheries that had bycatch estimates in 2013 were dropped in 2014 due to insufficient observer coverage: New England Shrimp Trawl (no observer coverage in 2014) and New England General Category Closed Area Scallop Dredge (only two trips covered by observers in quarter three of the fishing year, which was resulted in insufficient observer coverage to obtain a precise bycatch estimate for the entire year). For more information on Greater Atlantic Region bycatch estimation methods, see Tholke et al. 2017. Three fisheries that had bycatch estimated in 2014 did not have bycatch estimated in 2015: Mid-Atlantic Handline, New England Small-Mesh Ruhle Otter Trawl, and New England Small-Mesh Haddock Separator Otter Trawl. (The latter fishery became inactive in 2015.) Four fisheries that did not have bycatch estimated in 2014 had sufficient observer coverage to estimate bycatch in 2015: Mid-Atlantic General Category Closed Area Scallop Trawl, New England Large-Mesh Ruhle Otter Trawl, Mid-Atlantic Ocean Quahog/Surfclam Dredge, and New England Ocean Quahog/Surfclam Dredge.
The NBR provides marine mammal bycatch estimates based on multi-year annual averages for Greater Atlantic Region commercial fisheries (Hayes et al. 2017). Seabird estimates are provided for gillnet, otter trawl and scallop dredge fisheries, compared with only gillnet fisheries in previous NBRs, although a new estimation technique grouped Mid-Atlantic and New England estimates together (Hatch 2017) as opposed to splitting them like in previous NBRs.

9
3.2 Changes to Observer Coverage
Unique trips observed for fish bycatch increased from 3,702 in 2013 to 4,729 in 2014 (Blaylock et al. 2015; Tholke et al. 2017). At the same time, the number of Greater Atlantic commercial fishing trips decreased by approximately 1% from 2013 to 2014 (Blaylock et al. 2015; Tholke et al. 2017). The increase in overall observer coverage compared with 2013 was driven by increased observer coverage in two fisheries: New England Large-Mesh Gillnet and New England Extra-Large-Mesh Gillnet.
The number of trips observed for fish bycatch was 4,154 in 2015 (Blaylock et al. 2015; Tholke et al. 2017). At the same time, the number of Greater Atlantic commercial fishing trips decreased by approximately 6% between 2013 and 2015, resulting in an overall increase in coverage from 2013 to 2015 (Blaylock et al. 2015; Tholke et al. 2017). This increase was driven by increases in observer coverage in four fisheries: New England Lobster Pots and Traps, Mid-Atlantic Small-Mesh Gillnet, Mid-Atlantic Large-Mesh Gillnet, and New England Extra-Large-Mesh Gillnet.
Two fisheries had significant decreases in number of trips observed in 2015 compared with 2013: New England Large-Mesh Otter Trawl and New England Large-Mesh Gillnet. These two fisheries also saw decreases in the number of total commercial fishing trips between 2013 and 2015.
3.3 Changes to Catch and Bycatch Estimation Models
The methods used to estimate fish bycatch were the same as those used previously. These methods are described in Wigley et al. 2008, NMFS 2011, Blaylock et al. 2013, Blaylock et al. 2015, and Tholke et al. 2017.
3.4 Fish Bycatch
This section presents fish bycatch estimates in Greater Atlantic Region fisheries based on data from 2014 and 2015. The list of species for which bycatch was estimated was expanded to include all fish and invertebrate species with observed bycatch, as opposed to only species with fishery management plans (FMPs) developed by the New England Fishery Management Council and Mid-Atlantic Fishery Management Council. This section also includes fishery bycatch ratios as well as species bycatch ratios for each year. Estimates based on landings from less than three vessel permit holders were excluded in order to maintain the confidentiality of permit-holder information as required under section 402(b) of the MSA, 16 U.S.C. § 1881a(b).
The analysis presented was formulated based on a broad stratification and a combined ratio method (see Tholke et al. 2017 for more information) to estimate the 2014 and 2015 bycatch of 140 and 151 species and species groups in 34 and 35 commercial fisheries, respectively. These estimates may differ from stock assessment bycatch estimates because of differences in stratification, data used, mortality assumptions, and estimation methods. For some species and species groups the design-based ratio estimator may not be the most appropriate estimator to use (e.g., a model-based delta-generalized lineal model approach may perform better for some rarely

10
encountered species). Therefore, bycatch estimates presented here are not definitive estimates, but are indicative of where bycatch is occurring in this region.
3.4.1 Fish Bycatch Estimates for 2014
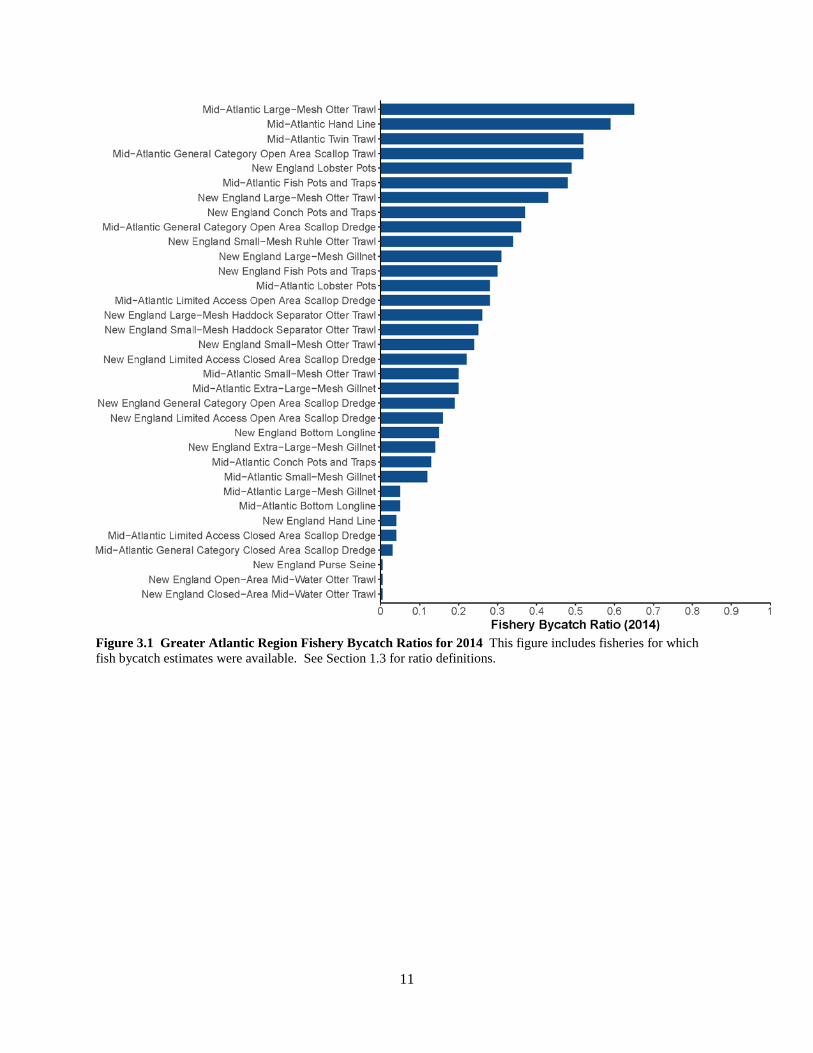
Fishery bycatch estimates based on 2014 data ranged from 42,514 lb in the New England Purse Seine Fishery to 51.2 M lb in the Mid-Atlantic Limited Access Open Area Scallop Dredge Fishery (Table 3.4.1a). Figure 3.1 shows fishery bycatch ratios for 34 Greater Atlantic Region fisheries based on 2014 data. Fish and invertebrate estimates based on 2014 data for 140 Greater Atlantic Region species and species groups are listed in Table 3.4.1b.
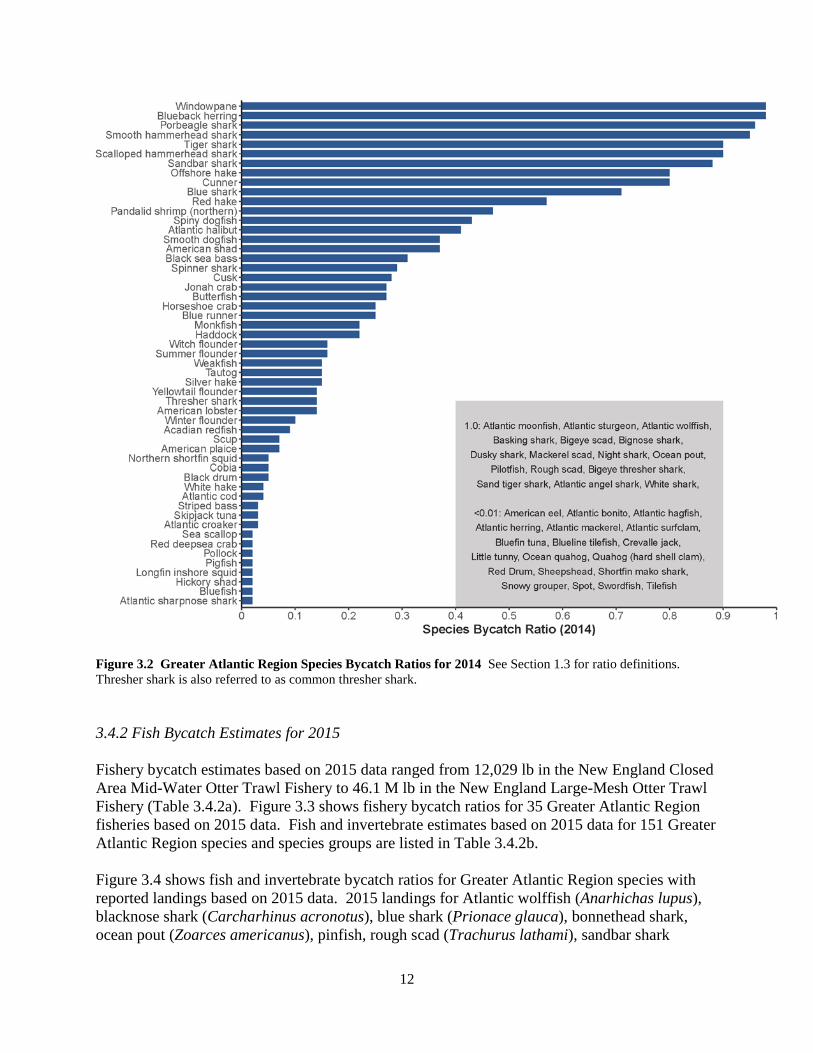
Figure 3.2 shows fish and invertebrate bycatch ratios for Greater Atlantic Region species with reported landings based on 2014 data. 2014 landings for alewife (Alosa pseudoharengus), bonnethead shark (Sphyrna tiburo), chain dogfish (Scyliorhinus retifer), pinfish (Lagodon rhomboides), and silky shark (Carcharhinus falciformis) are not included to maintain the confidentiality of that information as required under section 402(b) of the MSA, 16 U.S.C. § 1881a(b). Species with a bycatch ratio of 1.0 or <0.01 are listed in the inset box. In many cases, species with a bycatch ratio of 1.0 are ESA-listed species or species for which retention is prohibited by regulation.
11
Figure 3.1 Greater Atlantic Region Fishery Bycatch Ratios for 2014 This figure includes fisheries for which fish bycatch estimates were available. See Section 1.3 for ratio definitions.
12
3.4.2 Fish Bycatch Estimates for 2015
Fishery bycatch estimates based on 2015 data ranged from 12,029 lb in the New England Closed Area Mid-Water Otter Trawl Fishery to 46.1 M lb in the New England Large-Mesh Otter Trawl Fishery (Table 3.4.2a). Figure 3.3 shows fishery bycatch ratios for 35 Greater Atlantic Region fisheries based on 2015 data. Fish and invertebrate estimates based on 2015 data for 151 Greater Atlantic Region species and species groups are listed in Table 3.4.2b. Figure 3.4 shows fish and invertebrate bycatch ratios for Greater Atlantic Region species with reported landings based on 2015 data. 2015 landings for Atlantic wolffish (Anarhichas lupus), blacknose shark (Carcharhinus acronotus), blue shark (Prionace glauca), bonnethead shark, ocean pout (Zoarces americanus), pinfish, rough scad (Trachurus lathami), sandbar shark
Figure 3.2 Greater Atlantic Region Species Bycatch Ratios for 2014 See Section 1.3 for ratio definitions. Thresher shark is also referred to as common thresher shark.

13
(Carcharhinus plumbeus), and smooth hammerhead shark (Sphyrna zygaena) are not included to maintain the confidentiality of that information as required under section 402(b) of the MSA, 16 U.S.C. § 1881a(b). Like with Figure 3.2, species with a bycatch ratio of 1.0 or <0.01 are listed in the inset box. In many cases, species with a bycatch ratio of 1.0 are ESA-listed species or species for which retention is prohibited by regulation.
Figure 3.3 Greater Atlantic Region Fishery Bycatch Ratios for 2015 This figure includes fisheries for which fish bycatch estimates were available. See Section 1.3 for ratio definitions.

14
3.4.3 Protected and Retention-Prohibited Fish Bycatch Estimates
Species listed under the ESA such as Atlantic salmon (Salmo salar) Gulf of Maine Distinct Population Segment and Atlantic sturgeon (Acipenser oxyrinchus), and species for which retention is prohibited or not authorized in the fisheries listed above that also have a FMP (such as Atlantic wolfish), are reported in Sections 3.4.1 and 3.4.2. Harvest from the aquaculture industry for Atlantic salmon in Maine is not reported here.
3.4.4 Discussion In both years, the predominant species bycatch by weight were (1) skate complex (Rajidae; 37% and 38% of estimated annual bycatch in 2014 and 2015, respectively), (2) other benthic species
Figure 3.4 Greater Atlantic Region Species Bycatch Ratios for 2015 See Section 1.3 for ratio definitions.
15
(Benthic Species, Other; 18% and 15%), and (3) American lobster (Homarus americanus; 11% and 7%). In 2014 and 2015 respectively, approximately 81% and 77% of skate complex bycatch occurred in four fisheries: Mid-Atlantic Large-Mesh Otter Trawl, New England Large-Mesh Otter Trawl, Mid-Atlantic Limited Access Open Area Scallop Dredge, and New England Limited Access Open Area Scallop Dredge. Sand dollars (Echinarachnius parma) was the predominant species in the “Benthic Species, Other” group for both years, contributing approximately 89% by weight for this group in 2014 and approximately 88% by weight for this group in 2015. In both 2014 and 2015, non-animal species (i.e., plant and algae) contributed less than 1% of the “Benthic Species, Other” bycatch. The majority of American lobster bycatch occurred in the New England Lobster Pot and Trap Fishery in each year, with that fishery contributing approximately 91% of the total American lobster bycatch in 2014 and 86% in 2015. The CVs associated with the annual bycatch estimates for these three species or groups were less than or equal to 15.1%.
The CVs of the annual bycatch estimates varied across species and species groups and years. In 2014, 48 of 140 species and species groups with bycatch estimated had a CV less than 30%. For 78 species and species groups, the CV was between 30% and 100%, and of 14 it was greater than 100%. In 2015, of the 151 species and species groups with bycatch estimated, 55 had a CV less than 30%. For 81, the CV was between 30% and 100%, and for 15 it was greater than 100%. The highest CVs typically were associated with species with low bycatch estimates, such as spinner shark (Carcharhinus brevipinna), American eel (Anguilla rostrata), cusk (Brosme brosme), and wahoo (Acanthocybium solandri).
In each year, over half of the bycatch came from a small number of fisheries. In 2014, three fisheries accounted for 55% of the estimated bycatch: Mid-Atlantic Limited Access Open Area Scallop Dredge (23%), New England Large-Mesh Otter Trawl (19%), and New England Lobster Pots and Traps (13%).
In 2015, four fisheries accounted for 54% of the bycatch: New England Large-Mesh Otter Trawl (21%), Mid-Atlantic Limited Access Open Area Scallop Dredge (12%), Mid-Atlantic Large-Mesh Otter Trawl (11%), and New England Limited Access Open Area Scallop Dredge (10%). The CVs associated with the bycatch estimates for these fisheries were less than 18%. The remaining fisheries each represented less than 10% of the estimated bycatch for a given year.
Fishery bycatch ratios for some fisheries are expected to be higher here compared with previous reports because of the increase in the number of bycatch species and species groups included for these fisheries. More bycatch species and species groups increases the numerator in the bycatch ratio calculation (described in Section 1.3). For example, in 2013 the bycatch ratio of the 34 FMP bycatch species (a subset of the species considered in this report) in the New England Lobster Pots and Traps Fishery was 0.02. In 2014, when the additional bycatch species and species groups were included, the bycatch ratio was 0.49
3.5 Marine Mammal Bycatch
Table 3.5.1 shows annual average marine mammal bycatch estimates for 2014, which include 14 marine mammal stocks and seven Greater Atlantic Region commercial gear types/fisheries.

16
Table 3.5.2 shows that information for 2015, which include 10 marine mammal stocks and seven Greater Atlantic commercial gear types/fisheries. Total marine mammal bycatch estimates were 2,862 animals in 2014 and 2,361 in 2015.
Gillnet gear continues to be the largest contributor to total marine mammal bycatch, taking an estimated 1,997 in 2014 and 1,734 in 2015 (not including coastal bottlenose dolphin). The 2014 gillnet estimates were lower by 142 animals than the 2013 estimates, and the 2015 estimates were lower by 263 animals than the 2014 estimates. This reduction was partially driven by a drop of harbor porpoise bycatch in gillnets to the lowest five-year mean estimate ever recorded (Orphanides & Palka 2013, Hayes et al 2017). Marine mammal stocks with the highest average annual bycatch estimates across all six gear types included the:
• Western North Atlantic grey seal (also called gray seal) (Halichoerus grypus grypus; 1,162 animals, CV = 10% in 2014, and 1,088 animals, CV = 19% in 2015).
• Western north Atlantic short-beaked common dolphin (Delphinus delphis delphis; 409 animals, CV = 10% in 2014, and 436 animals, CV = 10% in 2015).
• Western North Atlantic harbor seal (Phoca vitulina concolor; 376 animals, CV = 13% in 2014, and 356 animals, CV = 11% in 2015).
• Gulf of Maine/Bay of Fundy harbor porpoise (Phocoena phocoena; 394 animals, CV = 18% in 2014, and 307 animals, CV = 16% in 2015).
The Marine Mammal Stock Assessment Reports contain more information on the status of these stocks. National Bycatch Report numbers for the Greater Atlantic Region may differ slightly from numbers in the Marine Mammal Stock Assessment Reports due to rounding error from summing bycatch across fisheries in the Stock Assessment Reports.
3.6 Sea Turtle Bycatch
The NBR tables do not include new sea turtle bycatch estimates for Greater Atlantic Region fisheries for 2014 and 2015. However, NMFS published a Technical Memorandum that contained estimates of bycatch of sea turtles in sink gillnet gear (Murray 2018). These estimates are totals for 2012-2016 and are not annual estimates. The estimates also are spatially divided such that they do not align with fisheries listed in the NBR and therefore are presented here in the text rather than in a table.
Murray 2018 estimated both total bycatch and estimated mortalities. The total estimated bycatch of sea turtles in sink gillnet gear for Greater Atlantic Region was:
• 705 loggerhead (Caretta caretta) turtles (557 mortalities) (CV = 0.29, 95% CI: 335-1116)
• 145 Kemp’s ridley (Lepidochelys kempii) turtles (115 mortalities) (CV=0.43, 95% CI: 44-292)
• 27 leatherback (Dermochelys coriacea) turtles (21 mortalities) (CV=0.71, 95% CI: 0-68) • 112 unidentified hard-shelled turtles (88 mortalities) (CV=0.37, 95% CI: 64-321)
Most sea turtle bycatch (87%) was attributed to trips catching monkfish, skates, or spiny dogfish.

17
Aside from the preceding sink gillnet gear estimates, the latest Greater Atlantic sea turtle bycatch estimates can be seen in Table 3.7 of NBR Update 2. These estimates cover bycatch in three Greater Atlantic Region commercial gear types/fisheries. The sea turtle estimates are at the species level for loggerhead turtles only; non-loggerhead species were excluded because there have been too few observed to support the modeling approach taken in the analysis. (See Murray 2013a for more information.) However, other turtles such as leatherback, green (Chelonia mydas), and Kemp’s ridley also are bycaught in these fisheries.
3.7 Seabird Bycatch
Table 3.7.1 shows the 2014 seabird bycatch estimates for seven species across six Greater Atlantic Region commercial fisheries, with a total of 1,060 seabirds taken. Table 3.7.2 shows the 2015 seabird bycatch estimates for 10 species across seven Greater Atlantic Region commercial fisheries, with a total of 2,572 seabirds taken.
Most bycatch occurred in the Mid-Atlantic and New England Gillnet Fisheries, with an estimated 917 seabirds taken in 2014 and 2,215 in 2015. More than half (54%) of the estimated 2014 seabird bycatch, and the majority (76%) of 2015 bycatch was composed of great shearwaters (also called greater shearwaters) (Puffinus gravis) caught in gillnets. Fisheries used for these estimates were grouped across the Mid-Atlantic and New England.
The great shearwater, northern fulmar (Fulmarus glacialis), red throated loon (Gavia stellata), and herring gull (Larus smithsonianus) were the most commonly taken species. Additional details on seabird bycatch estimates from 1996-2014 can be found in Hatch 2017, and in Sigourney et al in press for 2015.

18
4. Southeast Overview
4.1 Summary of Fisheries
Data presented in this chapter should be considered preliminary and subject to change if more thorough analyses are completed in the future. As such, these results should not be used for day-to-day management of fisheries. Management actions such as fishery closures, minimum sizes, area closures, and gear requirements may have a substantial impact on bycatch rates. Bycatch rates may also differ geographically and among seasons of the year. Detailed species-specific bycatch analyses that accounted for management measures (e.g., closed seasons, minimum size limit changes), or spatial and temporal specific effects, were not possible, other than for those species for which a recent stock assessment had been completed, due to the large number of species within each of the many commercial fisheries reporting to the Southeast Discard Logbook and Coastal Logbook programs and HMS Logbook program.
The NBR provides 2014 and 2015 fish bycatch estimates for 12 Southeast Region commercial fisheries (see Appendix 1), compared with 11 fisheries in the NBR First Edition Update 2 (NMFS 2016). It includes first-time estimates in the NBR for the Southeastern Atlantic Shrimp Trawl Fishery. This section of the NBR also features for the first time bycatch numbers (based on 100% observer coverage) for the Southeastern Atlantic and Gulf of Mexico Shark Bottom Longline Research Fishery, which has been separated from the Southeastern Atlantic and Gulf of Mexico Shark Bottom Longline Fishery here. (For more information about the Shark Bottom Longline Research Fishery, see Section 2.1.4 of NMFS 2007.) Bycatch estimates for NBR Update 2’s Gulf of Mexico Coastal Migratory Pelagic Gillnet Fishery have been incorporated into the Southeastern Atlantic Coastal Gillnet (Including North Carolina and Gulf of Mexico) Fishery.
Five Southeast Region fisheries—Southeastern Atlantic Shrimp Trawl, Gulf of Mexico Shrimp Trawl, Southeastern Atlantic and Gulf of Mexico Shark Bottom Longline, Southeastern Atlantic and Gulf of Mexico Shark Bottom Longline Research, and Atlantic and Gulf of Mexico Highly Migratory Species (HMS) Pelagic Longline—include estimated fish bycatch and landings data according to weight, as opposed to a mix of weight and individuals, which allows for the calculation of fishery bycatch ratios for these five fisheries. This is an increase over the two Southeast Region fisheries with fishery bycatch ratios in NBR First Edition Update 2 (NMFS 2016).
The Southeastern Atlantic and Gulf of Mexico Shark Bottom Longline Research Fishery reported bycatch mostly in pounds, but it also included 35 fish (see Section 4.4.1) reported as individuals in 2014, and 34 fish (see Section 4.4.2) reported as individuals in 2015, due to low sample size. In order to calculate a fishery bycatch ratio, these individual fish were excluded from the bycatch considered. These individual fish represent a very small proportion of bycatch observed in this fishery, and this fishery’s bycatch ratio should be viewed as a slight underestimation.
Bycatch estimates for the Southeastern Atlantic Snapper-Grouper Bottom Longline, Southeastern Atlantic Snapper-Grouper Vertical Line, Southeastern Atlantic Coastal Migratory Pelagic Troll,

19
Gulf of Mexico Reef Fish Bottom Longline, Gulf of Mexico Reef Fish Vertical Line, and Gulf of Mexico Coastal Migratory Pelagic Troll Fisheries were exclusively based on self-reported Coastal Logbook and Discard Logbook data. Bycatch estimates for the Southeastern Atlantic and Gulf of Mexico Shark Bottom Longline Fishery were based on a combination of logbook and observer information. NMFS requires all fishermen to complete the Coastal Logbook, and NMFS requires a random 20% of fishermen to submit Discard Logbook information.
As mentioned in Section 1.3, these fisheries include bycatch estimates with very high CVs due to the use of self-reported data in developing the estimates (see Tables 4.4.1a and 4.4.2a). These logbook data have a high level of observations, but might have few positive records for the bycatch species. The bycatch species listed for the reef fish and snapper-grouper fisheries in Tables 4.4.1a and 4.4.2a, although statistically imprecise, do reflect the diversity of species reported as discarded by fishermen in the Southeast Region.
Although fishermen are required to submit logbook forms within seven days of returning to port, delays of more than a week are not uncommon and may result in inaccurate bycatch reporting. Dealer trip tickets include landings information and are completed independently from logbook reports, usually on the day the catch was offloaded. Although data from dealer trip tickets were not used in bycatch calculations, fishermen may reference trip tickets when preparing logbook forms to ensure accurate landings reporting. Bycatch and detailed fishing effort information reported on logbooks cannot be validated against dealer trip tickets to ensure accuracy, as trip tickets only record landings, and in many states only very general fishing effort data (e.g., gear and number of days fished). Bycatch rate and fishing effort data inaccuracies due to delayed reporting, as well as the requirement for only 20% of fishermen to submit Discard Logbook information, will affect the estimation of total bycatch in a fishery.
Species identification of bycatch, particularly of sharks, may be difficult for fishermen with no formal training in species identification. Misidentification may be especially problematic for species not targeted by the fishery, such as protected/prohibited species. Uncertainty in species identification could lead to misreporting, non-reporting, or non-species-specific reporting; e.g., reporting “miscellaneous crustaceans (unidentified)”. This adds to the uncertainty in bycatch estimates for these species, as is reflected in the very high CVs associated with bycatch estimates for several Southeast Region fisheries.
The NBR provides 2014 and 2015 marine mammal bycatch estimates for the Atlantic and Gulf of Mexico HMS Pelagic Longline Fishery, as well as 2014 marine mammal bycatch estimates for the Gulf of Mexico Shrimp Trawl Fishery based on a multi-year annual average from years ranging from 2010 to 2014. The lack of estimates for other Southeast Region fisheries is due to lack of data and does not mean that the Atlantic and Gulf of Mexico HMS Pelagic Longline Fishery and the Gulf of Mexico Shrimp Trawl Fishery are the only fisheries with marine mammal bycatch in the Southeast Region.
In addition, sea turtle estimates for six Southeast Region fisheries for 2014 are provided: • Atlantic and Gulf of Mexico HMS Longline • Gulf of Mexico Reef Fish Vertical Line • Gulf of Mexico Shrimp Trawl
20
• Southern Atlantic Shrimp Trawl • Southeastern Atlantic Snapper-Grouper Bottom Longline • Southeastern Atlantic and Gulf of Mexico Shark Bottom Longline Research
Sea turtle estimates for six Southeast Region fisheries for 2015 are provided: the previously mentioned six fisheries, plus the Gulf of Mexico Coastal Migratory Pelagic Gillnet and Southeastern Atlantic Coastal Migratory Pelagic Troll.
Finally, the NBR includes 2014 and 2015 seabird bycatch estimates for the Atlantic and Gulf of Mexico HMS Pelagic Longline Fishery. The lack of estimates for other Southeast Region fisheries is due to lack of data and does not mean that the Atlantic and Gulf of Mexico HMS Pelagic Longline Fishery is the only fishery that interacts with seabirds in the Southeast Region.
4.2 Changes to Observer Coverage
Five observer programs operate out of the Southeast Region, including the Pelagic Longline Observer Program, the Gulf of Mexico Reef Fish Observer Program (Bottom Longline and Vertical Line), the Shark Bottom Longline Observer Program that includes the Shark Research Fishery, the Southeast Coastal Gillnet Observer Program, and the Shrimp Trawl Observer Program (otter trawl, skimmer, and butterfly net). The North Carolina Coastal Gillnet Alternative Sampling Program was discontinued in 2009, and the Shark Gillnet Program was greatly reduced in 2010 compared with 2005 because of the very small size of the fishery. However, the reduction in shark gillnet effort has allowed NMFS to expand observer coverage to other gillnet fisheries, and that program has now evolved into the Southeast Coastal Gillnet Observer Program, which still observes gillnet vessels that target sharks.
Observer data from the Gulf of Mexico Shrimp Skimmer Trawl and Butterfly Net Fishery are not included here, but observer data are available for 2014 (Scott-Denton et al. 2014). Since 2014, observer coverage for the Shrimp Skimmer Trawl Fishery has been greatly reduced.
4.3 Changes to Catch and Bycatch Estimation Methods The general methodologies used to estimate bycatch are the same as those outlined in the U.S. NBR First Edition (2011). However, NMFS was able to develop fishery and species bycatch ratios for more fisheries and species in this report due to the publication of a NOAA Technical Memorandum that provided individual-to-weight conversion factors for particular species captured in longline fisheries from the Western North Atlantic (Gulak et al. 2017). In addition, NMFS has provided separate bycatch estimates for the Southeastern Atlantic and Gulf of Mexico Shark Bottom Longline Research Fishery, which has been separated from the Southeastern Atlantic and Gulf of Mexico Shark Bottom Longline Fishery here. Dusky shark estimates in the U.S. NBR First Edition (NMFS 2011) and NBR First Edition Update 1 (NMFS 2013a) were based on a methodology that tended to overestimate dusky shark bycatch in non-HMS fisheries. This methodology was corrected in NBR First Edition Update 2 (NMFS 2016). Specifically, because there were so few observed dusky shark interactions in the Southeastern Atlantic Snapper-Grouper Bottom Longline and Gulf of Mexico Reef Fish Bottom
21
Longline Fisheries, the U.S. NBR First Edition and NBR First Edition Update 1 used dusky shark catch per unit effort from the Southeastern Atlantic and Gulf of Mexico Shark Bottom Longline Fishery Observer Program, including shark research fishery data, and expanded that catch rate to the total effort in the Southeastern Atlantic Snapper-Grouper Bottom Longline and Gulf of Mexico Reef Fish Bottom Longline Fisheries.
Bottom longline sets for sharks and reef fish/snapper-grouper are different due to different gear configurations, soak times, etc., and are not directly comparable. Additionally, because sets for both sharks and reef fish/snapper-grouper can occur on the same trip, estimates that treated these fisheries completely separately would have resulted in double counting of some sharks. Shark research fishery trips target sandbar sharks and have a comparatively high interaction frequency with dusky sharks, which resulted in artificially inflated values for dusky shark bycatch in the Southeastern Atlantic Snapper-Grouper Bottom Longline and Gulf of Mexico Reef Fish Bottom Longline Fisheries in the U.S. NBR First Edition and NBR First Edition Update 1.
Similar artificially inflated dusky shark bycatch estimates were made in the U.S. National Bycatch Report First Edition and NBR First Edition Update 1 for the Gulf of Mexico Reef Fish Vertical Line, Southeastern Atlantic Coastal Migratory Troll, and Southeastern Atlantic Reef Fish Vertical Line Fisheries, where observed dusky shark interactions have been near zero. Therefore, the dusky shark estimates provided in the U.S. National Bycatch Report First Edition and NBR First Edition Update 1 are considered invalid for use in management. In addition, Southeast fishery bycatch estimates for other shark species (e.g., sandbar sharks) in the U.S. NBR First Edition and NBR First Edition Update 1 may be similarly artificially inflated.
The methodology used to estimate dusky shark bycatch in the U.S. NBR First Edition and NBR First Edition Update 1 has been not used in the NBR First Edition Update 2, or here, due to these issues. For more information on the best available dusky shark catch and bycatch information, see pages 1-19 to 1-22 of Final Amendment 5b to the 2006 Consolidated Atlantic HMS Fishery Management Plan (NMFS 2017).
Sea turtle bycatch estimates for the Gulf of Mexico Shrimp Trawl and Southern Atlantic Shrimp Trawl Fisheries were developed through the application of integrated Bayesian models to fishery observer data (Babcock et al. 2018). Recent developments in models used for seabird bycatch estimation are described in Section 4.7.
4.4 Fish Bycatch
This section presents fish bycatch estimates in Southeast Region fisheries based on data from 2014 and 2015. This section also includes fishery bycatch ratios as well as species bycatch ratios for each year, where available.
4.4.1 Fish Bycatch Estimates for 2014
Fishery bycatch estimates based on 2014 data ranged from 66,100 lb of bycatch in the Southeastern Atlantic and Gulf of Mexico Shark Bottom Longline Research Fishery to 254.52 M lb of bycatch in the Gulf of Mexico Shrimp Trawl Fishery. The Gulf of Mexico Coastal

22
Migratory Pelagic Troll Fishery reported an estimated bycatch of 19,759 individual fish, while the Gulf of Mexico Reef Fish Vertical Line Fishery reported an estimated bycatch of 3,516,523 individual fish (Table 4.4.1a).
The NBR includes fish and invertebrate estimates based on 2014 data for 178 Southeast Region stocks, species, and species groups (Table 4.4.1b). Figure 4.1 shows fishery bycatch ratios for five Southeast Region fisheries based on 2014 data.
The ratio of bycatch to bycatch plus landings in these fisheries ranged from 0.15 for the Atlantic and Gulf of Mexico HMS Pelagic Longline Fishery (1.76 M lb of bycatch and 9.72 M lb of landings), to 0.83 for the Southeastern Atlantic Shrimp Trawl Fishery (80.10 M lb of bycatch and
Figure 4.1 Southeast Region Fishery Bycatch Ratios for 2014 This figure includes those Southeast fisheries for which both bycatch and landings are reported in terms of pounds, as opposed to a mix of pounds and individuals. See Section 1.3 for ratio definitions.

23
16.16 M lb of landings). The ratio for the Shark Bottom Longline Research Fishery does not include 35 fish recorded as individuals instead of pounds because of low sample size: one bluefish; one clearnose skate; one gafftopsail catfish; one houndshark; one ray, sawfish, or skate; two requiem sharks; one reticulate moray; 10 roughtail stingrays; one scorpionfish; one shark; one sharksucker; four smalltooth sawfish; three southern stingrays; one sponge (unidentified); three stingrays – South Atlantic/Gulf of Mexico; and three toad fishes. As in the first edition and Updates 1 and 2, some Southeast Region bycatch estimates were reported by weight, and others were reported in numbers. Therefore, NMFS could only develop bycatch ratios (pounds of bycatch divided by the total weight of fishery) for a subset of the Southeast Region species (Figure 4.2).
Figure 4.2 Southeast Region Species Bycatch Ratios for 2014 The species bycatch ratio is the ratio of bycatch of a single stock to total catch of that stock within the region, where total catch of that stock is the species bycatch plus species landings.

24
However, as previously mentioned, NMFS was able to develop fishery and species bycatch ratios for more fisheries and species in here due to the publication of Gulak et al. 2017. NMFS was able to provide bycatch ratios for five Southeast Region fisheries and for nine species for 2014, an increase over Update 2. (Species are referred to using FSSI stock names; FSSI stock names do not correspond to regional FMP names.)
For the fish stocks where bycatch-to-landings could be calculated for 2014, the ratios ranged from 1.00 for longspine porgy (Stenotomus caprinus) to 0.02 for great hammerhead (Sphyrna mokarran). Hammerhead sharks are not allowed to be possessed or sold when pelagic longline gear is on a vessel, but the sharks may be possessed and sold in bottom longline fisheries and in fisheries that use gears other than longline gear. Bycatch ratios for species like hammerhead sharks, which must be discarded under certain management measures but can be retained and sold under other management measures, cannot meaningfully be compared with other species that can be retained in all situations, or that must be discarded in all situations.
For stocks where bycatch ratios could not be developed, the highest bycatch estimates in terms of numbers of individuals for 2014 included red grouper (Epinephelus morio; 1.745 million individuals) and red snapper (Lutjanus campechanus; 1.191 million individuals). Likewise, the highest bycatch estimates in terms of pounds for stocks or species groups where bycatch ratios could not be developed included grouped finfish – other (117.88 M lb) and Atlantic croaker (Micropogonias undulatus; 78.02 M lb).
4.4.2 Fish Bycatch Estimates for 2015
Fishery bycatch estimates based on 2015 data ranged from 49,795 lb of bycatch in the Southeastern Atlantic and Gulf of Mexico Shark Bottom Longline Research Fishery to 345.62 M lb of bycatch in the Gulf of Mexico Shrimp Trawl Fishery. The Gulf of Mexico Coastal Migratory Pelagic Troll Fishery reported an estimated bycatch of 8,432 fish, while the Gulf of Mexico Reef Fish Vertical Line Fishery reported an estimated bycatch of 2,831,625 fish (Table 4.4.2a).
The NBR includes fish and invertebrate estimates based on 2015 data for 182 Southeast Region stocks (Table 4.4.2b). Figure 4.3 shows fishery bycatch ratios for five Southeast Region fisheries based on 2015 data. The ratio of bycatch to bycatch plus landings in these fisheries ranged from 0.14 for the Southeastern Atlantic and Gulf of Mexico Shark Bottom Longline Research Fishery (0.05 M lb of bycatch and 0.31 M lb of landings), to 0.73 for the Southeastern Atlantic Shrimp Trawl Fishery (88.36 M lb of bycatch and 23.89 M lb of landings). The Shark Bottom Longline Research Fishery ratio does not include 35 fish recorded as individuals instead of pounds in this fishery because of low sample size: one barracuda, one clearnose skate, two gag, three greater amberjacks, three hammerhead sharks, one lemon shark, one leopard toadfish, one moray eel, three requiem sharks, one roughtail stingray, one shark, two sharksuckers, two smalltooth sawfish, one southern stingray, two stingrays – South Atlantic/Gulf of Mexico, eight toad fishes, and one white shark.
NMFS developed 2015 bycatch ratios for 13 Southeast Region species (Figure 4.4), an increase over Update 2. For the fish stocks where bycatch ratios could be calculated for 2015, the ratios

25
ranged from 1.00 for longspine porgy (Stenotomus caprinus) to 0.00 for scup (Stenotomus chrysops). For stocks where bycatch ratios could not be developed, the highest bycatch estimates in terms of numbers of individuals for 2015 included red grouper (Epinephelus morio; 1.752 M fish) and red snapper (Lutjanus campechanus; 1.195 M fish). The highest bycatch estimates in terms of pounds for stocks or species groups where bycatch ratios could not be developed included grouped finfish – other (115.28 M lb) and Atlantic croaker (Micropogonias undulates; 76.76 M lb).
Figure 4.3 Southeast Region Fishery Bycatch Ratios for 2015 This figure includes those Southeast fisheries for which both bycatch and landings are reported in terms of pounds, as opposed to a mix of pounds and individuals. See Section 1.3 for ratio definitions.

26
4.4.3 Protected and/or Prohibited Fish Bycatch Estimates
NMFS began placing at-sea observers on Southeast commercial shrimp vessels in 1992 to identify and minimize the impacts of shrimp trawling on federally managed species. Analysis of bycatch data relative to smalltooth sawfish (Pristis pectinate), a federally listed endangered species, indicated that the level of take was higher than mandated. In light of the costs associated with observer coverage, and given the rarity of smalltooth sawfish captures, increasing observer coverage to refine take estimates of this species may not be practical.
In 2014, NMFS explored the use of electronic monitoring (EM) to provide a valid alternative to increased observer coverage. A pilot project on contracted commercial shrimp trawl vessels found that an EM system performed well in capturing video of the overall fishing operations.
Figure 4.4 Southeast Region Species Bycatch Ratios for 2015 The species bycatch ratio is the ratio of bycatch of a single stock to total catch of that stock within the region, where total catch of that stock is the species bycatch plus species landings.

27
The hardware held up for the duration of the trips with no water ingress to the deck components, and there was only one significant gap that may have been caused by a system component malfunction. The EM system performed well in capturing video for a total of 15 trips consisting of 391 hauls over 203 days at sea. Of the 15 trips captured by the EM system, seven were also observed trips with a certified fishery observer on the vessel. Overall camera framing of the hauling activity for the project was well-placed, and the resulting video documented all major areas of the vessel in which there was fishing activity. The reviewer was able to see the nets as they were brought alongside the vessel, as they came out of the water, and as they were brought onto the deck where they were emptied and sorted. Species identification for larger animals was possible. Even during periods of low light, the EM reviewer was able to detect and identify larger catch items such as sharks and rays.
Although no smalltooth sawfish were observed, one loggerhead sea turtle, which had been caught in a vessel’s try net, was released alive and fully captured by the EM system. Catch composition documented by the EM reviewer was compared for the observed trips. For the compared trips, 23 hauls contained 29 bycatch items (teleosts and elasmobranchs) in the observer sample that met the criteria of being over 1 kg. Of these catch items, 27 of the 29 were also detected by the EM reviewer, suggesting that EM could be an effective tool for detecting protected species interactions in the Gulf of Mexico Shrimp Trawl Fishery.
4.4.4 Discussion
The Atlantic and Gulf of Mexico HMS Pelagic Longline Fishery bycatch ratios were 0.15 for 2014 and 0.14 for 2015, which are consistent with bycatch ratios reported in previous National Bycatch Reports. Fishery bycatch ratios for the Gulf of Mexico Shrimp Trawl Fishery were 0.66 for 2014 and 0.67 for 2015. These ratios represent a slight increase over ratios reported for this fishery in Update 2, which ranged between 0.56 and 0.64 over 2011-2013. For more information on Southeast Region shrimp trawl bycatch ratios, see Scott-Denton et al. 2012.
The fluctuation in number of estimates for Southeast Region fish stocks and species groups in this report (178 in 2014, and 182 in 2015) is expected due to the many diverse species that inhabit the Southeast Region. Many minor stocks have very small bycatch values and may not occur in every year.
4.5 Marine Mammal Bycatch
The NBR includes 2014 and 2015 marine mammal bycatch estimates for the Atlantic and Gulf of Mexico HMS Pelagic Longline Fishery and 2014 bycatch estimates for the Gulf of Mexico Shrimp Trawl Fishery. Gulf of Mexico Shrimp Trawl Fishery marine mammal bycatch estimates for 2015 are not included here, because marine mammal estimation for that fishery operates on a three-year cycle that did not fit the NBR publication time frame. NMFS has only estimated marine mammal bycatch for the Gulf of Mexico Shrimp Trawl Fishery, not the Southeastern Atlantic Shrimp Trawl Fishery. In addition, the Gulf of Mexico Shrimp Trawl Fishery estimates cover only the otter trawl sector of the fishery, and not the skimmer trawl sector.

28
For 2014, the estimated bycatch was 254.9 dolphins and pilot whales for the HMS Pelagic Longline Fishery, and 496.2 dolphins in the Shrimp Trawl Fishery (Table 4.5.1). For 2015, the HMS Pelagic Longline Fishery included estimated dolphin, pilot whale, and sperm whale bycatch totaling 221.1 individuals (Table 4.5.2). These annual estimates are fractional because they are based on a multi-year average.
The HMS Pelagic Longline Fishery is a Category I fishery under the MMPA’s List of Fisheries, which means that annual mortality and serious injury of a marine mammal stock in that fishery is greater than or equal to 50 percent of the stock’s potential biological removal (PBR) level.4 The Gulf of Mexico Shrimp Trawl Fishery is a Category II fishery, which means that annual mortality and serious injury of a marine mammal stock in that fishery is greater than 1 percent and less than 50 percent of the stock’s PBR level. For more information about estimated bycatch of marine mammals in the Atlantic and Gulf of Mexico HMS Pelagic Longline Fishery, see Garrison and Stokes 2016. For more information about estimated bycatch mortality of marine mammals in the Gulf of Mexico Shrimp Trawl Fishery, see Soldevilla et al. 2016.
The Marine Mammal Stock Assessment Reports contain more information on the status of these stocks. The lack of estimates for other Southeast Region fisheries is due to lack of data and does not mean that the Atlantic and Gulf of Mexico HMS Pelagic Longline Fishery and the Gulf of Mexico Shrimp Trawl Fishery are the only fisheries with marine mammal bycatch in the Southeast Region.
4.6 Sea Turtle Bycatch
The NBR provides estimates of sea turtle bycatch for 2014 for six Southeast Region fisheries (Table 4.6.1), including the Gulf of Mexico Shrimp Trawl and Southern Atlantic Shrimp Trawl Fisheries. It also provides estimates of sea turtle bycatch for 2015 for eight Southeast Region fisheries (Table 4.6.2), also including the Gulf of Mexico Shrimp Trawl and Southern Atlantic Shrimp Trawl Fisheries. All estimated bycatch values presented in the text and tables are for total sea turtle bycatch (live and dead releases).
Sea turtle bycatch estimates for the Gulf of Mexico Shrimp Trawl and Southern Atlantic Shrimp Trawl Fisheries were developed through the application of integrated Bayesian models to fishery observer data (Babcock et al. 2018). Tables 4.6.3 and 4.6.4 below shows these estimates, including the credible intervals5 for the estimates, because those intervals could not be included in Tables 4.6.1 and 4.6.2 due to database limitations.
The collective total sea turtle bycatch estimate for 2014 was 1,607 individuals, including an estimated bycatch of 587 individuals (202 Kemp’s ridley sea turtles, 172 unclassified sea turtles, 156 green sea turtles, and 57 loggerhead sea turtles) in the Gulf of Mexico Shrimp Trawl Fishery. In addition, the Atlantic and Gulf of Mexico HMS Pelagic Longline Fishery had an
4 The PBR level is defined by the MMPA as the maximum number of animals, not including natural mortalities, that may be removed from a marine mammal stock while allowing that stock to maintain its optimum sustainable population. 5 Credible intervals are In Bayesian statistics are analogous to confidence intervals in frequentist statistics. For more information on Bayesian versus frequentist assessment methods, see Chen et al. 2003.

29
estimated bycatch of 544 individuals (279 leatherback sea turtles, 259 loggerhead sea turtles, and 6 olive ridley [Lepidochelys olivacea] sea turtles).
The collective total sea turtle bycatch estimate for 2015 was 1,632 individuals, including an estimated bycatch of 542 individuals (300 leatherback sea turtles and 242 loggerhead sea turtles) in the Atlantic and Gulf of Mexico HMS Pelagic Longline Fishery, and an estimated bycatch of 508 individuals (170 unclassified sea turtles, 158 Kemp’s ridley sea turtles, 134 green sea turtles, and 46 loggerhead sea turtles) in the Gulf of Mexico Shrimp Trawl Fishery.
Table 4.6.3 Sea turtle bycatch estimates for the Gulf of Mexico Shrimp Trawl Fishery, 2014 and 2015 Bycatch estimates are for live and dead releases. Credible intervals for the estimates shown in parenthesis. For more information, see Babcock et al. 2018.
Year Kemp’s ridley Loggerhead Green Unknown 2014 202 (94-405) 57 (22-121) 156 (88-262) 172 (96-289) 2015 158 (63-369) 46 (18-105) 134 (75-226) 170 (93-305)
Table 4.6.4 Sea turtle bycatch estimates for the Southeastern Atlantic Shrimp Trawl Fishery, 2014 and 2015 Bycatch estimates are for live and dead releases. Credible intervals for the estimates shown in parenthesis. For more information, see Babcock et al. 2018.
Year Kemp’s ridley Loggerhead Green Unknown 2014 73 (15-252) 101 (27-321) 47 (6-196) 127 (38-386) 2015 82 (16-296) 111 (29-378) 51 (7-226) 140 (42-453)
The lack of estimates for other Southeast Region fisheries is due to lack of data and does not mean that the fisheries in Table 4.6.1 and 4.6.2 are the only fisheries with sea turtle bycatch in the Southeast Region.
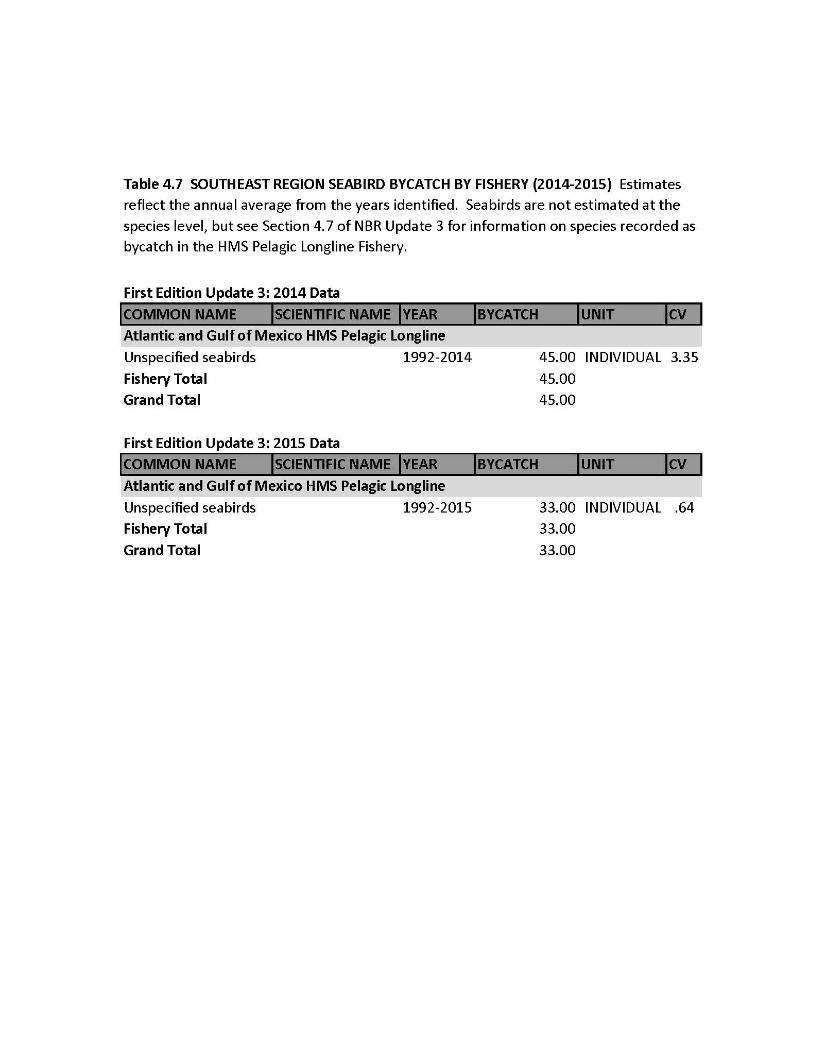
4.7 Seabird Bycatch
The NBR includes seabird bycatch estimates for only one Southeast Region commercial fishery, the Atlantic and Gulf of Mexico HMS Pelagic Longline Fishery. Seabird bycatch for the Atlantic and Gulf of Mexico HMS Pelagic Longline Fishery is reported each year in terms of number of birds per set or per 1,000 hooks. The observed annual seabird bycatch rate has varied substantially from year to year from 1992 through 2015. Over the long-term, there has been a substantial decrease in observed annual catch rate since 2004, the year that circle hooks became mandatory. A slight increase in observed annual catch rate occurred between 2014 and 2015, from 0.0016 birds per set and 0.0022 birds per thousand hooks in 2014 to 0.0018 birds per set and 0.0027 birds per thousand hooks in 2015.
A model based on seabird bycatch and effort data from the NMFS Pelagic Observer Program (POP) is used with effort data from the entire fleet to estimate the seabird bycatch of the fleet. By including a year effect in the model, bycatch can be estimated not only for the entire period of record but also for each year. Models used for estimation have advanced over time and are described in Li and Jiao 2013, Zhou and Jiao 2017, and Zhou et al. in review.

30
The POP documented 16,559 longline set operations, with 145 seabirds captured on 78 sets, from 1992 through 2014. Fleet effort through 2014 totaled 251,341 sets. From 1992 to 2014, the total seabird bycatch from the fishery was estimated at 2,715 seabirds, of which 45 birds (CV = 63.51%) came from 2014 (Table 4.7).
The POP documented 17,693 longline set operations, with 147 seabirds captured on 80 sets from 1992 through 2015. Fleet effort through 2015 totaled 259,538 sets. From 1992 to 2015, the total number of seabirds caught by the fishery was estimated at 2,748 seabirds, of which 33 birds (CV = 64.67%) came from 2015 (Table 4.7). The annual average seabird bycatch from 1992-2016 was 113 (CV = 26.52%).
The Middle Atlantic Bight area produced the highest seabird bycatch estimate, followed by the Northeast Coast and Gulf of Mexico areas. Most of the seabird bycatch was estimated to occur from summer through winter. Longline sets targeting a mixed group of species were estimated to produce the majority of the seabird bycatch. Longline sets targeting tuna, followed by swordfish, also led to higher seabird bycatch than those sets with other targets.
Over the years, the observed bycatch in the Atlantic and Gulf of Mexico HMS Pelagic Longline Fishery has consisted of brown pelicans (Pelecanus occidentalis) (2); northern gannets (Morus bassanus) (11); black-backed gulls (Larus marinus) (10); herring gulls (12); laughing gulls (Leucophaeus atricilla) (3); greater shearwaters (26); Cory’s shearwaters (Calonectris borealis) (2); a parasitic jaeger (Stercorarius parasiticus) (1); a northern fulmar (1); a storm petrel (Hydrobatidae) (1); unidentified seabirds (53); gulls not identified to species (23); and shearwaters not identified to species (2). Only two birds were observed caught in 2014 in this fishery, a live brown pelican and a dead Cory’s shearwater. Only two birds were observed caught in 2015 in this fishery, a greater shearwater and an unidentified shearwater, both dead. Of the 78 birds not identified to species, most (52 seabirds and 22 gulls) were caught prior to 2005. Seabird identification training was incorporated into POP observer training beginning in July 2004.
Observer programs operating out of the Panama City Laboratory of the NMFS Southeast Fisheries Science Center (SEFSC) report seabird bycatch from several other fisheries (besides the Atlantic and Gulf of Mexico HMS Pelagic Longline Fishery) to the SEFSC Miami Seabird Project office in Miami. No seabirds were reported for 2014. However, one brown pelican (Pelecanus occidentalis), released alive, was reported for 2015 from the Southeast Gillnet Observer Program, where the vessel was fishing for Atlantic croaker. The Panama City Laboratory also manages the Shark Bottom Longline Observer Program, but that program did not provide any 2014 or 2015 seabird bycatch records.
The lack of estimates for other Southeast Region fisheries is due to lack of data and does not mean that the Atlantic and Gulf of Mexico HMS Pelagic Longline Fishery is the only fishery with seabird bycatch in the Southeast Region.
31
32
5. Alaska Overview
5.1 Summary of Fisheries
The NBR provides 2014 and 2015 fish bycatch estimates for 19 Alaska Region commercial fisheries (see Appendix 3), compared with 23, 23, and 26 fisheries for 2011, 2012, and 2013 in the NBR First Edition Update 2 (NMFS 2016a). Update 2 categorized landings and bycatch as belonging to groundfish and halibut fisheries that were defined using a combination of area fished, gear, and the predominant retained fish species or species group (i.e. realized catch). This current update has changed how some of the groundfish and halibut fisheries are defined. They now more accurately reflect how fisheries are managed and prosecuted. In some cases this meant the fisheries remained the same, but in some cases they were consolidated (see Table 5.1).
This current update also includes 10 crab fisheries not previously reported in the NBR. These fisheries occur in the Bering Sea and Aleutian Islands and are under joint federal and state management. Bycatch estimates are only available for four of the 10 crab fisheries, because six were either closed during the time period covered here; had so few participants the data are required to be maintained as confidential under MSA 402(b), 16 U.S.C. § 1881a(b); or the fishery was not subject to observer coverage and there are no estimates of bycatch.
The NBR provides 2014 and 2015 marine mammal bycatch estimates based on multi-year annual averages (typically five years) for eight federally managed Alaska Region groundfish fisheries, two federally managed groundfish fishery groups, and one commercial fishery under state management. This compares to nine federally managed groundfish fisheries and two federally managed groundfish fishery groups in 2011, and eight federally managed groundfish fisheries and two federally managed groundfish fishery groups in 2012 and 2013. Update 2 also provided 2012 and 2013 marine mammal bycatch estimates based on two-year annual averages for one commercial fishery under state management authority. Unlike the fishery definitions used for fish and crab bycatch estimates, the fishery definitions did not change from the last update for marine mammal estimates.
Seabird bycatch estimates are provided for nine federally managed Alaska Region commercial fisheries and one halibut fishery under joint federal/international management authority. This compares to nine federally managed groundfish fisheries and two federally managed groundfish fishery groups for 2011 and 2012 where seabird bycatch was greater than zero; seven federally managed groundfish fisheries and two federally managed groundfish fishery groups for 2013 where seabird bycatch was greater than zero; and the halibut fishery (2013 only) that is under joint federal/international management authority in the NBR First Edition Update 2 (NMFS 2016a). As mentioned above, Update 2 categorized landings and bycatch as belonging to a fishery by using a combination of area fished, gear, and the predominantly retained fish species or species group, whereas this current update categorizes landings and bycatch by how fisheries are managed and prosecuted. The number of fisheries with seabird bycatch estimates may increase when NMFS is able to incorporate analyses that are being developed for trawl fishery seabird mortality that occurs outside the standard observer sampling regime.

33
Table 5.1 Comparison of Alaska Region Fisheries used for Fish and Seabird Bycatch Estimates in this Update and Update 2 Fisheries with fish and seabird bycatch estimates in this update are listed in the left-hand column. The corresponding fishery (or fisheries) from Update 2 are in the right-hand column. Where the new fishery is a consolidation of more than one fishery, there are multiple rows on the right-hand side to a single row on the left-hand side of the table. A fishery that has been split into more than one fishery has a single row on the right-hand side with more than one row on the left-hand side.
In Current Update In First Edition Update 2 Bering Sea/Aleutian Islands Catcher Processor Longline
Bering Sea/Aleutian Islands Greenland Turbot Longline Bering Sea/Aleutian Islands Pacific Cod Longline
Bering Sea/Aleutian Islands Catcher Vessel Longline
Bering Sea/Aleutian Islands Sablefish Longline Alaska Halibut Longline
Bering Sea/Aleutian Islands Groundfish Pot Bering Sea/Aleutian Islands Pacific Cod Pot Bering Sea/Aleutian Islands Sablefish Pot
Bering Sea/Aleutian Islands Jig Bering Sea/Aleutian Islands Pacific Cod Jig
Bering Sea/Aleutian Islands Non-Pollock Trawl
Bering Sea/Aleutian Islands Sablefish Trawl Aleutian Islands/Eastern Bering Sea Atka Mackerel Trawl Bering Sea/Aleutian Islands Pacific Ocean Perch Trawl Bering Sea/Aleutian Islands Flatfish Group (Arrowtooth Flounder, Flathead Sole, Other Flatfish) Trawl Bering Sea/Aleutian Islands Rock Sole Trawl
Bering Sea/Aleutian Islands Pollock Trawl Bering Sea/Aleutian Islands Pollock Trawl
Bering Sea/Aleutian Islands Trawl Limited Access Bering Sea/Aleutian Islands Yellowfin Sole Trawl Bering Sea/Aleutian Islands Pacific Cod Trawl
Gulf of Alaska Halibut Longline Alaska Halibut Longline
Gulf of Alaska Jig Gulf of Alaska Pacific Cod Jig Alaska/North Pacific Halibut Mechanical Jig and Troll
Gulf of Alaska Non-pelagic Trawl
Gulf of Alaska Arrowtooth Flounder Trawl Gulf of Alaska Flatfish (Deepwater Flatfish) Trawl Gulf of Alaska Flatfish (Shallow Water Flatfish) Trawl Gulf of Alaska Flathead Sole Trawl Gulf of Alaska Rex Sole Trawl Gulf of Alaska Pacific Cod Trawl
Gulf of Alaska Pacific Cod Longline Gulf of Alaska Pacific Cod Longline Gulf of Alaska Pollock Trawl Gulf of Alaska Pollock Trawl Gulf of Alaska Pot Gulf of Alaska Pacific Cod Pot Gulf of Alaska Rockfish Nonpelagic Trawl Gulf of Alaska Rockfish (Northern Rockfish, Pelagic Shelf
Rockfish, Pacific Ocean Perch) Trawl Gulf of Alaska Rockfish Pelagic Trawl Gulf of Alaska Sablefish Longline Gulf of Alaska Sablefish Longline Gulf of Alaska Sablefish Trawl Gulf of Alaska Sablefish Trawl Aleutian Islands Golden King Crab Pot
Bering Sea/Aleutian Islands Rationalized Crab Fisheries
Bering Sea Snow Crab Pot Bering Sea Tanner Crab Pot Bristol Bay Red King Crab Pot Pribilof Islands Blue King Crab Pot Pribilof Islands Golden King Crab Pot Pribilof Islands Red King Crab Pot St. Matthew Island Blue King Crab Pot Western Aleutian Islands Red King Crab Pot Norton Sound Red King Crab Pot Bering Sea/Aleutian Islands Crab Pot*
* The Bering Sea/Aleutian Islands Crab Pot Fishery was last used in the First Edition of the National Bycatch Report (NMFS 2011).
34
5.2 Changes to Observer Coverage
5.2.1 North Pacific Observer Program
The North Pacific Observer Program (Observer Program) oversees the deployment of NMFS-certified observers into the halibut and groundfish fisheries off Alaska. Observers collect biological samples and fishery-dependent information used to estimate total catch and interactions with protected species. This information collected by well-trained, independent observers is a cornerstone of management of the federal fisheries off Alaska. The details of the data collection methods used by observers are described in the Observer Program sampling manual (AFSC 2016).
The methods to deploy observers into the halibut and groundfish fisheries have not changed since Update 2 (NMFS 2016a). All vessels and processors that participate in federally managed or parallel groundfish and halibut fisheries off Alaska are assigned to one of two categories: (1) the full observer coverage category (full coverage), where vessels and processors have at least one observer present for all fishing activity, or (2) the partial observer coverage category (partial coverage), where observers are deployed on a statistically reliable sample of fishing vessels in the partial coverage category. Funds for deploying observers on vessels in the partial coverage category are provided through a system of fees based on the gross ex-vessel value of retained groundfish and halibut. This observer fee is assessed on all landings by vessels that are not otherwise in full coverage. The system of fees fairly and equitably distributes the cost of observer coverage among all vessels and processors in the partial coverage category.
NMFS develops an Annual Deployment Plan (ADP) to describe how observers will be deployed for the upcoming calendar year. The following year, the agency provides an annual report with descriptive information and scientific evaluation of the deployment of observers. NMFS and the North Pacific Fishery Management Council created the ADP process to provide flexibility in the deployment of observers to gather reliable data for estimation of catch in the groundfish and halibut fisheries off Alaska. The ADP process ensures that the best available information is used to annually determine deployment methods.
Details of the observer deployment in 2014 and 2015, including the specific sampling strata in the partial coverage category, are available in the 2014 ADP (NMFS 2013b) and 2015 ADP (NMFS 2014). Review of observer deployment in each of those years is available in the respective annual reports (NFMS 2015, NMFS 2016b). Overall, in 2014, there were 4,368 observer days in partial coverage and 39,810 observer days in full coverage, for a total of 44,178 observer days. Among all fishing activity (full and partial coverage categories) in federal fisheries in 2014, 5,883 trips (43%) and 417 vessels (32.8%) were observed. In 2015, there were 5,318 observer days in partial coverage and 41,322 observer days in full coverage, for a total of 46,640 observer days. Among all fishing in federal fisheries in 2015, 4,859 trips (39.1%) and 498 vessels (42.1%) were observed.
35
5.2.2 Bering Sea/Aleutian Islands Crab Observer Program
The Alaska Department of Fish and Game (ADF&G) has required observer coverage aboard vessels participating in commercial Bering Sea and Aleutian Islands crab fisheries since 1988 (Gaeuman 2014). Observer coverage is required on all vessels that process crabs at sea, whereas catcher-vessel observer coverage levels vary by fishery. Depending on the fishery and vessel type, observer coverage is either secured and paid for by industry (pay-as-you-go) or by using funds acquired through cost-recovery crab fishing or federal grants (Leon et al. 2017). Onboard observers collect information on catch, fishing behavior, effort, and biological data (Gaeuman 2014).
5.2.3 Alaska Marine Mammal Observer Program
The Alaska Marine Mammal Observer Program (AMMOP) conducts observer coverage of the state-managed fisheries classified as Category II under the Marine Mammal Protection Act (MMPA) list of fisheries. AMMOP collects data from fisheries on rotational observation periods. Of the 14 MMPA Category II fisheries managed by the State of Alaska, AMMOP has observed several of them since the establishment of AMMOP in 1990:
• The Prince William Sound Drift and Set Gillnet Fisheries (1990-1991) • The Alaska Peninsula Drift Gillnet Fishery (1990) • The Cook Inlet Drift and Set Gillnet Fishery (1999-2000) • The Kodiak Set Gillnet Fishery (2002 and 2005) • The Yakutat Set Gillnet Fishery (2007-2008) • The Southeast Alaska Drift Gillnet Fishery (2012-2013)
The AMMOP did not collect data in 2010 or 2011 due to lack of funding. AMMOP observed fisheries again in 2012 and 2013 in the Southeast Alaska Drift Gillnet Fishery. Data collection was suspended again in 2014 due to lack of funding and has not resumed efforts since that time; therefore no data from AMMOP are included in this update. NMFS will reassess future AMMOP activities as funding permits.
5.3 Changes to Catch and Bycatch Estimation Methods
5.3.1 Fish Bycatch Estimation Methods
The same methodologies used to estimate catch and bycatch of fish as described in Section 4.3.4.1 of the first edition of the NBR (NMFS 2011) were employed to produce estimates for subsequent updates (NMFS 2013a, NMFS 2016a) and this update. Total catch estimates in the groundfish fisheries off Alaska are generated in the Catch Accounting System using total catch data from the North Pacific Observer Program and industry reports of retained catch. Cahalan et al. 2014 provides a detailed description of the current catch estimation methods.
Bycatch management measures for groundfish fisheries in the Bering Sea and Aleutian Islands (BSAI) and Gulf of Alaska (GOA) have specific requirements to limit or reduce the incidental catch of species harvested by other fisheries. The catch of these species is referred to as Prohibited Species Catch (PSC). This report includes bycatch estimates for nine PSC species or
36
species groups, including Chinook salmon, non-Chinook salmon, golden king crab (Lithodes aequispinus), red king crab (Paralithodes camtschaticus), blue king crab (Paralithodes platypus), snow crab (Chionoecetes opilio), Tanner crab (Chionoecetes bairdi), Pacific halibut (Hippoglossus stenolepis), and Pacific herring (Clupea pallasii). In the groundfish fisheries, regulations require that PSC species be returned to the sea immediately with minimal injury, or donated under a salmon or halibut PSC donation program. For Pacific halibut estimates, discard mortality rates are used to estimate the portion of halibut bycatch that dies. Observer data are used to estimate discard mortality rates in the groundfish fisheries. In the Catch Accounting System, crab and salmon are estimated as numbers of individuals for management and have been estimated in weight here using average weights derived from samples taken by observers.
Estimates of uncertainty are currently not available for fish bycatch. The methods to calculate variance are being developed and are expected to be provided in the next update.
The crab bycatch estimates for the BSAI crab fisheries have been included in this update of the NBR for the first time. The estimates were generated by the ADF&G. They use information on total catch and total pot lifts collected by the Crab Observer Program during crab fisheries to estimate crab bycatch as a function of retained catch (Gaeuman 2014).
5.3.2 Marine Mammal Bycatch Estimation Methods
The marine mammal bycatch estimates for federally managed groundfish fisheries in this report are provided as an average annual estimate of bycatch based on five years of data: 2010-2014 for 2014, and 2011-2015 for 2015. The estimates also include bycatch that was observed in hauls that were not sampled for fish composition. For these events, the bycatch is observed, but the fishing effort in those hauls (i.e. groundfish weight landed) is undetermined. That is, the total catch weight landed is known, but the portion of catch that is groundfish cannot be determined. Therefore, the bycatch from those hauls is not extrapolated for effort. Rather, the bycatch is reported as the un-extrapolated number, with no associated CV.
Although marine mammal bycatch estimates presented here are based on North Pacific Observer Program data collected in the groundfish and halibut fisheries, there are also other sources of data on mortality and serious injury, such as stranding databases. See the Marine Mammal Stock Assessment Reports for more information.
5.3.3 Seabird Bycatch Estimation Methods
Annual estimates of seabird bycatch in the groundfish fisheries are derived in the Catch Accounting System using the same methods as other non-target species as described in Cahalan et al. 2014. However, the Catch Accounting System uses only the standard observer sample information. Additional seabird bycatch occurs on trawl vessels outside the standard sample. Seabird bycatch estimates derived from the observer species composition sample are biased low because observer sampling focuses on catch from the cod end, while on trawl vessels, seabirds can strike net monitoring equipment, such as paravanes or third wires, strike the trawl warp cables, or get caught in the net wings. Seabird bycatch from these sources are not mixed in with the fish in the cod end and thus are not available to the observer during their species composition
37
sampling. In 2010, the Observer Program implemented standardized data recording measures for these additional sources of mortality. Although these data have been collected since 2010, the estimation procedures have not yet been developed. That work currently is in progress.
Estimates of uncertainty are currently not available for seabird bycatch. In addition, seabird estimates in this report may not precisely match estimates reported in other NMFS summary documents. Differences in how fisheries are split or combined may lead to extrapolations resulting in similar but not identical estimates. The different nature of observer data and fisheries catch information, coupled with the overall vast quantity of data, can result in changes and updates between estimate runs. This in turn can result in differing estimates.
5.4 Fish Bycatch
This section presents fish bycatch estimates in Alaska Region fisheries based on data from 2014 and 2015. This section also includes fishery bycatch ratios as well as species bycatch ratios for each year (see Table 5.4.1a, Table 5.4.1b, Table 5.4.2a, and Table 5.4.2b). Estimates are provided for 80 fish and invertebrate stocks (or species or species groups) in 2014, and 82 fish and invertebrate stocks (or species or species groups) in 2015.
Fishery bycatch estimates based on 2014 data ranged from 315,449 lb in the GOA Rockfish Pelagic Trawl Fishery to 68.92 M lb in the BSAI Non-Pollock Trawl Fishery. In 2015, the fishery bycatch amounts ranged from to 97,205 lb in the St. Matthew Island Blue King Crab Pot Fishery up to 59.63 M lb in the BSAI Catcher/Processor Longline Fishery.
Figures 5.1 through 5.4 show fishery and species bycatch ratios for the Alaska Region fisheries based on 2014 and 2015 respectively. Vessels participating in the GOA Sablefish Trawl Fishery were part of the Gulf of Alaska Rockfish Trawl Fishery; trips were designated as sablefish trawl when sablefish (Anoplopoma fimbria) was the predominantly retained species.
Fishery bycatch ratios for the Alaska Region ranged from 0.004 in the BSAI Pollock Trawl Fishery to 0.63 in the GOA Sablefish Trawl Fishery in 2014. In 2015, the fishery bycatch ratios ranged from 0.005 in the BSAI Pollock Trawl Fishery to 0.69 in the GOA Sablefish Trawl Fishery.

38
Figure 5.1 Alaska Region Fishery Bycatch Ratios for 2014 This figure includes fisheries for which fish bycatch estimates were available. See Section 1.3 for ratio definitions. BSAI = Bering Sea/Aleutian Islands, and GOA = Gulf of Alaska.

39
Figure 5.2 Alaska Region Species Bycatch Ratios for 2014 See Section 1.3 for ratio definitions. BSAI = Bering Sea/Aleutian Islands, and GOA = Gulf of Alaska.
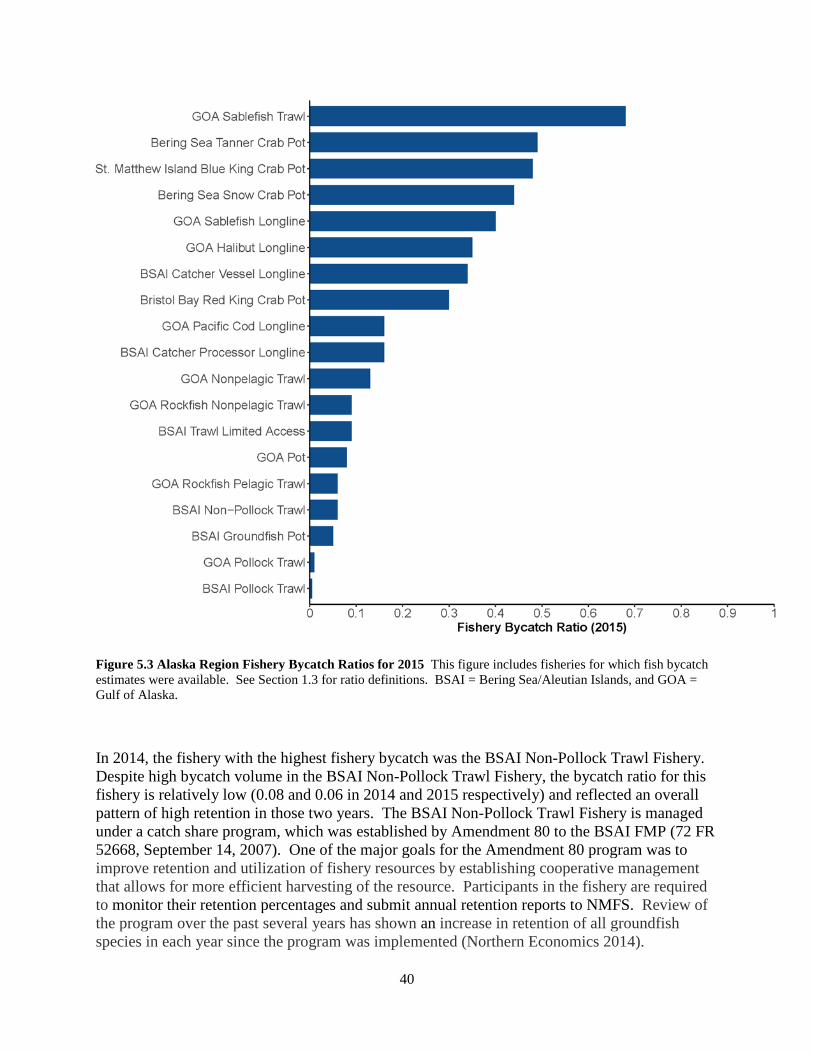
40
Figure 5.3 Alaska Region Fishery Bycatch Ratios for 2015 This figure includes fisheries for which fish bycatch estimates were available. See Section 1.3 for ratio definitions. BSAI = Bering Sea/Aleutian Islands, and GOA = Gulf of Alaska.
In 2014, the fishery with the highest fishery bycatch was the BSAI Non-Pollock Trawl Fishery. Despite high bycatch volume in the BSAI Non-Pollock Trawl Fishery, the bycatch ratio for this fishery is relatively low (0.08 and 0.06 in 2014 and 2015 respectively) and reflected an overall pattern of high retention in those two years. The BSAI Non-Pollock Trawl Fishery is managed under a catch share program, which was established by Amendment 80 to the BSAI FMP (72 FR 52668, September 14, 2007). One of the major goals for the Amendment 80 program was to improve retention and utilization of fishery resources by establishing cooperative management that allows for more efficient harvesting of the resource. Participants in the fishery are required to monitor their retention percentages and submit annual retention reports to NMFS. Review of the program over the past several years has shown an increase in retention of all groundfish species in each year since the program was implemented (Northern Economics 2014).

41
In 2015, the fishery with the highest bycatch estimates was the BSAI Catcher/Processor Longline Fishery. This is comparable to previous years (2011, 2012, and 2013) during which the BSAI Pacific Cod Longline Fishery had the highest bycatch estimates. Skates made up the majority of the bycatch in this fishery. In the BSAI management area, the skate complex is composed of big, longnose, Alaska, Aleutian, white-blotched, and other skates. The group is managed in aggregate and assigned an annual specification of overfishing level, acceptable biological catch (ABC), and total allowable catch (TAC). In both years, skates were closed to directed fishing, and skates were only caught incidentally while vessels were fishing for other species. There is some retention of large skates that are incidentally caught, which is indicative of their market value, but no directed fishing occurs. The TAC for skates in the BSAI was exceeded in 2015. However, exceeding the skate TAC does not pose a biological concern as the TAC for this group
Figure 5.4 Alaska Region Species Bycatch Ratios for 2015 See Section 1.3 for ratio definitions. BSAI = Bering Sea/Aleutian Islands, and GOA = Gulf of Alaska.

42
was set well below the ABC and the total catch estimates for skates did not approach the ABC (Ormseth 2016).
In both 2014 and 2015, the GOA Sablefish Trawl Fishery had the highest bycatch ratio. The GOA Sablefish Trawl Fishery has a low TAC and the target fishery is limited, so although the bycatch ratio is high for this fishery, the overall volume of bycatch is relatively low. The fishery is only open for directed fishing in the Central GOA by participants in the rockfish catch share program. Most of this catch share sablefish TAC is caught on the rockfish trips, which are the main component of this catch share program.
Although grenadiers comprised the greatest amount of bycatch in the GOA Sablefish Trawl Fishery, there is also a high amount of bycatch of grenadiers in the GOA Sablefish Longline and BSAI Catcher/Processor Longline Fisheries. Grenadiers are not a targeted species group, are not generally retained for sale or personal use, and have no current or foreseeable economic value. At the current level of catch, grenadiers are not subject to overfishing, not overfished, not approaching an overfished condition, and unlikely to become subject to overfishing or overfished in the absence of conservation and management measures. Grenadier are classified as an ecosystem component species, which acknowledges their role in the ecosystem and enables reporting and tracking of their bycatch amounts in the groundfish fisheries.
Crab fisheries in the BSAI are included for the first time in this update and the bycatch ratios in these fisheries are relatively high compared with other fisheries in Alaska. It is important to recognize that the crab fisheries are managed as a male-only fishery and have a minimum size limit so bycatch in the crab fisheries includes regulatory discards (female crab and male crab under size thresholds). The bycatch in these fisheries also includes other non-targeted species of crab. Fishermen may keep non-targeted crab species if they hold Individual Fisheries Quota (IFQ) for the species, or they may keep up to a certain amount of bycatch allowance if they do not have IFQ. Otherwise, the non-target crab must be discarded.
Bycatch ratios for the crab species (blue king crab, red king crab, snow crab, and southern Tanner crab) should be viewed with caution. The estimated bycatch in this update reflects bycatch for those species or stocks from both the groundfish and crab fisheries. However, these fisheries are managed over different time periods. The groundfish fisheries are managed by calendar year, so the bycatch estimates reflect activity from January 1 through December 31. However, the crab fisheries are managed by crab year from July 1 to June 30 to better reflect the crab commercial fishery seasons. As a result, the bycatch ratios presented here do not reflect a common time period.
5.5 Marine Mammal Bycatch
This update includes annual marine mammal bycatch estimates for 18 stocks (or species) for the five-year period terminating in 2014 (2010-2014) and for 19 stocks (or species) for the five-year period terminating in 2015 (2011-2015). In 2014, marine mammal bycatch was observed in eight individual federally managed groundfish fisheries, two federally managed groundfish fishery groups, and one state-managed fishery. In 2015, marine mammal bycatch was observed in thirteen individually managed groundfish fisheries, two federally managed groundfish

43
fisheries, and one state-managed fishery. Table 5.5.1 shows annual average marine mammal bycatch estimates for 2014, and table 5.5.2 shows annual average marine mammal bycatch estimates for 2015.
Bycatch estimates were numerically quite low for the majority of fisheries, although even a small amount of bycatch can have consequences if a stock’s potential biological removal (PBR) level is also low. Individuals from the western U.S. stock of Steller sea lions, which is listed as endangered, were the most frequently bycaught marine mammal (15.75 animals in 2015) followed by the Southeast Alaska stock of harbor porpoise (11.5 animals in 2015) and the Alaska stock of Dall’s porpoise (nine animals in 2015). Another 30 individuals from various stocks of cetaceans and pinnipeds were estimated to be bycaught in 2015. The SARs contain more information on marine mammal stocks, potential biological removal levels, and the significance of bycatch rates on those stocks.
The total annual estimated bycatch for 2015 (2011-2015) of 66.06 individuals is numerically comparable to the total annual estimated bycatch published in the first edition of the NBR for 2005 (2001-2005) of 62 individuals (NMFS 2011). The composition of the bycatch estimates, however, has varied since the first edition. This is partially due to changes in which state-managed fisheries were observed. For example, the Alaska Marine Mammal Observer Program observed the Kodiak Salmon Set Gillnet Fishery between 2001 and 2005, resulting in an annual estimated bycatch of 35.8 Gulf of Alaska harbor porpoise for 2005 (NMFS 2011). Similarly, the Alaska Marine Mammal Observer Program observed the Alaska Southeast Drift Gillnet Fishery between 2011 and 2013, which produced a bycatch estimate of nine Alaska Dall’s porpoise, 11.5 southeast Alaska harbor porpoise (no Gulf of Alaska harbor porpoise), and 5.5 central North Pacific humpback whales (NMFS 2016a). Within the federally managed groundfish fisheries, other notable differences since the first edition include an increase in the bycatch estimate of Eastern U.S. Steller sea lions from zero in 2005 to 5.19 in 2015, and an increase in the bycatch estimate of North Pacific sperm whales from zero in 2005 to 3.68 in 2015.
5.6 Sea Turtle Bycatch
No sea turtles were observed caught in 2014 or 2015 in Alaska Region fisheries under federal or joint federal/international management authority.
5.7 Seabird Bycatch
The NBR includes seabird bycatch estimates for 12 species (or species groups) summarized from observer data (Eich et al. 2016). (Observers identify seabirds to the species level whenever possible.) This report also includes seabird bycatch estimates for nine federally managed groundfish fisheries and one halibut fishery under joint federal/international management authority. In all other fisheries seabird bycatch was zero, based on estimates derived from standard observer species composition sampling. When NMFS completes its trawl seabird mortality project, NMFS may expand the list of fisheries with identified seabird bycatch.

44
Table 5.7.1 shows seabird bycatch estimates for nine Alaska Region federally managed groundfish fisheries (or fishery groups) and one halibut fishery under joint federal/international management authority for 2014. Bycatch estimates in these fisheries ranged from nine to 760 individuals, for a total of 2,367 estimated seabirds.
Table 5.7.2 shows seabird bycatch estimates for eight Alaska Region federally managed groundfish fisheries (or fishery groups) and one halibut fishery under joint federal/international management authority for 2015. Bycatch estimates in these fisheries ranged from 12 to 3,430 individuals, for a total of 5,919 estimated seabirds.
In each year, Northern fulmar (Fulmarus glacialis) was the most commonly caught seabird species and accounted for over half of the estimated annual seabird bycatch in 2015. Total Northern fulmar bycatch ranged from 760 birds for 2014 to 3,430 birds for 2015. Large inter-annual variation is the norm for seabird bycatch in Alaska fisheries. There were also large changes in Laysan albatross bycatch (ranging from 98 birds for 2014 to 218 birds for 2015) and shearwaters (ranging from 183 birds for 2014 to 377 birds for 2015).
Longline fisheries’ seabird bycatch accounted for roughly 88 percent of the overall estimated seabird bycatch each year. However, studies have shown that seabird bycatch numbers from trawl fisheries are biased low when based solely on the observer species composition samples, as with the numbers here (Fitzgerald et al. in preparation; and summarized in Eich et al. 2016). The AFSC has conducted research on additional sources of mortality for seabirds in the trawl fisheries and is currently preparing reports that address this issue. This research resulted in changes in observer responsibilities and supplemental sampling procedures, which, when applied to the trawl fleet, should result in improved estimates of seabird bycatch.
In 2014 and 2015, bycatch in longline fisheries was lower than the estimated 6,353 birds caught in the longline fisheries in 2005 (NMFS 2011), with an estimated 2,367 birds caught in 2014 and an estimated 5,919 birds caught in 2015. Bycatch in the longline fisheries has shown a marked decline beginning in 2002 due to the deployment of streamer lines as bird deterrents. Since then, annual bycatch has remained below 10,000 birds. The BSAI Catcher/Processor Longline Fisheries account for the vast majority of overall seabird bycatch, with primarily northern fulmars, gulls, and shearwaters being taken. This fishery typically does not take many albatross, although nearly all takes of the endangered short-tailed albatross (Phoebastria albatrus) since 1995 have been observed in this fleet.
In 2014 in the BSAI, one short-tailed albatross was observed incidentally hooked in the Pacific Cod Longline Fishery and two albatross were observed incidentally hooked in the Greenland Turbot Longline Fishery (both of these fisheries are included in the BSAI Catcher/Processor Longline Fisheries for this report). The short-tailed albatross recorded taken in the Pacific Cod Longline Fishery in 2014 was in the observer sample. However, only one of the two short-tailed albatross recorded taken in the Greenland Turbot Longline Fishery in 2014 was in the observer sample. When expanded by the CAS to all unsampled hooks in the haul and all unsampled events across fisheries, the estimated take was six short-tailed albatross for the Greenland Turbot Fishery and three short-tailed albatross for the Pacific Cod Longline Fishery;
45
thus, the estimated take across the BSAI Catcher/Processor Longline Fisheries was nine short-tailed albatross in 2014.
There was no further bycatch of the short-tailed albatross observed in the 2015 fisheries. For over 26 years, NOAA Fisheries has formally consulted with the U.S. Fish and Wildlife Service regarding the short-tailed albatross, and to date none of the incidental take limits have been reached within the specified periods.
In addition to the ESA-listed short-tailed albatross, NMFS is interested in the conservation of Laysan (Phoebastria immutabilis) and black-footed (Phoebastria nigripes) albatross. In 2014, there were 30 Laysan albatross and no black-footed albatross estimated for the BSAI Catcher/Processor Longline Fisheries. In 2015, there were 95 Laysan albatross and eight black-footed albatross estimated to be caught in the BSAI Catcher/Processor Longline Fisheries. The 2013 results for the Alaska Halibut Longline Fishery were the first available fleet-wide information from this fishery and confirmed that albatross bycatch does occur in this fishery. Alaska Halibut Longline Fishery bycatch of black-footed albatross was estimated as 33 birds in 2014 and no birds in 2015. In addition, Alaska Halibut Longline Fishery bycatch of Laysan albatross was estimated as no birds in 2014 and 19 birds in 2015. This compares to 53 black-footed albatross and 16 Laysan albatross in 2013 for this fishery. Inter-annual variability is common, and thus it is unknown whether these relatively low estimates of albatross bycatch in the Alaska Halibut Longline Fishery will continue.
In 2014 and 2015, there were 594 (243 in 2014 and 351 in 2015) black-footed albatross and 47 (24 in 2014 and 23 in 2015) Laysan albatross in the GOA Sablefish Longline Fisheries. These fisheries operate primarily on the continental shelf slope, which is also important albatross habitat.
NMFS will continue to track whether these patterns hold among these three major longline fisheries (Alaska halibut, Pacific cod, and sablefish) over time. More details about seabird interactions in fisheries in Alaska are available in Eich et al. 2016.
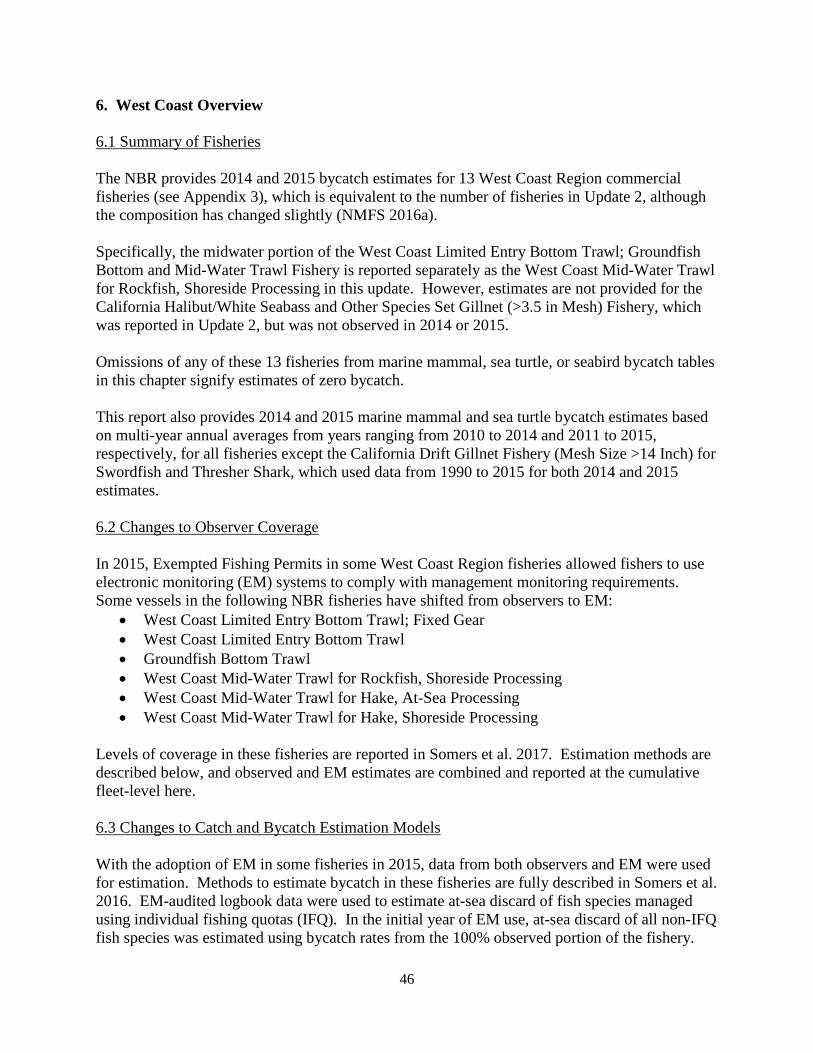
46
6. West Coast Overview
6.1 Summary of Fisheries
The NBR provides 2014 and 2015 bycatch estimates for 13 West Coast Region commercial fisheries (see Appendix 3), which is equivalent to the number of fisheries in Update 2, although the composition has changed slightly (NMFS 2016a).
Specifically, the midwater portion of the West Coast Limited Entry Bottom Trawl; Groundfish Bottom and Mid-Water Trawl Fishery is reported separately as the West Coast Mid-Water Trawl for Rockfish, Shoreside Processing in this update. However, estimates are not provided for the California Halibut/White Seabass and Other Species Set Gillnet (>3.5 in Mesh) Fishery, which was reported in Update 2, but was not observed in 2014 or 2015.
Omissions of any of these 13 fisheries from marine mammal, sea turtle, or seabird bycatch tables in this chapter signify estimates of zero bycatch.
This report also provides 2014 and 2015 marine mammal and sea turtle bycatch estimates based on multi-year annual averages from years ranging from 2010 to 2014 and 2011 to 2015, respectively, for all fisheries except the California Drift Gillnet Fishery (Mesh Size >14 Inch) for Swordfish and Thresher Shark, which used data from 1990 to 2015 for both 2014 and 2015 estimates.
6.2 Changes to Observer Coverage
In 2015, Exempted Fishing Permits in some West Coast Region fisheries allowed fishers to use electronic monitoring (EM) systems to comply with management monitoring requirements. Some vessels in the following NBR fisheries have shifted from observers to EM:
• West Coast Limited Entry Bottom Trawl; Fixed Gear • West Coast Limited Entry Bottom Trawl • Groundfish Bottom Trawl • West Coast Mid-Water Trawl for Rockfish, Shoreside Processing • West Coast Mid-Water Trawl for Hake, At-Sea Processing • West Coast Mid-Water Trawl for Hake, Shoreside Processing
Levels of coverage in these fisheries are reported in Somers et al. 2017. Estimation methods are described below, and observed and EM estimates are combined and reported at the cumulative fleet-level here.
6.3 Changes to Catch and Bycatch Estimation Models
With the adoption of EM in some fisheries in 2015, data from both observers and EM were used for estimation. Methods to estimate bycatch in these fisheries are fully described in Somers et al. 2016. EM-audited logbook data were used to estimate at-sea discard of fish species managed using individual fishing quotas (IFQ). In the initial year of EM use, at-sea discard of all non-IFQ fish species was estimated using bycatch rates from the 100% observed portion of the fishery.

47
Estimates from both the observed and EM portions of each fishery are combined and reported together here. Marine mammal bycatch in these fisheries was estimated based on observed interactions in the EM video. In all other fisheries, a five-year (or fewer if the fishery existed for less than five years) moving average was used, as in Update 2. However, Bayesian methods using all available data (i.e., more than five years) also are being explored and may be reported in future editions of the NBR.
Methods for marine mammal bycatch estimates remained mostly unchanged for all but the California Drift Gillnet Fishery (Mesh Size >14 Inch) for Swordfish and Thresher Shark, which are described in Caretta et al. 2017a. All other methods remain the same as those described in Update 2.
6.4 Fish Bycatch This section presents fish bycatch estimates in West Coast Region fisheries based on data from 2014 and 2015. This section includes fishery bycatch ratios as well as species bycatch ratios for each year.
6.4.1 Fish Bycatch Estimates for 2014 Fishery bycatch in 2014 ranged from 4,587 lb in the West Coast Mid-Water Trawl for Rockfish, Shoreside Processing Fishery to 7,126,092 lb in the Washington/Oregon/California Pink Shrimp Fishery. In addition, three fisheries are reported in terms of individuals (Table 6.4.1a). Figure 6.1 shows fishery bycatch ratios for 13 West Coast Region fisheries based on 2014 data. There is no bycatch ratio estimate for the California Drift Gillnet Fishery (Mesh Size > 14 Inch) for Swordfish and Thresher Shark, because bycatch is recorded as numbers rather than as pounds. Fish and invertebrate estimates (Table 6.4.1b) and bycatch ratios (Figure 6.2a and Figure 6.2b) are included for 377 West Coast Region species, stocks, and groups.
6.4.2 Fish Bycatch Estimates for 2015 Fishery bycatch estimates based on 2015 data ranged from 48,407 lb in the West Coast Mid-Water Trawl for Rockfish, Shoreside Processing Fishery to 5,855,763 lb in the Washington/Oregon/California Pink Shrimp Fishery. In addition, three fisheries are reported in terms of individuals (Table 6.4.2a). Figure 6.3 shows fishery bycatch ratios for 13 West Coast Region fisheries based on 2015 data. As with 2014, there is no bycatch ratio estimate for the California Drift Gillnet Fishery (Mesh Size > 14 Inch) for Swordfish and Thresher Shark, because bycatch is recorded as numbers rather than as pounds. Fish and invertebrate estimates (Table 6.4.2b) and bycatch ratios (Figures 6.4a and 6.4b) are included for 389 West Coast Region species, stocks, and groups.

48
Figure 6.1 West Coast Region Fishery Bycatch Ratios for 2014 This figure includes fisheries for which fish bycatch estimates were available. See Section 1.3 for ratio definitions.
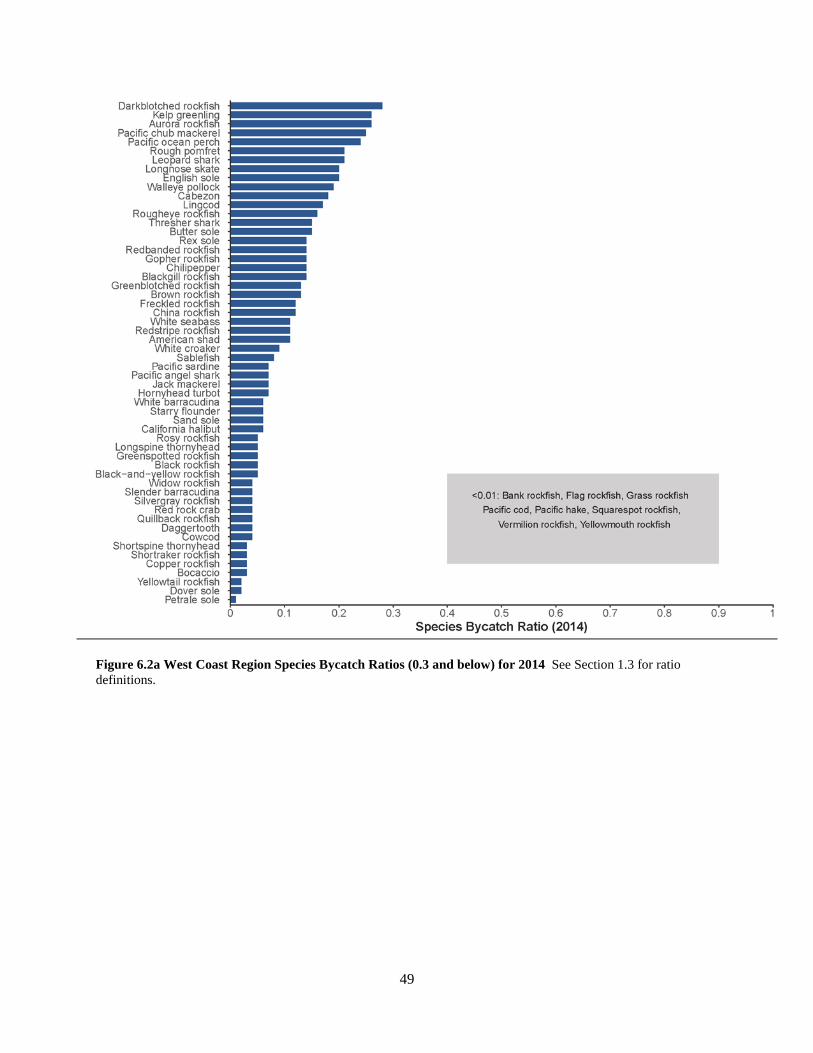
49
Figure 6.2a West Coast Region Species Bycatch Ratios (0.3 and below) for 2014 See Section 1.3 for ratio definitions.

50
Figure 6.2b West Coast Region Species Bycatch Ratios (above 0.3) for 2014 See Section 1.3 for ratio definitions.
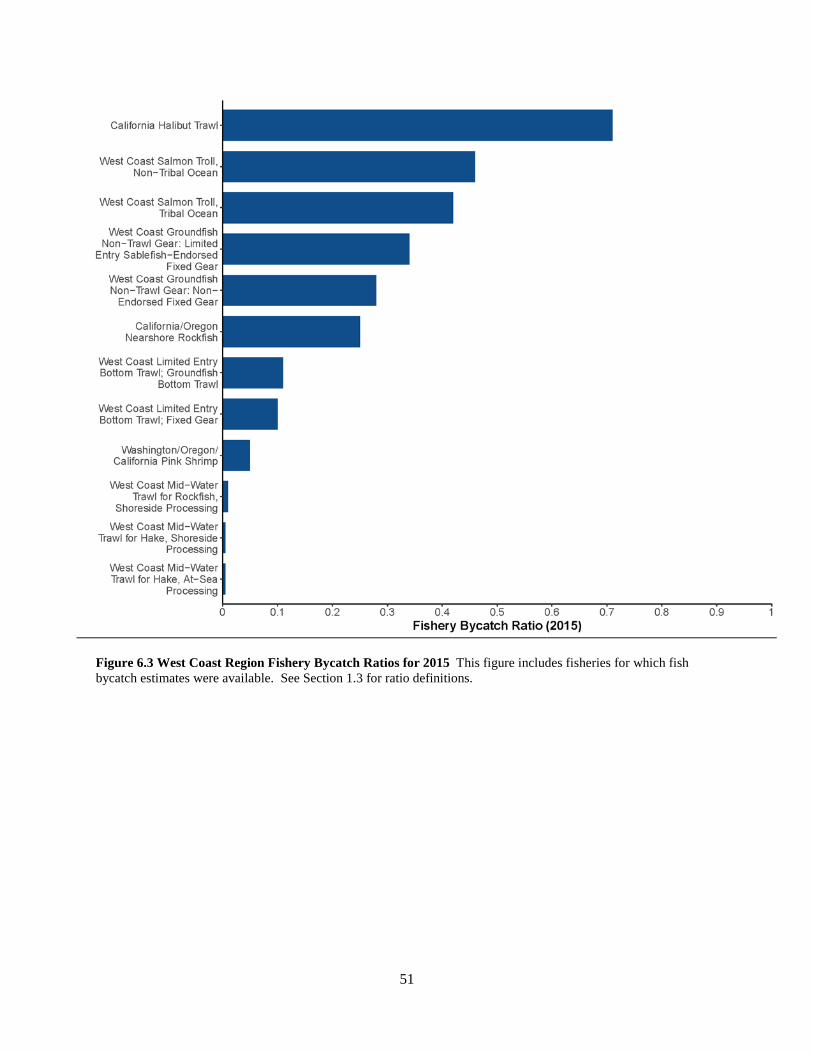
51
Figure 6.3 West Coast Region Fishery Bycatch Ratios for 2015 This figure includes fisheries for which fish bycatch estimates were available. See Section 1.3 for ratio definitions.

52
Figure 6.4a West Coast Region Species Bycatch Ratios (0.3 and below) for 2015 See Section 1.3 for ratio definitions.

53
Figure 6.4b West Coast Region Species Bycatch Ratios (above 0.3) for 2015 See Section 1.3 for ratio definitions.

54
6.4.3 Protected and/or Prohibited Fish Bycatch Estimates
Eulachon (Thaleichthys pacificus), green sturgeon (Acipenser medirostris), Pacific halibut, Dungeness crab (Metacarcinus magister), and five species of salmon (Chinook [Oncorhynchus tshawytscha], chum [O. keta], coho [O. kisutch], pink [O. gorbuscha], and sockeye [O. nerka]) as well as any unidentified salmonids are included in this report. All species are estimated using the same methods as described above, although the strata used for expansions differ to reflect biological characteristics of the species. In addition to weight estimates in the primary tables, estimates of number of individuals are provided in Tables 6.4.3a and 6.4.3b for 2014 and 2015, respectively, for all of these species except Pacific halibut and Dungeness crab. Further details can be found in the following reports: Gustafson et al. 2017, Jannot et al. 2017, Lee et al. 2017, and Somers et al. 2015.
6.4.4 Discussion
The rankings of fisheries by bycatch weight were consistent in 2014 and 2015 for those fisheries reporting both bycatch and landings in weight. Although fishery bycatch ratios were lowest in midwater trawl fisheries, the bycatch rate in the rockfish portion of the fleet increased from 2014 to 2015. Specifically, bycatch in the West Coast Mid-Water Trawl for Rockfish, Shoreside Processing Fishery increased tenfold from 2014 to 2015, reflecting increased effort and landings in the fishery. However, this fishery still had the lowest amount of total bycatch of the West Coast fisheries that measure bycatch by weight in this report. The greatest amount of total bycatch in both years occurred in the Washington/Oregon/California Pink Shrimp Fishery. For unclear reasons, 2014 was a year of high bycatch in the shrimp fishery, and its bycatch decreased by more than 1.3 M lb of bycatch in 2015. The California Halibut Trawl Fishery had the highest fishery bycatch ratios at 0.76 in 2014 and 0.71 in 2015; however, 78% of bycatch in 2014 and 47% in 2015 consisted of Dungeness crab. Bycatch ratios in the California Halibut Trawl Fishery have shown a decreasing trend since a near-historic high of 0.80 in 2012.
The California Drift Gillnet Fishery reports bycatch in terms of individuals and landings in terms of pounds. Bycatch decreased from 1,647 fish in 2014 to 649 fish in 2015 due primarily to lower effort in 2015. The salmon troll fisheries report both bycatch and landings in terms of individual salmon. In the West Coast Salmon Troll, Tribal Ocean Fishery, bycatch decreased from 55,900 fish in 2014 to 46,700 fish in 2015. However, landings decreased by almost half from 2014 to 2015, which increased the fishery bycatch ratio from 0.32 in 2014 to 0.42 in 2015. The West Coast Salmon Troll, Non-Tribal Ocean Fishery also had decreasing bycatch amounts from 2014 to 2015 (from 290,500 to 234,500 fish), but landings decreased substantially from 2014 to 2015, increasing the fishery bycatch ratio from 0.40 in 2014 to 0.46 in 2015.
55
6.5 Marine Mammal Bycatch
Tables 6.5.1 and 6.5.2 show 2014 and 2015 annual average marine mammal bycatch estimates, respectively. Any fisheries not listed had an estimate of zero killed or seriously injured marine mammals.
In 2014 and 2015, the California Drift Gillnet Fishery (Mesh Size >14 Inch) for Swordfish and Thresher Shark had the greatest total number of bycaught marine mammal individuals (34.5 and 41.4, respectively). In both years, short-beaked common dolphins and California sea lions comprised large amounts of the bycatch. The West Coast Limited Entry Bottom Trawl; Groundfish Bottom Trawl Fishery had the second greatest amount of marine mammal bycatch: 20 individuals in both years, with more than half of these being Steller and California sea lions. In 2015, the California Halibut Trawl Fishery also bycaught 15 California sea lions. In both years, six of the 13 reported fisheries were estimated to have zero marine mammal bycatch.
The Marine Mammal Stock Assessment Reports contain more information on the status of these stocks (Caretta et al. 2017b).
6.6 Sea Turtle Bycatch
Tables 6.6.1 and 6.6.2 show 2014 and 2015 sea turtle bycatch estimates, respectively. Any fisheries not listed had an estimate of zero bycaught sea turtles. The California Drift Gillnet Fishery (Mesh Size >14 Inch) for Swordfish and Thresher Shark is the only West Coast Region fishery to have estimates of sea turtle bycatch. For both 2014 and 2015, less than one leatherback and loggerhead sea turtle were estimated to be bycaught.

56

57

58
6.7 Seabird Bycatch
Tables 6.7.1 and 6.7.2 show 2014 and 2015 seabird bycatch estimates, respectively. Five fisheries in 2014 and seven fisheries in 2015 had estimates of zero bycaught seabirds. In 2014, the greatest amount of seabird bycatch was estimated in the California/Oregon Nearshore Rockfish Fishery, comprising 58 Brandt’s cormorants, followed by 44 seabirds (primarily shearwaters) in the Washington/Oregon/California Pink Shrimp Fishery. Four fisheries in 2014 had an estimated seabird bycatch of four or fewer individuals. In 2015, the greatest estimate of seabird bycatch, 82 individuals, occurred in the West Coast Groundfish Non-Trawl Gear: Limited Entry Sablefish-Endorsed Fixed Gear Fishery, comprised of 34 black-footed albatross and 34 shearwaters. Four other fisheries had estimates of between 13 and 30 individuals in 2015.

59
7. Pacific Islands Overview
7.1 Summary of Fisheries
Bycatch estimates are provided for Hawaii Deep-Set and Shallow-Set Pelagic Longline Fisheries, and the American Samoa Deep-Set Pelagic Longline Fishery in the Pacific Islands Region (see Appendix 3). The deep-set fisheries primarily target tuna, while the shallow-set fishery targets swordfish. These fisheries represented 88 percent of the Pacific Island Region pelagic landings. These are the same fisheries covered in the NBR First Edition Update 2 (NMFS 2016a). Fish bycatch estimates are for 2014 and 2015. Marine mammal estimates are based on multi-year annual averages from years ranging from 2010 to 2015 for the Hawaii fisheries and annual estimates for the American Samoa fishery. This report also provides sea turtle and seabird bycatch estimates for 2014 and 2015. This summary uses the date the vessel returns to port (arrival date) as the date to document the bycatch.
7.2 Changes to Observer Coverage
There have been no substantial changes to longline observer coverage. In 2014 and 2015, annual coverage ranged from 20.6 to 20.8 percent for the Hawaii Deep-Set Fishery and 19.4 to 22.0 percent in the American Samoa Deep-Set Fishery. Annual coverage in the Hawaii Shallow-Set Fishery remained at 100 percent.
7.3 Changes to Catch and Bycatch Estimation Methods
There have been no changes by NMFS in bycatch estimation methods for fish, marine mammals, sea turtles, and seabirds since Update 2 (NMFS 2016a). For the deep-set fisheries with less than 100 percent observer coverage, NMFS expands the observed bycatch using the observer coverage rate to estimate total interactions. For a detailed description of the bycatch estimation methods used in the deep-set fisheries, see the U.S. National Bycatch Report, First Edition (NMFS 2011).
7.4 Fish Bycatch
This section presents fish bycatch estimates in Pacific Island Region fisheries based on data from 2014 and 2015. This section also includes fishery bycatch ratios as well as species bycatch ratios for each year.
7.4.1 Fish Bycatch Estimates for 2014
Fishery bycatch estimates based on 2014 data were 10.94 M lb for the Hawaii Deep-Set Fishery, 604,251 lb for the Hawaii Shallow-Set Fishery and 752,135 lb for the American Samoa Deep-Set Fishery (Table 7.4.1a). Fishery bycatch ratios were 0.31, 0.16, and 0.14, respectively, for the Hawaii Deep-Set and Shallow-Set Longline Fisheries, and American Samoa Deep-Set Longline Fishery. Pelagic longline observers recorded the condition of bycatch species upon release from the vessel. If the definition of bycatch used for the NBR (see Section 1.1) distinguished between live and dead discarded catch, the bycatch estimates and ratios for these three fisheries would be lower. If bycatch was defined as species that are dead when

60
discarded, then fishery bycatch estimates were 2.46 M lb for the Hawaii Deep-Set Fishery, 138,482 lb for the Hawaii Shallow-Set Fishery and 276,182 lb for the American Samoa Deep-Set Longline Fishery (Table 7.5.1a). The corresponding fishery bycatch ratios considering dead bycatch would be 0.07, 0.04, and 0.05 (Figure 7.1).
Fish bycatch estimates in 2014 included 70 Pacific Island Region stocks (Table 7.4.1b). Landings were available for 18 of the 70 stocks. The 18 stocks had bycatch ratios that ranged from less than 0.01 to 1.0. Twelve of the 18 stocks had bycatch ratios less than or equal to 0.15. Four stocks (blue shark [Prionace glauca], oceanic white-tip shark [Carcharhinus longimanus], silky shark [Carcharhinus falciformis], and longnose lancetfish [Alepisaurus ferox]) had bycatch ratios of greater than 0.95 and represent species that were landed rarely in relation to the frequency of catch. Figure 7.2 illustrates fish bycatch ratios for 18 Pacific Island Region stocks
Figure 7.1 Pacific Islands Region Fishery Bycatch Ratios for 2014 This figure includes fisheries for which fish bycatch estimates were available. See Section 1.3 for ratio definitions.

61
based on 2014 data. (Species are referred to using FSSI stock names; FSSI stock names do not correspond to regional FMP names.)
7.4.2 Fish Bycatch Estimates for 2015
Fishery bycatch estimates (live and dead discards) based on 2015 data were 11.90 M lb for the Hawaii Deep-Set Pelagic Longline Fishery, 647,113 lb for the Hawaii Shallow-Set Pelagic Longline Fishery and 790,391 lb for the American Samoa Deep-Set Pelagic Longline Fishery (Table 7.4.2a).
Fishery bycatch ratios were 0.30, 0.19, and 0.13, respectively, for the Hawaii Deep-Set and Shallow-Set Pelagic Longline Fisheries, and American Samoa Deep-Set Pelagic Longline Fishery. If bycatch was defined as species that are dead when discarded, then fishery bycatch
Figure 7.2 Pacific Islands Region Species Bycatch Ratios (Total, i.e., Live + Dead, and Dead) for 2014 See Section 1.3 for ratio definitions.
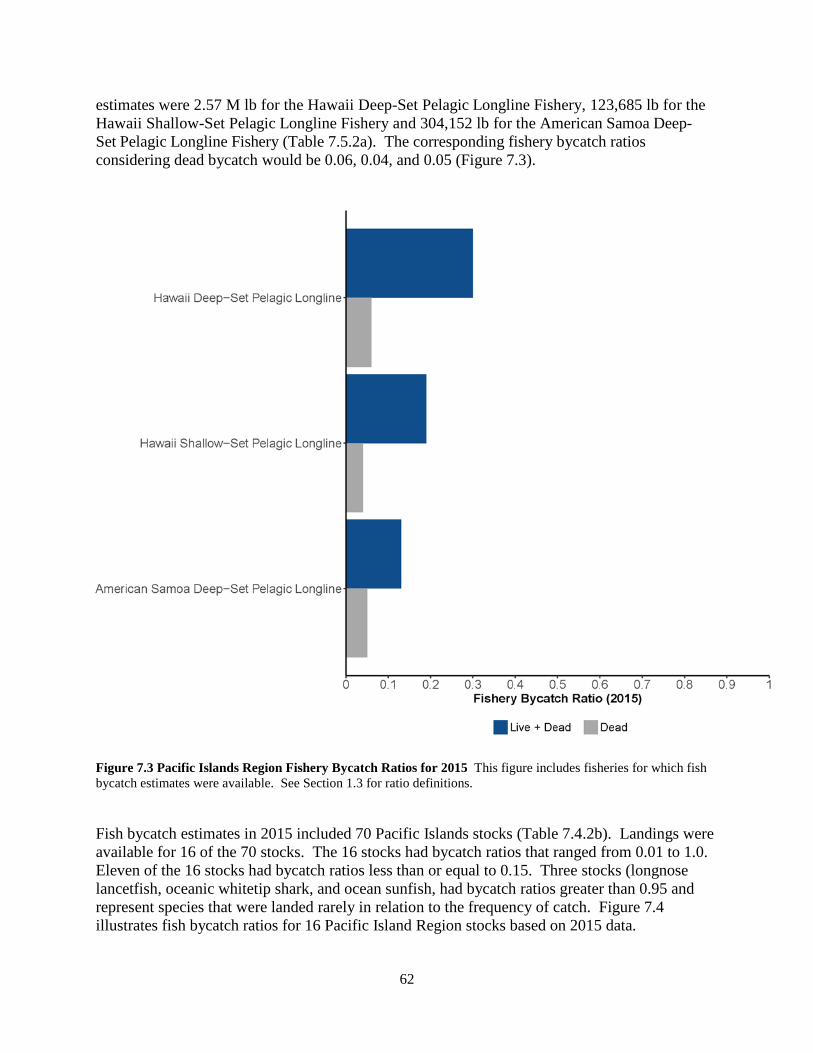
62
estimates were 2.57 M lb for the Hawaii Deep-Set Pelagic Longline Fishery, 123,685 lb for the Hawaii Shallow-Set Pelagic Longline Fishery and 304,152 lb for the American Samoa Deep-Set Pelagic Longline Fishery (Table 7.5.2a). The corresponding fishery bycatch ratios considering dead bycatch would be 0.06, 0.04, and 0.05 (Figure 7.3).
Fish bycatch estimates in 2015 included 70 Pacific Islands stocks (Table 7.4.2b). Landings were available for 16 of the 70 stocks. The 16 stocks had bycatch ratios that ranged from 0.01 to 1.0. Eleven of the 16 stocks had bycatch ratios less than or equal to 0.15. Three stocks (longnose lancetfish, oceanic whitetip shark, and ocean sunfish, had bycatch ratios greater than 0.95 and represent species that were landed rarely in relation to the frequency of catch. Figure 7.4 illustrates fish bycatch ratios for 16 Pacific Island Region stocks based on 2015 data.
Figure 7.3 Pacific Islands Region Fishery Bycatch Ratios for 2015 This figure includes fisheries for which fish bycatch estimates were available. See Section 1.3 for ratio definitions.

63
Figure 7.4 Pacific Islands Region Species Bycatch Ratios (Total, i.e., Live + Dead, and Dead) for 2015 See Section 1.3 for ratio definitions.
7.5 Marine Mammal Bycatch
The NBR includes marine mammal bycatch estimates for the three longline fisheries. NMFS disaggregated marine mammal estimates within the Exclusive Economic Zone (EEZ) and outside the EEZ for the Hawaii Deep-Set and Shallow-Set Pelagic Longline Fisheries. Annual averages over five years are provided for years terminating in 2014 (2010-2014) and 2015 (2011-2015) for the Hawaii Deep-Set and Shallow-Set Pelagic Longline Fisheries. All marine mammal estimates for the Pacific Islands Region include mortalities and serious injuries. Marine mammal stocks with the highest average annual bycatch estimates across the three fisheries included false killer whale, Risso’s dolphin, and bottlenose dolphin (Tursiops truncatus). For more information on estimation methods for false killer whales and pilot whales, see McCracken (2010).
64
The three pelagic longline fisheries caught an estimated 49.15 marine mammals in 2014 in all areas with 38.5 in the Hawaii Deep-Set Pelagic Longline Fishery, 8.65 in the Hawaii Shallow-Set Pelagic Longline Fishery and two in the American Samoa Deep-Set Pelagic Longline Fishery (Table 7.5.1). In 2015, an estimated 53.3 marine mammals were caught by the three pelagic longline fisheries, with 39.1 in the Hawaii Deep-Set Pelagic Longline Fishery, 9.2 in the Hawaii Shallow-Set Pelagic Longline Fishery and five in the American Samoa Deep-Set Pelagic Longline Fishery (Table 7.5.2).
7.6 Sea Turtle Bycatch
In 2014, the three pelagic longline fisheries caught an estimated 163 sea turtles in 2014 in all areas with 104 in the Hawaii Deep-Set Pelagic Longline Fishery, 33 in the Hawaii Shallow-Set Pelagic Longline Fishery and 26 in the American Samoa Deep-Set Pelagic Longline Fishery (Table 7.6.1). Four species of sea turtles (green, leatherback, olive ridley, and loggerhead) were caught, with leatherback sea turtles (58 individuals) representing the predominant species caught.
An estimated 147 sea turtles were caught by the pelagic longline fisheries in 2015 in all areas, with 100 in the Hawaii Deep-Set Pelagic Longline Fishery, 19 in the Hawaii Shallow-Set Pelagic Longline Fishery and 28 in the American Samoa Deep-Set Pelagic Longline Fishery (Table 7.6.2). Four species of sea turtles (green, leatherback, olive ridley, and loggerhead) were caught, with olive ridley (76 individuals) representing the predominant species caught.
7.7 Seabird Bycatch
Two of the three pelagic longline fisheries caught an estimated 333 seabirds in 2014. The Hawaii Deep-Set Pelagic Longline Fishery caught 261 seabirds, and the Hawaii Shallow-Set Pelagic Longline Fishery caught 72 seabirds (Table 7.7.1). The two fisheries caught an estimated total of 116 Laysan and 209 black-footed albatrosses and eight shearwaters. American Samoa Deep-Set Pelagic Longline Fishery experienced no observed seabird interactions in 2014.
An estimated 781 seabirds were caught by all three pelagic longline fisheries in 2015 in all areas, with 687 seabirds in the Hawaii Deep-Set Pelagic Longline Fishery, 81 seabirds in the Hawaii Shallow-Set Pelagic Longline Fishery, and 13 seabirds in the American Samoa Deep-Set Pelagic Longline Fishery in international waters (Table 7.7.2). The three fisheries caught an estimated 592 black-footed albatrosses, 162 Laysan albatrosses, 21 shearwaters, and 6 red-footed boobies.
Increased seabird bycatch in the Hawaii Deep-Set Pelagic Longline Fishery between 2014 and 2015 led the Western Pacific Fishery Management Council to convene an albatross workshop in November 2017 to review recent albatross interaction trends in the Hawaii longline fishery, explore possible factors influencing the trends, and evaluate albatross population impacts from fishery interactions. A NOAA Technical Memorandum summarizing this workshop should be published by 2019. For more information about seabird interactions, see the NMFS annual reports on seabird interactions and mitigation efforts in Hawaii longline fisheries.

65

66

67

68

69
8. References
AFSC (Alaska Fisheries Science Center). 2016. 2017 Observer Sampling Manual. Fisheries Monitoring and Analysis Division, North Pacific Groundfish Observer Program. AFSC, 7600 Sand Point Way N.E., Seattle, Washington, 98115. Available online at: https://www.afsc.noaa.gov/FMA/Manual_pages/MANUAL_pdfs/manual2017.pdf
Babcock, E.A., M. Barnette, J. Bohnsack, J.J. Isely, C. Porch, P.M. Richards, C. Sasso, and X. Zhang. 2018. Integrated Bayesian models to estimate bycatch of sea turtles in the Gulf of Mexico and southeastern U.S. Atlantic coast shrimp otter trawl fishery. NOAA Technical Memorandum NOAA NMFS-SEFSC-721: 47 p. Available online at: http://gulfcouncil.org/wp-content/uploads/D-5-Shrimp-fishery-turtle-bycatch-Tech-Memo-721-final.pdf
Blaylock J., S.E. Wigley, P.J. Rago, M. Mood, M.C. Palmer. 2013. A brief description of the Northeast Region fish and invertebrates discard estimation for the 2013 Update to the National Bycatch Report. U.S. Dept. of Commerce, Northeast Fish Sci Cent Ref Doc. 13-05; 38 p. Available online at: http://www.nefsc.noaa.gov/nefsc/publications/crd/crd1305/
Blaylock J., S.E. Wigley, P.J. Rago, M. Mood, M.C. Palmer. 2015. A brief description of Greater Atlantic Region fish and invertebrate discard estimation for the 2015 Update to the National Bycatch Report. U.S. Dept. of Commerce, Northeast Fish Sci Cent Ref Doc. 15-03; 59 p. DOI: 10.7289/V5BV7DJM. Available online at: http://www.nefsc.noaa.gov/publications/crd/crd1503/
Cahalan, J., J. Gasper, and J. Mondragon. 2014. Catch sampling and estimation in the federal groundfish fisheries off Alaska, 2015 edition. U.S. Dept. of Commerce, NOAA Tech. Memo. NMFS0AFSC-286, 46 p. Available online at: https://www.afsc.noaa.gov/Publications/AFSC-TM/NOAA-TM-AFSC-286.pdf
Carretta, J.V., K.A. Forney, E.M. Oleson, D.W. Weller, A.R. Lang, J. Baker, M.M. Muto, B. Hanson, A.J. Orr, H. Huber, M.S. Lowry, J. Barlow, J.E. Moore, D. Lynch, L. Carswell, L. and R.L. Brownell. 2017a. U.S. Pacific marine mammal stock assessments: 2016. NOAA Tech. Memo. NOAA-TM-NMFS-SWFSC-577. 414 p.
Carretta, J.V., J.E. Moore, and K.A. Forney. 2017b. Regression tree and ratio estimates of marine mammal, sea turtle, and seabird bycatch in the California drift gillnet fishery: 1990-2015. NOAA Technical Memorandum, NOAA-TM-NMFS-SWFSC-568. 83 p. doi:10.7289/V5/TM-SWFSC-568
Chen, Y., Y. Jiao, and L. Chen. 2003. Developing robust frequentist and Bayesian fish stock assessment methods. Fish and Fisheries 4:103-120.

70
Eich, A.M., K.R. Mabry, S.K. Wright, and S.M. Fitzgerald. 2016. Seabird Bycatch and Mitigation Efforts in Alaska Fisheries Summary Report: 2007 through 2015. U.S. Dept. of Commerce., NOAA Tech. Memo. NMFS-F/AKR-12, 47 p. Available online at: https://www.fisheries.noaa.gov/resource/document/seabird-bycatch-and-mitigation-efforts-alaska-fisheries-2007-through-2015
Fissel, B., M. Dalton, R. Felthoven, B. Garber-Yonts, A. Haynie, S. Kasperski, J. Lee, D. Lew, A. Santos, C. Seung, and K. Sparks. 2016. Stock Assessment and Fishery Evaluation Report for the Groundfish Fisheries of the Gulf of Alaska and Bering Sea/Aleutian Islands Area. Available at: https://www.afsc.noaa.gov/refm/docs/2016/economic.pdf
Fitzgerald, S.M., K.D. Dietrich, and A. Wicklund. In prep. Seabird bycatch in Alaska trawl fisheries – A comparison of observer sampling protocols. Unpublished data available from NOAA Fisheries Alaska Fisheries Science Center, [email protected].
Gaeuman, W.B. 2014. Summary of the 2013/2014 mandatory crab observer program database for the Bering Sea/Aleutian Islands commercial crab fisheries. Alaska Department of Fish and Game, Fishery Data Series No. 14-49, Anchorage.
Garrison, L.P., and L. Stokes. 2016. Estimated bycatch of marine mammals and sea turtles in the U.S. Atlantic pelagic longline fleet during 2014. NOAA Technical Memorandum NOAA NMFS-SEFSC-696, 61 p. Available online at: ftp://ftp.library.noaa.gov/noaa_documents.lib/NMFS/SEFSC/TM_NMFS_SEFSC/NMFS_SEFSC_TM_696.pdf
Gulak, S.J.B., M.P. Enzenauer, B.M. Deacy, and J.K. Carlson. 2017. Allometric relationships for species captured in longline fisheries from the Western North Atlantic. NOAA Technical Memorandum NMFS-SEFSC-705, 15 p. Available online at: https://www.st.nmfs.noaa.gov/Assets/Observer-Program/pdf/NMFS-SEFSC-705Allometric.pdf
Gustafson, R., Y.-W. Lee, E. Ward, K. Somers, V. Tuttle, J. Jannot, and J. McVeigh. 2017. Observed and estimated bycatch of eulachon in 2002–2015 U.S. West Coast Groundfish Fisheries. National Marine Fisheries Service, NWFSC, 2725 Montlake Blvd E., Seattle, WA 98112. Available online at: https://www.pcouncil.org/wp-content/uploads/2017/03/F5a_NMFS_Rpt4_ElectricOnly_Eulachon_bycatch_rpt_2017_Apr2017BB.pdf
Hatch, J.M. 2017. Comprehensive estimates of seabird-fishery interactions for the U.S. Northeast and Mid-Atlantic. Aquat Conserv. doi; 10.1002/aqc.2812
Hayes, S.A., E. Josephson, K. Maze-Foley, and P.E. Rosel, editors. 2017. U.S. Atlantic and Gulf of Mexico Marine Mammal Stock Assessments -- 2016. NOAA Tech Memo NMFS NE 241; 274 p. Available from: National Marine Fisheries Service, 166 Water Street, Woods Hole, MA 02543-1026, or online at: https://www.nefsc.noaa.gov/nefsc/publications/tm/tm241/
71
Leon, J.M., J. Shaishnikoff, E. Nichols, and M. Westphal. 2017. Annual management report for shellfish fisheries of the Bering Sea–Aleutian Islands Management Area, 2015/16. Alaska Department of Fish and Game, Fishery Management Report No. 17-10, Anchorage.
Li, Y. and Y. Jiao. 2013. Modeling seabird bycatch in the U.S. Atlantic pelagic longline fishery: fixed year effect versus random year effect. Ecological Modelling 260:36-41.
Lyssikatos, M.C., and L.P. Garrison. 2018. Common bottlenose dolphin (Tursiops truncatus) gillnet bycatch estimates along the US Mid-Atlantic Coast, 2007-2015. U.S. Dept. of Commerce, Northeast Fish Sci Cent Ref Doc. 18-07; 37 p. Available online at: https://www.nefsc.noaa.gov/publications/crd/crd1807/
Murray K.T. 2013. Estimated loggerhead and unidentified hard-shelled turtle interactions in Mid-Atlantic gillnet gear, 2007-2011. NOAA Tech Memo NMFS NE-225; 20 p. Available from: National Marine Fisheries Service, 166 Water Street, Woods Hole, MA 02543-1026, or online at: https://www.nefsc.noaa.gov/publications/tm/tm225/
Murray, K.T. 2015a. The importance of location and operational fishing factors in estimating and reducing loggerhead turtle (Caretta caretta) interactions in U.S. bottom trawl gear. Fish. Res. 172:440-451.
Murray, K.T. 2015b. Estimated loggerhead (Caretta caretta) interactions in the Mid-Atlantic scallop dredge fishery, 2009-2014. U.S. Dept. of Commerce, Northeast Fish Sci Cent Ref Doc. 15-20; 15 p. Available online at: http://nefsc.noaa.gov/publications/crd/crd1520/
Murray, K.T. 2018. Estimated bycatch of sea turtles in sink gillnet gear, 2012-2016. NOAA Tech Memo NMFS-NE-242, 20 p. Available online at: https://www.nefsc.noaa.gov/publications/tm/tm242/
NMFS. 2004. Evaluating bycatch: a national approach to standardized bycatch monitoring programs. U.S. Dep. Commer., NOAA Tech. Memo. NMFS-F/SPO-66, 108 p. Available online at: https://spo.nmfs.noaa.gov/content/tech-memo/evaluating-bycatch-national-approach-standardized-bycatch-monitoring-programs
NMFS. 2007. Final Amendment 2 to the Consolidated Atlantic Highly Migratory Species Fishery Management Plan. National Oceanic and Atmospheric Administration, National Marine Fisheries Service, Office of Sustainable Fisheries, Highly Migratory Species Management Division, Silver Spring, MD. Public Document. 726 p. Available online at: https://www.fisheries.noaa.gov/action/amendment-2-2006-consolidated-hms-fishery-management-plan-atlantic-shark-management-measures

72
NMFS. 2011. U.S. National Bycatch Report (W. A. Karp, L. L. Desfosse, S. G. Brooke, editors). U.S. Dept. of Commerce., NOAA Tech Memo NMFS-F/SPO-117E, 508 p.
NMFS. 2013a. U.S. National Bycatch Report First Edition Update 1 [L. R. Benaka, C. Rilling, E. E. Seney, and H. Winarsoo, Editors]. U.S. Dept. of Commerce., 57 p. Available online at: http://www.st.nmfs.noaa.gov/observer-home/first-edition-update-1
NMFS. 2013b. 2014 Annual Deployment Plan for Observers in the Groundfish and Halibut Fisheries off Alaska. National Oceanic and Atmospheric Administration, 709 West 9th Street. Juneau, Alaska 99802. Available online at: http://alaskafisheries.noaa.gov/sustainablefisheries/observers/adp2014.pdf.
NMFS 2014. 2015 Annual Deployment Plan for Observers in the Groundfish and Halibut Fisheries off Alaska. National Oceanic and Atmospheric Administration, 709 West 9th Street. Juneau, Alaska 99802. Available online at: https://alaskafisheries.noaa.gov/sites/default/files/final2015adp.pdf.
NMFS. 2015. North Pacific Groundfish and Halibut Observer Program 2014 Annual Report. National Oceanic and Atmospheric Administration, 709 West 9th Street. Juneau, Alaska 99802. 101 p. Available online at: https://alaskafisheries.noaa.gov/sites/default/files/annualrpt2014.pdf
NMFS. 2016a. U.S. National Bycatch Report First Edition Update 2 (L.R. Benaka, D. Bullock, J. Davis, E.E. Seney, and H. Winarsoo, Editors). U.S. Dept. of Commerce, 90 p. Available online at: http://www.st.nmfs.noaa.gov/observer-home/first-edition-update-2
NMFS (National Marine Fisheries Service). 2016b. North Pacific Groundfish and Halibut Observer Program 2015 Annual Report. National Oceanic and Atmospheric Administration, 709 West 9th Street. Juneau, Alaska 99802. Available online at: https://alaskafisheries.noaa.gov/sites/default/files/2015observerprogramannualreport.pdf.
NMFS. 2017. Final Amendment 5b to the 2006 Consolidated Atlantic Highly Migratory Species Fishery Management Plan. National Oceanic and Atmospheric Administration, National Marine Fisheries Service, Office of Sustainable Fisheries, Highly Migratory Species Management Division, Silver Spring, MD, 470 p. Available online at: https://www.fisheries.noaa.gov/action/amendment-5b-2006-consolidated-hms-fishery-management-plan-atlantic-shark-management
Northern Economics, Inc. 2014. Five-Year Review of the Effects of Amendment 80. Prepared for North Pacific Fishery Management Council. October 2014. Available online at: https://alaskafisheries.noaa.gov/sites/default/files/amd805yrreview1014.pdf
73
Ormseth, O.A. 2016. Assessment of the skate stock complex in the Bering Sea and Aleutian Islands, in the Stock Assessment and Fishery Evaluation Report for the Groundfish Resources of the Bering Sea/Aleutian Islands Regions. Available online at: https://www.afsc.noaa.gov/REFM/Docs/2016/BSAIskate.pdf
Orphanides, C.D. and D.L. Palka. 2013. Analysis of harbor porpoise gillnet bycatch, compliance, and enforcement trends in the U.S. northwestern Atlantic, January 1999 to May 2010. Endanger Species Res. 20:251-269.
Scott-Denton, E., P.F. Cryer, M.R. Duffy, J.P. Gocke, M.R. Harrelson, D.L. Kinsella, J.M. Nance, J.R. Pulver, R.C. Smith, and J.A. Williams. 2012. Characterization of the U.S. Gulf of Mexico and South Atlantic penaeid and rock shrimp fisheries based on observer data. Marine Fisheries Review 74(4):1-26.
Scott-Denton, E., J.A. Williams and J.R. Pulver. 2014. Observer coverage of the 2014 Gulf of Mexico skimmer trawl fishery. NOAA Technical Memorandum NMFS-SEFSC-666, 27 p. Available online at: http://www.galvestonlab.sefsc.noaa.gov/publications/pdf/949.pdf
Sigourney, D.B., C.D. Orphanides, and J.M. Hatch. in press. Estimates of seabird bycatch in commercial fisheries off the east coast of the United States from 2015 to 2016. U.S. Dept. of Commerce, Northeast Fish Sci Cent Ref Doc.
Soldevilla, M.S., L.P. Garrison, E. Scott-Denton, and R.A. Hart. 2016. Estimation of bycatch mortality of marine mammals in the Gulf of Mexico shrimp otter trawl fishery during 2012 to 2014. NOAA Technical Memorandum NMFS-SEFSC-697, 47 p. Available online at: http://www.galvestonlab.sefsc.noaa.gov/publications/pdf/966.pdf
Somers, K.A., J.E. Jannot, Y.-W. Lee, J. McVeigh, and V. Tuttle. 2015. Observed and estimated total bycatch of salmon in the 2002-2014 U.S. west coast fisheries. West Coast Groundfish Observer Program. National Marine Fisheries Service, NWFSC, 2725 Montlake Blvd E., Seattle, WA 98112.
Somers, K.A., J. Jannot, Y.-W. Lee, N. Riley, V. Tuttle, and J. McVeigh. 2016. Estimated discard and catch of groundfish species in the 2015 U.S. West Coast fisheries. NOAA Fisheries, NWFSC Observer Program, 2725 Montlake Blvd E., Seattle, WA 98112. Available online at: https://www.nwfsc.noaa.gov/research/divisions/fram/observation/data_products/species_management.cfm
Somers, K.A., J.E. Jannot, V. Tuttle, and J. McVeigh. 2017. FOS coverage rates, 2002-2016. Last updated: May 2017. NOAA Fisheries, NWFSC Observer Program, 2725 Montlake Blvd E., Seattle, WA 98112. Available online at: http://www.nwfsc.noaa.gov/research/divisions/fram/observation/data_products/sector_products.cfm#ob

74
Tholke C., S.E. Wigley, M.C. Palmer, and M. Mood. 2017. A Brief Description of Greater Atlantic Region Fish and Invertebrate Discard Estimation for the National Bycatch Report First Edition Update 3. U.S. Dept. of Commerce, Northeast Fish Sci Cent Ref Doc. 17-12; 144 p. Available online at: https://www.nefsc.noaa.gov/publications/crd/crd1712/
Warden, M.L. 2011. Modeling loggerhead sea turtle (Caretta caretta) interactions with U.S. Mid-Atlantic bottom trawl gear for fish and scallops, 2005-2008. Biological Conservation, 144: 2202-2212.
Wigley, S.E., M.C. Palmer, J. Blaylock, and P.J. Rago. 2008. A brief description of the discard estimation for the National Bycatch Report. U.S. Dept. of Commerce, Northeast Fish Sci Cent Ref Doc. 08-02; 35 p. Available online at: http://www.nefsc.noaa.gov/publications/crd/crd0802/
Zhou, C., Y. Jiao, and J.A. Browder. In review. K-aggregated transformation of discrete distributions improves modeling count observations with excess ones in seabird bycatch. Submitted to Ecological Modelling.
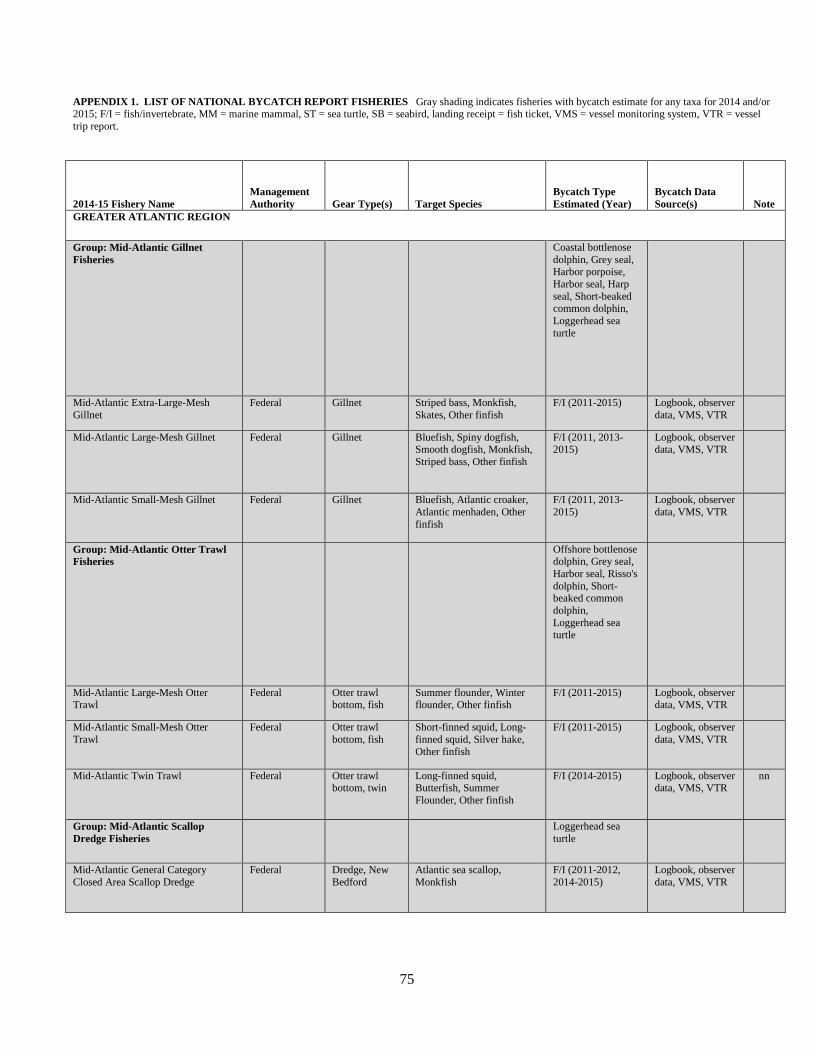
75
APPENDIX 1. LIST OF NATIONAL BYCATCH REPORT FISHERIES Gray shading indicates fisheries with bycatch estimate for any taxa for 2014 and/or 2015; F/I = fish/invertebrate, MM = marine mammal, ST = sea turtle, SB = seabird, landing receipt = fish ticket, VMS = vessel monitoring system, VTR = vessel trip report.
2014-15 Fishery Name Management Authority Gear Type(s) Target Species
Bycatch Type Estimated (Year)
Bycatch Data Source(s) Note
GREATER ATLANTIC REGION
Group: Mid-Atlantic Gillnet Fisheries
Coastal bottlenose dolphin, Grey seal, Harbor porpoise, Harbor seal, Harp seal, Short-beaked common dolphin, Loggerhead sea turtle
Mid-Atlantic Extra-Large-Mesh Gillnet
Federal Gillnet Striped bass, Monkfish, Skates, Other finfish
F/I (2011-2015) Logbook, observer data, VMS, VTR
Mid-Atlantic Large-Mesh Gillnet Federal Gillnet Bluefish, Spiny dogfish, Smooth dogfish, Monkfish, Striped bass, Other finfish
F/I (2011, 2013-2015)
Logbook, observer data, VMS, VTR
Mid-Atlantic Small-Mesh Gillnet Federal Gillnet Bluefish, Atlantic croaker, Atlantic menhaden, Other finfish
F/I (2011, 2013-2015)
Logbook, observer data, VMS, VTR
Group: Mid-Atlantic Otter Trawl Fisheries
Offshore bottlenose dolphin, Grey seal, Harbor seal, Risso's dolphin, Short-beaked common dolphin, Loggerhead sea turtle
Mid-Atlantic Large-Mesh Otter Trawl
Federal Otter trawl bottom, fish
Summer flounder, Winter flounder, Other finfish
F/I (2011-2015) Logbook, observer data, VMS, VTR
Mid-Atlantic Small-Mesh Otter Trawl
Federal Otter trawl bottom, fish
Short-finned squid, Long-finned squid, Silver hake, Other finfish
F/I (2011-2015) Logbook, observer data, VMS, VTR
Mid-Atlantic Twin Trawl Federal Otter trawl bottom, twin
Long-finned squid, Butterfish, Summer Flounder, Other finfish
F/I (2014-2015) Logbook, observer data, VMS, VTR
nn
Group: Mid-Atlantic Scallop Dredge Fisheries
Loggerhead sea turtle
Mid-Atlantic General Category Closed Area Scallop Dredge
Federal Dredge, New Bedford
Atlantic sea scallop, Monkfish
F/I (2011-2012, 2014-2015)
Logbook, observer data, VMS, VTR
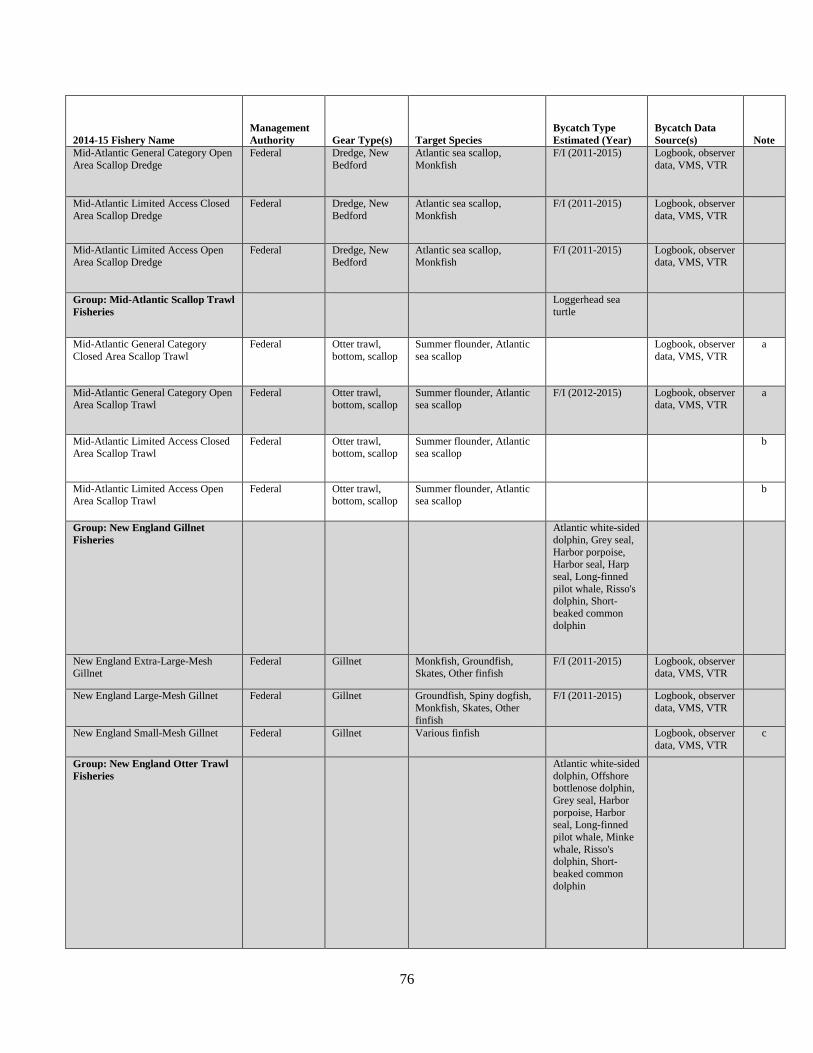
76
2014-15 Fishery Name Management Authority Gear Type(s) Target Species
Bycatch Type Estimated (Year)
Bycatch Data Source(s) Note
Mid-Atlantic General Category Open Area Scallop Dredge
Federal Dredge, New Bedford
Atlantic sea scallop, Monkfish
F/I (2011-2015) Logbook, observer data, VMS, VTR
Mid-Atlantic Limited Access Closed Area Scallop Dredge
Federal Dredge, New Bedford
Atlantic sea scallop, Monkfish
F/I (2011-2015) Logbook, observer data, VMS, VTR
Mid-Atlantic Limited Access Open Area Scallop Dredge
Federal Dredge, New Bedford
Atlantic sea scallop, Monkfish
F/I (2011-2015) Logbook, observer data, VMS, VTR
Group: Mid-Atlantic Scallop Trawl Fisheries
Loggerhead sea turtle
Mid-Atlantic General Category Closed Area Scallop Trawl
Federal Otter trawl, bottom, scallop
Summer flounder, Atlantic sea scallop
Logbook, observer data, VMS, VTR
a
Mid-Atlantic General Category Open Area Scallop Trawl
Federal Otter trawl, bottom, scallop
Summer flounder, Atlantic sea scallop
F/I (2012-2015) Logbook, observer data, VMS, VTR
a
Mid-Atlantic Limited Access Closed Area Scallop Trawl
Federal Otter trawl, bottom, scallop
Summer flounder, Atlantic sea scallop
b
Mid-Atlantic Limited Access Open Area Scallop Trawl
Federal Otter trawl, bottom, scallop
Summer flounder, Atlantic sea scallop
b
Group: New England Gillnet Fisheries
Atlantic white-sided dolphin, Grey seal, Harbor porpoise, Harbor seal, Harp seal, Long-finned pilot whale, Risso's dolphin, Short-beaked common dolphin
New England Extra-Large-Mesh Gillnet
Federal Gillnet Monkfish, Groundfish, Skates, Other finfish
F/I (2011-2015) Logbook, observer data, VMS, VTR
New England Large-Mesh Gillnet Federal Gillnet Groundfish, Spiny dogfish, Monkfish, Skates, Other finfish
F/I (2011-2015) Logbook, observer data, VMS, VTR
New England Small-Mesh Gillnet Federal Gillnet Various finfish Logbook, observer data, VMS, VTR
c
Group: New England Otter Trawl Fisheries
Atlantic white-sided dolphin, Offshore bottlenose dolphin, Grey seal, Harbor porpoise, Harbor seal, Long-finned pilot whale, Minke whale, Risso's dolphin, Short-beaked common dolphin

77
2014-15 Fishery Name Management Authority Gear Type(s) Target Species
Bycatch Type Estimated (Year)
Bycatch Data Source(s) Note
New England Large-Mesh Haddock Separator Otter Trawl
Federal Otter trawls Haddock, Other finfish F/I (2011-2015) Logbook, observer data, VMS, VTR
d
New England Large-Mesh Otter Trawl
Federal Otter trawl bottom, fish
Monkfish, Goundfish, Skates, Other finfish
F/I (2011-2015) Logbook, observer data, VMS, VTR
New England Large-Mesh Ruhle Otter Trawl
Federal Otter trawls Groundfish F/I (2011, 2015) Logbook, observer data, VMS, VTR
d
New England Small-Mesh Otter Trawl
Federal Otter trawl, bottom, fish
Short-finned squid, Long-finned squid, Silver hake, Other finfish
F/I (2011-2015) Logbook, observer data, VMS, VTR
New England Small-Mesh Ruhle Trawl
Federal Otter trawls, bottom, fish
Haddock, Other finfish Logbook, observer data, VMS, VTR
nn
Group: New England Scallop Dredge Fisheries
New England General Category Closed Area Scallop Dredge
Federal Dredge, New Bedford
Atlantic sea scallop, Monkfish
F/I (2013) Logbook, observer data, VMS, VTR
New England General Category Open Area Scallop Dredge
Federal Dredge, New Bedford
Atlantic sea scallop, Monkfish
F/I (2011-2015) Logbook, observer data, VMS, VTR
New England Limited Access Closed Area Scallop Dredge
Federal Dredge, New Bedford
Atlantic sea scallop, Monkfish
F/I (2011-2015) Logbook, observer data, VMS, VTR
New England Limited Access Open Area Scallop Dredge
Federal Dredge, New Bedford
Atlantic sea scallop, Monkfish
F/I (2011-2015) Logbook, observer data, VMS, VTR
Group: New England Mid-Water Otter Trawl
MM (2014-2015) nn
New England Open Area Mid-Water Otter Trawl
Federal Otter trawl midwater
Atlantic herring, Atlantic mackerel, Other finfish
F/I (2011-2015), MM (2011-2013)
Logbook, observer data, VMS, VTR
New England Closed Area Mid-Water Trawl
Federal Otter trawl midwater
Atlantic herring, Atlantic mackerel, Other finfish
F/I (2014-2015) Logbook, observer data, VMS, VTR
nn
Ungrouped Fisheries (Greater Atlantic Region)
Mid-Atlantic Bottom Longline Federal Longline, bottom
Atlantic cod, Tilefish, Other finfish
F/I (2014-2015)
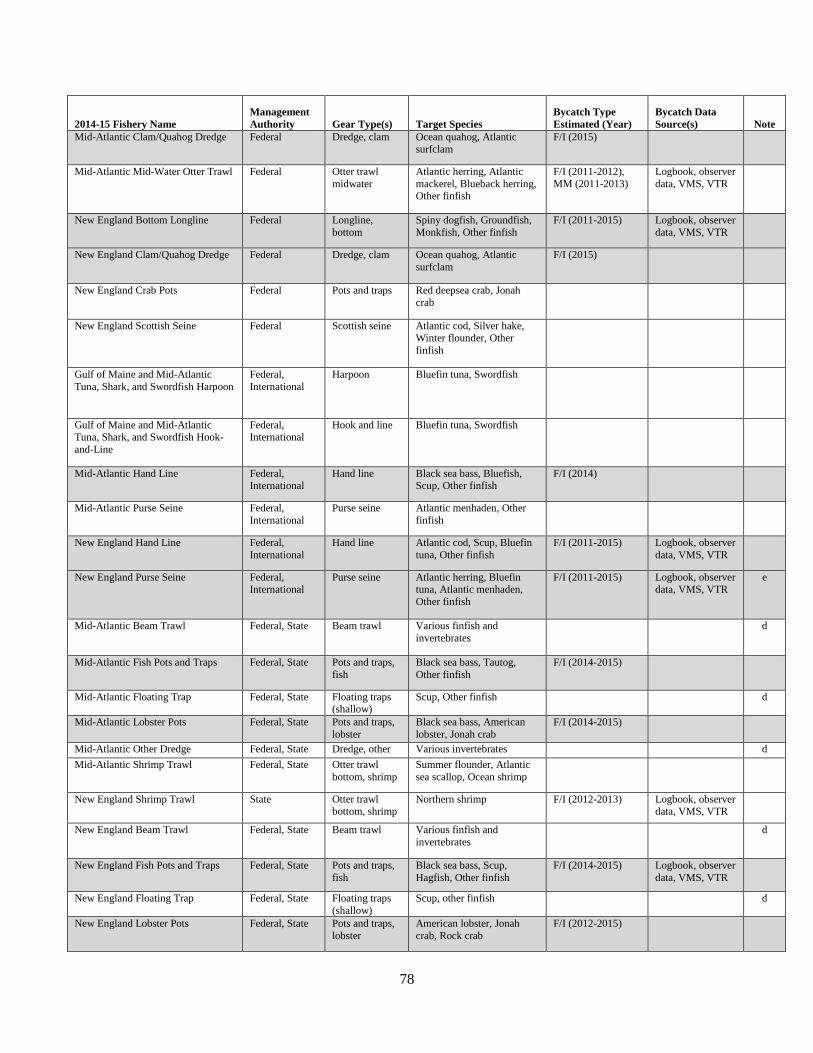
78
2014-15 Fishery Name Management Authority Gear Type(s) Target Species
Bycatch Type Estimated (Year)
Bycatch Data Source(s) Note
Mid-Atlantic Clam/Quahog Dredge Federal Dredge, clam Ocean quahog, Atlantic surfclam
F/I (2015)
Mid-Atlantic Mid-Water Otter Trawl Federal Otter trawl midwater
Atlantic herring, Atlantic mackerel, Blueback herring, Other finfish
F/I (2011-2012), MM (2011-2013)
Logbook, observer data, VMS, VTR
New England Bottom Longline Federal Longline, bottom
Spiny dogfish, Groundfish, Monkfish, Other finfish
F/I (2011-2015) Logbook, observer data, VMS, VTR
New England Clam/Quahog Dredge Federal Dredge, clam Ocean quahog, Atlantic surfclam
F/I (2015)
New England Crab Pots Federal Pots and traps Red deepsea crab, Jonah crab
New England Scottish Seine Federal Scottish seine Atlantic cod, Silver hake, Winter flounder, Other finfish
Gulf of Maine and Mid-Atlantic Tuna, Shark, and Swordfish Harpoon
Federal, International
Harpoon Bluefin tuna, Swordfish
Gulf of Maine and Mid-Atlantic Tuna, Shark, and Swordfish Hook-and-Line
Federal, International
Hook and line Bluefin tuna, Swordfish
Mid-Atlantic Hand Line Federal, International
Hand line Black sea bass, Bluefish, Scup, Other finfish
F/I (2014)
Mid-Atlantic Purse Seine Federal, International
Purse seine Atlantic menhaden, Other finfish
New England Hand Line Federal, International
Hand line Atlantic cod, Scup, Bluefin tuna, Other finfish
F/I (2011-2015) Logbook, observer data, VMS, VTR
New England Purse Seine Federal, International
Purse seine Atlantic herring, Bluefin tuna, Atlantic menhaden, Other finfish
F/I (2011-2015) Logbook, observer data, VMS, VTR
e
Mid-Atlantic Beam Trawl Federal, State Beam trawl Various finfish and invertebrates
d
Mid-Atlantic Fish Pots and Traps Federal, State Pots and traps, fish
Black sea bass, Tautog, Other finfish
F/I (2014-2015)
Mid-Atlantic Floating Trap Federal, State Floating traps (shallow)
Scup, Other finfish d
Mid-Atlantic Lobster Pots Federal, State Pots and traps, lobster
Black sea bass, American lobster, Jonah crab
F/I (2014-2015)
Mid-Atlantic Other Dredge Federal, State Dredge, other Various invertebrates d Mid-Atlantic Shrimp Trawl Federal, State Otter trawl
bottom, shrimp Summer flounder, Atlantic sea scallop, Ocean shrimp
New England Shrimp Trawl State Otter trawl bottom, shrimp
Northern shrimp F/I (2012-2013) Logbook, observer data, VMS, VTR
New England Beam Trawl Federal, State Beam trawl Various finfish and invertebrates
d
New England Fish Pots and Traps Federal, State Pots and traps, fish
Black sea bass, Scup, Hagfish, Other finfish
F/I (2014-2015) Logbook, observer data, VMS, VTR
New England Floating Trap Federal, State Floating traps (shallow)
Scup, other finfish d
New England Lobster Pots Federal, State Pots and traps, lobster
American lobster, Jonah crab, Rock crab
F/I (2012-2015)

79
2014-15 Fishery Name Management Authority Gear Type(s) Target Species
Bycatch Type Estimated (Year)
Bycatch Data Source(s) Note
Atlantic Blue Crab Trap/Pot State Pots and traps, blue crab
Blue crab
Chesapeake Bay Inshore Gillnet State Gillnet Various finfish
Delaware River Inshore Gillnet State Gillnet Various finfish
Gulf of Maine Herring and Atlantic Mackerel Stop Seine
State Stop seine Atlantic herring, Atlantic mackerel
Gulf of Maine Herring and Atlantic Mackerel Weir
State Weir Atlantic herring, Atlantic mackerel
Gulf of Maine Mussel State Dredge Blue mussel Gulf of Maine Urchin Dive, Hand/Mechanical Collection
State By hand, diving gear
Urchin
Long Island Sound Inshore Gillnet State Gillnet Various finfish
Mid-Atlantic Conch Pots and Traps State Pots and traps, conch
Whelk F/I (2014-2015) d
Mid-Atlantic Crab Pots State Pots and traps Red deepsea crab, Blue crab
Mid-Atlantic Crab Stop Seine State Stop seine Blue crab
Mid-Atlantic Crab Weir State Weir Blue crab Mid-Atlantic Eel Trap/Pot State Pots and traps,
eel American eel
Mid-Atlantic Hand Seine State Other seine Various finfish Mid-Atlantic Haul/Beach Seine State Haul seine Various finfish
Mid-Atlantic Oyster State Dredge Eastern oyster New England Conch Pots and Traps State Pots and traps,
conch Whelk F/I (2014-2015) d
New England Shrimp Pots and Traps State Pots and traps, shrimp
Shrimp d
Northeast Atlantic Finfish Aquaculture
State Aquaculture
Northeast Atlantic Shellfish Aquaculture
State Aquaculture
Rhode Island/South Massachusetts (to Monomoy Island) and New York Bight (Raritan and Lower New York Bays) Inshore Gillnet
State Gillnet Various finfish
Virginia Pound Net State Pound net Various finfish New England Hagfish Pots and Traps Pots and traps,
hagfish Hagfish Logbook, observer
data, VMS, VTR d, f
SOUTHEAST REGION
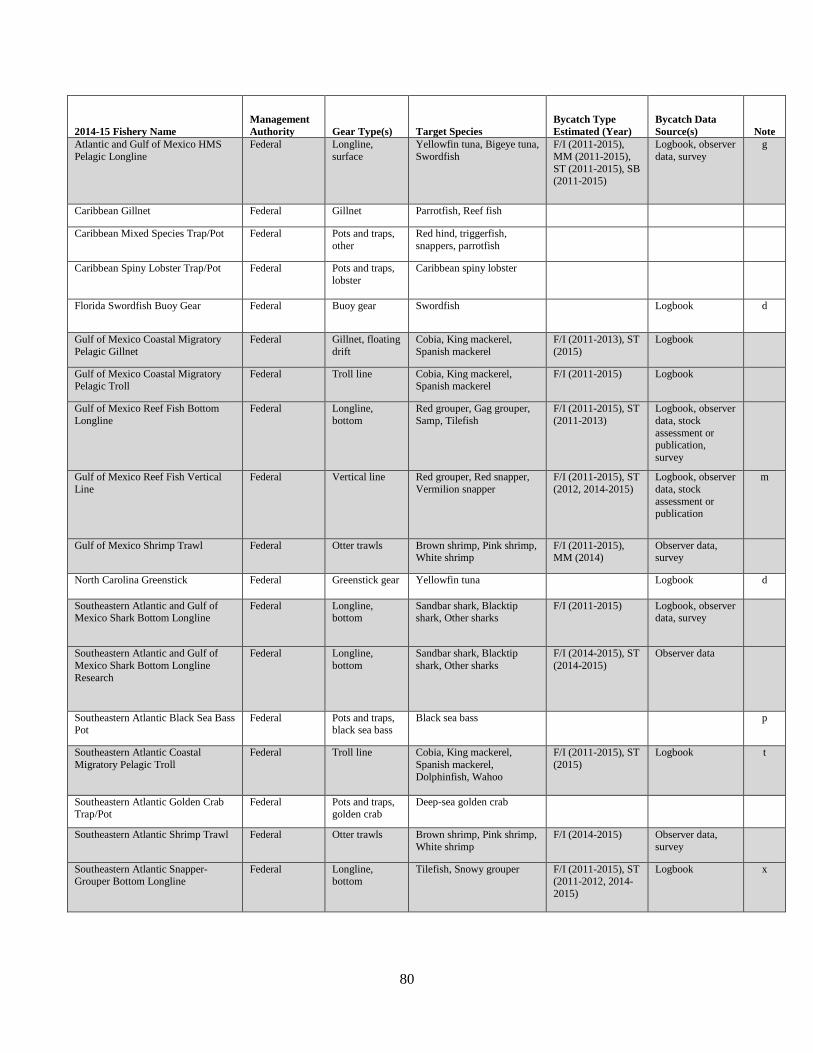
80
2014-15 Fishery Name Management Authority Gear Type(s) Target Species
Bycatch Type Estimated (Year)
Bycatch Data Source(s) Note
Atlantic and Gulf of Mexico HMS Pelagic Longline
Federal Longline, surface
Yellowfin tuna, Bigeye tuna, Swordfish
F/I (2011-2015), MM (2011-2015), ST (2011-2015), SB (2011-2015)
Logbook, observer data, survey
g
Caribbean Gillnet Federal Gillnet Parrotfish, Reef fish
Caribbean Mixed Species Trap/Pot Federal Pots and traps, other
Red hind, triggerfish, snappers, parrotfish
Caribbean Spiny Lobster Trap/Pot Federal Pots and traps, lobster
Caribbean spiny lobster
Florida Swordfish Buoy Gear Federal Buoy gear Swordfish Logbook d
Gulf of Mexico Coastal Migratory Pelagic Gillnet
Federal Gillnet, floating drift
Cobia, King mackerel, Spanish mackerel
F/I (2011-2013), ST (2015)
Logbook
Gulf of Mexico Coastal Migratory Pelagic Troll
Federal Troll line Cobia, King mackerel, Spanish mackerel
F/I (2011-2015) Logbook
Gulf of Mexico Reef Fish Bottom Longline
Federal Longline, bottom
Red grouper, Gag grouper, Samp, Tilefish
F/I (2011-2015), ST (2011-2013)
Logbook, observer data, stock assessment or publication, survey
Gulf of Mexico Reef Fish Vertical Line
Federal Vertical line Red grouper, Red snapper, Vermilion snapper
F/I (2011-2015), ST (2012, 2014-2015)
Logbook, observer data, stock assessment or publication
m
Gulf of Mexico Shrimp Trawl Federal Otter trawls Brown shrimp, Pink shrimp, White shrimp
F/I (2011-2015), MM (2014)
Observer data, survey
North Carolina Greenstick Federal Greenstick gear Yellowfin tuna Logbook d
Southeastern Atlantic and Gulf of Mexico Shark Bottom Longline
Federal Longline, bottom
Sandbar shark, Blacktip shark, Other sharks
F/I (2011-2015) Logbook, observer data, survey
Southeastern Atlantic and Gulf of Mexico Shark Bottom Longline Research
Federal Longline, bottom
Sandbar shark, Blacktip shark, Other sharks
F/I (2014-2015), ST (2014-2015)
Observer data
Southeastern Atlantic Black Sea Bass Pot
Federal Pots and traps, black sea bass
Black sea bass p
Southeastern Atlantic Coastal Migratory Pelagic Troll
Federal Troll line Cobia, King mackerel, Spanish mackerel, Dolphinfish, Wahoo
F/I (2011-2015), ST (2015)
Logbook t
Southeastern Atlantic Golden Crab Trap/Pot
Federal Pots and traps, golden crab
Deep-sea golden crab
Southeastern Atlantic Shrimp Trawl Federal Otter trawls Brown shrimp, Pink shrimp, White shrimp
F/I (2014-2015) Observer data, survey
Southeastern Atlantic Snapper-Grouper Bottom Longline
Federal Longline, bottom
Tilefish, Snowy grouper F/I (2011-2015), ST (2011-2012, 2014-2015)
Logbook x

81
2014-15 Fishery Name Management Authority Gear Type(s) Target Species
Bycatch Type Estimated (Year)
Bycatch Data Source(s) Note
Southeastern Atlantic Snapper-Grouper Vertical Line
Federal Vertical line Nassau grouper, Red snapper, Yellowtail snapper, Vermilion snapper
F/I (2011-2015), ST (2012)
Logbook y
Florida Spiny Lobster Trap/Pot Federal, State Pots and traps, lobster
Caribbean spiny lobster
Southeastern Atlantic and Gulf of Mexico Stone Crab Trap/Pot
Federal, State Pots and traps, stone crab
Florida stone crab o
Atlantic Menhaden State Purse seine Atlantic menhaden h Caribbean Haul/Beach Seine State Haul seines Jacks, snappers, baitfish
Caribbean Vertical Line Federal Vertical line Mahi, tunas, snappers, mackerels
d
Florida West Coast Sardine Purse Seine
State Purse seine, tarp
Sardine
Gulf of Mexico Blue Crab State Pots and traps, blue crab
Blue crab
Gulf of Mexico Cast Net State Cast net Brown shrimp, Pink shrimp, White shrimp, Mullet
j
Gulf of Mexico Coastal Gillnet State Gillnet King mackerel, Spanish mackerel
Gulf of Mexico Haul/Beach Seine State Haul seines; other seines
Striped mullet
Gulf of Mexico Marine Shrimp Butterfly Nets and Skimmer Trawls
State Butterfly net; trawl, skimmer
Brown shrimp, Pink shrimp, White shrimp
k
Gulf of Mexico Menhaden State Purse seine Atlantic menhaden l Gulf of Mexico Oyster State Dredge; tongs Eastern oyster North Carolina Inshore (Bays and Rivers) Gillnet
State Gillnet Striped bass, spot, Atlantic croaker, Bluefish, Weakfish
North Carolina Pound Net (Croaker, Weakfish)
State Pound net Atlantic croaker, Weakfish
North Carolina Southern Flounder Pound Net
State Pound net Southern flounder
Southeastern Atlantic Blue Crab State Pots and traps, blue crab
Blue crab q
Southeastern Atlantic Cast Net State Cast net Brown shrimp, Pink shrimp, White shrimp, Mullet
r
Southeastern Atlantic Coastal Gillnet (Including North Carolina)
State Gillnet Atlantic croaker, Bluefish, King mackerel, Spanish mackerel, Southern kingfish, Striped bass, Monkfish, Spot, Weakfish
F/I (2011-2015) s
Southeastern Atlantic Fish Trawl State Otter trawl bottom, fish
Butterfish, Squid u

82
2014-15 Fishery Name Management Authority Gear Type(s) Target Species
Bycatch Type Estimated (Year)
Bycatch Data Source(s) Note
Southeastern Atlantic Haul/Beach Seine (Including North Carolina)
State Haul seines; stop net
Atlantic croaker, Spot, Weakfish, Striped mullet, Brown shrimp, Pink shrimp, White shrimp
v
Southeastern Atlantic Ocean, Gulf of Mexico, Caribbean Shellfish Dive, Hand/Mechanical Collection
State By hand, diving gear
Clams, Oyster, Spiny lobster
Southeastern Atlantic Oyster State Dredge; tongs Eastern oyster d
Southeastern Atlantic Shrimp Butterfly Nets and Skimmer Trawls
State Butterfly net; trawl, skimmer
Brown shrimp, Pink shrimp, White shrimp
w
ALASKA REGION
Aleutian Islands/Eastern Bering Sea Atka Mackerel Trawl
Federal Otter trawl midwater
Atka mackerel F/I (2011-2013), MM (2011-2015), SB (2011-2012)
Landing receipt, observer data, production report
Bering Sea/Aleutian Islands Catcher Processor Longline
Federal Longline Pacific cod, Greenland halibut, sablefish
F/I (2014-2015), SB (2014-2015)
Landing receipt, observer data, production report
5
Bering Sea/Aleutian Islands Catcher Vessel Longline
Federal / International
Longline Sablefish, Pacific cod, Pacific halibut
F/I (2014-2015), SB(2014-2015)
Landing receipt, observer data, production report
12
Bering Sea/Aleutian Islands Flatfish Trawl Fisheries
Federal Otter trawl bottom, fish
Flathead sole,rock sole, yellowfin sole, arrowtooth flounder, sablefish, Greenland turbot, Kamchatka flounder
F/I (2011-2013), MM (2011-2015), SB (2011-2013)
Landing receipt, observer data, production report
Bering Sea/Aleutian Islands Greenland Turbot Longline
Federal Longline Greenland halibut F/I (2011-2013), MM (2011, 2015), SB (2011-2013)
Landing receipt, observer data, production report
Bering Sea/Aleutian Islands Halibut Longline
Federal / International
Longline Pacific halibut F/I (2013), MM (2011-2015)
Landing receipt, observer data, production report
2
Bering Sea/Aleutian Islands Jig Federal Hand line, auto jig
Pacific cod 4
Bering Sea/Aleutian Islands Non-Pollock Trawl
Federal Otter trawl bottom, fish
Flathead sole, rock sole, Atka mackerel, Pacific cod, yellowfin sole, Pacific ocean perch, arrowtooth flounder, sablefish, Greenland turbot, Kamchatka flounder
F/I (2014-2015), SB (2014-2015)
Landing receipt, observer data, production report
6
Bering Sea/Aleutian Islands Pacific Cod Longline
Federal Longline Pacific cod F/I (2011-2013), MM (2011-2015), SB (2011-2013)
Landing receipt, observer data, production report

83
2014-15 Fishery Name Management Authority Gear Type(s) Target Species
Bycatch Type Estimated (Year)
Bycatch Data Source(s) Note
Bering Sea/Aleutian Islands Pacific Cod Pot
Federal Pots and traps, fish
Pacific cod F/I (2011-2013), SB (2012-2013)
Landing receipt, observer data, production report
Bering Sea/Aleutian Islands Pacific Cod Trawl
Federal Otter trawl bottom, fish
Pacific cod F/I (2011-2013), MM (2011-2015)
Landing receipt, observer data, production report
Bering Sea/Aleutian Islands Pollock Trawl
Federal Otter trawl midwater
Pollock F/I (2011-2015), MM (2011-2015), SB (2011-2013)
Landing receipt, observer data, production report
Bering Sea/Aleutian Islands Groundfish Pot
Federal Pots and traps, fish
Pacific cod, sablefish F/I (2014-2015), SB (2014-2015)
Landing receipt, observer data, production report
7
Bering Sea/Aleutian Islands Rockfish Trawl
Federal Otter trawl bottom, fish
Pacific ocean perch F/I (2011-2013), MM (2011-2015)
Landing receipt, observer data, production report
1
Bering Sea Aleutian Islands Sablefish Longline
Federal Longline Sablefish F/I (2011-2013), SB(2011-2013)
Landing receipt, observer data, production report
Bering Sea/Aleutian Islands Sablefish Pot
Federal Pots and traps, fish
Sablefish F/I (2011-2013) Landing receipt, observer data, production report
Bering Sea/Aleutian Islands Trawl Limited Access
Federal Otter trawl bottom, fish
Yellowfin sole, Pacific cod, Atka mackerel, Pacific ocean perch
F/I (2014-2015), SB (2014-2015)
Landing receipt, observer data, production report
8
Gulf of Alaska Flatfish Trawl Fisheries
Federal Otter trawl bottom, fish
Arrowtooth flounder, flathead sole, rex sole, deep water flatfish (Dover sole, Greenland halibut, deepsea sole), and shallow water flatfish (yellowfin sole, rock sole, and other flatfish)
MM (2011-2015), SB (2013)
Landing receipt, observer data, production report
Gulf of Alaska Pot Federal Pots and traps, fish
Pacific cod F/I (2011-2015), SB (2014-2015)
Landing receipt, observer data, production report
3
Gulf of Alaska Halibut Longline Federal / International
Longline Pacific halibut F/I (2014-2015), MM (2015), SB (2014-2015)
Landing receipt, observer data, production report
2

84
2014-15 Fishery Name Management Authority Gear Type(s) Target Species
Bycatch Type Estimated (Year)
Bycatch Data Source(s) Note
Gulf of Alaska Jig Federal / International
Hand line, auto jig
Pacific cod, Pacific halibut 11
Gulf of Alaska Nonpelagic Trawl Federal Otter trawl bottom, fish
Pacific cod, arrowtooth flounder, flathead sole, rex sole, deep water flatfish (Dover sole, Greenland halibut, deepsea sole), and shallow water flatfish (yellowfin sole, rock sole, and other flatfish)
F/I (2014-2015) Landing receipt, observer data, production report
9
Gulf of Alaska Pacific Cod Longline Federal Longline Pacific cod F/I (2011-2015), MM (2011-2015), SB (2011-2015)
Landing receipt, observer data, production report
Gulf of Alaska Pacific Cod Trawl Federal Otter trawl bottom, fish
Pacific cod F/I (2011-2013), MM (2011-2015)
Landing receipt, observer data, production report
Gulf of Alaska Pollock Trawl Federal Otter trawl midwater
Pollock F/I (2011-2015), MM (2015),
Landing receipt, observer data, production report
Gulf of Alaska Rockfish Nonpelagic Trawl
Federal Otter trawl bottom, fish
Pacific ocean perch, Northern rockfish, Pelagic shelf rockfish, dusky rockfish, Pacific cod, rougheye rockfish, shortraker rockfish, and thornyhead rockfish
F/I (2014-2015), SB (2014)
Landing receipt, observer data, production report
10
Gulf of Alaska Rockfish Pelagic Trawl
Federal Otter trawl midwater
Pacific ocean perch, Northern rockfish, Pelagic shelf rockfish, dusky rockfish, Pacific cod, rougheye rockfish, shortraker rockfish, and thornyhead rockfish
F/I (2014-2015) Landing receipt, observer data, production report
10
Gulf of Alaska Rockfish Trawl Federal Otter trawl bottom, fish, otter trawl midwater
Pacific ocean perch, Northern rockfish, Pelagic shelf rockfish, dusky rockfish, Pacific cod, rougheye rockfish, shortraker rockfish, and thornyhead rockfish
F/I (2011-2013), MM (2015), SB (2011-2012)
Landing receipt, observer data, production report
Gulf of Alaska Sablefish Longline Federal Longline Sablefish F/I (2011-2015), MM (2011-2015), SB (2011-2015)
Landing receipt, observer data, production report
Gulf of Alaska Sablefish Trawl Federal Otter trawl bottom, fish; otter trawl
Sablefish F/I (2011-2015) Landing receipt, observer data, production report

85
2014-15 Fishery Name Management Authority Gear Type(s) Target Species
Bycatch Type Estimated (Year)
Bycatch Data Source(s) Note
Bering Sea/Aleutian Islands Crab Pot Federal / State Pots Red king crab, blue king crab, golden king crab, snow crab, southern Tanner crab
13
Aleutian Islands Golden King Crab Pot
Federal / State Pots Golden king crab 14
Bering Sea Snow Crab Pot Federal / State Pots Snow crab F/I (2014-2015) Logbook, observer data
14
Bering Sea Tanner Crab Pot Federal / State Pots Southern Tanner crab F/I (2014-2015) Logbook, observer data
14
Bristol Bay Red King Crab Pot Federal / State Pots Red king crab F/I (2014-2015) Logbook, observer data
14
Norton Sound Red King Crab Pot Federal / State Pots Red king crab 15
Pribilof Islands Blue King Crab Pot Federal / State Pots Blue king crab 14
Pribilof Islands Golden King Crab Pot
Federal / State Pots Golden king crab 14
Pribilof Islands Red King Crab Pot Federal / State Pots Red king crab 14
St. Matthew Island Blue King Crab Pot
Federal / State Pots Blue king crab F/I (2014-2015) Logbook, observer data
14
Western Aleutian Islands Red King Crab Pot
Federal / State Pots Red king crab 14
Southeast Alaska Crab Pot State Pots Red king crab, golden king crab, southern Tanner crab, dungeness crab
16
Alaska Statewide Salmon Fisheries State Purse seine; other seine; gillnet, floating drift; gillnet, troll line, manual; troll line, electric; fish wheel; dip net; weir; terminal hatchery fish ladder / raceway
Sockeye salmon, coho salmon, chinook salmon, chum salmon, pink salmon, steelhead
MM (2012-2013) Observer data
Alaska Southeast Salmon Drift Gillnet
State Gillnet, floating drift
Sockeye salmon, coho salmon, chinook salmon, chum salmon, pink salmon, steelhead
MM (2012-2013) Observer data 17
Alaska Yakutat Salmon Set Gillnet State Gillnet Sockeye salmon, coho salmon, chinook salmon, chum salmon, pink salmon, steelhead
17
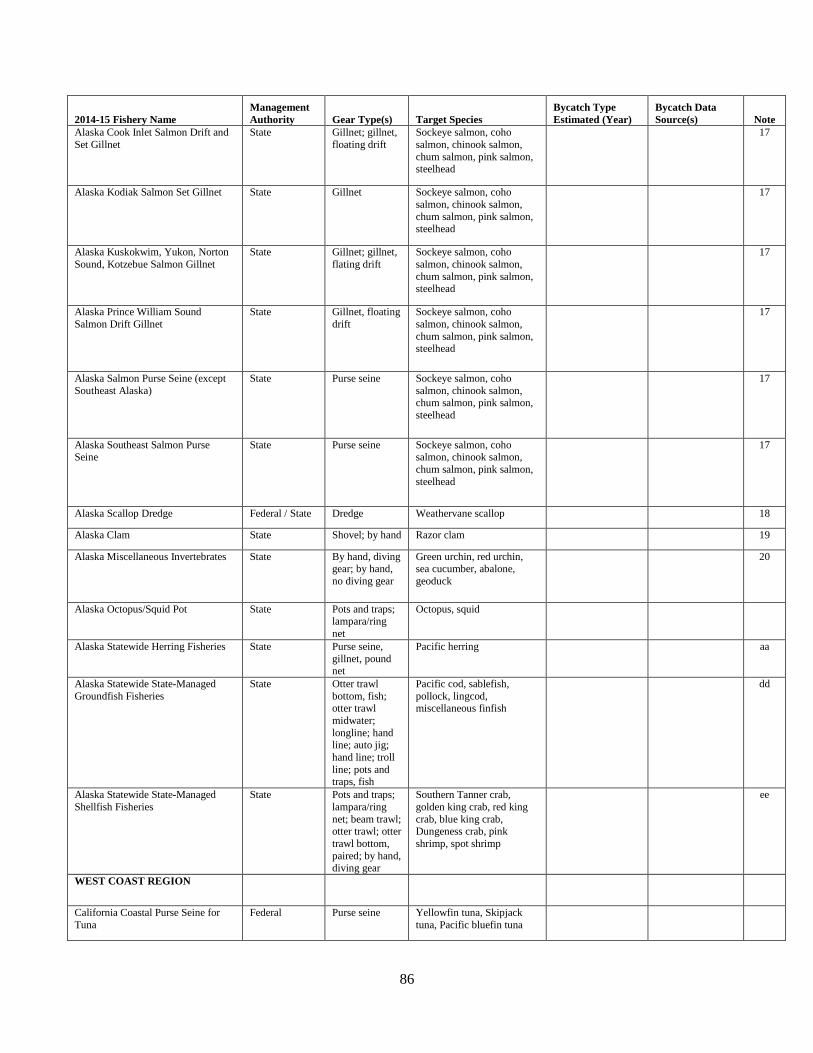
86
2014-15 Fishery Name Management Authority Gear Type(s) Target Species
Bycatch Type Estimated (Year)
Bycatch Data Source(s) Note
Alaska Cook Inlet Salmon Drift and Set Gillnet
State Gillnet; gillnet, floating drift
Sockeye salmon, coho salmon, chinook salmon, chum salmon, pink salmon, steelhead
17
Alaska Kodiak Salmon Set Gillnet State Gillnet Sockeye salmon, coho salmon, chinook salmon, chum salmon, pink salmon, steelhead
17
Alaska Kuskokwim, Yukon, Norton Sound, Kotzebue Salmon Gillnet
State Gillnet; gillnet, flating drift
Sockeye salmon, coho salmon, chinook salmon, chum salmon, pink salmon, steelhead
17
Alaska Prince William Sound Salmon Drift Gillnet
State Gillnet, floating drift
Sockeye salmon, coho salmon, chinook salmon, chum salmon, pink salmon, steelhead
17
Alaska Salmon Purse Seine (except Southeast Alaska)
State Purse seine Sockeye salmon, coho salmon, chinook salmon, chum salmon, pink salmon, steelhead
17
Alaska Southeast Salmon Purse Seine
State Purse seine Sockeye salmon, coho salmon, chinook salmon, chum salmon, pink salmon, steelhead
17
Alaska Scallop Dredge Federal / State Dredge Weathervane scallop 18
Alaska Clam State Shovel; by hand Razor clam 19
Alaska Miscellaneous Invertebrates State By hand, diving gear; by hand, no diving gear
Green urchin, red urchin, sea cucumber, abalone, geoduck
20
Alaska Octopus/Squid Pot State Pots and traps; lampara/ring net
Octopus, squid
Alaska Statewide Herring Fisheries State Purse seine, gillnet, pound net
Pacific herring aa
Alaska Statewide State-Managed Groundfish Fisheries
State Otter trawl bottom, fish; otter trawl midwater; longline; hand line; auto jig; hand line; troll line; pots and traps, fish
Pacific cod, sablefish, pollock, lingcod, miscellaneous finfish
dd
Alaska Statewide State-Managed Shellfish Fisheries
State Pots and traps; lampara/ring net; beam trawl; otter trawl; otter trawl bottom, paired; by hand, diving gear
Southern Tanner crab, golden king crab, red king crab, blue king crab, Dungeness crab, pink shrimp, spot shrimp
ee
WEST COAST REGION
California Coastal Purse Seine for Tuna
Federal Purse seine Yellowfin tuna, Skipjack tuna, Pacific bluefin tuna

87
2014-15 Fishery Name Management
Authority Gear Type(s) Target Species
Bycatch Type
Estimated
(Year) Bycatch Data
Source(s) Note
California Pelagic Longline Federal Longline, surface,
midwater
Bigeye tuna, Yellowfin
tuna
North Pacific Albacore
Baitboat - Pole and Line
Federal Hook and line Albacore tuna
North Pacific Albacore Troll Federal Troll line Albacore tuna
South Pacific Albacore Troll Federal Troll line Albacore tuna
West Coast Groundfish Non-
Trawl Gear: Limited Entry
Sablefish-Endorsed Fixed Gear
Federal Longline, bottom; pots
and traps, fish
Sablefish F/I (2011-2015),
MM (2011-
2015), SB (2011-2015)
Landing receipt,
observer data
West Coast Groundfish Non-Trawl Gear: Non-Endorsed
Fixed Gear
Federal Longline, bottom; pots and traps, fish
Sablefish, Thornyheads, Rockfish
F/I (2011-2015), MM (2011-
2015), SB (2011-
2015)
Landing receipt, observer data
ss
West Coast Limited Entry Bottom Trawl; Fixed Gear
Federal Longline, bottom; pots and traps, fish
Sablefish, Thornyheads, Rockfish
F/I (2011-2015), MM (2011-
2015), SB (2011-
2015)
Landing receipt, observer data,
logbook, electronic
monitoring data
mm
West Coast Limited Entry Bottom Trawl; Groundfish
Bottom Trawl
Federal Otter trawl bottom, fish Sablefish, Mixed flatfish, Mixed rockfish, Multi-
species groundfish
complexes, Widow rockfish, Yellowtail
rockfish
F/I (2011-2015), MM (2011-
2015), SB (2011-
2015)
Landing receipt, observer data,
logbook, electronic
monitoring data
rr
West Coast Mid-Water Trawl
for Rockfish, Shoreside
Processing
Federal Otter trawl midwater,
fish
Sablefish, Mixed flatfish,
Mixed rockfish, Multi-
species groundfish
complexes, Widow rockfish, Yellowtail
rockfish
F/I (2011-2015),
MM (2011-
2015), SB (2011-
2015)
Landing receipt,
observer data,
logbook, electronic
monitoring data
rr
West Coast Salmon Troll, Non-Tribal Ocean
Federal Troll line Sockeye salmon, Coho salmon, Chinook salmon,
Rainbow trout, Chum
salmon, Pink salmon
F/I (2011-2015) Landing receipt, logbook, observer
data, port sampling
California Coastal Purse Seine
for Anchovy, Mackerel, and
Sardine
Federal, State Purse seine Northern anchovy, Pacific
mackerel, Pacific sardine
California Halibut Trawl State Otter trawl bottom, fish California halibut F/I (2011-2015),
MM (2011-2015), SB (2011,
2014-2015)
Landing receipt,
observer data
California Swordfish Harpoon Federal, State Harpoons Swordfish
California/Oregon Drift
Gillnet (Mesh Size >14 in) for Swordfish and Thresher Shark
Federal, State Gillnet, floating drift Swordfish, Thresher shark F/I (2011-2013),
MM (2011-2015), ST (2012,
2014-2015)
Logbook, observer
data
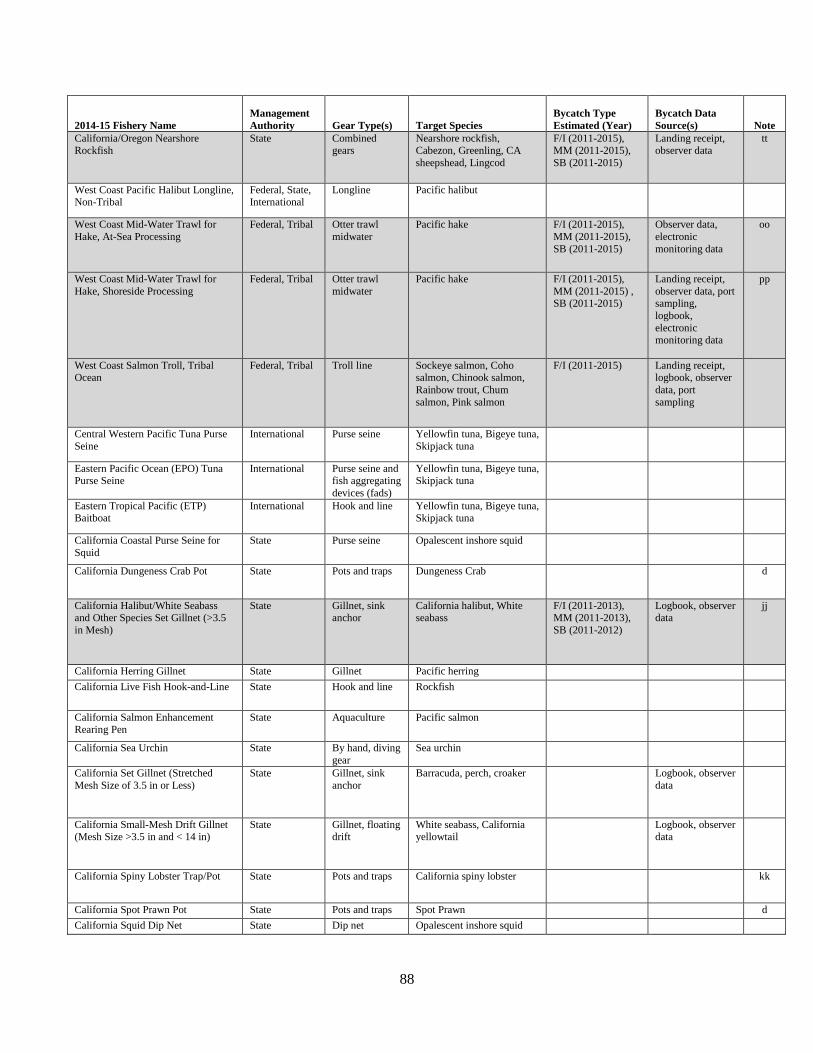
88
2014-15 Fishery Name Management Authority Gear Type(s) Target Species
Bycatch Type Estimated (Year)
Bycatch Data Source(s) Note
California/Oregon Nearshore Rockfish
State Combined gears
Nearshore rockfish, Cabezon, Greenling, CA sheepshead, Lingcod
F/I (2011-2015), MM (2011-2015), SB (2011-2015)
Landing receipt, observer data
tt
West Coast Pacific Halibut Longline, Non-Tribal
Federal, State, International
Longline Pacific halibut
West Coast Mid-Water Trawl for Hake, At-Sea Processing
Federal, Tribal Otter trawl midwater
Pacific hake F/I (2011-2015), MM (2011-2015), SB (2011-2015)
Observer data, electronic monitoring data
oo
West Coast Mid-Water Trawl for Hake, Shoreside Processing
Federal, Tribal Otter trawl midwater
Pacific hake F/I (2011-2015), MM (2011-2015) , SB (2011-2015)
Landing receipt, observer data, port sampling, logbook, electronic monitoring data
pp
West Coast Salmon Troll, Tribal Ocean
Federal, Tribal Troll line Sockeye salmon, Coho salmon, Chinook salmon, Rainbow trout, Chum salmon, Pink salmon
F/I (2011-2015) Landing receipt, logbook, observer data, port sampling
Central Western Pacific Tuna Purse Seine
International Purse seine Yellowfin tuna, Bigeye tuna, Skipjack tuna
Eastern Pacific Ocean (EPO) Tuna Purse Seine
International Purse seine and fish aggregating devices (fads)
Yellowfin tuna, Bigeye tuna, Skipjack tuna
Eastern Tropical Pacific (ETP) Baitboat
International Hook and line Yellowfin tuna, Bigeye tuna, Skipjack tuna
California Coastal Purse Seine for Squid
State Purse seine Opalescent inshore squid
California Dungeness Crab Pot State Pots and traps Dungeness Crab d
California Halibut/White Seabass and Other Species Set Gillnet (>3.5 in Mesh)
State Gillnet, sink anchor
California halibut, White seabass
F/I (2011-2013), MM (2011-2013), SB (2011-2012)
Logbook, observer data
jj
California Herring Gillnet State Gillnet Pacific herring California Live Fish Hook-and-Line State Hook and line Rockfish
California Salmon Enhancement Rearing Pen
State Aquaculture Pacific salmon
California Sea Urchin State By hand, diving gear
Sea urchin
California Set Gillnet (Stretched Mesh Size of 3.5 in or Less)
State Gillnet, sink anchor
Barracuda, perch, croaker Logbook, observer data
California Small-Mesh Drift Gillnet (Mesh Size >3.5 in and < 14 in)
State Gillnet, floating drift
White seabass, California yellowtail
Logbook, observer data
California Spiny Lobster Trap/Pot State Pots and traps California spiny lobster kk
California Spot Prawn Pot State Pots and traps Spot Prawn d California Squid Dip Net State Dip net Opalescent inshore squid

89
2014-15 Fishery Name Management Authority Gear Type(s) Target Species
Bycatch Type Estimated (Year)
Bycatch Data Source(s) Note
California White Seabass Enhancement Net Pens
State Aquaculture White seabass
California/Oregon Hagfish Pot or Trap
State Pots and traps, hagfish
Pacific hagfish
California/Oregon/Washington Bait Pens
State Aquaculture Northern anchovy
Oregon/California Spot Prawn State Pots and traps, shrimp
Spot shrimp
Washington Beach Seine/Oregon Drag Seine
State Other seine
Washington Grays Harbour Salmon Drift Gillnet (Excluding Treaty Tribal Fishing)
State Gillnet Sockeye salmon, Coho salmon, Chinook salmon, Rainbow trout, Chum salmon, Pink salmon
Washington Grays Harbour Salmon Set and Drift Gillnet
State Gillnet Sockeye salmon, Coho salmon, Chinook salmon, Rainbow trout, Chum salmon, Pink salmon
Washington Herring Brush Weir State Weir Pacific herring
Washington Puget Sound Region Salmon Drift Gillnet
State Gillnet Salmon
Washington Salmon Purse Seine State Purse seine Sockeye salmon, Coho salmon, Chinook salmon, Rainbow trout, Chum salmon, Pink salmon
Washington Salmon Reef Net State Other fixed net Sockeye salmon, Coho salmon, Chinook salmon, Rainbow trout, Chum salmon, Pink salmon
Washington Willapa Bay Drift Gillnet
State Gillnet Salmon
Washington/Oregon Gillnet State Gillnet Salmon Washington/Oregon Herring, Smelt, Squid Purse Seine
State Purse seine Coastal pelagic species
Washington/Oregon Lower Columbia River Salmon Drift Gillnet
State Gillnet Salmon ii
Washington/Oregon Miscellaneous Invertebrate
State By hand, diving gear
Washington/Oregon Shrimp Pot and Trap
State Pots and traps, shrimp
Shrimp
Washington/Oregon Smelt, Herring Dip Net
State Dip net Coastal pelagic species
Washington/Oregon/California Dungeness Crab Pot
State Pots and traps, other
Dungeness crab

90
2014-15 Fishery Name Management Authority Gear Type(s) Target Species
Bycatch Type Estimated (Year)
Bycatch Data Source(s) Note
Washington/Oregon/California Pink Shrimp
State Otter trawl bottom, shrimp
Pink shrimp F/I (2011-2015), MM (2011-2015), SB (2011-2015)
Landing receipt, observer data
ll Willapa Bay Salmon Drift Gillnet State Gillnet Sockeye salmon, Coho
salmon, Chinook salmon, Rainbow trout, Chum salmon, Pink salmon
Makah Salmon Set Gillnet Areas 4, 4A, 4B
Tribal Gillnet Sockeye salmon, Coho salmon, Chinook salmon, Rainbow trout, Chum salmon, Pink salmon
PACIFIC ISLANDS REGION
American Samoa Bottomfish Federal Hand line Deep water snappers (pink, red, gray/jobfish), Other snappers/jobfishes, Emerors, and Groupers
American Samoa Pelagic Longline Federal Longline Albacore F/I (2011-2015); MM (2011, 2013-2015); ST (2011-2015); SB (2011, 2013, 2015)
Observer data
American Samoa Troll Federal Troll line Dolphinfish, Indo-Pacific blue marlin, Yellowfin tuna, Skipjack tuna, Wahoo
Commonwealth of the Northern Mariana Islands Bottomfish
Federal Hook and line, electric
Shallow-water emperors, Snappers, Groups, and Deep water snappers (pink, red, gray/jobfish)
Commonwealth of the Northern Mariana Islands Tuna Troll
Federal Troll line Dolphinfish, Indo-Pacific blue marlin, Yellowfin tuna, Skipjack tuna, Kawakawa tuna, Wahoo
Guam Bottomfish Handline Federal Hook and line, electric
Deep water snappers, Hawaiian groupers
Guam Troll Federal Troll line Dolphinfish, Indo-Pacific blue marlin, Yellowfin tuna, Skipjack tuna, Wahoo
Hawaii Shrimp Trap Federal Pots and traps, shrimp
Deep-water Caridean shrimp
Hawaii-Based Deep-Set Pelagic Longline Fishery for Tuna
Federal Longline Yellowfin tuna, Bigeye tuna MM (2011-2012); ST (2011-2013); SB (2011-2013)
Observer data
Hawaii-Based Shallow-Set Pelagic Longline Fishery for Swordfish
Federal Longline Swordfish MM (2011-2012); ST (2011-2013); SB (2011-2013)
Observer data
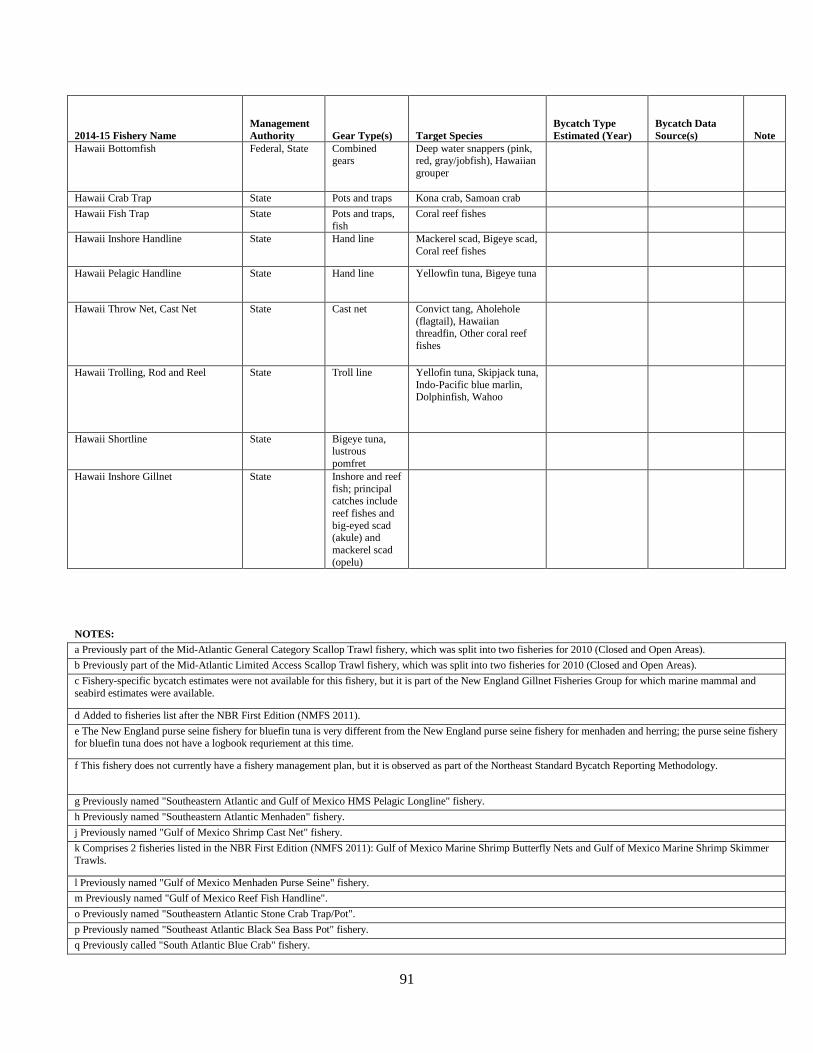
91
2014-15 Fishery Name Management Authority Gear Type(s) Target Species
Bycatch Type Estimated (Year)
Bycatch Data Source(s) Note
Hawaii Bottomfish Federal, State Combined gears
Deep water snappers (pink, red, gray/jobfish), Hawaiian grouper
Hawaii Crab Trap State Pots and traps Kona crab, Samoan crab Hawaii Fish Trap State Pots and traps,
fish Coral reef fishes
Hawaii Inshore Handline State Hand line Mackerel scad, Bigeye scad, Coral reef fishes
Hawaii Pelagic Handline State Hand line Yellowfin tuna, Bigeye tuna
Hawaii Throw Net, Cast Net State Cast net Convict tang, Aholehole (flagtail), Hawaiian threadfin, Other coral reef fishes
Hawaii Trolling, Rod and Reel State Troll line Yellofin tuna, Skipjack tuna, Indo-Pacific blue marlin, Dolphinfish, Wahoo
Hawaii Shortline State Bigeye tuna, lustrous pomfret
Hawaii Inshore Gillnet State Inshore and reef fish; principal catches include reef fishes and big-eyed scad (akule) and mackerel scad (opelu)
NOTES:
a Previously part of the Mid-Atlantic General Category Scallop Trawl fishery, which was split into two fisheries for 2010 (Closed and Open Areas). b Previously part of the Mid-Atlantic Limited Access Scallop Trawl fishery, which was split into two fisheries for 2010 (Closed and Open Areas). c Fishery-specific bycatch estimates were not available for this fishery, but it is part of the New England Gillnet Fisheries Group for which marine mammal and seabird estimates were available.
d Added to fisheries list after the NBR First Edition (NMFS 2011). e The New England purse seine fishery for bluefin tuna is very different from the New England purse seine fishery for menhaden and herring; the purse seine fishery for bluefin tuna does not have a logbook requriement at this time.
f This fishery does not currently have a fishery management plan, but it is observed as part of the Northeast Standard Bycatch Reporting Methodology.
g Previously named "Southeastern Atlantic and Gulf of Mexico HMS Pelagic Longline" fishery. h Previously named "Southeastern Atlantic Menhaden" fishery. j Previously named "Gulf of Mexico Shrimp Cast Net" fishery. k Comprises 2 fisheries listed in the NBR First Edition (NMFS 2011): Gulf of Mexico Marine Shrimp Butterfly Nets and Gulf of Mexico Marine Shrimp Skimmer Trawls.
l Previously named "Gulf of Mexico Menhaden Purse Seine" fishery. m Previously named "Gulf of Mexico Reef Fish Handline". o Previously named "Southeastern Atlantic Stone Crab Trap/Pot". p Previously named "Southeast Atlantic Black Sea Bass Pot" fishery. q Previously called "South Atlantic Blue Crab" fishery.

92
r Previously named "Southeastern Atlantic Marine Shrimp Cast Net". s Comprises 2 fisheries listed in the NBR First Edition (NMFS 2011): North Carolina Coastal Gillnet and South Atlantic Coastal Gillnet, as well as the following NBR fishery: Large Coastal and Small Coastal Shark Aggregates (Drift, Strike, and Bottom Gillnet).
t Previously named "South Atlantic Coastal Migratory Pelagic Troll" fishery. u Previously named "Southeast Fish Trawl" fishery. v Comprises 3 fisheries listed in the NBR First Edition (NMFS 2011): North Carolina Haul/Beach Seine - Long Haul; North Carolina Stop Nets; and Southeastern Atlantic Haul/Beach Seine.
w Comprises 2 fisheries listed in the NBR First Edition (NMFS 2011): Southeastern Atlantic Marine Shrimp Butterfly Nets and Southeastern Atlantic Marine Shrimp Skimmer Trawls.
x Previously named "South Atlantic Snapper-Grouper Bottom Longline" fishery. y Previously named "South Atlantic Snapper-Grouper Handline/Electric Reel" fishery. aa Comprises 6 state herring fisheries listed in the NBR First Edition (NMFS 2011): Alaska Food/Bait Herring Trawl, Alaska Herring Spawn on Kelp Pound Net, Alaska Roe Herring and Food/Bait Herring Beach Seine, Alaska Roe Herring and Food/Bait Herring Gillnet, Alaska Roe Herring and Food/Bait Herring Purse Seine, and Alaska Southeast Herring Roe/Food/Bait Pound Net.
dd Comprises 5 state groundfish fisheries listed in the NBR First Edition (NMFS 2011): Alaska Groundfish Longline/Setline (including Sablefish, Rockfish, and Miscellaneous Finfish); Alaska Miscellaneous Finfish Handline and Mechanical Jig; Aleutian Islands State Waters Pacific Cod; Gulf of Alaska Pacific Cod State Fishery Jig; and Gulf of Alaska Pacific Cod State Fishery Pot.
ee Comprises 5 state shellfish fisheries listed in the NBR First Edition (NMFS 2011): Alaska Dungeness Crab; Alaska Shrimp Otter Trawl and Beam Trawl (statewide and Cook Inlet); Gulf of Alaska Crab Pot; Southeast Alaska Crab Pot; and Southeast Alaska Shrimp Pot.
ii Same as "Washington/Oregon Lower Colorado River Salmon Drift Gillnet" fishery (incorrectly listed as two, similarly-named fisheries in NBR First Edition (NMFS 2011)).
jj Previously named "California Set Gillnet Mesh Size up to 14 Inches." kk Previously named "California Trap/Pot" fishery. ll Previously named "Oregon/California Pink Shrimp" fishery, renamed in 2011; marine mammals and seabirds were estimated each year, but in some years the estimate was 0.
mm Added to fisheries list beginning in 2011 (after First Edition Update 1 (NMFS 2013a)); marine mammals and seabirds were estimated each year, but in some years the estimate was 0.
nn Added to fisheries list beginning in 2014 (For Edition 2). oo Previously named West Coast Mid-Water Trawl for Whiting, At-Sea Processing; marine mammals and seabirds were estimated each year, but in some years the estimate was 0.
pp Previously named West Coast Mid-Water Trawl for Whiting, Shoreside Processing; marine mammals and seabirds were estimated each year, but in some years the estimate was 0.
qq Previously named California/Oregon Drift Gillnet (Mesh Size > 14 in. for Swordfish and Thresher Shark).
rr Previously part of West Coast Limited Entry Bottom Trawl; Groundfish Bottom and Midwater Trawl; marine mammals and seabirds were estimated each year, but in some years the estimate was 0.
ss Marine mammals were estimated for 2014 and 2015, but the estimates were 0 each year.
tt Marine mammals and seabirds were estimated each year, but in some years the estimate was 0.
1 Renamed - formerly identified as BSAI Pacific Ocean Perch Trawl. 2 The Alaska Halibut Longline fishery has been split into two fisheries (BSAI halibut longline and GOA halibut longline). 3 Renamed - formerly identified as GOA Pacific cod pot. 4 Renamed - formerly identified as Bering Sea/Aleutian Islands Pacific Cod Jig. 5 New group comprised of the former individual fisheries: Bering Sea/Aleutian Islands Greenland Turbot Longline & Bering Sea/Aleutian Islands Pacific Cod Longline.
6 New group comprised of the former individual fisheries: Bering Sea/Aleutian Islands Flatfish Group (Arrowtooth Flounder, Flathead Sole, Other Flatfish) Trawl; Bering Sea/Aleutian Islands Rock Sole Trawl; Aleutian Islands/Eastern Bering Sea Atka Mackerel Trawl; Bering Sea/Aleutian Islands Pacific Ocean Perch Trawl; & Bering Sea/Aleutian Islands Sablefish Trawl.
7 New group comprised of the former individual fisheries: Bering Sea/Aleutian Islands Pacific Cod Pot; & Bering Sea/Aleutian Islands Sablefish Pot. 8 New group comprised of the former individual fisheries: Bering Sea/Aleutian Islands Yellowfin Sole Trawl; & Bering Sea/Aleutian Islands Pacific Cod Trawl.
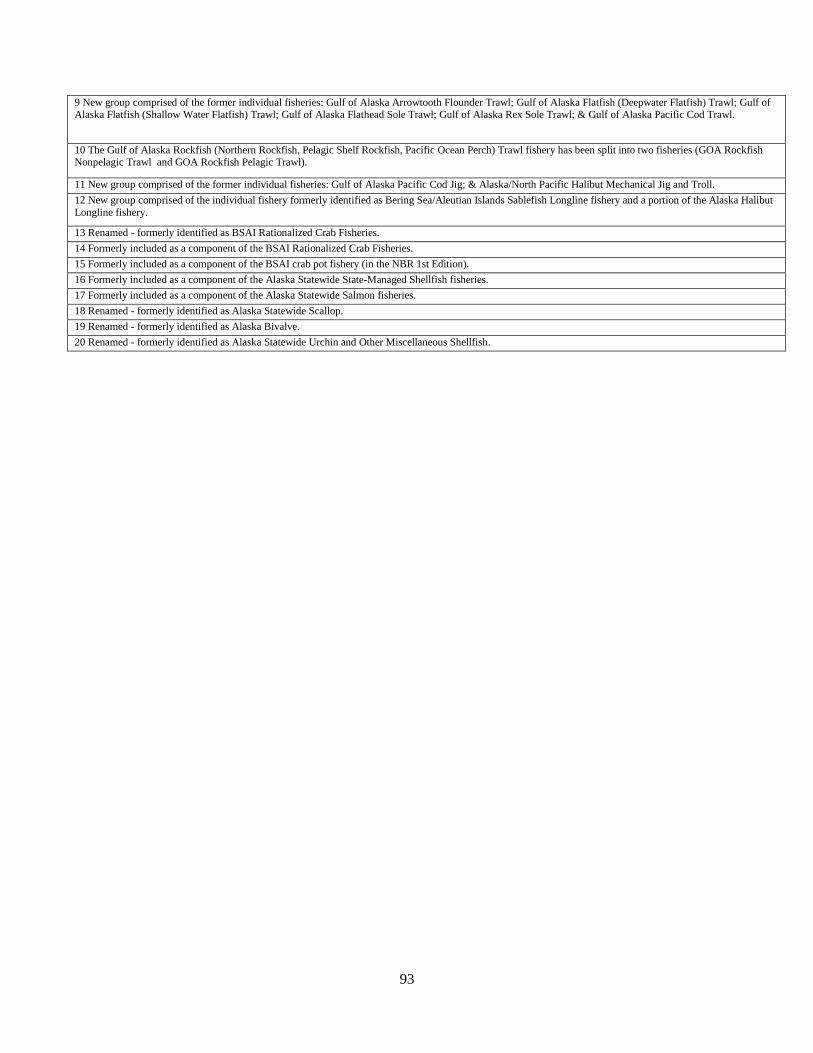
93
9 New group comprised of the former individual fisheries: Gulf of Alaska Arrowtooth Flounder Trawl; Gulf of Alaska Flatfish (Deepwater Flatfish) Trawl; Gulf of Alaska Flatfish (Shallow Water Flatfish) Trawl; Gulf of Alaska Flathead Sole Trawl; Gulf of Alaska Rex Sole Trawl; & Gulf of Alaska Pacific Cod Trawl.
10 The Gulf of Alaska Rockfish (Northern Rockfish, Pelagic Shelf Rockfish, Pacific Ocean Perch) Trawl fishery has been split into two fisheries (GOA Rockfish Nonpelagic Trawl and GOA Rockfish Pelagic Trawl).
11 New group comprised of the former individual fisheries: Gulf of Alaska Pacific Cod Jig; & Alaska/North Pacific Halibut Mechanical Jig and Troll. 12 New group comprised of the individual fishery formerly identified as Bering Sea/Aleutian Islands Sablefish Longline fishery and a portion of the Alaska Halibut Longline fishery.
13 Renamed - formerly identified as BSAI Rationalized Crab Fisheries. 14 Formerly included as a component of the BSAI Rationalized Crab Fisheries. 15 Formerly included as a component of the BSAI crab pot fishery (in the NBR 1st Edition). 16 Formerly included as a component of the Alaska Statewide State-Managed Shellfish fisheries. 17 Formerly included as a component of the Alaska Statewide Salmon fisheries. 18 Renamed - formerly identified as Alaska Statewide Scallop. 19 Renamed - formerly identified as Alaska Bivalve. 20 Renamed - formerly identified as Alaska Statewide Urchin and Other Miscellaneous Shellfish.
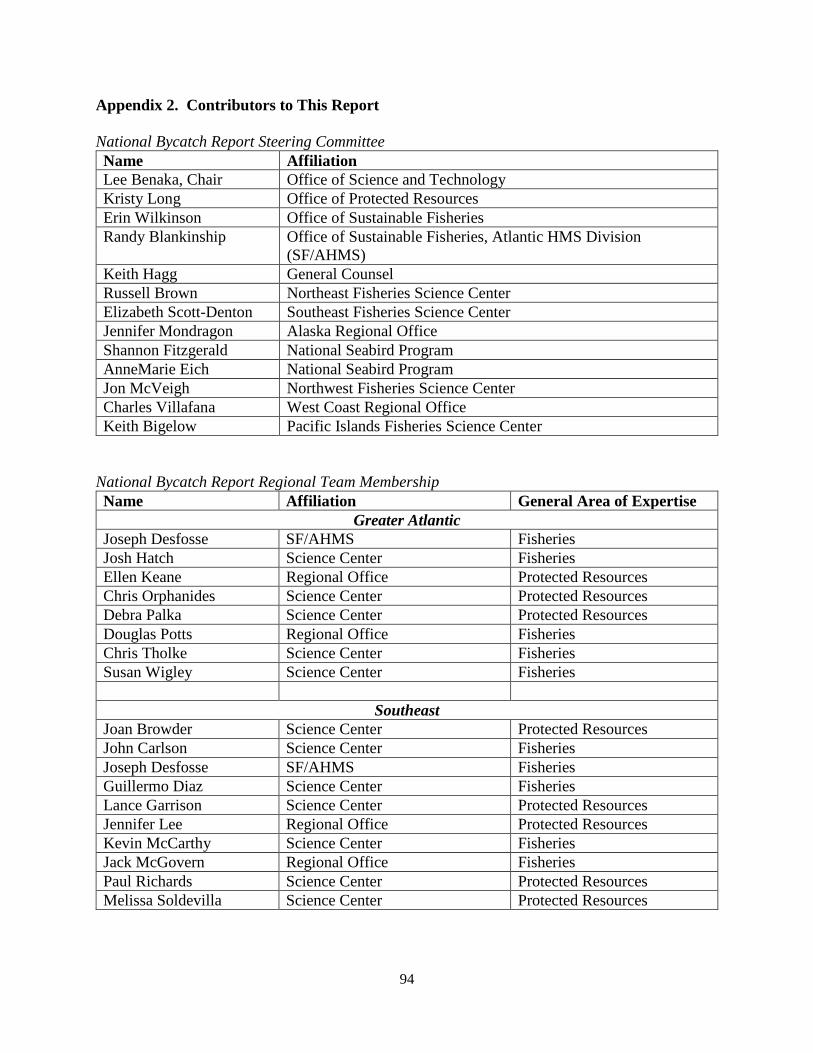
94
Appendix 2. Contributors to This Report National Bycatch Report Steering Committee Name Affiliation Lee Benaka, Chair Office of Science and Technology Kristy Long Office of Protected Resources Erin Wilkinson Office of Sustainable Fisheries Randy Blankinship Office of Sustainable Fisheries, Atlantic HMS Division
(SF/AHMS) Keith Hagg General Counsel Russell Brown Northeast Fisheries Science Center Elizabeth Scott-Denton Southeast Fisheries Science Center Jennifer Mondragon Alaska Regional Office Shannon Fitzgerald National Seabird Program AnneMarie Eich National Seabird Program Jon McVeigh Northwest Fisheries Science Center Charles Villafana West Coast Regional Office Keith Bigelow Pacific Islands Fisheries Science Center
National Bycatch Report Regional Team Membership Name Affiliation General Area of Expertise
Greater Atlantic Joseph Desfosse SF/AHMS Fisheries Josh Hatch Science Center Fisheries Ellen Keane Regional Office Protected Resources Chris Orphanides Science Center Protected Resources Debra Palka Science Center Protected Resources Douglas Potts Regional Office Fisheries Chris Tholke Science Center Fisheries Susan Wigley Science Center Fisheries
Southeast Joan Browder Science Center Protected Resources John Carlson Science Center Fisheries Joseph Desfosse SF/AHMS Fisheries Guillermo Diaz Science Center Fisheries Lance Garrison Science Center Protected Resources Jennifer Lee Regional Office Protected Resources Kevin McCarthy Science Center Fisheries Jack McGovern Regional Office Fisheries Paul Richards Science Center Protected Resources Melissa Soldevilla Science Center Protected Resources

95
Alaska Robyn Angliss Science Center Protected Resources Bob Foy Science Center Protected Resources Jason Gasper Regional Office Fisheries Cathy Tide Regional Office Fisheries Megan Mackey Regional Office Fisheries
West Coast Jim Carretta Southwest Science Center Protected Resources Tom Good Northwest Science Center Protected Resources Robert Kope Northwest Science Center Fisheries Kayleigh Somers Northwest Science Center Fisheries Vanessa Tuttle Northwest Science Center Fisheries
Pacific Islands Christofer Boggs Science Center Fisheries Melanie Brown (retired) Regional Office Fisheries Sarah Ellgen Regional Office Fisheries Dawn Golden Regional Office Protected Resources Marti McCracken Science Center Fisheries John Peschon Regional Office Fisheries
Other Important Partners Name Affiliation Karyl Brewster-Geisz SF/AHMS Stephen Brown Office of Science and Technology Daryl Bullock Office of Science and Technology Tobey Curtis SF/AHMS Jane DiCosimo Office of Science and Technology Alexis Gutierrez Office of Protected Resources Aimee Hoover Knauss Marine Policy Fellow Michael Lewis Office of Science and Technology Noelle Olsen Knauss Marine Policy Fellow David Gloeckner Southeast Fisheries Science Center Beth Wrege Southeast Fisheries Science Center


![BYCATCH Catalog - Midyear 2011[1]](https://img.pdfslide.us/doc/110x75/54f613604a795949198b48ce/bycatch-catalog-midyear-20111.jpg)