Embed Size (px)
Citation preview

U.S. MULTINATIONALS AND PREFERENTIAL MARKET ACCESS
EMILY BLANCHARD1 AND XENIA MATSCHKE2
Abstract
We combine firm level panel data on U.S. foreign affiliate activity with detailed measures
of U.S. trade policy to study the relationship between offshoring and preferential market
access. Consistent with theory, we find that trade preferences and offshoring activity are
positively and significantly correlated. Using instrumental variables, we estimate that a 10%
increase in U.S. foreign affiliate exports to the U.S. is associated with a 4 percentage point
increase in the rate of preferential duty-free access. Restricting attention to the Generalized
System of Preferences (GSP) among developing countries, this estimate more than triples
relative to the baseline, full sample results.
JEL classification: F13, F21, F23
The statistical analysis of firm-level data on U.S. multinational companies was conducted at the Bureau of Eco-
nomic Analysis, U.S. Department of Commerce under arrangements that maintain legal confidentiality requirements.
The views expressed are those of the authors and do not reflect official positions of the U.S. Department of Commerce.
We thank Bill Zeile and Ray Mataloni of the Bureau of Economic Analysis for sharing their expertise; Shushanik
Hakobyan, Martin Bresslein, and Ashley Ulrich for superb research assistance; Matilde Bombardini and Kishore
Gawande for sharing their data on political activity by U.S. industries; and Andrew Bernard, Bruce Blonigen, Matt
Cole, Wayne Gayle, James Harrigan, John McLaren, Nina Pavcnik, and Matthew Slaughter for helpful comments.
We are particularly grateful to the editor Gordon Hanson and three anonymous referees, whose constructive feedback
improved the paper tremendously. This work was funded in part by the Bankard Fund for Political Economy at the
University of Virginia.1Tuck School of Business at Dartmouth College, U.S.A.; [email protected] IV-Volkswirtschaftslehre, Universitat Trier, Germany; [email protected].
1
2
1. Overview
Recent theoretical work in Blanchard (2007, 2010) suggests that the pattern of inter-
national investment and multinational enterprise (MNE) activity may play an important
role in shaping government preferences over trade policies: when a multinational firm owns
export-oriented (i.e. ‘offshoring’) affiliates abroad, the MNE’s ‘home’ country government
has an incentive to improve market access for imports from those foreign affiliates, for the
simple reason that greater market access means higher rates of return to the government’s
MNE constituents. To the extent that governments respond to the interests of constituent
industries, differences in the pattern of firm operations across the globe may be reflected in
trade policy.
Unfortunately, this clear empirical prediction is not easily taken to the data. Empirically
testing the hypothesis that MNE operations and foreign direct investment (FDI) influence
governments’ most preferred trade policies proves problematic in three key dimensions. First,
most advanced economies have set tariffs cooperatively since the inception of the General
Agreement on Tariffs and Trade (GATT) in 1947. Since tariff concessions are negotiated
multilaterally and are subject to the Most Favored Nation (MFN) non-discrimination clause,
the econometrician is challenged to distinguish the influence of FDI from other multilateral
pressures at the negotiating table. A government may be unwilling to change its MFN
tariff on a particular good if its underlying objective is to improve market access for just
a handful of countries. Moreover, many of the MFN tariff concessions negotiated within
the GATT/WTO framework apply to broad classes of goods rather than narrowly defined
HTS-8 categories, further diluting the influence that country- and product-specific FDI and
MNE activity could have on MFN tariffs.
Our empirical strategy sidesteps this problem by focusing on the potential influence of
MNE activity not on MFN tariffs, but on preferential treatment of trade flows. Focusing
our analysis on U.S. trade policy, we study the pattern of duty-free access offered under
special trade initiatives (e.g. AGOA), free trade agreements (FTAs), and the Generalized
System of Preferences (GSP), the ‘aid-through-trade’ initiative in which industrial nations
grant expanded market access to developing countries. Because preferential treatment is
3
exempt from MFN, trade preferences may offer a closer reflection of governments’ unilateral
trade policy preferences.1
A second potential complication for empirical testing lies in differentiating export-oriented
(vertical) FDI apart from market-seeking (horizontal) FDI. While theory predicts that export-
oriented FDI will lower tariffs in the investment-source country, the same is not true of
market-seeking investment. If multinationals operate horizontal ‘tariff jumping’ operations
abroad, those activities will have either no effect, or – via general equilibrium forces – a
small positive effect on the investment-source country’s optimal tariff. Fortunately, rich data
from the U.S. Bureau of Economic Analysis (BEA) offer an empirical solution. Based on
detailed surveys of U.S. multinational firms, we are able to measure foreign affiliate sales
by destination, which allows us to distinguish export-oriented affiliate activity (measured
as U.S. MNE subsidiaries’ sales of goods back to the U.S.) apart from horizontal activity
(subsidiaries’ sales to the foreign local market).
The third and most challenging hurdle in identifying a potential effect of MNE activity
on trade policy is the presumed endogeneity of export platform investment. We expect that
MNEs will be more likely to set up offshoring operations in countries that have preferential
market access to the U.S. The theory in Blanchard (2007) makes this reverse causality
explicit, demonstrating that export-oriented FDI will in general increase as tariffs to the
export-destination market are lowered.
Our response is to use an instrumental variables (IV) approach to control for the endo-
geneity of export-oriented FDI. The theory makes it clear that absent general equilibrium
forces, horizontal investment should not itself influence or be influenced by U.S. tariffs.2
In practice, however, we expect market-seeking FDI to be positively correlated with export-
oriented FDI, since both rely on a favorable climate for investment. Thus, we use (horizontal)
MNE sales to the local market as an instrument for (export-oriented) MNE goods sales to
the U.S. Crucially, we construct our instrument using sales by only those multinational af-
filiates that do not also sell goods back to the U.S., which addresses the potential concern
1MFN exemptions are remarkably widespread in practice. See Section 2 for discussion of the institutional
structure governing U.S. trade policy and Figure 2 for the extent of variation in our data. FTAs are exempt from
MFN under GATT Article XXIV, while the Enabling Clause exempts the GSP.2In the context of our country-industry-level study, we do not expect general equilibrium effects to manifest in
practice and we find no evidence that they do. (See, e.g., column 5 in Table 4.)
4
that increasing returns to scale at the affiliate level could lead to violations of the exclusion
restriction.3
Equipped with the empirical strategy described above, we assemble a three-way panel
data set including 80 industries, 184 countries, and ten years (1997-2006) to measure the
responsiveness of U.S. trade preferences to export-oriented, offshoring activities by U.S.
MNEs. Our findings are consistent with a causal relationship: conservatively, a 10% increase
in MNE affiliates’ exports to the U.S. is associated with an increase in the duty-free access
of about 4 percentage points (roughly 20% relative to the mean value of preferential market
access), controlling for the endogeneity of MNE foreign affiliates’ exports to the U.S. Among
potentially GSP-eligible developing countries, the estimated effect is more than three times
higher: a 10% increase in affiliate goods exports to the U.S. is associated with a roughly
15 percentage point increase in the rate of duty-free access under the GSP. These baseline
estimates prove robust in a host of alternative empirical specifications.
Our results offer compelling evidence that offshoring MNE activity can spur preferen-
tial trade liberalization to the MNE’s home country, which in turn may deepen economic
integration between the investment host and source countries even further, but may also
lead to substantial trade and investment diversion. A particular concern is that while some
trading partners experience ever-greater economic integration through this investment-trade
complementarity, other countries may be left out entirely.
This paper complements and considerably extends the empirical literature on the de-
terminants of preferential treatment and the influence of international investment.4 Most
relevant to this paper’s objective are Magee (2003) and Baier and Bergstrand (2004), which
empirically test the determinants of preferential trade agreements (PTAs). Both papers view
preferential agreements as a binary, country-level decision and do not exploit, as we do, the
considerable variation in preferential treatment at the industry level. Also related are De-
Vault (1996), Ozden and Reinhardt (2005), Lederman and Ozden (2007), Kee, Olarreaga,
and Silva (2007), and Ludema, Mayda, and Mishra (2011), which explore the domestic and
3One might worry that U.S. trade policy could influence an affiliate’s horizontal FDI sales if the decision to enter
(or expand in) the market depends on both the level of exports back to the U.S. and local sales, as could arise under
increasing returns to scale.4See Bhagwati, Krishna, and Panagariya (1999) for a broad review.
5
geo-political determinants of U.S. trade preferences and (in the last paper) U.S. tariff sus-
pensions. None of these studies consider a role for foreign direct investment or multinational
firms.
A second subset of related work examines the role of (exogenous) PTAs in determining
investment flows. The seminal theoretical work by Motta and Norman (1996) identifies
the potential for PTAs to attract both export-oriented and import-competing investment.
Treating PTAs as exogenous, Balasubramanyam, Sapsford, and Griffiths (2002) find no effect
of regional integration agreements on bilateral FDI flows in a cross section of countries in
1995. To our knowledge, this is the only study apart from our own to evaluate empirically
the relationship between investment flows and trade agreements, though it examines the
reverse causality and does not address the question of endogeneity.
Finally this paper complements a companion project, Blanchard and Matschke (2006),
in which we extend a variant of Magee (2003) and Baier and Bergstrand (2004) to study
the effect of bilateral investment positions on preferential trade agreements. A key finding
from that exercise is the importance of using industry-level investment data to estimate the
effects of export-oriented investment apart from the influence of market-seeking investment,
as we do here.
The remainder of the paper proceeds as follows. Section 2 reviews the theoretical mo-
tivation behind our empirical approach and discusses the political process through which
U.S. trade policy solicits and responds to multinational firms’ concerns. Section 3 outlines
our empirical strategy; Section 4 describes the data; and Section 5 presents the results. We
describe a series of extensions and robustness tests in Section 6 before concluding in Section
7.
2. Theoretical Motivation and Political Mechanisms
In a general equilibrium framework, Blanchard (2010) demonstrates that export-oriented
foreign investment reduces the optimal (bilateral) tariff imposed by the investment source
country. The mechanism is straightforward. When a country is large, its import tariffs shift
part of the tax burden onto foreign exporters, generating the well-known ‘terms of trade
6
cost shifting’ externality.5 When part of the foreign export sector is owned by domestic con-
stituents in the importing country (for instance, through offshoring investments by MNEs),
the terms of trade externality is internalized, causing the optimal tariff to decline.6 If trade
protection is politically motivated and offshore investors actively lobby their local govern-
ment, tariffs should fall even further. In a many-country world, Blanchard (2007) shows
that a large importing country has an incentive to use MFN exemptions to favor its overseas
investors rather than change MFN tariffs, particularly if the investment host countries are
small.
Our most important empirical prediction follows directly: all else equal, offshoring ac-
tivity by firms from a given source country – here the U.S.– in a particular host country
and industry will increase the incentives for U.S. policy makers to improve market access
for imports from U.S.-affiliated producers overseas.7 Because trade policy by law cannot
discriminate at the firm level (except in anti-dumping cases), we expect this mechanism to
operate at the (HTS-8) tariff line level on a country-to-country basis.
The degree to which trade preferences will respond to MNE offshoring operations depends
on four key factors: the sensitivity of MNE investors’ profits to U.S. trade policy; the political
influence of the MNEs relative to import-competing domestic groups; the opportunity cost of
lost tariff revenues; and the extent to which preferences offered to one country and industry
dilute the MNE profits derived from rest of the world (ROW) imports.8 Translating to
empirically testable predictions in the context of U.S. trade preferences and multinational
affiliate activity, we thus draw the following predictions:
Empirical Prediction 1. U.S. trade preferences for product j from country c will be:
(i) increasing in U.S. MNE affiliates’ sales of product j from country c to the U.S.;
(ii) decreasing in U.S. domestic sales of product j;
(iii) decreasing in total U.S. imports of product j from country c;
(iv) decreasing in total U.S. imports of product j from U.S. MNE affiliates in the ROW.
5See Bagwell and Staiger (1999) for the canonical application to GATT/WTO rules, and Johnson (1951-52) for
the foundational exposition of the optimal tariff argument.6While offshoring operations are only one form of export-oriented foreign investment, they are also the most
easily measurable, which is why we use them as the focus of our study.7See Lemma 3.5 in Blanchard (2007) for formal treatment.8The first three predictions can be found in both Blanchard (2007) or (2010), while the last derives from the
multi-country framework in Blanchard (2007) for the case of a finite number of trading partners.
7
A few points of explanation bear mention. First, predictions (i) and (iv) use MNE
affiliate sales of goods back to the U.S. as the relevant measure of the sensitivity of U.S.
multinational investors’ profits to U.S. trade policy; our choice of this measure rests on the
assumption that an increase in preferential market access will translate into higher local
per-unit revenues and profits earned by those multinational affiliates supplying the U.S.9 In
prediction (ii), we use the size of domestic U.S. sales as a proxy for potential protectionist
pressure, with greater domestic sales associated with a more protectionist stance. In our
baseline empirical specifications, we also include a quadratic term for U.S. domestic sales to
capture potential concavity in the political response, loosely in the spirit of Bombardini and
Trebbi (2011).10 Prediction (iii) reflects the opportunity cost of tariff preferences, which is
greater the larger the volume of imports that would no longer pay MFN duties. Prediction
(iv) captures the possibility that enhanced market access for one country could, via trade
diversion, cannibalize profits from other MNE affiliate suppliers to the U.S. in the rest of the
world.
In addition, we expect that both MFN tariffs and total U.S. industry imports could be
important, but the sign prediction is ambiguous. A higher MFN tariff implies a greater
opportunity cost of offering tariff preferences, but at the same time, greater MFN tariffs
may induce more active MNE political lobbying for discretionary policies. The net influence
of the level of total U.S. imports is similarly indeterminate: all else equal, greater total U.S.
imports may imply less domestic political pressure against preferences. Conversely, higher
total U.S. imports imply a greater tariff revenue loss from the rest of the world via trade
diversion.
Political Mechanisms. We now offer a quick overview of the political process that
determines U.S. trade preferences. We highlight three important points that both support
our empirical approach and elucidate the underlying mechanism. Our first point is simply
that we may treat MFN tariffs as pre-determined in the context of our empirical analysis.
U.S. MFN tariff bindings were last set in 1994 during the Uruguay Round negotiations –
9By Hotelling’s lemma, recall that the derivative of the profit function with respect to output price p is supply
(i.e. ∂π(p,~w)∂p
= y(p, ~w)). Thus, if foreign investors are the residual claimants of affiliate profits and view local wages
as fixed, then our sales measure is exactly the derivative that theory suggests.10In section 6, we also consider explicit measures of political activity by domestic and MNE actors using indicators
from Gawande and Bandyopadhyay (2000) and Bombardini (2008).
8
three years before the start of our sample period in 1997. Applied tariffs have moved little
since, and the variation that has occurred has been the result of extended phase-in schedules
negotiated before the beginning of our sample period (and thus independent of conditions
after 1997).
Second, U.S. trade rules provide considerable scope for discretionary application of trade
preferences in practice.11 While the MFN clause of the GATT limits the extent to which
WTO members can offer other members preferential market access, there are widespread
exceptions. FTAs offer preferential market access at the bilateral level and include sharp
carve-outs and differential phase-in periods at the product level that introduce the potential
for discretionary application across goods in practice. Likewise, the GSP, meant to allow
countries to offer preferential market access to developing countries, introduces the potential
for discretion at the country-product level.12 Under the GSP, so-called ‘competitive need
limitations’ waivers and exemptions, differentially binding rules of origin, and product-level
application of country penalties lead to substantial variation in applied preferences at the
country-product-year level.13
The final point spotlights the underlying mechanism: we directly observe multinational
firms publicly and actively engaged in the political process that determines the structure
of U.S. trade preferences.14 For example, during a 2005-2006 USTR review of country-
level GSP eligibility, Dana Corporation, a large U.S. vehicle parts manufacturer, requested
extension of GSP preferences for its offshore operations in Argentina, Brazil, India, and
Venezuela, writing, “elimination of GSP benefits...will result in significant harm to Dana’s
foreign investments...”15 During the same year, Alcoa, a U.S. aluminum producer, petitioned
for continued GSP eligibility for Brazil, Russia, and Venezuela. In its written comments to
the USTR, Alcoa argued that loss of GSP access would “cause significant disruption to [its]
11Article XXIV of the GATT defines the rules for PTAs; for the U.S. GSP, duty-free treatment is specified by
Title V of the U.S. Trade Act of 1974 (19 U.S.C. 2461).12See Blanchard and Hakobyan (2014) for a detailed analysis of discretion under the U.S. GSP.13For example, following a 1997 violation of intellectual property rights in pharmaceuticals, Argentina lost GSP
access for a variety of products ranging from anchovies to raw cane sugar (ibid., footnote 2). Our baseline preference
measure captures any differential uptake in GSP preferences (whether by formal eligibility or by exporter choice); our
alternative eligibility measure reflects competitive need limitations and other formal exclusions, but cannot capture
differentially binding rules of origin.14These examples come from public petitions to the U.S. Trade Representative (USTR) and bear no relationship
to the BEA data. Additional examples and documentation available per request.152006 GSP Annual Review, written comment of Dana Corporation (USTR docket FR-0052)(14)

9
supply chain” and could cause “the imposition of over $3 million in additional costs.”16 It
went on to add, “If Brazil, Russia, and Venezuela have their eligibility restricted in some
way, we request that the following products not be removed,” before listing the relevant HTS
codes for its imports from those countries. There are many such examples, and they occur
every year.17
With a clear understanding of the theoretical motivation and the institutional mecha-
nisms that drive trade preferences in practice, we now turn to the empirical analysis.
3. Empirical Strategy
Let the latent variable θ∗cjt represent the underlying U.S. preference for offering duty-
free market access to imports of a given product j from country c in year t.18 Under U.S.
trade law, observed preferences θcjt must be binary: imports of a given product j from
country c are either eligible for duty-free access or subject to the MFN rate.19 Because
several key variables (including our measure for multinational activity) are only available
at the industry level, however,20 we need to aggregate our dependent variable to the 4-digit
North American Industry Classification System (NAICS-4) level. Indexing industries by i,
our observed preference measure θcit ∈ [0, 1] denotes the share of imports from country c in
industry i that are eligible for duty free access to the U.S. in year t.
We define the econometric model:
θcit = α0 + α1FDIcit + β ·Xcit + γc + δi + ηt + εcit, (3.1)
where FDIcit is a measure of offshoring activity by U.S. multinationals, Xcit is a k × 1
vector of other explanatory country-year, industry-year, and country-industry-year varying
characteristics, α0 and α1 are scalar parameters, and β is a 1× k vector of parameters. The
162006 GSP Annual Review, written comment of Alcoa (USTR docket FR-0052)(2)17Two examples from the recent 2011 Annual GSP Review include SC Johnson and Co., which petitioned for
continued GSP benefits on behalf of its Thai subsidiary, and MAT Holdings, which petitioned on behalf of its
production facilities in India. MAT Holdings spells out the mechanism plainly, writing “entering the United States
duty-free under GSP also contributes to the success of U.S. investments abroad...” (Dockets USTR 2011-0015-0125
and -0083; USTR-2011-0015-0012)18In principle, θ∗cjt is not bound by the unit interval: negative values imply the U.S. would like to impose a tariff
above MFN level, while values above 1 imply the U.S. would prefer an import subsidy.19Due to partial-year eligibility, θcjt may take intermediate values when defined over a calendar year.20Although the MNE data are available at the affiliate level, the financial and operating data are coded only to
the NAICS-4 level.

10
parameters γc, δi, and ηt represent country-, industry-, and year-fixed effects, respectively.
The remaining error term, εcit, represents unobserved heterogeneity in each country-industry-
year observation and is assumed to be independent of both Xcit and FDIcit. To the extent
that the errors are correlated within countries or industries, country- and industry-fixed
effects will mitigate the Moulton problem; to be conservative, we also cluster the standard
errors by country in our benchmark specification.
We include in the vector Xcit the variables directly suggested by theory and a small set
of standard political economy and gravity control variables. As discussed earlier, the key
explanatory variables in Xcit include total U.S. domestic sales in industry i and year t and its
square; total U.S. imports from the world in industry i and year t; total industry i exports
to the U.S. from country c in year t; sales to the U.S. by affiliates of U.S. MNEs in the
rest of the world (other than country c) to the U.S. in industry i and year t; and the U.S.
MFN ad-valorem tariff rate in industry i and year t. We also include a set of industry-year
controls to proxy for U.S. domestic political pressure, including the U.S. payroll, number of
establishments, import penetration, number of employees, and the year-on-year log change
in U.S. employment and import penetration. Two gravity variables, GDP per capita and
population, vary at the country-year level.21
With a normally distributed error, the correct specification is a double-censored Tobit
model. In practice, however, the three dimensions of fixed effects specified in (3.1) introduce
a tradeoff between computational feasibility and adherence to this ex-ante preferred non-
linear (Tobit) model specification. Thus, we pursue two different strategies for implementing
our empirical test. In the first, we estimate a linear probability model in which we can
remove industry, country, and year fixed effects, but must ignore the censoring process that
generates the mass points for θcit at 0 and 1.22 In a second approach, we adopt the non-linear
double censored Tobit model with fixed effects entering as dummy variables, but the need
to achieve convergence limits both our choice of estimator and the set of control variables
we can include.23
21Our results are robust to the exclusion of these additional variables.22Year-fixed effects are removed by dummy variables, while industry and country fixed effects are removed by
demeaning. We correct the standard errors to account for the demeaning, but given the large number of observations,
the correction is negligible.23In the instrumented Tobit specification, we adopt the Newey (1987) two-step estimation and reduce the set of
controls to only those variables explicitly indicated by theory.
11
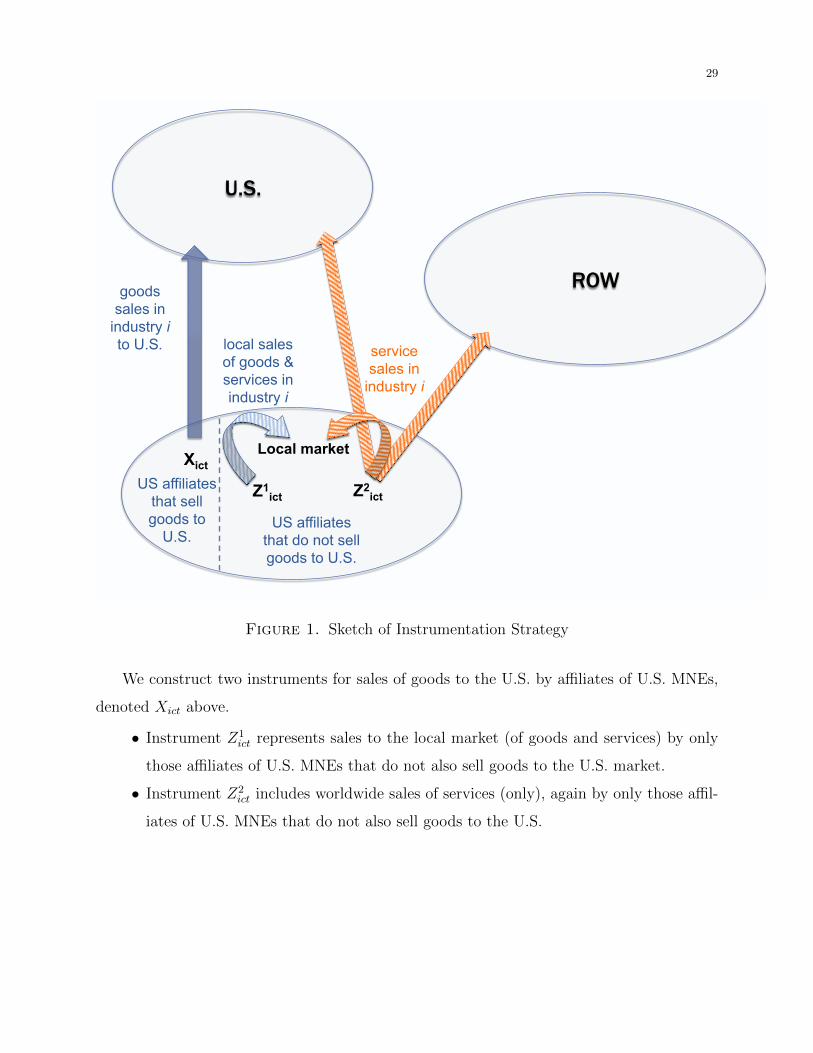
We address the potential simultaneity between offshoring activity and preferential access
by instrumenting for our measure of multinational affiliates sales of goods back to the United
States. Guided by theory, we argue that market-seeking (horizontal) MNE sales to the local
market should be independent of U.S. trade preferences.24 At the same time, we expect local
and offshoring MNE sales to be positively correlated because both reflect the attractiveness
of the local market for foreign investors. Thus, we instrument for (export-oriented) sales of
goods to the U.S. with (market-seeking) MNE affiliate sales (of goods and services) to the
local market in the same country, industry, and year. As second instrument, we use worldwide
sales of services by affiliates of U.S. MNEs, again within the same country, industry, and
year. The same rationale applies to the second instrument: while service sales may reflect
the attractiveness of the FDI host country within a given industry, we would not expect a
direct link between affiliates’ sales of services and U.S. preferences for goods trade. Crucially,
we are careful to construct both instruments using only those affiliates that do not also sell
goods to the U.S., which addresses the potential concern that increasing returns to scale at
the affiliate level could cause a firm’s joint decision to enter and sell both goods to the U.S.
and to the local market (or services worldwide) to depend directly on U.S. preferences.25
Figure 1 summarizes our instrumentation strategy using a simple diagram.
Finally, to reduce the potential influence of outliers, we estimate all specifications taking
logs of all variables that can take large integer values.26 In baseline specifications, we also lag
the explanatory right-hand side variables by one year to account for the time lag inherent
to policy changes.
24One might be concerned that MNE sales to the local market could be a substitute for MNE sales to the U.S.,
and thus be correlated with the second-stage error term. The first-stage results suggest a strong positive correlation
between sales to each destination, which argues against the substitutes story. The high p-values for the Hansen’s J
test offer additional reassurance.25In our sample, 84% of affiliates report positive sales to the local market, while fewer than 21% sell goods to
the U.S. Among affiliates that sell locally, fewer than 25% also sell goods to the U.S. Our results are robust to
alternative instruments, including MNE affiliate sales to the ROW (rather than the local market), although we find
this alternative instrument weaker and less plausibly exogenous given the greater potential substitutability across
destinations for export-platform FDI. (Among the 35% of affiliates in our sample with positive sales to the rest of
the world, 53% also sell goods to the U.S.)26To preserve zeroes, we add one to (all) variables’ values before taking the natural log (thus we replace x with
ln(1 + x)); the usual caveats apply. See, e.g., Wooldridge (2009), page 192.

12
4. Data
Preferential Market Access. The dependent variable of interest is the rate of prefer-
ential market access to the U.S. by industry, country, and year (θcit). One way to measure
preferential market access is to use a direct measure of preference program eligibility. Using
data from the U.S. Trade Representative (USTR), we code every HTS-8 tariff line by country
and year as either eligible or ineligible for duty-free market access under an applicable U.S.
preference program (NAFTA, GSP, AGOA, etc.). We then use time invariant trade weights
(based on 1997 trade flows, just before our sample begins) to aggregate to the NAICS-4
industry level. The result is a weighted eligibility measure of duty-free access under any
preference program, Any Pref El.27
While this simple eligibility-based definition of the preferential treatment variable is
appealing in its parsimony, one can easily challenge the definition on the grounds that even
when program eligibility is indicated by official trade policy, preferential treatment is often
afforded to only a subset of the imports in question. Partial-year program eligibility and
“competitive need limitations” (CNLs) are one concern, while restrictive rules of origin and
other bureaucratic costs under some programs often make de jure preference eligibility useless
in practice.28
With these caveats in mind, we define a second form of the dependent variable Any Pref
Share using more detailed data from the U.S. International Trade Commission (USITC).
Each year, the USITC reports the proportion of bilateral trade that clears U.S. Customs
under each preferential program code, by industry and country of origin. We use this infor-
mation to construct our baseline measure of the dependent variable, Any Pref Share, so that
θcit is the (exact) share of country c exports of industry i in year t that entered U.S. Cus-
toms claiming duty-free access under any preferential program code. Note that this version
of the dependent variable offers the additional advantage that it does not require an ad-hoc
weighting scheme to aggregate to the NAICS-4 level.
27Our results are robust to removing the trade weights.28Foreign exporters often do not claim preferential access when ‘officially’ eligible; see Hakobyan (2015) on under-
utilization of GSP preferences. The relevant concern for our study would be if MNE foreign affiliates are more likely
to use preferential trade programs than non-affiliates (which is not obvious – disproportionate use of foreign-sourced
inputs may make rules of origin harder to satisfy for MNE affiliates). The robustness of our results to either preference
variable definition (usage or eligibility) suggests that this discrepancy is of minimal consequence in the context of our
study.
13
In addition to these two measures of U.S. preferential market access under any prefer-
ence program, we create versions of the dependent variables which only use GSP eligibility
(GSP El) and usage (GSP Share). We find GSP preferences of particular interest not least
because roughly two-thirds of country-industry-year observations with preferential market
access are afforded duty-free treatment through GSP.29 Moreover, the mechanics of the GSP
program feature important institutional differences compared to regional or other prefer-
ential programs: firms and other interest groups regularly take part in the formal annual
GSP review process, and there is considerable scope for discretion and annual variation in
eligibility due to human rights, labor, intellectual property, or competitive need limitations
violations. From an econometric perspective, the GSP-based preference measures are largely
immune from concerns over reciprocal trade policy or bilateral investment provisions that
could arise under other preference programs (i.e. Article XXIV free trade deals), and so may
offer cleaner identification of a causal mechanism.
Finally, to convince the reader that there is sufficient variation left to explain after
including country-, industry-, and year-fixed effects, we offer a set of simple plots in Figure
2.30 On the vertical axis, we plot the residual of our preferential market access variables (Any
Pref Share, GSP Share, Any Pref El, and GSP El) after controlling for country-, industry-,
and year-fixed effects. On the horizontal axis, we plot country GDP per capita. In each plot,
we see clearly that there is considerable variation in preferential market access under either
the share or eligibility definitions, and that the degree of variation is higher among the less
developed trading partners.
Multinational Affiliate Activity. The U.S. Bureau of Economic Analysis (BEA)
collects detailed firm level financial and operating data for all foreign affiliates of U.S. multi-
national firms in which a U.S. entity holds an ownership interest of 10% or more.31 We
29Weighting by trade volume, U.S. imports under GSP comprise only 7% of all preferential imports.30A literal reading of GATT rules might lead one to expect that country and industry fixed effects should absorb
most of the variation in trade preferences. (Article XXIV stipulates that among FTA partners, “virtually all” products
should be eligible for duty-free access, while the Enabling Clause specifies that preferences be granted by industry
and country, but not industry-country pair.)31These data are collected in the BEA’s benchmark and annual surveys of U.S. direct investment abroad for the
purpose of producing aggregate statistics on U.S. multinational company operations for release to the general public.
The confidential microdata that BEA maintains in its databases for research purposes are a by-product of its legal
mandate to produce for the public aggregate statistics on multinational corporation operations.
14
necessarily restrict our sample to majority owned foreign affiliates (MOFAs), as only MO-
FAs report sales disaggregated by destination.32 Affiliates are coded to NAICS-4 industries,33
which we aggregate by country and year to create the variable FDIcit: total sales of goods to
the U.S. by MNE affiliates in country c, industry i, and year t, prorated by U.S. ownership.34
For our instruments, we use the two additional measures from the BEA data discussed ear-
lier: total sales to the local market by only those MNE affiliates that do not also sell goods to
the U.S., and total affiliate sales of services (worldwide), again by only those MNE affiliates
that do not also sell goods to the U.S.
Control Variables. We include control variables at the country, industry, country-year,
industry-year, and country-industry-year levels as discussed in the previous section. Sources
and summary statistics are reported in Table 1.
Political Economy Measures. In several extensions, we explore the interaction be-
tween our key measures of domestic and multinational affiliate activity using explicit mea-
sures of the political organization of U.S. industries. Gawande and Bandyopadhyay (2000)
develop an indicator variable, Io, that takes a value of 1 for industries that are deemed po-
litically active based on political contributions and import penetration ratios.35 Bombardini
(2008) develops an alternative proxy for political participation based on the within-industry
dispersion of firm sales. We use two incarnations of her measure, ψtrue, which uses direct ev-
idence of lobbying participation, and ψsales, which is based on sales dispersion alone.36 Using
the BEA data on MNE sales, we also construct ψmne, a direct analog to the (domestic) sales
32MOFAs constitute the majority (70% in 2007) of all foreign affiliate sales of U.S. MNEs, and virtually all sales
when pro-rated by percentage of U.S. ownership.33The BEA uses modified ‘BEA NAICS’ codes for industry categorization. Most codes are identical to the standard
NAICS, but several are aggregations of standard NAICS (in which case we aggregate to concord the standard NAICS
to the coarser BEA NAICS), and a few others are a disaggregation of the standard NAICS, in which case we concord
the finer BEA NAICS to NAICS-4.34BEA survey form BE-10B requires MNE affiliates to report sales disaggregated by goods vs. services for each
destination market (local, U.S., or other). We map sales to NAICS industries according to each MNE affiliate’s
primary NAICS affiliation.35Gawande and Bandyopadhyay (2000) regress PAC contributions on import penetration ratios interacted with
2-digit SIC dummy variables. If the coefficient on the interaction term is positive for a given SIC-2, it is assumed
that all sub-industries within the SIC-2 category are politically active.36Mapping to Bombardini’s notation, ψsales ≡ θ(ρ = .5) while ψtrue is her “true theta” variable. See Bombardini
(2008) for a detailed description of the construction of these measures.
15
dispersion measure, ψsales.37 Descriptive statistics for these political economy measures are
included at the bottom of Table 1.
Our data set spans 184 countries, 80 industries, and 10 years (1997-2006), which falls to
a 9 year window when we introduce lags in the explanatory variables. In principle, we would
have 132,480 observations, but because our dependent variable is defined as the preferential
share of imports, we lose all country-industry-year observations for which U.S. imports are
zero, leaving us with 68,130 observations in our benchmark sample.38 When we consider
the effect of GSP preferences specifically, we use a reduced sample that includes only those
countries that are de jure GSP eligible. Table 1 summarizes the variables that we include in
our full (N = 68, 130) and reduced (N = 42, 849) samples and lists their sources. A list of
included countries and industries is available in the online appendix.
5. Results
Table 2 presents our benchmark estimation results. The first three columns report esti-
mates from panel IV specifications, while columns 4-6 report results from non-linear IV Tobit
specifications. We consider two definitions of the dependent variable: Any Pref Share, which
is defined as the share of imports by industry i from country c in year t for which duty-free
treatment was claimed under any trade preference program; and GSP Share, which is the
share of imports by industry i from country c in year t for which duty-free treatment was
claimed specifically under the U.S. GSP program. For the Any Pref Share specifications, we
use two samples – the full sample, which includes all countries in our data set, and a reduced
sample, which restricts attention to only (developing) countries that are de jure GSP eligible.
For the GSP Share specifications, we use only the reduced sample.
In the panel IV specifications, country- and industry-specific fixed effects are removed by
demeaning (with standard errors corrected accordingly); time-fixed effects are incorporated
as year dummies; and standard errors are clustered at the country level. In the interest of
space, the table reports coefficient estimates for only the variables of primary interest.39
37ψitmne ≡ .5µitmne+.5σitmne where µitmne and σitmne represent the normalized mean and standard deviation of affiliate
sales (worldwide) within industry i and year t.38For consistency across specifications, we use this smaller data set in robustness checks of the eligibility-based
dependent variable; our results are robust to using the larger data set.39Explanatory variables included in the panel IV specifications but not reported are U.S. import penetration (ln),
the annual log change of U.S. industry import penetration, number of U.S. establishments (ln), country population

16
The first column reports our benchmark case, estimating the effect of MNE goods sales
to the U.S. on the rate of preferential access under all preference programs granted to any
country in the full sample. Jumping immediately to the key result in the first row, we find
that a 10% increase in multinational sales to the U.S. implies roughly a 4 percentage point
increase in the share of imports receiving duty-free market access, which translates to a
20% increase in the rate of preferential access relative to the sample mean.40 The result is
statistically significant at the 5% level with clustering at the country level.
Reading down the table, all estimated coefficients for the remaining empirical predic-
tions take the expected sign and are statistically significant at least at the 5% level, with
the exception of the country-industry-year exports to the U.S., which are statistically in-
significant. Consistent with political economy motives, we find that as a domestic industry
grows relatively larger (as measured by U.S. domestic sales), it is more protected (offering
less generous trade preferences), and that this relationship is both economically large and
concave.41 We also find that preferences become less generous as MNE affiliate sales from
the ROW increase, which is once again consistent with our initial empirical predictions.
The theory did not offer clear priors for the sign of the remaining coefficients, but we ven-
ture that by at least a rough approximation, all of the estimates make sense. Our estimated
coefficients are positive and negative for MFN tariffs and total U.S. imports, respectively.
Tying back to the discussion in Section 2, the first result suggests that higher MFN tariffs
may indeed shift political attention towards the use of preferences, while the second is con-
sistent with the concern that increasing preferences for one country may reduce overall tariff
revenue from the rest of the world via trade diversion. Finally, as one might expect, healthier
U.S. industries with rising payrolls and faster year-on-year employment growth tend to of-
fer more generous preferential access (or put another way, senescent industries receive more
protection); at the same time, increasing the number of domestic employees (holding payroll
fixed) seems to attract more protection in the form of a lower trade preference share.
Notice that the excluded instruments perform well in terms of explaining the potentially
endogenous variable MNE sales of goods to U.S. The first stage results are as expected: the
(ln), and GDP per capita (ln). Of these, only the country GDP per capita and the number of U.S. establishments
are significant at the 10% level.40From Table 1, the average rate of preferential market access is 19.8% in the full sample.41Our coefficient estimates imply that the derivative of Any Pref Share with respect to U.S. domestic sales is
negative for all values of domestic sales in our sample.

17
first stage coefficient estimates for the instruments MNE local sales and MNE service sales
are positive and significant, and the F-statistic for the excluded instruments is 17.30 (p-
value < .001).42 Finally, the J-statistic p-value of 0.869 exceeds 0.1 by a substantial margin,
passing at least this simple test for instrument validity.43
In column 2 of Table 2, we restrict the sample to exclude countries that are de jure GSP
ineligible under the 1974 Trade Act.44 In the reduced sample, 91% of observations apply to
currently GSP eligible countries, opposed to 57% in the full sample. The effect of removing
the de jure GSP ineligible countries is striking: under the otherwise identical specification,
the estimated effect of vertical FDI more than triples compared to the full sample result in
column 1. Among developing (potentially GSP-eligible) countries, a 10% increase in MNE
sales to the U.S. leads to a 14.7 percentage point increase in the share of U.S. imports
claiming any preferences. This effect is statistically significant at the 5% level, clustering at
the country level.
In column 3 of Table 2, we reestimate the model using GSP Share as the dependent
variable. Among potentially GSP-eligible countries, a 10% increase in MNE sales to the
U.S. leads to a 14.9 percentage point increase in the share of U.S. imports claiming GSP
preferences, statistically significant at the 1% level. A priori, one might have anticipated
that trade preferences for poorer countries would be less responsive to MNE activity, but
clearly we find no support for such a view.
The remaining variable coefficient estimates in columns 2 and 3 are consistent with
our results in the full sample except that the effect of MNE affiliate sales from the ROW is
42The estimation results are very similar to the just-identified version of the model (not reported here), offering
comfort that the over-identified model has not introduced systematic bias. An additional test for bias in over-identified
models, comparing 2SLS results against LIML, also revealed no meaningful changes in the results. See Angrist and
Pischke (2009), p. 209.43As an additional test of instrument performance and potential reverse causality, we run a three-stage least
squares (3SLS) specification in which our measure of FDI (MNE sales to the U.S.) is determined by trade preferences
and our existing instruments. The coefficient estimate for the effect of MNE Sales to the U.S. on Any Pref Share
remains remarkably similar at .412∗∗∗. Checking the reverse causality, we find that MNE sales to the U.S. depend
positively and significantly (at the 1% level) on Any Pref Share (with a coefficient estimate of .022∗∗∗); MNE local
sales (.076∗∗∗); and MNE service sales (.427∗∗∗). Complete results of this estimation are available from the authors
upon request.44Countries are deemed ineligible if they are members of the European Union, have high income according to the
World Bank, are communist, have terrorist ties, or are members of an arrangement aiming at withholding supplies
of vital commodities. The last two criteria appear to be implemented with considerable discretion, however, so we
restrict the sample to exclude countries under only the first three criteria.
18
muted among developing countries, as one might expect to the extent that the trade diversion
induced by a developing country is less likely to impose a competitive disadvantage on affiliate
imports from the ROW.45
Finally, note that the instruments are somewhat weaker in the restricted sample, presum-
ably because there are fewer industries among the developing countries with both market-
seeking (local sales) affiliates and offshoring MNE affiliates selling goods back to the U.S.
At the same time, instrument validity appears of little concern given J-statistic p-values of
approximately 100% in these GSP-program specific specifications of the model.46
In the right half of Table 2, we turn to an IV Tobit specification for both the full
and reduced samples, with double-censoring to restrict θcit ∈ [0, 1]. As we noted earlier,
demeaning the data to remove country- and industry-fixed effects is a legitimate exercise
only in a linear framework, so we include country-, industry-, and year-fixed effects through
dummy variables. Due to computational limitations in the estimation of the IV Tobit model
with these three dimensions of fixed effects, we revert to a just-identified specification, reduce
the set of controls to include only those explicitly specified by the theory, and resort to the
Newey (1987) two-step estimation procedure to achieve convergence.47
Columns 4 and 5 of Table 2 report results for the share of imports entering the U.S.
duty-free under any preference program for the full and the reduced sample, while column
6 provides results for the share of imports entering the U.S. duty-free under GSP for the
reduced data set. The results are qualitatively similar to the results of the IV panel esti-
mation, in that we find a strong positive effect of MNE sales on U.S. preferences, but the
coefficient estimates are uniformly higher. For the Any Pref Share variable in column 4,
the estimated effect of MNE sales to the U.S. more than triples compared to the IV panel
specification, which suggests that in the full sample, our baseline linear specification may
understate the effect of offshoring by multinationals on U.S. trade preferences. Reducing
the sample to include only the de jure GSP-eligible countries in column 5 leads to roughly
45Among the not reported variable coefficients, per capita GDP loses statistical significance in the reduced sample.46In the 3SLS specification of this regression, we find that MNE sales to the U.S. continue to depend positively
and significantly (at the 1% level) on our instruments, MNE local sales (coefficient estimate .096∗∗∗) and MNE service
sales (.273∗∗∗), but the reverse causality running from trade preferences (GSP Share) to vertical FDI is now negative
and weaker (coefficient estimate −.014∗∗). Again, complete 3SLS results are available upon request.47Unfortunately, Newey two-step estimation precludes clustering and limits the set of available post estimation
statistics.

19
the same estimated effect of FDI on preferences as in the full sample, and the results are
markedly closer to our linear model findings in the left half of Table 2, suggesting that the
extent of downward bias in the linear model is much less acute in the reduced sample. The
coefficient estimate is even higher if the dependent variable is the GSP share, which indi-
cates that a 10% increase in MNE sales back to the United States is associated with a 20
percentage point increase in the rate of preferential access for countries and industries that
already have some degree of preferential access at the NAICS-4 level. Finally, note that most
of the censoring is at zero (55% of the observations for the Any Pref Share variable in the full
sample) rather than 1 (just under 5% of the sample for the same dependent variable), which
suggests that the lower bound at zero is likely responsible for bias in the linear specification
results.
Summarizing our results thus far, we draw three broad conclusions. First, the empirical
results are qualitatively consistent with the theory, and our instruments perform strongly
in the full sample and only somewhat less so in the reduced sample. The key finding is
that U.S.-bound sales by foreign affiliates of U.S. MNEs seem to increase the rate at which
exports from the MNE host country and industry will be afforded preferential market access.
Under the benchmark linear panel IV specification, a 10% increase in MNE sales to the U.S.
is associated with an increase in preferential tariff exemption of about 20% of the mean for
the sample of all countries.
Second, the effect seems to be much stronger among developing countries and under the
GSP program. When we restrict the sample to exclude de jure GSP ineligible countries, we
find that the estimates for both all preferences and GSP preferences rise more than threefold
relative to the full sample findings. Moreover, in the reduced sample, the estimate for the
effect of MNE sales on GSP preferences is slightly higher than that for all preference programs
in general.
Lastly, the IV Tobit specification suggests that the linear IV panel estimates could rep-
resent a lower bound on the effect of MNE activity on preferential market access. In the IV
Tobit specification, the effect of a 10% increase in MNE sales back to the U.S. entails a 15.4
percentage point increase in the rate of preferential market access under any program in the
full sample and a 20 percentage point increase in the rate of preferential market access under
GSP in the reduced sample.
20
6. Extensions and Robustness Checks
We now consider several extensions to the benchmark specification to further our under-
standing of the underlying mechanism and to test the robustness of our baseline results.
Political Economy Motivations. Given the potential for political lobbying to in-
fluence trade policy, we introduce interaction terms for both U.S. domestic sales and our
measure of MNE offshoring with an indicator variable for whether or not an industry is
politically organized, in the spirit of the Goldberg and Maggi (1999) and Gawande and
Bandyopadhyay (2000) tests of the ‘Protection for Sale’ model (Grossman and Helpman,
1994). As described in Section 4, we use two distinct measures of political organization:
the widely-used Gawande and Bandyopadhyay (‘GB’) binary variable designation of indus-
try organization and a continuous political activity measure based on firm size dispersion
developed more recently by Bombardini (2008).
Table 3 reports the results. The first three columns use the binary GB indicator for
political organization, while the last two columns also incorporate firm-size distributions
based on Bombardini (2008). Note that the sample size falls somewhat because the GB
measures are not available for several industries.
Column 1 tests the performance of the GB measure for domestic demand for protection
within our context: thus, we interact only U.S. domestic sales with the GB indicator of
political organization, but leave the MNE sales measures unchanged from the baseline spec-
ification. Consistent with the existing literature, we find that the interaction between U.S.
domestic sales and political organization is strongly negative and significant – suggesting
that import protection (i.e. less preferential market access) is afforded to larger domestic
industries only if they are also politically active.48 Notice that the estimated effect of MNE
goods sales to U.S. rises nearly twofold relative to the benchmark case, which suggests that
by omitting explicit measures of domestic political organization, our benchmark specifica-
tion may understate the effect of MNE activity on U.S. trade preferences. The remaining
coefficient estimates are consistent with our earlier findings.49
48The coefficient estimate for the un-interacted U.S. domestic sales term is no longer statistically different from
zero.49In the interest of space, we suppress results for several of the control variables; the set of included controls is
unchanged, all coefficient estimates are in line with earlier findings for the benchmark case.
21
The remaining columns of Table 3 reestimate the model including political economy in-
teractions for both U.S domestic sales and the key measure of MNE offshoring activity; our
implicit assumption is that the GB and Bombardini measures of domestic political orga-
nization also reflect political organization by multinational firms within the same industry.
All else equal, we expect the interaction between MNE sales to the U.S. and political orga-
nization to be positive if indeed U.S trade preferences are differentially more responsive to
politically active multinationals. Scanning the point estimates in the first and second rows
of Table 3 in columns 2 through 5, we find evidence broadly suggestive that this is true.
In column 2, the coefficient estimate for MNE sales to the U.S. remains significant and
positive, which suggests that our mechanism operates even for unorganized industries. The
coefficient estimate for the interaction term is roughly of the same magnitude, which sug-
gests moreover that politically organized industries are offered more than double the rate
of preferential access for a marginal increase in MNE sales. Both coefficient estimates are
positive and significant at the 5% level or more with robust standard errors. The remain-
ing estimates are quantitatively very similar to the results in column 1, and need not be
repeated. Column 3 reports the same results with standard errors clustered at the country
level; statistical significance falls to roughly the 10% level, as one might anticipate given the
weaker first stage with multiple endogenous regressors.50
Columns 4 and 5 repeat the exercise using measures of political organization based on
Bombardini (2008). In column 4, we interact both U.S. domestic sales and MNE sales with
ψtrue, which is the share of U.S. industry sales by firms above a certain size threshold (at
least as large as the smallest politically active firm based on political contribution data)
interacted with the GB measure of political activity. In column 5, we interact U.S. domestic
sales with Bombardini’s ψsales, which is the normalized average of the mean and standard
deviation of firm sales within each U.S. industry (again, interacted with the GB measure
of political organization). Using the BEA’s firm level data on MNE affiliate sales, we cre-
ate an MNE-specific analog to Bombardini’s measure, ψmne, to interact with our measure
of MNE sales. Both specifications using Bombardini’s political economy measures deliver
higher estimates for MNE sales absent the political economy interaction, with somewhat
50In columns 2 and 3, we add an additional instrument that interacts local MNE sales with the political organiza-
tion measure; the F statistic falls somewhat as one might anticipate with two endogenous regressors. The Hansen’s
J statistic p-value remains sufficiently high not to trigger concerns over instrument validity.
22
weaker evidence of a differential trade policy response to MNE sales in politically organized
industries. (Neither specification can withstand clustering at the country level; perhaps this
is less surprising given that the continuous interaction term is noisier than the binary GB
measure.) Interestingly, we find that the Bombardini measures suggest that domestic pro-
tection seekers (proxied by U.S. domestic sales) gain little additional influence relative to
unorganized industries, counter to the findings with the GB measure.
While we remain cautious not to overstate the power of these results, they certainly
suggest that politics – and in particular political lobbying – may play an important role in
amplifying the mechanism. Moreover, they offer some additional evidence on the direction
of causality driving our results. If the concern is that preferential market access is driving
MNE sales to the U.S. (and not the reverse), it is hard to explain why the effect would
depend on the political organization of the domestic industry.51
Falsification Tests. In Table 4, we offer additional evidence that U.S. trade preferences
are responding to MNEs’ sales back to the U.S., rather than some other correlated deter-
minants of FDI that depend on the general attractiveness of the host country for foreign
investors. For ease of comparison, we re-report the results from our benchmark specification
with the full sample in the first column.
In column 2, we replace MNE goods sales to the U.S. by only the MNE goods sales to
the U.S. that go to affiliated buyers (e.g. MNE parent or ‘sibling affiliates’).52 Our prior is
that these sales will have a stronger effect on trade preferences because more generous trade
preferences are then beneficial for U.S. multinationals for two reasons: the foreign affiliates
themselves will become more profitable and, moreover, some of the cost savings from lower
tariffs may be passed onto the U.S. parent buying those imports. Indeed, in column 2 we
observe that the coefficient on the new explanatory variable is slightly higher. However,
this increase is quite small and the level of significance remains at 5% as before. From this,
we conclude that the positive effect of export-platform FDI on trade preferences does not
critically hinge on the idea that affiliate-produced inputs become cheaper for U.S. firms, but
rather on the prospect of foreign MNE affiliates’ increased profitability.
51We are grateful to an anonymous referee for this insight.52Buyer affiliation is a BEA designation.

23
In column 3, we replace the key explanatory variable, MNE goods sales to the U.S.,
with MNE goods sales to the rest of the world (ROW) by all MNEs that are not also
simultaneously selling goods to the U.S. For good measure, we additionally restrict attention
to MNE sales to only unaffiliated (arms-length) buyers to avoid potential contamination by
supply chain relationships within an MNE’s multi-country umbrella. The falsification test
is based on the idea that MNE sales to anywhere other than the United States should in
principle have no effect on U.S. trade preferences or even a small negative effect (via general
equilibrium effects), holding all else equal. In the third row of column 3, however, we
find the estimated effect to be positive, albeit smaller and noisier. That said, we are not
particularly surprised by this finding, since MNE affiliate sales are positively correlated across
destinations: our positive result in column 3 might simply reflect omitted variable bias (the
fact that we have not controlled for MNE sales to the U.S.). Once we reestimate the model
controlling for U.S.-bound MNE sales in column 4, we indeed find the theoretical predictions
validated: the coefficient on MNE goods sales to the U.S. is positive (and increased by
roughly half compared to the baseline specification), whereas the effect of MNE goods sales
to unaffiliated buyers in the ROW on trade preferences is smaller in size and negative.53
In column 5, we check whether the MNE sales to the local market (again, by firms that
are not also selling goods to the U.S.) have any impact on U.S. trade preferences; i.e., we
include one of our previously excluded instruments in the main specification. As replacement
for the excluded instrument, we introduce MNE sales to unaffiliated buyers in the ROW.
The coefficient of the previously excluded instrument, MNE sales to the local market, is very
small and statistically insignificant. This result is in keeping with the exclusion restriction
and offers more evidence that simply increasing the attractiveness of the local FDI-host
country for foreign investors without increasing sales to the U.S. is not enough to obtain
more preferential market access.54
Alternative Specifications and Dependent Variables. As an additional robust-
ness check, we report results from a set of alternative econometric specifications. First, we
53In column 4, we instrument for MNE goods sales to the U.S. but not MNE sales to the rest of the world, as the
latter satisfies the exclusion restriction. Estimates are little changed (qualitatively or quantitatively) if we instrument
for both MNE sales variables.54This result argues against the potential concern that U.S. trade preferences might be a reciprocal “favor” offered
to FDI host countries in exchange for more favorable investment conditions.

24
consider two reduced form (no IV) linear versions of the model – one panel and the other
pooled.55 In a second robustness exercise, we consider the alternative definitions of trade
preferences based on official program eligibility, which we aggregate to 4-digit NAICS using
historical (1997) trade volumes.56
Table 5 reports the results using the full sample for the dependent variables Any Pref
Share and Any Pref El and the reduced sample for GSP Share and GSP El. For brevity,
the table lists only the coefficient estimate of interest – MNE sales to the U.S. – for each
specification. Each cell in the table reports the key coefficient of interest for the model
defined by the row label and the dependent variable definition designated by the column
heading. For ease of reference, we also include the already reported baseline results from the
linear panel IV and IV Tobit specifications.
Scanning the results in Table 5, the estimated relationship between MNE sales to the U.S.
and trade preferences is broadly consistent across specifications and alternative definitions of
the dependent variable. To evaluate the potential impact of alternative dependent variable
definitions, we compare results across columns (1) and (2) for the effect of MNE sales on
preferences granted under any program to any country, and columns (3) and (4) for the effect
of MNE sales on GSP preferences offered to developing countries. Making these comparisons,
we see that the estimates are generally similar across the two dependent variable definitions.
The point estimates for the eligibility based measures of trade preferences are smaller and
noisier than those for the share based variable definitions in the full sample, while the
eligibility and share based variable definitions line up closely in the reduced sample. Finally,
the GSP estimates are typically larger and more precisely estimated than the Any Pref
estimates throughout.
Comparing the model specifications across rows, we note the panel instrumental variables
results to be quantitatively consistent across specifications in both the full sample and even
more so in the reduced sample. The OLS specifications yield smaller estimates, but remain
positive and statistically significant. To summarize, while the coefficient estimates vary,
55We report significance for unclustered heteroskedasticity-robust and country-cluster robust standard errors in the
panel OLS version and unclustered and two-way clustered (industry and country) standard errors in the pooled OLS
version. The pooled version includes year fixed effects and time invariant controls: country distance and indicators
for the textile and agricultural sectors.56We also test unweighted aggregations of the preference eligibility variables and find qualitatively consistent
results.
25
they are consistently positive and significant in most of the variants of the model reported
in Table 5.
Pairwise Fixed Effects. Pushing the data in a different direction, we explore within-
group variation more deeply by including pairwise fixed effects in Table 6. In columns
1 and 2, we rerun the baseline panel IV model for the full sample two more times: first
with industry-year pair-fixed effects, country dummies, and the (instrumented) explanatory
variable, MNE goods sales to the U.S., and then again with country-year pair-fixed effects,
industry dummies, and (instrumented) MNE goods sales to the U.S. In each instance, we
still find that the coefficient of our key explanatory variable of interest, MNE goods sales
to the U.S., is positive and highly statistically significant, while the instruments continue to
perform exceptionally well (with a strong first stage and high J statistic p-value).
The results for the reduced sample in columns 3 and 4 show once again that the impact
of MNE goods sales to the U.S. is even more pronounced (higher by a factor of about
4 compared to columns 1 and 2) when we use the reduced sample and GSP share as the
dependent variable. As in the IV panel specification, we observe that the instruments appear
weaker, whereas the J statistic p-value increases.
7. Closing Remarks
In this paper, we examine the relationship between U.S. multinational affiliates and the
structure of preferential tariff access to the United States. Combining firm level panel data
on U.S. foreign affiliate activity from the U.S. Bureau of Economic Analysis (BEA) with
detailed measures of implemented U.S. trade preferences from the U.S. International Trade
Commission (USITC), we obtain a rich panel data set spanning 80 industries, 184 countries,
and ten years (1997-2006).
Using instrumental variables to account for the endogeneity of export-oriented foreign
investment, we show that more export platform FDI causes more generous trade preferences
for goods originating from the country and industry towards which FDI is directed: within
a given (4-digit NAICS) industry in a given country and year, a 10% increase in U.S. foreign
affiliate exports to the U.S. is associated with roughly a 4 percentage point increase in the rate
of preferential duty-free access from all preferential programs combined. We find moreover
that GSP preferences, which are in principle designed to offer developing countries ‘aid

26
through trade’ market access, seem to be particularly sensitive to MNE activities. Among
countries eligible for the Generalized System of Preferences (GSP), a 10% increase in MNE
sales to the U.S. is associated with a 14.9 percentage point increase in the share of goods
claiming GSP preferences. We find this positive and significant relationship between U.S.-
bound MNE sales and preferential treatment to be remarkably robust across a variety of
model specifications and robustness checks.
As with any empirical study, there are caveats. The first is that our key explanatory
variable, U.S.-bound MNE goods sales, almost certainly understates the extent of U.S. in-
terests in the foreign export sector. Our data do not capture foreign arms-length suppliers
to U.S. firms (multinational or otherwise) that may have as much sway in the preference
setting process as the formal affiliates we measure in the BEA data. To the extent that
we undercount the extent of U.S. MNE interests relative to the remaining variables, our
quantitative estimates for the effect of MNE sales on U.S. trade preferences will be biased
upward. By the same token, our results underestimate the political economy motive (if not
the implementation) to the extent that WTO non-discrimination guidelines under Article
XXIV and the Enabling Clause are binding. Absent these GATT limitations, our results
suggest that discretionary application of trade preferences to favor a country’s MNE affiliates
would be even greater.
Even amid these qualifications, we conclude that discretionary trade preferences are
influenced in part by the importing country’s multinational firms’ foreign direct investment
decisions. The results are strong; the implication is clear: investment matters. Whether this
policy sensitivity is good or bad depends on how the interplay between FDI, multinational
firms, and trade policy manifests in practice. For some trading partners, generous preferential
tariff treatment may foster additional export-oriented investment, reinforcing a virtuous
cycle of improved market access and increased FDI. To the extent that the same mechanism
induces significant investment and trade diversion, however, other countries may be left out
entirely. How these competing effects play out in coming years will remain an important
question for researchers and policy makers alike.
27
References
Angrist, Joshua D., and Jorn-Steffen Pischke (2009): Mostly Harmless Economet-
rics. Princeton University Press, Princeton.
Bagwell, Kyle, and Robert Staiger (1999): “An Economic Theory of the GATT,”
American Economic Review, 89, 215–48.
Baier, Scott L., and Jeffrey H. Bergstrand (2004): “Economic Determinants of
Free Trade Agreements,” Journal of International Economics, 64, 29–63.
Balasubramanyam, V. N., David Sapsford, and David Griffiths (2002): “Regional
Integration and FDI: Theory and Preliminary Evidence,” Manchester School, 7, 460–482.
Bhagwati, Jagdish, Pravin Krishna, and Arvind Panagariya (eds.) (1999): Trad-
ing Blocs: Alternative Approaches to Analyzing Preferential Trade Agreements. MIT Press,
Cambridge, Mass.
Blanchard, Emily, and Shushanik Hakobyan (2014): “The U.S. Generalized System
of Preferences: In Principle and Practice,” World Economy, forthcoming.
Blanchard, Emily, and Xenia Matschke (2006): “Preliminary Evidence on the Link
Between Bilateral Investment and Trade Deals,” Mimeo.
Blanchard, Emily J. (2007): “Foreign Direct Investment, Endogenous Tariffs, and Pref-
erential Trade Agreements,” B.E. Journal of Economic Analysis and Policy - Advances,
7, Article 1.
Blanchard, Emily J. (2010): “Reevaluating the Role of Trade Agreements: Does In-
vestment Globalization Make the WTO Obsolete?,” Journal of International Economics,
82(1), 63–72.
Bombardini, Matilde (2008): “Firm Heterogeneity and Lobbying Participation,” Journal
of International Economics, 75(2), 329–348.
Bombardini, Matilde, and Francesco Trebbi (2011): “Votes or Money? Theory and
Evidence from the US Congress,” Journal of Public Economics, 95, 587–611.
DeVault, James M. (1996): “Political Pressure and the U.S. Generalized System of Pref-
erences,” Eastern Economic Journal, 22, 35–46.
Gawande, Kishore, and Usree Bandyopadhyay (2000): “Is Protection for Sale? Evi-
dence on the Grossman-Helpman Theory of Endogenous Protection,” Review of Economics
and Statistics, 82, 139–152.

28
Goldberg, Pinelopi K., and Giovanni Maggi (1999): “Protection for Sale: An Em-
pirical Investigation,” American Economic Review, 89, 1135–1155.
Grossman, Gene M., and Elhanan Helpman (1994): “Protection for Sale,” American
Economic Review, 84, 833–850.
Hakobyan, Shushanik (2015): “Accounting for Underutilization of Trade Preference Pro-
grams: U.S. Generalized System of Preferences,” Canadian Journal of Economics, forth-
coming.
Johnson, Harry G. (1951-52): “Optimum Welfare and Maximum Revenue Tariffs,” Re-
view of Economic Studies, 19, 28–35.
Kee, Hiau-Looi, Marcelo Olarreaga, and Peri Silva (2007): “Market Access for
Sale,” Journal of Development Economics, 82, 79–94.
Lederman, Daniel, and Caglar Ozden (2007): “Geopolitical Interests and Preferential
Access to U.S. Markets,” Economics and Politics, 19, 235–258.
Ludema, Rodney D., Anna Maria Mayda, and Prachi Mishra (2011): “Protection
for Free? The Political Economy of U.S. Tariff Suspensions,” CEPR Discussion Paper
9626.
Magee, Christopher (2003): “Endogenous Preferential Trade Agreements: An Empirical
Analysis,” B.E. Journal of Economic Analysis and Policy - Contributions, 2, Article 15.
Motta, Massimo, and George Norman (1996): “Does Economic Integration Cause
Foreign Direct Investment?,” International Economic Review, 37, 757–83.
Ozden, Caglar, and Eric Reinhardt (2005): “The Perversity of Preferences: GSP and
Developing Country Trade Policies 1976-2000,” Journal of Development Economics, 78,
1–21.
Wooldridge, Jeffrey M. (2009): Introductory Econometrics: Fourth Edition. Thomson.
29
U.S.
ROW
US affiliates that sell goods to
U.S. US affiliates
that do not sell goods to U.S.
goods sales in
industry i to U.S. service
sales in industry i
Z2ict
Xict
Z1ict
Local market
local sales of goods & services in industry i
Figure 1. Sketch of Instrumentation Strategy
We construct two instruments for sales of goods to the U.S. by affiliates of U.S. MNEs,
denoted Xict above.
• Instrument Z1ict represents sales to the local market (of goods and services) by only
those affiliates of U.S. MNEs that do not also sell goods to the U.S. market.
• Instrument Z2ict includes worldwide sales of services (only), again by only those affil-
iates of U.S. MNEs that do not also sell goods to the U.S.
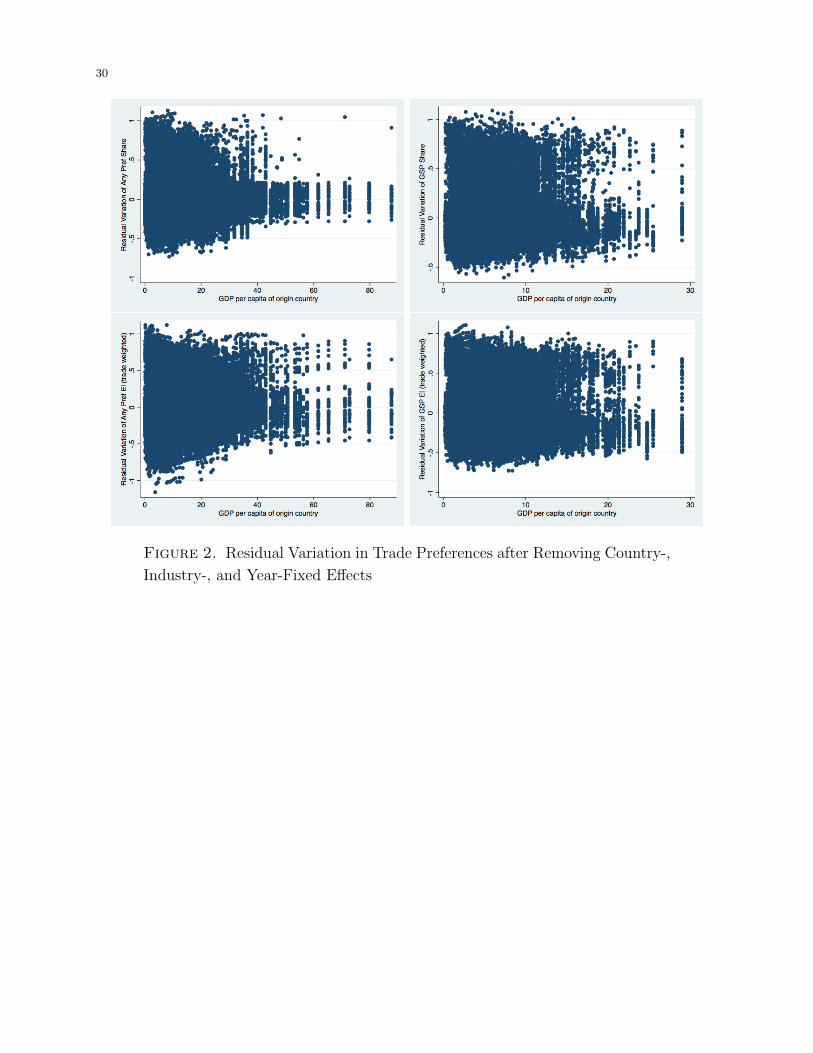
30
Figure 2. Residual Variation in Trade Preferences after Removing Country-,
Industry-, and Year-Fixed Effects

31
Table 1. Data Summary Statistics
Full Sample Reduced Sample
Variable; Source Mean SD Min Max Mean SD
distance to U.S. (km); www.timeanddate.com 8, 305 3, 681 734 16, 357 8, 297 3, 698
terrorist; CIA World Fact Book .013 .115 0 1 .021 .144
communist; CIA World Fact Book .021 .143 0 1 0 0
population (b.); Penn World Tables (PWT) .051 .168 .00002 1.314 .046 .136
per capita GDP (USD); PWT 13, 547 11, 776 288.4 87, 825 6, 531 4, 604
textile indicator .058 .234 0 1 .066 .249
agriculture indicator .035 .184 0 1 .041 .197
U.S. employees (m.); US Census .318 .550 .015 3.47 .343 .585
U.S. payroll (mUSD); US Census 8.69 7.06 .678 35.3 8.99 7.15
U.S. sales (mUSD); US Census 62.3 54.1 5.03 546.8 63.5 52.8
U.S. total imports (bUSD); USITC, USTR 17.2 23.2 .090 214.7 17.8 22.8
MFN ad-valorem eqv. (wt); USITC, USTR .027 .039 0 1.36 .029 .043
U.S. num. establishments (th.); US Census 41.9 192.1 .092 1, 151 47.7 205.3
U.S. import penetration .990 .017 .600 1.00 .990 .015
log change U.S. employees −.031 .061 −.494 .145 −.032 .061
log change U.S. import pen. .001 .005 −.020 .176 .001 .004
c- i- t- exports to U.S. (bUSD); UN Comtrade .161 1.18 2.5x10⁻⁷ 59.2 .047 .400
country curr. GSP el.; USTR .573 .495 0 1 .910 .287
country de jure GSP inel.; USTR .371 .483 0 1 0 0
industry curr. GSP el.; USITC, USTR .996 .064 0 1 .997 .057
Any Pref Share; USITC, USTR .198 .340 0 1 .276 .377
GSP Share; USITC, USTR .122 .275 0 1 .193 .326
El Any Pref (hwt); USITC, USTR .288 .392 0 1 .348 .422
El GSP (hwt); USITC, USTR .206 .367 0 1 .327 .416
MNE goods sales to U.S. (bUSD); BEA .027 .515 0 D .0063 .1271
MNE goods sales to U.S. (prorated by ownership) .026 .509 0 D .0062 .1268
(instr.) MNE local sales† (bUSD); BEA .041 .245 0 D .014 .111
(instr.) MNE services sales† (mUSD); BEA .349 8.67 0 D .087 3.31
any MNE; BEA .307 .461 0 1 .198 .399
rest of world MNE goods sales to U.S. (bUSD); BEA 2.43 6.11 0 D 2.41 5.72
political org., Io; Gawande-Bandyopadhyay (2000) .472 .499 0 1 .466 .499
political dispersion, ψtrue; Bombardini (2008) .270 .173 0 .866 .264 .171
political dispersion, ψsales; Bombardini (2008) .041 .064 .005 .634 .038 .056
political dispersion, ψmne; BEA .017 .060 0 1 .011 .049
68130 (42849) observations in full (reduced) sample; ‘D’: BEA data redacted for confidentiality, used in analysis.
† Indicates sales by only those MNE affiliates that are not also selling goods to the U.S.
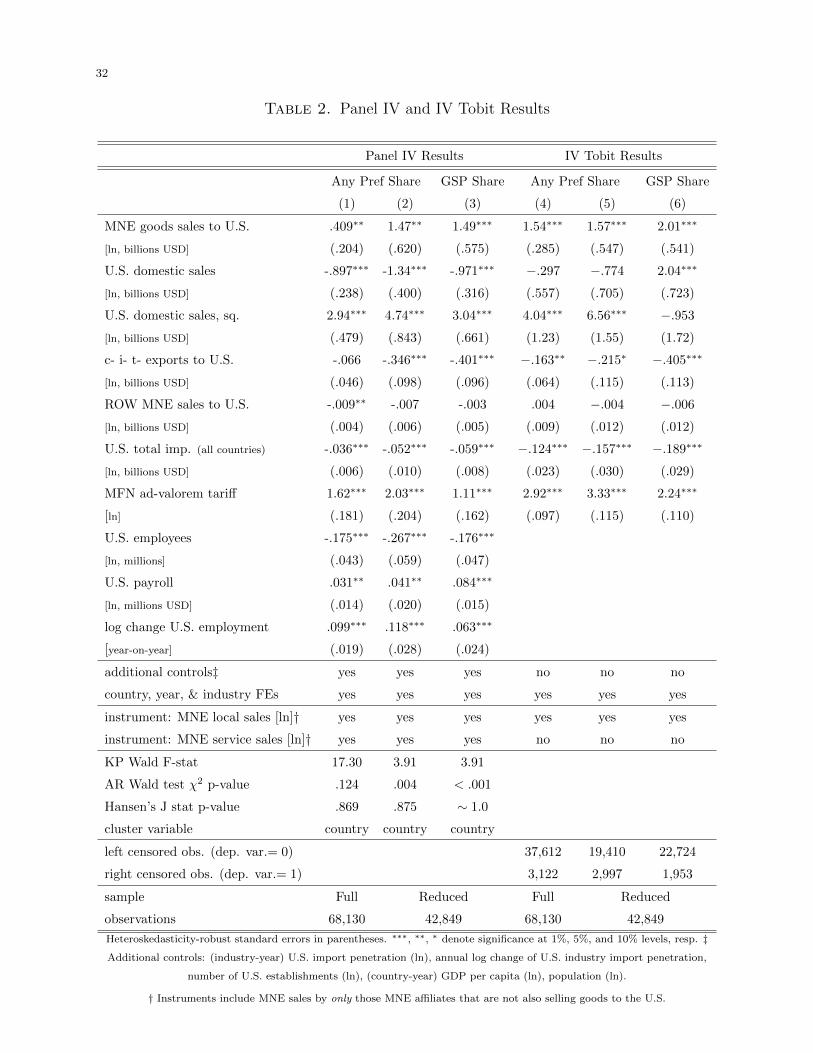
32
Table 2. Panel IV and IV Tobit Results
Panel IV Results IV Tobit Results
Any Pref Share GSP Share Any Pref Share GSP Share
(1) (2) (3) (4) (5) (6)
MNE goods sales to U.S. .409∗∗ 1.47∗∗ 1.49∗∗∗ 1.54∗∗∗ 1.57∗∗∗ 2.01∗∗∗
[ln, billions USD] (.204) (.620) (.575) (.285) (.547) (.541)
U.S. domestic sales -.897∗∗∗ -1.34∗∗∗ -.971∗∗∗ −.297 −.774 2.04∗∗∗
[ln, billions USD] (.238) (.400) (.316) (.557) (.705) (.723)
U.S. domestic sales, sq. 2.94∗∗∗ 4.74∗∗∗ 3.04∗∗∗ 4.04∗∗∗ 6.56∗∗∗ −.953
[ln, billions USD] (.479) (.843) (.661) (1.23) (1.55) (1.72)
c- i- t- exports to U.S. -.066 -.346∗∗∗ -.401∗∗∗ −.163∗∗ −.215∗ −.405∗∗∗
[ln, billions USD] (.046) (.098) (.096) (.064) (.115) (.113)
ROW MNE sales to U.S. -.009∗∗ -.007 -.003 .004 −.004 −.006
[ln, billions USD] (.004) (.006) (.005) (.009) (.012) (.012)
U.S. total imp. (all countries) -.036∗∗∗ -.052∗∗∗ -.059∗∗∗ −.124∗∗∗ −.157∗∗∗ −.189∗∗∗
[ln, billions USD] (.006) (.010) (.008) (.023) (.030) (.029)
MFN ad-valorem tariff 1.62∗∗∗ 2.03∗∗∗ 1.11∗∗∗ 2.92∗∗∗ 3.33∗∗∗ 2.24∗∗∗
[ln] (.181) (.204) (.162) (.097) (.115) (.110)
U.S. employees -.175∗∗∗ -.267∗∗∗ -.176∗∗∗
[ln, millions] (.043) (.059) (.047)
U.S. payroll .031∗∗ .041∗∗ .084∗∗∗
[ln, millions USD] (.014) (.020) (.015)
log change U.S. employment .099∗∗∗ .118∗∗∗ .063∗∗∗
[year-on-year] (.019) (.028) (.024)
additional controls‡ yes yes yes no no no
country, year, & industry FEs yes yes yes yes yes yes
instrument: MNE local sales [ln]† yes yes yes yes yes yes
instrument: MNE service sales [ln]† yes yes yes no no no
KP Wald F-stat 17.30 3.91 3.91
AR Wald test χ2 p-value .124 .004 < .001
Hansen’s J stat p-value .869 .875 ∼ 1.0
cluster variable country country country
left censored obs. (dep. var.= 0) 37,612 19,410 22,724
right censored obs. (dep. var.= 1) 3,122 2,997 1,953
sample Full Reduced Full Reduced
observations 68,130 42,849 68,130 42,849
Heteroskedasticity-robust standard errors in parentheses. ∗∗∗, ∗∗, ∗ denote significance at 1%, 5%, and 10% levels, resp. ‡
Additional controls: (industry-year) U.S. import penetration (ln), annual log change of U.S. industry import penetration,
number of U.S. establishments (ln), (country-year) GDP per capita (ln), population (ln).
† Instruments include MNE sales by only those MNE affiliates that are not also selling goods to the U.S.

33
Table 3. Political Economy Interactions
Gawande-Bandyopadhyay Bombardini
Dependent variable: Any Pref Share (1) (2) (3) (4) (5)
MNE goods sales to U.S. .731∗∗ .413∗∗ .413∗ .590∗∗∗ .669∗∗∗
[ln, billions USD] (.313) (.173) (.230) (.175) (.184)
MNE sales to U.S. × Pol. Org .598∗∗∗ .598 .470∗ .921
[ln, billions USD] (.159) (.376) (.240) (.822)
U.S. domestic sales -.281 -.127 -.127 -.928∗∗ -.995∗∗
[ln, billions USD] (.364) (.388) (.363) (.400) (.400)
U.S. domestic sales × Pol. Org. -1.26∗∗∗ -1.44∗∗∗ -1.44∗∗∗ -.317 -1.52
[ln, billions USD] (.272) (.279) (.280) (.530) (3.31)
U.S. domestic sales, sq. 1.69∗∗ 1.51∗∗ 1.51∗∗ 2.94∗∗∗ 3.04∗∗∗
[ln, billions USD] (.659) (.766) (.647) (.789) (.791)
c- i- t- exports to U.S. -.110∗∗ -.116∗∗∗ -.116∗∗ -.108∗∗∗ -.112∗∗∗
[ln, billions USD] (.052) (.038) (.052) (.030) (.030)
ROW MNE sales to U.S. -.007 -.004 -.004 -.005 -.005
[ln, billions USD] (.006) (.006) (.006) (.006) (.006)
U.S. total imp. (all countries) -.028∗∗∗ -.029∗∗∗ -.029∗∗∗ -.028∗∗∗ -.027∗∗∗
[ln, billions USD] (.009) (.010) (.009) (.010) (.010)
MFN ad-valorem tariff 1.66∗∗∗ 1.66∗∗∗ 1.66∗∗∗ 1.66∗∗∗ 1.66∗∗∗
[ln] (.190) (.082) (.191) (.082) (.082)
...
Pol. Org. for U.S. domestic sales Io Io Io ψtrue ψsales
Pol. Org. for MNE sales – Io Io ψtrue ψmne
additional controls‡; c-, i-, and t- FEs yes yes yes yes yes
Instrument: MNE local sales† [ln] yes yes yes yes yes
Instrument: MNE service sales† [ln] yes yes yes yes yes
Instrument: MNE local sales† [ln] × Pol. Org. no yes yes yes yes
KP Wald F-stat 12.34 11.28 5.542 16.20 16.49
AR Wald test χ2 p-value .065 < .0001 .027 < .0001 < .0001
Hansen’s J stat p-value .913 .375 .352 .567 .723
cluster variable country – country – –
number of clusters 184 – 184 – –
observations 60,704 60,704 60,704 60,704 60,704
Heteroskedasticity-robust standard errors in parentheses. ∗∗∗, ∗∗, ∗ denote significance at 1%, 5%, and 10% levels, resp. ‡
Additional controls: U.S. employees (ln), payroll (ln), import penetration (ln), annual log change of U.S. employment and
U.S. industry import penetration, number of U.S. establishments (ln), per capita GDP (ln), population (ln).
† Instruments include MNE sales by only those MNE affiliates that are not also selling goods to the U.S.
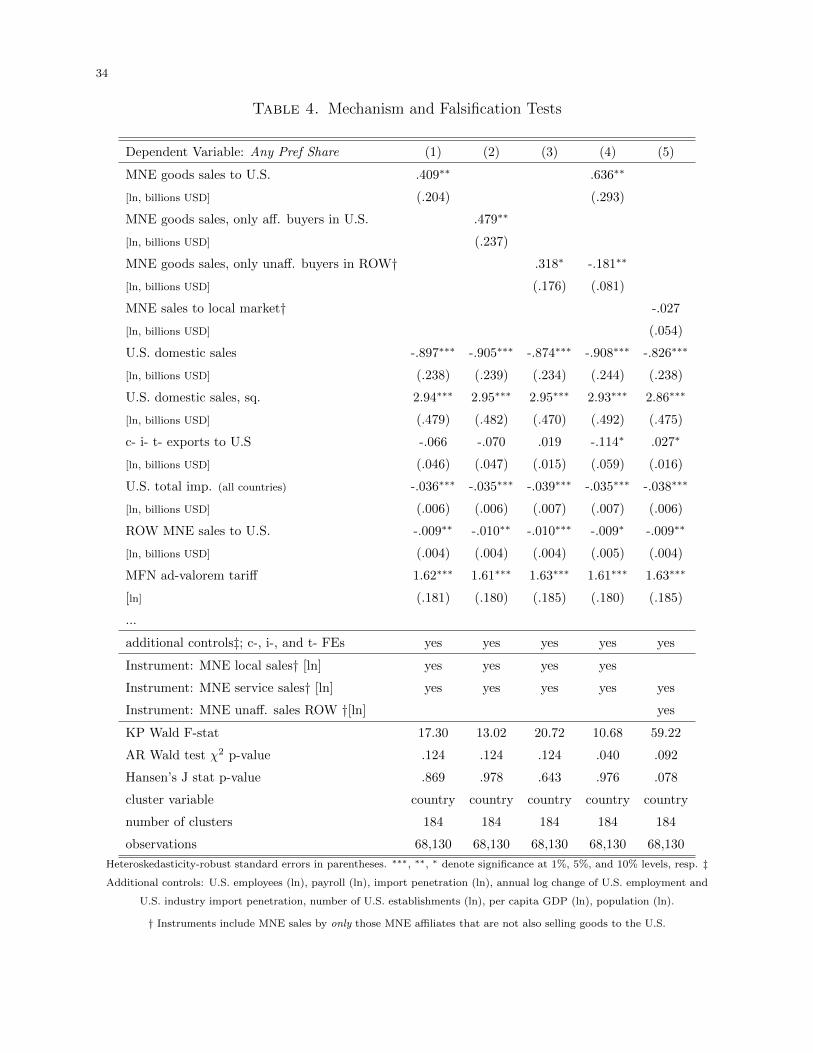
34
Table 4. Mechanism and Falsification Tests
Dependent Variable: Any Pref Share (1) (2) (3) (4) (5)
MNE goods sales to U.S. .409∗∗ .636∗∗
[ln, billions USD] (.204) (.293)
MNE goods sales, only aff. buyers in U.S. .479∗∗
[ln, billions USD] (.237)
MNE goods sales, only unaff. buyers in ROW† .318∗ -.181∗∗
[ln, billions USD] (.176) (.081)
MNE sales to local market† -.027
[ln, billions USD] (.054)
U.S. domestic sales -.897∗∗∗ -.905∗∗∗ -.874∗∗∗ -.908∗∗∗ -.826∗∗∗
[ln, billions USD] (.238) (.239) (.234) (.244) (.238)
U.S. domestic sales, sq. 2.94∗∗∗ 2.95∗∗∗ 2.95∗∗∗ 2.93∗∗∗ 2.86∗∗∗
[ln, billions USD] (.479) (.482) (.470) (.492) (.475)
c- i- t- exports to U.S -.066 -.070 .019 -.114∗ .027∗
[ln, billions USD] (.046) (.047) (.015) (.059) (.016)
U.S. total imp. (all countries) -.036∗∗∗ -.035∗∗∗ -.039∗∗∗ -.035∗∗∗ -.038∗∗∗
[ln, billions USD] (.006) (.006) (.007) (.007) (.006)
ROW MNE sales to U.S. -.009∗∗ -.010∗∗ -.010∗∗∗ -.009∗ -.009∗∗
[ln, billions USD] (.004) (.004) (.004) (.005) (.004)
MFN ad-valorem tariff 1.62∗∗∗ 1.61∗∗∗ 1.63∗∗∗ 1.61∗∗∗ 1.63∗∗∗
[ln] (.181) (.180) (.185) (.180) (.185)
...
additional controls‡; c-, i-, and t- FEs yes yes yes yes yes
Instrument: MNE local sales† [ln] yes yes yes yes
Instrument: MNE service sales† [ln] yes yes yes yes yes
Instrument: MNE unaff. sales ROW †[ln] yes
KP Wald F-stat 17.30 13.02 20.72 10.68 59.22
AR Wald test χ2 p-value .124 .124 .124 .040 .092
Hansen’s J stat p-value .869 .978 .643 .976 .078
cluster variable country country country country country
number of clusters 184 184 184 184 184
observations 68,130 68,130 68,130 68,130 68,130
Heteroskedasticity-robust standard errors in parentheses. ∗∗∗, ∗∗, ∗ denote significance at 1%, 5%, and 10% levels, resp. ‡
Additional controls: U.S. employees (ln), payroll (ln), import penetration (ln), annual log change of U.S. employment and
U.S. industry import penetration, number of U.S. establishments (ln), per capita GDP (ln), population (ln).
† Instruments include MNE sales by only those MNE affiliates that are not also selling goods to the U.S.
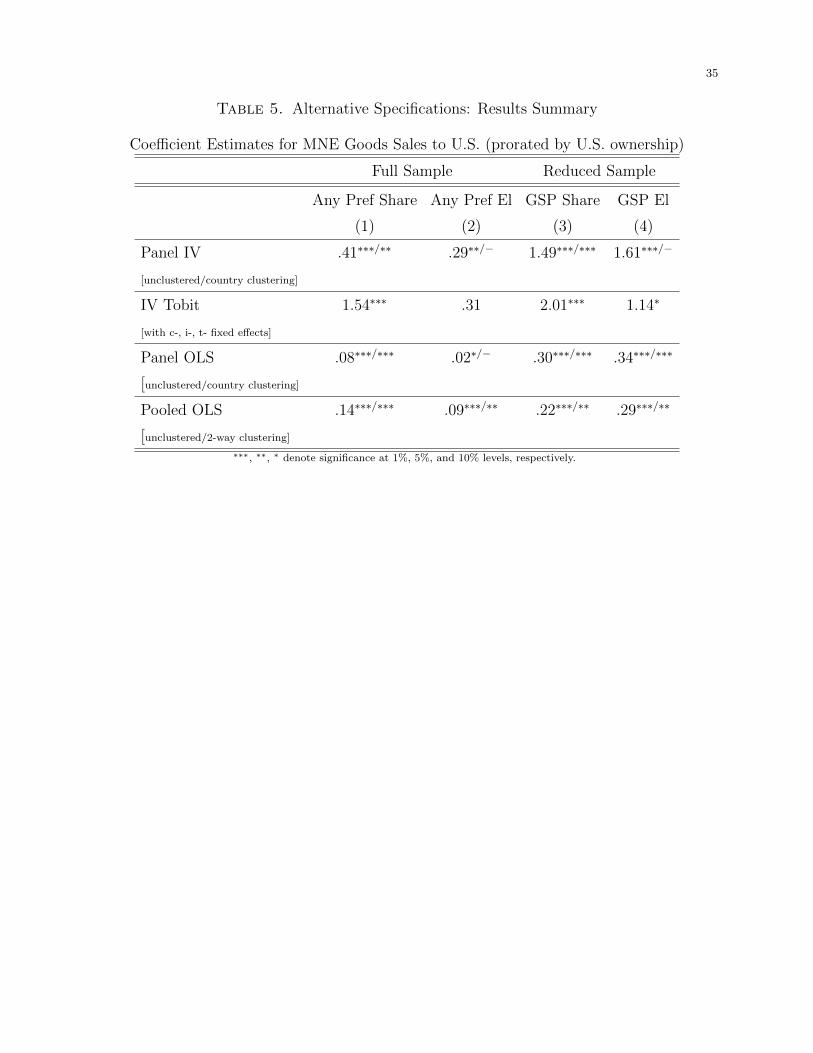
35
Table 5. Alternative Specifications: Results Summary
Coefficient Estimates for MNE Goods Sales to U.S. (prorated by U.S. ownership)
Full Sample Reduced Sample
Any Pref Share Any Pref El GSP Share GSP El
(1) (2) (3) (4)
Panel IV .41∗∗∗/∗∗ .29∗∗/− 1.49∗∗∗/∗∗∗ 1.61∗∗∗/−
[unclustered/country clustering]
IV Tobit 1.54∗∗∗ .31 2.01∗∗∗ 1.14∗
[with c-, i-, t- fixed effects]
Panel OLS .08∗∗∗/∗∗∗ .02∗/− .30∗∗∗/∗∗∗ .34∗∗∗/∗∗∗
[unclustered/country clustering]
Pooled OLS .14∗∗∗/∗∗∗ .09∗∗∗/∗∗ .22∗∗∗/∗∗ .29∗∗∗/∗∗
[unclustered/2-way clustering]
∗∗∗, ∗∗, ∗ denote significance at 1%, 5%, and 10% levels, respectively.
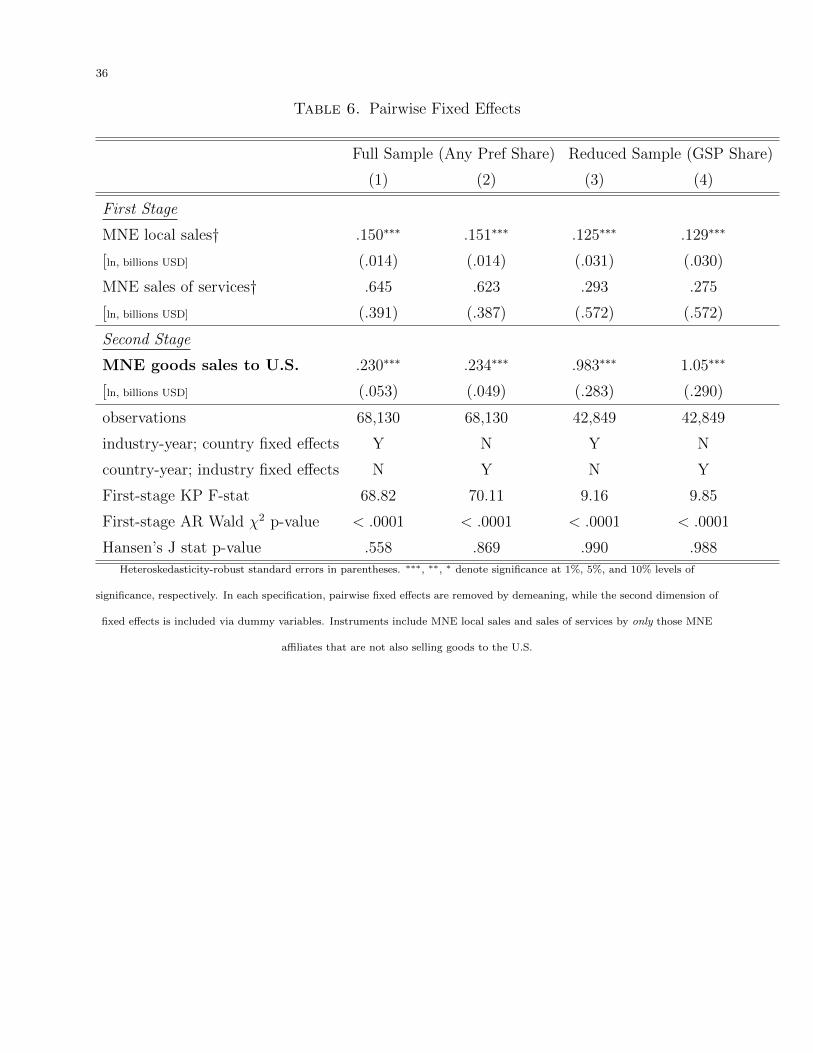
36
Table 6. Pairwise Fixed Effects
Full Sample (Any Pref Share) Reduced Sample (GSP Share)
(1) (2) (3) (4)
First Stage
MNE local sales† .150∗∗∗ .151∗∗∗ .125∗∗∗ .129∗∗∗
[ln, billions USD] (.014) (.014) (.031) (.030)
MNE sales of services† .645 .623 .293 .275
[ln, billions USD] (.391) (.387) (.572) (.572)
Second Stage
MNE goods sales to U.S. .230∗∗∗ .234∗∗∗ .983∗∗∗ 1.05∗∗∗
[ln, billions USD] (.053) (.049) (.283) (.290)
observations 68,130 68,130 42,849 42,849
industry-year; country fixed effects Y N Y N
country-year; industry fixed effects N Y N Y
First-stage KP F-stat 68.82 70.11 9.16 9.85
First-stage AR Wald χ2 p-value < .0001 < .0001 < .0001 < .0001
Hansen’s J stat p-value .558 .869 .990 .988
Heteroskedasticity-robust standard errors in parentheses. ∗∗∗, ∗∗, ∗ denote significance at 1%, 5%, and 10% levels of
significance, respectively. In each specification, pairwise fixed effects are removed by demeaning, while the second dimension of
fixed effects is included via dummy variables. Instruments include MNE local sales and sales of services by only those MNE
affiliates that are not also selling goods to the U.S.