Embed Size (px)
Citation preview

IESE Business School-University of Navarra - 1
US MARKET RISK PREMIUM USED IN 2011 BY PROFESSORS, ANALYSTS AND COMPANIES:
A SURVEY WITH 5,731 ANSWERS
Pablo Fernández
Javier Aguirreamalloa
Luis Corres
IESE Business School – University of Navarra Av. Pearson, 21 – 08034 Barcelona, Spain. Phone: (+34) 93 253 42 00 Fax: (+34) 93 253 43 43 Camino del Cerro del Águila, 3 (Ctra. de Castilla, km 5,180) – 28023 Madrid, Spain. Phone: (+34) 91 357 08 09 Fax: (+34) 91 357 29 13 Copyright © 2011 IESE Business School.
Working Paper
WP-918
May, 2011

IESE Business School-University of Navarra
The CIIF, International Center for Financial Research, is an interdisciplinary center with an international outlook and a focus on teaching and research in finance. It was created at the beginning of 1992 to channel the financial research interests of a multidisciplinary group of professors at IESE Business School and has established itself as a nucleus of study within the School’s activities.
Ten years on, our chief objectives remain the same:
• Find answers to the questions that confront the owners and managers of finance companies and the financial directors of all kinds of companies in the performance of their duties
• Develop new tools for financial management
• Study in depth the changes that occur in the market and their effects on the financial dimension of business activity
All of these activities are programmed and carried out with the support of our sponsoring companies. Apart from providing vital financial assistance, our sponsors also help to define the Center’s research projects, ensuring their practical relevance.
The companies in question, to which we reiterate our thanks, are: Aena, A.T. Kearney, Caja Madrid, Fundación Ramón Areces, Grupo Endesa, Royal Bank of Scotland and Unión Fenosa.
http://www.iese.edu/ciif/

IESE Business School-University of Navarra
US MARKET RISK PREMIUM USED IN 2011 BY PROFESSORS, ANALYSTS AND COMPANIES:
A SURVEY WITH 5,731 ANSWERS
Pablo Fernández1
Javier Aguirreamalloa2
Luis Corres3
Abstract
The average Market Risk Premium (MRP) used in 2011 by professors for the United States (5.7%) is higher than the one used by analysts (5.0%) and companies (5.6%).
The standard deviation of the MRP used in 2011 by analysts (1.1%) is lower than that of companies (2.0%) and professors (1.6%).
Most previous surveys have been interested in the Expected MRP, but this survey asks about the Required MRP. The paper also contains the references used to justify the MRP, and comments from 58 people who do not use MRP and 110 who do. The comments illustrate the various interpretations of the required MRP and its usefulness.
Professors, analysts and companies that cite Ibbotson as their reference use MRP for the United States between 2% and 14.5%, and the ones that cite Damodaran as their reference use MRP between 2% and 10.8%.
Classification JEL: G12, G31, M21
Keywords: equity premium, required equity premium, expected equity premium, historical equity premium.
1 Professor, Financial Management, PricewaterhouseCoopers Chair of Finance, IESE
2 Lecturer, Financial Management, IESE
3 Research Assistant, IESE

IESE Business School-University of Navarra
US MARKET RISK PREMIUM USED IN 2011 BY PROFESSORS, ANALYSTS AND COMPANIES:
A SURVEY WITH 5,731 ANSWERS
1. Market Risk Premium (MRP) Used in 2011 for the United States We sent a short email (see Exhibit 1) during March and April 2011 to about 19,500 email addresses of finance and economics professors, analysts and companies, obtained from previous correspondence, papers and webs of companies and universities. We asked about the Market Risk Premium (MRP) used “to calculate the required return to equity in different countries.” We also asked about “Books or articles that I use to support this number.”
By April 8, 2011, we had received 5,731 responses. 3,768 of these answers provided a specific MRP used in 2011.1 1,438 provided the MRP used in 2011 for the United States.
Table 1 MRP used in 2011: 5,731 answers
Professors Analysts Companies Total Answers reported (MRP figures) 823 1,397 1,439 3,659 Outliers 38 12 59 109 Answers that do not provide a figure: 704 303 956 1,963 Total 1,565 1,712 2,454 5,731 Answers that do not provide a figure: "I think about premia for particular stocks" 137 5 35 177 "MRP is a concept that we do not use" 390 390 "I use whatever MRP is specified in the textbook" 31 31 "The CAPM is not very useful nor is the concept of MRP" 140 70 210 "I did not have to use an estimate of the MRP in 2011" 38 38 "I am an academic, not a practitioner" 17 17 “I teach derivatives: I did not have to use a MRP” 35 35 “The MRP changes every day”, "weekly” or “monthly” 34 95 129 “It is confidential” 16 83 99 Use a Required Return to Equity 65 38 22 125 Use a minimum IRR 34 236 270 Use multiples 32 127 89 248 Other reasons 141 22 31 194
SUM 704 303 956 1,963
1 We considered 109 of them as outliers because they provided a very small MRP (for example, -23% and 0 for the United States) or a very high MRP (for example, 30% for the United States).
2 - IESE Business School-University of Navarra
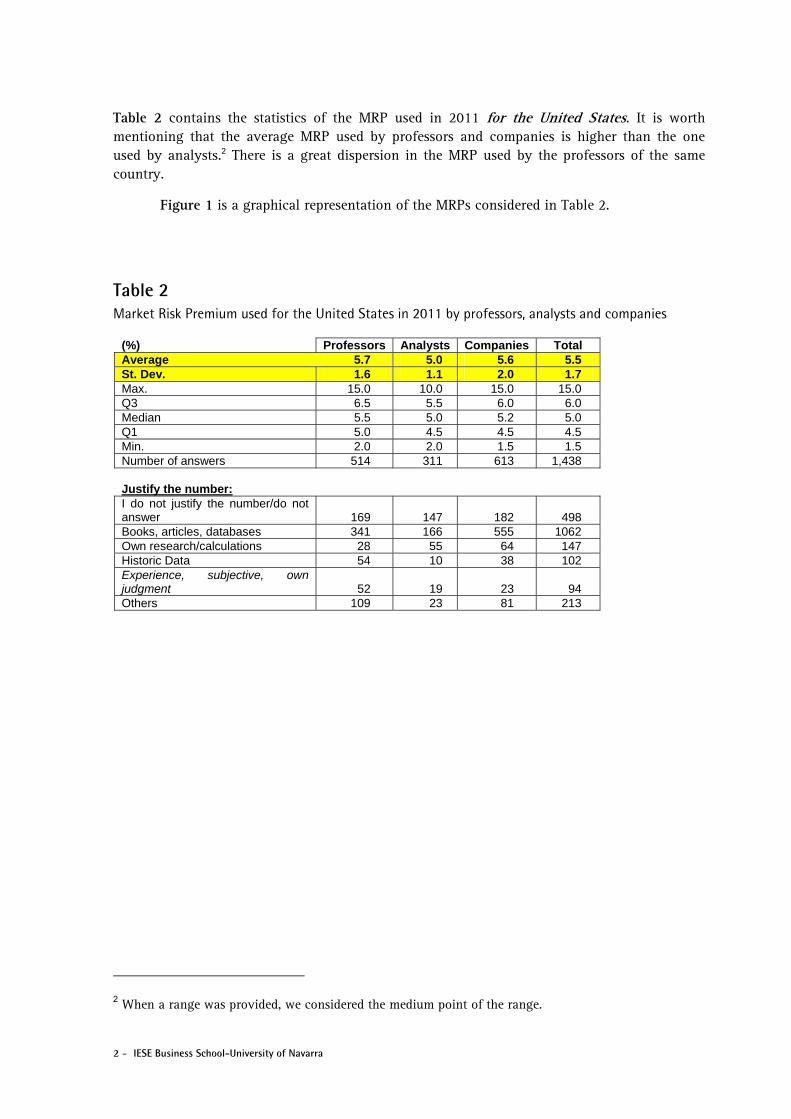
Table 2 contains the statistics of the MRP used in 2011 for the United States. It is worth mentioning that the average MRP used by professors and companies is higher than the one used by analysts.2 There is a great dispersion in the MRP used by the professors of the same country.
Figure 1 is a graphical representation of the MRPs considered in Table 2.
Table 2 Market Risk Premium used for the United States in 2011 by professors, analysts and companies
(%) Professors Analysts Companies Total Average 5.7 5.0 5.6 5.5 St. Dev. 1.6 1.1 2.0 1.7 Max. 15.0 10.0 15.0 15.0 Q3 6.5 5.5 6.0 6.0 Median 5.5 5.0 5.2 5.0 Q1 5.0 4.5 4.5 4.5 Min. 2.0 2.0 1.5 1.5 Number of answers 514 311 613 1,438 Justify the number: I do not justify the number/do not answer 169 147 182 498 Books, articles, databases 341 166 555 1062 Own research/calculations 28 55 64 147 Historic Data 54 10 38 102 Experience, subjective, own judgment 52 19 23 94 Others 109 23 81 213
2 When a range was provided, we considered the medium point of the range.
IESE Business School-University of Navarra - 3
Figure 1 Market Risk Premium for the United States used in 2011
Professors Analysts Companies
(%) 2011 2010 2011 2010 2011 2010
Average 5.7 6.0 5.0 5.1 5.6 5.3
St. Dev. 1.6 1.7 1.1 1.1 2.0 1.8
Max. 15.0 12.0 10.0 10.0 15.0 11.2
Median 5.5 6.0 5.0 5.0 5.2 5.0
Min. 2.0 2.0 2.0 2.5 1.5 1.9
Number of answers 514 462 311 104 613 205
USA MRP 2011 (%) Professors
02468
10121416
0 50 100 150 200 250 300 350 400 450 500
USA MRP 2011 (%) Analysts
0
2
4
6
8
10
12
0 50 100 150 200 250 300
USA MRP 2011 (%) Companies
0
2
4
6
8
10
12
14
16
0 50 100 150 200 250 300 350 400 450 500 550 600
USA MRP 2011 (%) ALL
0
2
4
6
8
10
12
14
16
0 100 200 300 400 500 600 700 800 900 1000 1100 1200 1300 1400
United States MRP 2011 (%) Professors
United States MRP 2011 (%) Analysts
United States MRP 2011 (%) Companies
United States MRP 2011 (%) ALL
4 - IESE Business School-University of Navarra
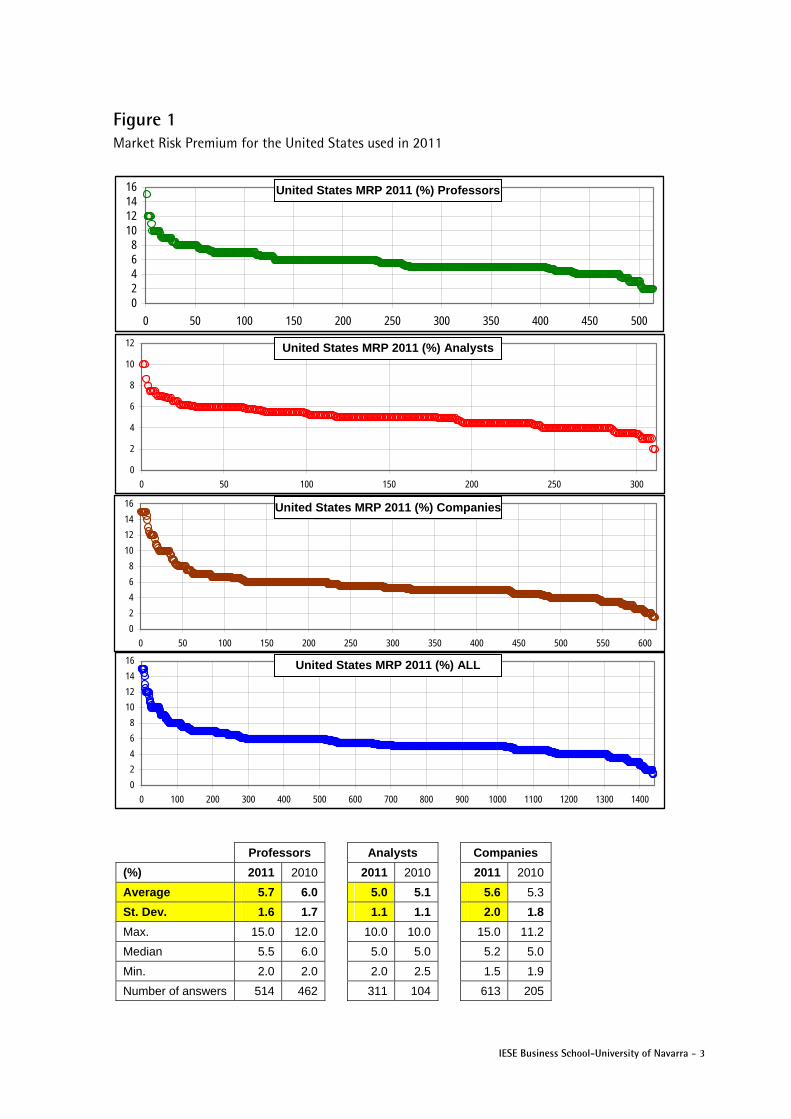
2. References Used to Justify the MRP Figure Many respondents indicated the reference books, papers, etc., that they use to justify their MRP (330 of them provided more than one reference). Table 3 contains the most cited references and Figure 2 contains the dispersion of the MRP used in 2010 by the professors who cited the most popular references: Ibbotson and Damodaran.
Table 3 Market Risk Premium for the United States used in 2011
References Professors Analysts Companies Total Ibbotson / Morningstar 50 29 162 241 Damodaran 67 26 94 187 Internal (own) estimate 14 53 50 117 Experience, subjective, own judgment 52 19 23 94 Analysts / Inv. Banks 13 17 50 80 Bloomberg 7 39 31 77 Historic data 41 9 27 77 Fernández 26 5 22 53 Duff & Phelps 2 0 31 33 Grabowski / Pratt's and Grabowski 1 5 23 29 Surveys, conversations,… 11 1 14 26 DMS 13 1 11 25 Mckinsey, Copeland 5 4 13 22 Brealy & Myers 14 2 5 21 Ross/Westerfield 13 0 1 14 Fama and French (2002) 10 0 3 13 CFA books 2 4 5 11
Others* 134 36 115 285 I do not justify the number / do not answer 169 147 182 498
* A Among them: CDS, Internet, Reuters, Siegel, Bodie, Kane, Marcus, Implied MRP, Economic Press, Datastream, Malkiel, Sharpe, Brigham, Consensus, IMF, RWJ, Shapiro, Kaplan, Shiller, Welch.

IESE Business School-University of Navarra - 5
Figure 2 Dispersion of the MRP used in 2011 for the UNITED STATES by the professors, analysts and companies that cited the most popular references: Ibbotson/Morningstar and Damodaran
3. Comparison with Previous Surveys Table 4 shows the evolution of the main statistics of the previous surveys (Fernández et al., 2009, 2010a, and 2010b) and this one.
Table 4 Market Risk Premium used for the United States in 2011, 2010, 2009, and 2008
Professors Analysts Companies 2011 Average 5.7 5.0 5.6 2010 Average 6.0 5.1 5.3 2009 Average 6.4 5.5 5.5 2008 Average 6.3
2011 St. dev. 1.6 1.1 2.0 2010 St. dev. 1.7 1.1 1.8 2009 St. dev. 2.4 1.3 1.8 2008 St. dev. 2.2
2011 Median 5.5 5.0 5.2 2010 Median 6.0 5.0 5.0 2009 Median 6.0 5.0 5.5 2008 Median 6.0
2011 Respondents 514 311 613 2010 Respondents 462 104 205 2009 Respondents 448 99 189 2008 Respondents 487
USA MRP 2011 with Damodaran as reference (%)
2
3
4
5
6
7
8
9
10
11
0 20 40 60 80 100 120 140 160 180
USA MRP 2011 with Ibbotson / Morningstar as reference (%)
23456789
101112131415
0 50 100 150 200
United States MRP 2011 with Ibbotson/Morningstar as reference (%)
United States MRP 2011 with Damodaran as reference (%)

6 - IESE Business School-University of Navarra
Welch (2000) performed two surveys with finance professors in 1997 and 1998, asking them what they thought the Expected MRP would be over the next 30 years. He obtained 226 replies, ranging from 1% to 15%, with an average arithmetic EEP of 7% above T-Bonds.3 Welch (2001) presented the results of a survey of 510 finance and economics professors performed in August 2001 and the consensus for the 30-year arithmetic EEP was 5.5%, much lower than just 3 years earlier. In an update published in 2008, Welch reports that the MRP “used in class” in December 2007 by about 400 finance professors was on average 5.89%, and 90% of the professors used equity premia between 4% and 8.5%.
Table 5 compares Ivo Welch’s main results with some results of Table 4.
Table 5 Comparison of previous surveys with this one
Surveys of Ivo Welch Fernández et al. (2009, 2010)
Oct 97– Feb 98*
Jan-May 99+
Sep 2001**
Dec. 2007#
January 2009++
United States
2008
Europe 2008
United States
2009
Europe 2009
Number of answers 226 112 510 360 143 487 224 462 194 Average 7.2 6.8 4.7 5.96 6.2 6.3 5.3 6.0 5.3 Std. Deviation 2.0 2.0 2.2 1.7 1.7 2.2 1.5 1.7 1.7 Max 15 15 20 20 19.0 10.0 12.0 12.0 Q3 8.4 8 6 7.0 7 7.2 6.0 7.0 6.0 Median 7 7 4.5 6.0 6 6.0 5.0 6.0 5.0 Q1 6 5 3 5.0 5 5.0 4.1 5.0 5.3 Min 1.5 1.5 0 2 0.8 1.0 2.0 2.0
* 30-Year Forecast. Welch (2000) First survey + 30-Year Forecast. Welch (2000) Second survey.
** 30 year Equity Premium Forecast (Geometric). “The Equity Premium Consensus Forecast Revisited” (2001).
# 30-Year Geo Eq Prem Used in class. Welch, I. (2008), “The Consensus Estimate for the Equity Premium by Academic Financial Economists in December 2007”. http://ssrn.com/abstract=1084918
++ In your classes, what is the main number you are recommending for long-term CAPM purposes? “Short Academic Equity Premium Survey for January 2009”. http://welch.econ.brown.edu/academics/equpdate-results2009.html
Johnson et al. (2007) report the results of a March 2007 survey of 116 finance professors in North America: 90% of the professors believed the Expected MRP during the next 30 years would range from 3% to 7%.
Graham and Harvey (2007) indicate that United States CFOs reduced their average EEP from 4.65% in September 2000 to 2.93% by September 2006 (st. dev. of the 465 responses = 2.47%). In the 2008 survey, they report an average EEP of 3.80%, ranging from 3.1% to 11.5% at the tenth percentile at each end of the spectrum. They show that average EEP changes through time. Goldman Sachs (O'Neill, Wilson, and Masih, 2002) conducted a survey of its global clients in July 2002 and the average long-run EEP was 3.9%, with most responses between 3.5% and 4.5%.
3 At that time, the most recent Ibbotson Associates Yearbook reported an arithmetic HEP versus T-bills of 8.9% (1926–1997).

IESE Business School-University of Navarra - 7
Table 6 Estimates of the EEP (Expected Equity Premium) according to other surveys
Authors Conclusion about EEP Respondents
Pensions and Investments (1998) 3% Institutional investors
Graham and Harvey (2007) Sep. 2000. Mean: 4.65%. Std. Dev. = 2.7% CFOs
Graham and Harvey (2007) Sep. 2006. Mean: 2.93%. Std. Dev. = 2.47% CFOs
Welch update December 2007. Mean: 5.69%. Range 2% to
12% Finance professors
O'Neill, Wilson, and Masih (2002) 3.9% Global clients Goldman
Ilmanen (2003) argues that surveys tend to be optimistic: “survey-based expected returns may tell us more about hoped-for returns than about required returns.” Damodaran (2008) points out that “the risk premiums in academic surveys indicate how far removed most academics are from the real world of valuation and corporate finance and how much of their own thinking is framed by the historical risk premiums... The risk premiums that are presented in classroom settings are not only much higher than the risk premiums in practice but also contradict other academic research.”
The magazine Pensions and Investments (12/1/1998) carried out a survey among professionals working for institutional investors: the average EEP was 3%. Shiller4 publishes and updates an index of investor sentiment since the crash of 1987. While neither survey provides a direct measure of the equity risk premium, they yield a broad measure of where investors or professors expect stock prices to go in the near future. The 2004 survey of the Securities Industry Association (SIA) found that the median EEP of 1500 United States investors was about 8.3%. Merrill Lynch surveys more than 300 institutional investors globally in July 2008: the average EEP was 3.5%.
A main difference of this survey with previous ones is that this survey asks about the Required MRP, while most surveys are interested in the Expected MRP. Exhibits 2 and 3 contain comments from 168 respondents.
4. MRP or EP (Equity Premium): 4 Different Concepts As Fernández (2007, 2009b) claims, the term “equity premium” is used to designate four different concepts:
1. Historical equity premium (HEP): historical differential return of the stock market over treasuries.
2. Expected equity premium (EEP): expected differential return of the stock market over treasuries.
3. Required equity premium (REP): incremental return of a diversified portfolio (the market) over the risk-free rate required by an investor. It is used for calculating the required return to equity.
4 See http://icf.som.yale.edu/Confidence.Index

8 - IESE Business School-University of Navarra
4. Implied equity premium (IEP): the required equity premium that arises from assuming that the market price is correct.
The four concepts (HEP, REP, EEP and IEP) designate different realities. The HEP is easy to calculate and is equal for all investors, provided they use the same timeframe, the same market index, the same risk-free instrument and the same average (arithmetic or geometric). But the EEP, the REP and the IEP may be different for different investors and are not observable.
The HEP is the historical average differential return of the market portfolio over the risk-free debt. The most widely cited sources are Ibbotson Associates and Dimson et al. (2007).
Numerous papers and books assert or imply that there is a “market” EEP. However, it is obvious that investors and professors do not share “homogeneous expectations” and have different assessments of the EEP. As Brealey et al. (2005, page 154) affirm, “Do not trust anyone who claims to know what returns investors expect.”
The REP is the answer to the following question: What incremental return do I require for investing in a diversified portfolio of shares over the risk-free rate? It is a crucial parameter because the REP is the key to determining the company’s required return to equity and the WACC. Different companies may use, and in fact do use, different REPs.
The IEP is the implicit REP used in the valuation of a stock (or market index) that matches the current market price. The most widely used model to calculate the IEP is the dividend discount model: the current price per share (P0) is the present value of expected dividends discounted at the required rate of return (Ke). If d1 is the dividend per share expected to be received at time 1, and g the expected long term growth rate in dividends per share, then
P0 = d1 / (Ke - g), which implies: IEP = d1/P0 + g - RF [1]
The estimates of the IEP depend on the particular assumption made for the expected growth (g). Even if market prices are correct for all investors, there is no common IEP for all investors: there are many pairs (IEP, g) that accomplish equation [1]. Even if equation [1] holds for every investor, there are many required returns (as many as expected growths, g) in the market. Many papers in the financial literature report different estimates of the IEP with great dispersion, as for example, Claus and Thomas (2001, IEP = 3%), Harris and Marston (2001, IEP = 7.14%) and Ritter and Warr (2002, IEP = 12% in 1980 and -2% in 1999). There is no a common IEP for all investors.
For a particular investor, the EEP is not necessarily equal to the REP (unless he considers that the market price is equal to the value of the shares). Obviously, an investor will hold a diversified portfolio of shares if his EEP is higher (or equal) than his REP and will not hold it otherwise.
We can find out the REP and the EEP of an investor by asking him, although for many investors the REP is not an explicit parameter but, rather, it is implicit in the price they are prepared to pay for the shares. However, it is not possible to determine the REP for the market as a whole, because it does not exist: even if we knew the REPs of all the investors in the market, it would be meaningless to talk of an REP for the market as a whole. There is a distribution of REPs and we can only say that some percentage of investors have REPs contained within a range. The average of that distribution cannot be interpreted as the REP of the market nor as the REP of a representative investor.

IESE Business School-University of Navarra - 9
Much confusion arises from not distinguishing among the four concepts that the phrase equity premium designates: Historical equity premium, Expected equity premium, Required equity premium and Implied equity premium. 129 of the books reviewed by Fernández (2009b) identify Expected and Required equity premium and 82 books identify Expected and Historical equity premium.
Finance textbooks should clarify the MRP by incorporating distinguishing definitions of the four different concepts and conveying a clearer message about their sensible magnitudes.
5. Relationship of the Results of the Survey with the Recommendations of Finance Textbooks Fernández (2009b) reviews 150 textbooks on corporate finance and valuation published between 1979 and 2009 by authors such as Brealey and Myers, Copeland, Damodaran, Merton, Ross, Bruner, etc., and finds that their recommendations regarding the equity premium range from 3% to 10%, and that 51 books use different equity premia in various pages. Figure 3 contains the evolution of the Required Equity Premium (REP) used or recommended by the books, and helps to explain the confusion that exists around the equity premium.
Figure 3 Evolution of the Required Equity Premium (REP) used or recommended in 150 finance and valuation textbooks.
3%
4%
5%
6%
7%
8%
9%
10%
1978
1980
1982
1984
1986
1988
1990
1992
1994
1996
1998
2000
2002
2004
2006
2008
Source: Fernández (2009b).
Figure 4 contains the moving average of the recommendations in Figure 5, which is in line with the findings of Welch (see Table 9) and with the results of this survey: the 5-year moving average has declined from 8.4% in 1990 to 5.7% in 2008 and 2009.

10 - IESE Business School-University of Navarra
Figure 4 Average of the Required Equity Premium (REP) used or recommended in 150 finance and valuation textbooks.
5%
6%
7%
8%
9%
1988
1990
1992
1994
1996
1998
2000
2002
2004
2006
2008
Moving average 5 years
Source: Fernandez (2009b).
6. Conclusion Most surveys have been interested in the Expected MRP, but this survey asks about the Required MRP.
The average Market Risk Premium (MRP) used in 2011 by professors for the United States (5.7%) is higher than that used by analysts (5.0%) and companies (5.6%).
The standard deviation of the MRP used in 2011 by analysts (1.1%) is lower than those of companies (2.0%) and professors (1.6%).
This paper also contains the references used to justify the MRP, comments from 58 people who do not use MRP and from 110 who do. The comments illustrate the various interpretations of the required MRP and its usefulness.
There is a lack of consensus among professors, analysts and companies about the magnitude of the MRP for United States: the dispersion of the MRP used is high.
There is also a great dispersion in the MRP used even if it is justified with the same reference. Professors, analysts and companies that cite Ibbotson as their reference use MRP for United States between 2% and 14.5%, and those that cite Damodaran as their reference used MRP between 2% and 10.8%.
This lack of consensus is also reflected in textbooks: Fernández (2008) reviews 100 textbooks on corporate finance and valuation published between 1979 and 2008 and finds that their recommendations regarding the equity premium range from 3% to 10%, and that 28 books use different equity premia in various pages.
The lack of consensus about the MRP is an effect of the fact that “The required MRP” and “The Expected MRP” do not exist: different market participants require different MRP and have different expectations.
This survey links with the Equity Premium Puzzle, where Fernández et al. (2009) argue that the equity premium puzzle may be explained by the fact that many market participants (such as
IESE Business School-University of Navarra - 11
equity investors, investment banks, analysts, and companies) do not use standard theory (such as a standard representative consumer asset pricing model) for determining their Required Equity Premium; rather, they use historical data and advice from textbooks and finance professors. Consequently, ex ante equity premia have been high, market prices have been consistently undervalued, and the ex post risk premia have also been high. Many investors use historical data and textbook prescriptions to estimate the required and the expected equity premium; the undervaluation and the high ex post risk premium are self-fulfilling prophecies.

12 - IESE Business School-University of Navarra
Exhibit 1 Mail sent on March and April 2011
We are conducting a survey of the Market Risk Premium (MRP) that companies, analysts and professors use to calculate the required return to equity in different countries.
We would be very grateful to you if you would kindly reply to the following 3 questions.
Of course, no companies, individuals or universities will be identified, and only aggregate data will be made public.
Best regards and thanks,
Pablo Fernández Professor of Finance. IESE Business School. Spain http://www.iese.edu http://ssrn.com/author=12696 3 questions: 1. The Market Risk Premium that I am using in 2011 for my country _________ is: ________% 2. The Market Risk Premium that I am using in 2011 for United States is: _________% 3. Books or articles that I use to support this number:
Comments

IESE Business School-University of Navarra - 13
Exhibit 2 Comments of Professors that did Not Provide the MRP Used in 2011
1. As a Marxist political economist and philosopher, I find it unethical to practice such thinking in my personal and professional life.
2. United States valuator. Your question is too general: it demonstrates that you don't understand how it is determined. The MRP is the systematic portion of risk in excess of the risk free rate, and is made of a large company risk premium and a small company risk premium, both of which are systematic, determined from the market. Added to these is the unsystematic risk premium of the specific company risk for the nuances of the particular company you are looking at.
3. United States appraisal firm: A fee is required.
4. I cannot answer because I work in a constant ''time condition shortage''.
5. As far as I know the MRP in any country depends on the particular industry examined. For instance, there is a different market risk for construction industry than for electronics or automobiles, etc.
6. Factoring the recent movement and rotation of/in the market, coupled with the methodologies available one may be better off using astrology as astrology too uses maths.
7. I put all my money in the CD at United States banks.
8. I use 10% as a standard discounting rate but then I apply a margin of safety specific to the company situation.
9. We don't generate estimates of equity risk premia. While this may be an interesting theoretical exercise for academic purposes, it has no or extremely limited use for a practitioner. Furthermore, forecasting one year returns or risk premiums for any market is in our view an exercise in futility and hubris.
10. We invest when we believe a security can be bought at a reasonable price and offers a good prospect of return and a margin of safety. We believe that is what all investors should be doing.
11. My guess is that your survey results will suffer immensely from an anchoring bias. Virtually everyone has been told to believe that the long-term equity risk premium is somewhere between 3% and 6%, and many people blindly rely on such numbers from "articles or books" without understanding or appreciating how it impacts their decision making.
12. As for the United States equity markets in aggregate (leaving aside individual securities), they are overvalued and our estimates of stock market investment returns over the next 7 years is that they will be roughly zero in real terms. You can flip the sign on whatever you believe the risk-free rate of return is to figure out what equity risk premium that implies.

14 - IESE Business School-University of Navarra
Exhibit 2 (continued)
13. CAPM is not a tool we use in our distressed fund. Required return is very situation specific and jurisdiction is but a small part.
14. I do not use a MRP; certainly not one that conjoins with the CAPM model.
15. We do not use the DCF methodology any longer to evaluate transactions. We generally utilize multiples of adjusted EBITDA as banks follow the same route.
16. I don’t model in such a sophisticated way... looking at actual companies’ prospects the risks of everyday life are bigger by far than such risk premia. The share price ratings are subjective.
17. I do not "use" a MRP for 2011 and future years.
18. United States Professor. You might be much better served by using something like Survey Monkey, Qualtrics or Survey Gizmo to gather these responses. All of these offer free web-based surveys (each offers different features, and also offers some paid services), and you won't have to hire anyone to do your data entry.
19. United States Bank. We are not allowed to hand out such information.
20. United States Consultant. We use the data from Morningstar and Duff & Phelps. I have not yet received the Morningstar yearbook, so I am unable to comment for 2011 at this time.
21. The new Ibbotson book is not out yet so we are still using 2009 data.
22. I work at a quant firm and don't make explicit MRP assumptions for our analysis.
23. Bank: I do not apply MRPs as I consider these risks to be diversifiable.
24. Consultant: we don't calculate 1 year MRP's, only for longer forward looking time periods.
25. United States Professor. After 10+ years of ups and down (net down) in the United States stock market it is hard to justify the previously conventional 8%. I have no idea what the risk premium is or even if it is meaningful in any practical sense.
26. This is not a significant consideration in the deals I am involved in: almost all of the transactions are in the lower end of the middle market and involve a strategic buyer.
27. The answer to all 3 questions is "I haven't the slightest idea."
28. I belong to the camp that despises the "pump and dump" of models of risk or anything else for that matter, and belong to the lateral thinking qualitative camp.
29. I do not use a MRP in my calculation of required return to equity.
30. I am a PhD economist and do a lot of benefit-cost analysis of social programs. But I have no idea what you mean by MRP. That may be the term used in financial market analysis but it is not a correct English translation of any of the terms I use related to discounting and the risk premium included in selecting a discount rate for public investment (which relates to whether the particular government program offers a larger or smaller return when the economy is bad and unemployment is high).

IESE Business School-University of Navarra - 15
Exhibit 2 (continued)
31. The premise of one standard figure is wrong for me. It all depends on stage and sector, regulatory issues and capital intensity.
32. United States Bank. We do not have any international business, therefore, we have not used any MRP.
33. I do not use the MRP because I do not use the CAPM to compute the cost of equity. I rather use a model based on volatility to compute the cost of equity capital, as I believe non systematic risk also has to be rewarded. In respect of market risk, I would use the same model based on volatility. This also means that diversification is creating value, lowering risk and the cost of economic capital. The results I get are about 150 to 200bp above the classical CAPM computation for the cost of equity capital of a stock. I am certainly not alone as banks and insurance companies who use economic capital recognize the value of diversification in their portfolio.
34. We are advocates of Fama-French methodologies so do not use this approach for investment decisions.
35. I don’t use MRP at all... and I doubt that other Venture Capital Firms do (VC is different than PE)!
36. I use a MRP combined with a size premium. The premium is basically different for different size companies. This combined premium is obtained from Duff and Phelps Risk Premium Report.
37. I currently use the Chance of a Loss model.
38. We have found that risk premiums suggested by the CAPM are too low to meet the returns demanded by our investors, which tend to be in around 30% per annum. While we do not achieve such equity returns consistently (in fact, less than half of our deals meet achieve this IRR), we nonetheless target such returns when making investments.
39. All of our investments are risk adjusted based upon the asset – the only time country specific factors come into play are when there are local regulatory issues or “banking” issues – which either would impact the commercialization of a healthcare product or the ability to “export” funds generated in that county. The risk premium we generally use adds up to a discount of 20-30%.
40. Achieving a return on equity of greater than 18% in North America is going to be a challenge due to the position of the global economy generally speaking.
41. United States Professor. I believe MRP amounts to a guess that doesn’t really assist long-term investors.
42. These questions are not directly answerable. I do not use some cookie cutter rate for anything.
43. Who knows. Question is entirely speculative.

16 - IESE Business School-University of Navarra
Exhibit 2 (continued)
44. I consider that those Premiums are not static data but are moving with the market valuation and anticipation. Those questions seem irrelevant according to my use and understanding of the concepts. I will be glad to receive your study on this subject.
45. I use biotech discount factors relevant to the science Biotech companies in my universe are not correlated to the variations of the economy.
46. I use my endogenous data-sets so that it is difficult to directly compare your MRP with my indicators relying on the measure of the differences between actual and endogenous data.
47. Depends on the property type, I generally use the variance between Junk bond rates and the corresponding time period equity return rates in a cap rate.
48. I reflect country premiums in the risk free rate used based on bond yields.
49. We have a value investor discipline and use one discount rate for all companies during all time periods. During certain periods we demand more margin for safety than others so we expect a larger gap between the value and fmv.
50. When I use the Duff & Phelps data, the risk premium is based on size so it varies based on the company.
51. We customize each return to equity based on the specific company, so I’m not comfortable sending a generalized percentage.
52. We are a United States based lower middle market PE fund investing in the United States. We are requiring an absolute return on invested capital of 20%, with a minimum expected multiple of invested equity of 2.0x.
53. We do not use a MRP in our group, preferring to do portfolio valuation instead of beta-based.
54. Market risk depends on the industry. We don’t use standard numbers.
55. We are a venture capital firm. Our risk premium is huge and does not change with short term market fluctuations.
56. I do only small business and don't use a build up MRP.
57. Sitting in the United States I only invest in non United States dollar securities when (1) the investment environment in the United States is poor, or (2) the currency risk vis-a-vis the United States dollar is nil. I account in the purchasing power of the United States dollar and my research risk increases the further I drift away from the accounting rules and regulatory rules with which I am familiar.
58. After 20 years as an analyst I believe that valuations must be based on reasonable PE multiples, so when I am forced to use a DFCF I adjust the assumptions to get a PE at target that makes sense.

IESE Business School-University of Navarra - 17
Exhibit 3 Comments of Professors that did Provide the United States MRP Used in 2011
1. Just tradition, really.
2. History, history, I know forecasters are using 5-6%, but the unknown is also forecast with a systemic risk, at least 2%.
3. I can tell you are an academic. In the real world of business sales, very few buyers consider risk premiums, but rather think in terms of required rate of return given the risk of the business. I handle small to low end middle market businesses in both my business brokerage practice as well as my business valuation practice. In this market no one thinks in terms of premiums. In reality, the range of required rates of return have not changed significantly in 20 years. Just because the risk free rate changes, it does not imply that the overall rate of return for the acquisition of businesses will change. To calculate the risk premium is an academic exercise to support the final rate.
4. United States equity risk premium of 6.0% plus size premium which ranges from -0.38% to +6.36%.
5. My assessment of MRP is the result of observation of market performance over time (short to medium term) and the size of the return on other investment types including government and corporate bond yields and rental yields.
6. The figures I currently use are at best educated estimates and I cannot back them with any specific financial model or theory.
7. Shiller earnings yield minus rate on long-term TIPS.
8. I am of the opinion that whatever risk premia is used today, the resulting output will be skewed due to the current interest market and outlook. Hence I decided to use the long-term mean as a overlay to my portfolio return estimates.
9. It's my view that the MRP is unknowable with any precision beyond + or minus 5% around 6%.
10. Arithmetic mean annual historical risk premium is higher, and the 85-year geometric mean is lower. I tell my students that 7% is a rough estimate of the geometric mean risk premium for medium-term projects (e.g., 10 years).
11. Since the risk free is low, the slope with the efficient frontier is higher: The probability of an increase in risk free rate is very high...
12. The number I use for MRP is based on conversations with local analysts at Merrill Lynch.
13. I started to ask my MBA students to read your risk-premium papers. At least they demonstrate that... we all tend to disagree.
14. Basically the average dividend yield on the S&P and the Dow plus a 3% GDP growth rate less the two year Treasury yield.
15. My students are allowed to use any risk premium metric as long as they can justify why they think it is most appropriate. We walk through historical risk premium data and calculations as well as the historical implied risk premium calculated by Damodaran.

18 - IESE Business School-University of Navarra
Exhibit 3 (continued)
16. I believe it is lower than it was 50 years ago, in general.
17. According to French website, MRP in January 2011 is 2.05%. For the last 3 month 9.64%; for the last 12 month 24.47%.
18. I think the low risk-free interest rate in United States will persist for a while.
19. I feel that the risk premium that I use should go up, but I am hesitating to do so, since the risk premium should reflect a long term orientation.
20. I computed average excess returns for a set of countries as a starting point. I then made some “judgment calls.” I have to admit my 95% confidence interval is rather large.
21. Gut feel on this one. I use a range generally of 3%, when things are going great, to 5%, when things seem to be going poorly. I'm somewhere in the middle during the present time.
22. Most major text books refer to Roger Ibbotson's as a basis for the 5%. There are several arguments which would lead to adjustments, but most are just splitting hairs. The reality is that it is just a guess which only has value in the long run.
23. I do not attempt to justify the MRP as it is based on CAPM which I think is irretrievably flawed as a method for determining the cost of capital.
24. I found the compound average annual growth rate of total return on S&P 500 from 1 January 1871 through 31 December 2010 to be 8.92%. I also found the current (yesterday) rate on 10-year government bond to be 3.33%.
25. The 9% risk premium is based on the average annual spread for the last 80 years between the return on the Standard and Poor 500 returns and the 90 day United States Treasury bill return. There are, not surprisingly, several caveats with using this measure. First, it is definitely ad hoc. Second, it is but the average, and there have been large variations in this spread over time. Third, a good argument could be made that the relevant risk free rate could better be approximated by a longer term Treasury security, such as the 10 year T bond rather than by the 90 day T bill rate. In that case, the risk premium would shrink to approximately 6%. However, if one were to be consistent in its usage, then the 9% spread should provide an acceptable estimation. The problem would still remain, however, that such a spread would be but an average which is subject to wide variation over time.
26. I usually stress the importance of trying different scenarios to my students (a sensitivity analysis). But I usually use a RP between 6% and 7.5%.
27. I tell my students that 4-8% is a reasonable risk premium, based on historical data. But when the market appears grossly overvalued (e.g., 2000), you can argue for a MRP as low as 2%, and when we are having a financial panic (e.g., 2009) and AAA-rated bonds are yielding 8% over the riskless rate, you can argue for a much higher MRP.
28. I rely heavily on Damodaran's work and his definitions of the various types of MRPs, i.e. implied, historical, etc.

IESE Business School-University of Navarra - 19
Exhibit 3 (continued)
29. My logic continues to be a long-term historical average. However, as diversification opportunities are much better today than in the past I believe the MRP should be lower today than in the past. As forward-looking premium seems to be lower than 5% I am tempted to lower my MRP to 4% ... but I have not yet done it.
30. I only use a number so that I can show the calculations.
31. I use an implied cost of capital based on a residual income model and analyst forecasts of earnings. The 5.3% yields approximately half the firms as overvalued and half the firms as undervalued, as of today.
32. I do this only with students, not for firms or as a consultant, I make my students decide, requiring them to have a positive MRP in the SML.
33. Is used as the long run risk premium by several of the big 4 auditor firms when they value firms.
34. I am slightly familiar with the research reports of Dimson, March and Staunton (2002) and Ibbotsen & Associates' publication Bonds, Bills, Stocks and Inflation (sic). In this data, DMS have calculated the 1900 to 2006 average annual return for United States common stocks (I do not know what index or sample size they used) as being 11.7% against an average annual return for long-term government bonds of 5.2%, so this Market Risk Premium would be about 6.5%.
35. I require an anticipated 4% real rate of return. I think that bond yields are excessively low right now, so I do not go for a certain premium over current bond yields.
36. Economic fundamentals would suggest GDP growth + Inflation + perhaps 1%.
37. I'm not particularly satisfied with what I use, and am always, always looking for a better answer, particularly when it comes to calculating the WACC for an international subsidiary.
38. The MRP Is currently higher than its historical norm due to a low interest rate environment and uncertainties in financial markets.
39. United States Market rates are a total mess at this point in time. Federal Reserve Policy has pushed the interest rates very low. Quantitative Easing and other policies make the traditional relationship in the rate structure somewhat uncertain.
40. As we become ever more connected globally we are all more likely to experience system shocks together. Also, the United States and regulators have not handled the “too big to fail” problem, so the moral hazard risk is still high and perhaps even increasing, rather than decreasing. One questions whether a 4% or even higher risk premium is enough enticement to commit much to the markets, given the potential volatility due to endogenous risk.
41. I think we are in a converging 'developed market' world where global investment flows 'tier' market premiums in a range from 4-10% (the latter for the most weakly structured emerging or developing markets). With macro funds able to move money around the globe so quickly, it suggests a convergence of like typed markets.
20 - IESE Business School-University of Navarra
Exhibit 3 (continued)
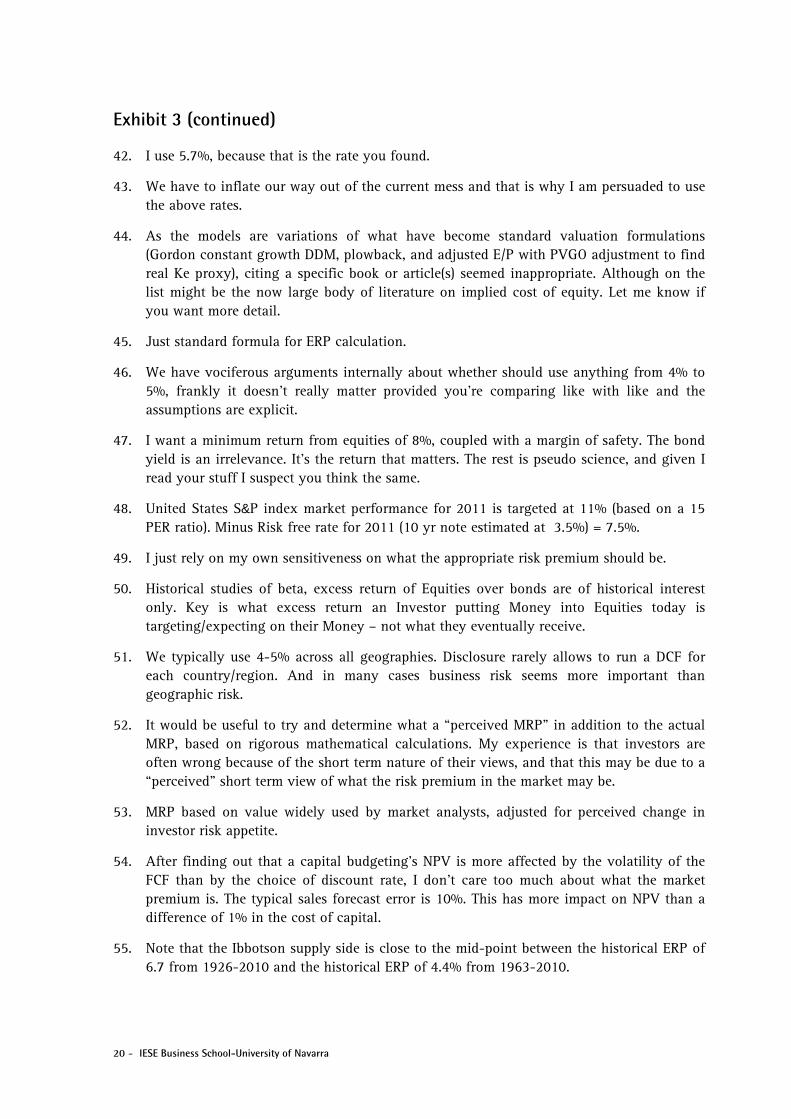
42. I use 5.7%, because that is the rate you found.
43. We have to inflate our way out of the current mess and that is why I am persuaded to use the above rates.
44. As the models are variations of what have become standard valuation formulations (Gordon constant growth DDM, plowback, and adjusted E/P with PVGO adjustment to find real Ke proxy), citing a specific book or article(s) seemed inappropriate. Although on the list might be the now large body of literature on implied cost of equity. Let me know if you want more detail.
45. Just standard formula for ERP calculation.
46. We have vociferous arguments internally about whether should use anything from 4% to 5%, frankly it doesn't really matter provided you're comparing like with like and the assumptions are explicit.
47. I want a minimum return from equities of 8%, coupled with a margin of safety. The bond yield is an irrelevance. It’s the return that matters. The rest is pseudo science, and given I read your stuff I suspect you think the same.
48. United States S&P index market performance for 2011 is targeted at 11% (based on a 15 PER ratio). Minus Risk free rate for 2011 (10 yr note estimated at 3.5%) = 7.5%.
49. I just rely on my own sensitiveness on what the appropriate risk premium should be.
50. Historical studies of beta, excess return of Equities over bonds are of historical interest only. Key is what excess return an Investor putting Money into Equities today is targeting/expecting on their Money – not what they eventually receive.
51. We typically use 4-5% across all geographies. Disclosure rarely allows to run a DCF for each country/region. And in many cases business risk seems more important than geographic risk.
52. It would be useful to try and determine what a “perceived MRP” in addition to the actual MRP, based on rigorous mathematical calculations. My experience is that investors are often wrong because of the short term nature of their views, and that this may be due to a “perceived” short term view of what the risk premium in the market may be.
53. MRP based on value widely used by market analysts, adjusted for perceived change in investor risk appetite.
54. After finding out that a capital budgeting's NPV is more affected by the volatility of the FCF than by the choice of discount rate, I don't care too much about what the market premium is. The typical sales forecast error is 10%. This has more impact on NPV than a difference of 1% in the cost of capital.
55. Note that the Ibbotson supply side is close to the mid-point between the historical ERP of 6.7 from 1926-2010 and the historical ERP of 4.4% from 1963-2010.
IESE Business School-University of Navarra - 21
Exhibit 3 (continued)
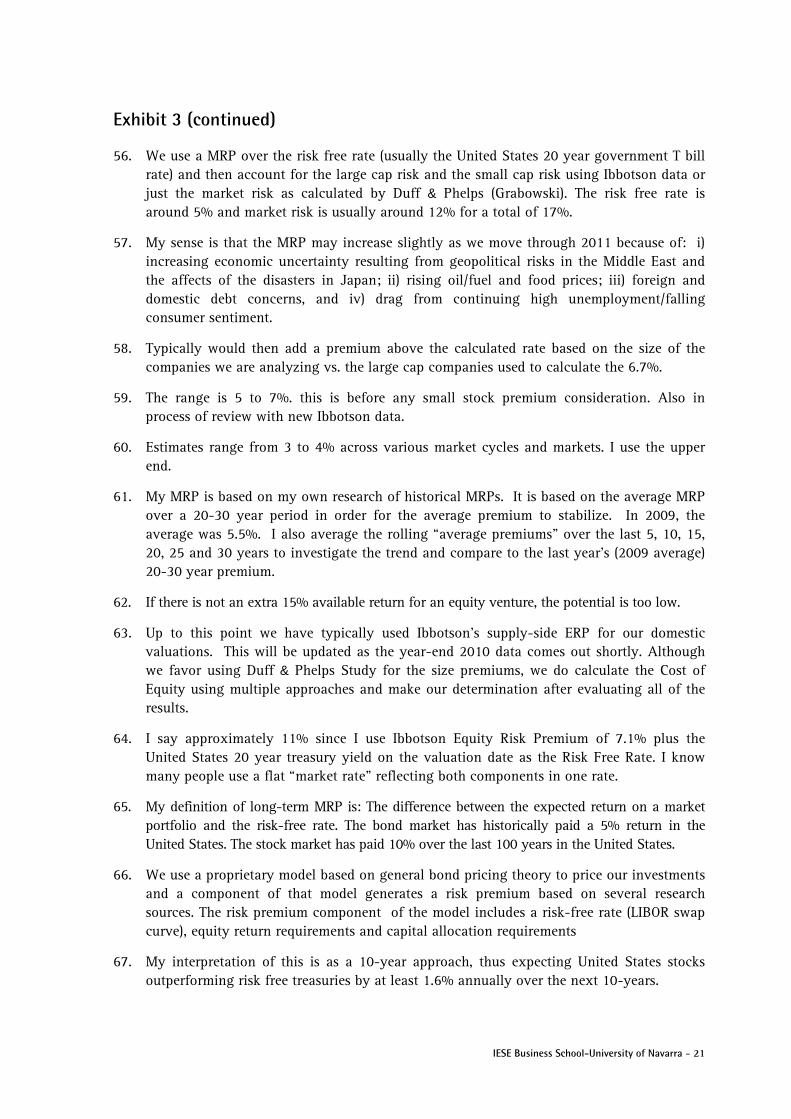
56. We use a MRP over the risk free rate (usually the United States 20 year government T bill rate) and then account for the large cap risk and the small cap risk using Ibbotson data or just the market risk as calculated by Duff & Phelps (Grabowski). The risk free rate is around 5% and market risk is usually around 12% for a total of 17%.
57. My sense is that the MRP may increase slightly as we move through 2011 because of: i) increasing economic uncertainty resulting from geopolitical risks in the Middle East and the affects of the disasters in Japan; ii) rising oil/fuel and food prices; iii) foreign and domestic debt concerns, and iv) drag from continuing high unemployment/falling consumer sentiment.
58. Typically would then add a premium above the calculated rate based on the size of the companies we are analyzing vs. the large cap companies used to calculate the 6.7%.
59. The range is 5 to 7%. this is before any small stock premium consideration. Also in process of review with new Ibbotson data.
60. Estimates range from 3 to 4% across various market cycles and markets. I use the upper end.
61. My MRP is based on my own research of historical MRPs. It is based on the average MRP over a 20-30 year period in order for the average premium to stabilize. In 2009, the average was 5.5%. I also average the rolling “average premiums” over the last 5, 10, 15, 20, 25 and 30 years to investigate the trend and compare to the last year’s (2009 average) 20-30 year premium.
62. If there is not an extra 15% available return for an equity venture, the potential is too low.
63. Up to this point we have typically used Ibbotson’s supply-side ERP for our domestic valuations. This will be updated as the year-end 2010 data comes out shortly. Although we favor using Duff & Phelps Study for the size premiums, we do calculate the Cost of Equity using multiple approaches and make our determination after evaluating all of the results.
64. I say approximately 11% since I use Ibbotson Equity Risk Premium of 7.1% plus the United States 20 year treasury yield on the valuation date as the Risk Free Rate. I know many people use a flat “market rate” reflecting both components in one rate.
65. My definition of long-term MRP is: The difference between the expected return on a market portfolio and the risk-free rate. The bond market has historically paid a 5% return in the United States. The stock market has paid 10% over the last 100 years in the United States.
66. We use a proprietary model based on general bond pricing theory to price our investments and a component of that model generates a risk premium based on several research sources. The risk premium component of the model includes a risk-free rate (LIBOR swap curve), equity return requirements and capital allocation requirements
67. My interpretation of this is as a 10-year approach, thus expecting United States stocks outperforming risk free treasuries by at least 1.6% annually over the next 10-years.

22 - IESE Business School-University of Navarra
Exhibit 3 (continued)
68. Generally we are ok with a range from 4.5% to 6%. While we refer to Damodaran calc. Historically we have not directly relied on it.
69. General sense that ERPs have come down over last decade or so although recent volatility arising from the financial crisis may have negated that… longer term outlook of further lowering of ERP by 0.5%.
70. Keep in mind that MRP is the systematic or non-diversifiable risk. The Equity Risk Premium for a particular company will not necessarily be the same as the MRP.
71. I look at risk premiums by sector not country, and reflect country premiums in the risk free rate used based on bond yields. I reflect volatility by beta. I look forward to receiving the results of the anonymous survey.
72. I also use firm specific risk. specific company risk is a judgment call based on the subject company.
73. I suspect those numbers overstate the premium that equity investors will actually receive over the next 20 years. I also believe that the consensus will move to give more weight to GM history in required return assessments.
74. Based on feedback from market participants.
75. Various publications show a long term premium of 7%, although I think this should be increased with the higher likelihood of crashes.
76. We use the Duff & Phelps Risk Premium Report currently developed by Roger Grabowski to determine an appropriate MRP based on the appropriate size portfolio.
77. I don’t invest this way (using rates derived from historical time series data and CAPM). I use a project specific discount rate depending on a number of factors especially including expected growth in cash flows due to local and national market fundamentals.
78. We usually put 30% on it. The high number is due to the fact we invest in the private company in growth stage.
79. For general academic exercises I use 8%.
80. These numbers are results of proprietary models of my company.
81. Difference between long-run expected equity risk premium, using S&P total returns less 30-day Treasury bill total returns.
82. From different publication source and historical one, could not remember which one.
83. I prefer to spend time on the forecast than the discount rate! Value is more sensitive to the first than the second.
84. The MRP should be above the risk free rate. That was the only criteria. I did not consult any books. Risk premia changes with business cycles also.

IESE Business School-University of Navarra - 23
Exhibit 3 (continued)
85. I use more aggressive risk for vacant land than for improved properties due to greater uncertainty and lack of available financing. For improved properties from $100-300,000, retail, commercial zoning, I might use a 15% AS MOST-PROBABLE. For high value properties (over $300,000) or more complex units, greater risk is considered.
86. I use a fixed WACC for valuation purposes (EVA/DCF) of 9% in order to hold on to a long term consistent valuation system. I am not using the company specific system and actual interest rate based system in order to avoid incidental low WACC rates that companies are sometimes using/misusing by creating too low and temporary rates. On average the 9% WACC rate is built up by the risk free rate of 4% and premium of 5%.
87. Our 14% is established as a premium to the current risk-free rate of 3.25%. We feel equity investors desire 10 to 11 points of premium above long-term United States Treasuries to compensate for the risk inherent in owning financial institutions. Yes, this risk acceptance varies from company-to-company- we follow a fair number of mid-sized and smaller financial institutions who have concentrated loans and relationships that we feel demand a healthy premium. Some large-capitalization stocks may be far more diversified and could require only 5 to 6 points (or 5% to 6%) premium, but this is the exception.
88. We used a 5.75 United States CRP based on an internal committee.
89. We don’t vary it year by year (we don’t normally change the estimates and we think along market cycles when estimate risk premia).
90. For non-United States cost of capital I use a 4%, ERP based on Damodaran’s survey article and the literature referenced there.
91. I do not use a MRP in my analysis. I largely *pick* a discount rate that I wish to earn and do not base it upon relative measures. That said, I have adjusted my desired rate of return downward to reflect my expectation of muted overall market returns in years to come due to expected rising interest rates and inflation. I am currently estimating 9% as my benchmark desire return for equities. Riskier equities may get higher required returns.
92. I use 5% historical ERP for United States market as a base (arithmetic average premium of equities over bonds in last 50 years). I then add credit default spread price for particular country, or better difference between sovereign CDS price of particular country to CDS price of United States. Because it reflects only sovereign bond risk I multiple this number by coefficient 1,5x (assuming 50% higher riskiness of equity market vs. bond market).
93. Volatility is a big deal right now. So my risk numbers are large.
94. I use the geometric (annually compounded) average over an investment horizon of twenty years, generally; but again, depending on the age of the company, whether it has reached a steady state of operations or not, and the general economic conditions at the appraisal date, that may change from one assignment to the next. I do not have a predetermined figure to use in all cases.
95. None – I just want something that is easy for my students to use in calculation.

24 - IESE Business School-University of Navarra
Exhibit 3 (continued)
96. I discount revenue streams - usually at 15%... occasionally 12 or 15%.
97. If I may mention, a bigger challenge is the terminal growth rate "g." Most in the region use 3% which does not make sense to me. Was wondering if you have looked into this also? For countries with Real GDP growth of 6% and inflation of 6-7%, using 3% growth means negative real growth. Why run the business then? It has to be at least 0% in real terms.
98. Reported size premia are based upon historic, so applying them to supply side is inconsistent. But I do believe that historic probably overstates reality. Let’s face it. The academic disputes over the right ERP are interesting, but especially for small private companies, the potential error arising from misestimated ERP is a minor element in the overall cost of equity and is generally dwarfed by the potential errors in estimating future financial performance.
99. Additional risk premiums include: Small Stock Premium; Industry Specific (not always); and Company Specific Risk Premium.
100. Depends on the purpose. If the firm is highly leveraged, then assuming all equity firm may not be relevant and a WACC adjusted for pension risk might be more appropriate.
101. Practical experience as an adviser to large financial institutions over 30 years.
102. Much of it is just guesswork, nevertheless I find it more important that one either takes a consistent level for the premiums across the companies or focus on a WACC which is consistent with what the companies say.
103. Currently we use the equity risk premium (ERP) of 5.2% based on the long-horizon expected equity risk premium from 2010 Ibbotson Associates Stock, Bonds, Bills and Inflation Valuation Edition. The ERP will be updated when the 2011 Ibbotson book coming out next month.
104. I believe that investors are more risk averse than five years ago.
105. I use Vector Vest to do the selections.
106. Shareholders have been right all along – there is a lot of risk out there in the fat tails.
107. Risk Premiums have risen somewhat in the last 3 years.
108. On top of that we apply beta (relevered) parameter according to CAPM model and reflecting sector and company specific risk.
109. For the United States, -3.9% is the estimate for the last decade by CREDIT SUISSE GLOBAL INVESTMENT RETURNS YEARBOOK 2011.
110. Supply side equity risk premium is the expected future returns in excess of the risk free rate that investors expect to receive by investing in a broad index of common stocks, such as the S&P 500 stock composite average. Long-horizon expected equity risk premium (supply side) is defined as the historical equity risk premium (large company stock total returns minus long-term government bond income returns) minus price-to-earnings ratio calculated using three-year average earnings.

IESE Business School-University of Navarra - 25
References Brealey, R.A., S.C. Myers, and F. Allen (2005), “Principles of Corporate Finance,” 8th edition, McGraw-Hill/Irwin.
Claus, J.J. and J.K. Thomas (2001), “Equity Premia as Low as Three Percent? Evidence from Analysts’ Earnings Forecasts for Domestic and International Stock Markets,” Journal of Finance, 55, (5), pp. 1629-66.
Damodaran, A. (2008), “Equity Risk Premiums (ERP): Determinants, Estimation and Implications”, Working Paper.
Dimson, E., P. Marsh, and M. Staunton (2007), “The Worldwide Equity Premium: A Smaller Puzzle,” in Handbook of investments: Equity risk premium, R. Mehra, Elsevier.
Fernández, P. (2007), “Equity Premium: Historical, Expected, Required and Implied,” http://ssrn.com/abstract=933070
Fernández, P. (2009a), “Market Risk Premium Used in 2008 by Professors: A Survey with 1,400 Answers,” http://ssrn.com/abstract=1344209
Fernández, P. (2009b), “The Equity Premium in 150 Textbooks,” http://ssrn.com/abstract=1473225
Fernández, P., J. Aguirremalloa, and H. Liechtenstein (2009), “The Equity Premium Puzzle: High Required Premium, Undervaluation and Self Fulfilling Prophecy,” IESE Business School WP. http://ssrn.com/abstract=1274816
Fernández, P. and J. del Campo (2010a), "Market Risk Premium used in 2010 by Analysts and Companies: a survey with 2,400 answers,” downloadable in http://ssrn.com/abstract=1609563
Fernández, P. and J. del Campo (2010b), “Market Risk Premium Used in 2010 by Professors: A Survey with 1,500 Answers,” downloadable in http://ssrn.com/abstract=1606563
Graham, J.R. and C.R. Harvey (2007), "The Equity Risk Premium in January 2007: Evidence from the Global CFO Outlook Survey,” Icfai Journal of Financial Risk Management, Vol. IV, No. 2, pp. 46-61.
Harris, R.S. and F.C. Marston (2001), “The Market Risk Premium: Expectational Estimates Using Analysts’ Forecasts,” Journal of Applied Finance, Vol. 11.
Ilmanen, A. (2003), “Expected returns on stocks and bonds,” Journal of Portfolio Management 29, pp. 7-27.
Johnson, D. T., T. Kochanek, and J. Alexander (2007), “The Equity Premium Puzzle: A New Look,” Journal of the Academy of Finance, Vol. 5, No. 1, pp. 61-71.
O'Neill, J., D. Wilson, and R. Masih (2002), “The Equity Risk Premium from an Economics Perspective,” Goldman Sachs, Global Economics Paper No. 84.
Ritter, J.R. and R. Warr (2002), "The Decline of Inflation and the Bull Market of 1982 to 1999,” Journal of Financial and Quantitative Analysis, Vol. 37, No. 1, pp. 29-61.

26 - IESE Business School-University of Navarra
Welch, I. (2000), “Views of Financial Economists on the Equity Premium and on Professional Controversies,” Journal of Business, Vol. 73, No. 4, pp. 501-537.
Welch, I. (2001), “The Equity Premium Consensus Forecast Revisited,” Cowles Foundation Discussion Paper No. 1325.
Welch, I. (2007), “A Different Way to Estimate the Equity Premium (for CAPM and One-Factor Model Use Only),” SSRN n. 1077876.