Embed Size (px)
Citation preview
EMBARGOED UNTIL RELEASE AT 8:30 A.M. EST, TUESDAY, JANUARY 7, 2020 CB 20-03, BEA 20-01
Goods Data Inquiries Goods Media Inquiries Services Data and Media Inquiries U.S. Census Bureau U.S. Census Bureau U.S. Bureau of Economic Analysis Economic Indicators Division, International Trade Public Information Office Balance of Payments Division (301) 763-2311 (301) 763-3030 Data: (301) 278-9559 [email protected] [email protected] Media: (301) 278-9003
U.S. International Trade in Goods and Services
November 2019
The U.S. Census Bureau and the U.S. Bureau of Economic Analysis announced today that the goods and services deficit was $43.1 billion in November, down $3.9 billion from $46.9 billion in October, revised.
Exports, Imports, and Balance (exhibit 1)
November exports were $208.6 billion, $1.4 billion more than October exports. November imports were $251.7 billion, $2.5 billion less than October imports.
The November decrease in the goods and services deficit reflected a decrease in the goods deficit of $3.9 billion to $63.9 billion and a decrease in the services surplus of less than $0.1 billion to $20.8 billion.
Year-to-date, the goods and services deficit decreased $3.9 billion, or 0.7 percent, from the same period in 2018. Exports decreased less than $0.1 billion or less than 0.1 percent. Imports decreased $3.9 billion or 0.1 percent.
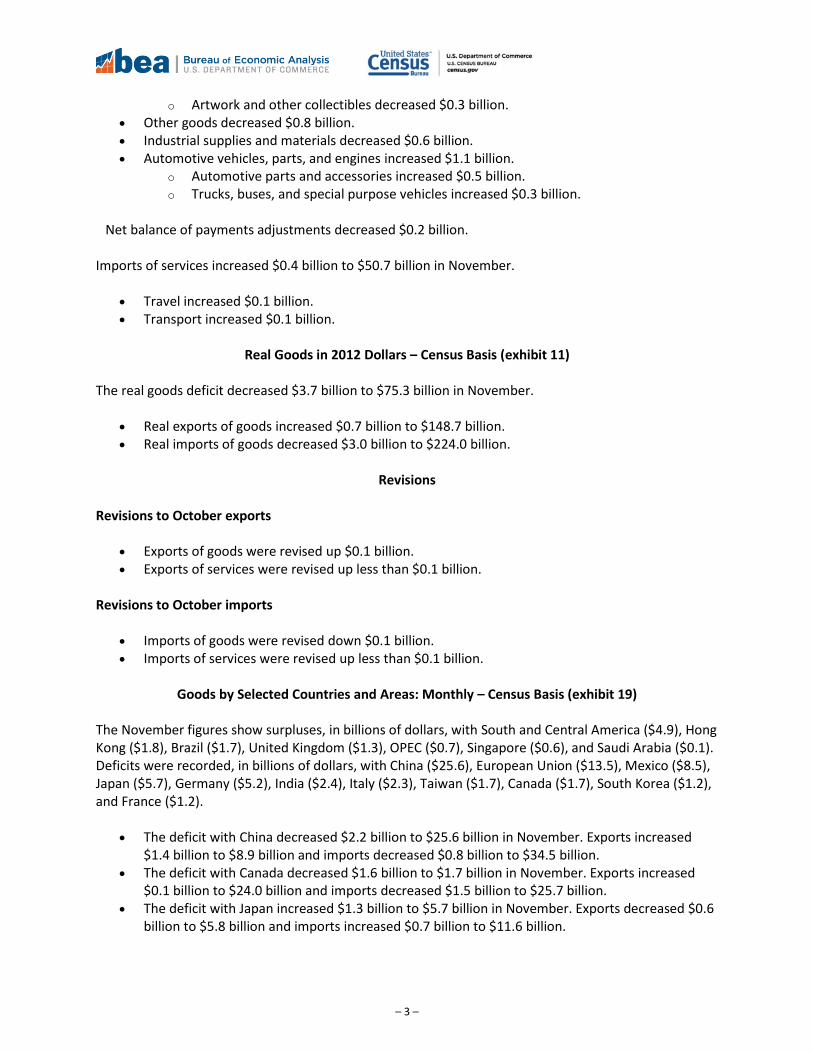
U.S. INTERNATIONAL TRADE IN GOODS AND SERVICES DEFICIT
Deficit: $43.1 Billion -8.2%°
Exports: $208.6 Billion +0.7%°
Imports: $251.7 Billion -1.0%°
Next release: February 5, 2020
(°) Statistical significance is not applicable or not measurable. Data adjusted for seasonality but not price changes
Source: U.S. Census Bureau, U.S. Bureau of Economic Analysis; U.S. International Trade in Goods and Services, January 7, 2020
Monthly deficit
Three-month moving average
35
40
45
50
55
60
65
November 2017 November 2018 November 2019
Billion $Goods and Services Trade Deficit
Seasonally adjusted
0
U.S. International Trade in Goods and ServicesJanuary 7, 2020
U.S. Bureau of Economic AnalysisU.S. Census Bureau
Three-Month Moving Averages (exhibit 2) The average goods and services deficit decreased $3.5 billion to $47.0 billion for the three months ending in November.
• Average exports decreased $0.2 billion to $207.8 billion in November. • Average imports decreased $3.7 billion to $254.9 billion in November.
Year-over-year, the average goods and services deficit decreased $8.4 billion from the three months ending in November 2018.
• Average exports decreased $1.5 billion from November 2018. • Average imports decreased $9.9 billion from November 2018.
Exports (exhibits 3, 6, and 7)
Exports of goods increased $1.0 billion to $137.2 billion in November.
Exports of goods on a Census basis increased $1.0 billion.
• Capital goods increased $0.6 billion. o Drilling and oilfield equipment increased $0.4 billion. o Civilian aircraft engines increased $0.3 billion.
• Consumer goods increased $0.5 billion. o Jewelry increased $0.4 billion. o Gem diamonds increased $0.3 billion.
• Automotive vehicles, parts, and engines increased $0.4 billion. • Other goods decreased $0.5 billion.
Net balance of payments adjustments decreased less than $0.1 billion.
Exports of services increased $0.4 billion to $71.5 billion in November.
• Other business services increased $0.1 billion. • Transport increased $0.1 billion. • Travel increased $0.1 billion.
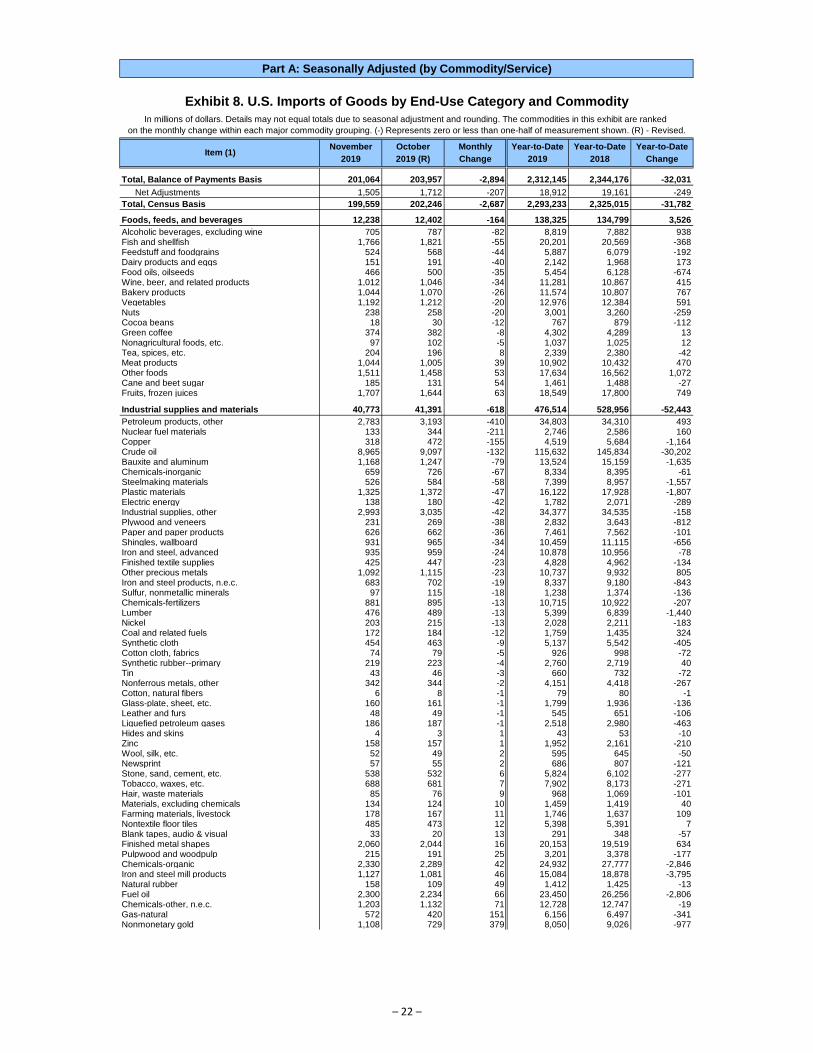
Imports (exhibits 4, 6, and 8)
Imports of goods decreased $2.9 billion to $201.1 billion in November.
Imports of goods on a Census basis decreased $2.7 billion.
• Capital goods decreased $1.2 billion. o Civilian aircraft decreased $0.6 billion. o Computers decreased $0.6 billion.
• Consumer goods decreased $1.0 billion. o Cell phones and other household goods decreased $0.5 billion.
– 2 –
o Artwork and other collectibles decreased $0.3 billion. • Other goods decreased $0.8 billion. • Industrial supplies and materials decreased $0.6 billion. • Automotive vehicles, parts, and engines increased $1.1 billion.
o Automotive parts and accessories increased $0.5 billion. o Trucks, buses, and special purpose vehicles increased $0.3 billion.
Net balance of payments adjustments decreased $0.2 billion.
Imports of services increased $0.4 billion to $50.7 billion in November.
• Travel increased $0.1 billion. • Transport increased $0.1 billion.
Real Goods in 2012 Dollars – Census Basis (exhibit 11)
The real goods deficit decreased $3.7 billion to $75.3 billion in November.
• Real exports of goods increased $0.7 billion to $148.7 billion. • Real imports of goods decreased $3.0 billion to $224.0 billion.
Revisions
Revisions to October exports
• Exports of goods were revised up $0.1 billion. • Exports of services were revised up less than $0.1 billion.
Revisions to October imports
• Imports of goods were revised down $0.1 billion. • Imports of services were revised up less than $0.1 billion.
Goods by Selected Countries and Areas: Monthly – Census Basis (exhibit 19)
The November figures show surpluses, in billions of dollars, with South and Central America ($4.9), Hong Kong ($1.8), Brazil ($1.7), United Kingdom ($1.3), OPEC ($0.7), Singapore ($0.6), and Saudi Arabia ($0.1). Deficits were recorded, in billions of dollars, with China ($25.6), European Union ($13.5), Mexico ($8.5), Japan ($5.7), Germany ($5.2), India ($2.4), Italy ($2.3), Taiwan ($1.7), Canada ($1.7), South Korea ($1.2), and France ($1.2).
• The deficit with China decreased $2.2 billion to $25.6 billion in November. Exports increased $1.4 billion to $8.9 billion and imports decreased $0.8 billion to $34.5 billion.
• The deficit with Canada decreased $1.6 billion to $1.7 billion in November. Exports increased $0.1 billion to $24.0 billion and imports decreased $1.5 billion to $25.7 billion.
• The deficit with Japan increased $1.3 billion to $5.7 billion in November. Exports decreased $0.6 billion to $5.8 billion and imports increased $0.7 billion to $11.6 billion.
– 3 –
* * * All statistics referenced are seasonally adjusted; statistics are on a balance of payments basis unless otherwise specified. Additional statistics, including not seasonally adjusted statistics and details for goods on a Census basis, are available in exhibits 1-20b of this release. For information on data sources, definitions, and revision procedures, see the explanatory notes in this release. The full release can be found at www.census.gov/foreign-trade/Press-Release/current_press_release/index.html or www.bea.gov/data/intl-trade-investment/international-trade-goods-and-services. The full schedule is available in the Census Bureau’s Economic Briefing Room at www.census.gov/economic-indicators/ or on BEA’s website at www.bea.gov/news/schedule.
* * *
Next release: February 5, 2020, at 8:30 A.M. EST U.S. International Trade in Goods and Services, December 2019
* * *
Notice Change to Exhibit 17 With the release of the “U.S. International Trade in Goods and Services, January 2020” report on March 6, 2020, exhibit 17 will include exports of energy-related petroleum products—in addition to imports— and will be renamed Exhibit 17. U.S. Trade in Energy-Related Petroleum Products, Including Crude Oil. A preview of the modified exhibit is available at www.census.gov/foreign-trade/statistics/notices/20191205_exhibit17.html. If you have questions or need additional information, please contact the U.S. Census Bureau, Economic Indicators Division, International Trade Macro Analysis Branch, on (800) 549-0595, option 4, or at [email protected].
– 4 –
Explanatory Notes
Goods (Census basis) Data for goods on a Census basis are compiled from the documents collected by U.S. Customs and Border Protection (CBP) and reflect the movement of goods between foreign countries and the 50 states, the District of Columbia, Puerto Rico, the U.S. Virgin Islands, and U.S. Foreign Trade Zones. They include government and non-government shipments of goods and exclude shipments between the United States and its territories and possessions; transactions with U.S. military, diplomatic, and consular installations abroad; U.S. goods returned to the United States by its Armed Forces; personal and household effects of travelers; and in-transit shipments. The General Imports value reflects the total arrival of merchandise from foreign countries that immediately enters consumption channels, warehouses, or Foreign Trade Zones. For imports, the value reported is the CBP-appraised value of merchandise—generally, the price paid for merchandise for export to the United States. Import duties, freight, insurance, and other charges incurred in bringing merchandise to the United States are excluded. The exception is exhibit 17a, which shows CIF import value. The CIF (cost, insurance, and freight) value represents the landed value of the merchandise at the first port of arrival in the United States. It is computed by adding import charges to the customs value and therefore excludes U.S. import duties. Exports are valued at the f.a.s. (free alongside ship) value of merchandise at the U.S. port of export, based on the transaction price including inland freight, insurance, and other charges incurred in placing the merchandise alongside the carrier at the U.S. port of exportation.
Revision procedure (Census basis) Monthly revisions: Monthly data include actual month's transactions as well as a small number of transactions for previous months. Each month, the U.S. Census Bureau revises the aggregate seasonally adjusted (current and real, or chained-dollar) and unadjusted export, import, and trade balance figures, as well as the end-use totals for the prior month. Country detail data and commodity detail data, based on the Standard International Trade Classification (SITC) Revision 4 and the North American Industry Classification System (NAICS), are not revised monthly. The timing adjustment shown in exhibit 14 is the difference between monthly data as originally reported and as recompiled. For October, unadjusted exports of goods were revised up $0.1 billion and unadjusted imports of goods were revised down less than $0.1 billion. Goods carry-over in November
was $0.1 billion (0.1 percent) for exports and less than $0.1 billion (less than 0.1 percent) for imports. For October, revised export carry-over was less than $0.1 billion (less than 0.1 percent) and revised import carry-over was less than $0.1 billion (less than 0.1 percent). Quarterly revisions to chain-weighted dollar series: For March, June, September, and December statistical month releases, revisions are made to the real, or chained-dollar, series presented in exhibits 10 and 11: the previous five months are revised to incorporate the U.S. Bureau of Labor Statistics’ (BLS) revisions to price indexes, which are used to produce the real series and to align Census data with data published by the U.S. Bureau of Economic Analysis (BEA) in the national income and product accounts (NIPAs). Annual revisions: Each June, not seasonally adjusted goods data are revised to redistribute monthly data that arrived too late for inclusion in the month of transaction. In addition, revisions are made to reflect corrections received subsequent to the monthly revisions. Seasonally adjusted data are also revised to reflect recalculated seasonal and trading-day adjustments. These revisions are reflected in totals, end-use, commodity, and country summary data. Other revisions: For December and January statistical month releases, each prior month of the most recent full year is revised so that the totals of the seasonally adjusted months equal the annual totals.
U.S./Canada data exchange and substitution Data for U.S. exports to Canada are derived from import data compiled by Canada. The use of Canada's import data to produce U.S. export data requires several alignments in order to compare the two series. 1. Coverage - Canadian imports are based on country of
origin. U.S. goods shipped from a third country are included. U.S. exports exclude these foreign shipments. For November 2019, these shipments totaled $203.5 million. U.S. export coverage also excludes U.S. postal shipments to Canada. For November 2019, these shipments totaled $20.8 million. U.S. import coverage includes shipments of railcars and locomotives from Canada. Effective with January 2004 statistics, Canada excludes these shipments from its goods exports to the United States, therefore creating coverage differences between the two countries for these goods.
2. Valuation - Canadian imports are valued at the point of origin in the United States. However, U.S. exports are valued at the port of exit in the United States and
– 5 –
include inland freight charges, making the U.S. export value slightly larger than the Canadian import value. Canada requires inland freight to be reported separately from the value of the goods. Combining the inland freight and the Canadian reported import value provides a consistent valuation for all U.S. exports. Inland freight charges for November 2019 accounted for 1.8 percent of the value of U.S. exports to Canada.
3. Re-exports - Unlike Canadian imports, which are based on country of origin, U.S. exports include re-exports of foreign goods. Therefore, the aggregate U.S. export figure is slightly larger than the Canadian import figure. For November 2019, re-exports to Canada were $4,613.4 million.
4. Exchange Rate - Average monthly exchange rates are applied to convert the published data to U.S. currency. For November 2019, the average exchange rate was 1.3237 Canadian dollars per U.S. dollar.
5. Other - There are other minor differences, such as rounding error, that are statistically insignificant.
Canadian estimates: Effective with January 2001 statistics, the current month data for exports to Canada contain an estimate for late arrivals and corrections. In the following month, this estimate is replaced, in the news release exhibits only, with the actual value of late receipts and corrections. This estimate improves the current month data for exports to Canada and treats late receipts for exports to Canada in a manner that is more consistent with the treatment of late receipts for exports to other countries.
Nonsampling errors The goods data are a complete enumeration of documents collected by CBP and are not subject to sampling errors. Quality assurance procedures are performed at every stage of collection, processing, and tabulation. However, the data are still subject to several types of nonsampling errors. The most significant of these include reporting errors, undocumented shipments, timeliness, data capture errors, and errors in the estimation of low-valued transactions. Reporting errors: Reporting errors are mistakes or omissions made by importers, exporters, or their agents in their import or export declarations. Most errors involve missing or invalid commodity classification codes and missing or incorrect quantities or shipping weights. They have a negligible effect on aggregate import, export, and balance of trade statistics. However, they can affect the detailed commodity statistics. Undocumented shipments: Federal regulations require importers, exporters, or their agents to report all merchandise shipments above established exemption levels. The Census Bureau has determined that not all required documents are filed, particularly for exports.
Timeliness and data capture errors: The Census Bureau captures import and export information from administrative documents and through various automated collection programs. Documents may be lost, and data may be incorrectly keyed, coded, or recorded. Transactions may be included in a subsequent month’s statistics if received late. Low-valued transactions: The total values of transactions valued as much as or below $2,500 for exports and $2,000 ($250 for certain quota items) for imports are estimated for each country, using factors based on the ratios of low-valued shipments to individual country totals for past periods. The Census Bureau recommends that data users incorporate this information into their analyses, as nonsampling errors could impact the conclusion drawn from the results. See “U.S. Merchandise Trade Statistics: A Quality Profile” (October 2014) for a detailed discussion of errors affecting the goods data.
Area groupings North America: Canada, Mexico. Dominican Republic-Central America-United States Free Trade Agreement (CAFTA-DR): Costa Rica, Dominican Republic, El Salvador, Guatemala, Honduras, Nicaragua. Europe: Albania, Andorra, Armenia, Austria, Azerbaijan, Belarus, Belgium, Bosnia and Herzegovina, Bulgaria, Croatia, Cyprus, Czech Republic, Denmark, Estonia, Faroe Islands, Finland, France, Georgia, Germany, Gibraltar, Greece, Hungary, Iceland, Ireland, Italy, Kazakhstan, Kosovo, Kyrgyzstan, Latvia, Liechtenstein, Lithuania, Luxembourg, Malta, Moldova, Monaco, Montenegro, Netherlands, North Macedonia, Norway, Poland, Portugal, Romania, Russia, San Marino, Serbia, Slovakia, Slovenia, Spain, Svalbard-Jan Mayen Island, Sweden, Switzerland, Tajikistan, Turkey, Turkmenistan, Ukraine, United Kingdom, Uzbekistan, Vatican City. European Union: Austria, Belgium, Bulgaria, Croatia, Cyprus, Czech Republic, Denmark, Estonia, Finland, France, Germany, Greece, Hungary, Ireland, Italy, Latvia, Lithuania, Luxembourg, Malta, Netherlands, Poland, Portugal, Romania, Slovakia, Slovenia, Spain, Sweden, United Kingdom. Euro Area: Austria, Belgium, Cyprus, Estonia, Finland, France, Germany, Greece, Ireland, Italy, Latvia, Lithuania, Luxembourg, Malta, Netherlands, Portugal, Slovakia, Slovenia, Spain. Pacific Rim: Australia, Brunei, China, Hong Kong, Indonesia, Japan, Korea (South), Macau, Malaysia, New Zealand, Papua New Guinea, Philippines, Singapore, Taiwan.
– 6 –
South/Central America: Anguilla, Antigua and Barbuda, Argentina, Aruba, Bahamas, Barbados, Belize, Bermuda, Bolivia, Brazil, British Virgin Islands, Cayman Islands, Chile, Colombia, Costa Rica, Cuba, Curacao, Dominica, Dominican Republic, Ecuador, El Salvador, Falkland Islands (Islas Malvinas), French Guiana, Grenada, Guadeloupe, Guatemala, Guyana, Haiti, Honduras, Jamaica, Martinique, Montserrat, Netherlands Antilles, Nicaragua, Panama, Paraguay, Peru, Sint Maarten, St. Kitts and Nevis, St. Lucia, St. Vincent and the Grenadines, Suriname, Trinidad and Tobago, Turks and Caicos Islands, Uruguay, Venezuela. Organization of Petroleum Exporting Countries (OPEC): Algeria, Angola, Congo (Brazzaville), Ecuador, Equatorial Guinea, Gabon, Iran, Iraq, Kuwait, Libya, Nigeria, Saudi Arabia, United Arab Emirates, Venezuela. Africa: Algeria, Angola, Benin, Botswana, British Indian Ocean Territories, Burkina Faso, Burundi, Cabo Verde, Cameroon, Central African Republic, Chad, Comoros, Congo (Brazzaville), Congo (Kinshasa), Djibouti, Egypt, Equatorial Guinea, Eritrea, Eswatini, Ethiopia, French Southern and Antarctic Lands, Gabon, Gambia, Ghana, Guinea, Guinea-Bissau, Ivory Coast, Kenya, Lesotho, Liberia, Libya, Madagascar, Malawi, Mali, Mauritania, Mauritius, Mayotte, Morocco, Mozambique, Namibia, Niger, Nigeria, Reunion, Rwanda, St. Helena, Sao Tome and Principe, Senegal, Seychelles, Sierra Leone, Somalia, South Africa, South Sudan, Sudan, Tanzania, Togo, Tunisia, Uganda, Western Sahara, Zambia, Zimbabwe.
Adjustments for seasonal and trading-day variations Goods are initially classified under the Harmonized Commodity Description and Coding System (Harmonized System), which is an internationally accepted standard for the commodity classification of traded goods. The Harmonized System describes and measures the characteristics of the goods and is the basis for the systems used in the United States: Schedule B for exports and Harmonized Tariff Schedule for imports. Combining trade into approximately 140 export and 140 import end-use categories makes it possible to examine goods according to their principal uses (see exhibits 7 and 8). These categories are used as the basis for computing the seasonal and trading-day adjusted data. These adjusted data are then summed to the six end-use aggregates for publication (see exhibit 6). The Census Bureau provides these data to BEA for use in the NIPAs and in the U.S international transactions accounts (balance of payments accounts). Exhibit 19 shows goods (Census basis) that are seasonally adjusted for selected countries and world areas. Unlike the commodity-based adjustments discussed above, these adjustments are developed and applied directly at the country and world area levels. For total exports and imports, data users should refer to the commodity-based
totals shown in the other exhibits. The seasonally adjusted country and world area data will not sum to the seasonally adjusted commodity-based totals because the seasonally adjusted country and world area data and the commodity-based totals are derived from different aggregations of the export and import data and from different seasonal adjustment models. Data users should use caution drawing comparisons between the two sets of seasonally adjusted series. The seasonal adjustment procedure (X-13ARIMA-SEATS) is based on a model that estimates the monthly movements as percentages above or below the general level of series (unlike other methods that redistribute the actual series values over the calendar year). Because the data series for aircraft is highly variable, users studying data trends may wish to analyze trade in aircraft separately from other trade.
Adjustments for price change Data adjusted for seasonal variation on a real, or chained-dollar, basis (2012 reference year) are presented in exhibits 10 and 11. This adjustment for price change is done using the Fisher chain-weighted methodology. The deflators are primarily based on the monthly price indexes published by the BLS using techniques developed for the NIPAs by BEA.
Principal commodities Goods data appearing in exhibit 15 are classified in terms of the SITC Revision 4, with the exception of agricultural and manufactured goods. Agricultural goods are defined by the U.S. Department of Agriculture (USDA); they consist of non-marine food products and other products of agriculture that have not passed through complex processes of manufacture. Manufactured goods conform to the NAICS; they consist of goods that have been mechanically, physically, or chemically transformed. USDA agricultural goods and NAICS manufactured goods are not mutually exclusive categories. Re-exports are foreign merchandise entering the country as imports and then exported in substantially the same condition as when imported. Re-exports, which are included in overall export totals, appear as separate line items in exhibit 15.
Advanced technology products About 500 of some 22,000 Schedule B and Harmonized Tariff Schedule classification codes used in reporting U.S. merchandise trade are identified as "advanced technology" codes, and they meet the following criteria: 1. The code contains products whose technology is from
a recognized high technology field (e.g., biotechnology).
– 7 –
2. These products represent leading edge technology in that field.
3. Such products constitute a significant part of all items covered in the selected classification code.
The aggregation of the goods results in a measure of advanced technology trade that appears in exhibits 16 and 16a. This product- and commodity-based measure of advanced technology differs from broader NAICS-based measures, which include all goods produced by a particular industry group, regardless of the level of technology embodied in the goods.
Goods trade in the Advance Economic Indicators Report In addition to the U.S. International Trade in Goods and Services report (FT-900), which is released jointly with BEA, the Census Bureau also releases advance statistics on international trade in goods, along with advance estimates on retail and wholesale inventories, in the Advance Economic Indicators Report (Advance Report). Trade statistics in the Advance Report, released on average 24 to 26 calendar days after the end of the reference month, reflect nearly complete coverage of goods trade, while statistics in the FT-900, released on average 34 to 36 calendar days after the end of the reference month, reflect complete coverage. The Advance Report contains advance statistics for goods trade on a Census basis by principal end-use category, thus providing users an earlier high-level snapshot of U.S. international trade for the featured month. Commodity and country details and statistics for goods trade on a balance of payments (BOP) basis and for services trade are released several days later in the FT-900. See the Advance Report Frequently Asked Questions for more information. The FT-900 is the primary source for the goods trade data used in BEA’s quarterly gross domestic product (GDP) statistics. However, for the advance GDP estimate, FT-900 data for the third month are not yet available, so BEA uses data from the Advance Report. Because only goods trade on a Census basis by principal end-use category is available in the Advance Report, BEA applies adjustments, such as BOP and coverage adjustments, to the Advance Report statistics to produce detailed estimates for incorporation into the advance GDP estimate. See the “Key Source Data and Assumptions” table that accompanies each GDP release for more information.
Goods (BOP basis) and services Quarterly and annual statistics for goods on a BOP basis and for services are included in the U.S. international transactions accounts (ITAs), which are published by BEA in news releases in March, June, September, and December and in the Survey of Current Business in the January, April,
July, and October issues. The next release of the ITAs is scheduled for March 19, 2020. In addition, BEA releases detailed annual international services statistics, which consist of statistics on trade in services and on services supplied through affiliates of multinational enterprises. The statistics provide detail on U.S. trade in services by type and by country and area and detail on services supplied through affiliates by industry and by country and area.
Goods (BOP basis) Goods on a Census basis are adjusted by BEA to a BOP basis to align the data with the concepts and definitions used to prepare the international and national economic accounts. These adjustments, which are applied separately to exports and imports, are necessary to supplement coverage of the Census data, to eliminate duplication of transactions recorded elsewhere in the international accounts, and to value transactions at market prices. They include both additions to and deductions from goods on a Census basis and are presented in this release as net adjustments. Adjustments that exhibit significant seasonal patterns are seasonally adjusted. BEA also publishes more detailed quarterly and annual statistics for net adjustments in ITA Table 2.4. U.S. International Trade in Goods, Balance of Payments Adjustments and in the January, April, July, and October issues of the Survey of Current Business. The export adjustments include:
Gold exports, nonmonetary - This addition is made for gold that is purchased by foreign official agencies from private dealers in the United States and held at the Federal Reserve Bank of New York. The Census data only include gold that leaves the U.S. customs territory.
Goods procured in U.S. ports by foreign carriers - This addition is made for foreign air and ocean carriers’ fuel purchases in U.S. ports.
Net exports of goods under merchanting - This addition is made to include the net value of the purchase and subsequent resale of goods abroad without the goods entering the United States. Because these goods do not cross the U.S. customs frontier, their value is not recorded in the Census data.
Other adjustments to exports include:
Deductions for equipment repairs (parts and labor), developed motion picture film, military grant-aid, and, for periods prior to 2010, goods identified in the Census data as exports under the Foreign Military Sales (FMS) program. Additions for sales of fish caught in U.S. territorial waters, exports of electricity to Mexico, private gift parcels, vessels and oil rigs for which
– 8 –
ownership changes, valuation of software exports at market value, low-value (below reporting threshold) transactions for 1999–2009 to phase in a revised Census Bureau low-value methodology that was implemented for goods on a Census basis beginning with statistics for 2010, and, for periods prior to 2010, FMS goods exports reported to BEA by the U.S. Department of Defense.
The import adjustments include:
Gold imports, nonmonetary - This addition is made for gold sold by foreign official agencies to private purchasers out of stock held at the Federal Reserve Bank of New York. The Census data only include gold that enters the U.S. customs territory.
Goods procured in foreign ports by U.S. carriers - This addition is made for U.S. air and ocean carriers’ fuel purchases in foreign ports.
Imports by U.S. military agencies - This addition is made for purchases of goods abroad by U.S. military agencies, which are reported to BEA by the Department of Defense. The Census data only include imports of goods by U.S. military agencies that enter the U.S. customs territory.
Inland freight in Canada and Mexico - This addition is made for inland freight in Canada and Mexico. Imports of goods from all countries should be valued at the customs value—the value at the foreign port of export including inland freight charges. For imports from Canada and Mexico, this should be the cost of the goods at the U.S. border. However, the customs value for imports for certain Canadian and Mexican goods is the point of origin in Canada or Mexico. BEA makes an addition for the inland freight charges of transporting these goods to the U.S. border to make the value comparable to the customs value reported for imports from other countries.
Other adjustments to imports include:
Deductions for equipment repairs (parts and labor), repairs to U.S. vessels abroad, and developed motion picture film. Additions for non-reported imports of locomotives and railcars, imports of electricity from Mexico, conversion of vessels for commercial use, valuation of software imports at market value, and low-value (below reporting threshold) transactions for 1999–2009 to phase in a revised Census Bureau low-value methodology that was implemented for goods on a Census basis beginning with statistics for 2010.
Services The services statistics cover transactions between foreign countries and the 50 states, the District of Columbia, Puerto
Rico, the U.S. Virgin Islands, and other U.S. territories and possessions. Transactions with U.S. military, diplomatic, and consular installations abroad are excluded because these installations are considered to be part of the U.S. economy. Services statistics are based on quarterly, annual, and benchmark surveys and information obtained from monthly government and industry reports. For categories for which monthly data are not available, monthly statistics are derived from quarterly statistics through temporal distribution, or interpolation. The interpolation methodology used by BEA is the modified Denton proportional first difference method. This method preserves the pattern of the monthly indicator series, if available, while satisfying the annual aggregation constraints. See “An Empirical Review of Methods for Temporal Distribution and Interpolation in the National Accounts” (May 2008) for more information. Services are seasonally adjusted when statistically significant seasonal patterns are present. Services are shown in nine broad categories. The following is a brief description of the types of services included in each category:
Maintenance and repair services n.i.e. (not included elsewhere) - Consists of maintenance and repair services performed by residents of one country on goods that are owned by residents of another country. The repairs may be performed at the site of the repair facility or elsewhere. Excludes such services in which the cost is included in the price of the goods and is not billed separately or is declared as a part of the price of the goods on the import or export declaration filed with the U.S. Customs and Border Protection. Maintenance and repair of computers are included under computer services, and some maintenance and repair of ships, aircraft, and other transport equipment are included under transport services.
Transport - Consists of transactions associated with moving people and freight from one location to another and includes related supporting and auxiliary services. Transport covers all modes of transportation, including air, sea, rail, road, space, and pipeline. Postal and courier services and port services, which cover cargo handling, storage and warehousing, and other related transport services, are also included.
Travel (for all purposes including education) - Includes goods and services acquired by nonresidents while abroad. A traveler is defined as a person who stays, or intends to stay, for less than one year in a country of which he or she is not a resident or as a nonresident whose purpose is to obtain education or medical treatment, no matter how long the stay. Purchases can be either for own use or for gifts to others. Travel is a
– 9 –
transactor-based component that covers a variety of goods and services, primarily lodging, meals, transportation in the country of travel, amusement, entertainment, and gifts. Travel excludes air passenger services for travel between countries, which are included in transport, and goods for resale, which are included in goods.
Travel includes business and personal travel. Business travel covers goods and services acquired for use by persons whose primary purpose for travel is for business (including goods and services for which business travelers are reimbursed by employers). Business travel also includes expenditures by border, seasonal, and other short-term workers in their economy of employment. Personal travel covers travel for all non-business purposes, including for medical or educational purposes.
Insurance services - Includes the direct insurance services of providing life insurance and annuities, non-life (property and casualty) insurance, reinsurance, freight insurance, and auxiliary insurance services. Insurance is measured as gross premiums earned plus premium supplements less claims payable, with an adjustment for claims volatility. Premium supplements represent investment income from insurance reserves, which are attributed to policyholders who are treated as paying the income back to the insurer. Auxiliary insurance services include agents’ commissions, brokerage services, insurance consulting services, actuarial services, and other insurance services.
Financial services - Includes financial intermediary and auxiliary services, except insurance services. These services include those normally provided by banks and other financial institutions. Services primarily include those for which an explicit commission or a fee is charged; implicit fees for bond transactions, measured as the difference between bid and ask prices, are also included. Services include securities brokerage and underwriting, financial management, financial advisory, and custody services; credit and other credit-related services; and securities lending, electronic funds transfer, and other services.
Charges for the use of intellectual property n.i.e. - Includes charges for the use of proprietary rights, such as patents, trademarks, and copyrights, and charges for licenses to use, reproduce, distribute, and sell or purchase intellectual property.
Telecommunications, computer, and information services - Telecommunications services include the broadcast or transmission of sound, images, data, or other information by electronic means. These services do not include the value of the information transmitted. Computer services consist of hardware- and software-
related services and data processing services. Sales of customized software and related use licenses, as well as licenses to use non-customized software with a periodic license fee, are also included, as is software downloaded or otherwise electronically delivered. Cross-border transactions in non-customized packaged software with a license for perpetual use are included in goods. Information services include news agency services, database services, and web search portals.
Other business services - Consists of research and development services, professional and management consulting services, and technical, trade-related, and other business services. Research and development services include services associated with basic and applied research and experimental development of new products and processes. Professional and management consulting services include legal services, accounting, management consulting, managerial services, public relations services, advertising, and market research. Amounts received by a parent company from its affiliates for general overhead expenses related to these services are included. Technical, trade-related, and other business services include architectural and engineering, construction, audio-visual, waste treatment, operational leasing, trade-related, and other business services.
Government goods and services n.i.e. - Includes goods and services supplied by and to enclaves, such as embassies, military bases, and international organizations; goods and services acquired from the host economy by diplomats, consular staff, and military personnel located abroad and their dependents; and services supplied by and to governments that are not included in other services categories. Services supplied by and to governments are classified to specific services categories when source data permit.
Goods (BOP basis) and services by country and area Monthly country and area detail is not available for goods on a BOP basis or for services. However, quarterly statistics on goods on a BOP basis and on services that are seasonally adjusted by geography are shown in exhibit 20. Unlike the seasonal adjustments by commodity and by service type that are applied to the global totals, these adjustments are developed and applied directly at the country and world area levels. For total exports and imports, data users should refer to the by-commodity and by-service type totals shown in the other exhibits. The seasonally adjusted country and world area data will not sum to the seasonally adjusted by-commodity and by-service type totals because the two sets of statistics are derived from different aggregations of the export and import data and from different seasonal adjustment models. Data users should use caution drawing
– 10 –
comparisons between the two sets of seasonally adjusted series. The definitions of the world areas shown in exhibit 20 are consistent with the definitions for goods on a Census basis (see Area groupings above) with a few exceptions. For services, CAFTA-DR is not available because trade with this area’s member countries cannot be separately identified. For goods on a BOP basis and for services, European Union and OPEC reflect the composition of the areas at the time of reporting.
Revision procedure (goods on a BOP basis and services) Monthly revisions: Each month, a preliminary estimate for the current month and a revised estimate for the immediately preceding month are released. After the initial revision, no further revisions are made to a month until more complete source data become available in March, June, September, and December. Quarterly revisions: The releases in March, June, September, and December contain revised estimates for the previous six months to incorporate more comprehensive and updated source data. Annual revisions: Each June, historical data are revised to incorporate newly available and revised source data, changes in definitions and classifications, and changes in
estimation methods. Seasonally adjusted data are also revised to reflect recalculated seasonal and trading-day adjustments. Other revisions: The release for December statistical month contains revisions to goods for January through November of the most recent year; the release for January statistical month contains revisions to both goods and services for all months of the most recent year. These revisions result from forcing the seasonally adjusted months to equal the annual totals.
Data availability The FT-900 and the FT-900 Supplement are available at www.census.gov/ft900 or www.bea.gov/data/intl-trade-investment/international-trade-goods-and-services. Census Bureau’s application programming interface (API): The Census Bureau’s API, available at www.census.gov/developers/, lets developers create custom apps to reach new users and makes key demographic, socio-economic, and housing statistics more accessible than ever before. BEA’s data API: BEA’s data API, available at apps.bea.gov/API/signup/index.cfm, provides programmatic access to BEA’s published economic statistics using industry-standard methods and procedures.
– 11 –
List of News Release Exhibits Part A: Seasonally Adjusted (by Commodity/Service) Exhibit 1. U.S. International Trade in Goods and Services Exhibit 2. U.S. International Trade in Goods and Services Three-Month Moving Averages Exhibit 3. U.S. Exports of Services by Major Category Exhibit 4. U.S. Imports of Services by Major Category Exhibit 5. U.S. Trade in Goods Exhibit 6. U.S. Trade in Goods by Principal End-Use Category Exhibit 7. U.S. Exports of Goods by End-Use Category and Commodity Exhibit 8. U.S. Imports of Goods by End-Use Category and Commodity Exhibit 9. U.S. Trade in Petroleum and Non-Petroleum Products by End-Use Exhibit 10. Real U.S. Trade in Goods by Principal End-Use Category—Chained (2012) Dollars Exhibit 11. Real U.S. Trade in Petroleum and Non-Petroleum Products by End-Use—Chained (2012) Dollars Part B: Not Seasonally Adjusted Exhibit 12. U.S. Trade in Goods Exhibit 13. U.S. Trade in Goods by Principal End-Use Category Exhibit 14. U.S. Trade in Goods by Selected Countries and Areas: 2019 Exhibit 14a. U.S. Trade in Goods by Selected Countries and Areas: 2018 Exhibit 15. U.S. Trade in Goods by Principal Commodities Exhibit 16. U.S. Trade in Advanced Technology Products Exhibit 16a. U.S. Trade in Advanced Technology Products by Technology Group and Selected Countries and Areas Exhibit 17. U.S. Imports of Energy-Related Petroleum Products, Including Crude Oil Exhibit 17a. U.S. Imports of Crude Oil by Selected Countries Exhibit 18. U.S. Trade in Motor Vehicles and Parts by Selected Countries Part C: Seasonally Adjusted (by Geography) Exhibit 19. U.S. Trade in Goods by Selected Countries and Areas—Census Basis Exhibit 20. U.S. Trade in Goods and Services by Selected Countries and Areas—BOP Basis Exhibit 20a. U.S. Trade in Goods by Selected Countries and Areas—BOP Basis Exhibit 20b. U.S. Trade in Services by Selected Countries and Areas
– 12 –

- BLANK PAGE -
– 13 –
Part A: Seasonally Adjusted (by Commodity/Service)
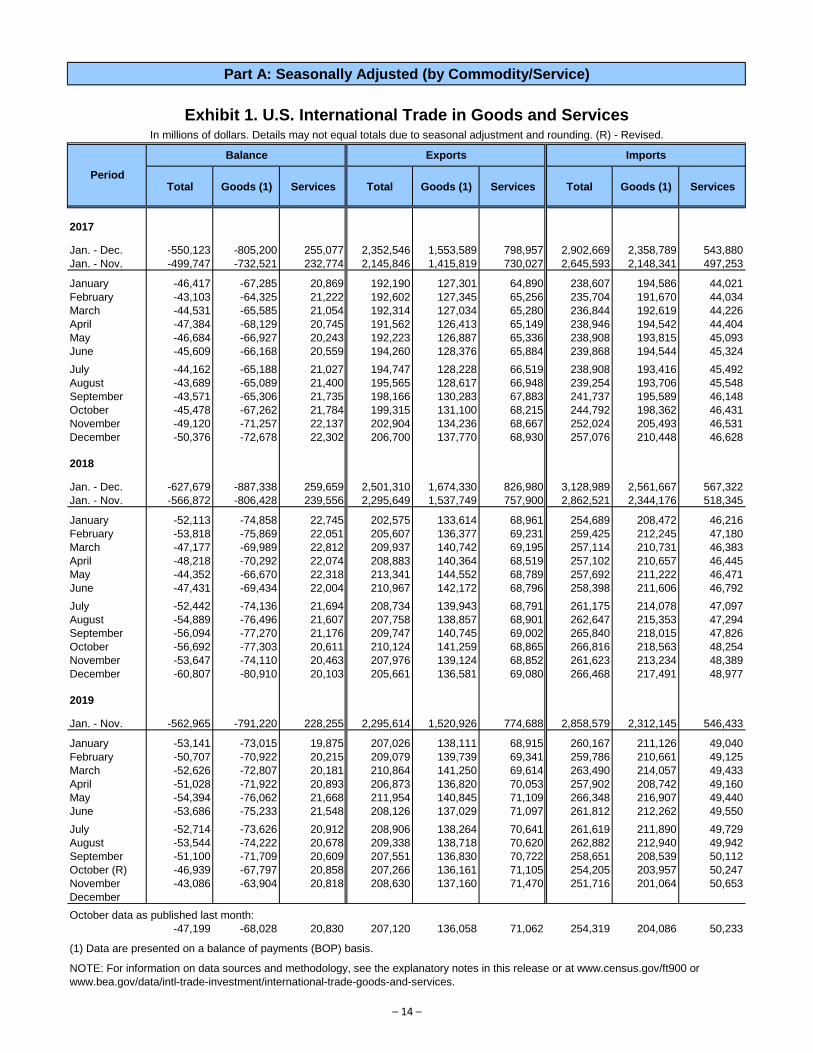
Exhibit 1. U.S. International Trade in Goods and ServicesIn millions of dollars. Details may not equal totals due to seasonal adjustment and rounding. (R) - Revised.
Balance Exports Imports
Total Goods (1) Services Total Goods (1) Services Total Goods (1) Services
2017
Jan. - Dec. -550,123 -805,200 255,077 2,352,546 1,553,589 798,957 2,902,669 2,358,789 543,880
Jan. - Nov. -499,747 -732,521 232,774 2,145,846 1,415,819 730,027 2,645,593 2,148,341 497,253
January -46,417 -67,285 20,869 192,190 127,301 64,890 238,607 194,586 44,021
February -43,103 -64,325 21,222 192,602 127,345 65,256 235,704 191,670 44,034
March -44,531 -65,585 21,054 192,314 127,034 65,280 236,844 192,619 44,226
April -47,384 -68,129 20,745 191,562 126,413 65,149 238,946 194,542 44,404
May -46,684 -66,927 20,243 192,223 126,887 65,336 238,908 193,815 45,093
June -45,609 -66,168 20,559 194,260 128,376 65,884 239,868 194,544 45,324
July -44,162 -65,188 21,027 194,747 128,228 66,519 238,908 193,416 45,492
August -43,689 -65,089 21,400 195,565 128,617 66,948 239,254 193,706 45,548
September -43,571 -65,306 21,735 198,166 130,283 67,883 241,737 195,589 46,148
October -45,478 -67,262 21,784 199,315 131,100 68,215 244,792 198,362 46,431
November -49,120 -71,257 22,137 202,904 134,236 68,667 252,024 205,493 46,531
December -50,376 -72,678 22,302 206,700 137,770 68,930 257,076 210,448 46,628
2018
Jan. - Dec. -627,679 -887,338 259,659 2,501,310 1,674,330 826,980 3,128,989 2,561,667 567,322
Jan. - Nov. -566,872 -806,428 239,556 2,295,649 1,537,749 757,900 2,862,521 2,344,176 518,345
January -52,113 -74,858 22,745 202,575 133,614 68,961 254,689 208,472 46,216
February -53,818 -75,869 22,051 205,607 136,377 69,231 259,425 212,245 47,180
March -47,177 -69,989 22,812 209,937 140,742 69,195 257,114 210,731 46,383
April -48,218 -70,292 22,074 208,883 140,364 68,519 257,102 210,657 46,445
May -44,352 -66,670 22,318 213,341 144,552 68,789 257,692 211,222 46,471
June -47,431 -69,434 22,004 210,967 142,172 68,796 258,398 211,606 46,792
July -52,442 -74,136 21,694 208,734 139,943 68,791 261,175 214,078 47,097
August -54,889 -76,496 21,607 207,758 138,857 68,901 262,647 215,353 47,294
September -56,094 -77,270 21,176 209,747 140,745 69,002 265,840 218,015 47,826
October -56,692 -77,303 20,611 210,124 141,259 68,865 266,816 218,563 48,254
November -53,647 -74,110 20,463 207,976 139,124 68,852 261,623 213,234 48,389
December -60,807 -80,910 20,103 205,661 136,581 69,080 266,468 217,491 48,977
2019
Jan. - Nov. -562,965 -791,220 228,255 2,295,614 1,520,926 774,688 2,858,579 2,312,145 546,433
January -53,141 -73,015 19,875 207,026 138,111 68,915 260,167 211,126 49,040
February -50,707 -70,922 20,215 209,079 139,739 69,341 259,786 210,661 49,125
March -52,626 -72,807 20,181 210,864 141,250 69,614 263,490 214,057 49,433
April -51,028 -71,922 20,893 206,873 136,820 70,053 257,902 208,742 49,160
May -54,394 -76,062 21,668 211,954 140,845 71,109 266,348 216,907 49,440
June -53,686 -75,233 21,548 208,126 137,029 71,097 261,812 212,262 49,550
July -52,714 -73,626 20,912 208,906 138,264 70,641 261,619 211,890 49,729
August -53,544 -74,222 20,678 209,338 138,718 70,620 262,882 212,940 49,942
September -51,100 -71,709 20,609 207,551 136,830 70,722 258,651 208,539 50,112
October (R) -46,939 -67,797 20,858 207,266 136,161 71,105 254,205 203,957 50,247
November -43,086 -63,904 20,818 208,630 137,160 71,470 251,716 201,064 50,653
December
October data as published last month:
-47,199 -68,028 20,830 207,120 136,058 71,062 254,319 204,086 50,233
(1) Data are presented on a balance of payments (BOP) basis.
NOTE: For information on data sources and methodology, see the explanatory notes in this release or at www.census.gov/ft900 or
www.bea.gov/data/intl-trade-investment/international-trade-goods-and-services.
Period
– 14 –
Part A: Seasonally Adjusted (by Commodity/Service)
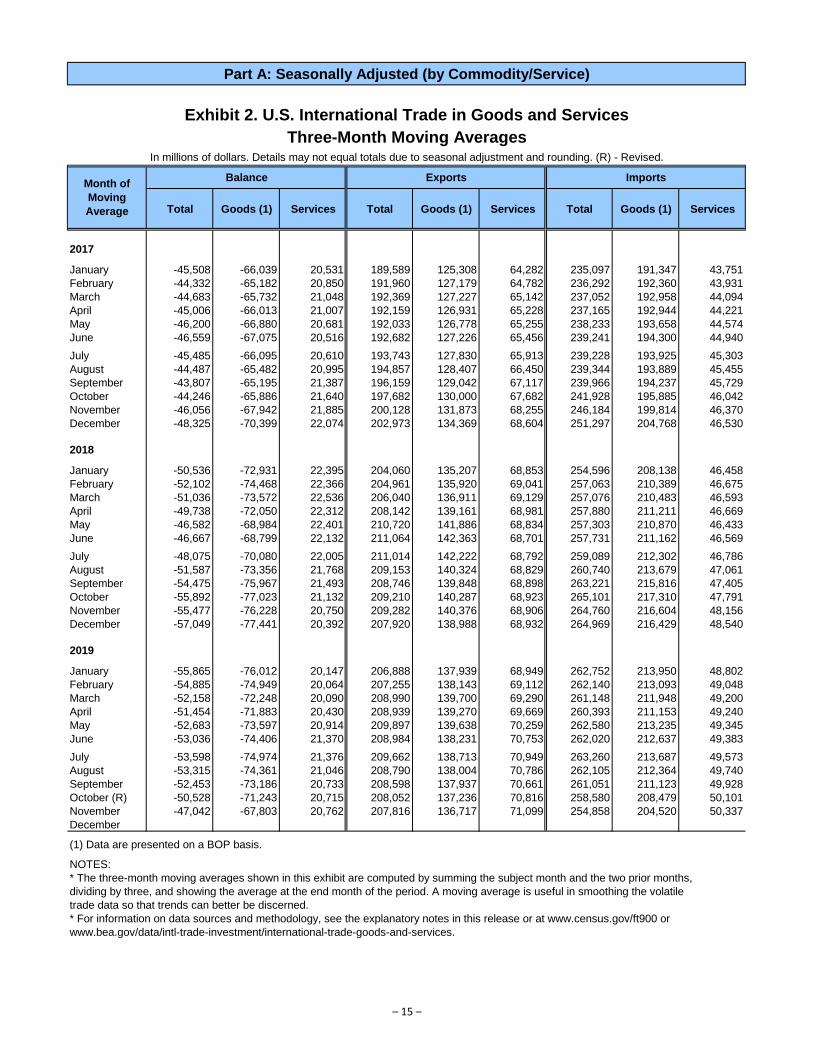
Exhibit 2. U.S. International Trade in Goods and Services
Three-Month Moving AveragesIn millions of dollars. Details may not equal totals due to seasonal adjustment and rounding. (R) - Revised.
Balance Exports Imports
Total Goods (1) Services Total Goods (1) Services Total Goods (1) Services
2017
January -45,508 -66,039 20,531 189,589 125,308 64,282 235,097 191,347 43,751
February -44,332 -65,182 20,850 191,960 127,179 64,782 236,292 192,360 43,931
March -44,683 -65,732 21,048 192,369 127,227 65,142 237,052 192,958 44,094
April -45,006 -66,013 21,007 192,159 126,931 65,228 237,165 192,944 44,221
May -46,200 -66,880 20,681 192,033 126,778 65,255 238,233 193,658 44,574
June -46,559 -67,075 20,516 192,682 127,226 65,456 239,241 194,300 44,940
July -45,485 -66,095 20,610 193,743 127,830 65,913 239,228 193,925 45,303
August -44,487 -65,482 20,995 194,857 128,407 66,450 239,344 193,889 45,455
September -43,807 -65,195 21,387 196,159 129,042 67,117 239,966 194,237 45,729
October -44,246 -65,886 21,640 197,682 130,000 67,682 241,928 195,885 46,042
November -46,056 -67,942 21,885 200,128 131,873 68,255 246,184 199,814 46,370
December -48,325 -70,399 22,074 202,973 134,369 68,604 251,297 204,768 46,530
2018
January -50,536 -72,931 22,395 204,060 135,207 68,853 254,596 208,138 46,458
February -52,102 -74,468 22,366 204,961 135,920 69,041 257,063 210,389 46,675
March -51,036 -73,572 22,536 206,040 136,911 69,129 257,076 210,483 46,593
April -49,738 -72,050 22,312 208,142 139,161 68,981 257,880 211,211 46,669
May -46,582 -68,984 22,401 210,720 141,886 68,834 257,303 210,870 46,433
June -46,667 -68,799 22,132 211,064 142,363 68,701 257,731 211,162 46,569
July -48,075 -70,080 22,005 211,014 142,222 68,792 259,089 212,302 46,786
August -51,587 -73,356 21,768 209,153 140,324 68,829 260,740 213,679 47,061
September -54,475 -75,967 21,493 208,746 139,848 68,898 263,221 215,816 47,405
October -55,892 -77,023 21,132 209,210 140,287 68,923 265,101 217,310 47,791
November -55,477 -76,228 20,750 209,282 140,376 68,906 264,760 216,604 48,156
December -57,049 -77,441 20,392 207,920 138,988 68,932 264,969 216,429 48,540
2019
January -55,865 -76,012 20,147 206,888 137,939 68,949 262,752 213,950 48,802
February -54,885 -74,949 20,064 207,255 138,143 69,112 262,140 213,093 49,048
March -52,158 -72,248 20,090 208,990 139,700 69,290 261,148 211,948 49,200
April -51,454 -71,883 20,430 208,939 139,270 69,669 260,393 211,153 49,240
May -52,683 -73,597 20,914 209,897 139,638 70,259 262,580 213,235 49,345
June -53,036 -74,406 21,370 208,984 138,231 70,753 262,020 212,637 49,383
July -53,598 -74,974 21,376 209,662 138,713 70,949 263,260 213,687 49,573
August -53,315 -74,361 21,046 208,790 138,004 70,786 262,105 212,364 49,740
September -52,453 -73,186 20,733 208,598 137,937 70,661 261,051 211,123 49,928
October (R) -50,528 -71,243 20,715 208,052 137,236 70,816 258,580 208,479 50,101
November -47,042 -67,803 20,762 207,816 136,717 71,099 254,858 204,520 50,337
December
(1) Data are presented on a BOP basis.
NOTES:
* The three-month moving averages shown in this exhibit are computed by summing the subject month and the two prior months,
dividing by three, and showing the average at the end month of the period. A moving average is useful in smoothing the volatile
trade data so that trends can better be discerned.
* For information on data sources and methodology, see the explanatory notes in this release or at www.census.gov/ft900 or
www.bea.gov/data/intl-trade-investment/international-trade-goods-and-services.
Month of
Moving
Average
– 15 –
Part A: Seasonally Adjusted (by Commodity/Service)
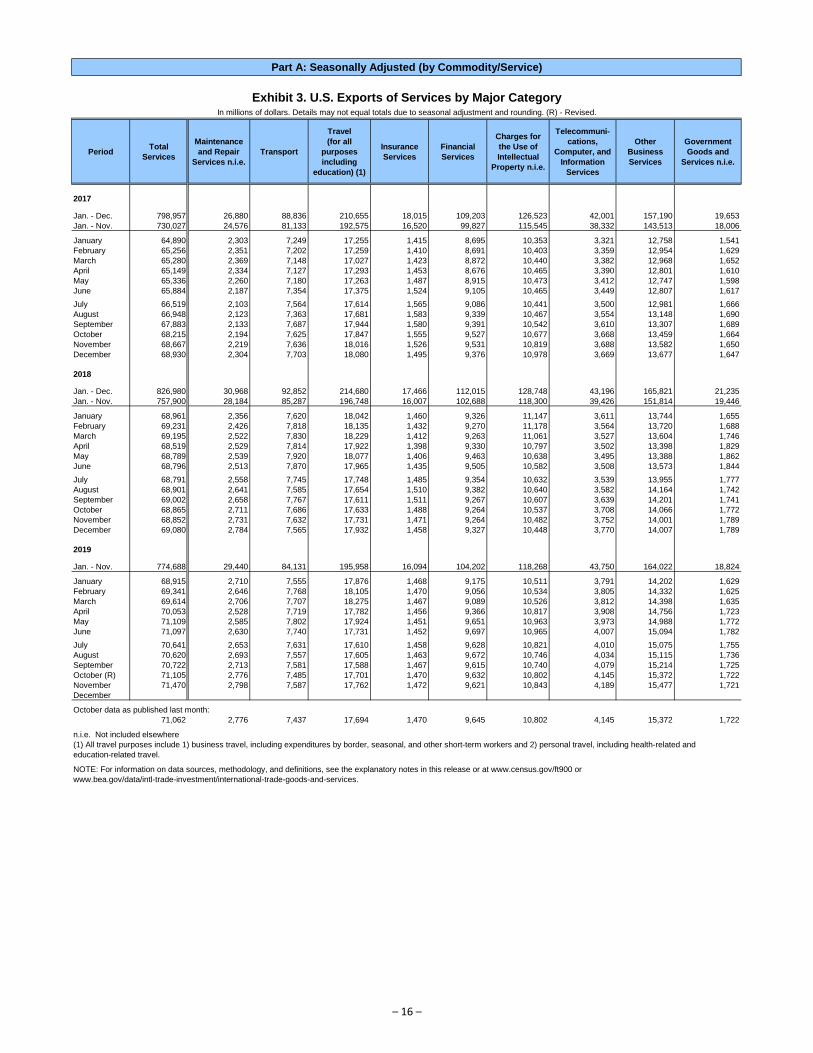
Exhibit 3. U.S. Exports of Services by Major CategoryIn millions of dollars. Details may not equal totals due to seasonal adjustment and rounding. (R) - Revised.
PeriodTotal
Services
Maintenance
and Repair
Services n.i.e.
Transport
Travel
(for all
purposes
including
education) (1)
Insurance
Services
Financial
Services
Charges for
the Use of
Intellectual
Property n.i.e.
Telecommuni-
cations,
Computer, and
Information
Services
Other
Business
Services
Government
Goods and
Services n.i.e.
2017
Jan. - Dec. 798,957 26,880 88,836 210,655 18,015 109,203 126,523 42,001 157,190 19,653
Jan. - Nov. 730,027 24,576 81,133 192,575 16,520 99,827 115,545 38,332 143,513 18,006
January 64,890 2,303 7,249 17,255 1,415 8,695 10,353 3,321 12,758 1,541
February 65,256 2,351 7,202 17,259 1,410 8,691 10,403 3,359 12,954 1,629
March 65,280 2,369 7,148 17,027 1,423 8,872 10,440 3,382 12,968 1,652
April 65,149 2,334 7,127 17,293 1,453 8,676 10,465 3,390 12,801 1,610
May 65,336 2,260 7,180 17,263 1,487 8,915 10,473 3,412 12,747 1,598
June 65,884 2,187 7,354 17,375 1,524 9,105 10,465 3,449 12,807 1,617
July 66,519 2,103 7,564 17,614 1,565 9,086 10,441 3,500 12,981 1,666
August 66,948 2,123 7,363 17,681 1,583 9,339 10,467 3,554 13,148 1,690
September 67,883 2,133 7,687 17,944 1,580 9,391 10,542 3,610 13,307 1,689
October 68,215 2,194 7,625 17,847 1,555 9,527 10,677 3,668 13,459 1,664
November 68,667 2,219 7,636 18,016 1,526 9,531 10,819 3,688 13,582 1,650
December 68,930 2,304 7,703 18,080 1,495 9,376 10,978 3,669 13,677 1,647
2018
Jan. - Dec. 826,980 30,968 92,852 214,680 17,466 112,015 128,748 43,196 165,821 21,235
Jan. - Nov. 757,900 28,184 85,287 196,748 16,007 102,688 118,300 39,426 151,814 19,446
January 68,961 2,356 7,620 18,042 1,460 9,326 11,147 3,611 13,744 1,655
February 69,231 2,426 7,818 18,135 1,432 9,270 11,178 3,564 13,720 1,688
March 69,195 2,522 7,830 18,229 1,412 9,263 11,061 3,527 13,604 1,746
April 68,519 2,529 7,814 17,922 1,398 9,330 10,797 3,502 13,398 1,829
May 68,789 2,539 7,920 18,077 1,406 9,463 10,638 3,495 13,388 1,862
June 68,796 2,513 7,870 17,965 1,435 9,505 10,582 3,508 13,573 1,844
July 68,791 2,558 7,745 17,748 1,485 9,354 10,632 3,539 13,955 1,777
August 68,901 2,641 7,585 17,654 1,510 9,382 10,640 3,582 14,164 1,742
September 69,002 2,658 7,767 17,611 1,511 9,267 10,607 3,639 14,201 1,741
October 68,865 2,711 7,686 17,633 1,488 9,264 10,537 3,708 14,066 1,772
November 68,852 2,731 7,632 17,731 1,471 9,264 10,482 3,752 14,001 1,789
December 69,080 2,784 7,565 17,932 1,458 9,327 10,448 3,770 14,007 1,789
2019
Jan. - Nov. 774,688 29,440 84,131 195,958 16,094 104,202 118,268 43,750 164,022 18,824
January 68,915 2,710 7,555 17,876 1,468 9,175 10,511 3,791 14,202 1,629
February 69,341 2,646 7,768 18,105 1,470 9,056 10,534 3,805 14,332 1,625
March 69,614 2,706 7,707 18,275 1,467 9,089 10,526 3,812 14,398 1,635
April 70,053 2,528 7,719 17,782 1,456 9,366 10,817 3,908 14,756 1,723
May 71,109 2,585 7,802 17,924 1,451 9,651 10,963 3,973 14,988 1,772
June 71,097 2,630 7,740 17,731 1,452 9,697 10,965 4,007 15,094 1,782
July 70,641 2,653 7,631 17,610 1,458 9,628 10,821 4,010 15,075 1,755
August 70,620 2,693 7,557 17,605 1,463 9,672 10,746 4,034 15,115 1,736
September 70,722 2,713 7,581 17,588 1,467 9,615 10,740 4,079 15,214 1,725
October (R) 71,105 2,776 7,485 17,701 1,470 9,632 10,802 4,145 15,372 1,722
November 71,470 2,798 7,587 17,762 1,472 9,621 10,843 4,189 15,477 1,721
December
October data as published last month:
71,062 2,776 7,437 17,694 1,470 9,645 10,802 4,145 15,372 1,722
n.i.e. Not included elsewhere
(1) All travel purposes include 1) business travel, including expenditures by border, seasonal, and other short-term workers and 2) personal travel, including health-related and
education-related travel.
NOTE: For information on data sources, methodology, and definitions, see the explanatory notes in this release or at www.census.gov/ft900 or
www.bea.gov/data/intl-trade-investment/international-trade-goods-and-services.
– 16 –
Part A: Seasonally Adjusted (by Commodity/Service)
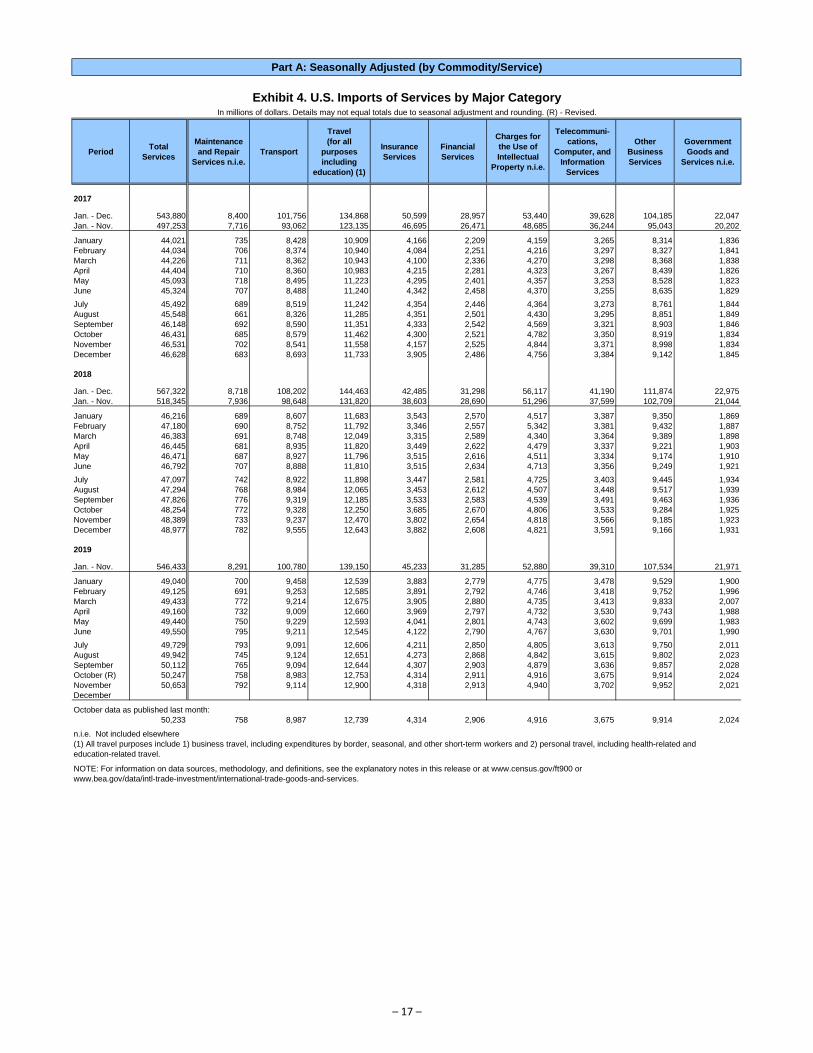
Exhibit 4. U.S. Imports of Services by Major CategoryIn millions of dollars. Details may not equal totals due to seasonal adjustment and rounding. (R) - Revised.
PeriodTotal
Services
Maintenance
and Repair
Services n.i.e.
Transport
Travel
(for all
purposes
including
education) (1)
Insurance
Services
Financial
Services
Charges for
the Use of
Intellectual
Property n.i.e.
Telecommuni-
cations,
Computer, and
Information
Services
Other
Business
Services
Government
Goods and
Services n.i.e.
2017
Jan. - Dec. 543,880 8,400 101,756 134,868 50,599 28,957 53,440 39,628 104,185 22,047
Jan. - Nov. 497,253 7,716 93,062 123,135 46,695 26,471 48,685 36,244 95,043 20,202
January 44,021 735 8,428 10,909 4,166 2,209 4,159 3,265 8,314 1,836
February 44,034 706 8,374 10,940 4,084 2,251 4,216 3,297 8,327 1,841
March 44,226 711 8,362 10,943 4,100 2,336 4,270 3,298 8,368 1,838
April 44,404 710 8,360 10,983 4,215 2,281 4,323 3,267 8,439 1,826
May 45,093 718 8,495 11,223 4,295 2,401 4,357 3,253 8,528 1,823
June 45,324 707 8,488 11,240 4,342 2,458 4,370 3,255 8,635 1,829
July 45,492 689 8,519 11,242 4,354 2,446 4,364 3,273 8,761 1,844
August 45,548 661 8,326 11,285 4,351 2,501 4,430 3,295 8,851 1,849
September 46,148 692 8,590 11,351 4,333 2,542 4,569 3,321 8,903 1,846
October 46,431 685 8,579 11,462 4,300 2,521 4,782 3,350 8,919 1,834
November 46,531 702 8,541 11,558 4,157 2,525 4,844 3,371 8,998 1,834
December 46,628 683 8,693 11,733 3,905 2,486 4,756 3,384 9,142 1,845
2018
Jan. - Dec. 567,322 8,718 108,202 144,463 42,485 31,298 56,117 41,190 111,874 22,975
Jan. - Nov. 518,345 7,936 98,648 131,820 38,603 28,690 51,296 37,599 102,709 21,044
January 46,216 689 8,607 11,683 3,543 2,570 4,517 3,387 9,350 1,869
February 47,180 690 8,752 11,792 3,346 2,557 5,342 3,381 9,432 1,887
March 46,383 691 8,748 12,049 3,315 2,589 4,340 3,364 9,389 1,898
April 46,445 681 8,935 11,820 3,449 2,622 4,479 3,337 9,221 1,903
May 46,471 687 8,927 11,796 3,515 2,616 4,511 3,334 9,174 1,910
June 46,792 707 8,888 11,810 3,515 2,634 4,713 3,356 9,249 1,921
July 47,097 742 8,922 11,898 3,447 2,581 4,725 3,403 9,445 1,934
August 47,294 768 8,984 12,065 3,453 2,612 4,507 3,448 9,517 1,939
September 47,826 776 9,319 12,185 3,533 2,583 4,539 3,491 9,463 1,936
October 48,254 772 9,328 12,250 3,685 2,670 4,806 3,533 9,284 1,925
November 48,389 733 9,237 12,470 3,802 2,654 4,818 3,566 9,185 1,923
December 48,977 782 9,555 12,643 3,882 2,608 4,821 3,591 9,166 1,931
2019
Jan. - Nov. 546,433 8,291 100,780 139,150 45,233 31,285 52,880 39,310 107,534 21,971
January 49,040 700 9,458 12,539 3,883 2,779 4,775 3,478 9,529 1,900
February 49,125 691 9,253 12,585 3,891 2,792 4,746 3,418 9,752 1,996
March 49,433 772 9,214 12,675 3,905 2,880 4,735 3,413 9,833 2,007
April 49,160 732 9,009 12,660 3,969 2,797 4,732 3,530 9,743 1,988
May 49,440 750 9,229 12,593 4,041 2,801 4,743 3,602 9,699 1,983
June 49,550 795 9,211 12,545 4,122 2,790 4,767 3,630 9,701 1,990
July 49,729 793 9,091 12,606 4,211 2,850 4,805 3,613 9,750 2,011
August 49,942 745 9,124 12,651 4,273 2,868 4,842 3,615 9,802 2,023
September 50,112 765 9,094 12,644 4,307 2,903 4,879 3,636 9,857 2,028
October (R) 50,247 758 8,983 12,753 4,314 2,911 4,916 3,675 9,914 2,024
November 50,653 792 9,114 12,900 4,318 2,913 4,940 3,702 9,952 2,021
December
October data as published last month:
50,233 758 8,987 12,739 4,314 2,906 4,916 3,675 9,914 2,024
n.i.e. Not included elsewhere
(1) All travel purposes include 1) business travel, including expenditures by border, seasonal, and other short-term workers and 2) personal travel, including health-related and
education-related travel.
NOTE: For information on data sources, methodology, and definitions, see the explanatory notes in this release or at www.census.gov/ft900 or
www.bea.gov/data/intl-trade-investment/international-trade-goods-and-services.
– 17 –
Part A: Seasonally Adjusted (by Commodity/Service)
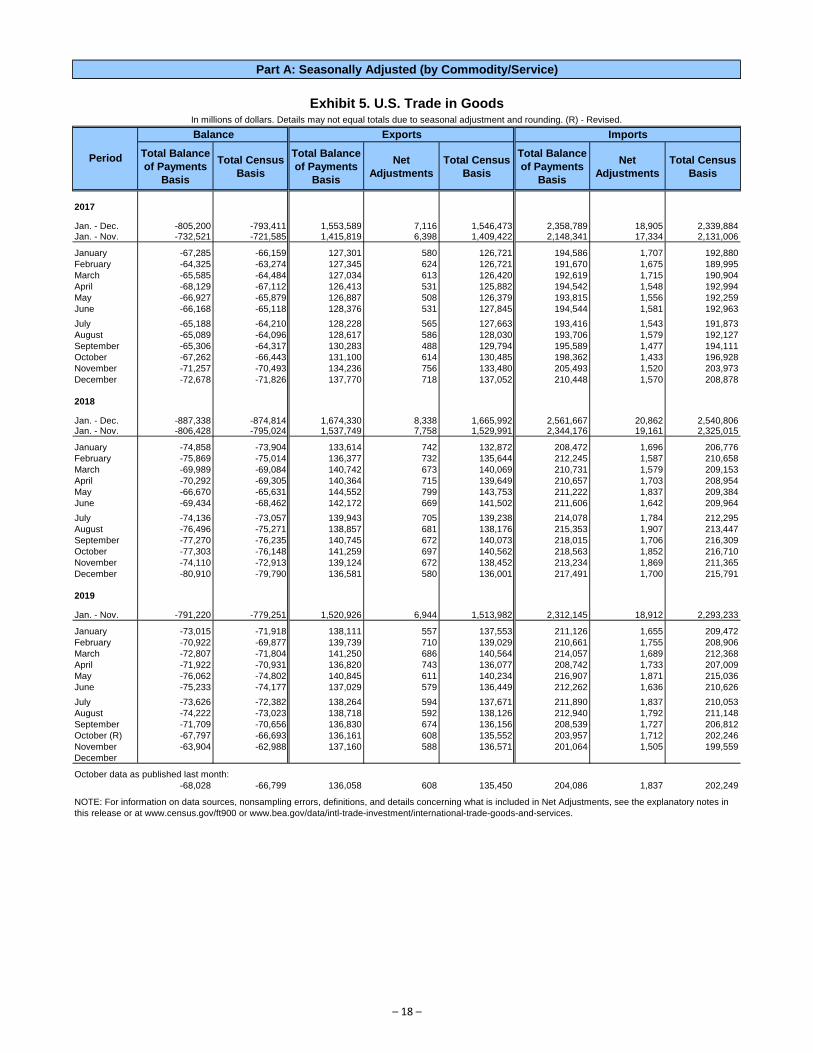
Exhibit 5. U.S. Trade in GoodsIn millions of dollars. Details may not equal totals due to seasonal adjustment and rounding. (R) - Revised.
Balance Exports Imports
Total Balance
of Payments
Basis
Total Census
Basis
Total Balance
of Payments
Basis
Net
Adjustments
Total Census
Basis
Total Balance
of Payments
Basis
Net
Adjustments
Total Census
Basis
2017
Jan. - Dec. -805,200 -793,411 1,553,589 7,116 1,546,473 2,358,789 18,905 2,339,884Jan. - Nov. -732,521 -721,585 1,415,819 6,398 1,409,422 2,148,341 17,334 2,131,006
January -67,285 -66,159 127,301 580 126,721 194,586 1,707 192,880
February -64,325 -63,274 127,345 624 126,721 191,670 1,675 189,995
March -65,585 -64,484 127,034 613 126,420 192,619 1,715 190,904
April -68,129 -67,112 126,413 531 125,882 194,542 1,548 192,994
May -66,927 -65,879 126,887 508 126,379 193,815 1,556 192,259
June -66,168 -65,118 128,376 531 127,845 194,544 1,581 192,963
July -65,188 -64,210 128,228 565 127,663 193,416 1,543 191,873
August -65,089 -64,096 128,617 586 128,030 193,706 1,579 192,127
September -65,306 -64,317 130,283 488 129,794 195,589 1,477 194,111
October -67,262 -66,443 131,100 614 130,485 198,362 1,433 196,928
November -71,257 -70,493 134,236 756 133,480 205,493 1,520 203,973
December -72,678 -71,826 137,770 718 137,052 210,448 1,570 208,878
2018
Jan. - Dec. -887,338 -874,814 1,674,330 8,338 1,665,992 2,561,667 20,862 2,540,806Jan. - Nov. -806,428 -795,024 1,537,749 7,758 1,529,991 2,344,176 19,161 2,325,015
January -74,858 -73,904 133,614 742 132,872 208,472 1,696 206,776
February -75,869 -75,014 136,377 732 135,644 212,245 1,587 210,658
March -69,989 -69,084 140,742 673 140,069 210,731 1,579 209,153
April -70,292 -69,305 140,364 715 139,649 210,657 1,703 208,954
May -66,670 -65,631 144,552 799 143,753 211,222 1,837 209,384
June -69,434 -68,462 142,172 669 141,502 211,606 1,642 209,964
July -74,136 -73,057 139,943 705 139,238 214,078 1,784 212,295
August -76,496 -75,271 138,857 681 138,176 215,353 1,907 213,447
September -77,270 -76,235 140,745 672 140,073 218,015 1,706 216,309
October -77,303 -76,148 141,259 697 140,562 218,563 1,852 216,710
November -74,110 -72,913 139,124 672 138,452 213,234 1,869 211,365
December -80,910 -79,790 136,581 580 136,001 217,491 1,700 215,791
2019
Jan. - Nov. -791,220 -779,251 1,520,926 6,944 1,513,982 2,312,145 18,912 2,293,233
January -73,015 -71,918 138,111 557 137,553 211,126 1,655 209,472
February -70,922 -69,877 139,739 710 139,029 210,661 1,755 208,906
March -72,807 -71,804 141,250 686 140,564 214,057 1,689 212,368
April -71,922 -70,931 136,820 743 136,077 208,742 1,733 207,009
May -76,062 -74,802 140,845 611 140,234 216,907 1,871 215,036
June -75,233 -74,177 137,029 579 136,449 212,262 1,636 210,626
July -73,626 -72,382 138,264 594 137,671 211,890 1,837 210,053
August -74,222 -73,023 138,718 592 138,126 212,940 1,792 211,148
September -71,709 -70,656 136,830 674 136,156 208,539 1,727 206,812
October (R) -67,797 -66,693 136,161 608 135,552 203,957 1,712 202,246
November -63,904 -62,988 137,160 588 136,571 201,064 1,505 199,559
December
October data as published last month:
-68,028 -66,799 136,058 608 135,450 204,086 1,837 202,249
NOTE: For information on data sources, nonsampling errors, definitions, and details concerning what is included in Net Adjustments, see the explanatory notes in
this release or at www.census.gov/ft900 or www.bea.gov/data/intl-trade-investment/international-trade-goods-and-services.
Period
– 18 –
Part A: Seasonally Adjusted (by Commodity/Service)
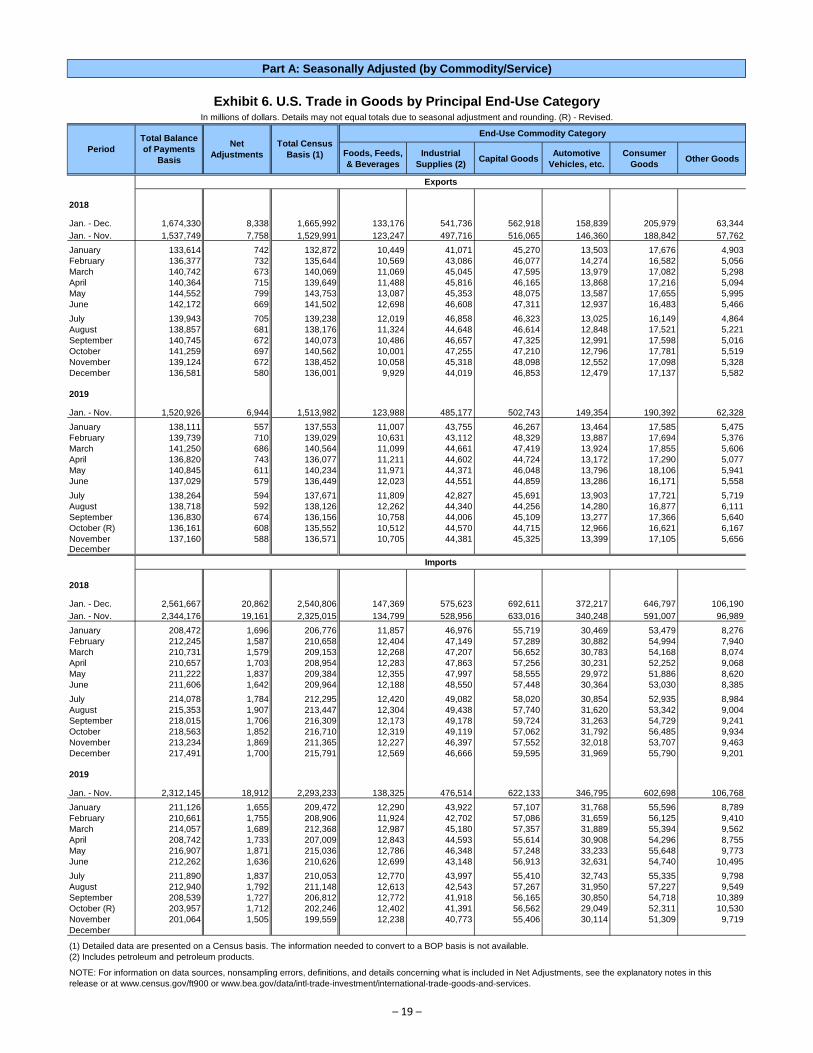
Exhibit 6. U.S. Trade in Goods by Principal End-Use CategoryIn millions of dollars. Details may not equal totals due to seasonal adjustment and rounding. (R) - Revised.
End-Use Commodity Category
Foods, Feeds,
& Beverages
Industrial
Supplies (2)Capital Goods
Automotive
Vehicles, etc.
Consumer
GoodsOther Goods
Exports
2018
Jan. - Dec. 1,674,330 8,338 1,665,992 133,176 541,736 562,918 158,839 205,979 63,344
Jan. - Nov. 1,537,749 7,758 1,529,991 123,247 497,716 516,065 146,360 188,842 57,762
January 133,614 742 132,872 10,449 41,071 45,270 13,503 17,676 4,903
February 136,377 732 135,644 10,569 43,086 46,077 14,274 16,582 5,056
March 140,742 673 140,069 11,069 45,045 47,595 13,979 17,082 5,298
April 140,364 715 139,649 11,488 45,816 46,165 13,868 17,216 5,094
May 144,552 799 143,753 13,087 45,353 48,075 13,587 17,655 5,995
June 142,172 669 141,502 12,698 46,608 47,311 12,937 16,483 5,466
July 139,943 705 139,238 12,019 46,858 46,323 13,025 16,149 4,864
August 138,857 681 138,176 11,324 44,648 46,614 12,848 17,521 5,221
September 140,745 672 140,073 10,486 46,657 47,325 12,991 17,598 5,016
October 141,259 697 140,562 10,001 47,255 47,210 12,796 17,781 5,519
November 139,124 672 138,452 10,058 45,318 48,098 12,552 17,098 5,328
December 136,581 580 136,001 9,929 44,019 46,853 12,479 17,137 5,582
2019
Jan. - Nov. 1,520,926 6,944 1,513,982 123,988 485,177 502,743 149,354 190,392 62,328
January 138,111 557 137,553 11,007 43,755 46,267 13,464 17,585 5,475
February 139,739 710 139,029 10,631 43,112 48,329 13,887 17,694 5,376
March 141,250 686 140,564 11,099 44,661 47,419 13,924 17,855 5,606
April 136,820 743 136,077 11,211 44,602 44,724 13,172 17,290 5,077
May 140,845 611 140,234 11,971 44,371 46,048 13,796 18,106 5,941
June 137,029 579 136,449 12,023 44,551 44,859 13,286 16,171 5,558
July 138,264 594 137,671 11,809 42,827 45,691 13,903 17,721 5,719
August 138,718 592 138,126 12,262 44,340 44,256 14,280 16,877 6,111
September 136,830 674 136,156 10,758 44,006 45,109 13,277 17,366 5,640
October (R) 136,161 608 135,552 10,512 44,570 44,715 12,966 16,621 6,167
November 137,160 588 136,571 10,705 44,381 45,325 13,399 17,105 5,656December
Imports
2018
Jan. - Dec. 2,561,667 20,862 2,540,806 147,369 575,623 692,611 372,217 646,797 106,190
Jan. - Nov. 2,344,176 19,161 2,325,015 134,799 528,956 633,016 340,248 591,007 96,989
January 208,472 1,696 206,776 11,857 46,976 55,719 30,469 53,479 8,276
February 212,245 1,587 210,658 12,404 47,149 57,289 30,882 54,994 7,940
March 210,731 1,579 209,153 12,268 47,207 56,652 30,783 54,168 8,074
April 210,657 1,703 208,954 12,283 47,863 57,256 30,231 52,252 9,068
May 211,222 1,837 209,384 12,355 47,997 58,555 29,972 51,886 8,620
June 211,606 1,642 209,964 12,188 48,550 57,448 30,364 53,030 8,385
July 214,078 1,784 212,295 12,420 49,082 58,020 30,854 52,935 8,984
August 215,353 1,907 213,447 12,304 49,438 57,740 31,620 53,342 9,004
September 218,015 1,706 216,309 12,173 49,178 59,724 31,263 54,729 9,241
October 218,563 1,852 216,710 12,319 49,119 57,062 31,792 56,485 9,934
November 213,234 1,869 211,365 12,227 46,397 57,552 32,018 53,707 9,463
December 217,491 1,700 215,791 12,569 46,666 59,595 31,969 55,790 9,201
2019
Jan. - Nov. 2,312,145 18,912 2,293,233 138,325 476,514 622,133 346,795 602,698 106,768
January 211,126 1,655 209,472 12,290 43,922 57,107 31,768 55,596 8,789
February 210,661 1,755 208,906 11,924 42,702 57,086 31,659 56,125 9,410
March 214,057 1,689 212,368 12,987 45,180 57,357 31,889 55,394 9,562
April 208,742 1,733 207,009 12,843 44,593 55,614 30,908 54,296 8,755
May 216,907 1,871 215,036 12,786 46,348 57,248 33,233 55,648 9,773
June 212,262 1,636 210,626 12,699 43,148 56,913 32,631 54,740 10,495
July 211,890 1,837 210,053 12,770 43,997 55,410 32,743 55,335 9,798
August 212,940 1,792 211,148 12,613 42,543 57,267 31,950 57,227 9,549
September 208,539 1,727 206,812 12,772 41,918 56,165 30,850 54,718 10,389
October (R) 203,957 1,712 202,246 12,402 41,391 56,562 29,049 52,311 10,530
November 201,064 1,505 199,559 12,238 40,773 55,406 30,114 51,309 9,719
December
(1) Detailed data are presented on a Census basis. The information needed to convert to a BOP basis is not available.
(2) Includes petroleum and petroleum products.
NOTE: For information on data sources, nonsampling errors, definitions, and details concerning what is included in Net Adjustments, see the explanatory notes in this
release or at www.census.gov/ft900 or www.bea.gov/data/intl-trade-investment/international-trade-goods-and-services.
Period
Total Balance
of Payments
Basis
Net
Adjustments
Total Census
Basis (1)
– 19 –
Part A: Seasonally Adjusted (by Commodity/Service)
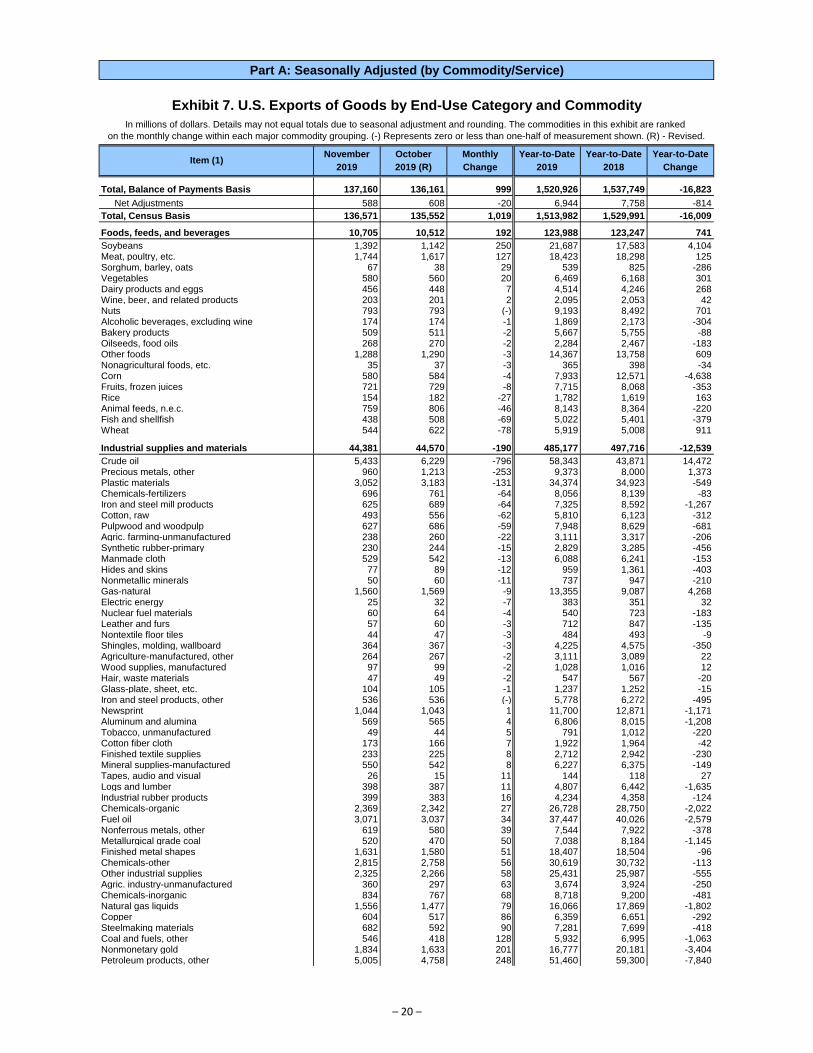
Exhibit 7. U.S. Exports of Goods by End-Use Category and Commodity
November October Monthly Year-to-Date Year-to-Date Year-to-Date
2019 2019 (R) Change 2019 2018 Change
Total, Balance of Payments Basis 137,160 136,161 999 1,520,926 1,537,749 -16,823
Net Adjustments 588 608 -20 6,944 7,758 -814
Total, Census Basis 136,571 135,552 1,019 1,513,982 1,529,991 -16,009
Foods, feeds, and beverages 10,705 10,512 192 123,988 123,247 741
Soybeans 1,392 1,142 250 21,687 17,583 4,104Meat, poultry, etc. 1,744 1,617 127 18,423 18,298 125Sorghum, barley, oats 67 38 29 539 825 -286Vegetables 580 560 20 6,469 6,168 301Dairy products and eggs 456 448 7 4,514 4,246 268Wine, beer, and related products 203 201 2 2,095 2,053 42Nuts 793 793 (-) 9,193 8,492 701Alcoholic beverages, excluding wine 174 174 -1 1,869 2,173 -304Bakery products 509 511 -2 5,667 5,755 -88Oilseeds, food oils 268 270 -2 2,284 2,467 -183Other foods 1,288 1,290 -3 14,367 13,758 609Nonagricultural foods, etc. 35 37 -3 365 398 -34Corn 580 584 -4 7,933 12,571 -4,638Fruits, frozen juices 721 729 -8 7,715 8,068 -353Rice 154 182 -27 1,782 1,619 163Animal feeds, n.e.c. 759 806 -46 8,143 8,364 -220Fish and shellfish 438 508 -69 5,022 5,401 -379Wheat 544 622 -78 5,919 5,008 911
Industrial supplies and materials 44,381 44,570 -190 485,177 497,716 -12,539
Crude oil 5,433 6,229 -796 58,343 43,871 14,472Precious metals, other 960 1,213 -253 9,373 8,000 1,373Plastic materials 3,052 3,183 -131 34,374 34,923 -549Chemicals-fertilizers 696 761 -64 8,056 8,139 -83Iron and steel mill products 625 689 -64 7,325 8,592 -1,267Cotton, raw 493 556 -62 5,810 6,123 -312Pulpwood and woodpulp 627 686 -59 7,948 8,629 -681Agric. farming-unmanufactured 238 260 -22 3,111 3,317 -206Synthetic rubber-primary 230 244 -15 2,829 3,285 -456Manmade cloth 529 542 -13 6,088 6,241 -153Hides and skins 77 89 -12 959 1,361 -403Nonmetallic minerals 50 60 -11 737 947 -210Gas-natural 1,560 1,569 -9 13,355 9,087 4,268Electric energy 25 32 -7 383 351 32Nuclear fuel materials 60 64 -4 540 723 -183Leather and furs 57 60 -3 712 847 -135Nontextile floor tiles 44 47 -3 484 493 -9Shingles, molding, wallboard 364 367 -3 4,225 4,575 -350Agriculture-manufactured, other 264 267 -2 3,111 3,089 22Wood supplies, manufactured 97 99 -2 1,028 1,016 12Hair, waste materials 47 49 -2 547 567 -20Glass-plate, sheet, etc. 104 105 -1 1,237 1,252 -15Iron and steel products, other 536 536 (-) 5,778 6,272 -495Newsprint 1,044 1,043 1 11,700 12,871 -1,171Aluminum and alumina 569 565 4 6,806 8,015 -1,208Tobacco, unmanufactured 49 44 5 791 1,012 -220Cotton fiber cloth 173 166 7 1,922 1,964 -42Finished textile supplies 233 225 8 2,712 2,942 -230Mineral supplies-manufactured 550 542 8 6,227 6,375 -149Tapes, audio and visual 26 15 11 144 118 27Logs and lumber 398 387 11 4,807 6,442 -1,635Industrial rubber products 399 383 16 4,234 4,358 -124Chemicals-organic 2,369 2,342 27 26,728 28,750 -2,022Fuel oil 3,071 3,037 34 37,447 40,026 -2,579Nonferrous metals, other 619 580 39 7,544 7,922 -378Metallurgical grade coal 520 470 50 7,038 8,184 -1,145Finished metal shapes 1,631 1,580 51 18,407 18,504 -96Chemicals-other 2,815 2,758 56 30,619 30,732 -113Other industrial supplies 2,325 2,266 58 25,431 25,987 -555Agric. industry-unmanufactured 360 297 63 3,674 3,924 -250Chemicals-inorganic 834 767 68 8,718 9,200 -481Natural gas liquids 1,556 1,477 79 16,066 17,869 -1,802Copper 604 517 86 6,359 6,651 -292Steelmaking materials 682 592 90 7,281 7,699 -418Coal and fuels, other 546 418 128 5,932 6,995 -1,063Nonmonetary gold 1,834 1,633 201 16,777 20,181 -3,404Petroleum products, other 5,005 4,758 248 51,460 59,300 -7,840
In millions of dollars. Details may not equal totals due to seasonal adjustment and rounding. The commodities in this exhibit are ranked
on the monthly change within each major commodity grouping. (-) Represents zero or less than one-half of measurement shown. (R) - Revised.
Item (1)
– 20 –
Part A: Seasonally Adjusted (by Commodity/Service)
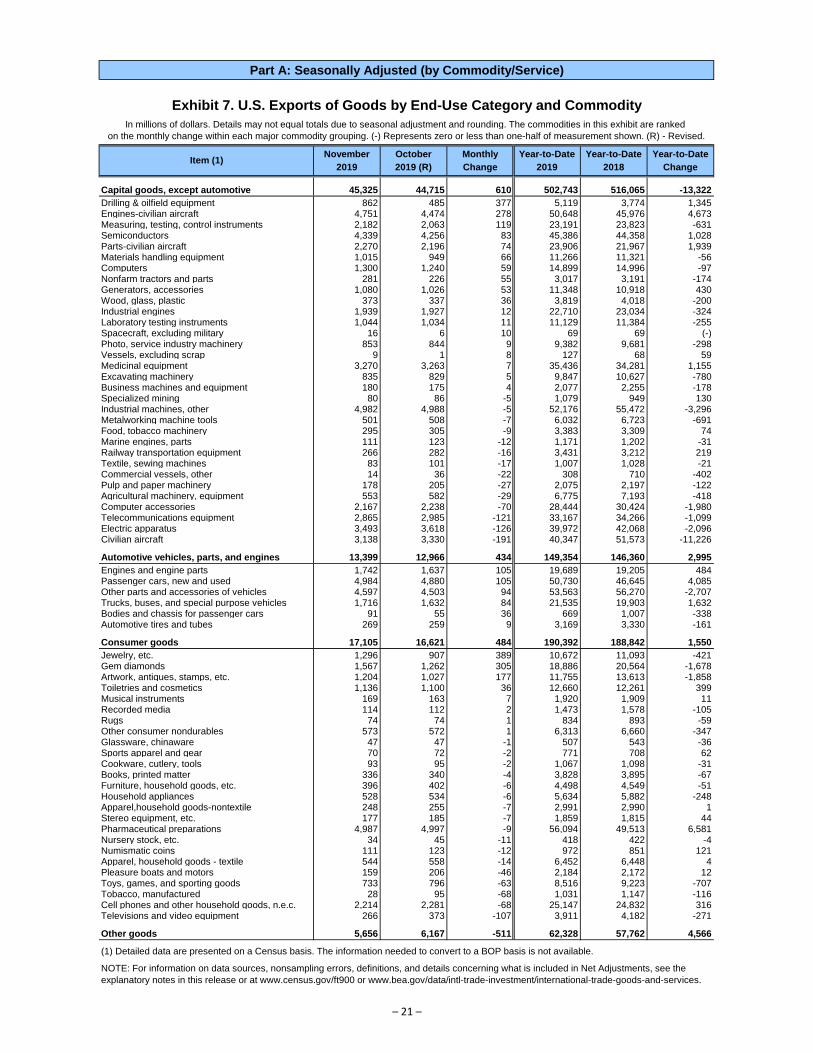
Exhibit 7. U.S. Exports of Goods by End-Use Category and Commodity
November October Monthly Year-to-Date Year-to-Date Year-to-Date
2019 2019 (R) Change 2019 2018 Change
In millions of dollars. Details may not equal totals due to seasonal adjustment and rounding. The commodities in this exhibit are ranked
on the monthly change within each major commodity grouping. (-) Represents zero or less than one-half of measurement shown. (R) - Revised.
Item (1)
Capital goods, except automotive 45,325 44,715 610 502,743 516,065 -13,322
Drilling & oilfield equipment 862 485 377 5,119 3,774 1,345Engines-civilian aircraft 4,751 4,474 278 50,648 45,976 4,673Measuring, testing, control instruments 2,182 2,063 119 23,191 23,823 -631Semiconductors 4,339 4,256 83 45,386 44,358 1,028Parts-civilian aircraft 2,270 2,196 74 23,906 21,967 1,939Materials handling equipment 1,015 949 66 11,266 11,321 -56Computers 1,300 1,240 59 14,899 14,996 -97Nonfarm tractors and parts 281 226 55 3,017 3,191 -174Generators, accessories 1,080 1,026 53 11,348 10,918 430Wood, glass, plastic 373 337 36 3,819 4,018 -200Industrial engines 1,939 1,927 12 22,710 23,034 -324Laboratory testing instruments 1,044 1,034 11 11,129 11,384 -255Spacecraft, excluding military 16 6 10 69 69 (-)Photo, service industry machinery 853 844 9 9,382 9,681 -298Vessels, excluding scrap 9 1 8 127 68 59Medicinal equipment 3,270 3,263 7 35,436 34,281 1,155Excavating machinery 835 829 5 9,847 10,627 -780Business machines and equipment 180 175 4 2,077 2,255 -178Specialized mining 80 86 -5 1,079 949 130Industrial machines, other 4,982 4,988 -5 52,176 55,472 -3,296Metalworking machine tools 501 508 -7 6,032 6,723 -691Food, tobacco machinery 295 305 -9 3,383 3,309 74Marine engines, parts 111 123 -12 1,171 1,202 -31Railway transportation equipment 266 282 -16 3,431 3,212 219Textile, sewing machines 83 101 -17 1,007 1,028 -21Commercial vessels, other 14 36 -22 308 710 -402Pulp and paper machinery 178 205 -27 2,075 2,197 -122Agricultural machinery, equipment 553 582 -29 6,775 7,193 -418Computer accessories 2,167 2,238 -70 28,444 30,424 -1,980Telecommunications equipment 2,865 2,985 -121 33,167 34,266 -1,099Electric apparatus 3,493 3,618 -126 39,972 42,068 -2,096Civilian aircraft 3,138 3,330 -191 40,347 51,573 -11,226
Automotive vehicles, parts, and engines 13,399 12,966 434 149,354 146,360 2,995
Engines and engine parts 1,742 1,637 105 19,689 19,205 484Passenger cars, new and used 4,984 4,880 105 50,730 46,645 4,085Other parts and accessories of vehicles 4,597 4,503 94 53,563 56,270 -2,707Trucks, buses, and special purpose vehicles 1,716 1,632 84 21,535 19,903 1,632Bodies and chassis for passenger cars 91 55 36 669 1,007 -338Automotive tires and tubes 269 259 9 3,169 3,330 -161
Consumer goods 17,105 16,621 484 190,392 188,842 1,550
Jewelry, etc. 1,296 907 389 10,672 11,093 -421Gem diamonds 1,567 1,262 305 18,886 20,564 -1,678Artwork, antiques, stamps, etc. 1,204 1,027 177 11,755 13,613 -1,858Toiletries and cosmetics 1,136 1,100 36 12,660 12,261 399Musical instruments 169 163 7 1,920 1,909 11Recorded media 114 112 2 1,473 1,578 -105Rugs 74 74 1 834 893 -59Other consumer nondurables 573 572 1 6,313 6,660 -347Glassware, chinaware 47 47 -1 507 543 -36Sports apparel and gear 70 72 -2 771 708 62Cookware, cutlery, tools 93 95 -2 1,067 1,098 -31Books, printed matter 336 340 -4 3,828 3,895 -67Furniture, household goods, etc. 396 402 -6 4,498 4,549 -51Household appliances 528 534 -6 5,634 5,882 -248Apparel,household goods-nontextile 248 255 -7 2,991 2,990 1Stereo equipment, etc. 177 185 -7 1,859 1,815 44Pharmaceutical preparations 4,987 4,997 -9 56,094 49,513 6,581Nursery stock, etc. 34 45 -11 418 422 -4Numismatic coins 111 123 -12 972 851 121Apparel, household goods - textile 544 558 -14 6,452 6,448 4Pleasure boats and motors 159 206 -46 2,184 2,172 12Toys, games, and sporting goods 733 796 -63 8,516 9,223 -707Tobacco, manufactured 28 95 -68 1,031 1,147 -116Cell phones and other household goods, n.e.c. 2,214 2,281 -68 25,147 24,832 316Televisions and video equipment 266 373 -107 3,911 4,182 -271
Other goods 5,656 6,167 -511 62,328 57,762 4,566
(1) Detailed data are presented on a Census basis. The information needed to convert to a BOP basis is not available.
NOTE: For information on data sources, nonsampling errors, definitions, and details concerning what is included in Net Adjustments, see the
explanatory notes in this release or at www.census.gov/ft900 or www.bea.gov/data/intl-trade-investment/international-trade-goods-and-services.
– 21 –
Part A: Seasonally Adjusted (by Commodity/Service)
Exhibit 8. U.S. Imports of Goods by End-Use Category and Commodity
November October Monthly Year-to-Date Year-to-Date Year-to-Date
2019 2019 (R) Change 2019 2018 Change
Total, Balance of Payments Basis 201,064 203,957 -2,894 2,312,145 2,344,176 -32,031
Net Adjustments 1,505 1,712 -207 18,912 19,161 -249
Total, Census Basis 199,559 202,246 -2,687 2,293,233 2,325,015 -31,782
Foods, feeds, and beverages 12,238 12,402 -164 138,325 134,799 3,526
Alcoholic beverages, excluding wine 705 787 -82 8,819 7,882 938Fish and shellfish 1,766 1,821 -55 20,201 20,569 -368Feedstuff and foodgrains 524 568 -44 5,887 6,079 -192Dairy products and eggs 151 191 -40 2,142 1,968 173Food oils, oilseeds 466 500 -35 5,454 6,128 -674Wine, beer, and related products 1,012 1,046 -34 11,281 10,867 415Bakery products 1,044 1,070 -26 11,574 10,807 767Vegetables 1,192 1,212 -20 12,976 12,384 591Nuts 238 258 -20 3,001 3,260 -259Cocoa beans 18 30 -12 767 879 -112Green coffee 374 382 -8 4,302 4,289 13Nonagricultural foods, etc. 97 102 -5 1,037 1,025 12Tea, spices, etc. 204 196 8 2,339 2,380 -42Meat products 1,044 1,005 39 10,902 10,432 470Other foods 1,511 1,458 53 17,634 16,562 1,072Cane and beet sugar 185 131 54 1,461 1,488 -27Fruits, frozen juices 1,707 1,644 63 18,549 17,800 749
Industrial supplies and materials 40,773 41,391 -618 476,514 528,956 -52,443
Petroleum products, other 2,783 3,193 -410 34,803 34,310 493Nuclear fuel materials 133 344 -211 2,746 2,586 160Copper 318 472 -155 4,519 5,684 -1,164Crude oil 8,965 9,097 -132 115,632 145,834 -30,202Bauxite and aluminum 1,168 1,247 -79 13,524 15,159 -1,635Chemicals-inorganic 659 726 -67 8,334 8,395 -61Steelmaking materials 526 584 -58 7,399 8,957 -1,557Plastic materials 1,325 1,372 -47 16,122 17,928 -1,807Electric energy 138 180 -42 1,782 2,071 -289Industrial supplies, other 2,993 3,035 -42 34,377 34,535 -158Plywood and veneers 231 269 -38 2,832 3,643 -812Paper and paper products 626 662 -36 7,461 7,562 -101Shingles, wallboard 931 965 -34 10,459 11,115 -656Iron and steel, advanced 935 959 -24 10,878 10,956 -78Finished textile supplies 425 447 -23 4,828 4,962 -134Other precious metals 1,092 1,115 -23 10,737 9,932 805Iron and steel products, n.e.c. 683 702 -19 8,337 9,180 -843Sulfur, nonmetallic minerals 97 115 -18 1,238 1,374 -136Chemicals-fertilizers 881 895 -13 10,715 10,922 -207Lumber 476 489 -13 5,399 6,839 -1,440Nickel 203 215 -13 2,028 2,211 -183Coal and related fuels 172 184 -12 1,759 1,435 324Synthetic cloth 454 463 -9 5,137 5,542 -405Cotton cloth, fabrics 74 79 -5 926 998 -72Synthetic rubber--primary 219 223 -4 2,760 2,719 40Tin 43 46 -3 660 732 -72Nonferrous metals, other 342 344 -2 4,151 4,418 -267Cotton, natural fibers 6 8 -1 79 80 -1Glass-plate, sheet, etc. 160 161 -1 1,799 1,936 -136Leather and furs 48 49 -1 545 651 -106Liquefied petroleum gases 186 187 -1 2,518 2,980 -463Hides and skins 4 3 1 43 53 -10Zinc 158 157 1 1,952 2,161 -210Wool, silk, etc. 52 49 2 595 645 -50Newsprint 57 55 2 686 807 -121Stone, sand, cement, etc. 538 532 6 5,824 6,102 -277Tobacco, waxes, etc. 688 681 7 7,902 8,173 -271Hair, waste materials 85 76 9 968 1,069 -101Materials, excluding chemicals 134 124 10 1,459 1,419 40Farming materials, livestock 178 167 11 1,746 1,637 109Nontextile floor tiles 485 473 12 5,398 5,391 7Blank tapes, audio & visual 33 20 13 291 348 -57Finished metal shapes 2,060 2,044 16 20,153 19,519 634Pulpwood and woodpulp 215 191 25 3,201 3,378 -177Chemicals-organic 2,330 2,289 42 24,932 27,777 -2,846Iron and steel mill products 1,127 1,081 46 15,084 18,878 -3,795Natural rubber 158 109 49 1,412 1,425 -13Fuel oil 2,300 2,234 66 23,450 26,256 -2,806Chemicals-other, n.e.c. 1,203 1,132 71 12,728 12,747 -19Gas-natural 572 420 151 6,156 6,497 -341Nonmonetary gold 1,108 729 379 8,050 9,026 -977
In millions of dollars. Details may not equal totals due to seasonal adjustment and rounding. The commodities in this exhibit are ranked
on the monthly change within each major commodity grouping. (-) Represents zero or less than one-half of measurement shown. (R) - Revised.
Item (1)
– 22 –
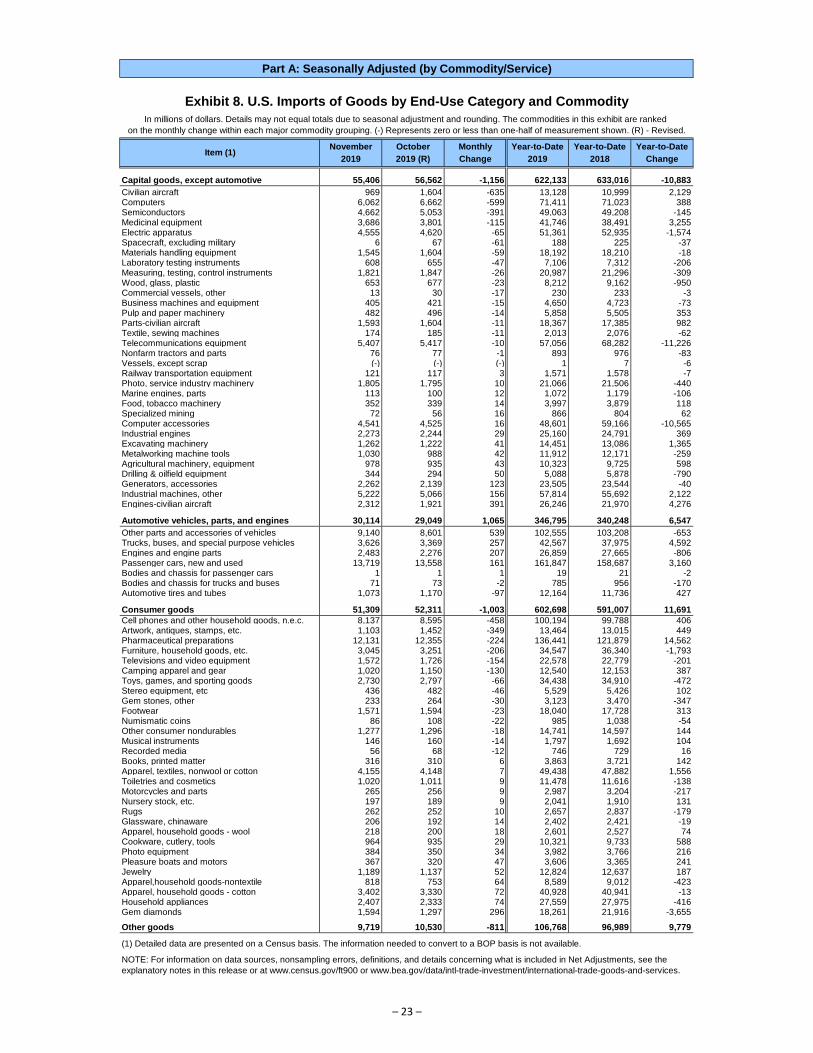
Part A: Seasonally Adjusted (by Commodity/Service)
Exhibit 8. U.S. Imports of Goods by End-Use Category and Commodity
November October Monthly Year-to-Date Year-to-Date Year-to-Date
2019 2019 (R) Change 2019 2018 Change
In millions of dollars. Details may not equal totals due to seasonal adjustment and rounding. The commodities in this exhibit are ranked
on the monthly change within each major commodity grouping. (-) Represents zero or less than one-half of measurement shown. (R) - Revised.
Item (1)
Capital goods, except automotive 55,406 56,562 -1,156 622,133 633,016 -10,883
Civilian aircraft 969 1,604 -635 13,128 10,999 2,129Computers 6,062 6,662 -599 71,411 71,023 388Semiconductors 4,662 5,053 -391 49,063 49,208 -145Medicinal equipment 3,686 3,801 -115 41,746 38,491 3,255Electric apparatus 4,555 4,620 -65 51,361 52,935 -1,574Spacecraft, excluding military 6 67 -61 188 225 -37Materials handling equipment 1,545 1,604 -59 18,192 18,210 -18Laboratory testing instruments 608 655 -47 7,106 7,312 -206Measuring, testing, control instruments 1,821 1,847 -26 20,987 21,296 -309Wood, glass, plastic 653 677 -23 8,212 9,162 -950Commercial vessels, other 13 30 -17 230 233 -3Business machines and equipment 405 421 -15 4,650 4,723 -73Pulp and paper machinery 482 496 -14 5,858 5,505 353Parts-civilian aircraft 1,593 1,604 -11 18,367 17,385 982Textile, sewing machines 174 185 -11 2,013 2,076 -62Telecommunications equipment 5,407 5,417 -10 57,056 68,282 -11,226Nonfarm tractors and parts 76 77 -1 893 976 -83Vessels, except scrap (-) (-) (-) 1 7 -6Railway transportation equipment 121 117 3 1,571 1,578 -7Photo, service industry machinery 1,805 1,795 10 21,066 21,506 -440Marine engines, parts 113 100 12 1,072 1,179 -106Food, tobacco machinery 352 339 14 3,997 3,879 118Specialized mining 72 56 16 866 804 62Computer accessories 4,541 4,525 16 48,601 59,166 -10,565Industrial engines 2,273 2,244 29 25,160 24,791 369Excavating machinery 1,262 1,222 41 14,451 13,086 1,365Metalworking machine tools 1,030 988 42 11,912 12,171 -259Agricultural machinery, equipment 978 935 43 10,323 9,725 598Drilling & oilfield equipment 344 294 50 5,088 5,878 -790Generators, accessories 2,262 2,139 123 23,505 23,544 -40Industrial machines, other 5,222 5,066 156 57,814 55,692 2,122Engines-civilian aircraft 2,312 1,921 391 26,246 21,970 4,276
Automotive vehicles, parts, and engines 30,114 29,049 1,065 346,795 340,248 6,547
Other parts and accessories of vehicles 9,140 8,601 539 102,555 103,208 -653Trucks, buses, and special purpose vehicles 3,626 3,369 257 42,567 37,975 4,592Engines and engine parts 2,483 2,276 207 26,859 27,665 -806Passenger cars, new and used 13,719 13,558 161 161,847 158,687 3,160Bodies and chassis for passenger cars 1 1 1 19 21 -2Bodies and chassis for trucks and buses 71 73 -2 785 956 -170Automotive tires and tubes 1,073 1,170 -97 12,164 11,736 427
Consumer goods 51,309 52,311 -1,003 602,698 591,007 11,691
Cell phones and other household goods, n.e.c. 8,137 8,595 -458 100,194 99,788 406Artwork, antiques, stamps, etc. 1,103 1,452 -349 13,464 13,015 449Pharmaceutical preparations 12,131 12,355 -224 136,441 121,879 14,562Furniture, household goods, etc. 3,045 3,251 -206 34,547 36,340 -1,793Televisions and video equipment 1,572 1,726 -154 22,578 22,779 -201Camping apparel and gear 1,020 1,150 -130 12,540 12,153 387Toys, games, and sporting goods 2,730 2,797 -66 34,438 34,910 -472Stereo equipment, etc 436 482 -46 5,529 5,426 102Gem stones, other 233 264 -30 3,123 3,470 -347Footwear 1,571 1,594 -23 18,040 17,728 313Numismatic coins 86 108 -22 985 1,038 -54Other consumer nondurables 1,277 1,296 -18 14,741 14,597 144Musical instruments 146 160 -14 1,797 1,692 104Recorded media 56 68 -12 746 729 16Books, printed matter 316 310 6 3,863 3,721 142Apparel, textiles, nonwool or cotton 4,155 4,148 7 49,438 47,882 1,556Toiletries and cosmetics 1,020 1,011 9 11,478 11,616 -138Motorcycles and parts 265 256 9 2,987 3,204 -217Nursery stock, etc. 197 189 9 2,041 1,910 131Rugs 262 252 10 2,657 2,837 -179Glassware, chinaware 206 192 14 2,402 2,421 -19Apparel, household goods - wool 218 200 18 2,601 2,527 74Cookware, cutlery, tools 964 935 29 10,321 9,733 588Photo equipment 384 350 34 3,982 3,766 216Pleasure boats and motors 367 320 47 3,606 3,365 241Jewelry 1,189 1,137 52 12,824 12,637 187Apparel,household goods-nontextile 818 753 64 8,589 9,012 -423Apparel, household goods - cotton 3,402 3,330 72 40,928 40,941 -13Household appliances 2,407 2,333 74 27,559 27,975 -416Gem diamonds 1,594 1,297 296 18,261 21,916 -3,655
Other goods 9,719 10,530 -811 106,768 96,989 9,779
(1) Detailed data are presented on a Census basis. The information needed to convert to a BOP basis is not available.
NOTE: For information on data sources, nonsampling errors, definitions, and details concerning what is included in Net Adjustments, see the
explanatory notes in this release or at www.census.gov/ft900 or www.bea.gov/data/intl-trade-investment/international-trade-goods-and-services.
– 23 –

Part A: Seasonally Adjusted (by Commodity/Service)
Exhibit 9. U.S. Trade in Petroleum and Non-Petroleum Products by End-UseIn millions of dollars. Details may not equal totals due to seasonal adjustment and rounding. (R) - Revised.
Balance Exports Imports
Total
Net
Adjust-
ments
Petroleum
(1)
Non-
petroleumTotal
Net
Adjust-
ments
Petroleum
(1)
Non-
petroleumTotal
Net
Adjust-
ments
Petroleum
(1)
Non-
petroleum
2018
Jan. - Dec. -887,338 -12,524 -50,041 -824,773 1,674,330 8,338 175,300 1,490,692 2,561,667 20,862 225,341 2,315,465
Jan. - Nov. -806,428 -11,404 -48,315 -746,709 1,537,749 7,758 161,065 1,368,926 2,344,176 19,161 209,380 2,115,635
January -74,858 -955 -7,085 -66,819 133,614 742 11,644 121,229 208,472 1,696 18,728 188,048
February -75,869 -854 -6,325 -68,689 136,377 732 12,038 123,606 212,245 1,587 18,363 192,295
March -69,989 -905 -4,531 -64,553 140,742 673 13,828 126,240 210,731 1,579 18,359 190,794
April -70,292 -988 -4,405 -64,899 140,364 715 14,428 125,221 210,657 1,703 18,833 190,120
May -66,670 -1,038 -3,843 -61,789 144,552 799 15,131 128,622 211,222 1,837 18,973 190,411
June -69,434 -972 -3,704 -64,758 142,172 669 15,786 125,716 211,606 1,642 19,490 190,474
July -74,136 -1,079 -3,942 -69,115 139,943 705 16,145 123,094 214,078 1,784 20,086 192,209
August -76,496 -1,226 -5,805 -69,466 138,857 681 14,426 123,750 215,353 1,907 20,231 193,216
September -77,270 -1,034 -4,603 -71,632 140,745 672 15,399 124,674 218,015 1,706 20,002 196,306
October -77,303 -1,155 -2,732 -73,416 141,259 697 16,785 123,777 218,563 1,852 19,517 197,193
November -74,110 -1,197 -1,341 -71,572 139,124 672 15,455 122,997 213,234 1,869 16,796 194,569
December -80,910 -1,120 -1,726 -78,064 136,581 580 14,235 121,766 217,491 1,700 15,961 199,830
2019
Jan. - Nov. -791,220 -11,969 -13,086 -766,165 1,520,926 6,944 163,317 1,350,665 2,312,145 18,912 176,403 2,116,831
January -73,015 -1,097 -971 -70,947 138,111 557 13,570 123,983 211,126 1,655 14,542 194,930
February -70,922 -1,045 -1,271 -68,606 139,739 710 14,020 125,008 210,661 1,755 15,292 193,614
March -72,807 -1,002 -2,151 -69,654 141,250 686 14,882 125,682 214,057 1,689 17,033 195,335
April -71,922 -990 -2,153 -68,778 136,820 743 15,587 120,491 208,742 1,733 17,740 189,269
May -76,062 -1,261 -4,150 -70,651 140,845 611 15,195 125,039 216,907 1,871 19,345 195,691
June -75,233 -1,057 -1,372 -72,805 137,029 579 15,285 121,164 212,262 1,636 16,656 193,969
July -73,626 -1,244 -2,572 -69,810 138,264 594 14,139 123,532 211,890 1,837 16,711 193,342
August -74,222 -1,200 -268 -72,754 138,718 592 15,159 122,967 212,940 1,792 15,427 195,721
September -71,709 -1,053 199 -70,855 136,830 674 14,914 121,242 208,539 1,727 14,714 192,097
October (R) -67,797 -1,103 791 -67,484 136,161 608 15,500 120,052 203,957 1,712 14,710 187,536
November -63,904 -916 832 -63,820 137,160 588 15,065 121,506 201,064 1,505 14,233 185,326
December
(1) The petroleum products aggregated in the end-use commodity classification system include virtually the same energy-related petroleum products as those aggregated in the
Standard International Trade Classification (SITC). The end-use petroleum products, however, include some products such as ethane, butane, benzene, and toluene, which are
included in "Manufactured Goods" in the SITC.
NOTE: For information on data sources, nonsampling errors, definitions, and details concerning what is included in Net Adjustments, see the explanatory notes in this release or
at www.census.gov/ft900 or www.bea.gov/data/intl-trade-investment/international-trade-goods-and-services.
Period
– 24 –
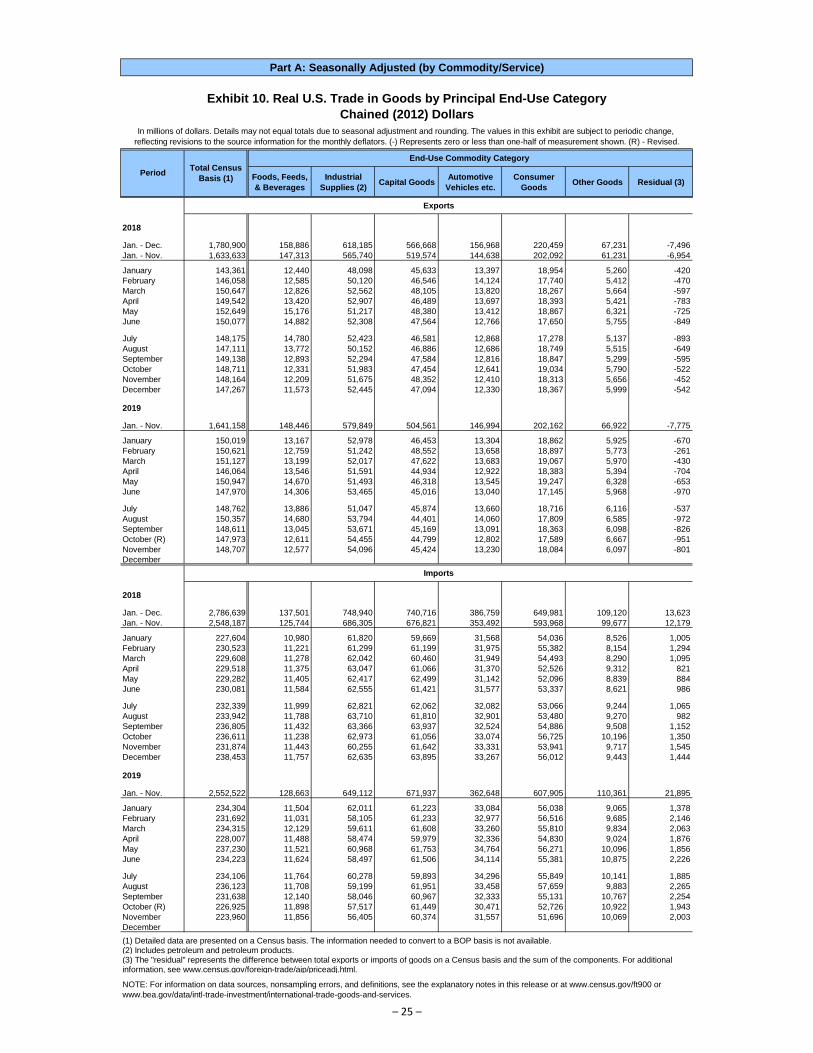
Part A: Seasonally Adjusted (by Commodity/Service)
Exhibit 10. Real U.S. Trade in Goods by Principal End-Use Category
Chained (2012) Dollars
In millions of dollars. Details may not equal totals due to seasonal adjustment and rounding. The values in this exhibit are subject to periodic change,
reflecting revisions to the source information for the monthly deflators. (-) Represents zero or less than one-half of measurement shown. (R) - Revised.
End-Use Commodity Category
Foods, Feeds,
& Beverages
Industrial
Supplies (2)Capital Goods
Automotive
Vehicles etc.
Consumer
GoodsOther Goods Residual (3)
Exports
2018
Jan. - Dec. 1,780,900 158,886 618,185 566,668 156,968 220,459 67,231 -7,496
Jan. - Nov. 1,633,633 147,313 565,740 519,574 144,638 202,092 61,231 -6,954
January 143,361 12,440 48,098 45,633 13,397 18,954 5,260 -420
February 146,058 12,585 50,120 46,546 14,124 17,740 5,412 -470
March 150,647 12,826 52,562 48,105 13,820 18,267 5,664 -597
April 149,542 13,420 52,907 46,489 13,697 18,393 5,421 -783
May 152,649 15,176 51,217 48,380 13,412 18,867 6,321 -725
June 150,077 14,882 52,308 47,564 12,766 17,650 5,755 -849
July 148,175 14,780 52,423 46,581 12,868 17,278 5,137 -893
August 147,111 13,772 50,152 46,886 12,686 18,749 5,515 -649
September 149,138 12,893 52,294 47,584 12,816 18,847 5,299 -595
October 148,711 12,331 51,983 47,454 12,641 19,034 5,790 -522
November 148,164 12,209 51,675 48,352 12,410 18,313 5,656 -452
December 147,267 11,573 52,445 47,094 12,330 18,367 5,999 -542
2019
Jan. - Nov. 1,641,158 148,446 579,849 504,561 146,994 202,162 66,922 -7,775
January 150,019 13,167 52,978 46,453 13,304 18,862 5,925 -670
February 150,621 12,759 51,242 48,552 13,658 18,897 5,773 -261
March 151,127 13,199 52,017 47,622 13,683 19,067 5,970 -430
April 146,064 13,546 51,591 44,934 12,922 18,383 5,394 -704
May 150,947 14,670 51,493 46,318 13,545 19,247 6,328 -653
June 147,970 14,306 53,465 45,016 13,040 17,145 5,968 -970
July 148,762 13,886 51,047 45,874 13,660 18,716 6,116 -537
August 150,357 14,680 53,794 44,401 14,060 17,809 6,585 -972
September 148,611 13,045 53,671 45,169 13,091 18,363 6,098 -826
October (R) 147,973 12,611 54,455 44,799 12,802 17,589 6,667 -951
November 148,707 12,577 54,096 45,424 13,230 18,084 6,097 -801
December
Imports
2018
Jan. - Dec. 2,786,639 137,501 748,940 740,716 386,759 649,981 109,120 13,623
Jan. - Nov. 2,548,187 125,744 686,305 676,821 353,492 593,968 99,677 12,179
January 227,604 10,980 61,820 59,669 31,568 54,036 8,526 1,005
February 230,523 11,221 61,299 61,199 31,975 55,382 8,154 1,294
March 229,608 11,278 62,042 60,460 31,949 54,493 8,290 1,095
April 229,518 11,375 63,047 61,066 31,370 52,526 9,312 821
May 229,282 11,405 62,417 62,499 31,142 52,096 8,839 884
June 230,081 11,584 62,555 61,421 31,577 53,337 8,621 986
July 232,339 11,999 62,821 62,062 32,082 53,066 9,244 1,065
August 233,942 11,788 63,710 61,810 32,901 53,480 9,270 982
September 236,805 11,432 63,366 63,937 32,524 54,886 9,508 1,152
October 236,611 11,238 62,973 61,056 33,074 56,725 10,196 1,350
November 231,874 11,443 60,255 61,642 33,331 53,941 9,717 1,545
December 238,453 11,757 62,635 63,895 33,267 56,012 9,443 1,444
2019
Jan. - Nov. 2,552,522 128,663 649,112 671,937 362,648 607,905 110,361 21,895
January 234,304 11,504 62,011 61,223 33,084 56,038 9,065 1,378
February 231,692 11,031 58,105 61,233 32,977 56,516 9,685 2,146
March 234,315 12,129 59,611 61,608 33,260 55,810 9,834 2,063
April 228,007 11,488 58,474 59,979 32,336 54,830 9,024 1,876
May 237,230 11,521 60,968 61,753 34,764 56,271 10,096 1,856
June 234,223 11,624 58,497 61,506 34,114 55,381 10,875 2,226
July 234,106 11,764 60,278 59,893 34,296 55,849 10,141 1,885
August 236,123 11,708 59,199 61,951 33,458 57,659 9,883 2,265
September 231,638 12,140 58,046 60,967 32,333 55,131 10,767 2,254
October (R) 226,925 11,898 57,517 61,449 30,471 52,726 10,922 1,943
November 223,960 11,856 56,405 60,374 31,557 51,696 10,069 2,003
December
(1) Detailed data are presented on a Census basis. The information needed to convert to a BOP basis is not available.(2) Includes petroleum and petroleum products.(3) The "residual" represents the difference between total exports or imports of goods on a Census basis and the sum of the components. For additional information, see www.census.gov/foreign-trade/aip/priceadj.html.
NOTE: For information on data sources, nonsampling errors, and definitions, see the explanatory notes in this release or at www.census.gov/ft900 or
www.bea.gov/data/intl-trade-investment/international-trade-goods-and-services.
PeriodTotal Census
Basis (1)
– 25 –
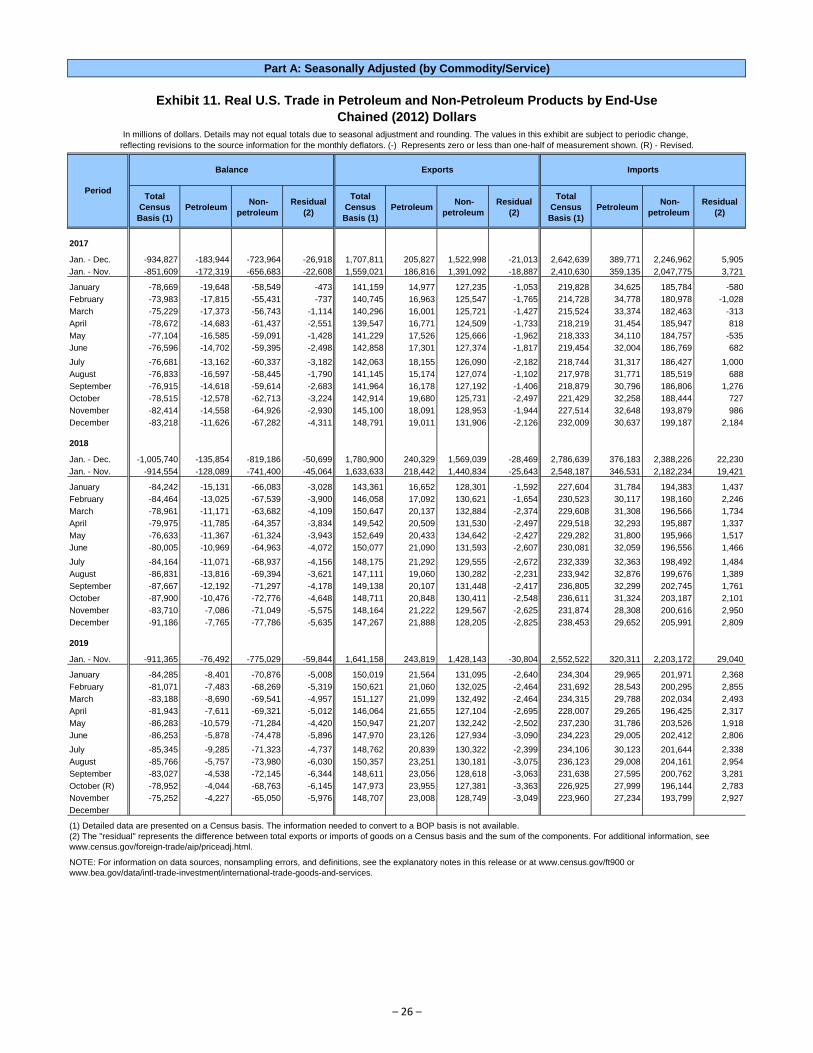
Part A: Seasonally Adjusted (by Commodity/Service)
Exhibit 11. Real U.S. Trade in Petroleum and Non-Petroleum Products by End-Use
Chained (2012) Dollars
In millions of dollars. Details may not equal totals due to seasonal adjustment and rounding. The values in this exhibit are subject to periodic change,
reflecting revisions to the source information for the monthly deflators. (-) Represents zero or less than one-half of measurement shown. (R) - Revised.
Balance Exports Imports
Total
Census
Basis (1)
Petroleum Non-
petroleum
Residual
(2)
Total
Census
Basis (1)
Petroleum Non-
petroleum
Residual
(2)
Total
Census
Basis (1)
Petroleum Non-
petroleum
Residual
(2)
2017
Jan. - Dec. -934,827 -183,944 -723,964 -26,918 1,707,811 205,827 1,522,998 -21,013 2,642,639 389,771 2,246,962 5,905
Jan. - Nov. -851,609 -172,319 -656,683 -22,608 1,559,021 186,816 1,391,092 -18,887 2,410,630 359,135 2,047,775 3,721
January -78,669 -19,648 -58,549 -473 141,159 14,977 127,235 -1,053 219,828 34,625 185,784 -580
February -73,983 -17,815 -55,431 -737 140,745 16,963 125,547 -1,765 214,728 34,778 180,978 -1,028
March -75,229 -17,373 -56,743 -1,114 140,296 16,001 125,721 -1,427 215,524 33,374 182,463 -313
April -78,672 -14,683 -61,437 -2,551 139,547 16,771 124,509 -1,733 218,219 31,454 185,947 818
May -77,104 -16,585 -59,091 -1,428 141,229 17,526 125,666 -1,962 218,333 34,110 184,757 -535
June -76,596 -14,702 -59,395 -2,498 142,858 17,301 127,374 -1,817 219,454 32,004 186,769 682
July -76,681 -13,162 -60,337 -3,182 142,063 18,155 126,090 -2,182 218,744 31,317 186,427 1,000
August -76,833 -16,597 -58,445 -1,790 141,145 15,174 127,074 -1,102 217,978 31,771 185,519 688
September -76,915 -14,618 -59,614 -2,683 141,964 16,178 127,192 -1,406 218,879 30,796 186,806 1,276
October -78,515 -12,578 -62,713 -3,224 142,914 19,680 125,731 -2,497 221,429 32,258 188,444 727
November -82,414 -14,558 -64,926 -2,930 145,100 18,091 128,953 -1,944 227,514 32,648 193,879 986
December -83,218 -11,626 -67,282 -4,311 148,791 19,011 131,906 -2,126 232,009 30,637 199,187 2,184
2018
Jan. - Dec. -1,005,740 -135,854 -819,186 -50,699 1,780,900 240,329 1,569,039 -28,469 2,786,639 376,183 2,388,226 22,230
Jan. - Nov. -914,554 -128,089 -741,400 -45,064 1,633,633 218,442 1,440,834 -25,643 2,548,187 346,531 2,182,234 19,421
January -84,242 -15,131 -66,083 -3,028 143,361 16,652 128,301 -1,592 227,604 31,784 194,383 1,437
February -84,464 -13,025 -67,539 -3,900 146,058 17,092 130,621 -1,654 230,523 30,117 198,160 2,246
March -78,961 -11,171 -63,682 -4,109 150,647 20,137 132,884 -2,374 229,608 31,308 196,566 1,734
April -79,975 -11,785 -64,357 -3,834 149,542 20,509 131,530 -2,497 229,518 32,293 195,887 1,337
May -76,633 -11,367 -61,324 -3,943 152,649 20,433 134,642 -2,427 229,282 31,800 195,966 1,517
June -80,005 -10,969 -64,963 -4,072 150,077 21,090 131,593 -2,607 230,081 32,059 196,556 1,466
July -84,164 -11,071 -68,937 -4,156 148,175 21,292 129,555 -2,672 232,339 32,363 198,492 1,484
August -86,831 -13,816 -69,394 -3,621 147,111 19,060 130,282 -2,231 233,942 32,876 199,676 1,389
September -87,667 -12,192 -71,297 -4,178 149,138 20,107 131,448 -2,417 236,805 32,299 202,745 1,761
October -87,900 -10,476 -72,776 -4,648 148,711 20,848 130,411 -2,548 236,611 31,324 203,187 2,101
November -83,710 -7,086 -71,049 -5,575 148,164 21,222 129,567 -2,625 231,874 28,308 200,616 2,950
December -91,186 -7,765 -77,786 -5,635 147,267 21,888 128,205 -2,825 238,453 29,652 205,991 2,809
2019
Jan. - Nov. -911,365 -76,492 -775,029 -59,844 1,641,158 243,819 1,428,143 -30,804 2,552,522 320,311 2,203,172 29,040
January -84,285 -8,401 -70,876 -5,008 150,019 21,564 131,095 -2,640 234,304 29,965 201,971 2,368
February -81,071 -7,483 -68,269 -5,319 150,621 21,060 132,025 -2,464 231,692 28,543 200,295 2,855
March -83,188 -8,690 -69,541 -4,957 151,127 21,099 132,492 -2,464 234,315 29,788 202,034 2,493
April -81,943 -7,611 -69,321 -5,012 146,064 21,655 127,104 -2,695 228,007 29,265 196,425 2,317
May -86,283 -10,579 -71,284 -4,420 150,947 21,207 132,242 -2,502 237,230 31,786 203,526 1,918
June -86,253 -5,878 -74,478 -5,896 147,970 23,126 127,934 -3,090 234,223 29,005 202,412 2,806
July -85,345 -9,285 -71,323 -4,737 148,762 20,839 130,322 -2,399 234,106 30,123 201,644 2,338
August -85,766 -5,757 -73,980 -6,030 150,357 23,251 130,181 -3,075 236,123 29,008 204,161 2,954
September -83,027 -4,538 -72,145 -6,344 148,611 23,056 128,618 -3,063 231,638 27,595 200,762 3,281
October (R) -78,952 -4,044 -68,763 -6,145 147,973 23,955 127,381 -3,363 226,925 27,999 196,144 2,783
November -75,252 -4,227 -65,050 -5,976 148,707 23,008 128,749 -3,049 223,960 27,234 193,799 2,927
December
(1) Detailed data are presented on a Census basis. The information needed to convert to a BOP basis is not available.
(2) The "residual" represents the difference between total exports or imports of goods on a Census basis and the sum of the components. For additional information, see
www.census.gov/foreign-trade/aip/priceadj.html.
NOTE: For information on data sources, nonsampling errors, and definitions, see the explanatory notes in this release or at www.census.gov/ft900 or
www.bea.gov/data/intl-trade-investment/international-trade-goods-and-services.
Period
– 26 –
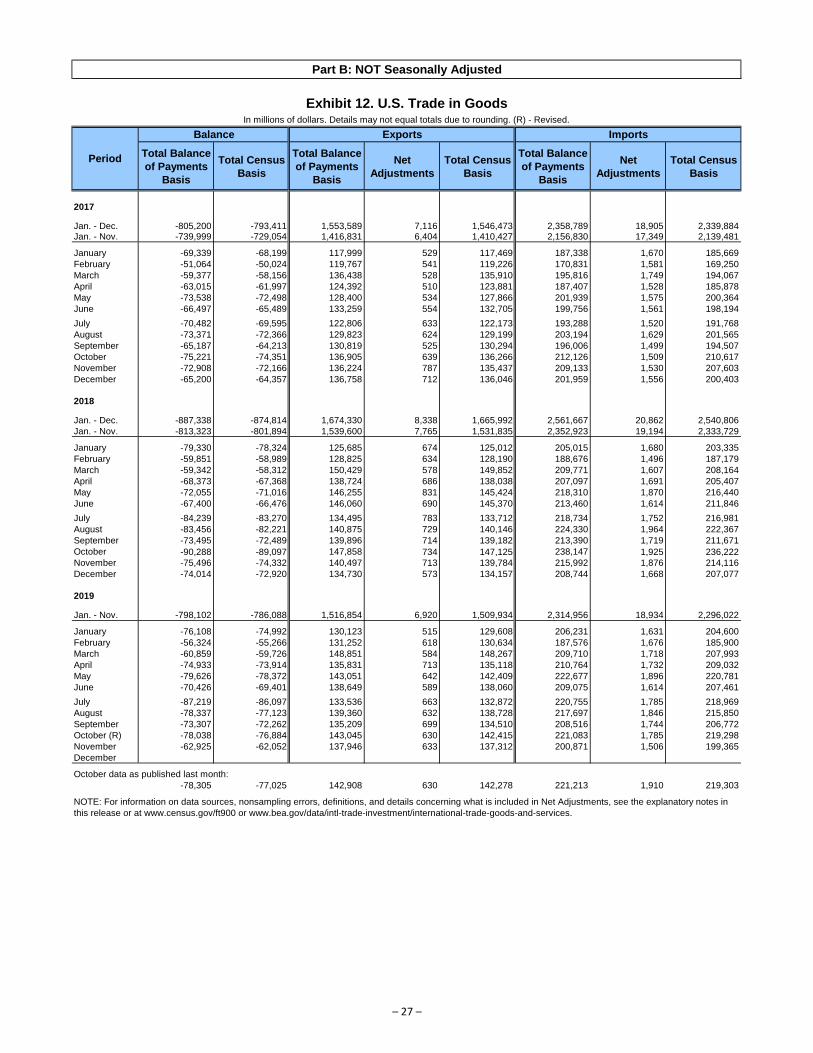
Part B: NOT Seasonally Adjusted
Exhibit 12. U.S. Trade in GoodsIn millions of dollars. Details may not equal totals due to rounding. (R) - Revised.
Balance Exports Imports
Total Balance
of Payments
Basis
Total Census
Basis
Total Balance
of Payments
Basis
Net
Adjustments
Total Census
Basis
Total Balance
of Payments
Basis
Net
Adjustments
Total Census
Basis
2017
Jan. - Dec. -805,200 -793,411 1,553,589 7,116 1,546,473 2,358,789 18,905 2,339,884Jan. - Nov. -739,999 -729,054 1,416,831 6,404 1,410,427 2,156,830 17,349 2,139,481
January -69,339 -68,199 117,999 529 117,469 187,338 1,670 185,669
February -51,064 -50,024 119,767 541 119,226 170,831 1,581 169,250
March -59,377 -58,156 136,438 528 135,910 195,816 1,749 194,067
April -63,015 -61,997 124,392 510 123,881 187,407 1,528 185,878
May -73,538 -72,498 128,400 534 127,866 201,939 1,575 200,364
June -66,497 -65,489 133,259 554 132,705 199,756 1,561 198,194
July -70,482 -69,595 122,806 633 122,173 193,288 1,520 191,768
August -73,371 -72,366 129,823 624 129,199 203,194 1,629 201,565
September -65,187 -64,213 130,819 525 130,294 196,006 1,499 194,507
October -75,221 -74,351 136,905 639 136,266 212,126 1,509 210,617
November -72,908 -72,166 136,224 787 135,437 209,133 1,530 207,603
December -65,200 -64,357 136,758 712 136,046 201,959 1,556 200,403
2018
Jan. - Dec. -887,338 -874,814 1,674,330 8,338 1,665,992 2,561,667 20,862 2,540,806
Jan. - Nov. -813,323 -801,894 1,539,600 7,765 1,531,835 2,352,923 19,194 2,333,729
January -79,330 -78,324 125,685 674 125,012 205,015 1,680 203,335
February -59,851 -58,989 128,825 634 128,190 188,676 1,496 187,179
March -59,342 -58,312 150,429 578 149,852 209,771 1,607 208,164
April -68,373 -67,368 138,724 686 138,038 207,097 1,691 205,407
May -72,055 -71,016 146,255 831 145,424 218,310 1,870 216,440
June -67,400 -66,476 146,060 690 145,370 213,460 1,614 211,846
July -84,239 -83,270 134,495 783 133,712 218,734 1,752 216,981
August -83,456 -82,221 140,875 729 140,146 224,330 1,964 222,367
September -73,495 -72,489 139,896 714 139,182 213,390 1,719 211,671
October -90,288 -89,097 147,858 734 147,125 238,147 1,925 236,222
November -75,496 -74,332 140,497 713 139,784 215,992 1,876 214,116
December -74,014 -72,920 134,730 573 134,157 208,744 1,668 207,077
2019
Jan. - Nov. -798,102 -786,088 1,516,854 6,920 1,509,934 2,314,956 18,934 2,296,022
January -76,108 -74,992 130,123 515 129,608 206,231 1,631 204,600
February -56,324 -55,266 131,252 618 130,634 187,576 1,676 185,900
March -60,859 -59,726 148,851 584 148,267 209,710 1,718 207,993
April -74,933 -73,914 135,831 713 135,118 210,764 1,732 209,032
May -79,626 -78,372 143,051 642 142,409 222,677 1,896 220,781
June -70,426 -69,401 138,649 589 138,060 209,075 1,614 207,461
July -87,219 -86,097 133,536 663 132,872 220,755 1,785 218,969
August -78,337 -77,123 139,360 632 138,728 217,697 1,846 215,850
September -73,307 -72,262 135,209 699 134,510 208,516 1,744 206,772
October (R) -78,038 -76,884 143,045 630 142,415 221,083 1,785 219,298
November -62,925 -62,052 137,946 633 137,312 200,871 1,506 199,365
December
October data as published last month:
-78,305 -77,025 142,908 630 142,278 221,213 1,910 219,303
NOTE: For information on data sources, nonsampling errors, definitions, and details concerning what is included in Net Adjustments, see the explanatory notes in
this release or at www.census.gov/ft900 or www.bea.gov/data/intl-trade-investment/international-trade-goods-and-services.
Period
– 27 –
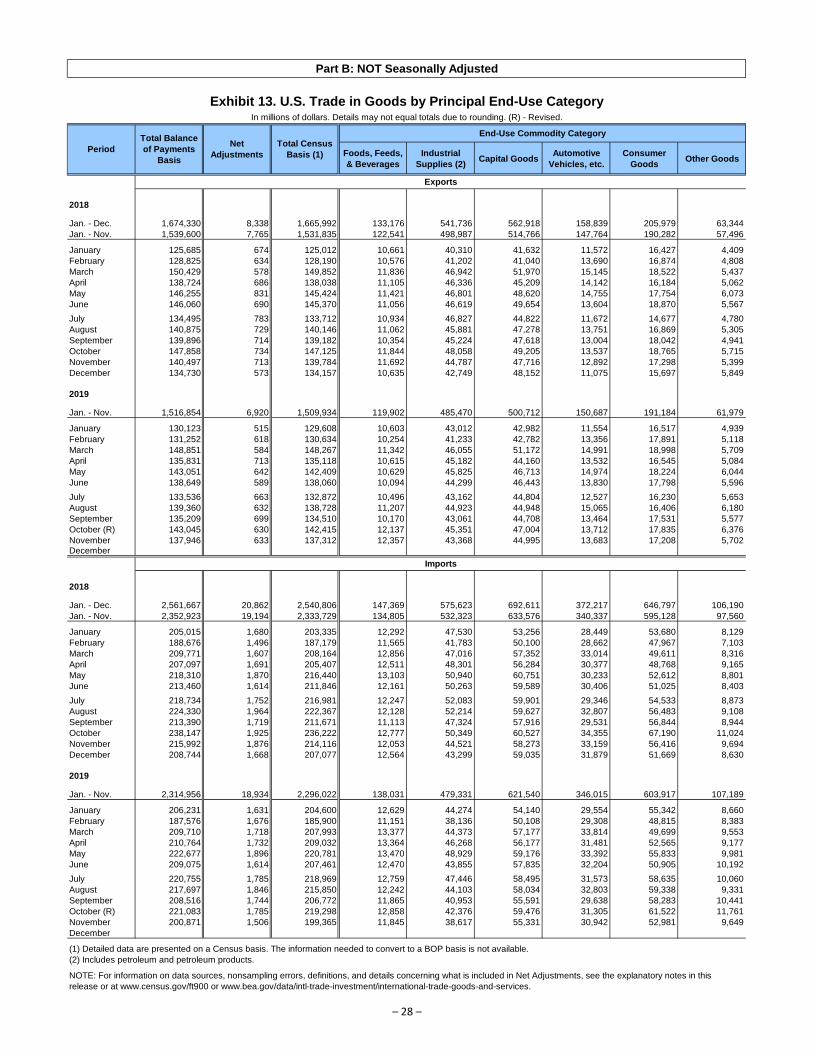
Part B: NOT Seasonally Adjusted
Exhibit 13. U.S. Trade in Goods by Principal End-Use CategoryIn millions of dollars. Details may not equal totals due to rounding. (R) - Revised.
End-Use Commodity Category
Foods, Feeds,
& Beverages
Industrial
Supplies (2)Capital Goods
Automotive
Vehicles, etc.
Consumer
GoodsOther Goods
Exports
2018
Jan. - Dec. 1,674,330 8,338 1,665,992 133,176 541,736 562,918 158,839 205,979 63,344
Jan. - Nov. 1,539,600 7,765 1,531,835 122,541 498,987 514,766 147,764 190,282 57,496
January 125,685 674 125,012 10,661 40,310 41,632 11,572 16,427 4,409
February 128,825 634 128,190 10,576 41,202 41,040 13,690 16,874 4,808
March 150,429 578 149,852 11,836 46,942 51,970 15,145 18,522 5,437
April 138,724 686 138,038 11,105 46,336 45,209 14,142 16,184 5,062
May 146,255 831 145,424 11,421 46,801 48,620 14,755 17,754 6,073
June 146,060 690 145,370 11,056 46,619 49,654 13,604 18,870 5,567
July 134,495 783 133,712 10,934 46,827 44,822 11,672 14,677 4,780
August 140,875 729 140,146 11,062 45,881 47,278 13,751 16,869 5,305
September 139,896 714 139,182 10,354 45,224 47,618 13,004 18,042 4,941
October 147,858 734 147,125 11,844 48,058 49,205 13,537 18,765 5,715
November 140,497 713 139,784 11,692 44,787 47,716 12,892 17,298 5,399
December 134,730 573 134,157 10,635 42,749 48,152 11,075 15,697 5,849
2019
Jan. - Nov. 1,516,854 6,920 1,509,934 119,902 485,470 500,712 150,687 191,184 61,979
January 130,123 515 129,608 10,603 43,012 42,982 11,554 16,517 4,939
February 131,252 618 130,634 10,254 41,233 42,782 13,356 17,891 5,118
March 148,851 584 148,267 11,342 46,055 51,172 14,991 18,998 5,709
April 135,831 713 135,118 10,615 45,182 44,160 13,532 16,545 5,084
May 143,051 642 142,409 10,629 45,825 46,713 14,974 18,224 6,044
June 138,649 589 138,060 10,094 44,299 46,443 13,830 17,798 5,596
July 133,536 663 132,872 10,496 43,162 44,804 12,527 16,230 5,653
August 139,360 632 138,728 11,207 44,923 44,948 15,065 16,406 6,180
September 135,209 699 134,510 10,170 43,061 44,708 13,464 17,531 5,577
October (R) 143,045 630 142,415 12,137 45,351 47,004 13,712 17,835 6,376
November 137,946 633 137,312 12,357 43,368 44,995 13,683 17,208 5,702December
Imports
2018
Jan. - Dec. 2,561,667 20,862 2,540,806 147,369 575,623 692,611 372,217 646,797 106,190
Jan. - Nov. 2,352,923 19,194 2,333,729 134,805 532,323 633,576 340,337 595,128 97,560
January 205,015 1,680 203,335 12,292 47,530 53,256 28,449 53,680 8,129
February 188,676 1,496 187,179 11,565 41,783 50,100 28,662 47,967 7,103
March 209,771 1,607 208,164 12,856 47,016 57,352 33,014 49,611 8,316
April 207,097 1,691 205,407 12,511 48,301 56,284 30,377 48,768 9,165
May 218,310 1,870 216,440 13,103 50,940 60,751 30,233 52,612 8,801
June 213,460 1,614 211,846 12,161 50,263 59,589 30,406 51,025 8,403
July 218,734 1,752 216,981 12,247 52,083 59,901 29,346 54,533 8,873
August 224,330 1,964 222,367 12,128 52,214 59,627 32,807 56,483 9,108
September 213,390 1,719 211,671 11,113 47,324 57,916 29,531 56,844 8,944
October 238,147 1,925 236,222 12,777 50,349 60,527 34,355 67,190 11,024
November 215,992 1,876 214,116 12,053 44,521 58,273 33,159 56,416 9,694
December 208,744 1,668 207,077 12,564 43,299 59,035 31,879 51,669 8,630
2019
Jan. - Nov. 2,314,956 18,934 2,296,022 138,031 479,331 621,540 346,015 603,917 107,189
January 206,231 1,631 204,600 12,629 44,274 54,140 29,554 55,342 8,660
February 187,576 1,676 185,900 11,151 38,136 50,108 29,308 48,815 8,383
March 209,710 1,718 207,993 13,377 44,373 57,177 33,814 49,699 9,553
April 210,764 1,732 209,032 13,364 46,268 56,177 31,481 52,565 9,177
May 222,677 1,896 220,781 13,470 48,929 59,176 33,392 55,833 9,981
June 209,075 1,614 207,461 12,470 43,855 57,835 32,204 50,905 10,192
July 220,755 1,785 218,969 12,759 47,446 58,495 31,573 58,635 10,060
August 217,697 1,846 215,850 12,242 44,103 58,034 32,803 59,338 9,331
September 208,516 1,744 206,772 11,865 40,953 55,591 29,638 58,283 10,441
October (R) 221,083 1,785 219,298 12,858 42,376 59,476 31,305 61,522 11,761
November 200,871 1,506 199,365 11,845 38,617 55,331 30,942 52,981 9,649
December
(1) Detailed data are presented on a Census basis. The information needed to convert to a BOP basis is not available.
(2) Includes petroleum and petroleum products.
NOTE: For information on data sources, nonsampling errors, definitions, and details concerning what is included in Net Adjustments, see the explanatory notes in this
release or at www.census.gov/ft900 or www.bea.gov/data/intl-trade-investment/international-trade-goods-and-services.
Period
Total Balance
of Payments
Basis
Net
Adjustments
Total Census
Basis (1)
– 28 –
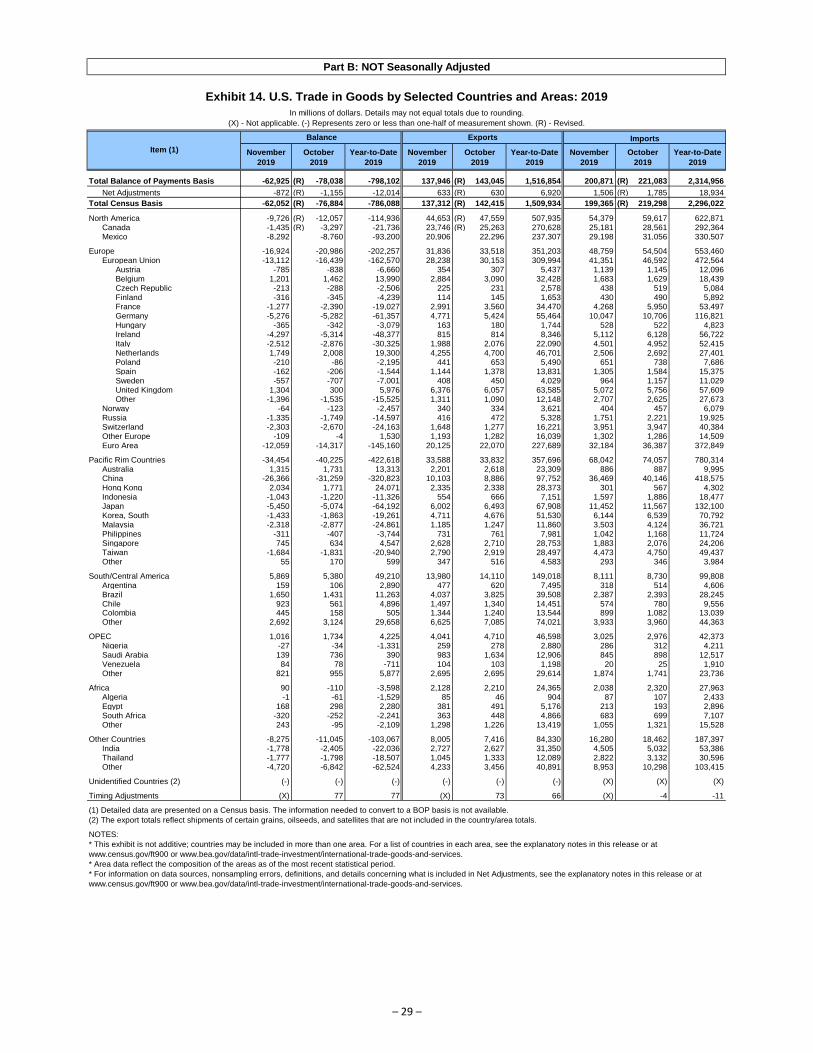
Part B: NOT Seasonally Adjusted
Exhibit 14. U.S. Trade in Goods by Selected Countries and Areas: 2019
In millions of dollars. Details may not equal totals due to rounding.
(X) - Not applicable. (-) Represents zero or less than one-half of measurement shown. (R) - Revised.
Balance Exports Imports
November
2019
October
2019
Year-to-Date
2019
November
2019
October
2019
Year-to-Date
2019
November
2019
October
2019
Year-to-Date
2019
Total Balance of Payments Basis -62,925 (R) -78,038 -798,102 137,946 (R) 143,045 1,516,854 200,871 (R) 221,083 2,314,956
Net Adjustments -872 (R) -1,155 -12,014 633 (R) 630 6,920 1,506 (R) 1,785 18,934
Total Census Basis -62,052 (R) -76,884 -786,088 137,312 (R) 142,415 1,509,934 199,365 (R) 219,298 2,296,022
North America -9,726 (R) -12,057 -114,936 44,653 (R) 47,559 507,935 54,379 59,617 622,871Canada -1,435 (R) -3,297 -21,736 23,746 (R) 25,263 270,628 25,181 28,561 292,364Mexico -8,292 -8,760 -93,200 20,906 22,296 237,307 29,198 31,056 330,507
Europe -16,924 -20,986 -202,257 31,836 33,518 351,203 48,759 54,504 553,460European Union -13,112 -16,439 -162,570 28,238 30,153 309,994 41,351 46,592 472,564
Austria -785 -838 -6,660 354 307 5,437 1,139 1,145 12,096Belgium 1,201 1,462 13,990 2,884 3,090 32,428 1,683 1,629 18,439Czech Republic -213 -288 -2,506 225 231 2,578 438 519 5,084Finland -316 -345 -4,239 114 145 1,653 430 490 5,892France -1,277 -2,390 -19,027 2,991 3,560 34,470 4,268 5,950 53,497Germany -5,276 -5,282 -61,357 4,771 5,424 55,464 10,047 10,706 116,821Hungary -365 -342 -3,079 163 180 1,744 528 522 4,823Ireland -4,297 -5,314 -48,377 815 814 8,346 5,112 6,128 56,722Italy -2,512 -2,876 -30,325 1,988 2,076 22,090 4,501 4,952 52,415Netherlands 1,749 2,008 19,300 4,255 4,700 46,701 2,506 2,692 27,401Poland -210 -86 -2,195 441 653 5,490 651 738 7,686Spain -162 -206 -1,544 1,144 1,378 13,831 1,305 1,584 15,375Sweden -557 -707 -7,001 408 450 4,029 964 1,157 11,029United Kingdom 1,304 300 5,976 6,376 6,057 63,585 5,072 5,756 57,609Other -1,396 -1,535 -15,525 1,311 1,090 12,148 2,707 2,625 27,673
Norway -64 -123 -2,457 340 334 3,621 404 457 6,079Russia -1,335 -1,749 -14,597 416 472 5,328 1,751 2,221 19,925Switzerland -2,303 -2,670 -24,163 1,648 1,277 16,221 3,951 3,947 40,384Other Europe -109 -4 1,530 1,193 1,282 16,039 1,302 1,286 14,509Euro Area -12,059 -14,317 -145,160 20,125 22,070 227,689 32,184 36,387 372,849
Pacific Rim Countries -34,454 -40,225 -422,618 33,588 33,832 357,696 68,042 74,057 780,314Australia 1,315 1,731 13,313 2,201 2,618 23,309 886 887 9,995China -26,366 -31,259 -320,823 10,103 8,886 97,752 36,469 40,146 418,575Hong Kong 2,034 1,771 24,071 2,335 2,338 28,373 301 567 4,302Indonesia -1,043 -1,220 -11,326 554 666 7,151 1,597 1,886 18,477Japan -5,450 -5,074 -64,192 6,002 6,493 67,908 11,452 11,567 132,100Korea, South -1,433 -1,863 -19,261 4,711 4,676 51,530 6,144 6,539 70,792Malaysia -2,318 -2,877 -24,861 1,185 1,247 11,860 3,503 4,124 36,721Philippines -311 -407 -3,744 731 761 7,981 1,042 1,168 11,724Singapore 745 634 4,547 2,628 2,710 28,753 1,883 2,076 24,206Taiwan -1,684 -1,831 -20,940 2,790 2,919 28,497 4,473 4,750 49,437Other 55 170 599 347 516 4,583 293 346 3,984
South/Central America 5,869 5,380 49,210 13,980 14,110 149,018 8,111 8,730 99,808Argentina 159 106 2,890 477 620 7,495 318 514 4,606Brazil 1,650 1,431 11,263 4,037 3,825 39,508 2,387 2,393 28,245Chile 923 561 4,896 1,497 1,340 14,451 574 780 9,556Colombia 445 158 505 1,344 1,240 13,544 899 1,082 13,039Other 2,692 3,124 29,658 6,625 7,085 74,021 3,933 3,960 44,363
OPEC 1,016 1,734 4,225 4,041 4,710 46,598 3,025 2,976 42,373Nigeria -27 -34 -1,331 259 278 2,880 286 312 4,211Saudi Arabia 139 736 390 983 1,634 12,906 845 898 12,517Venezuela 84 78 -711 104 103 1,198 20 25 1,910Other 821 955 5,877 2,695 2,695 29,614 1,874 1,741 23,736
Africa 90 -110 -3,598 2,128 2,210 24,365 2,038 2,320 27,963Algeria -1 -61 -1,529 85 46 904 87 107 2,433Egypt 168 298 2,280 381 491 5,176 213 193 2,896South Africa -320 -252 -2,241 363 448 4,866 683 699 7,107Other 243 -95 -2,109 1,298 1,226 13,419 1,055 1,321 15,528
Other Countries -8,275 -11,045 -103,067 8,005 7,416 84,330 16,280 18,462 187,397India -1,778 -2,405 -22,036 2,727 2,627 31,350 4,505 5,032 53,386Thailand -1,777 -1,798 -18,507 1,045 1,333 12,089 2,822 3,132 30,596Other -4,720 -6,842 -62,524 4,233 3,456 40,891 8,953 10,298 103,415
Unidentified Countries (2) (-) (-) (-) (-) (-) (-) (X) (X) (X)
Timing Adjustments (X) 77 77 (X) 73 66 (X) -4 -11
(1) Detailed data are presented on a Census basis. The information needed to convert to a BOP basis is not available.
(2) The export totals reflect shipments of certain grains, oilseeds, and satellites that are not included in the country/area totals.
NOTES:
* This exhibit is not additive; countries may be included in more than one area. For a list of countries in each area, see the explanatory notes in this release or at
www.census.gov/ft900 or www.bea.gov/data/intl-trade-investment/international-trade-goods-and-services.
* Area data reflect the composition of the areas as of the most recent statistical period.
* For information on data sources, nonsampling errors, definitions, and details concerning what is included in Net Adjustments, see the explanatory notes in this release or at
www.census.gov/ft900 or www.bea.gov/data/intl-trade-investment/international-trade-goods-and-services.
Item (1)
– 29 –
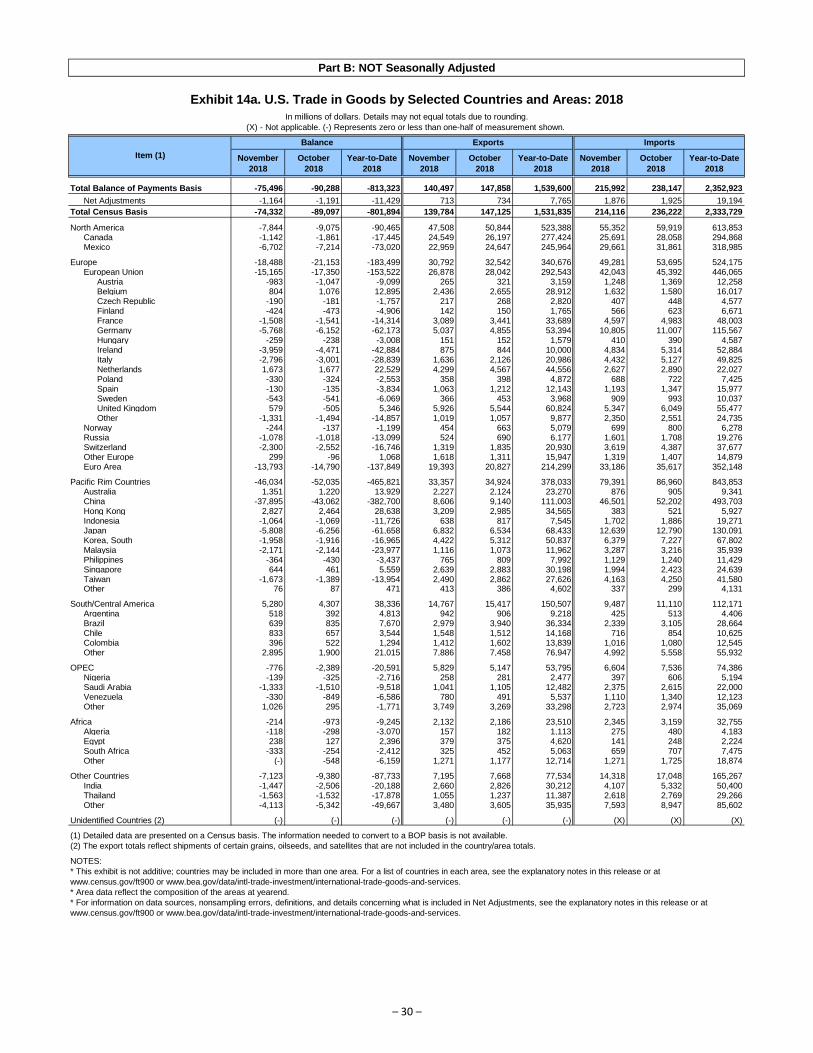
Part B: NOT Seasonally Adjusted
Exhibit 14a. U.S. Trade in Goods by Selected Countries and Areas: 2018
In millions of dollars. Details may not equal totals due to rounding.
Balance Exports Imports
November
2018
October
2018
Year-to-Date
2018
November
2018
October
2018
Year-to-Date
2018
November
2018
October
2018
Year-to-Date
2018
Total Balance of Payments Basis -75,496 -90,288 -813,323 140,497 147,858 1,539,600 215,992 238,147 2,352,923
Net Adjustments -1,164 -1,191 -11,429 713 734 7,765 1,876 1,925 19,194
Total Census Basis -74,332 -89,097 -801,894 139,784 147,125 1,531,835 214,116 236,222 2,333,729
North America -7,844 -9,075 -90,465 47,508 50,844 523,388 55,352 59,919 613,853Canada -1,142 -1,861 -17,445 24,549 26,197 277,424 25,691 28,058 294,868Mexico -6,702 -7,214 -73,020 22,959 24,647 245,964 29,661 31,861 318,985
Europe -18,488 -21,153 -183,499 30,792 32,542 340,676 49,281 53,695 524,175European Union -15,165 -17,350 -153,522 26,878 28,042 292,543 42,043 45,392 446,065
Austria -983 -1,047 -9,099 265 321 3,159 1,248 1,369 12,258Belgium 804 1,076 12,895 2,436 2,655 28,912 1,632 1,580 16,017Czech Republic -190 -181 -1,757 217 268 2,820 407 448 4,577Finland -424 -473 -4,906 142 150 1,765 566 623 6,671France -1,508 -1,541 -14,314 3,089 3,441 33,689 4,597 4,983 48,003Germany -5,768 -6,152 -62,173 5,037 4,855 53,394 10,805 11,007 115,567Hungary -259 -238 -3,008 151 152 1,579 410 390 4,587Ireland -3,959 -4,471 -42,884 875 844 10,000 4,834 5,314 52,884Italy -2,796 -3,001 -28,839 1,636 2,126 20,986 4,432 5,127 49,825Netherlands 1,673 1,677 22,529 4,299 4,567 44,556 2,627 2,890 22,027Poland -330 -324 -2,553 358 398 4,872 688 722 7,425Spain -130 -135 -3,834 1,063 1,212 12,143 1,193 1,347 15,977Sweden -543 -541 -6,069 366 453 3,968 909 993 10,037United Kingdom 579 -505 5,346 5,926 5,544 60,824 5,347 6,049 55,477Other -1,331 -1,494 -14,857 1,019 1,057 9,877 2,350 2,551 24,735
Norway -244 -137 -1,199 454 663 5,079 699 800 6,278Russia -1,078 -1,018 -13,099 524 690 6,177 1,601 1,708 19,276Switzerland -2,300 -2,552 -16,746 1,319 1,835 20,930 3,619 4,387 37,677Other Europe 299 -96 1,068 1,618 1,311 15,947 1,319 1,407 14,879Euro Area -13,793 -14,790 -137,849 19,393 20,827 214,299 33,186 35,617 352,148
Pacific Rim Countries -46,034 -52,035 -465,821 33,357 34,924 378,033 79,391 86,960 843,853Australia 1,351 1,220 13,929 2,227 2,124 23,270 876 905 9,341China -37,895 -43,062 -382,700 8,606 9,140 111,003 46,501 52,202 493,703Hong Kong 2,827 2,464 28,638 3,209 2,985 34,565 383 521 5,927Indonesia -1,064 -1,069 -11,726 638 817 7,545 1,702 1,886 19,271Japan -5,808 -6,256 -61,658 6,832 6,534 68,433 12,639 12,790 130,091Korea, South -1,958 -1,916 -16,965 4,422 5,312 50,837 6,379 7,227 67,802Malaysia -2,171 -2,144 -23,977 1,116 1,073 11,962 3,287 3,216 35,939Philippines -364 -430 -3,437 765 809 7,992 1,129 1,240 11,429Singapore 644 461 5,559 2,639 2,883 30,198 1,994 2,423 24,639Taiwan -1,673 -1,389 -13,954 2,490 2,862 27,626 4,163 4,250 41,580Other 76 87 471 413 386 4,602 337 299 4,131
South/Central America 5,280 4,307 38,336 14,767 15,417 150,507 9,487 11,110 112,171Argentina 518 392 4,813 942 906 9,218 425 513 4,406Brazil 639 835 7,670 2,979 3,940 36,334 2,339 3,105 28,664Chile 833 657 3,544 1,548 1,512 14,168 716 854 10,625Colombia 396 522 1,294 1,412 1,602 13,839 1,016 1,080 12,545Other 2,895 1,900 21,015 7,886 7,458 76,947 4,992 5,558 55,932
OPEC -776 -2,389 -20,591 5,829 5,147 53,795 6,604 7,536 74,386Nigeria -139 -325 -2,716 258 281 2,477 397 606 5,194Saudi Arabia -1,333 -1,510 -9,518 1,041 1,105 12,482 2,375 2,615 22,000Venezuela -330 -849 -6,586 780 491 5,537 1,110 1,340 12,123Other 1,026 295 -1,771 3,749 3,269 33,298 2,723 2,974 35,069
Africa -214 -973 -9,245 2,132 2,186 23,510 2,345 3,159 32,755Algeria -118 -298 -3,070 157 182 1,113 275 480 4,183Egypt 238 127 2,396 379 375 4,620 141 248 2,224South Africa -333 -254 -2,412 325 452 5,063 659 707 7,475Other (-) -548 -6,159 1,271 1,177 12,714 1,271 1,725 18,874
Other Countries -7,123 -9,380 -87,733 7,195 7,668 77,534 14,318 17,048 165,267India -1,447 -2,506 -20,188 2,660 2,826 30,212 4,107 5,332 50,400Thailand -1,563 -1,532 -17,878 1,055 1,237 11,387 2,618 2,769 29,266Other -4,113 -5,342 -49,667 3,480 3,605 35,935 7,593 8,947 85,602
Unidentified Countries (2) (-) (-) (-) (-) (-) (-) (X) (X) (X)
(1) Detailed data are presented on a Census basis. The information needed to convert to a BOP basis is not available.
(2) The export totals reflect shipments of certain grains, oilseeds, and satellites that are not included in the country/area totals.
NOTES:
* This exhibit is not additive; countries may be included in more than one area. For a list of countries in each area, see the explanatory notes in this release or at
www.census.gov/ft900 or www.bea.gov/data/intl-trade-investment/international-trade-goods-and-services.
* Area data reflect the composition of the areas at yearend.
* For information on data sources, nonsampling errors, definitions, and details concerning what is included in Net Adjustments, see the explanatory notes in this release or at
www.census.gov/ft900 or www.bea.gov/data/intl-trade-investment/international-trade-goods-and-services.
(X) - Not applicable. (-) Represents zero or less than one-half of measurement shown.
Item (1)
– 30 –
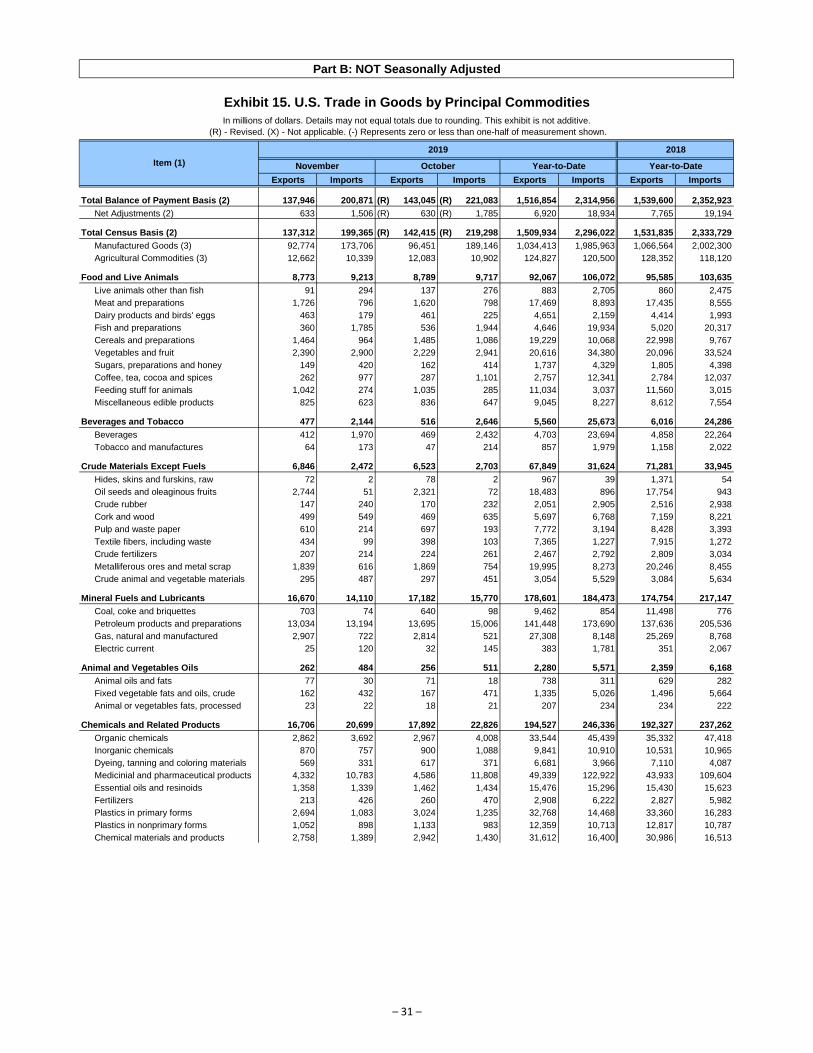
Part B: NOT Seasonally Adjusted
Exhibit 15. U.S. Trade in Goods by Principal Commodities
In millions of dollars. Details may not equal totals due to rounding. This exhibit is not additive.
(R) - Revised. (X) - Not applicable. (-) Represents zero or less than one-half of measurement shown.
2019 2018
November October Year-to-Date Year-to-Date
Exports Imports Exports Imports Exports Imports Exports Imports
Total Balance of Payment Basis (2) 137,946 200,871 (R) 143,045 (R) 221,083 1,516,854 2,314,956 1,539,600 2,352,923
Net Adjustments (2) 633 1,506 (R) 630 (R) 1,785 6,920 18,934 7,765 19,194
Total Census Basis (2) 137,312 199,365 (R) 142,415 (R) 219,298 1,509,934 2,296,022 1,531,835 2,333,729
Manufactured Goods (3) 92,774 173,706 96,451 189,146 1,034,413 1,985,963 1,066,564 2,002,300
Agricultural Commodities (3) 12,662 10,339 12,083 10,902 124,827 120,500 128,352 118,120
Food and Live Animals 8,773 9,213 8,789 9,717 92,067 106,072 95,585 103,635
Live animals other than fish 91 294 137 276 883 2,705 860 2,475
Meat and preparations 1,726 796 1,620 798 17,469 8,893 17,435 8,555
Dairy products and birds' eggs 463 179 461 225 4,651 2,159 4,414 1,993
Fish and preparations 360 1,785 536 1,944 4,646 19,934 5,020 20,317
Cereals and preparations 1,464 964 1,485 1,086 19,229 10,068 22,998 9,767
Vegetables and fruit 2,390 2,900 2,229 2,941 20,616 34,380 20,096 33,524
Sugars, preparations and honey 149 420 162 414 1,737 4,329 1,805 4,398
Coffee, tea, cocoa and spices 262 977 287 1,101 2,757 12,341 2,784 12,037
Feeding stuff for animals 1,042 274 1,035 285 11,034 3,037 11,560 3,015
Miscellaneous edible products 825 623 836 647 9,045 8,227 8,612 7,554
Beverages and Tobacco 477 2,144 516 2,646 5,560 25,673 6,016 24,286
Beverages 412 1,970 469 2,432 4,703 23,694 4,858 22,264
Tobacco and manufactures 64 173 47 214 857 1,979 1,158 2,022
Crude Materials Except Fuels 6,846 2,472 6,523 2,703 67,849 31,624 71,281 33,945
Hides, skins and furskins, raw 72 2 78 2 967 39 1,371 54
Oil seeds and oleaginous fruits 2,744 51 2,321 72 18,483 896 17,754 943
Crude rubber 147 240 170 232 2,051 2,905 2,516 2,938
Cork and wood 499 549 469 635 5,697 6,768 7,159 8,221
Pulp and waste paper 610 214 697 193 7,772 3,194 8,428 3,393
Textile fibers, including waste 434 99 398 103 7,365 1,227 7,915 1,272
Crude fertilizers 207 214 224 261 2,467 2,792 2,809 3,034
Metalliferous ores and metal scrap 1,839 616 1,869 754 19,995 8,273 20,246 8,455
Crude animal and vegetable materials 295 487 297 451 3,054 5,529 3,084 5,634
Mineral Fuels and Lubricants 16,670 14,110 17,182 15,770 178,601 184,473 174,754 217,147
Coal, coke and briquettes 703 74 640 98 9,462 854 11,498 776
Petroleum products and preparations 13,034 13,194 13,695 15,006 141,448 173,690 137,636 205,536
Gas, natural and manufactured 2,907 722 2,814 521 27,308 8,148 25,269 8,768
Electric current 25 120 32 145 383 1,781 351 2,067
Animal and Vegetables Oils 262 484 256 511 2,280 5,571 2,359 6,168
Animal oils and fats 77 30 71 18 738 311 629 282
Fixed vegetable fats and oils, crude 162 432 167 471 1,335 5,026 1,496 5,664
Animal or vegetables fats, processed 23 22 18 21 207 234 234 222
Chemicals and Related Products 16,706 20,699 17,892 22,826 194,527 246,336 192,327 237,262
Organic chemicals 2,862 3,692 2,967 4,008 33,544 45,439 35,332 47,418
Inorganic chemicals 870 757 900 1,088 9,841 10,910 10,531 10,965
Dyeing, tanning and coloring materials 569 331 617 371 6,681 3,966 7,110 4,087
Medicinial and pharmaceutical products 4,332 10,783 4,586 11,808 49,339 122,922 43,933 109,604
Essential oils and resinoids 1,358 1,339 1,462 1,434 15,476 15,296 15,430 15,623
Fertilizers 213 426 260 470 2,908 6,222 2,827 5,982
Plastics in primary forms 2,694 1,083 3,024 1,235 32,768 14,468 33,360 16,283
Plastics in nonprimary forms 1,052 898 1,133 983 12,359 10,713 12,817 10,787
Chemical materials and products 2,758 1,389 2,942 1,430 31,612 16,400 30,986 16,513
Item (1)
– 31 –
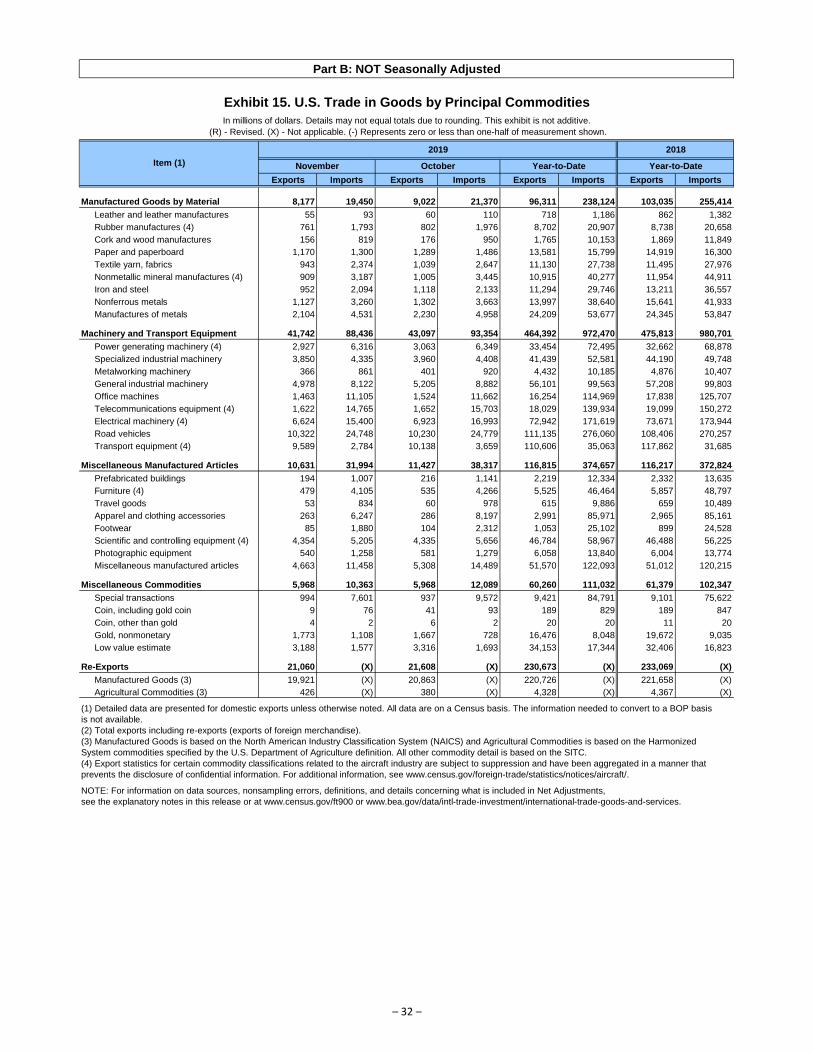
Part B: NOT Seasonally Adjusted
Exhibit 15. U.S. Trade in Goods by Principal Commodities
In millions of dollars. Details may not equal totals due to rounding. This exhibit is not additive.
(R) - Revised. (X) - Not applicable. (-) Represents zero or less than one-half of measurement shown.
2019 2018
November October Year-to-Date Year-to-Date
Exports Imports Exports Imports Exports Imports Exports Imports
Item (1)
Manufactured Goods by Material 8,177 19,450 9,022 21,370 96,311 238,124 103,035 255,414
Leather and leather manufactures 55 93 60 110 718 1,186 862 1,382
Rubber manufactures (4) 761 1,793 802 1,976 8,702 20,907 8,738 20,658
Cork and wood manufactures 156 819 176 950 1,765 10,153 1,869 11,849
Paper and paperboard 1,170 1,300 1,289 1,486 13,581 15,799 14,919 16,300
Textile yarn, fabrics 943 2,374 1,039 2,647 11,130 27,738 11,495 27,976
Nonmetallic mineral manufactures (4) 909 3,187 1,005 3,445 10,915 40,277 11,954 44,911
Iron and steel 952 2,094 1,118 2,133 11,294 29,746 13,211 36,557
Nonferrous metals 1,127 3,260 1,302 3,663 13,997 38,640 15,641 41,933
Manufactures of metals 2,104 4,531 2,230 4,958 24,209 53,677 24,345 53,847
Machinery and Transport Equipment 41,742 88,436 43,097 93,354 464,392 972,470 475,813 980,701
Power generating machinery (4) 2,927 6,316 3,063 6,349 33,454 72,495 32,662 68,878
Specialized industrial machinery 3,850 4,335 3,960 4,408 41,439 52,581 44,190 49,748
Metalworking machinery 366 861 401 920 4,432 10,185 4,876 10,407
General industrial machinery 4,978 8,122 5,205 8,882 56,101 99,563 57,208 99,803
Office machines 1,463 11,105 1,524 11,662 16,254 114,969 17,838 125,707
Telecommunications equipment (4) 1,622 14,765 1,652 15,703 18,029 139,934 19,099 150,272
Electrical machinery (4) 6,624 15,400 6,923 16,993 72,942 171,619 73,671 173,944
Road vehicles 10,322 24,748 10,230 24,779 111,135 276,060 108,406 270,257
Transport equipment (4) 9,589 2,784 10,138 3,659 110,606 35,063 117,862 31,685
Miscellaneous Manufactured Articles 10,631 31,994 11,427 38,317 116,815 374,657 116,217 372,824
Prefabricated buildings 194 1,007 216 1,141 2,219 12,334 2,332 13,635
Furniture (4) 479 4,105 535 4,266 5,525 46,464 5,857 48,797
Travel goods 53 834 60 978 615 9,886 659 10,489
Apparel and clothing accessories 263 6,247 286 8,197 2,991 85,971 2,965 85,161
Footwear 85 1,880 104 2,312 1,053 25,102 899 24,528
Scientific and controlling equipment (4) 4,354 5,205 4,335 5,656 46,784 58,967 46,488 56,225
Photographic equipment 540 1,258 581 1,279 6,058 13,840 6,004 13,774
Miscellaneous manufactured articles 4,663 11,458 5,308 14,489 51,570 122,093 51,012 120,215
Miscellaneous Commodities 5,968 10,363 5,968 12,089 60,260 111,032 61,379 102,347
Special transactions 994 7,601 937 9,572 9,421 84,791 9,101 75,622
Coin, including gold coin 9 76 41 93 189 829 189 847
Coin, other than gold 4 2 6 2 20 20 11 20
Gold, nonmonetary 1,773 1,108 1,667 728 16,476 8,048 19,672 9,035
Low value estimate 3,188 1,577 3,316 1,693 34,153 17,344 32,406 16,823
Re-Exports 21,060 (X) 21,608 (X) 230,673 (X) 233,069 (X)
Manufactured Goods (3) 19,921 (X) 20,863 (X) 220,726 (X) 221,658 (X)
Agricultural Commodities (3) 426 (X) 380 (X) 4,328 (X) 4,367 (X)
(1) Detailed data are presented for domestic exports unless otherwise noted. All data are on a Census basis. The information needed to convert to a BOP basis
is not available.
(2) Total exports including re-exports (exports of foreign merchandise).
(3) Manufactured Goods is based on the North American Industry Classification System (NAICS) and Agricultural Commodities is based on the Harmonized
System commodities specified by the U.S. Department of Agriculture definition. All other commodity detail is based on the SITC.
(4) Export statistics for certain commodity classifications related to the aircraft industry are subject to suppression and have been aggregated in a manner that
prevents the disclosure of confidential information. For additional information, see www.census.gov/foreign-trade/statistics/notices/aircraft/.
NOTE: For information on data sources, nonsampling errors, definitions, and details concerning what is included in Net Adjustments,
see the explanatory notes in this release or at www.census.gov/ft900 or www.bea.gov/data/intl-trade-investment/international-trade-goods-and-services.
– 32 –
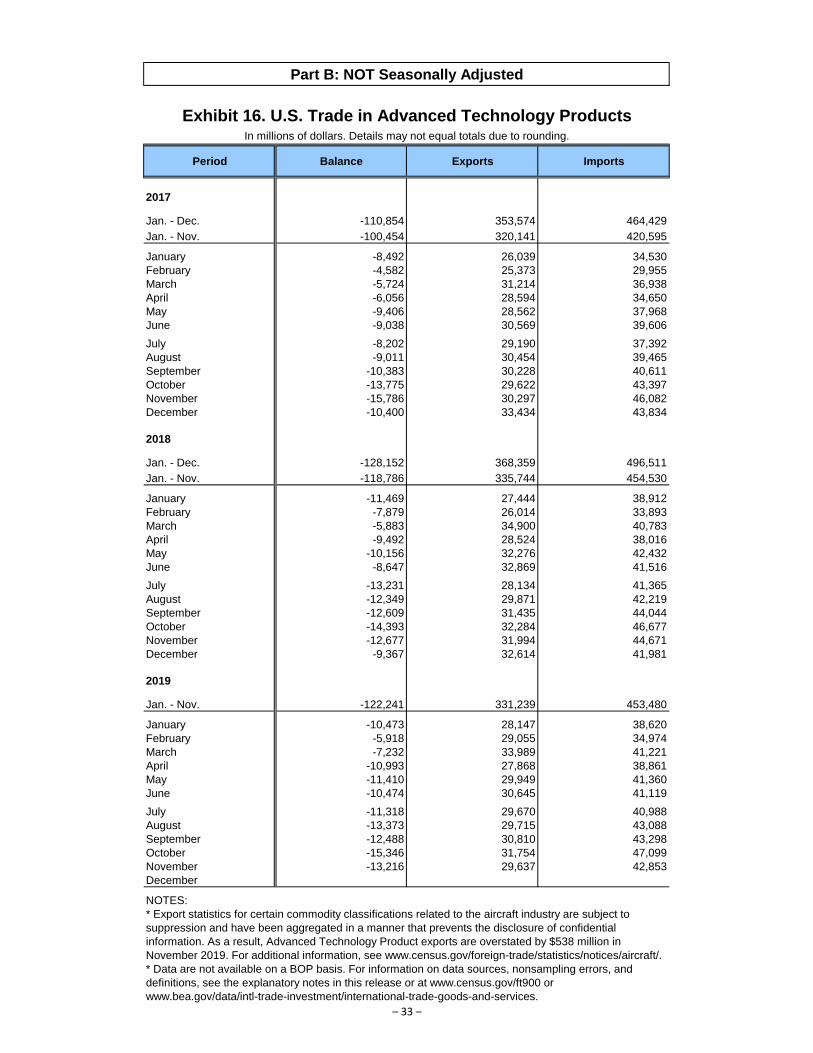
Part B: NOT Seasonally Adjusted
Exhibit 16. U.S. Trade in Advanced Technology ProductsIn millions of dollars. Details may not equal totals due to rounding.
Period Balance Exports Imports
2017
Jan. - Dec. -110,854 353,574 464,429
Jan. - Nov. -100,454 320,141 420,595
January -8,492 26,039 34,530
February -4,582 25,373 29,955
March -5,724 31,214 36,938
April -6,056 28,594 34,650
May -9,406 28,562 37,968
June -9,038 30,569 39,606
July -8,202 29,190 37,392
August -9,011 30,454 39,465
September -10,383 30,228 40,611
October -13,775 29,622 43,397
November -15,786 30,297 46,082
December -10,400 33,434 43,834
2018
Jan. - Dec. -128,152 368,359 496,511
Jan. - Nov. -118,786 335,744 454,530
January -11,469 27,444 38,912
February -7,879 26,014 33,893
March -5,883 34,900 40,783
April -9,492 28,524 38,016
May -10,156 32,276 42,432
June -8,647 32,869 41,516
July -13,231 28,134 41,365
August -12,349 29,871 42,219
September -12,609 31,435 44,044
October -14,393 32,284 46,677
November -12,677 31,994 44,671
December -9,367 32,614 41,981
2019
Jan. - Nov. -122,241 331,239 453,480
January -10,473 28,147 38,620
February -5,918 29,055 34,974
March -7,232 33,989 41,221
April -10,993 27,868 38,861
May -11,410 29,949 41,360
June -10,474 30,645 41,119
July -11,318 29,670 40,988
August -13,373 29,715 43,088
September -12,488 30,810 43,298
October -15,346 31,754 47,099
November -13,216 29,637 42,853
December
NOTES:
* Export statistics for certain commodity classifications related to the aircraft industry are subject to
suppression and have been aggregated in a manner that prevents the disclosure of confidential
information. As a result, Advanced Technology Product exports are overstated by $538 million in
November 2019. For additional information, see www.census.gov/foreign-trade/statistics/notices/aircraft/.
* Data are not available on a BOP basis. For information on data sources, nonsampling errors, and
definitions, see the explanatory notes in this release or at www.census.gov/ft900 or
www.bea.gov/data/intl-trade-investment/international-trade-goods-and-services.
– 33 –
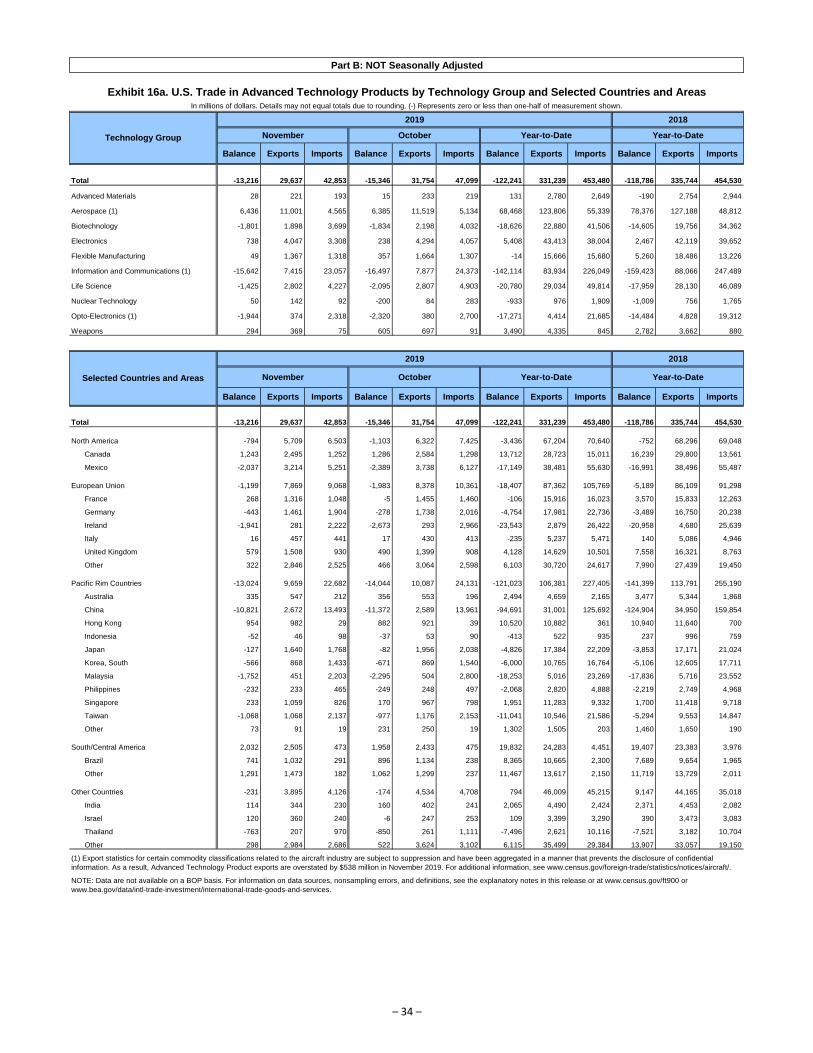
Part B: NOT Seasonally Adjusted
Exhibit 16a. U.S. Trade in Advanced Technology Products by Technology Group and Selected Countries and AreasIn millions of dollars. Details may not equal totals due to rounding. (-) Represents zero or less than one-half of measurement shown.
2019 2018
November October Year-to-Date Year-to-Date
Balance Exports Imports Balance Exports Imports Balance Exports Imports Balance Exports Imports
Total -13,216 29,637 42,853 -15,346 31,754 47,099 -122,241 331,239 453,480 -118,786 335,744 454,530
Advanced Materials 28 221 193 15 233 219 131 2,780 2,649 -190 2,754 2,944
Aerospace (1) 6,436 11,001 4,565 6,385 11,519 5,134 68,468 123,806 55,339 78,376 127,188 48,812
Biotechnology -1,801 1,898 3,699 -1,834 2,198 4,032 -18,626 22,880 41,506 -14,605 19,756 34,362
Electronics 738 4,047 3,308 238 4,294 4,057 5,408 43,413 38,004 2,467 42,119 39,652
Flexible Manufacturing 49 1,367 1,318 357 1,664 1,307 -14 15,666 15,680 5,260 18,486 13,226
Information and Communications (1) -15,642 7,415 23,057 -16,497 7,877 24,373 -142,114 83,934 226,049 -159,423 88,066 247,489
Life Science -1,425 2,802 4,227 -2,095 2,807 4,903 -20,780 29,034 49,814 -17,959 28,130 46,089
Nuclear Technology 50 142 92 -200 84 283 -933 976 1,909 -1,009 756 1,765
Opto-Electronics (1) -1,944 374 2,318 -2,320 380 2,700 -17,271 4,414 21,685 -14,484 4,828 19,312
Weapons 294 369 75 605 697 91 3,490 4,335 845 2,782 3,662 880
2019 2018
November October Year-to-Date Year-to-Date
Balance Exports Imports Balance Exports Imports Balance Exports Imports Balance Exports Imports
Total -13,216 29,637 42,853 -15,346 31,754 47,099 -122,241 331,239 453,480 -118,786 335,744 454,530
North America -794 5,709 6,503 -1,103 6,322 7,425 -3,436 67,204 70,640 -752 68,296 69,048
Canada 1,243 2,495 1,252 1,286 2,584 1,298 13,712 28,723 15,011 16,239 29,800 13,561
Mexico -2,037 3,214 5,251 -2,389 3,738 6,127 -17,149 38,481 55,630 -16,991 38,496 55,487
European Union -1,199 7,869 9,068 -1,983 8,378 10,361 -18,407 87,362 105,769 -5,189 86,109 91,298
France 268 1,316 1,048 -5 1,455 1,460 -106 15,916 16,023 3,570 15,833 12,263
Germany -443 1,461 1,904 -278 1,738 2,016 -4,754 17,981 22,736 -3,489 16,750 20,238
Ireland -1,941 281 2,222 -2,673 293 2,966 -23,543 2,879 26,422 -20,958 4,680 25,639
Italy 16 457 441 17 430 413 -235 5,237 5,471 140 5,086 4,946
United Kingdom 579 1,508 930 490 1,399 908 4,128 14,629 10,501 7,558 16,321 8,763
Other 322 2,846 2,525 466 3,064 2,598 6,103 30,720 24,617 7,990 27,439 19,450
Pacific Rim Countries -13,024 9,659 22,682 -14,044 10,087 24,131 -121,023 106,381 227,405 -141,399 113,791 255,190
Australia 335 547 212 356 553 196 2,494 4,659 2,165 3,477 5,344 1,868
China -10,821 2,672 13,493 -11,372 2,589 13,961 -94,691 31,001 125,692 -124,904 34,950 159,854
Hong Kong 954 982 29 882 921 39 10,520 10,882 361 10,940 11,640 700
Indonesia -52 46 98 -37 53 90 -413 522 935 237 996 759
Japan -127 1,640 1,768 -82 1,956 2,038 -4,826 17,384 22,209 -3,853 17,171 21,024
Korea, South -566 868 1,433 -671 869 1,540 -6,000 10,765 16,764 -5,106 12,605 17,711
Malaysia -1,752 451 2,203 -2,295 504 2,800 -18,253 5,016 23,269 -17,836 5,716 23,552
Philippines -232 233 465 -249 248 497 -2,068 2,820 4,888 -2,219 2,749 4,968
Singapore 233 1,059 826 170 967 798 1,951 11,283 9,332 1,700 11,418 9,718
Taiwan -1,068 1,068 2,137 -977 1,176 2,153 -11,041 10,546 21,586 -5,294 9,553 14,847
Other 73 91 19 231 250 19 1,302 1,505 203 1,460 1,650 190
South/Central America 2,032 2,505 473 1,958 2,433 475 19,832 24,283 4,451 19,407 23,383 3,976
Brazil 741 1,032 291 896 1,134 238 8,365 10,665 2,300 7,689 9,654 1,965
Other 1,291 1,473 182 1,062 1,299 237 11,467 13,617 2,150 11,719 13,729 2,011
Other Countries -231 3,895 4,126 -174 4,534 4,708 794 46,009 45,215 9,147 44,165 35,018
India 114 344 230 160 402 241 2,065 4,490 2,424 2,371 4,453 2,082
Israel 120 360 240 -6 247 253 109 3,399 3,290 390 3,473 3,083
Thailand -763 207 970 -850 261 1,111 -7,496 2,621 10,116 -7,521 3,182 10,704
Other 298 2,984 2,686 522 3,624 3,102 6,115 35,499 29,384 13,907 33,057 19,150
(1) Export statistics for certain commodity classifications related to the aircraft industry are subject to suppression and have been aggregated in a manner that prevents the disclosure of confidential
information. As a result, Advanced Technology Product exports are overstated by $538 million in November 2019. For additional information, see www.census.gov/foreign-trade/statistics/notices/aircraft/.
NOTE: Data are not available on a BOP basis. For information on data sources, nonsampling errors, and definitions, see the explanatory notes in this release or at www.census.gov/ft900 or
www.bea.gov/data/intl-trade-investment/international-trade-goods-and-services.
Technology Group
Selected Countries and Areas
– 34 –
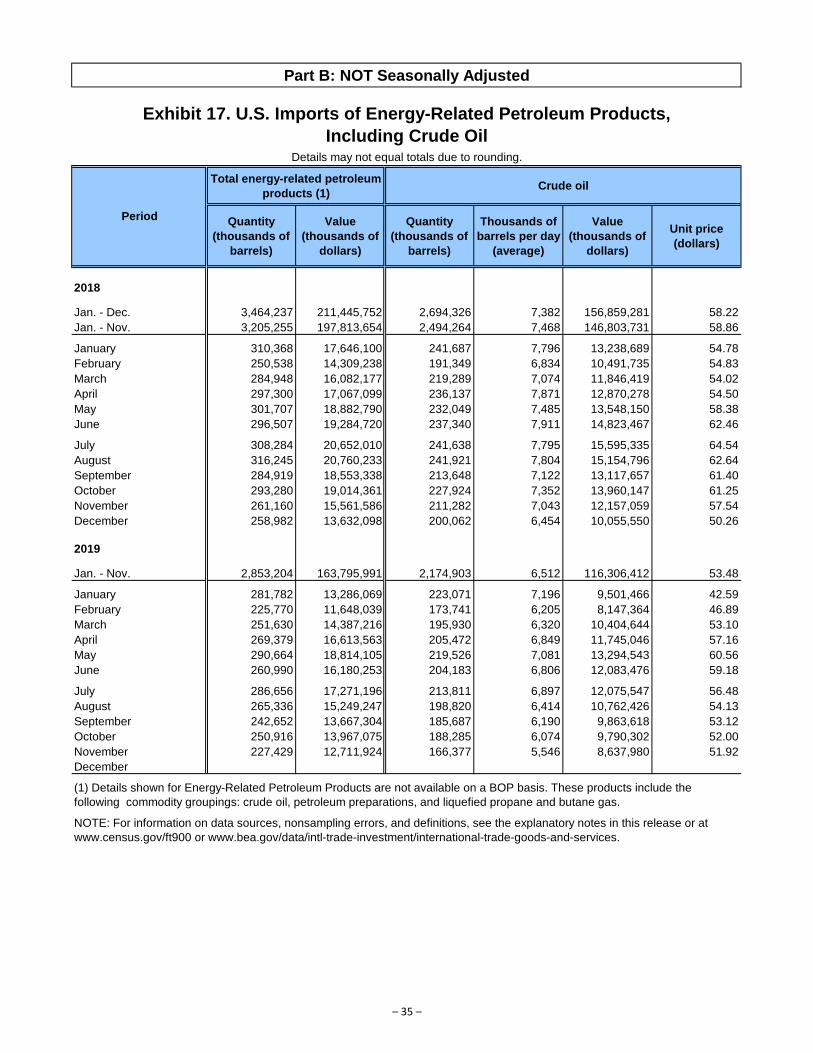
Part B: NOT Seasonally Adjusted
Exhibit 17. U.S. Imports of Energy-Related Petroleum Products,
Including Crude OilDetails may not equal totals due to rounding.
Total energy-related petroleum
products (1)Crude oil
Quantity
(thousands of
barrels)
Value
(thousands of
dollars)
Quantity
(thousands of
barrels)
Thousands of
barrels per day
(average)
Value
(thousands of
dollars)
Unit price
(dollars)
2018
Jan. - Dec. 3,464,237 211,445,752 2,694,326 7,382 156,859,281 58.22
Jan. - Nov. 3,205,255 197,813,654 2,494,264 7,468 146,803,731 58.86
January 310,368 17,646,100 241,687 7,796 13,238,689 54.78
February 250,538 14,309,238 191,349 6,834 10,491,735 54.83
March 284,948 16,082,177 219,289 7,074 11,846,419 54.02
April 297,300 17,067,099 236,137 7,871 12,870,278 54.50
May 301,707 18,882,790 232,049 7,485 13,548,150 58.38
June 296,507 19,284,720 237,340 7,911 14,823,467 62.46
July 308,284 20,652,010 241,638 7,795 15,595,335 64.54
August 316,245 20,760,233 241,921 7,804 15,154,796 62.64
September 284,919 18,553,338 213,648 7,122 13,117,657 61.40
October 293,280 19,014,361 227,924 7,352 13,960,147 61.25
November 261,160 15,561,586 211,282 7,043 12,157,059 57.54
December 258,982 13,632,098 200,062 6,454 10,055,550 50.26
2019
Jan. - Nov. 2,853,204 163,795,991 2,174,903 6,512 116,306,412 53.48
January 281,782 13,286,069 223,071 7,196 9,501,466 42.59
February 225,770 11,648,039 173,741 6,205 8,147,364 46.89
March 251,630 14,387,216 195,930 6,320 10,404,644 53.10
April 269,379 16,613,563 205,472 6,849 11,745,046 57.16
May 290,664 18,814,105 219,526 7,081 13,294,543 60.56
June 260,990 16,180,253 204,183 6,806 12,083,476 59.18
July 286,656 17,271,196 213,811 6,897 12,075,547 56.48
August 265,336 15,249,247 198,820 6,414 10,762,426 54.13
September 242,652 13,667,304 185,687 6,190 9,863,618 53.12
October 250,916 13,967,075 188,285 6,074 9,790,302 52.00
November 227,429 12,711,924 166,377 5,546 8,637,980 51.92
December
(1) Details shown for Energy-Related Petroleum Products are not available on a BOP basis. These products include the
following commodity groupings: crude oil, petroleum preparations, and liquefied propane and butane gas.
NOTE: For information on data sources, nonsampling errors, and definitions, see the explanatory notes in this release or at
www.census.gov/ft900 or www.bea.gov/data/intl-trade-investment/international-trade-goods-and-services.
Period
– 35 –
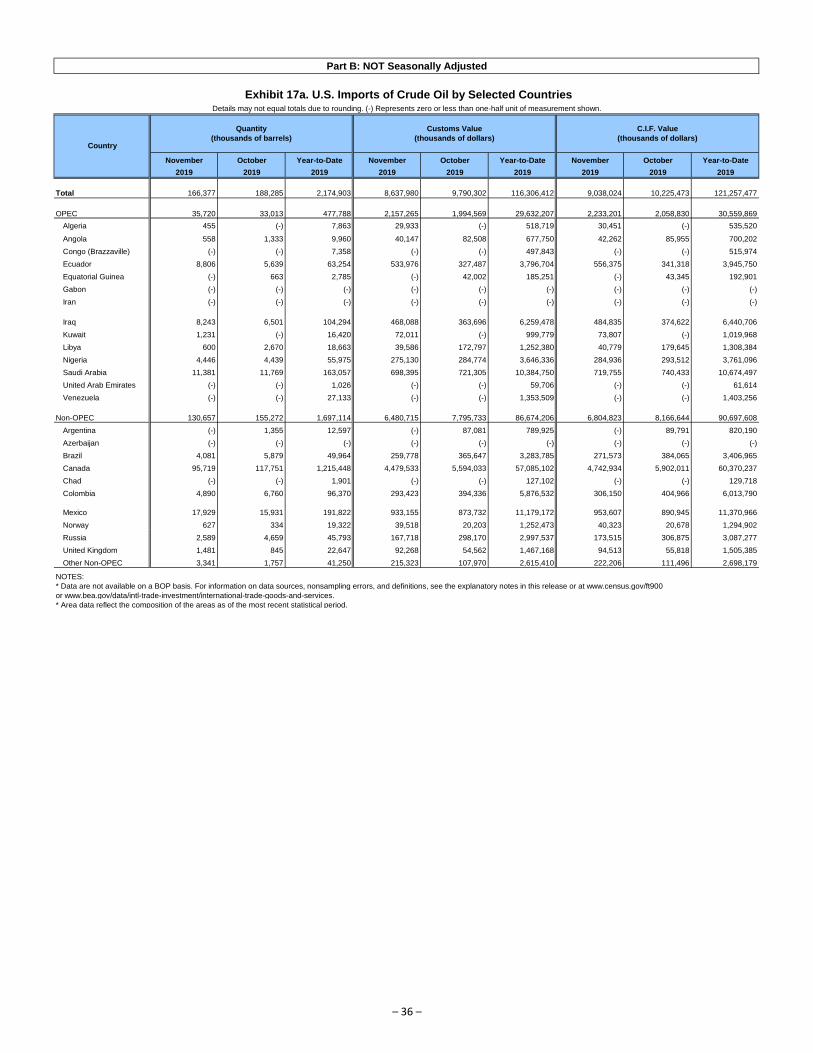
Part B: NOT Seasonally Adjusted
Exhibit 17a. U.S. Imports of Crude Oil by Selected CountriesDetails may not equal totals due to rounding. (-) Represents zero or less than one-half unit of measurement shown.
November October Year-to-Date November October Year-to-Date November October Year-to-Date
2019 2019 2019 2019 2019 2019 2019 2019 2019
Total 166,377 188,285 2,174,903 8,637,980 9,790,302 116,306,412 9,038,024 10,225,473 121,257,477
OPEC 35,720 33,013 477,788 2,157,265 1,994,569 29,632,207 2,233,201 2,058,830 30,559,869
Algeria 455 (-) 7,863 29,933 (-) 518,719 30,451 (-) 535,520
Angola 558 1,333 9,960 40,147 82,508 677,750 42,262 85,955 700,202
Congo (Brazzaville) (-) (-) 7,358 (-) (-) 497,843 (-) (-) 515,974
Ecuador 8,806 5,639 63,254 533,976 327,487 3,796,704 556,375 341,318 3,945,750
Equatorial Guinea (-) 663 2,785 (-) 42,002 185,251 (-) 43,345 192,901
Gabon (-) (-) (-) (-) (-) (-) (-) (-) (-)
Iran (-) (-) (-) (-) (-) (-) (-) (-) (-)
Iraq 8,243 6,501 104,294 468,088 363,696 6,259,478 484,835 374,622 6,440,706
Kuwait 1,231 (-) 16,420 72,011 (-) 999,779 73,807 (-) 1,019,968
Libya 600 2,670 18,663 39,586 172,797 1,252,380 40,779 179,645 1,308,384
Nigeria 4,446 4,439 55,975 275,130 284,774 3,646,336 284,936 293,512 3,761,096
Saudi Arabia 11,381 11,769 163,057 698,395 721,305 10,384,750 719,755 740,433 10,674,497
United Arab Emirates (-) (-) 1,026 (-) (-) 59,706 (-) (-) 61,614
Venezuela (-) (-) 27,133 (-) (-) 1,353,509 (-) (-) 1,403,256
Non-OPEC 130,657 155,272 1,697,114 6,480,715 7,795,733 86,674,206 6,804,823 8,166,644 90,697,608
Argentina (-) 1,355 12,597 (-) 87,081 789,925 (-) 89,791 820,190
Azerbaijan (-) (-) (-) (-) (-) (-) (-) (-) (-)
Brazil 4,081 5,879 49,964 259,778 365,647 3,283,785 271,573 384,065 3,406,965
Canada 95,719 117,751 1,215,448 4,479,533 5,594,033 57,085,102 4,742,934 5,902,011 60,370,237
Chad (-) (-) 1,901 (-) (-) 127,102 (-) (-) 129,718
Colombia 4,890 6,760 96,370 293,423 394,336 5,876,532 306,150 404,966 6,013,790
Mexico 17,929 15,931 191,822 933,155 873,732 11,179,172 953,607 890,945 11,370,966
Norway 627 334 19,322 39,518 20,203 1,252,473 40,323 20,678 1,294,902
Russia 2,589 4,659 45,793 167,718 298,170 2,997,537 173,515 306,875 3,087,277
United Kingdom 1,481 845 22,647 92,268 54,562 1,467,168 94,513 55,818 1,505,385
Other Non-OPEC 3,341 1,757 41,250 215,323 107,970 2,615,410 222,206 111,496 2,698,179
NOTES:
* Data are not available on a BOP basis. For information on data sources, nonsampling errors, and definitions, see the explanatory notes in this release or at www.census.gov/ft900
or www.bea.gov/data/intl-trade-investment/international-trade-goods-and-services.
* Area data reflect the composition of the areas as of the most recent statistical period.
Country
Quantity
(thousands of barrels)
Customs Value
(thousands of dollars)
C.I.F. Value
(thousands of dollars)
– 36 –
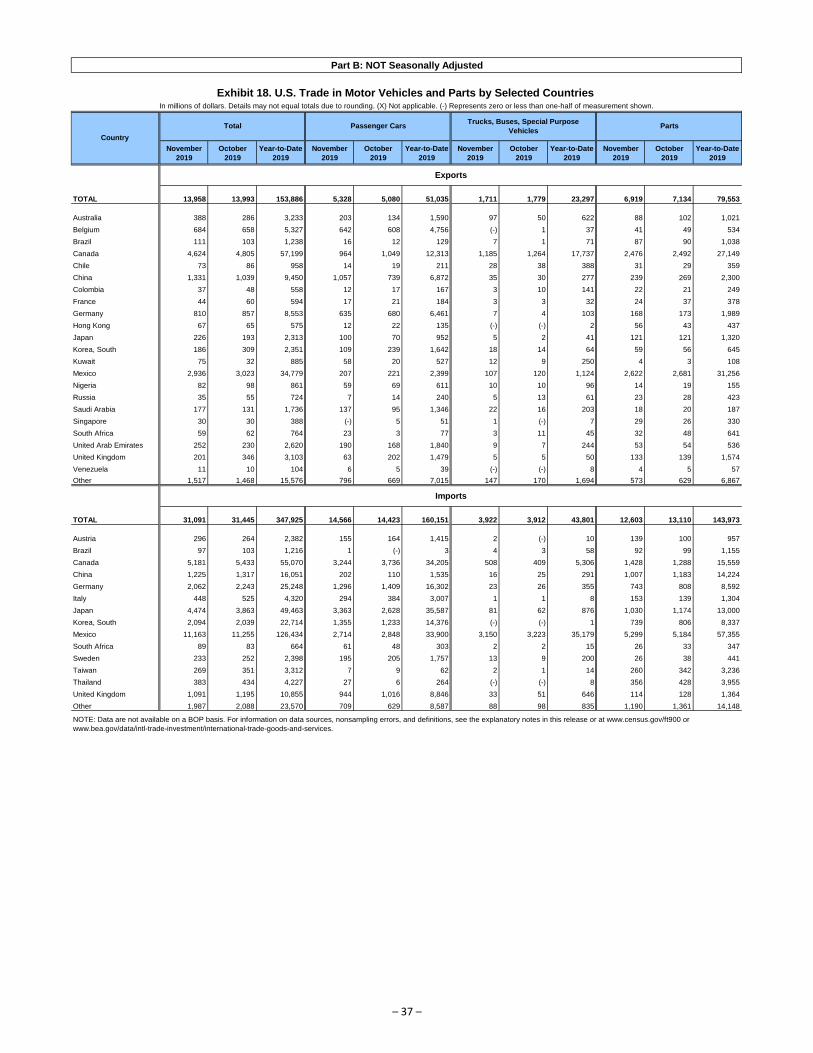
Part B: NOT Seasonally Adjusted
Exhibit 18. U.S. Trade in Motor Vehicles and Parts by Selected Countries In millions of dollars. Details may not equal totals due to rounding. (X) Not applicable. (-) Represents zero or less than one-half of measurement shown.
November
2019
October
2019
Year-to-Date
2019
November
2019
October
2019
Year-to-Date
2019
November
2019
October
2019
Year-to-Date
2019
November
2019
October
2019
Year-to-Date
2019
Exports
TOTAL 13,958 13,993 153,886 5,328 5,080 51,035 1,711 1,779 23,297 6,919 7,134 79,553
Australia 388 286 3,233 203 134 1,590 97 50 622 88 102 1,021
Belgium 684 658 5,327 642 608 4,756 (-) 1 37 41 49 534
Brazil 111 103 1,238 16 12 129 7 1 71 87 90 1,038
Canada 4,624 4,805 57,199 964 1,049 12,313 1,185 1,264 17,737 2,476 2,492 27,149
Chile 73 86 958 14 19 211 28 38 388 31 29 359
China 1,331 1,039 9,450 1,057 739 6,872 35 30 277 239 269 2,300
Colombia 37 48 558 12 17 167 3 10 141 22 21 249
France 44 60 594 17 21 184 3 3 32 24 37 378
Germany 810 857 8,553 635 680 6,461 7 4 103 168 173 1,989
Hong Kong 67 65 575 12 22 135 (-) (-) 2 56 43 437
Japan 226 193 2,313 100 70 952 5 2 41 121 121 1,320
Korea, South 186 309 2,351 109 239 1,642 18 14 64 59 56 645
Kuwait 75 32 885 58 20 527 12 9 250 4 3 108
Mexico 2,936 3,023 34,779 207 221 2,399 107 120 1,124 2,622 2,681 31,256
Nigeria 82 98 861 59 69 611 10 10 96 14 19 155
Russia 35 55 724 7 14 240 5 13 61 23 28 423
Saudi Arabia 177 131 1,736 137 95 1,346 22 16 203 18 20 187
Singapore 30 30 388 (-) 5 51 1 (-) 7 29 26 330
South Africa 59 62 764 23 3 77 3 11 45 32 48 641
United Arab Emirates 252 230 2,620 190 168 1,840 9 7 244 53 54 536
United Kingdom 201 346 3,103 63 202 1,479 5 5 50 133 139 1,574
Venezuela 11 10 104 6 5 39 (-) (-) 8 4 5 57
Other 1,517 1,468 15,576 796 669 7,015 147 170 1,694 573 629 6,867
Imports
TOTAL 31,091 31,445 347,925 14,566 14,423 160,151 3,922 3,912 43,801 12,603 13,110 143,973
Austria 296 264 2,382 155 164 1,415 2 (-) 10 139 100 957
Brazil 97 103 1,216 1 (-) 3 4 3 58 92 99 1,155
Canada 5,181 5,433 55,070 3,244 3,736 34,205 508 409 5,306 1,428 1,288 15,559
China 1,225 1,317 16,051 202 110 1,535 16 25 291 1,007 1,183 14,224
Germany 2,062 2,243 25,248 1,296 1,409 16,302 23 26 355 743 808 8,592
Italy 448 525 4,320 294 384 3,007 1 1 8 153 139 1,304
Japan 4,474 3,863 49,463 3,363 2,628 35,587 81 62 876 1,030 1,174 13,000
Korea, South 2,094 2,039 22,714 1,355 1,233 14,376 (-) (-) 1 739 806 8,337
Mexico 11,163 11,255 126,434 2,714 2,848 33,900 3,150 3,223 35,179 5,299 5,184 57,355
South Africa 89 83 664 61 48 303 2 2 15 26 33 347
Sweden 233 252 2,398 195 205 1,757 13 9 200 26 38 441
Taiwan 269 351 3,312 7 9 62 2 1 14 260 342 3,236
Thailand 383 434 4,227 27 6 264 (-) (-) 8 356 428 3,955
United Kingdom 1,091 1,195 10,855 944 1,016 8,846 33 51 646 114 128 1,364
Other 1,987 2,088 23,570 709 629 8,587 88 98 835 1,190 1,361 14,148
NOTE: Data are not available on a BOP basis. For information on data sources, nonsampling errors, and definitions, see the explanatory notes in this release or at www.census.gov/ft900 or
www.bea.gov/data/intl-trade-investment/international-trade-goods-and-services.
Country
Total Passenger CarsTrucks, Buses, Special Purpose
VehiclesParts
– 37 –
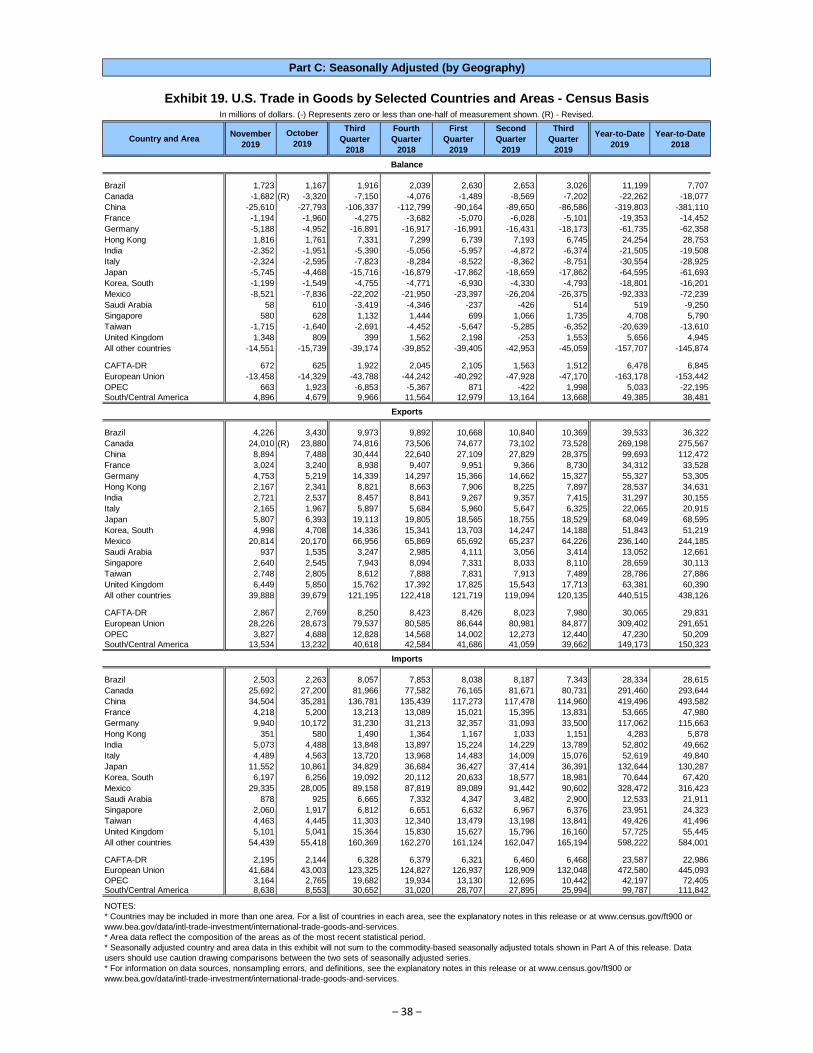
Part C: Seasonally Adjusted (by Geography)
Exhibit 19. U.S. Trade in Goods by Selected Countries and Areas - Census BasisIn millions of dollars. (-) Represents zero or less than one-half of measurement shown. (R) - Revised.
Country and AreaNovember
2019
Third
Quarter
2018
Fourth
Quarter
2018
First
Quarter
2019
Second
Quarter
2019
Third
Quarter
2019
Year-to-Date
2019
Year-to-Date
2018
Balance
Brazil 1,723 1,167 1,916 2,039 2,630 2,653 3,026 11,199 7,707
Canada -1,682 (R) -3,320 -7,150 -4,076 -1,489 -8,569 -7,202 -22,262 -18,077
China -25,610 -27,793 -106,337 -112,799 -90,164 -89,650 -86,586 -319,803 -381,110
France -1,194 -1,960 -4,275 -3,682 -5,070 -6,028 -5,101 -19,353 -14,452
Germany -5,188 -4,952 -16,891 -16,917 -16,991 -16,431 -18,173 -61,735 -62,358
Hong Kong 1,816 1,761 7,331 7,299 6,739 7,193 6,745 24,254 28,753
India -2,352 -1,951 -5,390 -5,056 -5,957 -4,872 -6,374 -21,505 -19,508
Italy -2,324 -2,595 -7,823 -8,284 -8,522 -8,362 -8,751 -30,554 -28,925
Japan -5,745 -4,468 -15,716 -16,879 -17,862 -18,659 -17,862 -64,595 -61,693
Korea, South -1,199 -1,549 -4,755 -4,771 -6,930 -4,330 -4,793 -18,801 -16,201
Mexico -8,521 -7,836 -22,202 -21,950 -23,397 -26,204 -26,375 -92,333 -72,239
Saudi Arabia 58 610 -3,419 -4,346 -237 -426 514 519 -9,250
Singapore 580 628 1,132 1,444 699 1,066 1,735 4,708 5,790
Taiwan -1,715 -1,640 -2,691 -4,452 -5,647 -5,285 -6,352 -20,639 -13,610
United Kingdom 1,348 809 399 1,562 2,198 -253 1,553 5,656 4,945
All other countries -14,551 -15,739 -39,174 -39,852 -39,405 -42,953 -45,059 -157,707 -145,874
CAFTA-DR 672 625 1,922 2,045 2,105 1,563 1,512 6,478 6,845
European Union -13,458 -14,329 -43,788 -44,242 -40,292 -47,928 -47,170 -163,178 -153,442
OPEC 663 1,923 -6,853 -5,367 871 -422 1,998 5,033 -22,195
South/Central America 4,896 4,679 9,966 11,564 12,979 13,164 13,668 49,385 38,481
Exports
Brazil 4,226 3,430 9,973 9,892 10,668 10,840 10,369 39,533 36,322
Canada 24,010 (R) 23,880 74,816 73,506 74,677 73,102 73,528 269,198 275,567
China 8,894 7,488 30,444 22,640 27,109 27,829 28,375 99,693 112,472
France 3,024 3,240 8,938 9,407 9,951 9,366 8,730 34,312 33,528
Germany 4,753 5,219 14,339 14,297 15,366 14,662 15,327 55,327 53,305
Hong Kong 2,167 2,341 8,821 8,663 7,906 8,225 7,897 28,537 34,631
India 2,721 2,537 8,457 8,841 9,267 9,357 7,415 31,297 30,155
Italy 2,165 1,967 5,897 5,684 5,960 5,647 6,325 22,065 20,915
Japan 5,807 6,393 19,113 19,805 18,565 18,755 18,529 68,049 68,595
Korea, South 4,998 4,708 14,336 15,341 13,703 14,247 14,188 51,843 51,219
Mexico 20,814 20,170 66,956 65,869 65,692 65,237 64,226 236,140 244,185
Saudi Arabia 937 1,535 3,247 2,985 4,111 3,056 3,414 13,052 12,661
Singapore 2,640 2,545 7,943 8,094 7,331 8,033 8,110 28,659 30,113
Taiwan 2,748 2,805 8,612 7,888 7,831 7,913 7,489 28,786 27,886
United Kingdom 6,449 5,850 15,762 17,392 17,825 15,543 17,713 63,381 60,390
All other countries 39,888 39,679 121,195 122,418 121,719 119,094 120,135 440,515 438,126
CAFTA-DR 2,867 2,769 8,250 8,423 8,426 8,023 7,980 30,065 29,831
European Union 28,226 28,673 79,537 80,585 86,644 80,981 84,877 309,402 291,651
OPEC 3,827 4,688 12,828 14,568 14,002 12,273 12,440 47,230 50,209
South/Central America 13,534 13,232 40,618 42,584 41,686 41,059 39,662 149,173 150,323
Imports
Brazil 2,503 2,263 8,057 7,853 8,038 8,187 7,343 28,334 28,615
Canada 25,692 27,200 81,966 77,582 76,165 81,671 80,731 291,460 293,644
China 34,504 35,281 136,781 135,439 117,273 117,478 114,960 419,496 493,582
France 4,218 5,200 13,213 13,089 15,021 15,395 13,831 53,665 47,980
Germany 9,940 10,172 31,230 31,213 32,357 31,093 33,500 117,062 115,663
Hong Kong 351 580 1,490 1,364 1,167 1,033 1,151 4,283 5,878
India 5,073 4,488 13,848 13,897 15,224 14,229 13,789 52,802 49,662
Italy 4,489 4,563 13,720 13,968 14,483 14,009 15,076 52,619 49,840
Japan 11,552 10,861 34,829 36,684 36,427 37,414 36,391 132,644 130,287
Korea, South 6,197 6,256 19,092 20,112 20,633 18,577 18,981 70,644 67,420
Mexico 29,335 28,005 89,158 87,819 89,089 91,442 90,602 328,472 316,423
Saudi Arabia 878 925 6,665 7,332 4,347 3,482 2,900 12,533 21,911
Singapore 2,060 1,917 6,812 6,651 6,632 6,967 6,376 23,951 24,323
Taiwan 4,463 4,445 11,303 12,340 13,479 13,198 13,841 49,426 41,496
United Kingdom 5,101 5,041 15,364 15,830 15,627 15,796 16,160 57,725 55,445
All other countries 54,439 55,418 160,369 162,270 161,124 162,047 165,194 598,222 584,001
CAFTA-DR 2,195 2,144 6,328 6,379 6,321 6,460 6,468 23,587 22,986
European Union 41,684 43,003 123,325 124,827 126,937 128,909 132,048 472,580 445,093
OPEC 3,164 2,765 19,682 19,934 13,130 12,695 10,442 42,197 72,405South/Central America 8,638 8,553 30,652 31,020 28,707 27,895 25,994 99,787 111,842
NOTES:
* Countries may be included in more than one area. For a list of countries in each area, see the explanatory notes in this release or at www.census.gov/ft900 or
www.bea.gov/data/intl-trade-investment/international-trade-goods-and-services.
* Area data reflect the composition of the areas as of the most recent statistical period.
* Seasonally adjusted country and area data in this exhibit will not sum to the commodity-based seasonally adjusted totals shown in Part A of this release. Data
users should use caution drawing comparisons between the two sets of seasonally adjusted series.
* For information on data sources, nonsampling errors, and definitions, see the explanatory notes in this release or at www.census.gov/ft900 or
www.bea.gov/data/intl-trade-investment/international-trade-goods-and-services.
October
2019
– 38 –
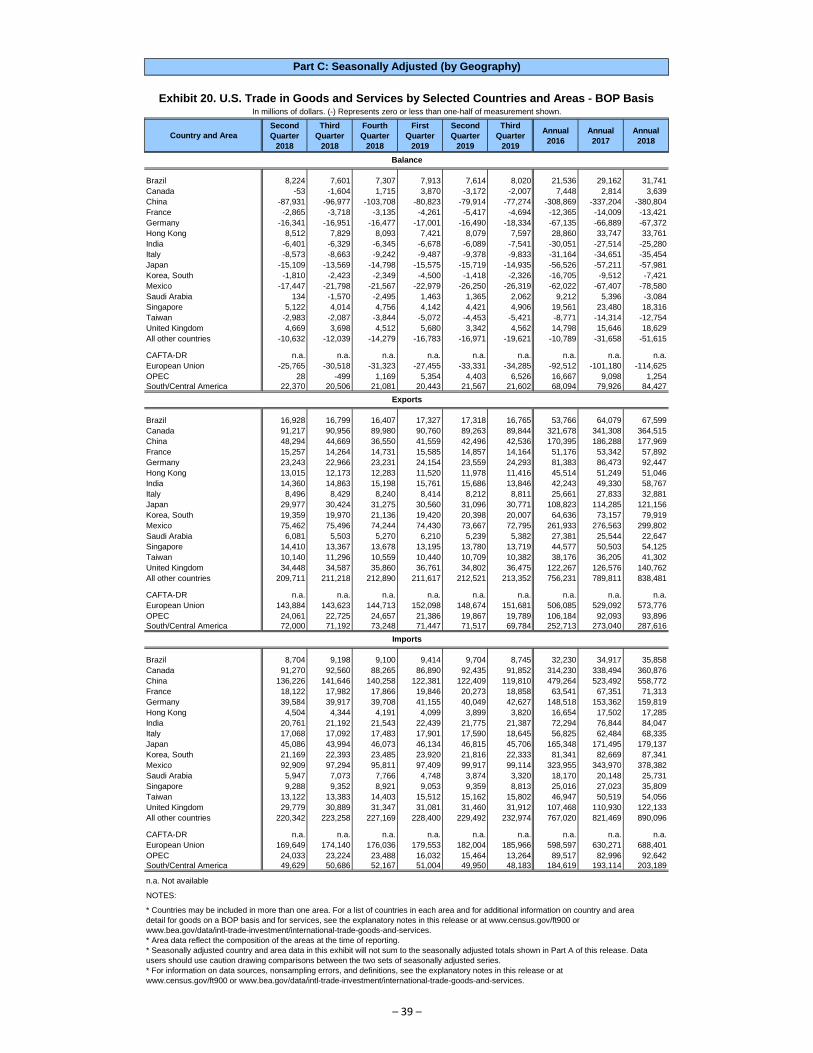
Country and Area
Second
Quarter
2018
Third
Quarter
2018
Fourth
Quarter
2018
First
Quarter
2019
Second
Quarter
2019
Third
Quarter
2019
Annual
2016
Annual
2017
Annual
2018
Brazil 8,224 7,601 7,307 7,913 7,614 8,020 21,536 29,162 31,741
Canada -53 -1,604 1,715 3,870 -3,172 -2,007 7,448 2,814 3,639
China -87,931 -96,977 -103,708 -80,823 -79,914 -77,274 -308,869 -337,204 -380,804
France -2,865 -3,718 -3,135 -4,261 -5,417 -4,694 -12,365 -14,009 -13,421
Germany -16,341 -16,951 -16,477 -17,001 -16,490 -18,334 -67,135 -66,889 -67,372
Hong Kong 8,512 7,829 8,093 7,421 8,079 7,597 28,860 33,747 33,761
India -6,401 -6,329 -6,345 -6,678 -6,089 -7,541 -30,051 -27,514 -25,280
Italy -8,573 -8,663 -9,242 -9,487 -9,378 -9,833 -31,164 -34,651 -35,454
Japan -15,109 -13,569 -14,798 -15,575 -15,719 -14,935 -56,526 -57,211 -57,981
Korea, South -1,810 -2,423 -2,349 -4,500 -1,418 -2,326 -16,705 -9,512 -7,421
Mexico -17,447 -21,798 -21,567 -22,979 -26,250 -26,319 -62,022 -67,407 -78,580
Saudi Arabia 134 -1,570 -2,495 1,463 1,365 2,062 9,212 5,396 -3,084
Singapore 5,122 4,014 4,756 4,142 4,421 4,906 19,561 23,480 18,316
Taiwan -2,983 -2,087 -3,844 -5,072 -4,453 -5,421 -8,771 -14,314 -12,754
United Kingdom 4,669 3,698 4,512 5,680 3,342 4,562 14,798 15,646 18,629
All other countries -10,632 -12,039 -14,279 -16,783 -16,971 -19,621 -10,789 -31,658 -51,615
CAFTA-DR n.a. n.a. n.a. n.a. n.a. n.a. n.a. n.a. n.a.
European Union -25,765 -30,518 -31,323 -27,455 -33,331 -34,285 -92,512 -101,180 -114,625
OPEC 28 -499 1,169 5,354 4,403 6,526 16,667 9,098 1,254
South/Central America 22,370 20,506 21,081 20,443 21,567 21,602 68,094 79,926 84,427
Brazil 16,928 16,799 16,407 17,327 17,318 16,765 53,766 64,079 67,599
Canada 91,217 90,956 89,980 90,760 89,263 89,844 321,678 341,308 364,515
China 48,294 44,669 36,550 41,559 42,496 42,536 170,395 186,288 177,969
France 15,257 14,264 14,731 15,585 14,857 14,164 51,176 53,342 57,892
Germany 23,243 22,966 23,231 24,154 23,559 24,293 81,383 86,473 92,447
Hong Kong 13,015 12,173 12,283 11,520 11,978 11,416 45,514 51,249 51,046
India 14,360 14,863 15,198 15,761 15,686 13,846 42,243 49,330 58,767
Italy 8,496 8,429 8,240 8,414 8,212 8,811 25,661 27,833 32,881
Japan 29,977 30,424 31,275 30,560 31,096 30,771 108,823 114,285 121,156
Korea, South 19,359 19,970 21,136 19,420 20,398 20,007 64,636 73,157 79,919
Mexico 75,462 75,496 74,244 74,430 73,667 72,795 261,933 276,563 299,802
Saudi Arabia 6,081 5,503 5,270 6,210 5,239 5,382 27,381 25,544 22,647
Singapore 14,410 13,367 13,678 13,195 13,780 13,719 44,577 50,503 54,125
Taiwan 10,140 11,296 10,559 10,440 10,709 10,382 38,176 36,205 41,302
United Kingdom 34,448 34,587 35,860 36,761 34,802 36,475 122,267 126,576 140,762
All other countries 209,711 211,218 212,890 211,617 212,521 213,352 756,231 789,811 838,481
CAFTA-DR n.a. n.a. n.a. n.a. n.a. n.a. n.a. n.a. n.a.
European Union 143,884 143,623 144,713 152,098 148,674 151,681 506,085 529,092 573,776
OPEC 24,061 22,725 24,657 21,386 19,867 19,789 106,184 92,093 93,896
South/Central America 72,000 71,192 73,248 71,447 71,517 69,784 252,713 273,040 287,616
Brazil 8,704 9,198 9,100 9,414 9,704 8,745 32,230 34,917 35,858
Canada 91,270 92,560 88,265 86,890 92,435 91,852 314,230 338,494 360,876
China 136,226 141,646 140,258 122,381 122,409 119,810 479,264 523,492 558,772
France 18,122 17,982 17,866 19,846 20,273 18,858 63,541 67,351 71,313
Germany 39,584 39,917 39,708 41,155 40,049 42,627 148,518 153,362 159,819
Hong Kong 4,504 4,344 4,191 4,099 3,899 3,820 16,654 17,502 17,285
India 20,761 21,192 21,543 22,439 21,775 21,387 72,294 76,844 84,047
Italy 17,068 17,092 17,483 17,901 17,590 18,645 56,825 62,484 68,335
Japan 45,086 43,994 46,073 46,134 46,815 45,706 165,348 171,495 179,137
Korea, South 21,169 22,393 23,485 23,920 21,816 22,333 81,341 82,669 87,341
Mexico 92,909 97,294 95,811 97,409 99,917 99,114 323,955 343,970 378,382
Saudi Arabia 5,947 7,073 7,766 4,748 3,874 3,320 18,170 20,148 25,731
Singapore 9,288 9,352 8,921 9,053 9,359 8,813 25,016 27,023 35,809
Taiwan 13,122 13,383 14,403 15,512 15,162 15,802 46,947 50,519 54,056
United Kingdom 29,779 30,889 31,347 31,081 31,460 31,912 107,468 110,930 122,133
All other countries 220,342 223,258 227,169 228,400 229,492 232,974 767,020 821,469 890,096
CAFTA-DR n.a. n.a. n.a. n.a. n.a. n.a. n.a. n.a. n.a.
European Union 169,649 174,140 176,036 179,553 182,004 185,966 598,597 630,271 688,401
OPEC 24,033 23,224 23,488 16,032 15,464 13,264 89,517 82,996 92,642
South/Central America 49,629 50,686 52,167 51,004 49,950 48,183 184,619 193,114 203,189
n.a. Not available
NOTES:
* Countries may be included in more than one area. For a list of countries in each area and for additional information on country and area
detail for goods on a BOP basis and for services, see the explanatory notes in this release or at www.census.gov/ft900 or
www.bea.gov/data/intl-trade-investment/international-trade-goods-and-services.
* Area data reflect the composition of the areas at the time of reporting.
* Seasonally adjusted country and area data in this exhibit will not sum to the seasonally adjusted totals shown in Part A of this release. Data
users should use caution drawing comparisons between the two sets of seasonally adjusted series.
* For information on data sources, nonsampling errors, and definitions, see the explanatory notes in this release or at
www.census.gov/ft900 or www.bea.gov/data/intl-trade-investment/international-trade-goods-and-services.
Imports
Part C: Seasonally Adjusted (by Geography)
Exhibit 20. U.S. Trade in Goods and Services by Selected Countries and Areas - BOP BasisIn millions of dollars. (-) Represents zero or less than one-half of measurement shown.
Balance
Exports
– 39 –
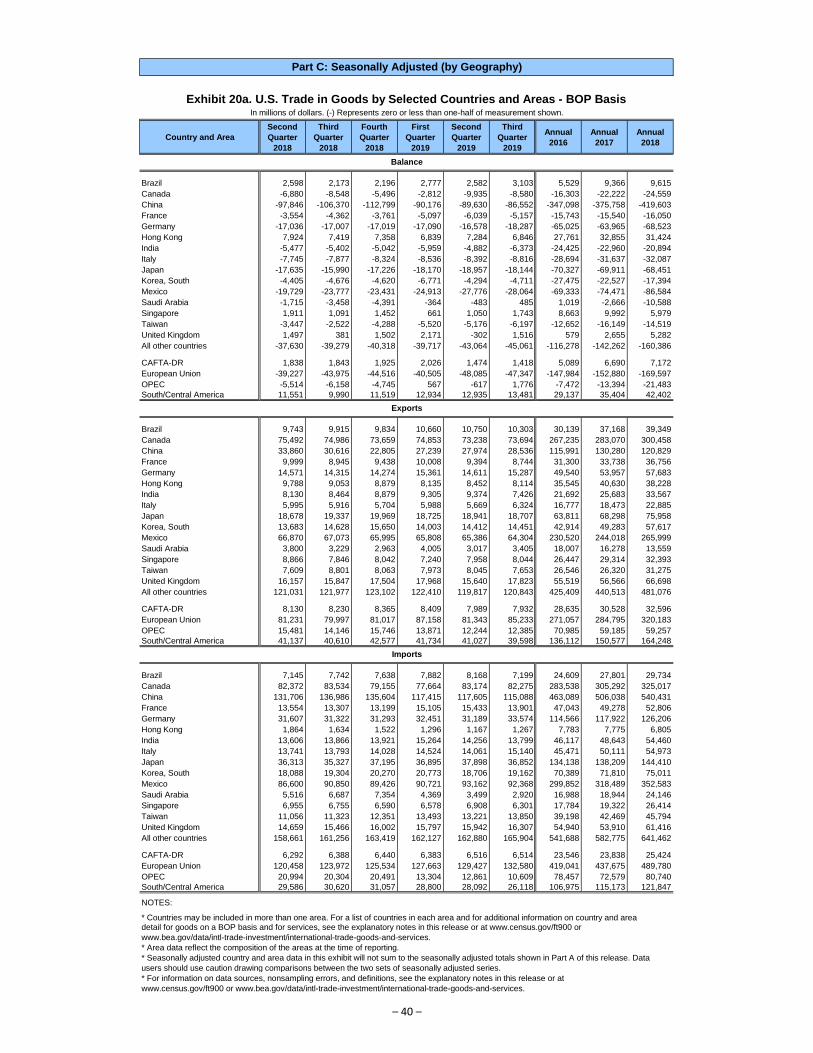
Country and Area
Second
Quarter
2018
Third
Quarter
2018
Fourth
Quarter
2018
First
Quarter
2019
Second
Quarter
2019
Third
Quarter
2019
Annual
2016
Annual
2017
Annual
2018
Brazil 2,598 2,173 2,196 2,777 2,582 3,103 5,529 9,366 9,615
Canada -6,880 -8,548 -5,496 -2,812 -9,935 -8,580 -16,303 -22,222 -24,559
China -97,846 -106,370 -112,799 -90,176 -89,630 -86,552 -347,098 -375,758 -419,603
France -3,554 -4,362 -3,761 -5,097 -6,039 -5,157 -15,743 -15,540 -16,050
Germany -17,036 -17,007 -17,019 -17,090 -16,578 -18,287 -65,025 -63,965 -68,523
Hong Kong 7,924 7,419 7,358 6,839 7,284 6,846 27,761 32,855 31,424
India -5,477 -5,402 -5,042 -5,959 -4,882 -6,373 -24,425 -22,960 -20,894
Italy -7,745 -7,877 -8,324 -8,536 -8,392 -8,816 -28,694 -31,637 -32,087
Japan -17,635 -15,990 -17,226 -18,170 -18,957 -18,144 -70,327 -69,911 -68,451
Korea, South -4,405 -4,676 -4,620 -6,771 -4,294 -4,711 -27,475 -22,527 -17,394
Mexico -19,729 -23,777 -23,431 -24,913 -27,776 -28,064 -69,333 -74,471 -86,584
Saudi Arabia -1,715 -3,458 -4,391 -364 -483 485 1,019 -2,666 -10,588
Singapore 1,911 1,091 1,452 661 1,050 1,743 8,663 9,992 5,979
Taiwan -3,447 -2,522 -4,288 -5,520 -5,176 -6,197 -12,652 -16,149 -14,519
United Kingdom 1,497 381 1,502 2,171 -302 1,516 579 2,655 5,282
All other countries -37,630 -39,279 -40,318 -39,717 -43,064 -45,061 -116,278 -142,262 -160,386
CAFTA-DR 1,838 1,843 1,925 2,026 1,474 1,418 5,089 6,690 7,172
European Union -39,227 -43,975 -44,516 -40,505 -48,085 -47,347 -147,984 -152,880 -169,597
OPEC -5,514 -6,158 -4,745 567 -617 1,776 -7,472 -13,394 -21,483
South/Central America 11,551 9,990 11,519 12,934 12,935 13,481 29,137 35,404 42,402
Brazil 9,743 9,915 9,834 10,660 10,750 10,303 30,139 37,168 39,349
Canada 75,492 74,986 73,659 74,853 73,238 73,694 267,235 283,070 300,458
China 33,860 30,616 22,805 27,239 27,974 28,536 115,991 130,280 120,829
France 9,999 8,945 9,438 10,008 9,394 8,744 31,300 33,738 36,756
Germany 14,571 14,315 14,274 15,361 14,611 15,287 49,540 53,957 57,683
Hong Kong 9,788 9,053 8,879 8,135 8,452 8,114 35,545 40,630 38,228
India 8,130 8,464 8,879 9,305 9,374 7,426 21,692 25,683 33,567
Italy 5,995 5,916 5,704 5,988 5,669 6,324 16,777 18,473 22,885
Japan 18,678 19,337 19,969 18,725 18,941 18,707 63,811 68,298 75,958
Korea, South 13,683 14,628 15,650 14,003 14,412 14,451 42,914 49,283 57,617
Mexico 66,870 67,073 65,995 65,808 65,386 64,304 230,520 244,018 265,999
Saudi Arabia 3,800 3,229 2,963 4,005 3,017 3,405 18,007 16,278 13,559
Singapore 8,866 7,846 8,042 7,240 7,958 8,044 26,447 29,314 32,393
Taiwan 7,609 8,801 8,063 7,973 8,045 7,653 26,546 26,320 31,275
United Kingdom 16,157 15,847 17,504 17,968 15,640 17,823 55,519 56,566 66,698
All other countries 121,031 121,977 123,102 122,410 119,817 120,843 425,409 440,513 481,076
CAFTA-DR 8,130 8,230 8,365 8,409 7,989 7,932 28,635 30,528 32,596
European Union 81,231 79,997 81,017 87,158 81,343 85,233 271,057 284,795 320,183
OPEC 15,481 14,146 15,746 13,871 12,244 12,385 70,985 59,185 59,257
South/Central America 41,137 40,610 42,577 41,734 41,027 39,598 136,112 150,577 164,248
Brazil 7,145 7,742 7,638 7,882 8,168 7,199 24,609 27,801 29,734
Canada 82,372 83,534 79,155 77,664 83,174 82,275 283,538 305,292 325,017
China 131,706 136,986 135,604 117,415 117,605 115,088 463,089 506,038 540,431
France 13,554 13,307 13,199 15,105 15,433 13,901 47,043 49,278 52,806
Germany 31,607 31,322 31,293 32,451 31,189 33,574 114,566 117,922 126,206
Hong Kong 1,864 1,634 1,522 1,296 1,167 1,267 7,783 7,775 6,805
India 13,606 13,866 13,921 15,264 14,256 13,799 46,117 48,643 54,460
Italy 13,741 13,793 14,028 14,524 14,061 15,140 45,471 50,111 54,973
Japan 36,313 35,327 37,195 36,895 37,898 36,852 134,138 138,209 144,410
Korea, South 18,088 19,304 20,270 20,773 18,706 19,162 70,389 71,810 75,011
Mexico 86,600 90,850 89,426 90,721 93,162 92,368 299,852 318,489 352,583
Saudi Arabia 5,516 6,687 7,354 4,369 3,499 2,920 16,988 18,944 24,146
Singapore 6,955 6,755 6,590 6,578 6,908 6,301 17,784 19,322 26,414
Taiwan 11,056 11,323 12,351 13,493 13,221 13,850 39,198 42,469 45,794
United Kingdom 14,659 15,466 16,002 15,797 15,942 16,307 54,940 53,910 61,416
All other countries 158,661 161,256 163,419 162,127 162,880 165,904 541,688 582,775 641,462
CAFTA-DR 6,292 6,388 6,440 6,383 6,516 6,514 23,546 23,838 25,424
European Union 120,458 123,972 125,534 127,663 129,427 132,580 419,041 437,675 489,780
OPEC 20,994 20,304 20,491 13,304 12,861 10,609 78,457 72,579 80,740
South/Central America 29,586 30,620 31,057 28,800 28,092 26,118 106,975 115,173 121,847
NOTES:
* Countries may be included in more than one area. For a list of countries in each area and for additional information on country and areadetail for goods on a BOP basis and for services, see the explanatory notes in this release or at www.census.gov/ft900 or
www.bea.gov/data/intl-trade-investment/international-trade-goods-and-services.
* Area data reflect the composition of the areas at the time of reporting.
* Seasonally adjusted country and area data in this exhibit will not sum to the seasonally adjusted totals shown in Part A of this release. Data
users should use caution drawing comparisons between the two sets of seasonally adjusted series.
* For information on data sources, nonsampling errors, and definitions, see the explanatory notes in this release or at
www.census.gov/ft900 or www.bea.gov/data/intl-trade-investment/international-trade-goods-and-services.
Imports
Part C: Seasonally Adjusted (by Geography)
Exhibit 20a. U.S. Trade in Goods by Selected Countries and Areas - BOP BasisIn millions of dollars. (-) Represents zero or less than one-half of measurement shown.
Balance
Exports
– 40 –
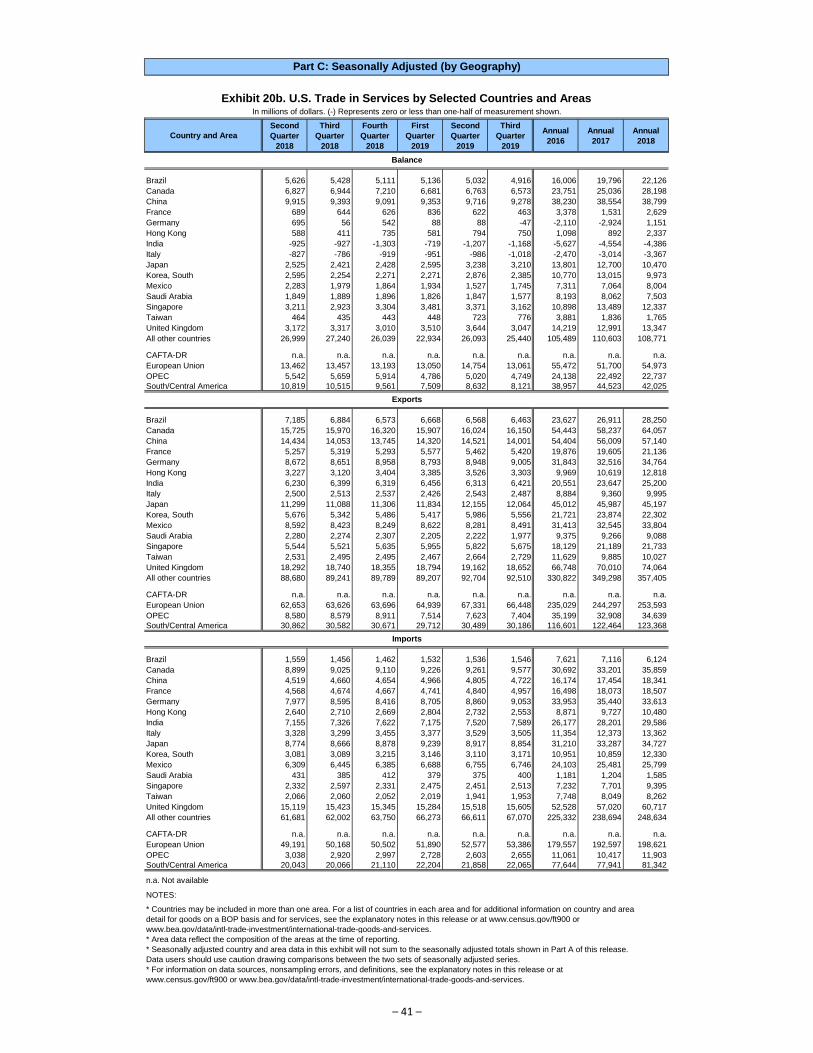
Country and Area
Second
Quarter
2018
Third
Quarter
2018
Fourth
Quarter
2018
First
Quarter
2019
Second
Quarter
2019
Third
Quarter
2019
Annual
2016
Annual
2017
Annual
2018
Brazil 5,626 5,428 5,111 5,136 5,032 4,916 16,006 19,796 22,126
Canada 6,827 6,944 7,210 6,681 6,763 6,573 23,751 25,036 28,198
China 9,915 9,393 9,091 9,353 9,716 9,278 38,230 38,554 38,799
France 689 644 626 836 622 463 3,378 1,531 2,629
Germany 695 56 542 88 88 -47 -2,110 -2,924 1,151
Hong Kong 588 411 735 581 794 750 1,098 892 2,337
India -925 -927 -1,303 -719 -1,207 -1,168 -5,627 -4,554 -4,386
Italy -827 -786 -919 -951 -986 -1,018 -2,470 -3,014 -3,367
Japan 2,525 2,421 2,428 2,595 3,238 3,210 13,801 12,700 10,470
Korea, South 2,595 2,254 2,271 2,271 2,876 2,385 10,770 13,015 9,973
Mexico 2,283 1,979 1,864 1,934 1,527 1,745 7,311 7,064 8,004
Saudi Arabia 1,849 1,889 1,896 1,826 1,847 1,577 8,193 8,062 7,503
Singapore 3,211 2,923 3,304 3,481 3,371 3,162 10,898 13,489 12,337
Taiwan 464 435 443 448 723 776 3,881 1,836 1,765
United Kingdom 3,172 3,317 3,010 3,510 3,644 3,047 14,219 12,991 13,347
All other countries 26,999 27,240 26,039 22,934 26,093 25,440 105,489 110,603 108,771
CAFTA-DR n.a. n.a. n.a. n.a. n.a. n.a. n.a. n.a. n.a.
European Union 13,462 13,457 13,193 13,050 14,754 13,061 55,472 51,700 54,973
OPEC 5,542 5,659 5,914 4,786 5,020 4,749 24,138 22,492 22,737
South/Central America 10,819 10,515 9,561 7,509 8,632 8,121 38,957 44,523 42,025
Brazil 7,185 6,884 6,573 6,668 6,568 6,463 23,627 26,911 28,250
Canada 15,725 15,970 16,320 15,907 16,024 16,150 54,443 58,237 64,057
China 14,434 14,053 13,745 14,320 14,521 14,001 54,404 56,009 57,140
France 5,257 5,319 5,293 5,577 5,462 5,420 19,876 19,605 21,136
Germany 8,672 8,651 8,958 8,793 8,948 9,005 31,843 32,516 34,764
Hong Kong 3,227 3,120 3,404 3,385 3,526 3,303 9,969 10,619 12,818
India 6,230 6,399 6,319 6,456 6,313 6,421 20,551 23,647 25,200
Italy 2,500 2,513 2,537 2,426 2,543 2,487 8,884 9,360 9,995
Japan 11,299 11,088 11,306 11,834 12,155 12,064 45,012 45,987 45,197
Korea, South 5,676 5,342 5,486 5,417 5,986 5,556 21,721 23,874 22,302
Mexico 8,592 8,423 8,249 8,622 8,281 8,491 31,413 32,545 33,804
Saudi Arabia 2,280 2,274 2,307 2,205 2,222 1,977 9,375 9,266 9,088
Singapore 5,544 5,521 5,635 5,955 5,822 5,675 18,129 21,189 21,733
Taiwan 2,531 2,495 2,495 2,467 2,664 2,729 11,629 9,885 10,027
United Kingdom 18,292 18,740 18,355 18,794 19,162 18,652 66,748 70,010 74,064
All other countries 88,680 89,241 89,789 89,207 92,704 92,510 330,822 349,298 357,405
CAFTA-DR n.a. n.a. n.a. n.a. n.a. n.a. n.a. n.a. n.a.
European Union 62,653 63,626 63,696 64,939 67,331 66,448 235,029 244,297 253,593
OPEC 8,580 8,579 8,911 7,514 7,623 7,404 35,199 32,908 34,639
South/Central America 30,862 30,582 30,671 29,712 30,489 30,186 116,601 122,464 123,368
Brazil 1,559 1,456 1,462 1,532 1,536 1,546 7,621 7,116 6,124
Canada 8,899 9,025 9,110 9,226 9,261 9,577 30,692 33,201 35,859
China 4,519 4,660 4,654 4,966 4,805 4,722 16,174 17,454 18,341
France 4,568 4,674 4,667 4,741 4,840 4,957 16,498 18,073 18,507
Germany 7,977 8,595 8,416 8,705 8,860 9,053 33,953 35,440 33,613
Hong Kong 2,640 2,710 2,669 2,804 2,732 2,553 8,871 9,727 10,480
India 7,155 7,326 7,622 7,175 7,520 7,589 26,177 28,201 29,586
Italy 3,328 3,299 3,455 3,377 3,529 3,505 11,354 12,373 13,362
Japan 8,774 8,666 8,878 9,239 8,917 8,854 31,210 33,287 34,727
Korea, South 3,081 3,089 3,215 3,146 3,110 3,171 10,951 10,859 12,330
Mexico 6,309 6,445 6,385 6,688 6,755 6,746 24,103 25,481 25,799
Saudi Arabia 431 385 412 379 375 400 1,181 1,204 1,585
Singapore 2,332 2,597 2,331 2,475 2,451 2,513 7,232 7,701 9,395
Taiwan 2,066 2,060 2,052 2,019 1,941 1,953 7,748 8,049 8,262
United Kingdom 15,119 15,423 15,345 15,284 15,518 15,605 52,528 57,020 60,717
All other countries 61,681 62,002 63,750 66,273 66,611 67,070 225,332 238,694 248,634
CAFTA-DR n.a. n.a. n.a. n.a. n.a. n.a. n.a. n.a. n.a.
European Union 49,191 50,168 50,502 51,890 52,577 53,386 179,557 192,597 198,621
OPEC 3,038 2,920 2,997 2,728 2,603 2,655 11,061 10,417 11,903
South/Central America 20,043 20,066 21,110 22,204 21,858 22,065 77,644 77,941 81,342
n.a. Not available
NOTES:
* Countries may be included in more than one area. For a list of countries in each area and for additional information on country and area
detail for goods on a BOP basis and for services, see the explanatory notes in this release or at www.census.gov/ft900 or
www.bea.gov/data/intl-trade-investment/international-trade-goods-and-services.
* Area data reflect the composition of the areas at the time of reporting.
* Seasonally adjusted country and area data in this exhibit will not sum to the seasonally adjusted totals shown in Part A of this release.
Data users should use caution drawing comparisons between the two sets of seasonally adjusted series.
* For information on data sources, nonsampling errors, and definitions, see the explanatory notes in this release or at
www.census.gov/ft900 or www.bea.gov/data/intl-trade-investment/international-trade-goods-and-services.
Imports
Part C: Seasonally Adjusted (by Geography)
Exhibit 20b. U.S. Trade in Services by Selected Countries and AreasIn millions of dollars. (-) Represents zero or less than one-half of measurement shown.
Balance
Exports
– 41 –
Goods Data Inquiries Goods Media Inquiries U.S. Census Bureau U.S. Census Bureau Economic Indicators Division, International Trade Public Information Office 301-763-2311 301-763-3030 [email protected] [email protected]
FOR RELEASE AT 8:30 AM EST, January 7, 2020
MONTHLY U.S. INTERNATIONAL TRADE IN GOODS AND SERVICES, NOVEMBER 2019, SUPPLEMENT
Release Number: CB 20-03
– 42 –
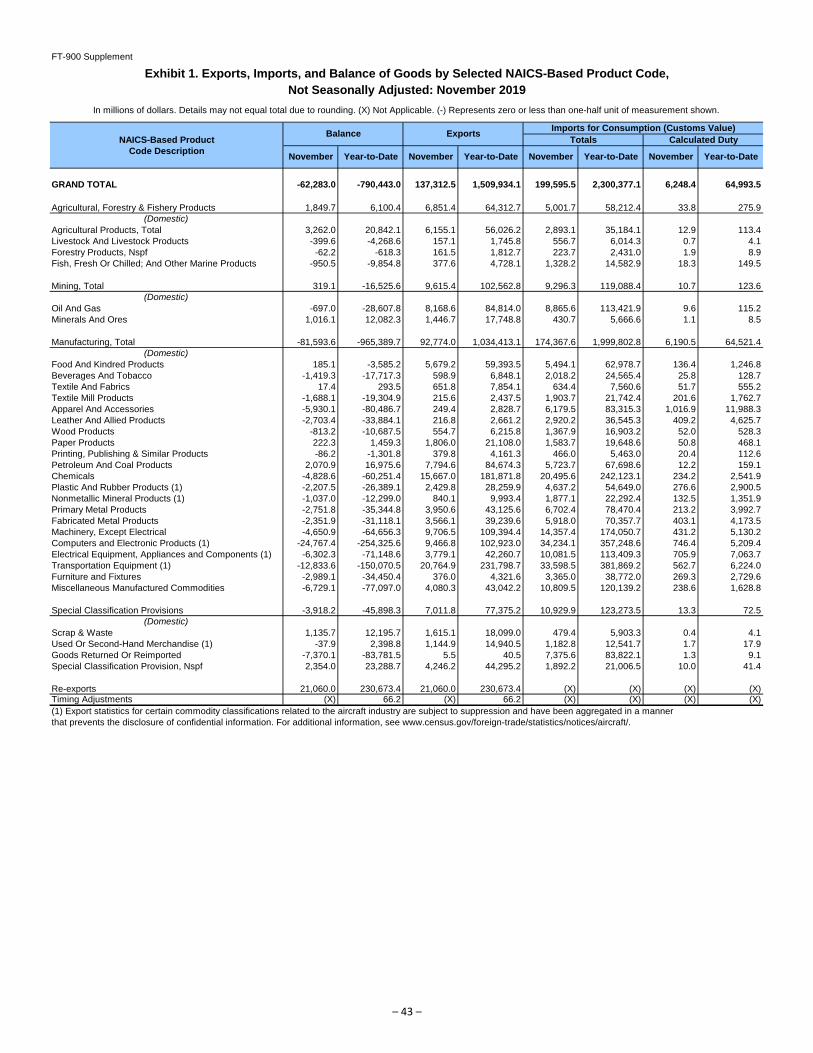
FT-900 Supplement
Exhibit 1. Exports, Imports, and Balance of Goods by Selected NAICS-Based Product Code,
Not Seasonally Adjusted: November 2019
Imports for Consumption (Customs Value)
NAICS-Based Product Totals Calculated Duty
Code Description
GRAND TOTAL -62,283.0 -790,443.0 137,312.5 1,509,934.1 199,595.5 2,300,377.1 6,248.4 64,993.5
Agricultural, Forestry & Fishery Products 1,849.7 6,100.4 6,851.4 64,312.7 5,001.7 58,212.4 33.8 275.9
(Domestic)
Agricultural Products, Total 3,262.0 20,842.1 6,155.1 56,026.2 2,893.1 35,184.1 12.9 113.4
Livestock And Livestock Products -399.6 -4,268.6 157.1 1,745.8 556.7 6,014.3 0.7 4.1
Forestry Products, Nspf -62.2 -618.3 161.5 1,812.7 223.7 2,431.0 1.9 8.9
Fish, Fresh Or Chilled; And Other Marine Products -950.5 -9,854.8 377.6 4,728.1 1,328.2 14,582.9 18.3 149.5
Mining, Total 319.1 -16,525.6 9,615.4 102,562.8 9,296.3 119,088.4 10.7 123.6
(Domestic)
Oil And Gas -697.0 -28,607.8 8,168.6 84,814.0 8,865.6 113,421.9 9.6 115.2
Minerals And Ores 1,016.1 12,082.3 1,446.7 17,748.8 430.7 5,666.6 1.1 8.5
Manufacturing, Total -81,593.6 -965,389.7 92,774.0 1,034,413.1 174,367.6 1,999,802.8 6,190.5 64,521.4
(Domestic)
Food And Kindred Products 185.1 -3,585.2 5,679.2 59,393.5 5,494.1 62,978.7 136.4 1,246.8
Beverages And Tobacco -1,419.3 -17,717.3 598.9 6,848.1 2,018.2 24,565.4 25.8 128.7
Textile And Fabrics 17.4 293.5 651.8 7,854.1 634.4 7,560.6 51.7 555.2
Textile Mill Products -1,688.1 -19,304.9 215.6 2,437.5 1,903.7 21,742.4 201.6 1,762.7
Apparel And Accessories -5,930.1 -80,486.7 249.4 2,828.7 6,179.5 83,315.3 1,016.9 11,988.3
Leather And Allied Products -2,703.4 -33,884.1 216.8 2,661.2 2,920.2 36,545.3 409.2 4,625.7
Wood Products -813.2 -10,687.5 554.7 6,215.8 1,367.9 16,903.2 52.0 528.3
Paper Products 222.3 1,459.3 1,806.0 21,108.0 1,583.7 19,648.6 50.8 468.1
Printing, Publishing & Similar Products -86.2 -1,301.8 379.8 4,161.3 466.0 5,463.0 20.4 112.6
Petroleum And Coal Products 2,070.9 16,975.6 7,794.6 84,674.3 5,723.7 67,698.6 12.2 159.1
Chemicals -4,828.6 -60,251.4 15,667.0 181,871.8 20,495.6 242,123.1 234.2 2,541.9
Plastic And Rubber Products (1) -2,207.5 -26,389.1 2,429.8 28,259.9 4,637.2 54,649.0 276.6 2,900.5
Nonmetallic Mineral Products (1) -1,037.0 -12,299.0 840.1 9,993.4 1,877.1 22,292.4 132.5 1,351.9
Primary Metal Products -2,751.8 -35,344.8 3,950.6 43,125.6 6,702.4 78,470.4 213.2 3,992.7
Fabricated Metal Products -2,351.9 -31,118.1 3,566.1 39,239.6 5,918.0 70,357.7 403.1 4,173.5
Machinery, Except Electrical -4,650.9 -64,656.3 9,706.5 109,394.4 14,357.4 174,050.7 431.2 5,130.2
Computers and Electronic Products (1) -24,767.4 -254,325.6 9,466.8 102,923.0 34,234.1 357,248.6 746.4 5,209.4
Electrical Equipment, Appliances and Components (1) -6,302.3 -71,148.6 3,779.1 42,260.7 10,081.5 113,409.3 705.9 7,063.7
Transportation Equipment (1) -12,833.6 -150,070.5 20,764.9 231,798.7 33,598.5 381,869.2 562.7 6,224.0
Furniture and Fixtures -2,989.1 -34,450.4 376.0 4,321.6 3,365.0 38,772.0 269.3 2,729.6
Miscellaneous Manufactured Commodities -6,729.1 -77,097.0 4,080.3 43,042.2 10,809.5 120,139.2 238.6 1,628.8
Special Classification Provisions -3,918.2 -45,898.3 7,011.8 77,375.2 10,929.9 123,273.5 13.3 72.5
(Domestic)
Scrap & Waste 1,135.7 12,195.7 1,615.1 18,099.0 479.4 5,903.3 0.4 4.1
Used Or Second-Hand Merchandise (1) -37.9 2,398.8 1,144.9 14,940.5 1,182.8 12,541.7 1.7 17.9
Goods Returned Or Reimported -7,370.1 -83,781.5 5.5 40.5 7,375.6 83,822.1 1.3 9.1
Special Classification Provision, Nspf 2,354.0 23,288.7 4,246.2 44,295.2 1,892.2 21,006.5 10.0 41.4
Re-exports 21,060.0 230,673.4 21,060.0 230,673.4 (X) (X) (X) (X)Timing Adjustments (X) 66.2 (X) 66.2 (X) (X) (X) (X)
(1) Export statistics for certain commodity classifications related to the aircraft industry are subject to suppression and have been aggregated in a manner
that prevents the disclosure of confidential information. For additional information, see www.census.gov/foreign-trade/statistics/notices/aircraft/.
Year-to-Date
In millions of dollars. Details may not equal total due to rounding. (X) Not Applicable. (-) Represents zero or less than one-half unit of measurement shown.
Balance Exports
November Year-to-Date November Year-to-Date November Year-to-Date November
– 43 –
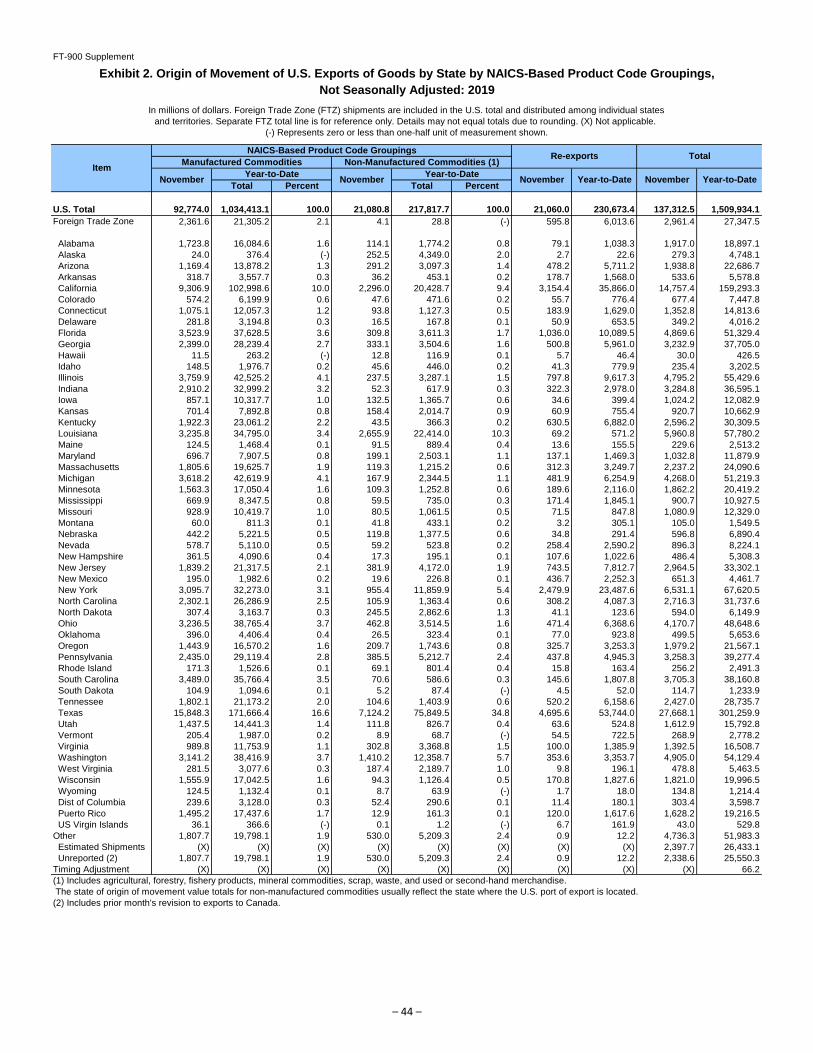
FT-900 Supplement
Exhibit 2. Origin of Movement of U.S. Exports of Goods by State by NAICS-Based Product Code Groupings,
Not Seasonally Adjusted: 2019
In millions of dollars. Foreign Trade Zone (FTZ) shipments are included in the U.S. total and distributed among individual states
and territories. Separate FTZ total line is for reference only. Details may not equal totals due to rounding. (X) Not applicable.
(-) Represents zero or less than one-half unit of measurement shown.
NAICS-Based Product Code Groupings
Manufactured Commodities Non-Manufactured Commodities (1)
Year-to-Date Year-to-Date
Total Percent Total Percent
U.S. Total 92,774.0 1,034,413.1 100.0 21,080.8 217,817.7 100.0 21,060.0 230,673.4 137,312.5 1,509,934.1
Foreign Trade Zone 2,361.6 21,305.2 2.1 4.1 28.8 (-) 595.8 6,013.6 2,961.4 27,347.5
Alabama 1,723.8 16,084.6 1.6 114.1 1,774.2 0.8 79.1 1,038.3 1,917.0 18,897.1
Alaska 24.0 376.4 (-) 252.5 4,349.0 2.0 2.7 22.6 279.3 4,748.1
Arizona 1,169.4 13,878.2 1.3 291.2 3,097.3 1.4 478.2 5,711.2 1,938.8 22,686.7
Arkansas 318.7 3,557.7 0.3 36.2 453.1 0.2 178.7 1,568.0 533.6 5,578.8
California 9,306.9 102,998.6 10.0 2,296.0 20,428.7 9.4 3,154.4 35,866.0 14,757.4 159,293.3
Colorado 574.2 6,199.9 0.6 47.6 471.6 0.2 55.7 776.4 677.4 7,447.8
Connecticut 1,075.1 12,057.3 1.2 93.8 1,127.3 0.5 183.9 1,629.0 1,352.8 14,813.6
Delaware 281.8 3,194.8 0.3 16.5 167.8 0.1 50.9 653.5 349.2 4,016.2
Florida 3,523.9 37,628.5 3.6 309.8 3,611.3 1.7 1,036.0 10,089.5 4,869.6 51,329.4
Georgia 2,399.0 28,239.4 2.7 333.1 3,504.6 1.6 500.8 5,961.0 3,232.9 37,705.0
Hawaii 11.5 263.2 (-) 12.8 116.9 0.1 5.7 46.4 30.0 426.5
Idaho 148.5 1,976.7 0.2 45.6 446.0 0.2 41.3 779.9 235.4 3,202.5
Illinois 3,759.9 42,525.2 4.1 237.5 3,287.1 1.5 797.8 9,617.3 4,795.2 55,429.6
Indiana 2,910.2 32,999.2 3.2 52.3 617.9 0.3 322.3 2,978.0 3,284.8 36,595.1
Iowa 857.1 10,317.7 1.0 132.5 1,365.7 0.6 34.6 399.4 1,024.2 12,082.9
Kansas 701.4 7,892.8 0.8 158.4 2,014.7 0.9 60.9 755.4 920.7 10,662.9
Kentucky 1,922.3 23,061.2 2.2 43.5 366.3 0.2 630.5 6,882.0 2,596.2 30,309.5
Louisiana 3,235.8 34,795.0 3.4 2,655.9 22,414.0 10.3 69.2 571.2 5,960.8 57,780.2
Maine 124.5 1,468.4 0.1 91.5 889.4 0.4 13.6 155.5 229.6 2,513.2
Maryland 696.7 7,907.5 0.8 199.1 2,503.1 1.1 137.1 1,469.3 1,032.8 11,879.9
Massachusetts 1,805.6 19,625.7 1.9 119.3 1,215.2 0.6 312.3 3,249.7 2,237.2 24,090.6
Michigan 3,618.2 42,619.9 4.1 167.9 2,344.5 1.1 481.9 6,254.9 4,268.0 51,219.3
Minnesota 1,563.3 17,050.4 1.6 109.3 1,252.8 0.6 189.6 2,116.0 1,862.2 20,419.2
Mississippi 669.9 8,347.5 0.8 59.5 735.0 0.3 171.4 1,845.1 900.7 10,927.5
Missouri 928.9 10,419.7 1.0 80.5 1,061.5 0.5 71.5 847.8 1,080.9 12,329.0
Montana 60.0 811.3 0.1 41.8 433.1 0.2 3.2 305.1 105.0 1,549.5
Nebraska 442.2 5,221.5 0.5 119.8 1,377.5 0.6 34.8 291.4 596.8 6,890.4
Nevada 578.7 5,110.0 0.5 59.2 523.8 0.2 258.4 2,590.2 896.3 8,224.1
New Hampshire 361.5 4,090.6 0.4 17.3 195.1 0.1 107.6 1,022.6 486.4 5,308.3
New Jersey 1,839.2 21,317.5 2.1 381.9 4,172.0 1.9 743.5 7,812.7 2,964.5 33,302.1
New Mexico 195.0 1,982.6 0.2 19.6 226.8 0.1 436.7 2,252.3 651.3 4,461.7
New York 3,095.7 32,273.0 3.1 955.4 11,859.9 5.4 2,479.9 23,487.6 6,531.1 67,620.5
North Carolina 2,302.1 26,286.9 2.5 105.9 1,363.4 0.6 308.2 4,087.3 2,716.3 31,737.6
North Dakota 307.4 3,163.7 0.3 245.5 2,862.6 1.3 41.1 123.6 594.0 6,149.9
Ohio 3,236.5 38,765.4 3.7 462.8 3,514.5 1.6 471.4 6,368.6 4,170.7 48,648.6
Oklahoma 396.0 4,406.4 0.4 26.5 323.4 0.1 77.0 923.8 499.5 5,653.6
Oregon 1,443.9 16,570.2 1.6 209.7 1,743.6 0.8 325.7 3,253.3 1,979.2 21,567.1
Pennsylvania 2,435.0 29,119.4 2.8 385.5 5,212.7 2.4 437.8 4,945.3 3,258.3 39,277.4
Rhode Island 171.3 1,526.6 0.1 69.1 801.4 0.4 15.8 163.4 256.2 2,491.3
South Carolina 3,489.0 35,766.4 3.5 70.6 586.6 0.3 145.6 1,807.8 3,705.3 38,160.8
South Dakota 104.9 1,094.6 0.1 5.2 87.4 (-) 4.5 52.0 114.7 1,233.9
Tennessee 1,802.1 21,173.2 2.0 104.6 1,403.9 0.6 520.2 6,158.6 2,427.0 28,735.7
Texas 15,848.3 171,666.4 16.6 7,124.2 75,849.5 34.8 4,695.6 53,744.0 27,668.1 301,259.9
Utah 1,437.5 14,441.3 1.4 111.8 826.7 0.4 63.6 524.8 1,612.9 15,792.8
Vermont 205.4 1,987.0 0.2 8.9 68.7 (-) 54.5 722.5 268.9 2,778.2
Virginia 989.8 11,753.9 1.1 302.8 3,368.8 1.5 100.0 1,385.9 1,392.5 16,508.7
Washington 3,141.2 38,416.9 3.7 1,410.2 12,358.7 5.7 353.6 3,353.7 4,905.0 54,129.4
West Virginia 281.5 3,077.6 0.3 187.4 2,189.7 1.0 9.8 196.1 478.8 5,463.5
Wisconsin 1,555.9 17,042.5 1.6 94.3 1,126.4 0.5 170.8 1,827.6 1,821.0 19,996.5
Wyoming 124.5 1,132.4 0.1 8.7 63.9 (-) 1.7 18.0 134.8 1,214.4
Dist of Columbia 239.6 3,128.0 0.3 52.4 290.6 0.1 11.4 180.1 303.4 3,598.7
Puerto Rico 1,495.2 17,437.6 1.7 12.9 161.3 0.1 120.0 1,617.6 1,628.2 19,216.5
US Virgin Islands 36.1 366.6 (-) 0.1 1.2 (-) 6.7 161.9 43.0 529.8
Other 1,807.7 19,798.1 1.9 530.0 5,209.3 2.4 0.9 12.2 4,736.3 51,983.3
Estimated Shipments (X) (X) (X) (X) (X) (X) (X) (X) 2,397.7 26,433.1
Unreported (2) 1,807.7 19,798.1 1.9 530.0 5,209.3 2.4 0.9 12.2 2,338.6 25,550.3
Timing Adjustment (X) (X) (X) (X) (X) (X) (X) (X) (X) 66.2
(1) Includes agricultural, forestry, fishery products, mineral commodities, scrap, waste, and used or second-hand merchandise.
The state of origin of movement value totals for non-manufactured commodities usually reflect the state where the U.S. port of export is located.
(2) Includes prior month's revision to exports to Canada.
Item
Re-exports Total
November November November Year-to-Date November Year-to-Date
– 44 –
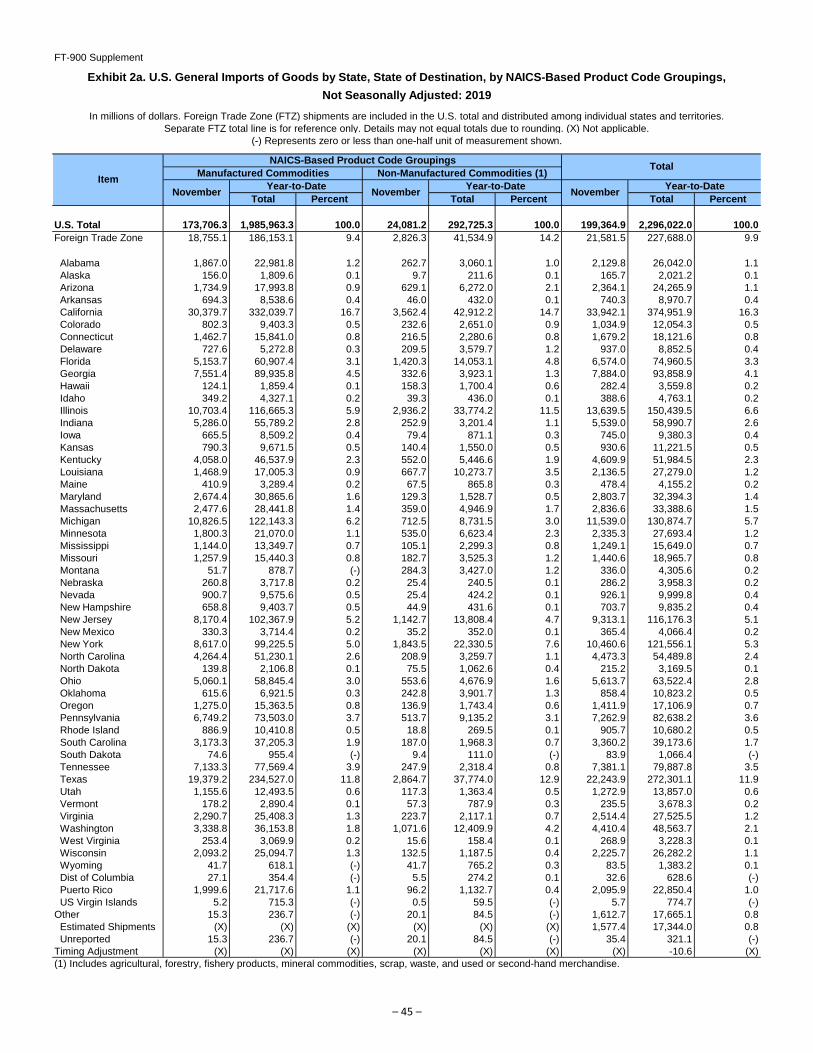
FT-900 Supplement
In millions of dollars. Foreign Trade Zone (FTZ) shipments are included in the U.S. total and distributed among individual states and territories.
Separate FTZ total line is for reference only. Details may not equal totals due to rounding. (X) Not applicable.
(-) Represents zero or less than one-half unit of measurement shown.
NAICS-Based Product Code Groupings
Manufactured Commodities Non-Manufactured Commodities (1)
Year-to-Date Year-to-Date Year-to-Date
Total Percent Total Percent Total Percent
U.S. Total 173,706.3 1,985,963.3 100.0 24,081.2 292,725.3 100.0 199,364.9 2,296,022.0 100.0
Foreign Trade Zone 18,755.1 186,153.1 9.4 2,826.3 41,534.9 14.2 21,581.5 227,688.0 9.9
Alabama 1,867.0 22,981.8 1.2 262.7 3,060.1 1.0 2,129.8 26,042.0 1.1
Alaska 156.0 1,809.6 0.1 9.7 211.6 0.1 165.7 2,021.2 0.1
Arizona 1,734.9 17,993.8 0.9 629.1 6,272.0 2.1 2,364.1 24,265.9 1.1
Arkansas 694.3 8,538.6 0.4 46.0 432.0 0.1 740.3 8,970.7 0.4
California 30,379.7 332,039.7 16.7 3,562.4 42,912.2 14.7 33,942.1 374,951.9 16.3
Colorado 802.3 9,403.3 0.5 232.6 2,651.0 0.9 1,034.9 12,054.3 0.5
Connecticut 1,462.7 15,841.0 0.8 216.5 2,280.6 0.8 1,679.2 18,121.6 0.8
Delaware 727.6 5,272.8 0.3 209.5 3,579.7 1.2 937.0 8,852.5 0.4
Florida 5,153.7 60,907.4 3.1 1,420.3 14,053.1 4.8 6,574.0 74,960.5 3.3
Georgia 7,551.4 89,935.8 4.5 332.6 3,923.1 1.3 7,884.0 93,858.9 4.1
Hawaii 124.1 1,859.4 0.1 158.3 1,700.4 0.6 282.4 3,559.8 0.2
Idaho 349.2 4,327.1 0.2 39.3 436.0 0.1 388.6 4,763.1 0.2
Illinois 10,703.4 116,665.3 5.9 2,936.2 33,774.2 11.5 13,639.5 150,439.5 6.6
Indiana 5,286.0 55,789.2 2.8 252.9 3,201.4 1.1 5,539.0 58,990.7 2.6
Iowa 665.5 8,509.2 0.4 79.4 871.1 0.3 745.0 9,380.3 0.4
Kansas 790.3 9,671.5 0.5 140.4 1,550.0 0.5 930.6 11,221.5 0.5
Kentucky 4,058.0 46,537.9 2.3 552.0 5,446.6 1.9 4,609.9 51,984.5 2.3
Louisiana 1,468.9 17,005.3 0.9 667.7 10,273.7 3.5 2,136.5 27,279.0 1.2
Maine 410.9 3,289.4 0.2 67.5 865.8 0.3 478.4 4,155.2 0.2
Maryland 2,674.4 30,865.6 1.6 129.3 1,528.7 0.5 2,803.7 32,394.3 1.4
Massachusetts 2,477.6 28,441.8 1.4 359.0 4,946.9 1.7 2,836.6 33,388.6 1.5
Michigan 10,826.5 122,143.3 6.2 712.5 8,731.5 3.0 11,539.0 130,874.7 5.7
Minnesota 1,800.3 21,070.0 1.1 535.0 6,623.4 2.3 2,335.3 27,693.4 1.2
Mississippi 1,144.0 13,349.7 0.7 105.1 2,299.3 0.8 1,249.1 15,649.0 0.7
Missouri 1,257.9 15,440.3 0.8 182.7 3,525.3 1.2 1,440.6 18,965.7 0.8
Montana 51.7 878.7 (-) 284.3 3,427.0 1.2 336.0 4,305.6 0.2
Nebraska 260.8 3,717.8 0.2 25.4 240.5 0.1 286.2 3,958.3 0.2
Nevada 900.7 9,575.6 0.5 25.4 424.2 0.1 926.1 9,999.8 0.4
New Hampshire 658.8 9,403.7 0.5 44.9 431.6 0.1 703.7 9,835.2 0.4
New Jersey 8,170.4 102,367.9 5.2 1,142.7 13,808.4 4.7 9,313.1 116,176.3 5.1
New Mexico 330.3 3,714.4 0.2 35.2 352.0 0.1 365.4 4,066.4 0.2
New York 8,617.0 99,225.5 5.0 1,843.5 22,330.5 7.6 10,460.6 121,556.1 5.3
North Carolina 4,264.4 51,230.1 2.6 208.9 3,259.7 1.1 4,473.3 54,489.8 2.4
North Dakota 139.8 2,106.8 0.1 75.5 1,062.6 0.4 215.2 3,169.5 0.1
Ohio 5,060.1 58,845.4 3.0 553.6 4,676.9 1.6 5,613.7 63,522.4 2.8
Oklahoma 615.6 6,921.5 0.3 242.8 3,901.7 1.3 858.4 10,823.2 0.5
Oregon 1,275.0 15,363.5 0.8 136.9 1,743.4 0.6 1,411.9 17,106.9 0.7
Pennsylvania 6,749.2 73,503.0 3.7 513.7 9,135.2 3.1 7,262.9 82,638.2 3.6
Rhode Island 886.9 10,410.8 0.5 18.8 269.5 0.1 905.7 10,680.2 0.5
South Carolina 3,173.3 37,205.3 1.9 187.0 1,968.3 0.7 3,360.2 39,173.6 1.7
South Dakota 74.6 955.4 (-) 9.4 111.0 (-) 83.9 1,066.4 (-)
Tennessee 7,133.3 77,569.4 3.9 247.9 2,318.4 0.8 7,381.1 79,887.8 3.5
Texas 19,379.2 234,527.0 11.8 2,864.7 37,774.0 12.9 22,243.9 272,301.1 11.9
Utah 1,155.6 12,493.5 0.6 117.3 1,363.4 0.5 1,272.9 13,857.0 0.6
Vermont 178.2 2,890.4 0.1 57.3 787.9 0.3 235.5 3,678.3 0.2
Virginia 2,290.7 25,408.3 1.3 223.7 2,117.1 0.7 2,514.4 27,525.5 1.2
Washington 3,338.8 36,153.8 1.8 1,071.6 12,409.9 4.2 4,410.4 48,563.7 2.1
West Virginia 253.4 3,069.9 0.2 15.6 158.4 0.1 268.9 3,228.3 0.1
Wisconsin 2,093.2 25,094.7 1.3 132.5 1,187.5 0.4 2,225.7 26,282.2 1.1
Wyoming 41.7 618.1 (-) 41.7 765.2 0.3 83.5 1,383.2 0.1
Dist of Columbia 27.1 354.4 (-) 5.5 274.2 0.1 32.6 628.6 (-)
Puerto Rico 1,999.6 21,717.6 1.1 96.2 1,132.7 0.4 2,095.9 22,850.4 1.0
US Virgin Islands 5.2 715.3 (-) 0.5 59.5 (-) 5.7 774.7 (-)
Other 15.3 236.7 (-) 20.1 84.5 (-) 1,612.7 17,665.1 0.8
Estimated Shipments (X) (X) (X) (X) (X) (X) 1,577.4 17,344.0 0.8
Unreported 15.3 236.7 (-) 20.1 84.5 (-) 35.4 321.1 (-)
Timing Adjustment (X) (X) (X) (X) (X) (X) (X) -10.6 (X)
(1) Includes agricultural, forestry, fishery products, mineral commodities, scrap, waste, and used or second-hand merchandise.
Exhibit 2a. U.S. General Imports of Goods by State, State of Destination, by NAICS-Based Product Code Groupings,
Not Seasonally Adjusted: 2019
Item
Total
November November November
– 45 –
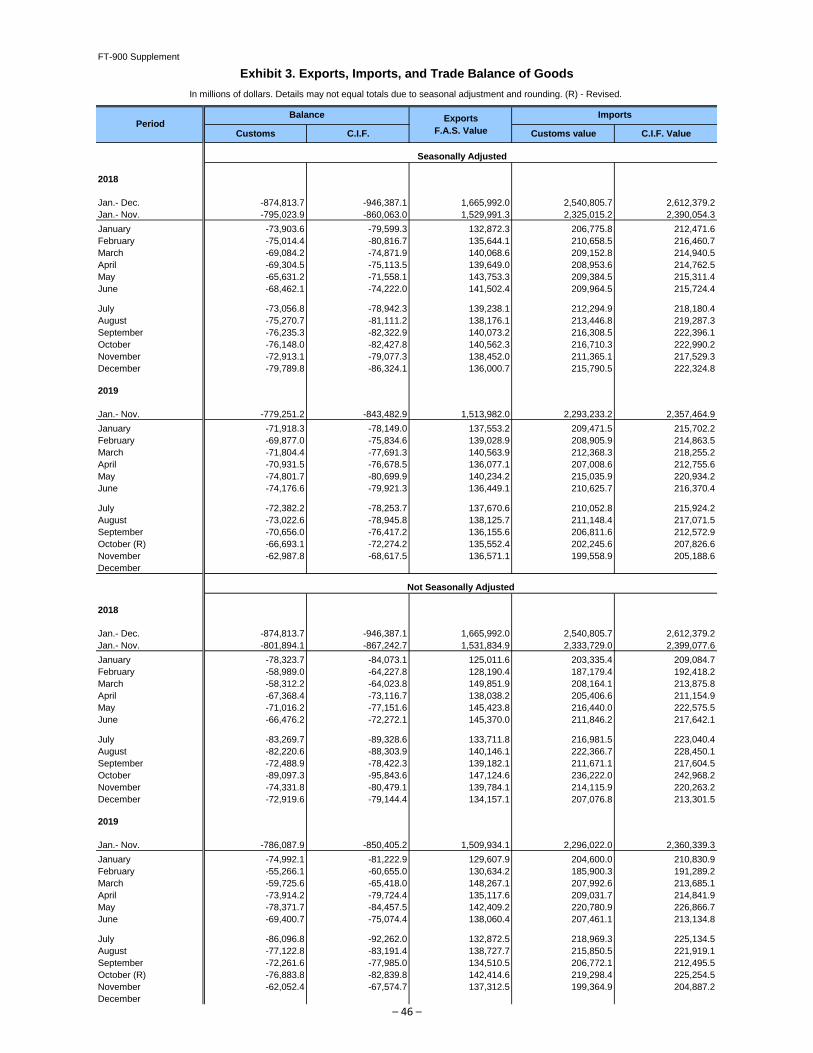
FT-900 Supplement
Exhibit 3. Exports, Imports, and Trade Balance of Goods
In millions of dollars. Details may not equal totals due to seasonal adjustment and rounding. (R) - Revised.
Exports
Customs C.I.F. F.A.S. Value Customs value C.I.F. Value
Seasonally Adjusted
2018
Jan.- Dec. -874,813.7 -946,387.1 1,665,992.0 2,540,805.7 2,612,379.2
Jan.- Nov. -795,023.9 -860,063.0 1,529,991.3 2,325,015.2 2,390,054.3
January -73,903.6 -79,599.3 132,872.3 206,775.8 212,471.6
February -75,014.4 -80,816.7 135,644.1 210,658.5 216,460.7
March -69,084.2 -74,871.9 140,068.6 209,152.8 214,940.5
April -69,304.5 -75,113.5 139,649.0 208,953.6 214,762.5
May -65,631.2 -71,558.1 143,753.3 209,384.5 215,311.4
June -68,462.1 -74,222.0 141,502.4 209,964.5 215,724.4
July -73,056.8 -78,942.3 139,238.1 212,294.9 218,180.4
August -75,270.7 -81,111.2 138,176.1 213,446.8 219,287.3
September -76,235.3 -82,322.9 140,073.2 216,308.5 222,396.1
October -76,148.0 -82,427.8 140,562.3 216,710.3 222,990.2
November -72,913.1 -79,077.3 138,452.0 211,365.1 217,529.3
December -79,789.8 -86,324.1 136,000.7 215,790.5 222,324.8
2019
Jan.- Nov. -779,251.2 -843,482.9 1,513,982.0 2,293,233.2 2,357,464.9
January -71,918.3 -78,149.0 137,553.2 209,471.5 215,702.2
February -69,877.0 -75,834.6 139,028.9 208,905.9 214,863.5
March -71,804.4 -77,691.3 140,563.9 212,368.3 218,255.2
April -70,931.5 -76,678.5 136,077.1 207,008.6 212,755.6
May -74,801.7 -80,699.9 140,234.2 215,035.9 220,934.2
June -74,176.6 -79,921.3 136,449.1 210,625.7 216,370.4
July -72,382.2 -78,253.7 137,670.6 210,052.8 215,924.2
August -73,022.6 -78,945.8 138,125.7 211,148.4 217,071.5
September -70,656.0 -76,417.2 136,155.6 206,811.6 212,572.9
October (R) -66,693.1 -72,274.2 135,552.4 202,245.6 207,826.6
November -62,987.8 -68,617.5 136,571.1 199,558.9 205,188.6
December
Not Seasonally Adjusted
2018
Jan.- Dec. -874,813.7 -946,387.1 1,665,992.0 2,540,805.7 2,612,379.2
Jan.- Nov. -801,894.1 -867,242.7 1,531,834.9 2,333,729.0 2,399,077.6
January -78,323.7 -84,073.1 125,011.6 203,335.4 209,084.7
February -58,989.0 -64,227.8 128,190.4 187,179.4 192,418.2
March -58,312.2 -64,023.8 149,851.9 208,164.1 213,875.8
April -67,368.4 -73,116.7 138,038.2 205,406.6 211,154.9
May -71,016.2 -77,151.6 145,423.8 216,440.0 222,575.5
June -66,476.2 -72,272.1 145,370.0 211,846.2 217,642.1
July -83,269.7 -89,328.6 133,711.8 216,981.5 223,040.4
August -82,220.6 -88,303.9 140,146.1 222,366.7 228,450.1
September -72,488.9 -78,422.3 139,182.1 211,671.1 217,604.5
October -89,097.3 -95,843.6 147,124.6 236,222.0 242,968.2
November -74,331.8 -80,479.1 139,784.1 214,115.9 220,263.2
December -72,919.6 -79,144.4 134,157.1 207,076.8 213,301.5
2019
Jan.- Nov. -786,087.9 -850,405.2 1,509,934.1 2,296,022.0 2,360,339.3
January -74,992.1 -81,222.9 129,607.9 204,600.0 210,830.9
February -55,266.1 -60,655.0 130,634.2 185,900.3 191,289.2
March -59,725.6 -65,418.0 148,267.1 207,992.6 213,685.1
April -73,914.2 -79,724.4 135,117.6 209,031.7 214,841.9
May -78,371.7 -84,457.5 142,409.2 220,780.9 226,866.7
June -69,400.7 -75,074.4 138,060.4 207,461.1 213,134.8
July -86,096.8 -92,262.0 132,872.5 218,969.3 225,134.5
August -77,122.8 -83,191.4 138,727.7 215,850.5 221,919.1
September -72,261.6 -77,985.0 134,510.5 206,772.1 212,495.5
October (R) -76,883.8 -82,839.8 142,414.6 219,298.4 225,254.5
November -62,052.4 -67,574.7 137,312.5 199,364.9 204,887.2
December
PeriodBalance Imports
– 46 –
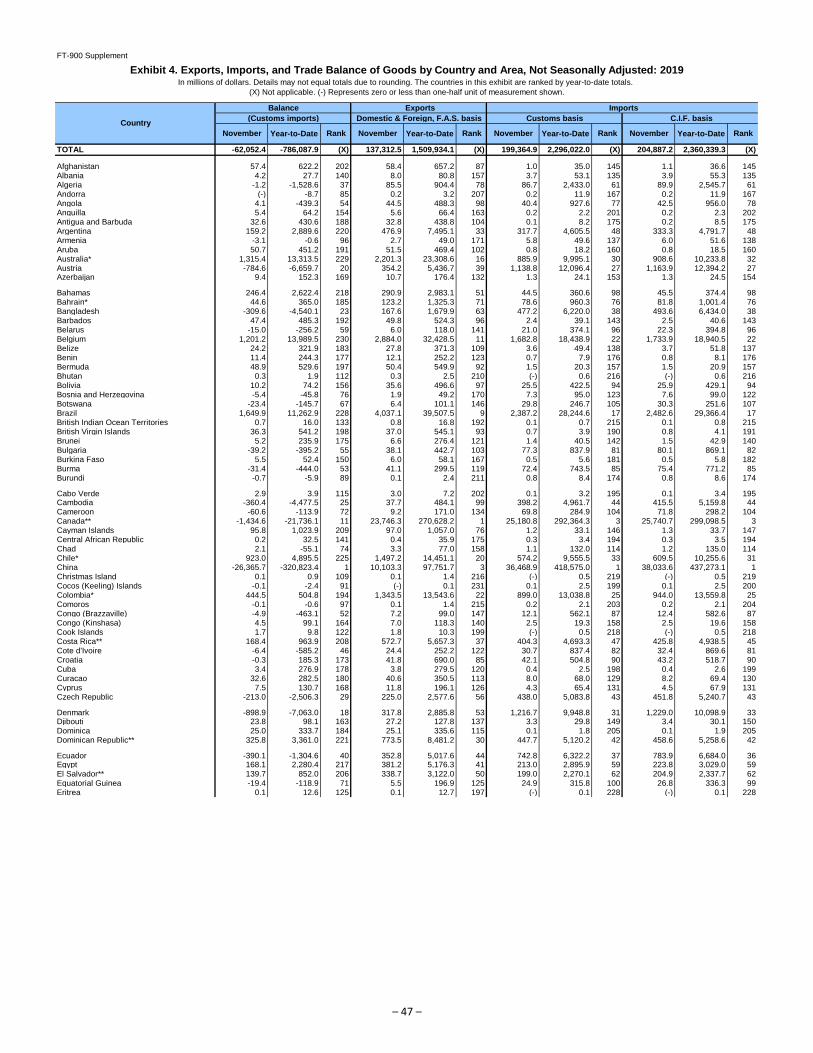
FT-900 Supplement
Exhibit 4. Exports, Imports, and Trade Balance of Goods by Country and Area, Not Seasonally Adjusted: 2019In millions of dollars. Details may not equal totals due to rounding. The countries in this exhibit are ranked by year-to-date totals.
(X) Not applicable. (-) Represents zero or less than one-half unit of measurement shown.
Balance Exports Imports
(Customs imports) Domestic & Foreign, F.A.S. basis Customs basis C.I.F. basis
TOTAL -62,052.4 -786,087.9 (X) 137,312.5 1,509,934.1 (X) 199,364.9 2,296,022.0 (X) 204,887.2 2,360,339.3 (X)
Afghanistan 57.4 622.2 202 58.4 657.2 87 1.0 35.0 145 1.1 36.6 145Albania 4.2 27.7 140 8.0 80.8 157 3.7 53.1 135 3.9 55.3 135Algeria -1.2 -1,528.6 37 85.5 904.4 78 86.7 2,433.0 61 89.9 2,545.7 61Andorra (-) -8.7 85 0.2 3.2 207 0.2 11.9 167 0.2 11.9 167Angola 4.1 -439.3 54 44.5 488.3 98 40.4 927.6 77 42.5 956.0 78Anguilla 5.4 64.2 154 5.6 66.4 163 0.2 2.2 201 0.2 2.3 202Antigua and Barbuda 32.6 430.6 188 32.8 438.8 104 0.1 8.2 175 0.2 8.5 175Argentina 159.2 2,889.6 220 476.9 7,495.1 33 317.7 4,605.5 48 333.3 4,791.7 48Armenia -3.1 -0.6 96 2.7 49.0 171 5.8 49.6 137 6.0 51.6 138Aruba 50.7 451.2 191 51.5 469.4 102 0.8 18.2 160 0.8 18.5 160Australia* 1,315.4 13,313.5 229 2,201.3 23,308.6 16 885.9 9,995.1 30 908.6 10,233.8 32Austria -784.6 -6,659.7 20 354.2 5,436.7 39 1,138.8 12,096.4 27 1,163.9 12,394.2 27Azerbaijan 9.4 152.3 169 10.7 176.4 132 1.3 24.1 153 1.3 24.5 154
Bahamas 246.4 2,622.4 218 290.9 2,983.1 51 44.5 360.6 98 45.5 374.4 98Bahrain* 44.6 365.0 185 123.2 1,325.3 71 78.6 960.3 76 81.8 1,001.4 76Bangladesh -309.6 -4,540.1 23 167.6 1,679.9 63 477.2 6,220.0 38 493.6 6,434.0 38Barbados 47.4 485.3 192 49.8 524.3 96 2.4 39.1 143 2.5 40.6 143Belarus -15.0 -256.2 59 6.0 118.0 141 21.0 374.1 96 22.3 394.8 96Belgium 1,201.2 13,989.5 230 2,884.0 32,428.5 11 1,682.8 18,438.9 22 1,733.9 18,940.5 22Belize 24.2 321.9 183 27.8 371.3 109 3.6 49.4 138 3.7 51.8 137Benin 11.4 244.3 177 12.1 252.2 123 0.7 7.9 176 0.8 8.1 176Bermuda 48.9 529.6 197 50.4 549.9 92 1.5 20.3 157 1.5 20.9 157Bhutan 0.3 1.9 112 0.3 2.5 210 (-) 0.6 216 (-) 0.6 216Bolivia 10.2 74.2 156 35.6 496.6 97 25.5 422.5 94 25.9 429.1 94Bosnia and Herzegovina -5.4 -45.8 76 1.9 49.2 170 7.3 95.0 123 7.6 99.0 122Botswana -23.4 -145.7 67 6.4 101.1 146 29.8 246.7 105 30.3 251.6 107Brazil 1,649.9 11,262.9 228 4,037.1 39,507.5 9 2,387.2 28,244.6 17 2,482.6 29,366.4 17British Indian Ocean Territories 0.7 16.0 133 0.8 16.8 192 0.1 0.7 215 0.1 0.8 215British Virgin Islands 36.3 541.2 198 37.0 545.1 93 0.7 3.9 190 0.8 4.1 191Brunei 5.2 235.9 175 6.6 276.4 121 1.4 40.5 142 1.5 42.9 140Bulgaria -39.2 -395.2 55 38.1 442.7 103 77.3 837.9 81 80.1 869.1 82Burkina Faso 5.5 52.4 150 6.0 58.1 167 0.5 5.6 181 0.5 5.8 182Burma -31.4 -444.0 53 41.1 299.5 119 72.4 743.5 85 75.4 771.2 85Burundi -0.7 -5.9 89 0.1 2.4 211 0.8 8.4 174 0.8 8.6 174
Cabo Verde 2.9 3.9 115 3.0 7.2 202 0.1 3.2 195 0.1 3.4 195Cambodia -360.4 -4,477.5 25 37.7 484.1 99 398.2 4,961.7 44 415.5 5,159.8 44Cameroon -60.6 -113.9 72 9.2 171.0 134 69.8 284.9 104 71.8 298.2 104Canada** -1,434.6 -21,736.1 11 23,746.3 270,628.2 1 25,180.8 292,364.3 3 25,740.7 299,098.5 3Cayman Islands 95.8 1,023.9 209 97.0 1,057.0 76 1.2 33.1 146 1.3 33.7 147Central African Republic 0.2 32.5 141 0.4 35.9 175 0.3 3.4 194 0.3 3.5 194Chad 2.1 -55.1 74 3.3 77.0 158 1.1 132.0 114 1.2 135.0 114Chile* 923.0 4,895.5 225 1,497.2 14,451.1 20 574.2 9,555.5 33 609.5 10,255.6 31China -26,365.7 -320,823.4 1 10,103.3 97,751.7 3 36,468.9 418,575.0 1 38,033.6 437,273.1 1Christmas Island 0.1 0.9 109 0.1 1.4 216 (-) 0.5 219 (-) 0.5 219Cocos (Keeling) Islands -0.1 -2.4 91 (-) 0.1 231 0.1 2.5 199 0.1 2.5 200Colombia* 444.5 504.8 194 1,343.5 13,543.6 22 899.0 13,038.8 25 944.0 13,559.8 25Comoros -0.1 -0.6 97 0.1 1.4 215 0.2 2.1 203 0.2 2.1 204Congo (Brazzaville) -4.9 -463.1 52 7.2 99.0 147 12.1 562.1 87 12.4 582.6 87Congo (Kinshasa) 4.5 99.1 164 7.0 118.3 140 2.5 19.3 158 2.5 19.6 158Cook Islands 1.7 9.8 122 1.8 10.3 199 (-) 0.5 218 (-) 0.5 218Costa Rica** 168.4 963.9 208 572.7 5,657.3 37 404.3 4,693.3 47 425.8 4,938.5 45Cote d'Ivoire -6.4 -585.2 46 24.4 252.2 122 30.7 837.4 82 32.4 869.6 81Croatia -0.3 185.3 173 41.8 690.0 85 42.1 504.8 90 43.2 518.7 90Cuba 3.4 276.9 178 3.8 279.5 120 0.4 2.5 198 0.4 2.6 199Curacao 32.6 282.5 180 40.6 350.5 113 8.0 68.0 129 8.2 69.4 130Cyprus 7.5 130.7 168 11.8 196.1 126 4.3 65.4 131 4.5 67.9 131Czech Republic -213.0 -2,506.3 29 225.0 2,577.6 56 438.0 5,083.8 43 451.8 5,240.7 43
Denmark -898.9 -7,063.0 18 317.8 2,885.8 53 1,216.7 9,948.8 31 1,229.0 10,098.9 33Djibouti 23.8 98.1 163 27.2 127.8 137 3.3 29.8 149 3.4 30.1 150Dominica 25.0 333.7 184 25.1 335.6 115 0.1 1.8 205 0.1 1.9 205Dominican Republic** 325.8 3,361.0 221 773.5 8,481.2 30 447.7 5,120.2 42 458.6 5,258.6 42
Ecuador -390.1 -1,304.6 40 352.8 5,017.6 44 742.8 6,322.2 37 783.9 6,684.0 36Egypt 168.1 2,280.4 217 381.2 5,176.3 41 213.0 2,895.9 59 223.8 3,029.0 59El Salvador** 139.7 852.0 206 338.7 3,122.0 50 199.0 2,270.1 62 204.9 2,337.7 62Equatorial Guinea -19.4 -118.9 71 5.5 196.9 125 24.9 315.8 100 26.8 336.3 99Eritrea 0.1 12.6 125 0.1 12.7 197 (-) 0.1 228 (-) 0.1 228
Year-to-Date
Country
November Year-to-Date Rank November RankRank November Year-to-Date Rank November Year-to-Date
– 47 –
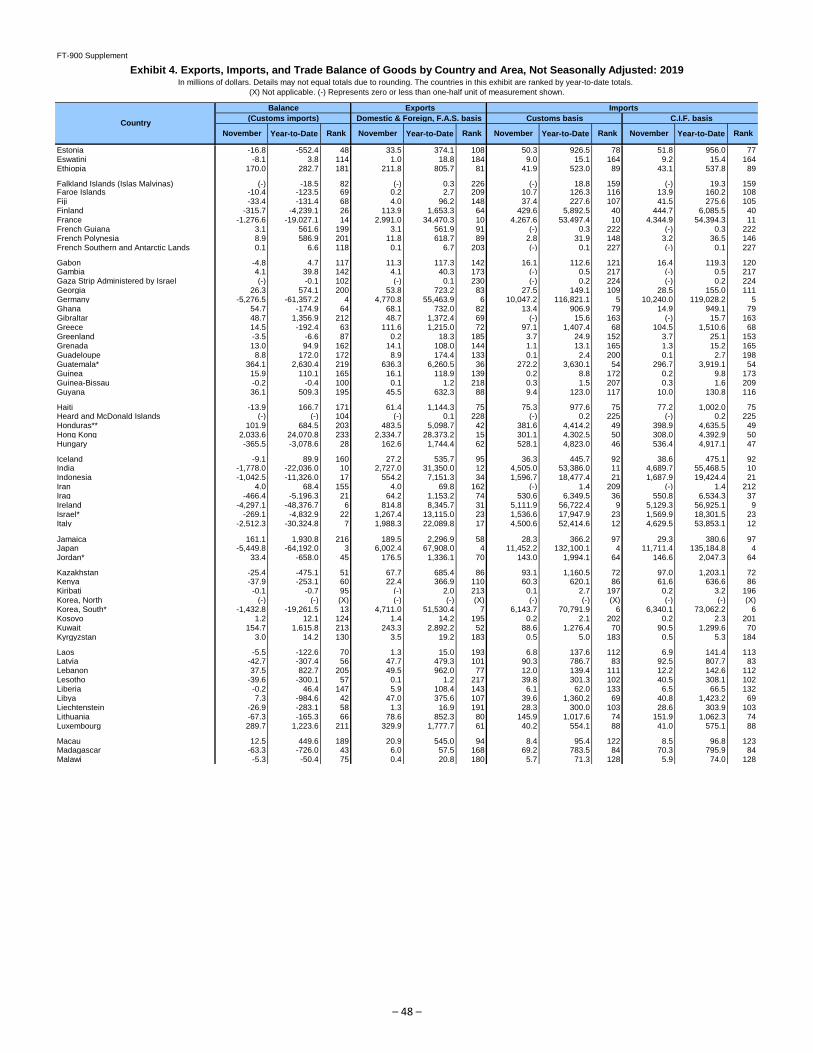
FT-900 Supplement
Exhibit 4. Exports, Imports, and Trade Balance of Goods by Country and Area, Not Seasonally Adjusted: 2019In millions of dollars. Details may not equal totals due to rounding. The countries in this exhibit are ranked by year-to-date totals.
(X) Not applicable. (-) Represents zero or less than one-half unit of measurement shown.
Balance Exports Imports
(Customs imports) Domestic & Foreign, F.A.S. basis Customs basis C.I.F. basis
Year-to-Date
Country
November Year-to-Date Rank November RankRank November Year-to-Date Rank November Year-to-Date
Estonia -16.8 -552.4 48 33.5 374.1 108 50.3 926.5 78 51.8 956.0 77Eswatini -8.1 3.8 114 1.0 18.8 184 9.0 15.1 164 9.2 15.4 164Ethiopia 170.0 282.7 181 211.8 805.7 81 41.9 523.0 89 43.1 537.8 89
Falkland Islands (Islas Malvinas) (-) -18.5 82 (-) 0.3 226 (-) 18.8 159 (-) 19.3 159Faroe Islands -10.4 -123.5 69 0.2 2.7 209 10.7 126.3 116 13.9 160.2 108Fiji -33.4 -131.4 68 4.0 96.2 148 37.4 227.6 107 41.5 275.6 105Finland -315.7 -4,239.1 26 113.9 1,653.3 64 429.6 5,892.5 40 444.7 6,085.5 40France -1,276.6 -19,027.1 14 2,991.0 34,470.3 10 4,267.6 53,497.4 10 4,344.9 54,394.3 11French Guiana 3.1 561.6 199 3.1 561.9 91 (-) 0.3 222 (-) 0.3 222French Polynesia 8.9 586.9 201 11.8 618.7 89 2.8 31.9 148 3.2 36.5 146French Southern and Antarctic Lands 0.1 6.6 118 0.1 6.7 203 (-) 0.1 227 (-) 0.1 227
Gabon -4.8 4.7 117 11.3 117.3 142 16.1 112.6 121 16.4 119.3 120Gambia 4.1 39.8 142 4.1 40.3 173 (-) 0.5 217 (-) 0.5 217Gaza Strip Administered by Israel (-) -0.1 102 (-) 0.1 230 (-) 0.2 224 (-) 0.2 224Georgia 26.3 574.1 200 53.8 723.2 83 27.5 149.1 109 28.5 155.0 111Germany -5,276.5 -61,357.2 4 4,770.8 55,463.9 6 10,047.2 116,821.1 5 10,240.0 119,028.2 5Ghana 54.7 -174.9 64 68.1 732.0 82 13.4 906.9 79 14.9 949.1 79Gibraltar 48.7 1,356.9 212 48.7 1,372.4 69 (-) 15.6 163 (-) 15.7 163Greece 14.5 -192.4 63 111.6 1,215.0 72 97.1 1,407.4 68 104.5 1,510.6 68Greenland -3.5 -6.6 87 0.2 18.3 185 3.7 24.9 152 3.7 25.1 153Grenada 13.0 94.9 162 14.1 108.0 144 1.1 13.1 165 1.3 15.2 165Guadeloupe 8.8 172.0 172 8.9 174.4 133 0.1 2.4 200 0.1 2.7 198Guatemala* 364.1 2,630.4 219 636.3 6,260.5 36 272.2 3,630.1 54 296.7 3,919.1 54Guinea 15.9 110.1 165 16.1 118.9 139 0.2 8.8 172 0.2 9.8 173Guinea-Bissau -0.2 -0.4 100 0.1 1.2 218 0.3 1.5 207 0.3 1.6 209Guyana 36.1 509.3 195 45.5 632.3 88 9.4 123.0 117 10.0 130.8 116
Haiti -13.9 166.7 171 61.4 1,144.3 75 75.3 977.6 75 77.2 1,002.0 75Heard and McDonald Islands (-) (-) 104 (-) 0.1 228 (-) 0.2 225 (-) 0.2 225Honduras** 101.9 684.5 203 483.5 5,098.7 42 381.6 4,414.2 49 398.9 4,635.5 49Hong Kong 2,033.6 24,070.8 233 2,334.7 28,373.2 15 301.1 4,302.5 50 308.0 4,392.9 50Hungary -365.5 -3,078.6 28 162.6 1,744.4 62 528.1 4,823.0 46 536.4 4,917.1 47
Iceland -9.1 89.9 160 27.2 535.7 95 36.3 445.7 92 38.6 475.1 92India -1,778.0 -22,036.0 10 2,727.0 31,350.0 12 4,505.0 53,386.0 11 4,689.7 55,468.5 10Indonesia -1,042.5 -11,326.0 17 554.2 7,151.3 34 1,596.7 18,477.4 21 1,687.9 19,424.4 21Iran 4.0 68.4 155 4.0 69.8 162 (-) 1.4 209 (-) 1.4 212Iraq -466.4 -5,196.3 21 64.2 1,153.2 74 530.6 6,349.5 36 550.8 6,534.3 37Ireland -4,297.1 -48,376.7 6 814.8 8,345.7 31 5,111.9 56,722.4 9 5,129.3 56,925.1 9Israel* -269.1 -4,832.9 22 1,267.4 13,115.0 23 1,536.6 17,947.9 23 1,569.9 18,301.5 23Italy -2,512.3 -30,324.8 7 1,988.3 22,089.8 17 4,500.6 52,414.6 12 4,629.5 53,853.1 12
Jamaica 161.1 1,930.8 216 189.5 2,296.9 58 28.3 366.2 97 29.3 380.6 97Japan -5,449.8 -64,192.0 3 6,002.4 67,908.0 4 11,452.2 132,100.1 4 11,711.4 135,184.8 4Jordan* 33.4 -658.0 45 176.5 1,336.1 70 143.0 1,994.1 64 146.6 2,047.3 64
Kazakhstan -25.4 -475.1 51 67.7 685.4 86 93.1 1,160.5 72 97.0 1,203.1 72Kenya -37.9 -253.1 60 22.4 366.9 110 60.3 620.1 86 61.6 636.6 86Kiribati -0.1 -0.7 95 (-) 2.0 213 0.1 2.7 197 0.2 3.2 196Korea, North (-) (-) (X) (-) (-) (X) (-) (-) (X) (-) (-) (X)Korea, South* -1,432.8 -19,261.5 13 4,711.0 51,530.4 7 6,143.7 70,791.9 6 6,340.1 73,062.2 6Kosovo 1.2 12.1 124 1.4 14.2 195 0.2 2.1 202 0.2 2.3 201Kuwait 154.7 1,615.8 213 243.3 2,892.2 52 88.6 1,276.4 70 90.5 1,299.6 70Kyrgyzstan 3.0 14.2 130 3.5 19.2 183 0.5 5.0 183 0.5 5.3 184
Laos -5.5 -122.6 70 1.3 15.0 193 6.8 137.6 112 6.9 141.4 113Latvia -42.7 -307.4 56 47.7 479.3 101 90.3 786.7 83 92.5 807.7 83Lebanon 37.5 822.7 205 49.5 962.0 77 12.0 139.4 111 12.2 142.6 112Lesotho -39.6 -300.1 57 0.1 1.2 217 39.8 301.3 102 40.5 308.1 102Liberia -0.2 46.4 147 5.9 108.4 143 6.1 62.0 133 6.5 66.5 132Libya 7.3 -984.6 42 47.0 375.6 107 39.6 1,360.2 69 40.8 1,423.2 69Liechtenstein -26.9 -283.1 58 1.3 16.9 191 28.3 300.0 103 28.6 303.9 103Lithuania -67.3 -165.3 66 78.6 852.3 80 145.9 1,017.6 74 151.9 1,062.3 74Luxembourg 289.7 1,223.6 211 329.9 1,777.7 61 40.2 554.1 88 41.0 575.1 88
Macau 12.5 449.6 189 20.9 545.0 94 8.4 95.4 122 8.5 96.8 123Madagascar -63.3 -726.0 43 6.0 57.5 168 69.2 783.5 84 70.3 795.9 84Malawi -5.3 -50.4 75 0.4 20.8 180 5.7 71.3 128 5.9 74.0 128
– 48 –
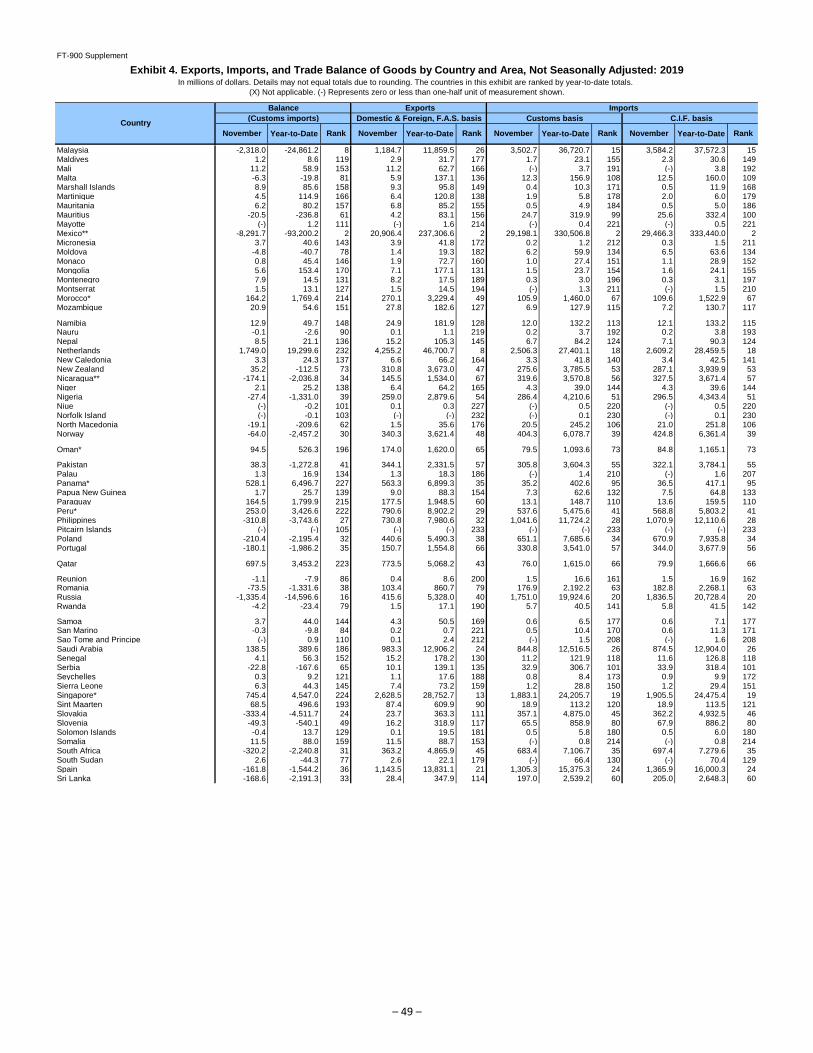
FT-900 Supplement
Exhibit 4. Exports, Imports, and Trade Balance of Goods by Country and Area, Not Seasonally Adjusted: 2019In millions of dollars. Details may not equal totals due to rounding. The countries in this exhibit are ranked by year-to-date totals.
(X) Not applicable. (-) Represents zero or less than one-half unit of measurement shown.
Balance Exports Imports
(Customs imports) Domestic & Foreign, F.A.S. basis Customs basis C.I.F. basis
Year-to-Date
Country
November Year-to-Date Rank November RankRank November Year-to-Date Rank November Year-to-Date
Malaysia -2,318.0 -24,861.2 8 1,184.7 11,859.5 26 3,502.7 36,720.7 15 3,584.2 37,572.3 15Maldives 1.2 8.6 119 2.9 31.7 177 1.7 23.1 155 2.3 30.6 149Mali 11.2 58.9 153 11.2 62.7 166 (-) 3.7 191 (-) 3.8 192Malta -6.3 -19.8 81 5.9 137.1 136 12.3 156.9 108 12.5 160.0 109Marshall Islands 8.9 85.6 158 9.3 95.8 149 0.4 10.3 171 0.5 11.9 168Martinique 4.5 114.9 166 6.4 120.8 138 1.9 5.8 178 2.0 6.0 179Mauritania 6.2 80.2 157 6.8 85.2 155 0.5 4.9 184 0.5 5.0 186Mauritius -20.5 -236.8 61 4.2 83.1 156 24.7 319.9 99 25.6 332.4 100Mayotte (-) 1.2 111 (-) 1.6 214 (-) 0.4 221 (-) 0.5 221Mexico** -8,291.7 -93,200.2 2 20,906.4 237,306.6 2 29,198.1 330,506.8 2 29,466.3 333,440.0 2Micronesia 3.7 40.6 143 3.9 41.8 172 0.2 1.2 212 0.3 1.5 211Moldova -4.8 -40.7 78 1.4 19.3 182 6.2 59.9 134 6.5 63.6 134Monaco 0.8 45.4 146 1.9 72.7 160 1.0 27.4 151 1.1 28.9 152Mongolia 5.6 153.4 170 7.1 177.1 131 1.5 23.7 154 1.6 24.1 155Montenegro 7.9 14.5 131 8.2 17.5 189 0.3 3.0 196 0.3 3.1 197Montserrat 1.5 13.1 127 1.5 14.5 194 (-) 1.3 211 (-) 1.5 210Morocco* 164.2 1,769.4 214 270.1 3,229.4 49 105.9 1,460.0 67 109.6 1,522.9 67Mozambique 20.9 54.6 151 27.8 182.6 127 6.9 127.9 115 7.2 130.7 117
Namibia 12.9 49.7 148 24.9 181.9 128 12.0 132.2 113 12.1 133.2 115Nauru -0.1 -2.6 90 0.1 1.1 219 0.2 3.7 192 0.2 3.8 193Nepal 8.5 21.1 136 15.2 105.3 145 6.7 84.2 124 7.1 90.3 124Netherlands 1,749.0 19,299.6 232 4,255.2 46,700.7 8 2,506.3 27,401.1 18 2,609.2 28,459.5 18New Caledonia 3.3 24.3 137 6.6 66.2 164 3.3 41.8 140 3.4 42.5 141New Zealand 35.2 -112.5 73 310.8 3,673.0 47 275.6 3,785.5 53 287.1 3,939.9 53Nicaragua** -174.1 -2,036.8 34 145.5 1,534.0 67 319.6 3,570.8 56 327.5 3,671.4 57Niger 2.1 25.2 138 6.4 64.2 165 4.3 39.0 144 4.3 39.6 144Nigeria -27.4 -1,331.0 39 259.0 2,879.6 54 286.4 4,210.6 51 296.5 4,343.4 51Niue (-) -0.2 101 0.1 0.3 227 (-) 0.5 220 (-) 0.5 220Norfolk Island (-) -0.1 103 (-) (-) 232 (-) 0.1 230 (-) 0.1 230North Macedonia -19.1 -209.6 62 1.5 35.6 176 20.5 245.2 106 21.0 251.8 106Norway -64.0 -2,457.2 30 340.3 3,621.4 48 404.3 6,078.7 39 424.8 6,361.4 39
Oman* 94.5 526.3 196 174.0 1,620.0 65 79.5 1,093.6 73 84.8 1,165.1 73
Pakistan 38.3 -1,272.8 41 344.1 2,331.5 57 305.8 3,604.3 55 322.1 3,784.1 55Palau 1.3 16.9 134 1.3 18.3 186 (-) 1.4 210 (-) 1.6 207Panama* 528.1 6,496.7 227 563.3 6,899.3 35 35.2 402.6 95 36.5 417.1 95Papua New Guinea 1.7 25.7 139 9.0 88.3 154 7.3 62.6 132 7.5 64.8 133Paraguay 164.5 1,799.9 215 177.5 1,948.5 60 13.1 148.7 110 13.6 159.5 110Peru* 253.0 3,426.6 222 790.6 8,902.2 29 537.6 5,475.6 41 568.8 5,803.2 41Philippines -310.8 -3,743.6 27 730.8 7,980.6 32 1,041.6 11,724.2 28 1,070.9 12,110.6 28Pitcairn Islands (-) (-) 105 (-) (-) 233 (-) (-) 233 (-) (-) 233Poland -210.4 -2,195.4 32 440.6 5,490.3 38 651.1 7,685.6 34 670.9 7,935.8 34Portugal -180.1 -1,986.2 35 150.7 1,554.8 66 330.8 3,541.0 57 344.0 3,677.9 56
Qatar 697.5 3,453.2 223 773.5 5,068.2 43 76.0 1,615.0 66 79.9 1,666.6 66
Reunion -1.1 -7.9 86 0.4 8.6 200 1.5 16.6 161 1.5 16.9 162Romania -73.5 -1,331.6 38 103.4 860.7 79 176.9 2,192.2 63 182.8 2,268.1 63Russia -1,335.4 -14,596.6 16 415.6 5,328.0 40 1,751.0 19,924.6 20 1,836.5 20,728.4 20Rwanda -4.2 -23.4 79 1.5 17.1 190 5.7 40.5 141 5.8 41.5 142
Samoa 3.7 44.0 144 4.3 50.5 169 0.6 6.5 177 0.6 7.1 177San Marino -0.3 -9.8 84 0.2 0.7 221 0.5 10.4 170 0.6 11.3 171Sao Tome and Principe (-) 0.9 110 0.1 2.4 212 (-) 1.5 208 (-) 1.6 208Saudi Arabia 138.5 389.6 186 983.3 12,906.2 24 844.8 12,516.5 26 874.5 12,904.0 26Senegal 4.1 56.3 152 15.2 178.2 130 11.2 121.9 118 11.6 126.8 118Serbia -22.8 -167.6 65 10.1 139.1 135 32.9 306.7 101 33.9 318.4 101Seychelles 0.3 9.2 121 1.1 17.6 188 0.8 8.4 173 0.9 9.9 172Sierra Leone 6.3 44.3 145 7.4 73.2 159 1.2 28.8 150 1.2 29.4 151Singapore* 745.4 4,547.0 224 2,628.5 28,752.7 13 1,883.1 24,205.7 19 1,905.5 24,475.4 19Sint Maarten 68.5 496.6 193 87.4 609.9 90 18.9 113.2 120 18.9 113.5 121Slovakia -333.4 -4,511.7 24 23.7 363.3 111 357.1 4,875.0 45 362.2 4,932.5 46Slovenia -49.3 -540.1 49 16.2 318.9 117 65.5 858.9 80 67.9 886.2 80Solomon Islands -0.4 13.7 129 0.1 19.5 181 0.5 5.8 180 0.5 6.0 180Somalia 11.5 88.0 159 11.5 88.7 153 (-) 0.8 214 (-) 0.8 214South Africa -320.2 -2,240.8 31 363.2 4,865.9 45 683.4 7,106.7 35 697.4 7,279.6 35South Sudan 2.6 -44.3 77 2.6 22.1 179 (-) 66.4 130 (-) 70.4 129Spain -161.8 -1,544.2 36 1,143.5 13,831.1 21 1,305.3 15,375.3 24 1,365.9 16,000.3 24Sri Lanka -168.6 -2,191.3 33 28.4 347.9 114 197.0 2,539.2 60 205.0 2,648.3 60
– 49 –

FT-900 Supplement
Exhibit 4. Exports, Imports, and Trade Balance of Goods by Country and Area, Not Seasonally Adjusted: 2019In millions of dollars. Details may not equal totals due to rounding. The countries in this exhibit are ranked by year-to-date totals.
(X) Not applicable. (-) Represents zero or less than one-half unit of measurement shown.
Balance Exports Imports
(Customs imports) Domestic & Foreign, F.A.S. basis Customs basis C.I.F. basis
Year-to-Date
Country
November Year-to-Date Rank November RankRank November Year-to-Date Rank November Year-to-Date
St Helena -2.1 -10.8 83 (-) 0.6 222 2.1 11.3 169 2.2 11.5 170St Kitts and Nevis 14.6 127.6 167 22.2 178.2 129 7.7 50.6 136 7.8 52.1 136St Lucia 31.4 700.0 204 32.1 711.4 84 0.7 11.4 168 0.8 11.8 169St Pierre and Miquelon (-) 0.1 106 (-) 0.1 229 (-) (-) 232 (-) (-) 232St Vincent and the Grenadines 8.3 90.5 161 8.8 95.3 150 0.5 4.8 185 0.5 5.1 185Sudan 4.5 50.6 149 4.5 71.8 161 0.1 21.2 156 0.1 22.7 156Suriname 21.9 277.5 179 27.6 354.9 112 5.8 77.4 126 6.2 82.3 125Svalbard, Jan Mayen Island (-) 4.1 116 (-) 4.2 205 (-) 0.1 229 (-) 0.1 229Sweden -556.8 -7,000.9 19 407.5 4,028.6 46 964.4 11,029.5 29 993.0 11,542.0 29Switzerland -2,303.0 -24,162.8 9 1,648.3 16,221.0 19 3,951.3 40,383.8 14 3,999.9 40,851.9 14Syria 0.2 3.3 113 0.5 8.0 201 0.2 4.6 188 0.3 4.9 187
Taiwan -1,683.6 -20,940.2 12 2,789.8 28,497.2 14 4,473.4 49,437.4 13 4,606.1 50,998.4 13Tajikistan 0.4 8.8 120 0.5 10.8 198 (-) 2.0 204 (-) 2.2 203Tanzania 0.5 202.3 174 14.5 323.4 116 14.0 121.1 119 14.3 124.5 119Thailand -1,776.8 -18,506.9 15 1,044.9 12,088.9 25 2,821.7 30,595.8 16 2,931.6 31,807.7 16Timor-Leste -0.3 -0.5 98 0.4 3.9 206 0.7 4.4 189 0.7 4.4 189Togo 18.5 401.9 187 20.0 413.8 105 1.5 11.9 166 1.6 12.6 166Tokelau -0.1 -1.3 93 (-) 0.4 225 0.1 1.8 206 0.1 1.8 206Tonga 0.9 13.6 128 2.6 18.2 187 1.7 4.7 186 1.8 5.8 181Trinidad and Tobago 6.3 -523.5 50 281.7 2,600.4 55 275.5 3,123.9 58 293.1 3,307.4 58Tunisia 7.2 -22.1 80 43.0 403.6 106 35.8 425.8 93 36.9 440.2 93Turkey -162.8 -558.6 47 740.7 9,223.1 28 903.4 9,781.7 32 961.6 10,389.8 30Turkmenistan 1.4 10.9 123 1.5 27.1 178 0.1 16.2 162 0.1 16.9 161Turks and Caicos Islands 38.1 309.9 182 38.5 315.1 118 0.4 5.2 182 0.4 5.4 183Tuvalu 0.1 0.6 108 0.1 0.8 220 (-) 0.2 226 (-) 0.2 226
Uganda -1.2 17.1 135 9.4 92.6 152 10.6 75.5 127 10.9 78.2 127Ukraine 83.0 948.2 207 183.8 2,159.8 59 100.8 1,211.6 71 105.0 1,268.0 71United Arab Emirates 1,537.6 14,223.8 231 1,829.6 18,299.1 18 292.0 4,075.4 52 307.8 4,278.0 52United Kingdom 1,303.8 5,975.6 226 6,375.9 63,585.0 5 5,072.1 57,609.4 8 5,158.3 58,590.2 8Uruguay 65.1 1,034.6 210 110.2 1,515.1 68 45.1 480.5 91 47.1 502.1 91Uzbekistan 9.1 450.5 190 9.6 482.4 100 0.5 31.9 147 0.5 32.5 148
Vanuatu (-) -1.4 92 0.5 4.3 204 0.5 5.8 179 0.6 6.2 178Vatican City 0.3 -0.5 99 0.3 0.5 223 (-) 1.0 213 (-) 1.0 213Venezuela 83.6 -711.5 44 103.7 1,198.5 73 20.1 1,910.0 65 21.4 1,991.2 65Vietnam -4,624.5 -50,895.3 5 881.3 10,004.4 27 5,505.8 60,899.7 7 5,737.1 63,352.3 7
Wallis and Futuna (-) 0.4 107 (-) 0.5 224 (-) (-) 231 (-) (-) 231West Bank Administered by Israel (-) -0.7 94 0.2 2.8 208 0.3 3.6 193 0.3 4.2 190Western Sahara (-) 12.7 126 (-) 13.0 196 (-) 0.3 223 (-) 0.3 223
Yemen 35.1 243.8 176 35.6 248.5 124 0.5 4.7 187 0.5 4.8 188
Zambia 0.7 15.8 132 2.8 95.3 151 2.1 79.5 125 2.1 80.8 126Zimbabwe -6.7 -6.5 88 1.6 37.0 174 8.3 43.5 139 8.5 45.1 139
Unidentified (1) (-) (-) (X) (-) (-) (X) (-) (-) (X) (-) (-) (X)
Timing adjustment (X) 76.8 (X) (X) 66.2 (X) (X) -10.6 (X) (X) -11.5 (X)
– 50 –
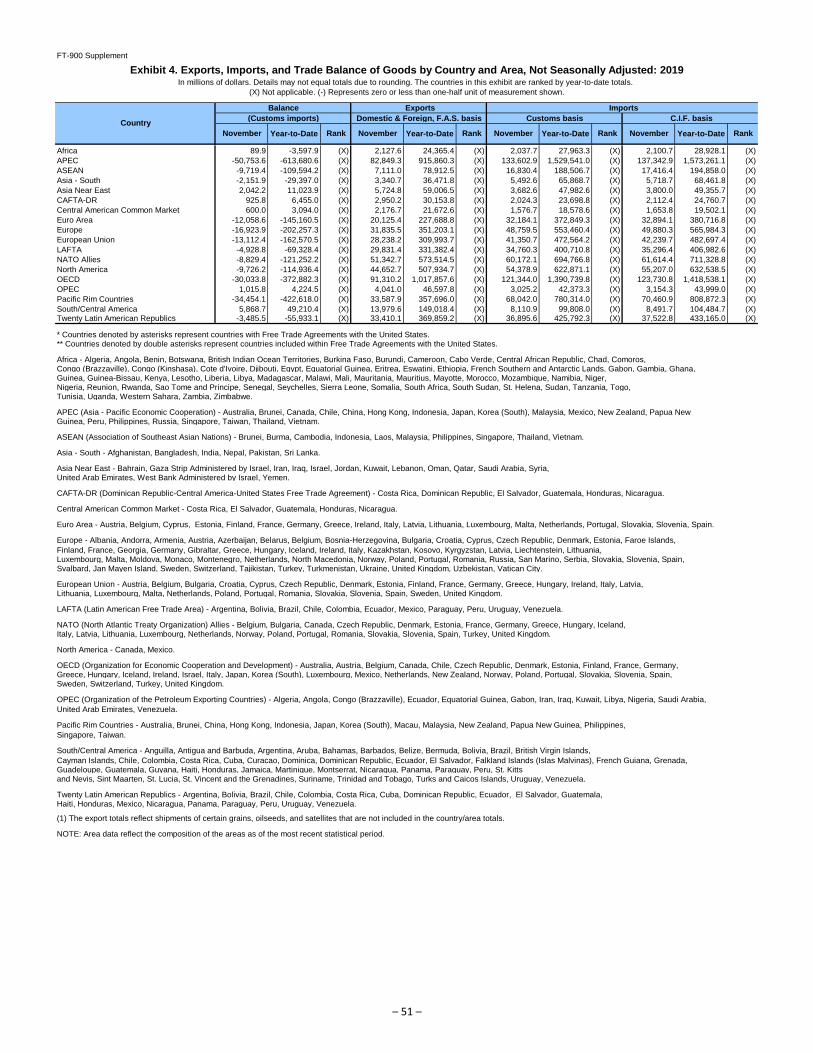
FT-900 Supplement
Exhibit 4. Exports, Imports, and Trade Balance of Goods by Country and Area, Not Seasonally Adjusted: 2019In millions of dollars. Details may not equal totals due to rounding. The countries in this exhibit are ranked by year-to-date totals.
(X) Not applicable. (-) Represents zero or less than one-half unit of measurement shown.
Balance Exports Imports
(Customs imports) Domestic & Foreign, F.A.S. basis Customs basis C.I.F. basis
Year-to-Date
Country
November Year-to-Date Rank November RankRank November Year-to-Date Rank November Year-to-Date
Africa 89.9 -3,597.9 (X) 2,127.6 24,365.4 (X) 2,037.7 27,963.3 (X) 2,100.7 28,928.1 (X)
APEC -50,753.6 -613,680.6 (X) 82,849.3 915,860.3 (X) 133,602.9 1,529,541.0 (X) 137,342.9 1,573,261.1 (X)
ASEAN -9,719.4 -109,594.2 (X) 7,111.0 78,912.5 (X) 16,830.4 188,506.7 (X) 17,416.4 194,858.0 (X)
Asia - South -2,151.9 -29,397.0 (X) 3,340.7 36,471.8 (X) 5,492.6 65,868.7 (X) 5,718.7 68,461.8 (X)
Asia Near East 2,042.2 11,023.9 (X) 5,724.8 59,006.5 (X) 3,682.6 47,982.6 (X) 3,800.0 49,355.7 (X)
CAFTA-DR 925.8 6,455.0 (X) 2,950.2 30,153.8 (X) 2,024.3 23,698.8 (X) 2,112.4 24,760.7 (X)
Central American Common Market 600.0 3,094.0 (X) 2,176.7 21,672.6 (X) 1,576.7 18,578.6 (X) 1,653.8 19,502.1 (X)
Euro Area -12,058.6 -145,160.5 (X) 20,125.4 227,688.8 (X) 32,184.1 372,849.3 (X) 32,894.1 380,716.8 (X)
Europe -16,923.9 -202,257.3 (X) 31,835.5 351,203.1 (X) 48,759.5 553,460.4 (X) 49,880.3 565,984.3 (X)
European Union -13,112.4 -162,570.5 (X) 28,238.2 309,993.7 (X) 41,350.7 472,564.2 (X) 42,239.7 482,697.4 (X)
LAFTA -4,928.8 -69,328.4 (X) 29,831.4 331,382.4 (X) 34,760.3 400,710.8 (X) 35,296.4 406,982.6 (X)
NATO Allies -8,829.4 -121,252.2 (X) 51,342.7 573,514.5 (X) 60,172.1 694,766.8 (X) 61,614.4 711,328.8 (X)
North America -9,726.2 -114,936.4 (X) 44,652.7 507,934.7 (X) 54,378.9 622,871.1 (X) 55,207.0 632,538.5 (X)
OECD -30,033.8 -372,882.3 (X) 91,310.2 1,017,857.6 (X) 121,344.0 1,390,739.8 (X) 123,730.8 1,418,538.1 (X)
OPEC 1,015.8 4,224.5 (X) 4,041.0 46,597.8 (X) 3,025.2 42,373.3 (X) 3,154.3 43,999.0 (X)
Pacific Rim Countries -34,454.1 -422,618.0 (X) 33,587.9 357,696.0 (X) 68,042.0 780,314.0 (X) 70,460.9 808,872.3 (X)
South/Central America 5,868.7 49,210.4 (X) 13,979.6 149,018.4 (X) 8,110.9 99,808.0 (X) 8,491.7 104,484.7 (X)Twenty Latin American Republics -3,485.5 -55,933.1 (X) 33,410.1 369,859.2 (X) 36,895.6 425,792.3 (X) 37,522.8 433,165.0 (X)
* Countries denoted by asterisks represent countries with Free Trade Agreements with the United States.** Countries denoted by double asterisks represent countries included within Free Trade Agreements with the United States.
Africa - Algeria, Angola, Benin, Botswana, British Indian Ocean Territories, Burkina Faso, Burundi, Cameroon, Cabo Verde, Central African Republic, Chad, Comoros, Congo (Brazzaville), Congo (Kinshasa), Cote d'Ivoire, Djibouti, Egypt, Equatorial Guinea, Eritrea, Eswatini, Ethiopia, French Southern and Antarctic Lands, Gabon, Gambia, Ghana,Guinea, Guinea-Bissau, Kenya, Lesotho, Liberia, Libya, Madagascar, Malawi, Mali, Mauritania, Mauritius, Mayotte, Morocco, Mozambique, Namibia, Niger, Nigeria, Reunion, Rwanda, Sao Tome and Principe, Senegal, Seychelles, Sierra Leone, Somalia, South Africa, South Sudan, St. Helena, Sudan, Tanzania, Togo, Tunisia, Uganda, Western Sahara, Zambia, Zimbabwe.
APEC (Asia - Pacific Economic Cooperation) - Australia, Brunei, Canada, Chile, China, Hong Kong, Indonesia, Japan, Korea (South), Malaysia, Mexico, New Zealand, Papua New Guinea, Peru, Philippines, Russia, Singapore, Taiwan, Thailand, Vietnam.
ASEAN (Association of Southeast Asian Nations) - Brunei, Burma, Cambodia, Indonesia, Laos, Malaysia, Philippines, Singapore, Thailand, Vietnam.
Asia - South - Afghanistan, Bangladesh, India, Nepal, Pakistan, Sri Lanka.
Asia Near East - Bahrain, Gaza Strip Administered by Israel, Iran, Iraq, Israel, Jordan, Kuwait, Lebanon, Oman, Qatar, Saudi Arabia, Syria, United Arab Emirates, West Bank Administered by Israel, Yemen.
CAFTA-DR (Dominican Republic-Central America-United States Free Trade Agreement) - Costa Rica, Dominican Republic, El Salvador, Guatemala, Honduras, Nicaragua.
Central American Common Market - Costa Rica, El Salvador, Guatemala, Honduras, Nicaragua.
Euro Area - Austria, Belgium, Cyprus, Estonia, Finland, France, Germany, Greece, Ireland, Italy, Latvia, Lithuania, Luxembourg, Malta, Netherlands, Portugal, Slovakia, Slovenia, Spain.
Europe - Albania, Andorra, Armenia, Austria, Azerbaijan, Belarus, Belgium, Bosnia-Herzegovina, Bulgaria, Croatia, Cyprus, Czech Republic, Denmark, Estonia, Faroe Islands,
Finland, France, Georgia, Germany, Gibraltar, Greece, Hungary, Iceland, Ireland, Italy, Kazakhstan, Kosovo, Kyrgyzstan, Latvia, Liechtenstein, Lithuania,Luxembourg, Malta, Moldova, Monaco, Montenegro, Netherlands, North Macedonia, Norway, Poland, Portugal, Romania, Russia, San Marino, Serbia, Slovakia, Slovenia, Spain, Svalbard, Jan Mayen Island, Sweden, Switzerland, Tajikistan, Turkey, Turkmenistan, Ukraine, United Kingdom, Uzbekistan, Vatican City.
European Union - Austria, Belgium, Bulgaria, Croatia, Cyprus, Czech Republic, Denmark, Estonia, Finland, France, Germany, Greece, Hungary, Ireland, Italy, Latvia, Lithuania, Luxembourg, Malta, Netherlands, Poland, Portugal, Romania, Slovakia, Slovenia, Spain, Sweden, United Kingdom.
LAFTA (Latin American Free Trade Area) - Argentina, Bolivia, Brazil, Chile, Colombia, Ecuador, Mexico, Paraguay, Peru, Uruguay, Venezuela.
NATO (North Atlantic Treaty Organization) Allies - Belgium, Bulgaria, Canada, Czech Republic, Denmark, Estonia, France, Germany, Greece, Hungary, Iceland, Italy, Latvia, Lithuania, Luxembourg, Netherlands, Norway, Poland, Portugal, Romania, Slovakia, Slovenia, Spain, Turkey, United Kingdom.
North America - Canada, Mexico.
OECD (Organization for Economic Cooperation and Development) - Australia, Austria, Belgium, Canada, Chile, Czech Republic, Denmark, Estonia, Finland, France, Germany,Greece, Hungary, Iceland, Ireland, Israel, Italy, Japan, Korea (South), Luxembourg, Mexico, Netherlands, New Zealand, Norway, Poland, Portugal, Slovakia, Slovenia, Spain,Sweden, Switzerland, Turkey, United Kingdom.
OPEC (Organization of the Petroleum Exporting Countries) - Algeria, Angola, Congo (Brazzaville), Ecuador, Equatorial Guinea, Gabon, Iran, Iraq, Kuwait, Libya, Nigeria, Saudi Arabia,
United Arab Emirates, Venezuela.
Pacific Rim Countries - Australia, Brunei, China, Hong Kong, Indonesia, Japan, Korea (South), Macau, Malaysia, New Zealand, Papua New Guinea, Philippines,
Singapore, Taiwan.
South/Central America - Anguilla, Antigua and Barbuda, Argentina, Aruba, Bahamas, Barbados, Belize, Bermuda, Bolivia, Brazil, British Virgin Islands,
Cayman Islands, Chile, Colombia, Costa Rica, Cuba, Curacao, Dominica, Dominican Republic, Ecuador, El Salvador, Falkland Islands (Islas Malvinas), French Guiana, Grenada,Guadeloupe, Guatemala, Guyana, Haiti, Honduras, Jamaica, Martinique, Montserrat, Nicaragua, Panama, Paraguay, Peru, St. Kittsand Nevis, Sint Maarten, St. Lucia, St. Vincent and the Grenadines, Suriname, Trinidad and Tobago, Turks and Caicos Islands, Uruguay, Venezuela.
Twenty Latin American Republics - Argentina, Bolivia, Brazil, Chile, Colombia, Costa Rica, Cuba, Dominican Republic, Ecuador, El Salvador, Guatemala, Haiti, Honduras, Mexico, Nicaragua, Panama, Paraguay, Peru, Uruguay, Venezuela.
(1) The export totals reflect shipments of certain grains, oilseeds, and satellites that are not included in the country/area totals.
NOTE: Area data reflect the composition of the areas as of the most recent statistical period.
– 51 –
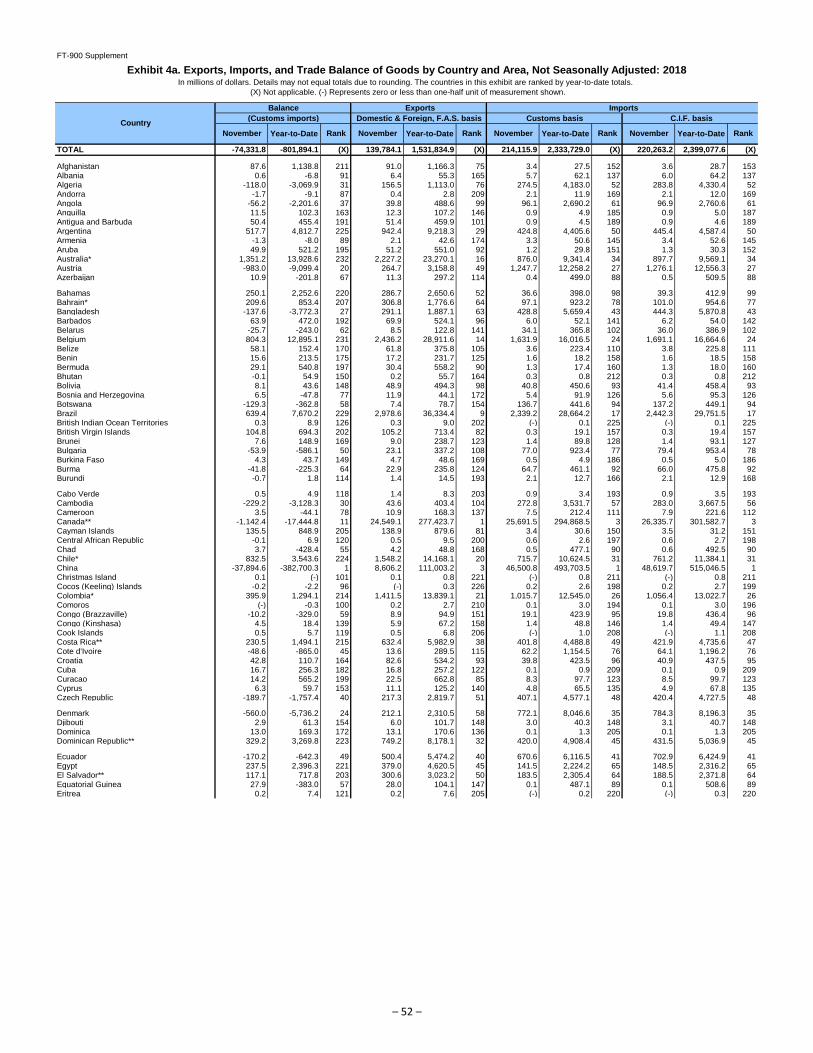
FT-900 Supplement
Exhibit 4a. Exports, Imports, and Trade Balance of Goods by Country and Area, Not Seasonally Adjusted: 2018In millions of dollars. Details may not equal totals due to rounding. The countries in this exhibit are ranked by year-to-date totals.
(X) Not applicable. (-) Represents zero or less than one-half unit of measurement shown.
Balance Exports Imports
(Customs imports) Domestic & Foreign, F.A.S. basis Customs basis C.I.F. basis
TOTAL -74,331.8 -801,894.1 (X) 139,784.1 1,531,834.9 (X) 214,115.9 2,333,729.0 (X) 220,263.2 2,399,077.6 (X)
Afghanistan 87.6 1,138.8 211 91.0 1,166.3 75 3.4 27.5 152 3.6 28.7 153Albania 0.6 -6.8 91 6.4 55.3 165 5.7 62.1 137 6.0 64.2 137Algeria -118.0 -3,069.9 31 156.5 1,113.0 76 274.5 4,183.0 52 283.8 4,330.4 52Andorra -1.7 -9.1 87 0.4 2.8 209 2.1 11.9 169 2.1 12.0 169Angola -56.2 -2,201.6 37 39.8 488.6 99 96.1 2,690.2 61 96.9 2,760.6 61Anguilla 11.5 102.3 163 12.3 107.2 146 0.9 4.9 185 0.9 5.0 187Antigua and Barbuda 50.4 455.4 191 51.4 459.9 101 0.9 4.5 189 0.9 4.6 189Argentina 517.7 4,812.7 225 942.4 9,218.3 29 424.8 4,405.6 50 445.4 4,587.4 50Armenia -1.3 -8.0 89 2.1 42.6 174 3.3 50.6 145 3.4 52.6 145Aruba 49.9 521.2 195 51.2 551.0 92 1.2 29.8 151 1.3 30.3 152Australia* 1,351.2 13,928.6 232 2,227.2 23,270.1 16 876.0 9,341.4 34 897.7 9,569.1 34Austria -983.0 -9,099.4 20 264.7 3,158.8 49 1,247.7 12,258.2 27 1,276.1 12,556.3 27Azerbaijan 10.9 -201.8 67 11.3 297.2 114 0.4 499.0 88 0.5 509.5 88
Bahamas 250.1 2,252.6 220 286.7 2,650.6 52 36.6 398.0 98 39.3 412.9 99Bahrain* 209.6 853.4 207 306.8 1,776.6 64 97.1 923.2 78 101.0 954.6 77Bangladesh -137.6 -3,772.3 27 291.1 1,887.1 63 428.8 5,659.4 43 444.3 5,870.8 43Barbados 63.9 472.0 192 69.9 524.1 96 6.0 52.1 141 6.2 54.0 142Belarus -25.7 -243.0 62 8.5 122.8 141 34.1 365.8 102 36.0 386.9 102Belgium 804.3 12,895.1 231 2,436.2 28,911.6 14 1,631.9 16,016.5 24 1,691.1 16,664.6 24Belize 58.1 152.4 170 61.8 375.8 105 3.6 223.4 110 3.8 225.8 111Benin 15.6 213.5 175 17.2 231.7 125 1.6 18.2 158 1.6 18.5 158Bermuda 29.1 540.8 197 30.4 558.2 90 1.3 17.4 160 1.3 18.0 160Bhutan -0.1 54.9 150 0.2 55.7 164 0.3 0.8 212 0.3 0.8 212Bolivia 8.1 43.6 148 48.9 494.3 98 40.8 450.6 93 41.4 458.4 93Bosnia and Herzegovina 6.5 -47.8 77 11.9 44.1 172 5.4 91.9 126 5.6 95.3 126Botswana -129.3 -362.8 58 7.4 78.7 154 136.7 441.6 94 137.2 449.1 94Brazil 639.4 7,670.2 229 2,978.6 36,334.4 9 2,339.2 28,664.2 17 2,442.3 29,751.5 17British Indian Ocean Territories 0.3 8.9 126 0.3 9.0 202 (-) 0.1 225 (-) 0.1 225British Virgin Islands 104.8 694.3 202 105.2 713.4 82 0.3 19.1 157 0.3 19.4 157Brunei 7.6 148.9 169 9.0 238.7 123 1.4 89.8 128 1.4 93.1 127Bulgaria -53.9 -586.1 50 23.1 337.2 108 77.0 923.4 77 79.4 953.4 78Burkina Faso 4.3 43.7 149 4.7 48.6 169 0.5 4.9 186 0.5 5.0 186Burma -41.8 -225.3 64 22.9 235.8 124 64.7 461.1 92 66.0 475.8 92Burundi -0.7 1.8 114 1.4 14.5 193 2.1 12.7 166 2.1 12.9 168
Cabo Verde 0.5 4.9 118 1.4 8.3 203 0.9 3.4 193 0.9 3.5 193Cambodia -229.2 -3,128.3 30 43.6 403.4 104 272.8 3,531.7 57 283.0 3,667.5 56Cameroon 3.5 -44.1 78 10.9 168.3 137 7.5 212.4 111 7.9 221.6 112Canada** -1,142.4 -17,444.8 11 24,549.1 277,423.7 1 25,691.5 294,868.5 3 26,335.7 301,582.7 3Cayman Islands 135.5 848.9 205 138.9 879.6 81 3.4 30.6 150 3.5 31.2 151Central African Republic -0.1 6.9 120 0.5 9.5 200 0.6 2.6 197 0.6 2.7 198Chad 3.7 -428.4 55 4.2 48.8 168 0.5 477.1 90 0.6 492.5 90Chile* 832.5 3,543.6 224 1,548.2 14,168.1 20 715.7 10,624.5 31 761.2 11,384.1 31China -37,894.6 -382,700.3 1 8,606.2 111,003.2 3 46,500.8 493,703.5 1 48,619.7 515,046.5 1Christmas Island 0.1 (-) 101 0.1 0.8 221 (-) 0.8 211 (-) 0.8 211Cocos (Keeling) Islands -0.2 -2.2 96 (-) 0.3 226 0.2 2.6 198 0.2 2.7 199Colombia* 395.9 1,294.1 214 1,411.5 13,839.1 21 1,015.7 12,545.0 26 1,056.4 13,022.7 26Comoros (-) -0.3 100 0.2 2.7 210 0.1 3.0 194 0.1 3.0 196Congo (Brazzaville) -10.2 -329.0 59 8.9 94.9 151 19.1 423.9 95 19.8 436.4 96Congo (Kinshasa) 4.5 18.4 139 5.9 67.2 158 1.4 48.8 146 1.4 49.4 147Cook Islands 0.5 5.7 119 0.5 6.8 206 (-) 1.0 208 (-) 1.1 208Costa Rica** 230.5 1,494.1 215 632.4 5,982.9 38 401.8 4,488.8 49 421.9 4,735.6 47Cote d'Ivoire -48.6 -865.0 45 13.6 289.5 115 62.2 1,154.5 76 64.1 1,196.2 76Croatia 42.8 110.7 164 82.6 534.2 93 39.8 423.5 96 40.9 437.5 95Cuba 16.7 256.3 182 16.8 257.2 122 0.1 0.9 209 0.1 0.9 209Curacao 14.2 565.2 199 22.5 662.8 85 8.3 97.7 123 8.5 99.7 123Cyprus 6.3 59.7 153 11.1 125.2 140 4.8 65.5 135 4.9 67.8 135Czech Republic -189.7 -1,757.4 40 217.3 2,819.7 51 407.1 4,577.1 48 420.4 4,727.5 48
Denmark -560.0 -5,736.2 24 212.1 2,310.5 58 772.1 8,046.6 35 784.3 8,196.3 35Djibouti 2.9 61.3 154 6.0 101.7 148 3.0 40.3 148 3.1 40.7 148Dominica 13.0 169.3 172 13.1 170.6 136 0.1 1.3 205 0.1 1.3 205Dominican Republic** 329.2 3,269.8 223 749.2 8,178.1 32 420.0 4,908.4 45 431.5 5,036.9 45
Ecuador -170.2 -642.3 49 500.4 5,474.2 40 670.6 6,116.5 41 702.9 6,424.9 41Egypt 237.5 2,396.3 221 379.0 4,620.5 45 141.5 2,224.2 65 148.5 2,316.2 65El Salvador** 117.1 717.8 203 300.6 3,023.2 50 183.5 2,305.4 64 188.5 2,371.8 64Equatorial Guinea 27.9 -383.0 57 28.0 104.1 147 0.1 487.1 89 0.1 508.6 89Eritrea 0.2 7.4 121 0.2 7.6 205 (-) 0.2 220 (-) 0.3 220
Year-to-Date
Country
November Year-to-Date Rank November RankRank November Year-to-Date Rank November Year-to-Date
– 52 –

FT-900 Supplement
Exhibit 4a. Exports, Imports, and Trade Balance of Goods by Country and Area, Not Seasonally Adjusted: 2018In millions of dollars. Details may not equal totals due to rounding. The countries in this exhibit are ranked by year-to-date totals.
(X) Not applicable. (-) Represents zero or less than one-half unit of measurement shown.
Balance Exports Imports
(Customs imports) Domestic & Foreign, F.A.S. basis Customs basis C.I.F. basis
Year-to-Date
Country
November Year-to-Date Rank November RankRank November Year-to-Date Rank November Year-to-Date
Estonia -88.7 -547.1 52 35.8 306.5 112 124.6 853.6 80 128.2 876.8 80Eswatini -1.0 18.3 137 2.2 30.9 181 3.2 12.6 167 3.3 13.0 167Ethiopia 195.5 651.9 201 227.0 1,063.8 77 31.5 411.9 97 32.6 424.5 97
Falkland Islands (Islas Malvinas) (-) -12.9 85 (-) 0.2 229 (-) 13.1 164 (-) 13.2 165Faroe Islands -10.4 -97.3 73 0.4 2.2 211 10.7 99.5 121 13.8 126.0 117Fiji -20.9 -147.4 70 4.4 54.4 166 25.4 201.8 112 31.2 252.9 109Finland -424.0 -4,906.0 25 141.9 1,764.7 65 565.9 6,670.6 39 581.2 6,853.1 39France -1,508.0 -14,313.9 14 3,088.5 33,688.9 11 4,596.6 48,002.8 11 4,691.4 48,982.9 11French Guiana 15.1 227.2 177 15.1 228.3 126 (-) 1.1 207 (-) 1.1 207French Polynesia 9.3 237.6 178 12.5 271.4 120 3.2 33.8 149 3.6 37.5 149French Southern and Antarctic Lands 0.1 0.7 109 0.1 0.8 222 (-) (-) 229 (-) (-) 229
Gabon -6.6 -188.7 68 6.6 99.3 150 13.2 287.9 107 13.9 298.6 107Gambia 3.6 35.6 144 3.7 36.1 177 0.1 0.5 217 0.1 0.5 217Gaza Strip Administered by Israel (-) 0.3 107 (-) 0.4 225 (-) 0.1 224 (-) 0.1 224Georgia 6.4 245.0 179 46.1 432.9 102 39.7 187.9 113 41.1 196.2 113Germany -5,767.8 -62,173.1 3 5,037.2 53,394.3 6 10,805.0 115,567.5 5 11,011.1 117,873.8 5Ghana 45.9 116.3 166 59.9 679.4 83 14.0 563.1 86 15.0 593.8 86Gibraltar 158.0 1,213.0 212 158.0 1,213.4 74 (-) 0.5 218 (-) 0.5 218Greece -53.1 -512.1 53 94.3 961.0 80 147.4 1,473.1 68 157.6 1,581.3 68Greenland 0.9 -6.3 92 1.3 9.7 199 0.4 16.0 161 0.4 16.2 162Grenada 8.8 94.3 161 9.8 108.6 144 1.0 14.3 163 1.2 16.3 161Guadeloupe 33.1 268.7 184 33.3 271.5 119 0.2 2.8 195 0.2 2.9 197Guatemala* 236.7 2,223.9 219 530.6 6,090.4 37 293.9 3,866.5 53 318.3 4,196.1 53Guinea 9.1 113.7 165 9.7 119.0 142 0.6 5.3 183 0.8 6.2 182Guinea-Bissau (-) 18.4 138 (-) 18.6 187 (-) 0.2 223 (-) 0.2 223Guyana 54.5 258.5 183 71.3 502.1 97 16.8 243.6 109 17.7 251.2 110
Haiti 64.3 372.5 189 137.8 1,275.8 70 73.5 903.3 79 75.1 923.4 79Heard and McDonald Islands (-) (-) 102 (-) 0.1 232 (-) 0.1 227 (-) 0.1 227Honduras** 120.6 853.0 206 505.3 5,179.1 41 384.7 4,326.1 51 402.3 4,544.8 51Hong Kong 2,826.7 28,638.4 234 3,209.3 34,565.2 10 382.6 5,926.8 42 391.8 6,066.8 42Hungary -258.7 -3,008.0 32 150.9 1,579.1 66 409.6 4,587.2 47 418.9 4,684.5 49
Iceland -20.8 247.2 180 21.7 638.0 87 42.5 390.7 100 45.1 418.6 98India -1,447.4 -20,188.0 9 2,659.7 30,211.6 12 4,107.1 50,399.6 9 4,265.0 52,331.4 9Indonesia -1,064.3 -11,726.4 17 637.9 7,544.7 34 1,702.2 19,271.1 23 1,793.0 20,182.1 22Iran 26.0 350.7 188 26.3 420.6 103 0.3 69.9 134 0.3 72.6 134Iraq -718.0 -10,233.2 18 104.0 1,245.5 71 822.0 11,478.7 29 838.1 11,721.9 30Ireland -3,959.2 -42,883.6 5 874.7 10,000.2 27 4,833.9 52,883.9 8 4,854.7 53,087.0 8Israel* -689.9 -7,659.3 21 1,149.8 12,471.9 23 1,839.6 20,131.2 21 1,872.4 20,500.5 21Italy -2,796.3 -28,839.0 7 1,635.7 20,985.8 17 4,431.9 49,824.8 10 4,554.8 51,202.0 10
Jamaica 273.3 2,044.9 218 318.6 2,395.2 57 45.3 350.3 103 46.1 363.5 103Japan -5,807.8 -61,658.1 4 6,831.5 68,432.7 4 12,639.4 130,090.8 4 12,954.8 133,265.6 4Jordan* 17.4 -201.9 66 140.3 1,483.4 68 123.0 1,685.3 67 125.8 1,725.2 67
Kazakhstan -36.4 -679.1 48 49.1 665.8 84 85.5 1,344.9 71 90.3 1,390.9 71Kenya -27.3 -268.0 61 26.2 335.2 109 53.5 603.3 85 54.9 619.0 85Kiribati 0.2 1.8 115 0.5 4.4 207 0.3 2.6 199 0.4 3.1 195Korea, North (-) (-) 103 (-) (-) 234 (-) (-) (X) (-) (-) (X)Korea, South* -1,957.7 -16,965.0 12 4,421.6 50,837.1 7 6,379.4 67,802.1 6 6,548.8 69,576.2 6Kosovo 0.9 15.5 134 1.2 17.7 189 0.3 2.2 200 0.3 2.3 200Kuwait 28.9 595.1 200 224.0 2,635.0 53 195.1 2,039.9 66 197.5 2,077.0 66Kyrgyzstan 0.3 8.1 124 1.2 15.1 192 0.9 7.0 178 1.0 7.4 178
Laos -14.4 -112.9 72 0.5 13.9 194 14.8 126.8 116 15.2 130.8 116Latvia -11.7 -205.0 65 58.7 484.8 100 70.4 689.8 83 71.8 706.7 83Lebanon 130.7 1,129.0 210 142.1 1,228.2 72 11.4 99.3 122 11.7 102.2 122Lesotho -43.3 -383.6 56 0.1 2.2 212 43.3 385.8 101 44.4 393.5 101Liberia 11.9 125.2 167 15.9 184.7 132 4.0 59.6 139 4.3 63.2 138Libya -65.1 -1,007.2 44 16.7 218.6 128 81.8 1,225.8 73 84.4 1,263.3 73Liechtenstein -20.4 -232.5 63 1.2 47.9 170 21.7 280.4 108 21.9 284.1 108Lithuania -34.8 -561.3 51 59.9 648.7 86 94.7 1,210.0 74 99.0 1,257.7 74Luxembourg 35.9 502.1 193 80.3 1,006.7 78 44.4 504.6 87 45.9 523.0 87
Macau 59.7 433.1 190 68.9 529.8 94 9.2 96.8 124 9.3 98.9 124Macedonia -33.6 -280.2 60 4.7 35.6 178 38.3 315.8 104 39.4 323.3 104Madagascar -57.9 -695.4 47 2.4 110.3 143 60.3 805.8 81 61.5 818.9 81
– 53 –
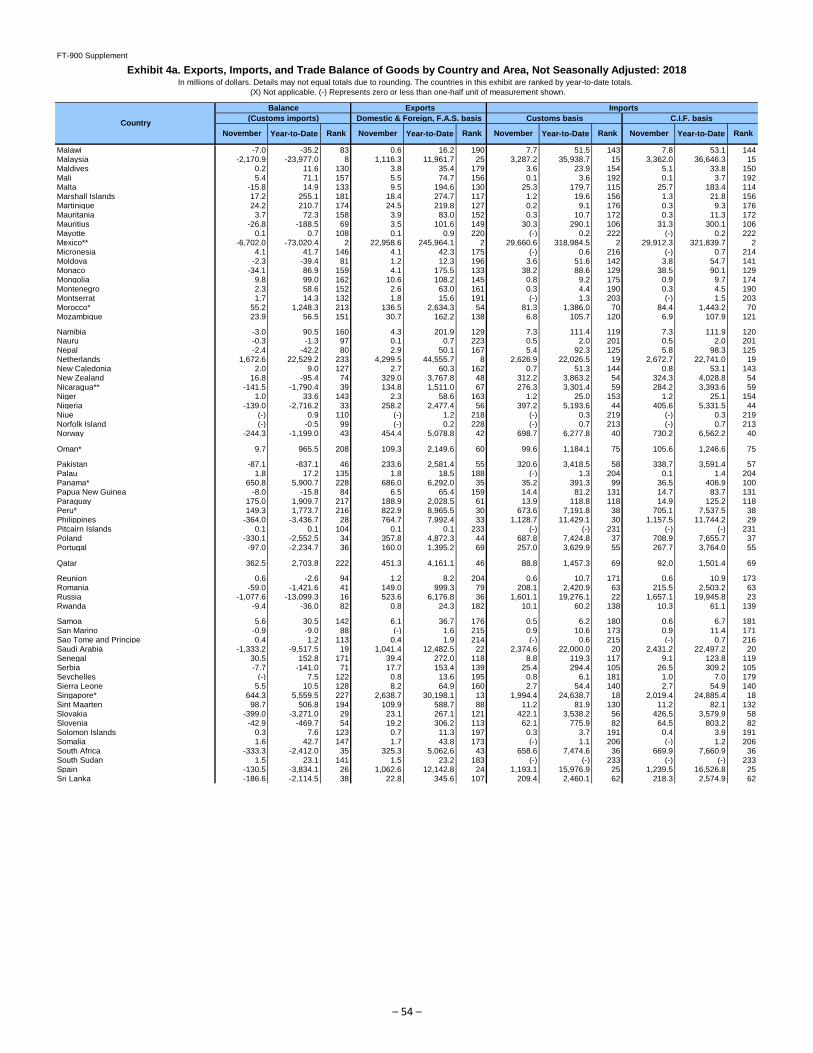
FT-900 Supplement
Exhibit 4a. Exports, Imports, and Trade Balance of Goods by Country and Area, Not Seasonally Adjusted: 2018In millions of dollars. Details may not equal totals due to rounding. The countries in this exhibit are ranked by year-to-date totals.
(X) Not applicable. (-) Represents zero or less than one-half unit of measurement shown.
Balance Exports Imports
(Customs imports) Domestic & Foreign, F.A.S. basis Customs basis C.I.F. basis
Year-to-Date
Country
November Year-to-Date Rank November RankRank November Year-to-Date Rank November Year-to-Date
Malawi -7.0 -35.2 83 0.6 16.2 190 7.7 51.5 143 7.8 53.1 144Malaysia -2,170.9 -23,977.0 8 1,116.3 11,961.7 25 3,287.2 35,938.7 15 3,362.0 36,646.3 15Maldives 0.2 11.6 130 3.8 35.4 179 3.6 23.9 154 5.1 33.8 150Mali 5.4 71.1 157 5.5 74.7 156 0.1 3.6 192 0.1 3.7 192Malta -15.8 14.9 133 9.5 194.6 130 25.3 179.7 115 25.7 183.4 114Marshall Islands 17.2 255.1 181 18.4 274.7 117 1.2 19.6 156 1.3 21.8 156Martinique 24.2 210.7 174 24.5 219.8 127 0.2 9.1 176 0.3 9.3 176Mauritania 3.7 72.3 158 3.9 83.0 152 0.3 10.7 172 0.3 11.3 172Mauritius -26.8 -188.5 69 3.5 101.6 149 30.3 290.1 106 31.3 300.1 106Mayotte 0.1 0.7 108 0.1 0.9 220 (-) 0.2 222 (-) 0.2 222Mexico** -6,702.0 -73,020.4 2 22,958.6 245,964.1 2 29,660.6 318,984.5 2 29,912.3 321,839.7 2Micronesia 4.1 41.7 146 4.1 42.3 175 (-) 0.6 216 (-) 0.7 214Moldova -2.3 -39.4 81 1.2 12.3 196 3.6 51.6 142 3.8 54.7 141Monaco -34.1 86.9 159 4.1 175.5 133 38.2 88.6 129 38.5 90.1 129Mongolia 9.8 99.0 162 10.6 108.2 145 0.8 9.2 175 0.9 9.7 174Montenegro 2.3 58.6 152 2.6 63.0 161 0.3 4.4 190 0.3 4.5 190Montserrat 1.7 14.3 132 1.8 15.6 191 (-) 1.3 203 (-) 1.5 203Morocco* 55.2 1,248.3 213 136.5 2,634.3 54 81.3 1,386.0 70 84.4 1,443.2 70Mozambique 23.9 56.5 151 30.7 162.2 138 6.8 105.7 120 6.9 107.9 121
Namibia -3.0 90.5 160 4.3 201.9 129 7.3 111.4 119 7.3 111.9 120Nauru -0.3 -1.3 97 0.1 0.7 223 0.5 2.0 201 0.5 2.0 201Nepal -2.4 -42.2 80 2.9 50.1 167 5.4 92.3 125 5.8 98.3 125Netherlands 1,672.6 22,529.2 233 4,299.5 44,555.7 8 2,626.9 22,026.5 19 2,672.7 22,741.0 19New Caledonia 2.0 9.0 127 2.7 60.3 162 0.7 51.3 144 0.8 53.1 143New Zealand 16.8 -95.4 74 329.0 3,767.8 48 312.2 3,863.2 54 324.3 4,028.8 54Nicaragua** -141.5 -1,790.4 39 134.8 1,511.0 67 276.3 3,301.4 59 284.2 3,393.6 59Niger 1.0 33.6 143 2.3 58.6 163 1.2 25.0 153 1.2 25.1 154Nigeria -139.0 -2,716.2 33 258.2 2,477.4 56 397.2 5,193.6 44 405.6 5,331.5 44Niue (-) 0.9 110 (-) 1.2 218 (-) 0.3 219 (-) 0.3 219Norfolk Island (-) -0.5 99 (-) 0.2 228 (-) 0.7 213 (-) 0.7 213Norway -244.3 -1,199.0 43 454.4 5,078.8 42 698.7 6,277.8 40 730.2 6,562.2 40
Oman* 9.7 965.5 208 109.3 2,149.6 60 99.6 1,184.1 75 105.6 1,246.6 75
Pakistan -87.1 -837.1 46 233.6 2,581.4 55 320.6 3,418.5 58 338.7 3,591.4 57Palau 1.8 17.2 135 1.8 18.5 188 (-) 1.3 204 0.1 1.4 204Panama* 650.8 5,900.7 228 686.0 6,292.0 35 35.2 391.3 99 36.5 406.9 100Papua New Guinea -8.0 -15.8 84 6.5 65.4 159 14.4 81.2 131 14.7 83.7 131Paraguay 175.0 1,909.7 217 188.9 2,028.5 61 13.9 118.8 118 14.9 125.2 118Peru* 149.3 1,773.7 216 822.9 8,965.5 30 673.6 7,191.8 38 705.1 7,537.5 38Philippines -364.0 -3,436.7 28 764.7 7,992.4 33 1,128.7 11,429.1 30 1,157.5 11,744.2 29Pitcairn Islands 0.1 0.1 104 0.1 0.1 233 (-) (-) 231 (-) (-) 231Poland -330.1 -2,552.5 34 357.8 4,872.3 44 687.8 7,424.8 37 708.9 7,655.7 37Portugal -97.0 -2,234.7 36 160.0 1,395.2 69 257.0 3,629.9 55 267.7 3,764.0 55
Qatar 362.5 2,703.8 222 451.3 4,161.1 46 88.8 1,457.3 69 92.0 1,501.4 69
Reunion 0.6 -2.6 94 1.2 8.2 204 0.6 10.7 171 0.6 10.9 173Romania -59.0 -1,421.6 41 149.0 999.3 79 208.1 2,420.9 63 215.5 2,503.2 63Russia -1,077.6 -13,099.3 16 523.6 6,176.8 36 1,601.1 19,276.1 22 1,657.1 19,945.8 23Rwanda -9.4 -36.0 82 0.8 24.3 182 10.1 60.2 138 10.3 61.1 139
Samoa 5.6 30.5 142 6.1 36.7 176 0.5 6.2 180 0.6 6.7 181San Marino -0.9 -9.0 88 (-) 1.6 215 0.9 10.6 173 0.9 11.4 171Sao Tome and Principe 0.4 1.2 113 0.4 1.9 214 (-) 0.6 215 (-) 0.7 216Saudi Arabia -1,333.2 -9,517.5 19 1,041.4 12,482.5 22 2,374.6 22,000.0 20 2,431.2 22,497.2 20Senegal 30.5 152.8 171 39.4 272.0 118 8.8 119.3 117 9.1 123.8 119Serbia -7.7 -141.0 71 17.7 153.4 139 25.4 294.4 105 26.5 309.2 105Seychelles (-) 7.5 122 0.8 13.6 195 0.8 6.1 181 1.0 7.0 179Sierra Leone 5.5 10.5 128 8.2 64.9 160 2.7 54.4 140 2.7 54.9 140Singapore* 644.3 5,559.5 227 2,638.7 30,198.1 13 1,994.4 24,638.7 18 2,019.4 24,885.4 18Sint Maarten 98.7 506.8 194 109.9 588.7 88 11.2 81.9 130 11.2 82.1 132Slovakia -399.0 -3,271.0 29 23.1 267.1 121 422.1 3,538.2 56 426.5 3,579.9 58Slovenia -42.9 -469.7 54 19.2 306.2 113 62.1 775.9 82 64.5 803.2 82Solomon Islands 0.3 7.6 123 0.7 11.3 197 0.3 3.7 191 0.4 3.9 191Somalia 1.6 42.7 147 1.7 43.8 173 (-) 1.1 206 (-) 1.2 206South Africa -333.3 -2,412.0 35 325.3 5,062.6 43 658.6 7,474.6 36 669.9 7,660.9 36South Sudan 1.5 23.1 141 1.5 23.2 183 (-) (-) 233 (-) (-) 233Spain -130.5 -3,834.1 26 1,062.6 12,142.8 24 1,193.1 15,976.9 25 1,239.5 16,526.8 25Sri Lanka -186.6 -2,114.5 38 22.8 345.6 107 209.4 2,460.1 62 218.3 2,574.9 62
– 54 –
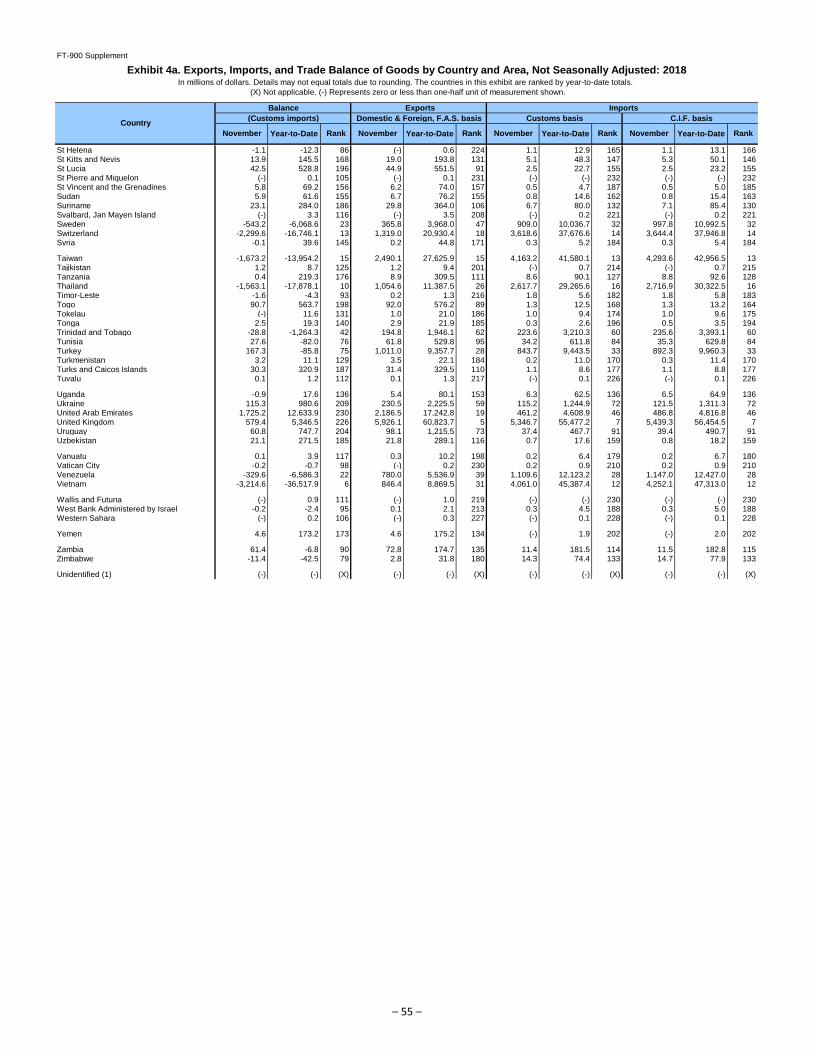
FT-900 Supplement
Exhibit 4a. Exports, Imports, and Trade Balance of Goods by Country and Area, Not Seasonally Adjusted: 2018In millions of dollars. Details may not equal totals due to rounding. The countries in this exhibit are ranked by year-to-date totals.
(X) Not applicable. (-) Represents zero or less than one-half unit of measurement shown.
Balance Exports Imports
(Customs imports) Domestic & Foreign, F.A.S. basis Customs basis C.I.F. basis
Year-to-Date
Country
November Year-to-Date Rank November RankRank November Year-to-Date Rank November Year-to-Date
St Helena -1.1 -12.3 86 (-) 0.6 224 1.1 12.9 165 1.1 13.1 166St Kitts and Nevis 13.9 145.5 168 19.0 193.8 131 5.1 48.3 147 5.3 50.1 146St Lucia 42.5 528.8 196 44.9 551.5 91 2.5 22.7 155 2.5 23.2 155St Pierre and Miquelon (-) 0.1 105 (-) 0.1 231 (-) (-) 232 (-) (-) 232St Vincent and the Grenadines 5.8 69.2 156 6.2 74.0 157 0.5 4.7 187 0.5 5.0 185Sudan 5.9 61.6 155 6.7 76.2 155 0.8 14.6 162 0.8 15.4 163Suriname 23.1 284.0 186 29.8 364.0 106 6.7 80.0 132 7.1 85.4 130Svalbard, Jan Mayen Island (-) 3.3 116 (-) 3.5 208 (-) 0.2 221 (-) 0.2 221Sweden -543.2 -6,068.6 23 365.8 3,968.0 47 909.0 10,036.7 32 997.8 10,992.5 32Switzerland -2,299.6 -16,746.1 13 1,319.0 20,930.4 18 3,618.6 37,676.6 14 3,644.4 37,946.8 14Syria -0.1 39.6 145 0.2 44.8 171 0.3 5.2 184 0.3 5.4 184
Taiwan -1,673.2 -13,954.2 15 2,490.1 27,625.9 15 4,163.2 41,580.1 13 4,293.6 42,956.5 13Tajikistan 1.2 8.7 125 1.2 9.4 201 (-) 0.7 214 (-) 0.7 215Tanzania 0.4 219.3 176 8.9 309.5 111 8.6 90.1 127 8.8 92.6 128Thailand -1,563.1 -17,878.1 10 1,054.6 11,387.5 26 2,617.7 29,265.6 16 2,716.9 30,322.5 16Timor-Leste -1.6 -4.3 93 0.2 1.3 216 1.8 5.6 182 1.8 5.8 183Togo 90.7 563.7 198 92.0 576.2 89 1.3 12.5 168 1.3 13.2 164Tokelau (-) 11.6 131 1.0 21.0 186 1.0 9.4 174 1.0 9.6 175Tonga 2.5 19.3 140 2.9 21.9 185 0.3 2.6 196 0.5 3.5 194Trinidad and Tobago -28.8 -1,264.3 42 194.8 1,946.1 62 223.6 3,210.3 60 235.6 3,393.1 60Tunisia 27.6 -82.0 76 61.8 529.8 95 34.2 611.8 84 35.3 629.8 84Turkey 167.3 -85.8 75 1,011.0 9,357.7 28 843.7 9,443.5 33 892.3 9,960.3 33Turkmenistan 3.2 11.1 129 3.5 22.1 184 0.2 11.0 170 0.3 11.4 170Turks and Caicos Islands 30.3 320.9 187 31.4 329.5 110 1.1 8.6 177 1.1 8.8 177Tuvalu 0.1 1.2 112 0.1 1.3 217 (-) 0.1 226 (-) 0.1 226
Uganda -0.9 17.6 136 5.4 80.1 153 6.3 62.5 136 6.5 64.9 136Ukraine 115.3 980.6 209 230.5 2,225.5 59 115.2 1,244.9 72 121.5 1,311.3 72United Arab Emirates 1,725.2 12,633.9 230 2,186.5 17,242.8 19 461.2 4,608.9 46 486.8 4,816.8 46United Kingdom 579.4 5,346.5 226 5,926.1 60,823.7 5 5,346.7 55,477.2 7 5,439.3 56,454.5 7Uruguay 60.8 747.7 204 98.1 1,215.5 73 37.4 467.7 91 39.4 490.7 91Uzbekistan 21.1 271.5 185 21.8 289.1 116 0.7 17.6 159 0.8 18.2 159
Vanuatu 0.1 3.9 117 0.3 10.2 198 0.2 6.4 179 0.2 6.7 180Vatican City -0.2 -0.7 98 (-) 0.2 230 0.2 0.9 210 0.2 0.9 210Venezuela -329.6 -6,586.3 22 780.0 5,536.9 39 1,109.6 12,123.2 28 1,147.0 12,427.0 28Vietnam -3,214.6 -36,517.9 6 846.4 8,869.5 31 4,061.0 45,387.4 12 4,252.1 47,313.0 12
Wallis and Futuna (-) 0.9 111 (-) 1.0 219 (-) (-) 230 (-) (-) 230West Bank Administered by Israel -0.2 -2.4 95 0.1 2.1 213 0.3 4.5 188 0.3 5.0 188Western Sahara (-) 0.2 106 (-) 0.3 227 (-) 0.1 228 (-) 0.1 228
Yemen 4.6 173.2 173 4.6 175.2 134 (-) 1.9 202 (-) 2.0 202
Zambia 61.4 -6.8 90 72.8 174.7 135 11.4 181.5 114 11.5 182.8 115Zimbabwe -11.4 -42.5 79 2.8 31.8 180 14.3 74.4 133 14.7 77.9 133
Unidentified (1) (-) (-) (X) (-) (-) (X) (-) (-) (X) (-) (-) (X)
– 55 –
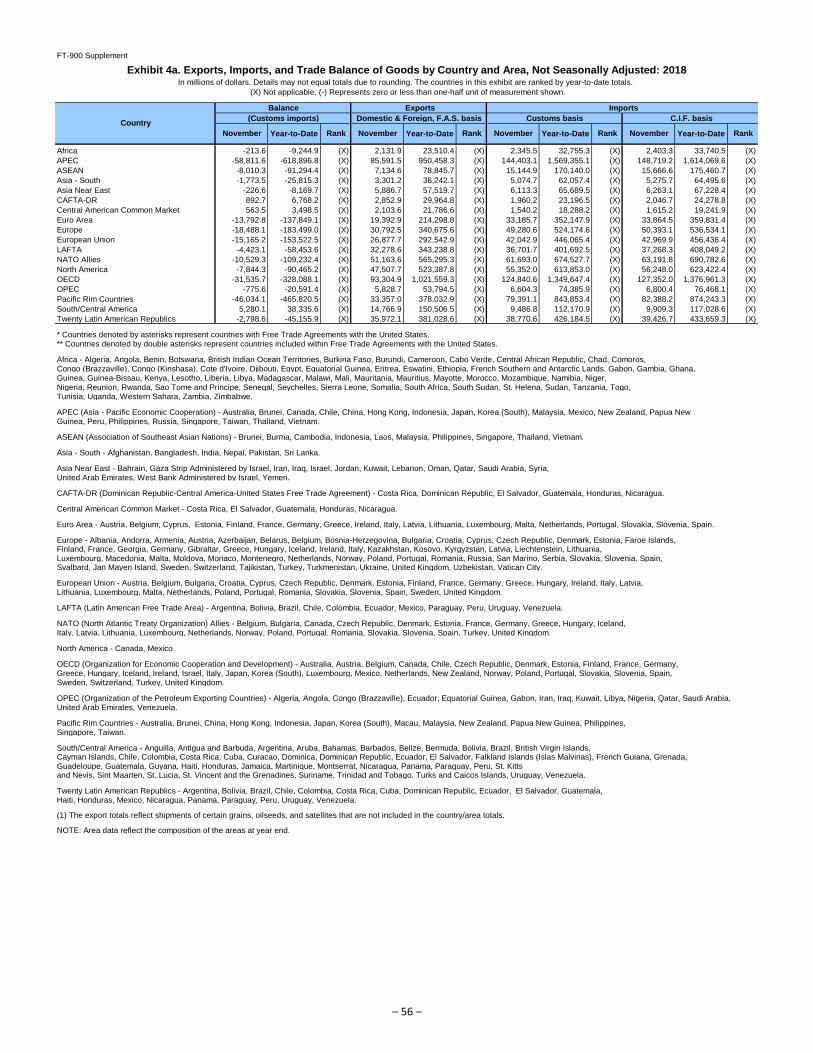
FT-900 Supplement
Exhibit 4a. Exports, Imports, and Trade Balance of Goods by Country and Area, Not Seasonally Adjusted: 2018In millions of dollars. Details may not equal totals due to rounding. The countries in this exhibit are ranked by year-to-date totals.
(X) Not applicable. (-) Represents zero or less than one-half unit of measurement shown.
Balance Exports Imports
(Customs imports) Domestic & Foreign, F.A.S. basis Customs basis C.I.F. basis
Year-to-Date
Country
November Year-to-Date Rank November RankRank November Year-to-Date Rank November Year-to-Date
Africa -213.6 -9,244.9 (X) 2,131.9 23,510.4 (X) 2,345.5 32,755.3 (X) 2,403.3 33,740.5 (X)
APEC -58,811.6 -618,896.8 (X) 85,591.5 950,458.3 (X) 144,403.1 1,569,355.1 (X) 148,719.2 1,614,069.6 (X)
ASEAN -8,010.3 -91,294.4 (X) 7,134.6 78,845.7 (X) 15,144.9 170,140.0 (X) 15,666.6 175,460.7 (X)
Asia - South -1,773.5 -25,815.3 (X) 3,301.2 36,242.1 (X) 5,074.7 62,057.4 (X) 5,275.7 64,495.6 (X)
Asia Near East -226.6 -8,169.7 (X) 5,886.7 57,519.7 (X) 6,113.3 65,689.5 (X) 6,263.1 67,228.4 (X)
CAFTA-DR 892.7 6,768.2 (X) 2,852.9 29,964.8 (X) 1,960.2 23,196.5 (X) 2,046.7 24,278.8 (X)
Central American Common Market 563.5 3,498.5 (X) 2,103.6 21,786.6 (X) 1,540.2 18,288.2 (X) 1,615.2 19,241.9 (X)
Euro Area -13,792.8 -137,849.1 (X) 19,392.9 214,298.8 (X) 33,185.7 352,147.9 (X) 33,864.5 359,831.4 (X)
Europe -18,488.1 -183,499.0 (X) 30,792.5 340,675.6 (X) 49,280.6 524,174.6 (X) 50,393.1 536,534.1 (X)
European Union -15,165.2 -153,522.5 (X) 26,877.7 292,542.9 (X) 42,042.9 446,065.4 (X) 42,969.9 456,436.4 (X)
LAFTA -4,423.1 -58,453.6 (X) 32,278.6 343,238.8 (X) 36,701.7 401,692.5 (X) 37,268.3 408,049.2 (X)
NATO Allies -10,529.3 -109,232.4 (X) 51,163.6 565,295.3 (X) 61,693.0 674,527.7 (X) 63,191.8 690,782.6 (X)
North America -7,844.3 -90,465.2 (X) 47,507.7 523,387.8 (X) 55,352.0 613,853.0 (X) 56,248.0 623,422.4 (X)
OECD -31,535.7 -328,088.1 (X) 93,304.9 1,021,559.3 (X) 124,840.6 1,349,647.4 (X) 127,352.0 1,376,961.3 (X)
OPEC -775.6 -20,591.4 (X) 5,828.7 53,794.5 (X) 6,604.3 74,385.9 (X) 6,800.4 76,468.1 (X)
Pacific Rim Countries -46,034.1 -465,820.5 (X) 33,357.0 378,032.9 (X) 79,391.1 843,853.4 (X) 82,388.2 874,243.3 (X)
South/Central America 5,280.1 38,335.6 (X) 14,766.9 150,506.5 (X) 9,486.8 112,170.9 (X) 9,909.3 117,028.6 (X)
Twenty Latin American Republics -2,798.6 -45,155.9 (X) 35,972.1 381,028.6 (X) 38,770.6 426,184.5 (X) 39,426.7 433,659.3 (X)
* Countries denoted by asterisks represent countries with Free Trade Agreements with the United States.** Countries denoted by double asterisks represent countries included within Free Trade Agreements with the United States.
Africa - Algeria, Angola, Benin, Botswana, British Indian Ocean Territories, Burkina Faso, Burundi, Cameroon, Cabo Verde, Central African Republic, Chad, Comoros, Congo (Brazzaville), Congo (Kinshasa), Cote d'Ivoire, Djibouti, Egypt, Equatorial Guinea, Eritrea, Eswatini, Ethiopia, French Southern and Antarctic Lands, Gabon, Gambia, Ghana,Guinea, Guinea-Bissau, Kenya, Lesotho, Liberia, Libya, Madagascar, Malawi, Mali, Mauritania, Mauritius, Mayotte, Morocco, Mozambique, Namibia, Niger, Nigeria, Reunion, Rwanda, Sao Tome and Principe, Senegal, Seychelles, Sierra Leone, Somalia, South Africa, South Sudan, St. Helena, Sudan, Tanzania, Togo, Tunisia, Uganda, Western Sahara, Zambia, Zimbabwe.
APEC (Asia - Pacific Economic Cooperation) - Australia, Brunei, Canada, Chile, China, Hong Kong, Indonesia, Japan, Korea (South), Malaysia, Mexico, New Zealand, Papua New Guinea, Peru, Philippines, Russia, Singapore, Taiwan, Thailand, Vietnam.
ASEAN (Association of Southeast Asian Nations) - Brunei, Burma, Cambodia, Indonesia, Laos, Malaysia, Philippines, Singapore, Thailand, Vietnam.
Asia - South - Afghanistan, Bangladesh, India, Nepal, Pakistan, Sri Lanka.
Asia Near East - Bahrain, Gaza Strip Administered by Israel, Iran, Iraq, Israel, Jordan, Kuwait, Lebanon, Oman, Qatar, Saudi Arabia, Syria, United Arab Emirates, West Bank Administered by Israel, Yemen.
CAFTA-DR (Dominican Republic-Central America-United States Free Trade Agreement) - Costa Rica, Dominican Republic, El Salvador, Guatemala, Honduras, Nicaragua.
Central American Common Market - Costa Rica, El Salvador, Guatemala, Honduras, Nicaragua.
Euro Area - Austria, Belgium, Cyprus, Estonia, Finland, France, Germany, Greece, Ireland, Italy, Latvia, Lithuania, Luxembourg, Malta, Netherlands, Portugal, Slovakia, Slovenia, Spain.
Europe - Albania, Andorra, Armenia, Austria, Azerbaijan, Belarus, Belgium, Bosnia-Herzegovina, Bulgaria, Croatia, Cyprus, Czech Republic, Denmark, Estonia, Faroe Islands,Finland, France, Georgia, Germany, Gibraltar, Greece, Hungary, Iceland, Ireland, Italy, Kazakhstan, Kosovo, Kyrgyzstan, Latvia, Liechtenstein, Lithuania,Luxembourg, Macedonia, Malta, Moldova, Monaco, Montenegro, Netherlands, Norway, Poland, Portugal, Romania, Russia, San Marino, Serbia, Slovakia, Slovenia, Spain, Svalbard, Jan Mayen Island, Sweden, Switzerland, Tajikistan, Turkey, Turkmenistan, Ukraine, United Kingdom, Uzbekistan, Vatican City.
European Union - Austria, Belgium, Bulgaria, Croatia, Cyprus, Czech Republic, Denmark, Estonia, Finland, France, Germany, Greece, Hungary, Ireland, Italy, Latvia, Lithuania, Luxembourg, Malta, Netherlands, Poland, Portugal, Romania, Slovakia, Slovenia, Spain, Sweden, United Kingdom.
LAFTA (Latin American Free Trade Area) - Argentina, Bolivia, Brazil, Chile, Colombia, Ecuador, Mexico, Paraguay, Peru, Uruguay, Venezuela.
NATO (North Atlantic Treaty Organization) Allies - Belgium, Bulgaria, Canada, Czech Republic, Denmark, Estonia, France, Germany, Greece, Hungary, Iceland, Italy, Latvia, Lithuania, Luxembourg, Netherlands, Norway, Poland, Portugal, Romania, Slovakia, Slovenia, Spain, Turkey, United Kingdom.
North America - Canada, Mexico.
OECD (Organization for Economic Cooperation and Development) - Australia, Austria, Belgium, Canada, Chile, Czech Republic, Denmark, Estonia, Finland, France, Germany,Greece, Hungary, Iceland, Ireland, Israel, Italy, Japan, Korea (South), Luxembourg, Mexico, Netherlands, New Zealand, Norway, Poland, Portugal, Slovakia, Slovenia, Spain,Sweden, Switzerland, Turkey, United Kingdom.
OPEC (Organization of the Petroleum Exporting Countries) - Algeria, Angola, Congo (Brazzaville), Ecuador, Equatorial Guinea, Gabon, Iran, Iraq, Kuwait, Libya, Nigeria, Qatar, Saudi Arabia, United Arab Emirates, Venezuela.
Pacific Rim Countries - Australia, Brunei, China, Hong Kong, Indonesia, Japan, Korea (South), Macau, Malaysia, New Zealand, Papua New Guinea, Philippines,Singapore, Taiwan.
South/Central America - Anguilla, Antigua and Barbuda, Argentina, Aruba, Bahamas, Barbados, Belize, Bermuda, Bolivia, Brazil, British Virgin Islands,Cayman Islands, Chile, Colombia, Costa Rica, Cuba, Curacao, Dominica, Dominican Republic, Ecuador, El Salvador, Falkland Islands (Islas Malvinas), French Guiana, Grenada,Guadeloupe, Guatemala, Guyana, Haiti, Honduras, Jamaica, Martinique, Montserrat, Nicaragua, Panama, Paraguay, Peru, St. Kittsand Nevis, Sint Maarten, St. Lucia, St. Vincent and the Grenadines, Suriname, Trinidad and Tobago, Turks and Caicos Islands, Uruguay, Venezuela.
Twenty Latin American Republics - Argentina, Bolivia, Brazil, Chile, Colombia, Costa Rica, Cuba, Dominican Republic, Ecuador, El Salvador, Guatemala, Haiti, Honduras, Mexico, Nicaragua, Panama, Paraguay, Peru, Uruguay, Venezuela.
(1) The export totals reflect shipments of certain grains, oilseeds, and satellites that are not included in the country/area totals.
NOTE: Area data reflect the composition of the areas at year end.
– 56 –


![WELCOME [] · billion in goods and services in 2016 • USD $2 billion worth of goods and services crossing the border every day • In 2015, 75% of Canada’s exports were to the](https://img.pdfslide.us/doc/110x75/6043d4ec52a2a6187c7460ae/welcome-billion-in-goods-and-services-in-2016-a-usd-2-billion-worth-of-goods.jpg)