Embed Size (px)
Citation preview
U.S. Global InvestorsQuarterly Fund Profi le 4th Quarter 2010
About Our Company
About U.S. Global InvestorsU.S Global Investors, Inc. is an investment management fi rm specializing in gold, natural resources, emerging markets and global infrastructure opportunities around the world.
The company, headquartered in San Antonio, Texas, manages a family of no-load mutual funds across a range of asset classes. In addition, the company manages funds for international clients.
The story of U.S. Global Investors goes back more than 40 years when it began as an investment club. Over the years, the company has formed a strong bond with its investors who have entrusted U.S. Global to help them achieve their fi nancial goals.
Since 1989, the company has been led by CEO Frank Holmes, who purchased a controlling interest that same year. Under Mr. Holmes’ guidance, the company has expanded into new markets and developed a strong culture which shapes U.S. Global Investors’ identity today.
Our VisionTo make people feel fi nancially happy and secure that their wealth is consistently growing.
Our ValuesRespect for People and Teamwork•
Initiative and Responsiveness•
Curiosity to Learn and Improve•
Performance and Results Oriented•
Focused Work Ethic•
Recognition of Achievement•
Stay Connected with Our Award-Winning Weekly Investor Alert or Advisor AlertOur investment team provides unique insights on gold, energy, natural resources, and emerging markets, as well as timely perspectives on the economy and equity and bond markets. Plus, be the fi rst to learn about upcoming webcasts and other special events. E Sign up at www.usfunds.com.
We want to hear from you.Contact us by phone at 1-800-US-FUNDS (1-800-873-8637).
Individual investors can reach our Shareholder Services team at [email protected]. Investment professionals can reach our Institutional Services Team at [email protected].
Our mailing address is:
7900 Callaghan Road San Antonio, TX 78229-2327
Our Story Early Beginnings
U.S. Global Investors was originally started as an investment club in the early 1960s. In 1969 the company became a registered investment adviser under the name Military Services Investments Advisors, Inc. The name was soon changed to Growth and Research Management, Inc.
The First No-Load Precious Metals Fund
In July of 1974 the company launched the Gold Shares Fund (USERX), the nation’s fi rst no-load precious metals fund.
Public Offering
In early 1984, company stakeholders voted to take the company public and the name was changed to United Services Advisors.
Frank Holmes Buys Controlling Stake
In October 1989, Frank Holmes purchased a controlling interest in the company, becoming the fi rm’s chief executive offi cer.
Opening the Door to the China Region
In October 1994, the company opened the fi rst no-load fund dedicated to investing in the China Region.
Name Changed to U.S. Global Investors, Inc.
In June 1996, the company was renamed U.S. Global Investors, Inc. to refl ect its expanded activity in global fi nancial markets.
Eastern European Reconstruction
In the spring of 1997, U.S. Global Investors opened the Eastern European Fund (EUROX) which concentrated on the growth of the region following the collapse of the Soviet Union.
Frank Holmes Wins Mining Fund Manager of the Year Award
In December 2006, Mining Journal magazine named Frank Holmes its “Mining Fund Manager of the Year.”
Taking an Active Role in the Global Community
In the summer of 2007, U.S. Global Investors took leadership roles in two leading global charitable organizations: The Clinton Giustra Sustainable Growth Initiative and the International Crisis Group.
Global Infrastructure Identifi ed as a Global Megatrend
In October 2007, U.S. Global Investors refocused the Global MegaTrends Fund (MEGAX) on global infrastructure investment.
Natural Resource FundsGlobal Resources Fund . . . . . . . . . . . . . . . . . . . . . . . . . . . . . . . . . . . . . . . . . . . . . . . . . . . . . . . . . . . . . . . . . . . . . . . . . . . . . . . . . . . . . . . . . . . . . . . . . . . . . . . . . . . . . . . . .4
Gold and Precious Metals Fund . . . . . . . . . . . . . . . . . . . . . . . . . . . . . . . . . . . . . . . . . . . . . . . . . . . . . . . . . . . . . . . . . . . . . . . . . . . . . . . . . . . . . . . . . . . . . . . . . . . . . . . . .6
World Precious Minerals Fund . . . . . . . . . . . . . . . . . . . . . . . . . . . . . . . . . . . . . . . . . . . . . . . . . . . . . . . . . . . . . . . . . . . . . . . . . . . . . . . . . . . . . . . . . . . . . . . . . . . . . . . . . .8
International Equity FundsChina Region Fund . . . . . . . . . . . . . . . . . . . . . . . . . . . . . . . . . . . . . . . . . . . . . . . . . . . . . . . . . . . . . . . . . . . . . . . . . . . . . . . . . . . . . . . . . . . . . . . . . . . . . . . . . . . . . . . . . . . .10
Eastern European Fund . . . . . . . . . . . . . . . . . . . . . . . . . . . . . . . . . . . . . . . . . . . . . . . . . . . . . . . . . . . . . . . . . . . . . . . . . . . . . . . . . . . . . . . . . . . . . . . . . . . . . . . . . . . . . . . .12
Global Emerging Markets Fund . . . . . . . . . . . . . . . . . . . . . . . . . . . . . . . . . . . . . . . . . . . . . . . . . . . . . . . . . . . . . . . . . . . . . . . . . . . . . . . . . . . . . . . . . . . . . . . . . . . . . . . . .14
Global MegaTrends Fund . . . . . . . . . . . . . . . . . . . . . . . . . . . . . . . . . . . . . . . . . . . . . . . . . . . . . . . . . . . . . . . . . . . . . . . . . . . . . . . . . . . . . . . . . . . . . . . . . . . . . . . . . . . . . .16
Domestic Equity FundsAll American Equity Fund . . . . . . . . . . . . . . . . . . . . . . . . . . . . . . . . . . . . . . . . . . . . . . . . . . . . . . . . . . . . . . . . . . . . . . . . . . . . . . . . . . . . . . . . . . . . . . . . . . . . . . . . . . . . . .18
Holmes Growth Fund . . . . . . . . . . . . . . . . . . . . . . . . . . . . . . . . . . . . . . . . . . . . . . . . . . . . . . . . . . . . . . . . . . . . . . . . . . . . . . . . . . . . . . . . . . . . . . . . . . . . . . . . . . . . . . . . . .20
Fixed Income FundsTax Free Fund . . . . . . . . . . . . . . . . . . . . . . . . . . . . . . . . . . . . . . . . . . . . . . . . . . . . . . . . . . . . . . . . . . . . . . . . . . . . . . . . . . . . . . . . . . . . . . . . . . . . . . . . . . . . . . . . . . . . . . . .22
Near-Term Tax Free Fund . . . . . . . . . . . . . . . . . . . . . . . . . . . . . . . . . . . . . . . . . . . . . . . . . . . . . . . . . . . . . . . . . . . . . . . . . . . . . . . . . . . . . . . . . . . . . . . . . . . . . . . . . . . . . .24
U.S. Government Securities Savings Fund . . . . . . . . . . . . . . . . . . . . . . . . . . . . . . . . . . . . . . . . . . . . . . . . . . . . . . . . . . . . . . . . . . . . . . . . . . . . . . . . . . . . . . . . . . . . . . .26
U.S. Treasury Securities Cash Fund . . . . . . . . . . . . . . . . . . . . . . . . . . . . . . . . . . . . . . . . . . . . . . . . . . . . . . . . . . . . . . . . . . . . . . . . . . . . . . . . . . . . . . . . . . . . . . . . . . . . .26
Returns. . . . . . . . . . . . . . . . . . . . . . . . . . . . . . . . . . . . . . . . . . . . . . . . . . . . . . . . . . . . . . . . . . . . . . . . . . . . . . . . . . . . . . . . . . . . . . . . . . . . . . . . . . . . . . . . . . . . . . . . . . . . . .27
Please consider carefully a fund’s investment objectives, risks, charges and expenses. For this and other important information, obtain a fund prospectus by visiting www.usfunds.com or by calling 1-800-US-FUNDS. Read it carefully before investing. Distributed by U.S. Global Brokerage, Inc. 10-889
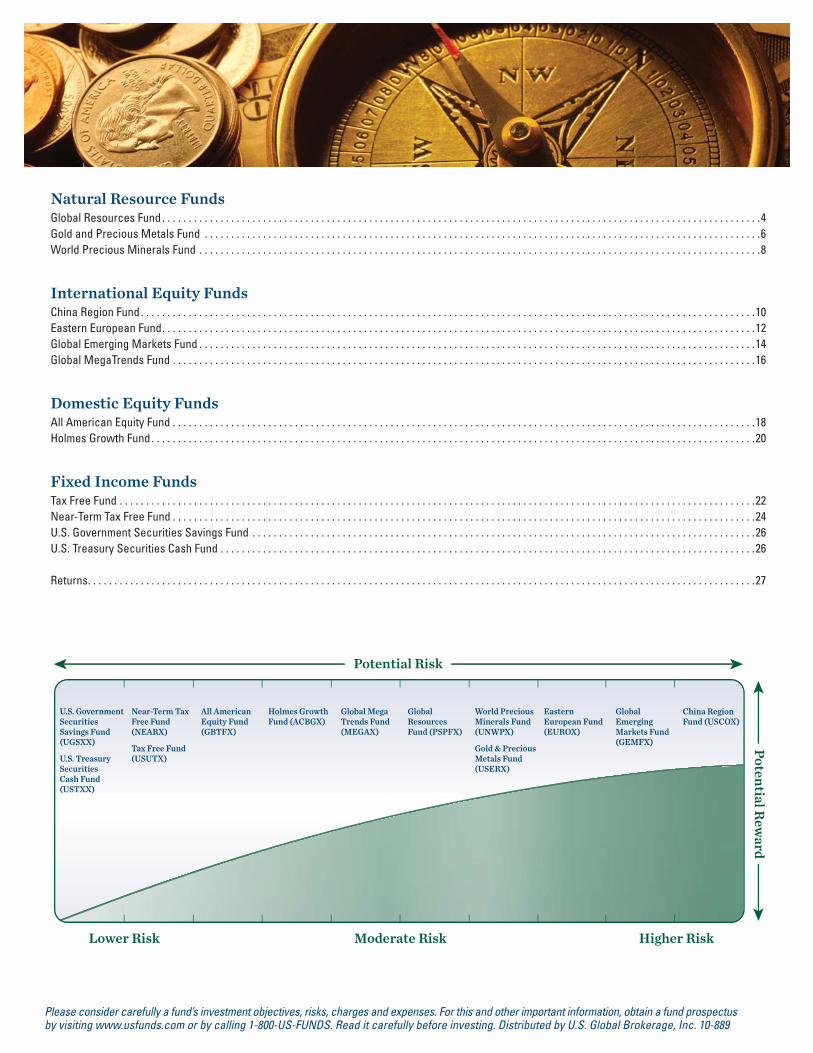
U.S. Government Securities Savings Fund (UGSXX)
U.S. TreasurySecurities Cash Fund (USTXX)
Near-Term Tax Free Fund(NEARX)
Tax Free Fund (USUTX)
All American Equity Fund (GBTFX)
Holmes Growth Fund (ACBGX)
Global MegaTrends Fund (MEGAX)
Global Resources Fund (PSPFX)
World PreciousMinerals Fund (UNWPX)
Gold & Precious Metals Fund(USERX)
Eastern European Fund (EUROX)
Global Emerging Markets Fund (GEMFX)
China Region Fund (USCOX)
Potential Risk
Higher Risk
Po
tentia
l Rew
ard
Lower Risk Moderate Risk
World Precious Minerals Fund
4
Global Resources Fund (PSPFX)
December 2010
Symbol: PSPFX CUSIP: 911476-20-8
Inception Date: 8/3/83
About the FundThe Global Resources Fund takes a diversifi ed approach to the natural resources sector by investing in energy and basic materials. The fund invests in companies involved in the exploration, production and processing of petroleum, natural gas, coal, alternative energies, chemicals, mining, iron and steel, and paper and forest products, and can invest in any part of the world.
Fund ObjectiveThe Global Resources Fund seeks long-term growth of capital while providing protection against infl ation and monetary instability.
Fund StrategyUnder normal market conditions, the Global Resources Fund invests at least 80 percent of its net assets in the common stock, preferred stock, convertible securities, rights and warrants, and depository receipts of companies involved in the natural resources industries. The fund may invest without limitation in any of the various natural resources industries.
Portfolio TeamFrank Holmes, Chief Investment Officer Years of Experience: 30
Brian K. Hicks, CFA Years of Experience: 17
Evan Smith, CFA Years of Experience: 10
Gross expense ratio as stated in the most recent prospectus. Capped expense ratio is a voluntary limit on total fund operating expenses (exclusive of any acquired fund fees and expenses, performance fees, taxes, brokerage commissions and interest) that U.S. Global Investors, Inc. can modify or terminate at any time. Performance data quoted above is historical. Past performance is no guarantee of future results. Results reflect the reinvestment of dividends and other earnings. Current performance may be higher or lower than the performance data quoted. The principal value and investment return of an investment will fluctuate so that your shares, when redeemed, may be worth more or less than their original cost. Performance does not include the effect of any direct fees described in the fund’s prospectus (e.g., short-term trading fees of 0.25%) which, if applicable, would lower your total returns. Performance quoted for periods of one year or less is cumulative and not annualized. Obtain performance data current to the most recent month-end at www.usfunds.com or 1-800-US-FUNDS. High double-digit returns are attributable, in part, to unusually favorable market conditions and may not be repeated or consistently achieved in the future. Since Inception *(08/03/83), **(03/01/10). *** Please refer to the prospectus for Institutional class shares for details about fee waivers.
Average Annual ReturnsAverage Annual Expense Ratio
1 MonthYear to
Date 1-year 3-year 5-year 10-yearSince
Inception Gross Capped
Global Resources Fund (as of 12/31/10)
10.12% 38.00% 38.00% -4.19% 8.50% 19.49% 6.59%* 1.63% 1.90%
Global Resources Fund Inst. Class (as of 12/31/10)
10.17% n/a n/a n/a n/a n/a 38.42%** 1.22% ***
Morgan Stanley Commodity Related Equity Index1 (as of 12/31/10)
10.54% 25.66% 25.66% 4.57% 15.41% 16.08% n/a n/a n/a
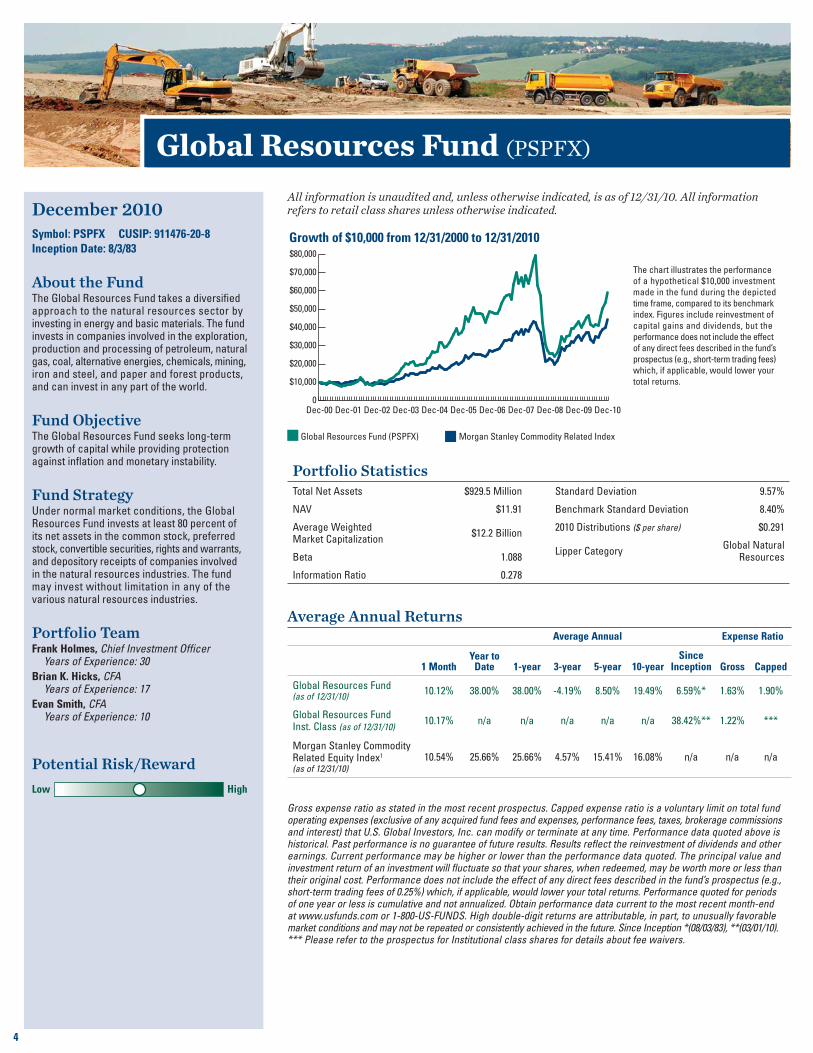
The chart illustrates the performance
of a hypothetical $10,000 investment
made in the fund during the depicted
time frame, compared to its benchmark
index. Figures include reinvestment of
capital gains and dividends, but the
performance does not include the effect
of any direct fees described in the fund’s
prospectus (e.g., short-term trading fees)
which, if applicable, would lower your
total returns.
Global Resources Fund (PSPFX) Morgan Stanley Commodity Related Index
Growth of $10,000 from 12/31/2000 to 12/31/2010
0
$10,000
$20,000
$30,000
$40,000
$50,000
$60,000
$70,000
$80,000
Dec-10 Dec-09 Dec-08 Dec-07 Dec-06 Dec-05 Dec-04 Dec-03 Dec-02 Dec-01 Dec-00
Potential Risk/Reward
Low High
Portfolio StatisticsTotal Net Assets $929.5 Million
NAV $11.91
Average Weighted Market Capitalization
$12.2 Billion
Beta 1.088
Information Ratio 0.278
Standard Deviation 9.57%
Benchmark Standard Deviation 8.40%
2010 Distributions ($ per share) $0.291
Lipper CategoryGlobal Natural
Resources
All information is unaudited and, unless otherwise indicated, is as of 12/31/10. All information refers to retail class shares unless otherwise indicated.
5
Top 5 Regional Breakdown as a percentage of net assets (Country of Domicile)
United States 38.57%
Canada 36.60%
Brazil 4.63%
United Kingdom 4.06%
Netherlands 1.88%
Top 10 Equity Holdings2 as a percentage of net assets
HRT Participacoes Em Petroleo 4.63%
Pacific Rubiales Energy Corp. 3.57%
Anadarko Petroleum Corp. 2.95%
Apache Corp. 1.92%
Halliburton Co. 1.89%
Pioneer Natural Resources Co. 1.87%
Rio Tinto plc 1.81%
Shamaran Petroleum Corp. 1.80%
Gran Tierra Energy, Inc. 1.76%
Agrium, Inc. 1.73%
Percentage of total net assets in top 20 holdings
38.49%
Total number of holdings 139
Industry Breakdown as a percentage of total investments
Oil Companies - Exploration & Production 33.50%
Oil - Field Services 9.88%
Gold Mining 6.99%
Coal 6.04%
Agricultural Chemicals & Fertilizers 4.60%
Metal - Copper 3.05%
Oil & Gas Drilling 2.92%
Oil & Gas Exploration & Production 2.64%
General Metal & Mineral Mining 2.11%
Metal - Iron 2.02%
Metal - Diversified 1.91%
Gold & Silver Mining 1.56%
Forestry 1.55%
Machinery - General Industrial 1.20%
Machinery - Pumps 1.15%
Other 18.79%
Please consider carefully a fund’s investment objectives, risks, charges and expenses. For this and other important information, obtain a fund prospectus by visiting www.usfunds.com or by calling 1-800-US-FUNDS (1-800-873-8637). Read it carefully before investing. Distributed by U.S. Global Brokerage, Inc.
Foreign and emerging market investing involves special risks such as currency fluctuation and less public disclosure, as well as economic and political risk. Because the Global Resources Fund
concentrates its investments in a specific industry, the fund may be subject to greater risks and fluctuations than a portfolio representing a broader range of industries.
There is no guarantee that the investment objectives will be met. 1The Morgan Stanley Commodity Related Index (CRX) is an equal-dollar weighted index of 20 stocks involved in commodity related industries such as energy, non-ferrous metals, agriculture, and forest products. The index was developed with a base value of 200 as of March 15, 1996. 2Portfolio holdings will change. 3Fund assets can include, but are not limited to, equities, bonds, cash, receivables, pre-paid expenses and other miscellaneous assets. Fund composition represents key components only and should not be considered a complete financial picture of a fund’s assets. Beta is a measure of the volatility, or systematic risk, of a security or a portfolio in comparison to the market as a whole. Information Ratio is the ratio of expected return to risk, as measured by standard deviation. Information Ratio is used to measure portfolio management’s performance against a benchmark. Standard deviation is a measure of the dispersion of a set of data from its mean. The more spread apart the data, the higher the deviation. Standard deviation is also known as historical volatility. Morningstar Ratings are based on risk-adjusted return. The Overall Morningstar Rating for a fund is derived from a weighted-average of the performance figures associated with its three-, five- and ten-year (if applicable) Morningstar Rating metrics. Past performance does not guarantee future results. For each fund with at least a three-year history, Morningstar calculates a Morningstar Rating™ based on a Morningstar Risk-Adjusted Return measure that accounts for variation in a fund’s monthly performance (including the effects of sales charges, loads, and redemption fees), placing more emphasis on downward variations and rewarding consistent performance. The top 10% of funds in each category receive 5 stars, the next 22.5% receive 4 stars, the next 35% receive 3 stars, the next 22.5% receive 2 stars and the bottom 10% receive 1 star. (Each share class is counted as a fraction of one fund within this scale and rated separately, which may cause slight variations in the distribution percentages.)
Fund Composition3 as a percentage of total investments
Equities 91.62%
Cash Equivalents 7.86%
Bonds 0.52%
Assets by Capitalizationas a percentage of total assets
Small Cap (under $1 Billion) 22.85%
Mid Cap ($1 – $10 Billion) 46.82%
Large Cap (over $10 Billion) 30.33%
★★★★ Morningstar 10-year Rating™
Among 103, 103, 66, and 37 Natural Resources funds, the Global Resources Fund earned 3 stars, 2 stars, 1 star and 4 stars for the overall, 3-, 5- and 10-year periods ending 12/31/10.
#1 Global Natural Resources Fund for 1-year and 10-year
According to Lipper, the Global Resources Fund ranked 1 out of 131, 17 out of 54, and 1 out of 32 global natural resources funds for total return for the 1-, 5- and 10-year periods as of 12/31/2010. Past performance does not guarantee future results.
World Precious Minerals Fund
All information is unaudited and, unless otherwise indicated, is as of 12/31/10.
6
Gold and Precious Metals Fund (USERX)
December 2010
Symbol: USERX CUSIP: 911478-10-5
Inception Date: 7/1/74
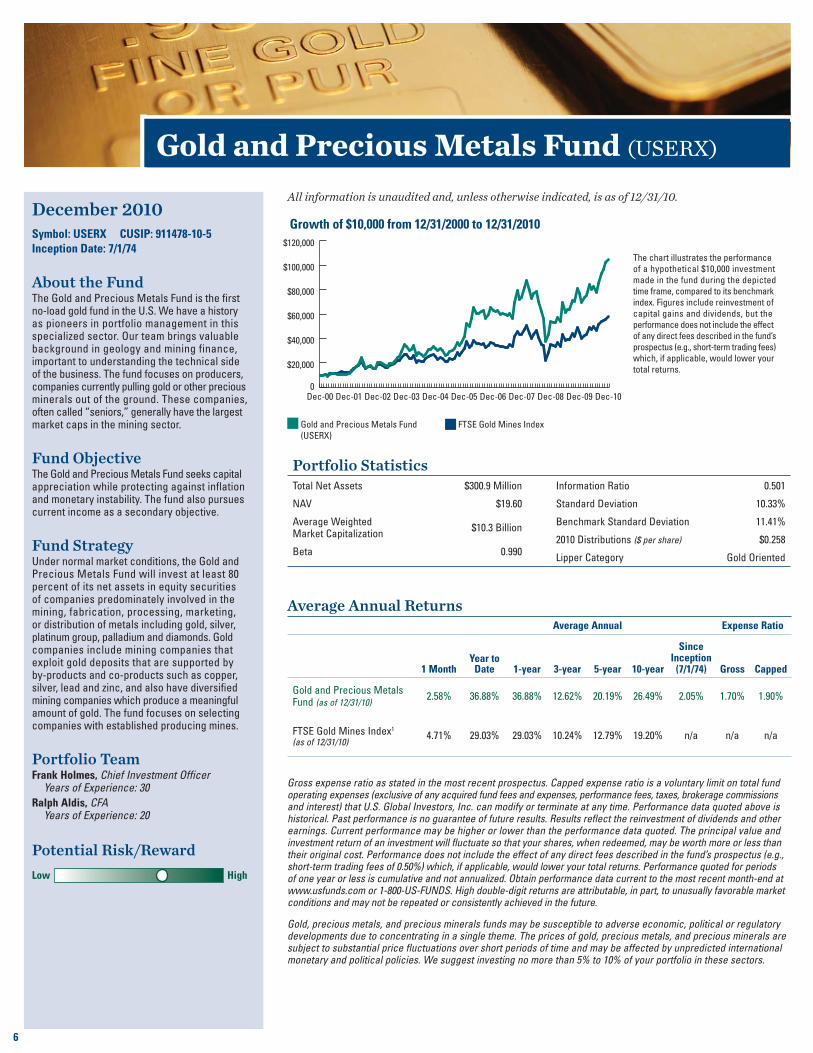
About the FundThe Gold and Precious Metals Fund is the fi rst no-load gold fund in the U.S. We have a history as pioneers in portfolio management in this specialized sector. Our team brings valuable background in geology and mining finance, important to understanding the technical side of the business. The fund focuses on producers, companies currently pulling gold or other precious minerals out of the ground. These companies, often called “seniors,” generally have the largest market caps in the mining sector.
Fund ObjectiveThe Gold and Precious Metals Fund seeks capital appreciation while protecting against infl ation and monetary instability. The fund also pursues current income as a secondary objective.
Fund StrategyUnder normal market conditions, the Gold and Precious Metals Fund will invest at least 80 percent of its net assets in equity securities of companies predominately involved in the mining, fabrication, processing, marketing, or distribution of metals including gold, silver, platinum group, palladium and diamonds. Gold companies include mining companies that exploit gold deposits that are supported by by-products and co-products such as copper, silver, lead and zinc, and also have diversifi ed mining companies which produce a meaningful amount of gold. The fund focuses on selecting companies with established producing mines.
Portfolio TeamFrank Holmes, Chief Investment Officer Years of Experience: 30
Ralph Aldis, CFA Years of Experience: 20
Gross expense ratio as stated in the most recent prospectus. Capped expense ratio is a voluntary limit on total fund operating expenses (exclusive of any acquired fund fees and expenses, performance fees, taxes, brokerage commissions and interest) that U.S. Global Investors, Inc. can modify or terminate at any time. Performance data quoted above is historical. Past performance is no guarantee of future results. Results reflect the reinvestment of dividends and other earnings. Current performance may be higher or lower than the performance data quoted. The principal value and investment return of an investment will fluctuate so that your shares, when redeemed, may be worth more or less than their original cost. Performance does not include the effect of any direct fees described in the fund’s prospectus (e.g., short-term trading fees of 0.50%) which, if applicable, would lower your total returns. Performance quoted for periods of one year or less is cumulative and not annualized. Obtain performance data current to the most recent month-end at www.usfunds.com or 1-800-US-FUNDS. High double-digit returns are attributable, in part, to unusually favorable market conditions and may not be repeated or consistently achieved in the future.
Gold, precious metals, and precious minerals funds may be susceptible to adverse economic, political or regulatory developments due to concentrating in a single theme. The prices of gold, precious metals, and precious minerals are subject to substantial price fluctuations over short periods of time and may be affected by unpredicted international monetary and political policies. We suggest investing no more than 5% to 10% of your portfolio in these sectors.
Average Annual ReturnsAverage Annual Expense Ratio
1 MonthYear to
Date 1-year 3-year 5-year 10-year
Since Inception
(7/1/74) Gross Capped
Gold and Precious Metals Fund (as of 12/31/10)
2.58% 36.88% 36.88% 12.62% 20.19% 26.49% 2.05% 1.70% 1.90%
FTSE Gold Mines Index1 (as of 12/31/10)
4.71% 29.03% 29.03% 10.24% 12.79% 19.20% n/a n/a n/a
The chart illustrates the performance
of a hypothetical $10,000 investment
made in the fund during the depicted
time frame, compared to its benchmark
index. Figures include reinvestment of
capital gains and dividends, but the
performance does not include the effect
of any direct fees described in the fund’s
prospectus (e.g., short-term trading fees)
which, if applicable, would lower your
total returns.
Gold and Precious Metals Fund
(USERX)
FTSE Gold Mines Index
Growth of $10,000 from 12/31/2000 to 12/31/2010
0
$20,000
$40,000
$60,000
$80,000
$100,000
$120,000
Dec-10 Dec-09 Dec-08 Dec-07 Dec-06 Dec-05 Dec-04 Dec-03 Dec-02 Dec-01 Dec-00
Potential Risk/Reward
Low High
Portfolio StatisticsTotal Net Assets $300.9 Million
NAV $19.60
Average Weighted Market Capitalization
$10.3 Billion
Beta 0.990
Information Ratio 0.501
Standard Deviation 10.33%
Benchmark Standard Deviation 11.41%
2010 Distributions ($ per share) $0.258
Lipper Category Gold Oriented
7
Top 5 Regional Breakdown as a percentage of net assets (Country of Domicile)
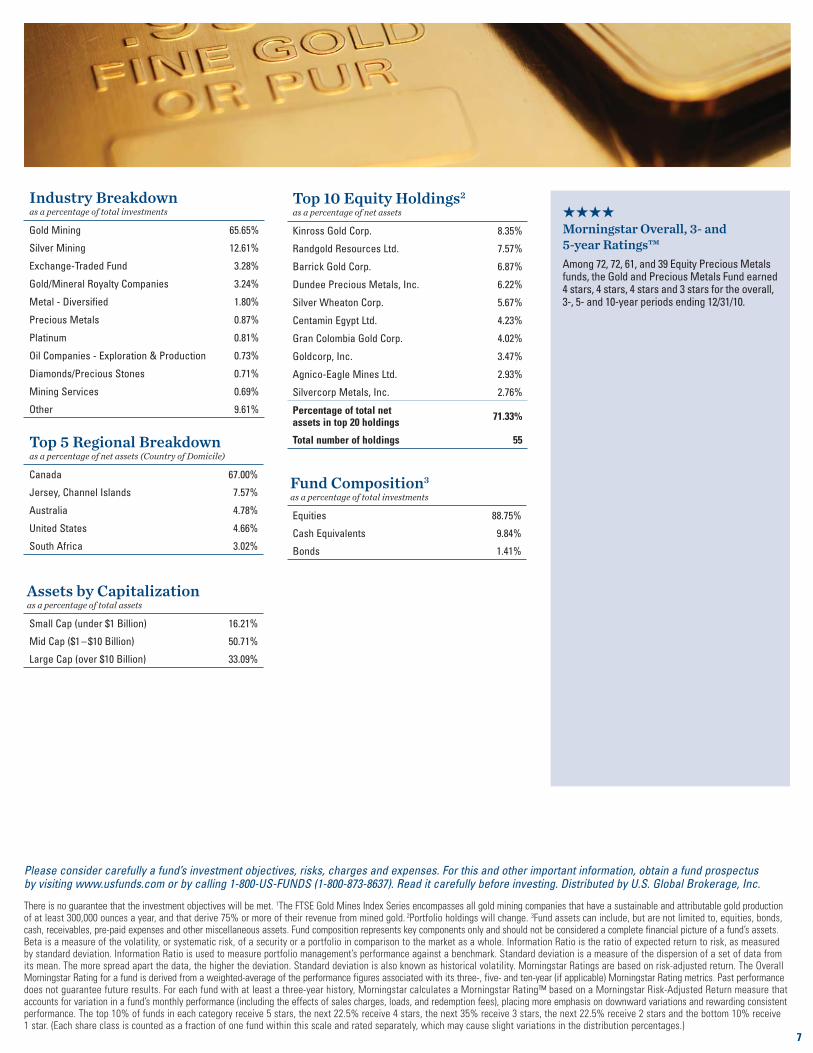
Canada 67.00%
Jersey, Channel Islands 7.57%
Australia 4.78%
United States 4.66%
South Africa 3.02%
Top 10 Equity Holdings2 as a percentage of net assets
Kinross Gold Corp. 8.35%
Randgold Resources Ltd. 7.57%
Barrick Gold Corp. 6.87%
Dundee Precious Metals, Inc. 6.22%
Silver Wheaton Corp. 5.67%
Centamin Egypt Ltd. 4.23%
Gran Colombia Gold Corp. 4.02%
Goldcorp, Inc. 3.47%
Agnico-Eagle Mines Ltd. 2.93%
Silvercorp Metals, Inc. 2.76%
Percentage of total net assets in top 20 holdings
71.33%
Total number of holdings 55
Industry Breakdown as a percentage of total investments
Gold Mining 65.65%
Silver Mining 12.61%
Exchange-Traded Fund 3.28%
Gold/Mineral Royalty Companies 3.24%
Metal - Diversified 1.80%
Precious Metals 0.87%
Platinum 0.81%
Oil Companies - Exploration & Production 0.73%
Diamonds/Precious Stones 0.71%
Mining Services 0.69%
Other 9.61%
Please consider carefully a fund’s investment objectives, risks, charges and expenses. For this and other important information, obtain a fund prospectus by visiting www.usfunds.com or by calling 1-800-US-FUNDS (1-800-873-8637). Read it carefully before investing. Distributed by U.S. Global Brokerage, Inc.
There is no guarantee that the investment objectives will be met. 1The FTSE Gold Mines Index Series encompasses all gold mining companies that have a sustainable and attributable gold production of at least 300,000 ounces a year, and that derive 75% or more of their revenue from mined gold. 2Portfolio holdings will change. 3Fund assets can include, but are not limited to, equities, bonds, cash, receivables, pre-paid expenses and other miscellaneous assets. Fund composition represents key components only and should not be considered a complete financial picture of a fund’s assets. Beta is a measure of the volatility, or systematic risk, of a security or a portfolio in comparison to the market as a whole. Information Ratio is the ratio of expected return to risk, as measuredby standard deviation. Information Ratio is used to measure portfolio management’s performance against a benchmark. Standard deviation is a measure of the dispersion of a set of data from its mean. The more spread apart the data, the higher the deviation. Standard deviation is also known as historical volatility. Morningstar Ratings are based on risk-adjusted return. The Overall Morningstar Rating for a fund is derived from a weighted-average of the performance figures associated with its three-, five- and ten-year (if applicable) Morningstar Rating metrics. Past performance does not guarantee future results. For each fund with at least a three-year history, Morningstar calculates a Morningstar Rating™ based on a Morningstar Risk-Adjusted Return measure that accounts for variation in a fund’s monthly performance (including the effects of sales charges, loads, and redemption fees), placing more emphasis on downward variations and rewarding consistent performance. The top 10% of funds in each category receive 5 stars, the next 22.5% receive 4 stars, the next 35% receive 3 stars, the next 22.5% receive 2 stars and the bottom 10% receive 1 star. (Each share class is counted as a fraction of one fund within this scale and rated separately, which may cause slight variations in the distribution percentages.)
Fund Composition3 as a percentage of total investments
Equities 88.75%
Cash Equivalents 9.84%
Bonds 1.41%
Assets by Capitalizationas a percentage of total assets
Small Cap (under $1 Billion) 16.21%
Mid Cap ($1 – $10 Billion) 50.71%
Large Cap (over $10 Billion) 33.09%
★★★★ Morningstar Overall, 3- and 5-year Ratings™
Among 72, 72, 61, and 39 Equity Precious Metals funds, the Gold and Precious Metals Fund earned 4 stars, 4 stars, 4 stars and 3 stars for the overall, 3-, 5- and 10-year periods ending 12/31/10.
World Precious Minerals Fund
8
World Precious Minerals Fund (UNWPX)
December 2010
Symbol: UNWPX CUSIP: 911476-80-2
Inception Date: 11/27/85
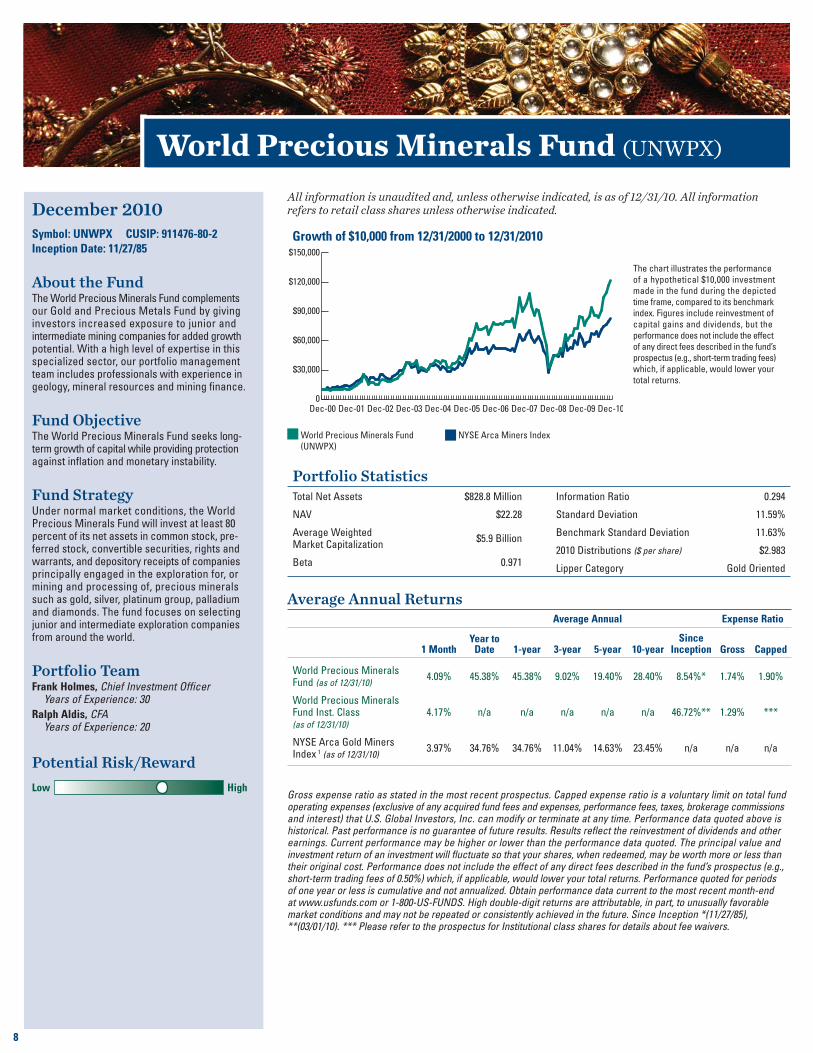
About the FundThe World Precious Minerals Fund complements our Gold and Precious Metals Fund by giving investors increased exposure to junior and intermediate mining companies for added growth potential. With a high level of expertise in this specialized sector, our portfolio management team includes professionals with experience in geology, mineral resources and mining fi nance.
Fund ObjectiveThe World Precious Minerals Fund seeks long-term growth of capital while providing protection against infl ation and monetary instability.
Fund StrategyUnder normal market conditions, the World Precious Minerals Fund will invest at least 80 percent of its net assets in common stock, pre-ferred stock, convertible securities, rights and warrants, and depository receipts of companies principally engaged in the exploration for, or mining and processing of, precious minerals such as gold, silver, platinum group, palladium and diamonds. The fund focuses on selecting junior and intermediate exploration companies from around the world.
Portfolio TeamFrank Holmes, Chief Investment Officer Years of Experience: 30
Ralph Aldis, CFA Years of Experience: 20
Gross expense ratio as stated in the most recent prospectus. Capped expense ratio is a voluntary limit on total fund operating expenses (exclusive of any acquired fund fees and expenses, performance fees, taxes, brokerage commissions and interest) that U.S. Global Investors, Inc. can modify or terminate at any time. Performance data quoted above is historical. Past performance is no guarantee of future results. Results reflect the reinvestment of dividends and other earnings. Current performance may be higher or lower than the performance data quoted. The principal value and investment return of an investment will fluctuate so that your shares, when redeemed, may be worth more or less than their original cost. Performance does not include the effect of any direct fees described in the fund’s prospectus (e.g., short-term trading fees of 0.50%) which, if applicable, would lower your total returns. Performance quoted for periods of one year or less is cumulative and not annualized. Obtain performance data current to the most recent month-end at www.usfunds.com or 1-800-US-FUNDS. High double-digit returns are attributable, in part, to unusually favorable market conditions and may not be repeated or consistently achieved in the future. Since Inception *(11/27/85), **(03/01/10). *** Please refer to the prospectus for Institutional class shares for details about fee waivers.
Average Annual ReturnsAverage Annual Expense Ratio
1 MonthYear to
Date 1-year 3-year 5-year 10-yearSince
Inception Gross Capped
World Precious Minerals Fund (as of 12/31/10)
4.09% 45.38% 45.38% 9.02% 19.40% 28.40% 8.54%* 1.74% 1.90%
World Precious Minerals Fund Inst. Class (as of 12/31/10)
4.17% n/a n/a n/a n/a n/a 46.72%** 1.29% ***
NYSE Arca Gold Miners Index 1 (as of 12/31/10)
3.97% 34.76% 34.76% 11.04% 14.63% 23.45% n/a n/a n/a
The chart illustrates the performance
of a hypothetical $10,000 investment
made in the fund during the depicted
time frame, compared to its benchmark
index. Figures include reinvestment of
capital gains and dividends, but the
performance does not include the effect
of any direct fees described in the fund’s
prospectus (e.g., short-term trading fees)
which, if applicable, would lower your
total returns.
World Precious Minerals Fund
(UNWPX)
NYSE Arca Miners Index
Growth of $10,000 from 12/31/2000 to 12/31/2010
0
$30,000
$60,000
$90,000
$120,000
$150,000
Dec-10 Dec-09 Dec-08 Dec-07 Dec-06 Dec-05 Dec-04 Dec-03 Dec-02 Dec-01 Dec-00
Potential Risk/Reward
Low High
Portfolio StatisticsTotal Net Assets $828.8 Million
NAV $22.28
Average Weighted Market Capitalization
$5.9 Billion
Beta 0.971
Information Ratio 0.294
Standard Deviation 11.59%
Benchmark Standard Deviation 11.63%
2010 Distributions ($ per share) $2.983
Lipper Category Gold Oriented
All information is unaudited and, unless otherwise indicated, is as of 12/31/10. All information refers to retail class shares unless otherwise indicated.
9
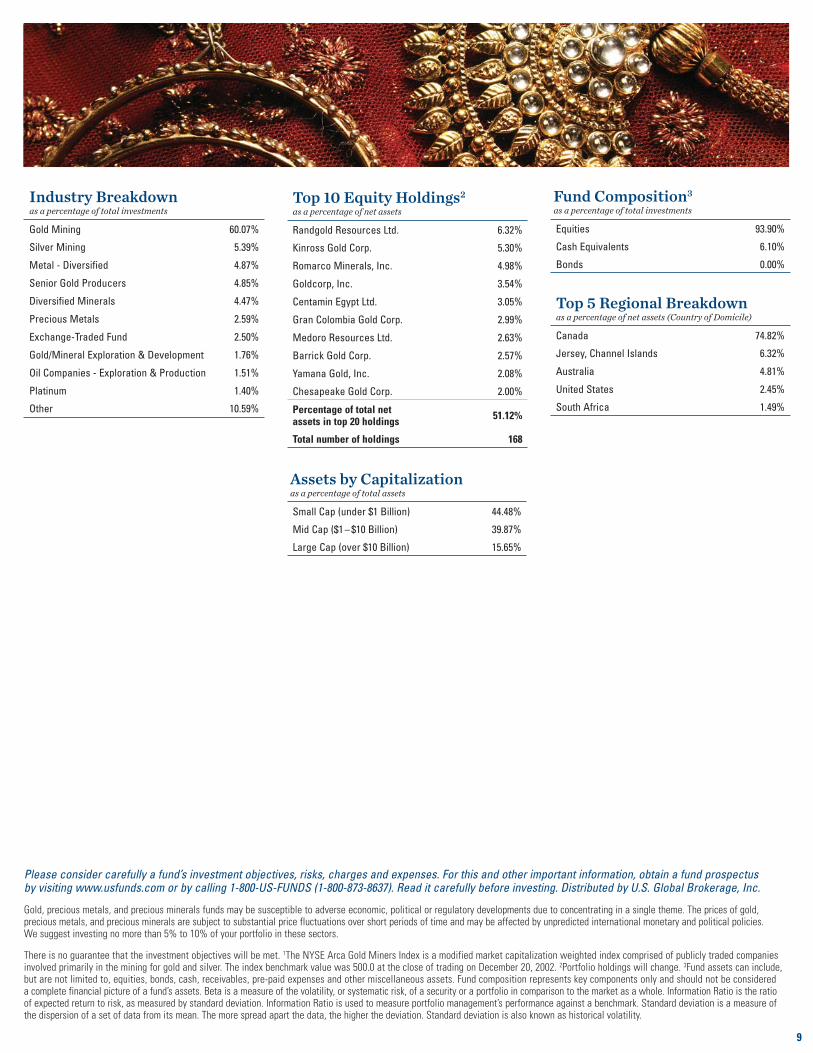
Top 5 Regional Breakdown as a percentage of net assets (Country of Domicile)
Canada 74.82%
Jersey, Channel Islands 6.32%
Australia 4.81%
United States 2.45%
South Africa 1.49%
Top 10 Equity Holdings2 as a percentage of net assets
Randgold Resources Ltd. 6.32%
Kinross Gold Corp. 5.30%
Romarco Minerals, Inc. 4.98%
Goldcorp, Inc. 3.54%
Centamin Egypt Ltd. 3.05%
Gran Colombia Gold Corp. 2.99%
Medoro Resources Ltd. 2.63%
Barrick Gold Corp. 2.57%
Yamana Gold, Inc. 2.08%
Chesapeake Gold Corp. 2.00%
Percentage of total net assets in top 20 holdings
51.12%
Total number of holdings 168
Industry Breakdown as a percentage of total investments
Gold Mining 60.07%
Silver Mining 5.39%
Metal - Diversified 4.87%
Senior Gold Producers 4.85%
Diversified Minerals 4.47%
Precious Metals 2.59%
Exchange-Traded Fund 2.50%
Gold/Mineral Exploration & Development 1.76%
Oil Companies - Exploration & Production 1.51%
Platinum 1.40%
Other 10.59%
Please consider carefully a fund’s investment objectives, risks, charges and expenses. For this and other important information, obtain a fund prospectus by visiting www.usfunds.com or by calling 1-800-US-FUNDS (1-800-873-8637). Read it carefully before investing. Distributed by U.S. Global Brokerage, Inc.
Gold, precious metals, and precious minerals funds may be susceptible to adverse economic, political or regulatory developments due to concentrating in a single theme. The prices of gold, precious metals, and precious minerals are subject to substantial price fluctuations over short periods of time and may be affected by unpredicted international monetary and political policies. We suggest investing no more than 5% to 10% of your portfolio in these sectors.
There is no guarantee that the investment objectives will be met. 1The NYSE Arca Gold Miners Index is a modified market capitalization weighted index comprised of publicly traded companies involved primarily in the mining for gold and silver. The index benchmark value was 500.0 at the close of trading on December 20, 2002. 2Portfolio holdings will change. 3Fund assets can include, but are not limited to, equities, bonds, cash, receivables, pre-paid expenses and other miscellaneous assets. Fund composition represents key components only and should not be considered a complete financial picture of a fund’s assets. Beta is a measure of the volatility, or systematic risk, of a security or a portfolio in comparison to the market as a whole. Information Ratio is the ratio of expected return to risk, as measured by standard deviation. Information Ratio is used to measure portfolio management’s performance against a benchmark. Standard deviation is a measure of the dispersion of a set of data from its mean. The more spread apart the data, the higher the deviation. Standard deviation is also known as historical volatility.
Fund Composition3 as a percentage of total investments
Equities 93.90%
Cash Equivalents 6.10%
Bonds 0.00%
Assets by Capitalizationas a percentage of total assets
Small Cap (under $1 Billion) 44.48%
Mid Cap ($1 – $10 Billion) 39.87%
Large Cap (over $10 Billion) 15.65%
World Precious Minerals Fund
All information is unaudited and, unless otherwise indicated, is as of 12/31/10.
10
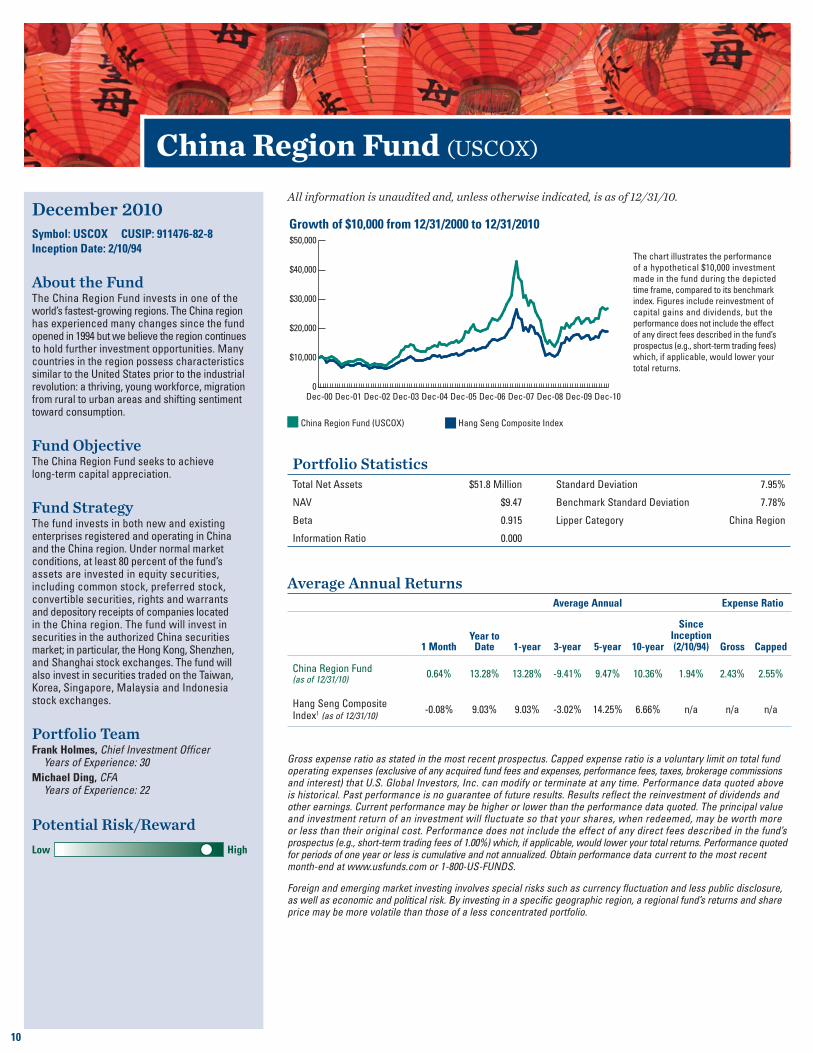
China Region Fund (USCOX)
December 2010
Symbol: USCOX CUSIP: 911476-82-8
Inception Date: 2/10/94
About the FundThe China Region Fund invests in one of the world’s fastest-growing regions. The China region has experienced many changes since the fund opened in 1994 but we believe the region continues to hold further investment opportunities. Many countries in the region possess characteristics similar to the United States prior to the industrial revolution: a thriving, young workforce, migration from rural to urban areas and shifting sentiment toward consumption.
Fund ObjectiveThe China Region Fund seeks to achieve long-term capital appreciation.
Fund StrategyThe fund invests in both new and existing enterprises registered and operating in China and the China region. Under normal market conditions, at least 80 percent of the fund’s assets are invested in equity securities, including common stock, preferred stock, convertible securities, rights and warrants and depository receipts of companies located in the China region. The fund will invest in securities in the authorized China securities market; in particular, the Hong Kong, Shenzhen, and Shanghai stock exchanges. The fund will also invest in securities traded on the Taiwan, Korea, Singapore, Malaysia and Indonesia stock exchanges.
Portfolio TeamFrank Holmes, Chief Investment Officer Years of Experience: 30
Michael Ding, CFA Years of Experience: 22
Gross expense ratio as stated in the most recent prospectus. Capped expense ratio is a voluntary limit on total fund operating expenses (exclusive of any acquired fund fees and expenses, performance fees, taxes, brokerage commissions and interest) that U.S. Global Investors, Inc. can modify or terminate at any time. Performance data quoted above is historical. Past performance is no guarantee of future results. Results reflect the reinvestment of dividends and other earnings. Current performance may be higher or lower than the performance data quoted. The principal value and investment return of an investment will fluctuate so that your shares, when redeemed, may be worth more or less than their original cost. Performance does not include the effect of any direct fees described in the fund’s prospectus (e.g., short-term trading fees of 1.00%) which, if applicable, would lower your total returns. Performance quoted for periods of one year or less is cumulative and not annualized. Obtain performance data current to the most recent month-end at www.usfunds.com or 1-800-US-FUNDS.
Foreign and emerging market investing involves special risks such as currency fluctuation and less public disclosure, as well as economic and political risk. By investing in a specific geographic region, a regional fund’s returns and share price may be more volatile than those of a less concentrated portfolio.
Average Annual ReturnsAverage Annual Expense Ratio
1 MonthYear to
Date 1-year 3-year 5-year 10-year
Since Inception (2/10/94) Gross Capped
China Region Fund (as of 12/31/10)
0.64% 13.28% 13.28% -9.41% 9.47% 10.36% 1.94% 2.43% 2.55%
Hang Seng Composite Index1 (as of 12/31/10)
-0.08% 9.03% 9.03% -3.02% 14.25% 6.66% n/a n/a n/a
The chart illustrates the performance
of a hypothetical $10,000 investment
made in the fund during the depicted
time frame, compared to its benchmark
index. Figures include reinvestment of
capital gains and dividends, but the
performance does not include the effect
of any direct fees described in the fund’s
prospectus (e.g., short-term trading fees)
which, if applicable, would lower your
total returns.
China Region Fund (USCOX) Hang Seng Composite Index
Growth of $10,000 from 12/31/2000 to 12/31/2010
0
$10,000
$20,000
$30,000
$40,000
$50,000
Dec-10 Dec-09 Dec-08 Dec-07 Dec-06 Dec-05 Dec-04 Dec-03 Dec-02 Dec-01 Dec-00
Potential Risk/Reward
Low High
Portfolio StatisticsTotal Net Assets $51.8 Million
NAV $9.47
Beta 0.915
Information Ratio 0.000
Standard Deviation 7.95%
Benchmark Standard Deviation 7.78%
Lipper Category China Region
11
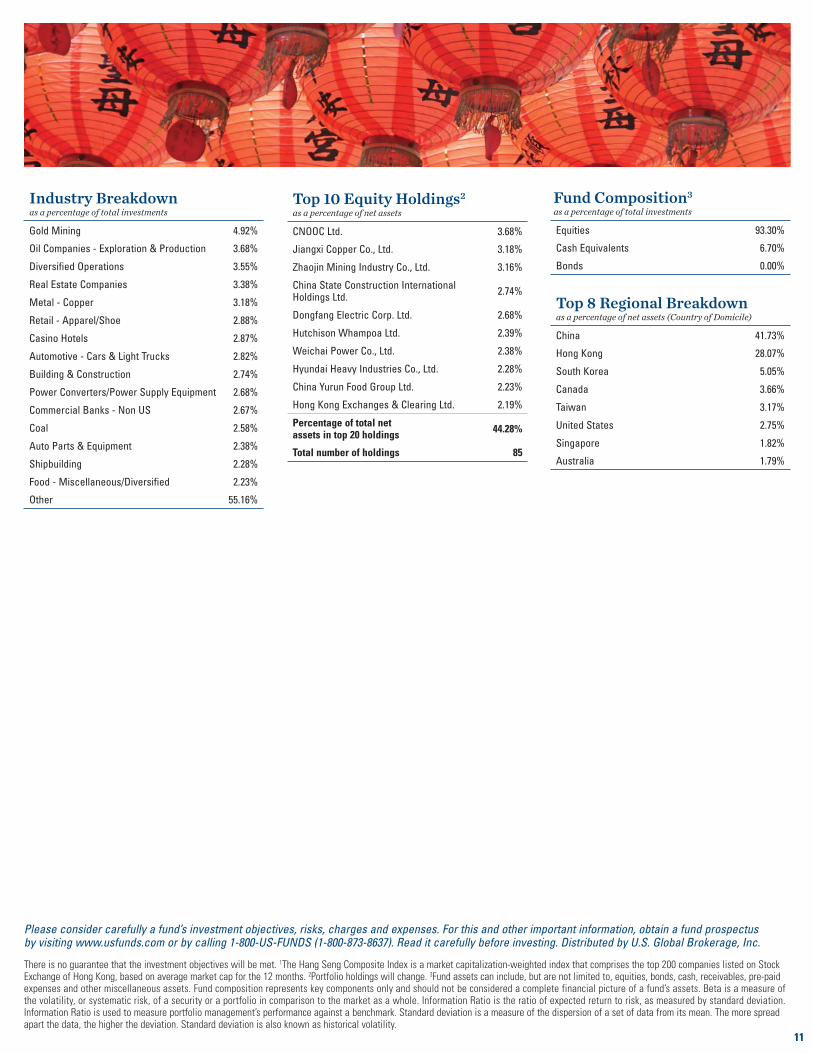
Top 8 Regional Breakdown as a percentage of net assets (Country of Domicile)
China 41.73%
Hong Kong 28.07%
South Korea 5.05%
Canada 3.66%
Taiwan 3.17%
United States 2.75%
Singapore 1.82%
Australia 1.79%
Top 10 Equity Holdings2 as a percentage of net assets
CNOOC Ltd. 3.68%
Jiangxi Copper Co., Ltd. 3.18%
Zhaojin Mining Industry Co., Ltd. 3.16%
China State Construction International Holdings Ltd.
2.74%
Dongfang Electric Corp. Ltd. 2.68%
Hutchison Whampoa Ltd. 2.39%
Weichai Power Co., Ltd. 2.38%
Hyundai Heavy Industries Co., Ltd. 2.28%
China Yurun Food Group Ltd. 2.23%
Hong Kong Exchanges & Clearing Ltd. 2.19%
Percentage of total net assets in top 20 holdings
44.28%
Total number of holdings 85
Industry Breakdown as a percentage of total investments
Gold Mining 4.92%
Oil Companies - Exploration & Production 3.68%
Diversified Operations 3.55%
Real Estate Companies 3.38%
Metal - Copper 3.18%
Retail - Apparel/Shoe 2.88%
Casino Hotels 2.87%
Automotive - Cars & Light Trucks 2.82%
Building & Construction 2.74%
Power Converters/Power Supply Equipment 2.68%
Commercial Banks - Non US 2.67%
Coal 2.58%
Auto Parts & Equipment 2.38%
Shipbuilding 2.28%
Food - Miscellaneous/Diversified 2.23%
Other 55.16%
Please consider carefully a fund’s investment objectives, risks, charges and expenses. For this and other important information, obtain a fund prospectus by visiting www.usfunds.com or by calling 1-800-US-FUNDS (1-800-873-8637). Read it carefully before investing. Distributed by U.S. Global Brokerage, Inc.
There is no guarantee that the investment objectives will be met. 1The Hang Seng Composite Index is a market capitalization-weighted index that comprises the top 200 companies listed on Stock Exchange of Hong Kong, based on average market cap for the 12 months. 2Portfolio holdings will change. 3Fund assets can include, but are not limited to, equities, bonds, cash, receivables, pre-paid expenses and other miscellaneous assets. Fund composition represents key components only and should not be considered a complete financial picture of a fund’s assets. Beta is a measure of the volatility, or systematic risk, of a security or a portfolio in comparison to the market as a whole. Information Ratio is the ratio of expected return to risk, as measured by standard deviation. Information Ratio is used to measure portfolio management’s performance against a benchmark. Standard deviation is a measure of the dispersion of a set of data from its mean. The more spread apart the data, the higher the deviation. Standard deviation is also known as historical volatility.
Fund Composition3 as a percentage of total investments
Equities 93.30%
Cash Equivalents 6.70%
Bonds 0.00%
World Precious Minerals Fund
All information is unaudited and, unless otherwise indicated, is as of 12/31/10.
12
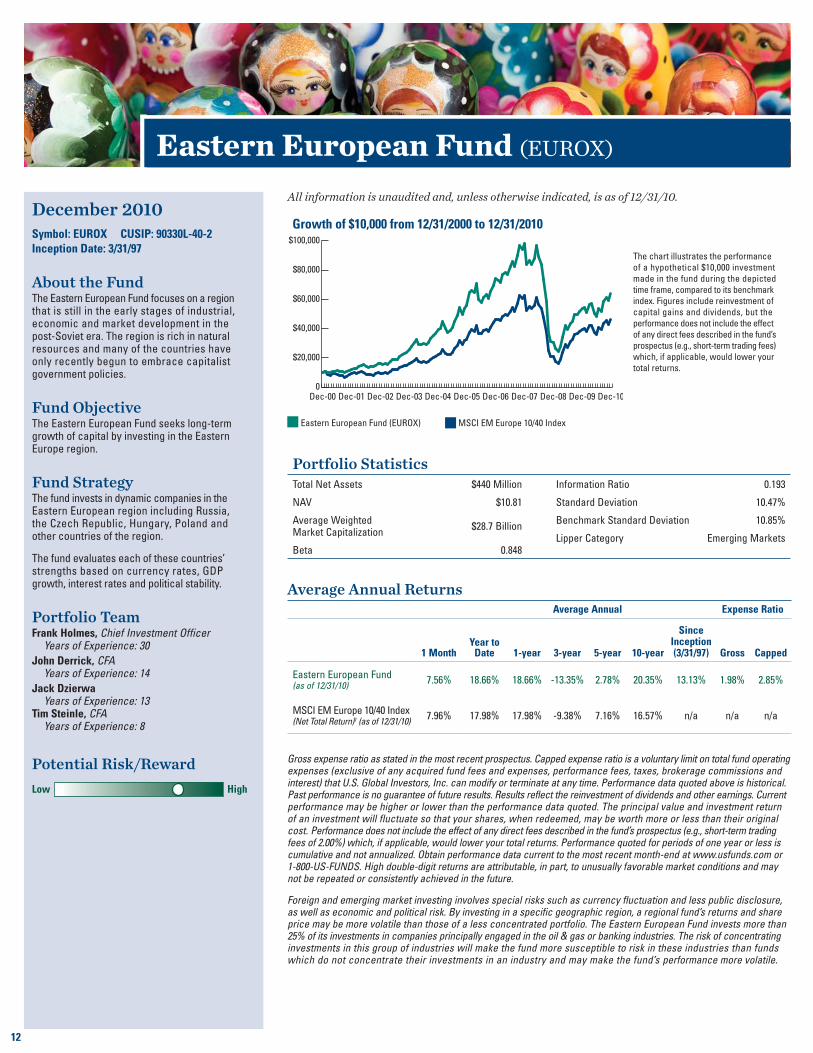
Eastern European Fund (EUROX)
December 2010
Symbol: EUROX CUSIP: 90330L-40-2
Inception Date: 3/31/97
About the FundThe Eastern European Fund focuses on a region that is still in the early stages of industrial, economic and market development in the post-Soviet era. The region is rich in natural resources and many of the countries have only recently begun to embrace capitalist government policies.
Fund ObjectiveThe Eastern European Fund seeks long-term growth of capital by investing in the Eastern Europe region.
Fund StrategyThe fund invests in dynamic companies in the Eastern European region including Russia, the Czech Republic, Hungary, Poland and other countries of the region.
The fund evaluates each of these countries’ strengths based on currency rates, GDP growth, interest rates and political stability.
Portfolio TeamFrank Holmes, Chief Investment Officer Years of Experience: 30
John Derrick, CFA Years of Experience: 14
Jack Dzierwa Years of Experience: 13Tim Steinle, CFA Years of Experience: 8
Gross expense ratio as stated in the most recent prospectus. Capped expense ratio is a voluntary limit on total fund operating expenses (exclusive of any acquired fund fees and expenses, performance fees, taxes, brokerage commissions and interest) that U.S. Global Investors, Inc. can modify or terminate at any time. Performance data quoted above is historical. Past performance is no guarantee of future results. Results reflect the reinvestment of dividends and other earnings. Current performance may be higher or lower than the performance data quoted. The principal value and investment return of an investment will fluctuate so that your shares, when redeemed, may be worth more or less than their original cost. Performance does not include the effect of any direct fees described in the fund’s prospectus (e.g., short-term trading fees of 2.00%) which, if applicable, would lower your total returns. Performance quoted for periods of one year or less is cumulative and not annualized. Obtain performance data current to the most recent month-end at www.usfunds.com or 1-800-US-FUNDS. High double-digit returns are attributable, in part, to unusually favorable market conditions and may not be repeated or consistently achieved in the future.
Foreign and emerging market investing involves special risks such as currency fluctuation and less public disclosure, as well as economic and political risk. By investing in a specific geographic region, a regional fund’s returns and share price may be more volatile than those of a less concentrated portfolio. The Eastern European Fund invests more than 25% of its investments in companies principally engaged in the oil & gas or banking industries. The risk of concentrating investments in this group of industries will make the fund more susceptible to risk in these industries than funds which do not concentrate their investments in an industry and may make the fund’s performance more volatile.
Average Annual ReturnsAverage Annual Expense Ratio
1 MonthYear to
Date 1-year 3-year 5-year 10-year
Since Inception (3/31/97) Gross Capped
Eastern European Fund (as of 12/31/10)
7.56% 18.66% 18.66% -13.35% 2.78% 20.35% 13.13% 1.98% 2.85%
MSCI EM Europe 10/40 Index (Net Total Return)1 (as of 12/31/10)
7.96% 17.98% 17.98% -9.38% 7.16% 16.57% n/a n/a n/a
The chart illustrates the performance
of a hypothetical $10,000 investment
made in the fund during the depicted
time frame, compared to its benchmark
index. Figures include reinvestment of
capital gains and dividends, but the
performance does not include the effect
of any direct fees described in the fund’s
prospectus (e.g., short-term trading fees)
which, if applicable, would lower your
total returns.
Eastern European Fund (EUROX) MSCI EM Europe 10/40 Index
Growth of $10,000 from 12/31/2000 to 12/31/2010
0
$20,000
$40,000
$60,000
$80,000
$100,000
Dec-10 Dec-09 Dec-08 Dec-07 Dec-06 Dec-05 Dec-04 Dec-03 Dec-02 Dec-01 Dec-00
Potential Risk/Reward
Low High
Portfolio StatisticsTotal Net Assets $440 Million
NAV $10.81
Average Weighted Market Capitalization
$28.7 Billion
Beta 0.848
Information Ratio 0.193
Standard Deviation 10.47%
Benchmark Standard Deviation 10.85%
Lipper Category Emerging Markets
13
Top 10 Regional Breakdown as a percentage of net assets (Country of Domicile)
Russia 59.26%
Turkey 17.71%
Poland 5.92%
Hungary 5.08%
Netherlands 3.42%
Canada 2.50%
Luxembourg 2.04%
Cyprus 0.52%
Ukraine 0.49%
United States 0.46%
Top 10 Equity Holdings2 as a percentage of net assets
Sberbank RF 10.19%
NovaTek OAO 5.39%
Rosneft Oil Co. OJSC 4.99%
VTB Bank OJSC 4.49%
Novolipetsk Steel 3.79%
Turkiye Garanti Bankasi A.S. 3.73%
Mechel 3.59%
X5 Retail Group N.V. 3.42%
Gazprom OAO 3.25%
MOL Hungarian Oil & Gas Nyrt. 2.95%
Percentage of total net assets in top 20 holdings
68.27%
Total number of holdings 55
Industry Breakdown as a percentage of total investments
Commercial Banks - Non US 26.89%
Oil Companies - Integrated 12.20%
Steel - Producers 11.34%
Oil Companies - Exploration & Production 9.65%
Food - Retail 4.19%
Medical - Drugs 3.78%
Metal - Aluminum 2.63%
Gold Mining 2.45%
Automotive - Cars & Light Trucks 2.35%
Steel Pipe & Tube 2.32%
Diversified Metals & Mining 1.99%
Cellular Telecommunications 1.91%
Retail 1.73%
Appliances 1.72%
Real Estate Operating/Development 1.66%
Other 13.19%
Please consider carefully a fund’s investment objectives, risks, charges and expenses. For this and other important information, obtain a fund prospectus by visiting www.usfunds.com or by calling 1-800-US-FUNDS (1-800-873-8637). Read it carefully before investing. Distributed by U.S. Global Brokerage, Inc.
There is no guarantee that the investment objectives will be met. 1The MSCI Emerging Markets Europe 10/40 Index (Net Total Return) is a free float-adjusted market capitalization index that is designed to measure equity performance in the emerging market countries of Europe (Czech Republic, Hungary, Poland, Russia, and Turkey). The index is calculated on a net return basis (i.e., reflects the minimum possible dividend reinvestment after deduction of the maximum rate withholding tax). The index is periodically rebalanced relative to the constituents’ weights in the parent index. 2Portfolio holdings will change. 3Fund assets can include, but are not limited to, equities, bonds, cash, receivables, pre-paid expenses and other miscellaneous assets. Fund composition represents key components only and should not be considered a complete financial picture of a fund’s assets. Beta is a measure of the volatility, or systematic risk, of a security or a portfolio in comparison to the market as a whole. Information Ratio is the ratio of expected return to risk, as measured by standard deviation. Information Ratio is used to measure portfolio management’s performance against a benchmark. Standard deviation is a measure of the dispersion of a set of data from its mean. The more spread apart the data, the higher the deviation. Standard deviation is also known as historical volatility. Morningstar Ratings are based on risk-adjusted return. The Overall Morningstar Rating for a fund is derived from a weighted-average of the performance figures associated with its three-, five- and ten-year (if applicable) Morningstar Rating metrics. Past performance does not guarantee future results. For each fund with at least a three-year history, Morningstar calculates a Morningstar Rating™ based on a Morningstar Risk-Adjusted Return measure that accounts for variation in a fund’s monthly performance (including the effects of sales charges, loads, and redemption fees), placing more emphasis on downward variations and rewarding consistent performance. The top 10% of funds in each category receive 5 stars, the next 22.5% receive 4 stars, the next 35% receive 3 stars, the next 22.5% receive 2 stars and the bottom 10% receive 1 star. (Each share class is counted as a fraction of one fund within this scale and rated separately, which may cause slight variations in the distribution percentages.)
Fund Composition3 as a percentage of total investments
Equities 97.30%
Cash Equivalents 2.70%
Bonds 0.00%
Assets by Capitalizationas a percentage of total assets
Small Cap (under $1 Billion) 2.36%
Mid Cap ($1 – $10 Billion) 24.25%
Large Cap (over $10 Billion) 73.39%
★★★★ Morningstar 10-year Rating™
Among 98, 98, 89, and 67 Europe Stock funds, the Eastern European Fund earned 3 stars, 2 stars, 1 star and 4 stars for the overall, 3-, 5- and 10-year periods ending 12/31/10.
World Precious Minerals Fund
All information is unaudited and, unless otherwise indicated, is as of 12/31/10.
14
Global Emerging Markets Fund (GEMFX)
December 2010
Symbol: GEMFX CUSIP: 90330L-50-1
Inception Date: 2/24/05
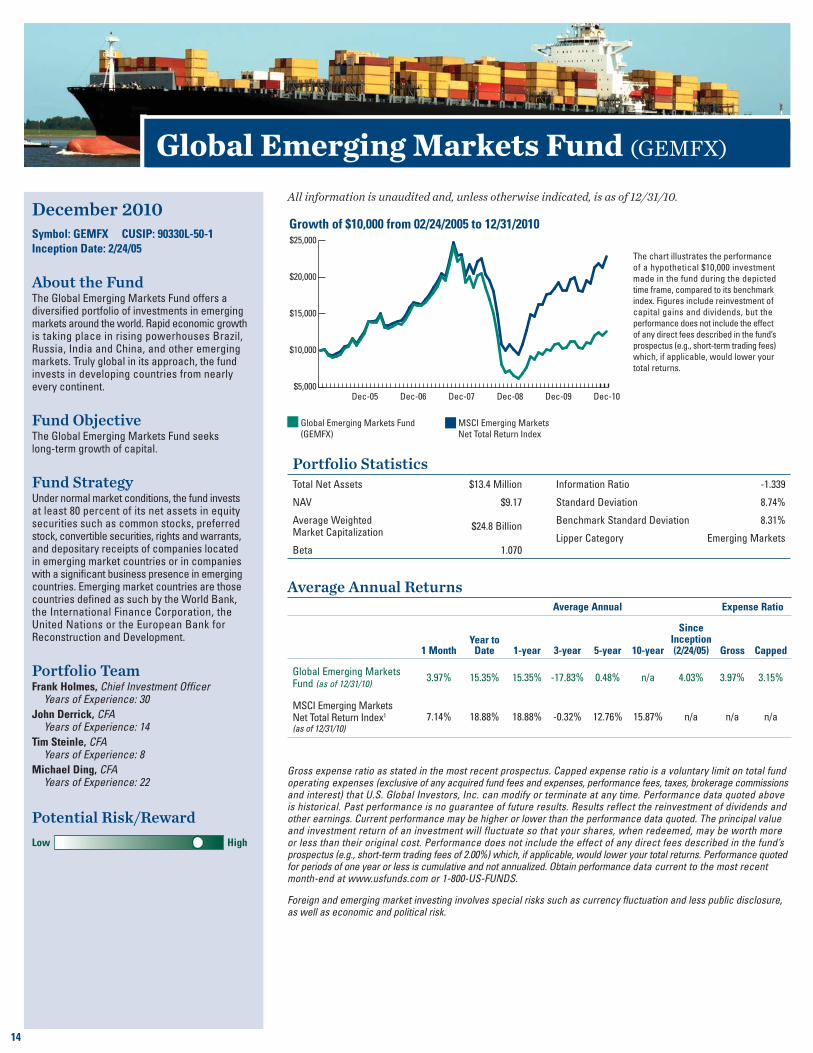
About the FundThe Global Emerging Markets Fund offers a diversifi ed portfolio of investments in emerging markets around the world. Rapid economic growth is taking place in rising powerhouses Brazil, Russia, India and China, and other emerging markets. Truly global in its approach, the fund invests in developing countries from nearly every continent.
Fund ObjectiveThe Global Emerging Markets Fund seeks long-term growth of capital.
Fund StrategyUnder normal market conditions, the fund invests at least 80 percent of its net assets in equity securities such as common stocks, preferred stock, convertible securities, rights and warrants, and depositary receipts of companies located in emerging market countries or in companies with a signifi cant business presence in emerging countries. Emerging market countries are those countries defi ned as such by the World Bank, the International Finance Corporation, the United Nations or the European Bank for Reconstruction and Development.
Portfolio TeamFrank Holmes, Chief Investment Officer Years of Experience: 30
John Derrick, CFA Years of Experience: 14
Tim Steinle, CFA Years of Experience: 8
Michael Ding, CFA Years of Experience: 22
Gross expense ratio as stated in the most recent prospectus. Capped expense ratio is a voluntary limit on total fund operating expenses (exclusive of any acquired fund fees and expenses, performance fees, taxes, brokerage commissions and interest) that U.S. Global Investors, Inc. can modify or terminate at any time. Performance data quoted above is historical. Past performance is no guarantee of future results. Results reflect the reinvestment of dividends and other earnings. Current performance may be higher or lower than the performance data quoted. The principal value and investment return of an investment will fluctuate so that your shares, when redeemed, may be worth more or less than their original cost. Performance does not include the effect of any direct fees described in the fund’s prospectus (e.g., short-term trading fees of 2.00%) which, if applicable, would lower your total returns. Performance quoted for periods of one year or less is cumulative and not annualized. Obtain performance data current to the most recent month-end at www.usfunds.com or 1-800-US-FUNDS.
Foreign and emerging market investing involves special risks such as currency fluctuation and less public disclosure, as well as economic and political risk.
Average Annual ReturnsAverage Annual Expense Ratio
1 MonthYear to
Date 1-year 3-year 5-year 10-year
Since Inception (2/24/05) Gross Capped
Global Emerging Markets Fund (as of 12/31/10)
3.97% 15.35% 15.35% -17.83% 0.48% n/a 4.03% 3.97% 3.15%
MSCI Emerging Markets Net Total Return Index1 (as of 12/31/10)
7.14% 18.88% 18.88% -0.32% 12.76% 15.87% n/a n/a n/a
The chart illustrates the performance
of a hypothetical $10,000 investment
made in the fund during the depicted
time frame, compared to its benchmark
index. Figures include reinvestment of
capital gains and dividends, but the
performance does not include the effect
of any direct fees described in the fund’s
prospectus (e.g., short-term trading fees)
which, if applicable, would lower your
total returns.
Global Emerging Markets Fund
(GEMFX)
MSCI Emerging Markets
Net Total Return Index
Growth of $10,000 from 12/31/2000 to 12/31/2010
$5,000
$10,000
$15,000
$20,000
$25,000
Dec-10 Dec-09 Dec-08 Dec-07 Dec-06 Dec-05
Growth of $10,000 from 02/24/2005 to 12/31/2010
Potential Risk/Reward
Low High
Portfolio StatisticsTotal Net Assets $13.4 Million
NAV $9.17
Average Weighted Market Capitalization
$24.8 Billion
Beta 1.070
Information Ratio -1.339
Standard Deviation 8.74%
Benchmark Standard Deviation 8.31%
Lipper Category Emerging Markets
15
Top 10 Regional Breakdown as a percentage of net assets (Country of Domicile)
Brazil 16.29%
Russia 10.27%
China 8.49%
India 6.39%
Turkey 6.09%
Mexico 5.47%
United States 5.12%
South Korea 4.37%
South Africa 4.04%
Taiwan 3.80%
Top 10 Equity Holdings2 as a percentage of net assets
Naspers Ltd. 2.84%
TNK-BP Holding 2.80%
MercadoLibre, Inc. 2.59%
X5 Retail Group N.V. 2.42%
Sberbank RF 2.29%
KGHM Polska Miedz S.A. 2.18%
Randgold Resources Ltd. 2.10%
Kolon Industries, Inc. 1.98%
Vivo Participacoes S.A. 1.95%
OGX Petroleo e Gas Participacoes S.A. 1.80%
Percentage of total net assets in top 20 holdings
38.47%
Total number of holdings 96
Industry Breakdown as a percentage of total investments
Commercial Banks - Non US 13.02%
Cellular Telecommunications 5.62%
Gold Mining 4.98%
Oil Companies - Exploration & Production 4.84%
Oil Companies - Integrated 4.50%
Exchange-Traded Fund 3.97%
Food - Retail 3.67%
Multimedia 2.84%
Metal - Diversified 2.79%
Sugar 2.76%
Automotive - Cars & Light Trucks 2.62%
E-Commerce/Products 2.59%
Medical Labs & Testing Services 2.44%
Medical - Drugs 2.06%
Retail - Hypermarkets 2.04%
Other 39.26%
Please consider carefully a fund’s investment objectives, risks, charges and expenses. For this and other important information, obtain a fund prospectus by visiting www.usfunds.com or by calling 1-800-US-FUNDS (1-800-873-8637). Read it carefully before investing. Distributed by U.S. Global Brokerage, Inc.
There is no guarantee that the investment objectives will be met. 1The MSCI Emerging Markets Total Net Return Index is a free float-adjusted market capitalization index that is designed to measure equity market performance in emerging market countries on a net return basis (i.e., reflects the minimum possible dividend reinvestment after deduction of the maximum rate withholding tax). 2Portfolio holdings will change. 3Fund assets can include, but are not limited to, equities, bonds, cash, receivables, pre-paid expenses and other miscellaneous assets. Fund composition represents key components only and should not be considered a complete financial picture of a fund’s assets. Beta is a measure of the volatility, or systematic risk, of a security or a portfolio in comparison to the market as a whole. Information Ratio is the ratio of expected return to risk, as measured by standard deviation. Information Ratio is used to measure portfolio management’s performance against a benchmark. Standard deviation is a measure of the dispersion of a set of data from its mean. The more spread apart the data, the higher the deviation. Standard deviation is also known as historical volatility.
Fund Composition3 as a percentage of total investments
Equities 96.69%
Cash Equivalents 3.31%
Bonds 0.00%
World Precious Minerals Fund
16
Global MegaTrends Fund (MEGAX)
December 2010
Symbol: MEGAX CUSIP: 90330L-20-4
Inception Date: 10/21/91
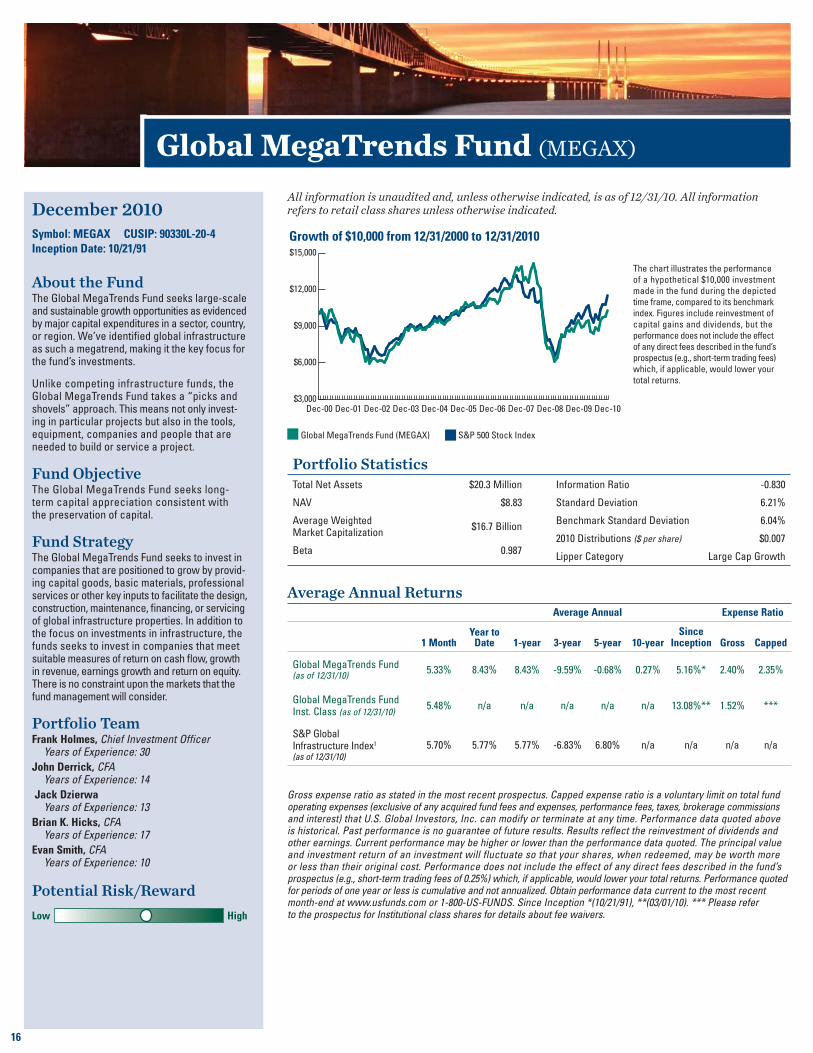
About the FundThe Global MegaTrends Fund seeks large-scale and sustainable growth opportunities as evidenced by major capital expenditures in a sector, country, or region. We’ve identifi ed global infrastructure as such a megatrend, making it the key focus for the fund’s investments.
Unlike competing infrastructure funds, the Global MegaTrends Fund takes a “picks and shovels” approach. This means not only invest-ing in particular projects but also in the tools, equipment, companies and people that are needed to build or service a project.
Fund ObjectiveThe Global MegaTrends Fund seeks long-term capital appreciation consistent with the preservation of capital.
Fund StrategyThe Global MegaTrends Fund seeks to invest in companies that are positioned to grow by provid-ing capital goods, basic materials, professional services or other key inputs to facilitate the design, construction, maintenance, fi nancing, or servicing of global infrastructure properties. In addition to the focus on investments in infrastructure, the funds seeks to invest in companies that meet suitable measures of return on cash fl ow, growth in revenue, earnings growth and return on equity. There is no constraint upon the markets that the fund management will consider.
Portfolio TeamFrank Holmes, Chief Investment Officer Years of Experience: 30
John Derrick, CFA Years of Experience: 14
Jack Dzierwa Years of Experience: 13
Brian K. Hicks, CFA Years of Experience: 17
Evan Smith, CFA Years of Experience: 10
Gross expense ratio as stated in the most recent prospectus. Capped expense ratio is a voluntary limit on total fund operating expenses (exclusive of any acquired fund fees and expenses, performance fees, taxes, brokerage commissions and interest) that U.S. Global Investors, Inc. can modify or terminate at any time. Performance data quoted above is historical. Past performance is no guarantee of future results. Results reflect the reinvestment of dividends and other earnings. Current performance may be higher or lower than the performance data quoted. The principal value and investment return of an investment will fluctuate so that your shares, when redeemed, may be worth more or less than their original cost. Performance does not include the effect of any direct fees described in the fund’s prospectus (e.g., short-term trading fees of 0.25%) which, if applicable, would lower your total returns. Performance quoted for periods of one year or less is cumulative and not annualized. Obtain performance data current to the most recent month-end at www.usfunds.com or 1-800-US-FUNDS. Since Inception *(10/21/91), **(03/01/10). *** Please refer to the prospectus for Institutional class shares for details about fee waivers.
Average Annual ReturnsAverage Annual Expense Ratio
1 MonthYear to
Date 1-year 3-year 5-year 10-yearSince
Inception Gross Capped
Global MegaTrends Fund (as of 12/31/10)
5.33% 8.43% 8.43% -9.59% -0.68% 0.27% 5.16%* 2.40% 2.35%
Global MegaTrends Fund Inst. Class (as of 12/31/10)
5.48% n/a n/a n/a n/a n/a 13.08%** 1.52% ***
S&P Global Infrastructure Index1 (as of 12/31/10)
5.70% 5.77% 5.77% -6.83% 6.80% n/a n/a n/a n/a
The chart illustrates the performance
of a hypothetical $10,000 investment
made in the fund during the depicted
time frame, compared to its benchmark
index. Figures include reinvestment of
capital gains and dividends, but the
performance does not include the effect
of any direct fees described in the fund’s
prospectus (e.g., short-term trading fees)
which, if applicable, would lower your
total returns.
Global MegaTrends Fund (MEGAX) S&P 500 Stock Index
Growth of $10,000 from 12/31/2000 to 12/31/2010
$3,000
$6,000
$9,000
$12,000
$15,000
Dec-10 Dec-09 Dec-08 Dec-07 Dec-06 Dec-05 Dec-04 Dec-03 Dec-02 Dec-01 Dec-00
Potential Risk/Reward
Low High
Portfolio StatisticsTotal Net Assets $20.3 Million
NAV $8.83
Average Weighted Market Capitalization
$16.7 Billion
Beta 0.987
Information Ratio -0.830
Standard Deviation 6.21%
Benchmark Standard Deviation 6.04%
2010 Distributions ($ per share) $0.007
Lipper Category Large Cap Growth
All information is unaudited and, unless otherwise indicated, is as of 12/31/10. All information refers to retail class shares unless otherwise indicated.
17
Top 10 Regional Breakdown as a percentage of net assets (Country of Domicile)
United States 42.15%
Brazil 11.67%
Canada 10.98%
Russia 7.53%
China 5.75%
Turkey 4.90%
Mexico 4.49%
Panama 2.67%
Luxembourg 2.30%
Hong Kong 1.52%
Top 10 Equity Holdings2 as a percentage of net assets
CSX Corp. 3.53%
Compania de Concessoes Rodoviarias 3.38%
NuStar Energy L.P. 3.08%
EcoRodovias Infraestrutura e Logistica S.A. 3.04%
SNC-Lavalin Group, Inc. 2.95%
Westshore Terminals Income Fund 2.84%
CPFL Energia S.A. 2.84%
Tofas Turk Otomobil Fabrikasi A.S. 2.75%
Zhuzhou CSR Times Electric Co., Ltd. 2.62%
Grupo Empresarial Ibiza S.A. 2.56%
Percentage of total net assets in top 20 holdings
51.86%
Total number of holdings 66
Industry Breakdown as a percentage of total investments
Public Thoroughfares 6.42%
Engineering/R&D Services 4.99%
Cellular Telecommunications 4.95%
Pipelines 4.73%
Airport Development/Maintenance 4.10%
Metal - Iron 3.90%
Metal & Mineral Mining 3.78%
Steel - Producers 3.74%
Transportation - Rail 3.53%
Wireless Equipment 3.40%
Water Treatment Systems 3.13%
Storage/Warehousing 2.84%
Electric - Integrated 2.84%
Automotive - Cars & Light Trucks 2.75%
Electric Products - Miscellaneous 2.62%
Other 42.28%
Please consider carefully a fund’s investment objectives, risks, charges and expenses. For this and other important information, obtain a fund prospectus by visiting www.usfunds.com or by calling 1-800-US-FUNDS (1-800-873-8637). Read it carefully before investing. Distributed by U.S. Global Brokerage, Inc.
Foreign and emerging market investing involves special risks such as currency fluctuation and less public disclosure, as well as economic and political risk.
There is no guarantee that the investment objectives will be met. 1The S&P Global Infrastructure Index provides liquid and tradable exposure to 75 companies from around the world that represent the listed infrastructure universe. To create diversified exposure across the global listed infrastructure market, the index has balanced weights across three distinct infrastructure clusters: Utilities, Transportation and Energy. 2Portfolio holdings will change. 3Fund assets can include, but are not limited to, equities, bonds, cash, receivables, pre-paid expenses and other miscellaneous assets. Fund composition represents key components only and should not be considered a complete financial picture of a fund’s assets. Beta is a measure of the volatility, or systematic risk, of a security or a portfolio in comparison to the market as a whole. Information Ratio is the ratio of expected return to risk, as measured by standard deviation. Information Ratio is used to measure portfolio management’s performance against a benchmark. Standard deviation is a measure of the dispersion of a set of data from its mean. The more spread apart the data, the higher the deviation. Standard deviation is also known as historical volatility.
Fund Composition3 as a percentage of total investments
Equities 95.60%
Cash Equivalents 1.86%
Bonds 2.54%
Assets by Capitalizationas a percentage of total assets
Small Cap (under $1 Billion) 9.15%
Mid Cap ($1 – $10 Billion) 49.41%
Large Cap (over $10 Billion) 41.44%
World Precious Minerals Fund
All information is unaudited and, unless otherwise indicated, is as of 12/31/10.
18
All American Equity Fund (GBTFX)
December 2010
Symbol: GBTFX CUSIP: 911476-60-4
Inception Date: 3/4/81
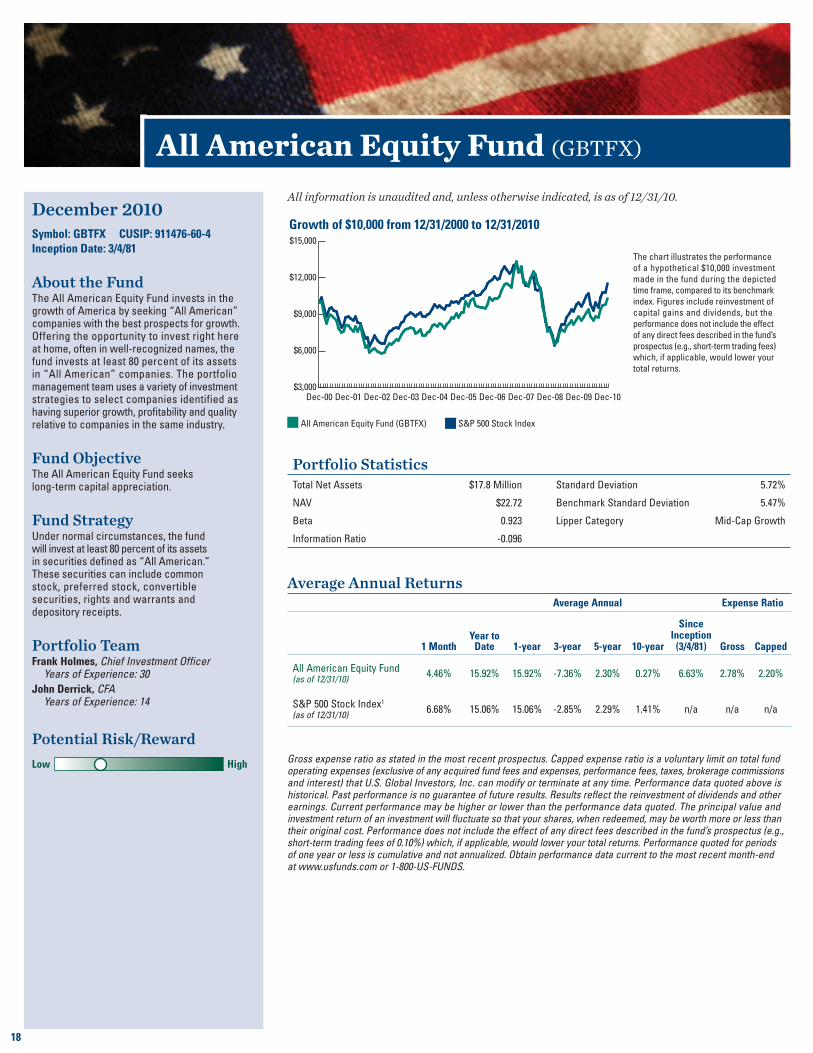
About the FundThe All American Equity Fund invests in the growth of America by seeking “All American” companies with the best prospects for growth. Offering the opportunity to invest right here at home, often in well-recognized names, the fund invests at least 80 percent of its assets in “All American” companies. The portfolio management team uses a variety of investment strategies to select companies identified as having superior growth, profi tability and quality relative to companies in the same industry.
Fund ObjectiveThe All American Equity Fund seeks long-term capital appreciation.
Fund StrategyUnder normal circumstances, the fund will invest at least 80 percent of its assets in securities defi ned as “All American.” These securities can include common stock, preferred stock, convertible securities, rights and warrants and depository receipts.
Portfolio TeamFrank Holmes, Chief Investment Officer Years of Experience: 30
John Derrick, CFA Years of Experience: 14
Gross expense ratio as stated in the most recent prospectus. Capped expense ratio is a voluntary limit on total fund operating expenses (exclusive of any acquired fund fees and expenses, performance fees, taxes, brokerage commissions and interest) that U.S. Global Investors, Inc. can modify or terminate at any time. Performance data quoted above is historical. Past performance is no guarantee of future results. Results reflect the reinvestment of dividends and other earnings. Current performance may be higher or lower than the performance data quoted. The principal value and investment return of an investment will fluctuate so that your shares, when redeemed, may be worth more or less than their original cost. Performance does not include the effect of any direct fees described in the fund’s prospectus (e.g., short-term trading fees of 0.10%) which, if applicable, would lower your total returns. Performance quoted for periods of one year or less is cumulative and not annualized. Obtain performance data current to the most recent month-end at www.usfunds.com or 1-800-US-FUNDS.
Average Annual ReturnsAverage Annual Expense Ratio
1 MonthYear to
Date 1-year 3-year 5-year 10-year
Since Inception
(3/4/81) Gross Capped
All American Equity Fund (as of 12/31/10)
4.46% 15.92% 15.92% -7.36% 2.30% 0.27% 6.63% 2.78% 2.20%
S&P 500 Stock Index1 (as of 12/31/10)
6.68% 15.06% 15.06% -2.85% 2.29% 1.41% n/a n/a n/a
The chart illustrates the performance
of a hypothetical $10,000 investment
made in the fund during the depicted
time frame, compared to its benchmark
index. Figures include reinvestment of
capital gains and dividends, but the
performance does not include the effect
of any direct fees described in the fund’s
prospectus (e.g., short-term trading fees)
which, if applicable, would lower your
total returns.
All American Equity Fund (GBTFX) S&P 500 Stock Index
Growth of $10,000 from 12/31/2000 to 12/31/2010
$3,000
$6,000
$9,000
$12,000
$15,000
Dec-10 Dec-09 Dec-08 Dec-07 Dec-06 Dec-05 Dec-04 Dec-03 Dec-02 Dec-01 Dec-00
Potential Risk/Reward
Low High
Portfolio StatisticsTotal Net Assets $17.8 Million
NAV $22.72
Beta 0.923
Information Ratio -0.096
Standard Deviation 5.72%
Benchmark Standard Deviation 5.47%
Lipper Category Mid-Cap Growth
19
Top 10 Equity Holdings2 as a percentage of net assets
Apple, Inc. 4.54%
National-Oilwell Varco, Inc. 3.41%
Lincoln National Corp. 2.35%
Red Hat, Inc. 2.31%
NVIDIA Corp. 2.17%
Concho Resources, Inc. 1.97%
Check Point Software Technologies Ltd. 1.96%
AutoZone, Inc. 1.84%
Northern Oil & Gas, Inc. 1.84%
Oracle Corp. 1.76%
Percentage of total net assets in top 20 holdings
38.77%
Total number of holdings 82
Industry Breakdown as a percentage of total investments
Oil Companies - Exploration & Production 6.00%
Computers 4.54%
Telephone - Integrated 4.37%
Electric - Integrated 4.36%
Applications Software 4.27%
Oil Field Machinery & Equipment 3.41%
Agricultural Chemicals 2.70%
Electronic Components - Semiconductors 2.46%
Life/Health Insurance 2.35%
Oil Companies - Integrated 2.18%
Electronics & Components 2.17%
Tobacco 2.09%
Investment Management/Advisory Services 2.04%
Commercial Services/Financial 1.98%
Property/Casualty Insurance 1.95%
Other 53.13%
Please consider carefully a fund’s investment objectives, risks, charges and expenses. For this and other important information, obtain a fund prospectus by visiting www.usfunds.com or by calling 1-800-US-FUNDS (1-800-873-8637). Read it carefully before investing. Distributed by U.S. Global Brokerage, Inc.
There is no guarantee that the investment objectives will be met. 1The S&P 500 Stock Index is a widely recognized capitalization-weighted index of 500 common stock prices in U.S. companies. 2Portfolio holdings will change. 3Fund assets can include, but are not limited to, equities, bonds, cash, receivables, pre-paid expenses and other miscellaneous assets. Fund composition represents key components only and should not be considered a complete financial picture of a fund’s assets. Beta is a measure of the volatility, or systematic risk, of a security or a portfolio in comparison to the market as a whole. Information Ratio is the ratio of expected return to risk, as measured by standard deviation. Information Ratio is used to measure portfolio management’s performance against a benchmark. Standard deviation is a measure of the dispersion of a set of data from its mean. The more spread apart the data, the higher the deviation. Standard deviation is also known as historical volatility.
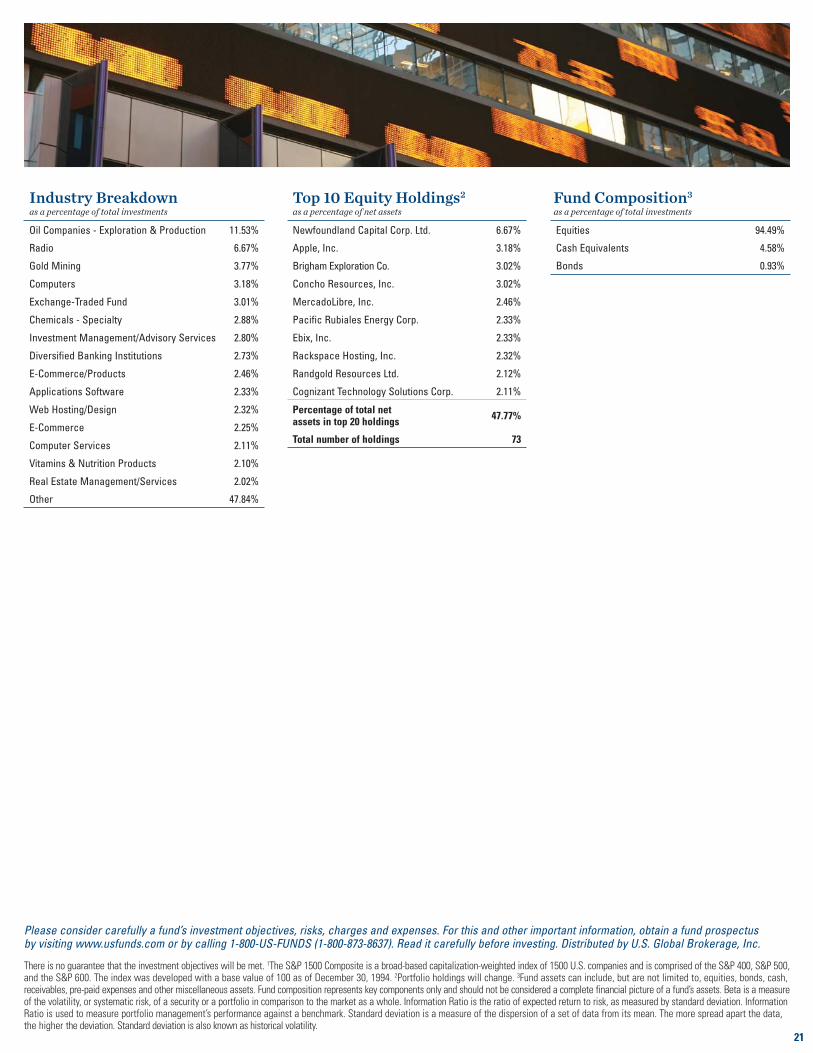
Fund Composition3 as a percentage of total investments
Equities 94.58%
Cash Equivalents 5.42%
Bonds 0.00%
World Precious Minerals Fund
All information is unaudited and, unless otherwise indicated, is as of 12/31/10.
20
Holmes Growth Fund (ACBGX)
December 2010
Symbol: ACBGX CUSIP: 90330L-10-5
Inception Date: 10/17/94
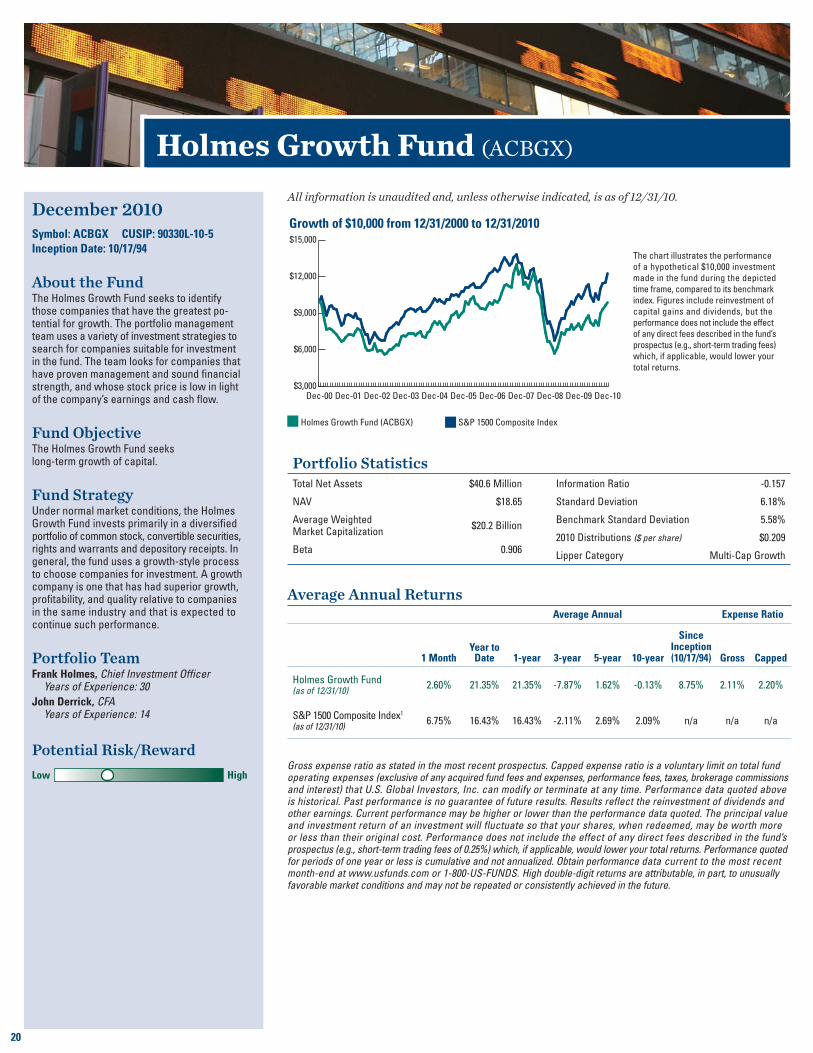
About the FundThe Holmes Growth Fund seeks to identify those companies that have the greatest po-tential for growth. The portfolio management team uses a variety of investment strategies to search for companies suitable for investment in the fund. The team looks for companies that have proven management and sound fi nancial strength, and whose stock price is low in light of the company’s earnings and cash fl ow.
Fund ObjectiveThe Holmes Growth Fund seeks long-term growth of capital.
Fund StrategyUnder normal market conditions, the Holmes Growth Fund invests primarily in a diversifi ed portfolio of common stock, convertible securities, rights and warrants and depository receipts. In general, the fund uses a growth-style process to choose companies for investment. A growth company is one that has had superior growth, profi tability, and quality relative to companies in the same industry and that is expected to continue such performance.
Portfolio TeamFrank Holmes, Chief Investment Officer Years of Experience: 30
John Derrick, CFA Years of Experience: 14
Gross expense ratio as stated in the most recent prospectus. Capped expense ratio is a voluntary limit on total fund operating expenses (exclusive of any acquired fund fees and expenses, performance fees, taxes, brokerage commissions and interest) that U.S. Global Investors, Inc. can modify or terminate at any time. Performance data quoted above is historical. Past performance is no guarantee of future results. Results reflect the reinvestment of dividends and other earnings. Current performance may be higher or lower than the performance data quoted. The principal value and investment return of an investment will fluctuate so that your shares, when redeemed, may be worth more or less than their original cost. Performance does not include the effect of any direct fees described in the fund’s prospectus (e.g., short-term trading fees of 0.25%) which, if applicable, would lower your total returns. Performance quoted for periods of one year or less is cumulative and not annualized. Obtain performance data current to the most recent month-end at www.usfunds.com or 1-800-US-FUNDS. High double-digit returns are attributable, in part, to unusually favorable market conditions and may not be repeated or consistently achieved in the future.
Average Annual ReturnsAverage Annual Expense Ratio
1 MonthYear to
Date 1-year 3-year 5-year 10-year
Since Inception (10/17/94) Gross Capped
Holmes Growth Fund (as of 12/31/10)
2.60% 21.35% 21.35% -7.87% 1.62% -0.13% 8.75% 2.11% 2.20%
S&P 1500 Composite Index1
(as of 12/31/10)6.75% 16.43% 16.43% -2.11% 2.69% 2.09% n/a n/a n/a
The chart illustrates the performance
of a hypothetical $10,000 investment
made in the fund during the depicted
time frame, compared to its benchmark
index. Figures include reinvestment of
capital gains and dividends, but the
performance does not include the effect
of any direct fees described in the fund’s
prospectus (e.g., short-term trading fees)
which, if applicable, would lower your
total returns.
Holmes Growth Fund (ACBGX) S&P 1500 Composite Index
Growth of $10,000 from 12/31/2000 to 12/31/2010
$3,000
$6,000
$9,000
$12,000
$15,000
Dec-10 Dec-09 Dec-08 Dec-07 Dec-06 Dec-05 Dec-04 Dec-03 Dec-02 Dec-01 Dec-00
Potential Risk/Reward
Low High
Portfolio StatisticsTotal Net Assets $40.6 Million
NAV $18.65
Average Weighted Market Capitalization
$20.2 Billion
Beta 0.906
Information Ratio -0.157
Standard Deviation 6.18%
Benchmark Standard Deviation 5.58%
2010 Distributions ($ per share) $0.209
Lipper Category Multi-Cap Growth
21
Top 10 Equity Holdings2 as a percentage of net assets
Newfoundland Capital Corp. Ltd. 6.67%
Apple, Inc. 3.18%
Brigham Exploration Co. 3.02%
Concho Resources, Inc. 3.02%
MercadoLibre, Inc. 2.46%
Pacific Rubiales Energy Corp. 2.33%
Ebix, Inc. 2.33%
Rackspace Hosting, Inc. 2.32%
Randgold Resources Ltd. 2.12%
Cognizant Technology Solutions Corp. 2.11%
Percentage of total net assets in top 20 holdings
47.77%
Total number of holdings 73
Industry Breakdown as a percentage of total investments
Oil Companies - Exploration & Production 11.53%
Radio 6.67%
Gold Mining 3.77%
Computers 3.18%
Exchange-Traded Fund 3.01%
Chemicals - Specialty 2.88%
Investment Management/Advisory Services 2.80%
Diversified Banking Institutions 2.73%
E-Commerce/Products 2.46%
Applications Software 2.33%
Web Hosting/Design 2.32%
E-Commerce 2.25%
Computer Services 2.11%
Vitamins & Nutrition Products 2.10%
Real Estate Management/Services 2.02%
Other 47.84%
Please consider carefully a fund’s investment objectives, risks, charges and expenses. For this and other important information, obtain a fund prospectus by visiting www.usfunds.com or by calling 1-800-US-FUNDS (1-800-873-8637). Read it carefully before investing. Distributed by U.S. Global Brokerage, Inc.
There is no guarantee that the investment objectives will be met. 1The S&P 1500 Composite is a broad-based capitalization-weighted index of 1500 U.S. companies and is comprised of the S&P 400, S&P 500, and the S&P 600. The index was developed with a base value of 100 as of December 30, 1994. 2Portfolio holdings will change. 3Fund assets can include, but are not limited to, equities, bonds, cash, receivables, pre-paid expenses and other miscellaneous assets. Fund composition represents key components only and should not be considered a complete financial picture of a fund’s assets. Beta is a measure of the volatility, or systematic risk, of a security or a portfolio in comparison to the market as a whole. Information Ratio is the ratio of expected return to risk, as measured by standard deviation. Information Ratio is used to measure portfolio management’s performance against a benchmark. Standard deviation is a measure of the dispersion of a set of data from its mean. The more spread apart the data, the higher the deviation. Standard deviation is also known as historical volatility.
Fund Composition3 as a percentage of total investments
Equities 94.49%
Cash Equivalents 4.58%
Bonds 0.93%
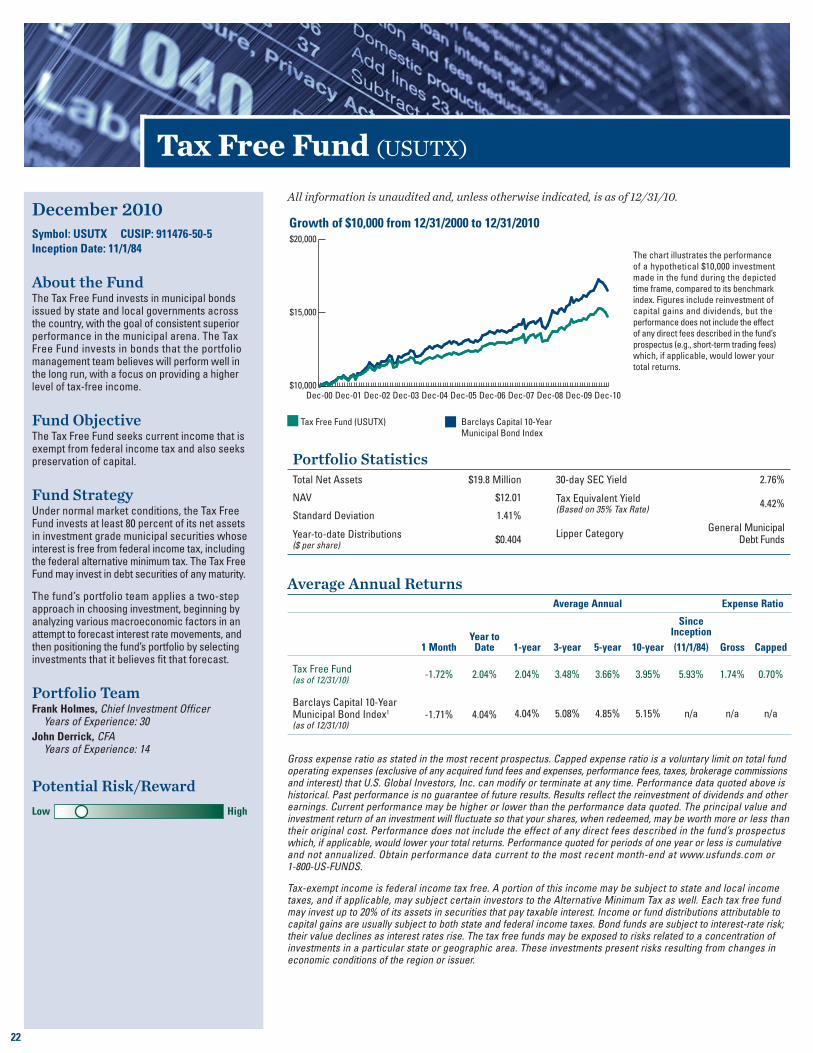
World Precious Minerals Fund
All information is unaudited and, unless otherwise indicated, is as of 12/31/10.
22
Tax Free Fund (USUTX)
December 2010
Symbol: USUTX CUSIP: 911476-50-5
Inception Date: 11/1/84
About the FundThe Tax Free Fund invests in municipal bonds issued by state and local governments across the country, with the goal of consistent superior performance in the municipal arena. The Tax Free Fund invests in bonds that the portfolio management team believes will perform well in the long run, with a focus on providing a higher level of tax-free income.
Fund ObjectiveThe Tax Free Fund seeks current income that is exempt from federal income tax and also seeks preservation of capital.
Fund StrategyUnder normal market conditions, the Tax Free Fund invests at least 80 percent of its net assets in investment grade municipal securities whose interest is free from federal income tax, including the federal alternative minimum tax. The Tax Free Fund may invest in debt securities of any maturity.
The fund’s portfolio team applies a two-step approach in choosing investment, beginning by analyzing various macroeconomic factors in an attempt to forecast interest rate movements, and then positioning the fund’s portfolio by selecting investments that it believes fi t that forecast.
Portfolio TeamFrank Holmes, Chief Investment Officer Years of Experience: 30
John Derrick, CFA Years of Experience: 14
Gross expense ratio as stated in the most recent prospectus. Capped expense ratio is a voluntary limit on total fund operating expenses (exclusive of any acquired fund fees and expenses, performance fees, taxes, brokerage commissions and interest) that U.S. Global Investors, Inc. can modify or terminate at any time. Performance data quoted above is historical. Past performance is no guarantee of future results. Results reflect the reinvestment of dividends and other earnings. Current performance may be higher or lower than the performance data quoted. The principal value and investment return of an investment will fluctuate so that your shares, when redeemed, may be worth more or less than their original cost. Performance does not include the effect of any direct fees described in the fund’s prospectus which, if applicable, would lower your total returns. Performance quoted for periods of one year or less is cumulative and not annualized. Obtain performance data current to the most recent month-end at www.usfunds.com or 1-800-US-FUNDS.
Tax-exempt income is federal income tax free. A portion of this income may be subject to state and local income taxes, and if applicable, may subject certain investors to the Alternative Minimum Tax as well. Each tax free fund may invest up to 20% of its assets in securities that pay taxable interest. Income or fund distributions attributable to capital gains are usually subject to both state and federal income taxes. Bond funds are subject to interest-rate risk; their value declines as interest rates rise. The tax free funds may be exposed to risks related to a concentration of investments in a particular state or geographic area. These investments present risks resulting from changes in economic conditions of the region or issuer.
Average Annual ReturnsAverage Annual Expense Ratio
1 MonthYear to
Date 1-year 3-year 5-year 10-year
Since Inception
(11/1/84) Gross Capped
Tax Free Fund (as of 12/31/10)
-1.72% 2.04% 2.04% 3.48% 3.66% 3.95% 5.93% 1.74% 0.70%
Barclays Capital 10-Year Municipal Bond Index1
(as of 12/31/10)-1.71% 4.04% 4.04% 5.08% 4.85% 5.15% n/a n/a n/a
The chart illustrates the performance
of a hypothetical $10,000 investment
made in the fund during the depicted
time frame, compared to its benchmark
index. Figures include reinvestment of
capital gains and dividends, but the
performance does not include the effect
of any direct fees described in the fund’s
prospectus (e.g., short-term trading fees)
which, if applicable, would lower your
total returns.
Tax Free Fund (USUTX) Barclays Capital 10-Year
Municipal Bond Index
Growth of $10,000 from 12/31/2000 to 12/31/2010
$10,000
$15,000
$20,000
Dec-10 Dec-09 Dec-08 Dec-07 Dec-06 Dec-05 Dec-04 Dec-03 Dec-02 Dec-01 Dec-00
Potential Risk/Reward
Low High
Portfolio StatisticsTotal Net Assets $19.8 Million
NAV $12.01
Standard Deviation 1.41%
Year-to-date Distributions ($ per share)
$0.404
30-day SEC Yield 2.76%
Tax Equivalent Yield(Based on 35% Tax Rate)
4.42%
Lipper CategoryGeneral Municipal
Debt Funds
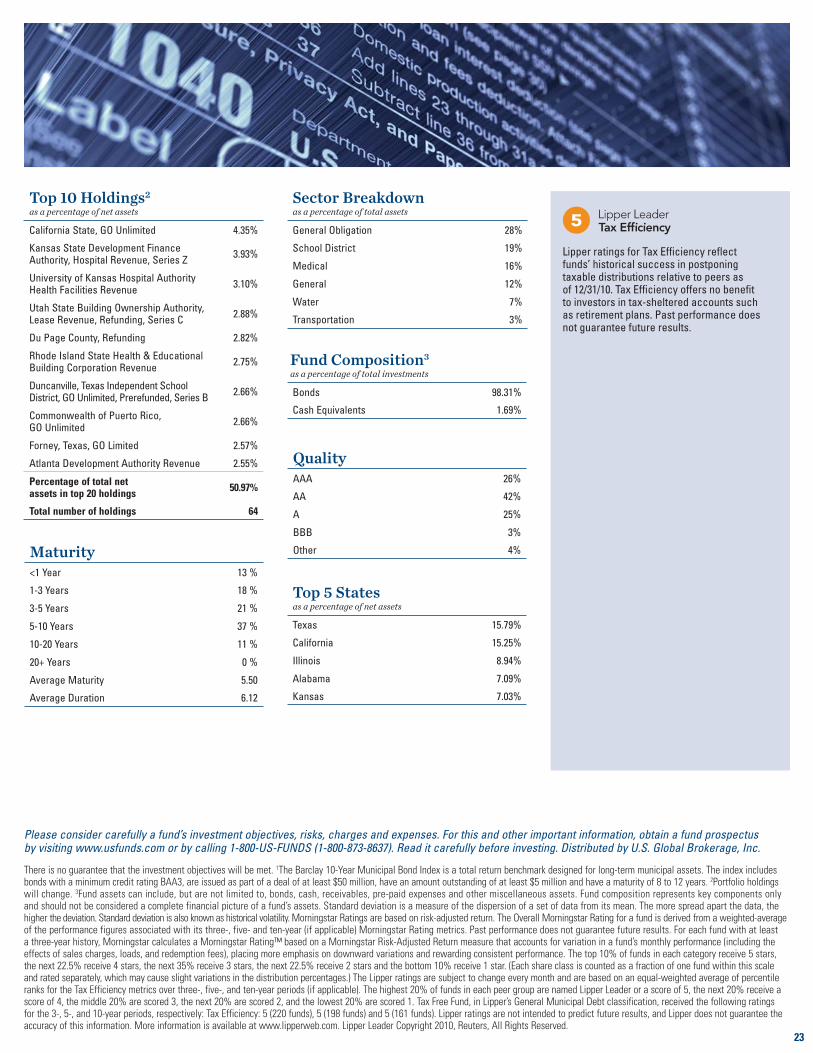
23
Top 5 States as a percentage of net assets
Texas 15.79%
California 15.25%
Illinois 8.94%
Alabama 7.09%
Kansas 7.03%
Top 10 Holdings2 as a percentage of net assets
California State, GO Unlimited 4.35%
Kansas State Development Finance Authority, Hospital Revenue, Series Z
3.93%
University of Kansas Hospital Authority Health Facilities Revenue
3.10%
Utah State Building Ownership Authority, Lease Revenue, Refunding, Series C
2.88%
Du Page County, Refunding 2.82%
Rhode Island State Health & Educational Building Corporation Revenue
2.75%
Duncanville, Texas Independent School District, GO Unlimited, Prerefunded, Series B
2.66%
Commonwealth of Puerto Rico, GO Unlimited
2.66%
Forney, Texas, GO Limited 2.57%
Atlanta Development Authority Revenue 2.55%
Percentage of total net assets in top 20 holdings
50.97%
Total number of holdings 64
Sector Breakdownas a percentage of total assets
General Obligation 28%
School District 19%
Medical 16%
General 12%
Water 7%
Transportation 3%
Please consider carefully a fund’s investment objectives, risks, charges and expenses. For this and other important information, obtain a fund prospectus by visiting www.usfunds.com or by calling 1-800-US-FUNDS (1-800-873-8637). Read it carefully before investing. Distributed by U.S. Global Brokerage, Inc.
There is no guarantee that the investment objectives will be met. 1The Barclay 10-Year Municipal Bond Index is a total return benchmark designed for long-term municipal assets. The index includes bonds with a minimum credit rating BAA3, are issued as part of a deal of at least $50 million, have an amount outstanding of at least $5 million and have a maturity of 8 to 12 years. 2Portfolio holdings will change. 3Fund assets can include, but are not limited to, bonds, cash, receivables, pre-paid expenses and other miscellaneous assets. Fund composition represents key components only and should not be considered a complete financial picture of a fund’s assets. Standard deviation is a measure of the dispersion of a set of data from its mean. The more spread apart the data, the higher the deviation. Standard deviation is also known as historical volatility. Morningstar Ratings are based on risk-adjusted return. The Overall Morningstar Rating for a fund is derived from a weighted-average of the performance figures associated with its three-, five- and ten-year (if applicable) Morningstar Rating metrics. Past performance does not guarantee future results. For each fund with at least a three-year history, Morningstar calculates a Morningstar Rating™ based on a Morningstar Risk-Adjusted Return measure that accounts for variation in a fund’s monthly performance (including the effects of sales charges, loads, and redemption fees), placing more emphasis on downward variations and rewarding consistent performance. The top 10% of funds in each category receive 5 stars, the next 22.5% receive 4 stars, the next 35% receive 3 stars, the next 22.5% receive 2 stars and the bottom 10% receive 1 star. (Each share class is counted as a fraction of one fund within this scale and rated separately, which may cause slight variations in the distribution percentages.) The Lipper ratings are subject to change every month and are based on an equal-weighted average of percentile ranks for the Tax Efficiency metrics over three-, five-, and ten-year periods (if applicable). The highest 20% of funds in each peer group are named Lipper Leader or a score of 5, the next 20% receive a score of 4, the middle 20% are scored 3, the next 20% are scored 2, and the lowest 20% are scored 1. Tax Free Fund, in Lipper’s General Municipal Debt classification, received the following ratings for the 3-, 5-, and 10-year periods, respectively: Tax Efficiency: 5 (220 funds), 5 (198 funds) and 5 (161 funds). Lipper ratings are not intended to predict future results, and Lipper does not guarantee the accuracy of this information. More information is available at www.lipperweb.com. Lipper Leader Copyright 2010, Reuters, All Rights Reserved.
Fund Composition3 as a percentage of total investments
Bonds 98.31%
Cash Equivalents 1.69%
Lipper ratings for Tax Effi ciency refl ect funds’ historical success in postponing taxable distributions relative to peers as of 12/31/10. Tax Effi ciency offers no benefi t to investors in tax-sheltered accounts such as retirement plans. Past performance does not guarantee future results.
Quality AAA 26%
AA 42%
A 25%
BBB 3%
Other 4%Maturity <1 Year 13 %
1-3 Years 18 %
3-5 Years 21 %
5-10 Years 37 %
10-20 Years 11 %
20+ Years 0 %
Average Maturity 5.50
Average Duration 6.12
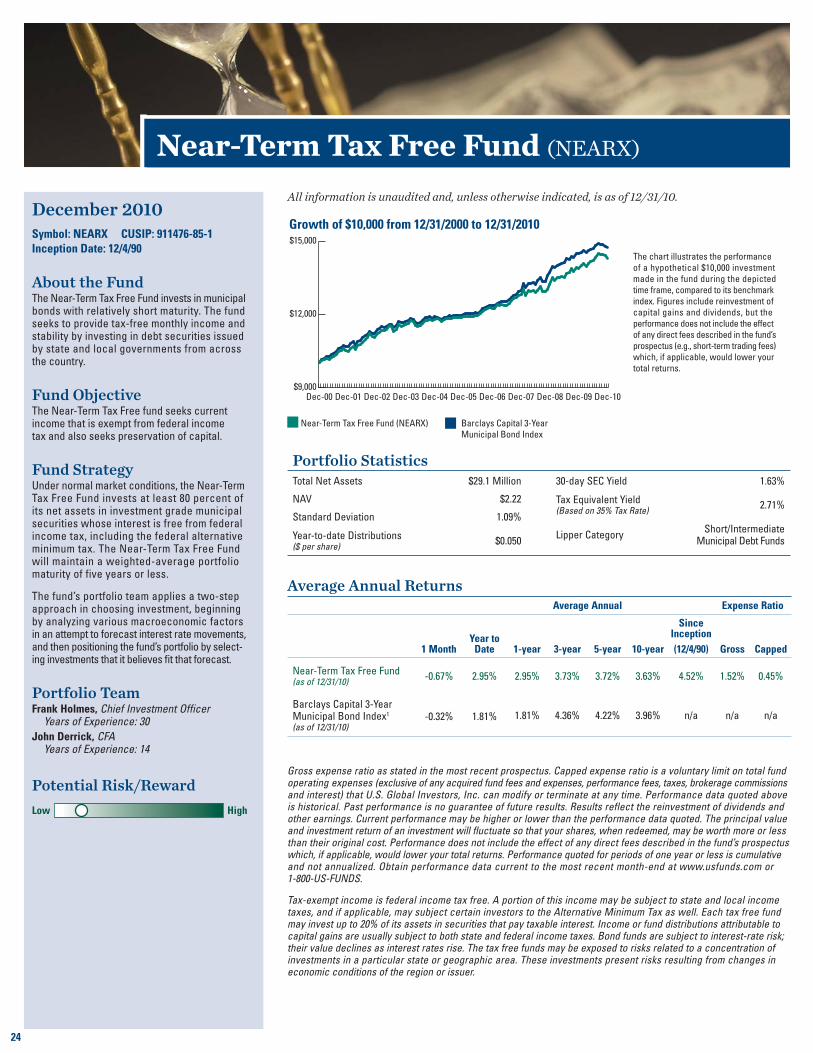
World Precious Minerals Fund
All information is unaudited and, unless otherwise indicated, is as of 12/31/10.
24
Near-Term Tax Free Fund (NEARX)
December 2010
Symbol: NEARX CUSIP: 911476-85-1
Inception Date: 12/4/90
About the FundThe Near-Term Tax Free Fund invests in municipal bonds with relatively short maturity. The fund seeks to provide tax-free monthly income and stability by investing in debt securities issued by state and local governments from across the country.
Fund ObjectiveThe Near-Term Tax Free fund seeks current income that is exempt from federal income tax and also seeks preservation of capital.
Fund StrategyUnder normal market conditions, the Near-Term Tax Free Fund invests at least 80 percent of its net assets in investment grade municipal securities whose interest is free from federal income tax, including the federal alternative minimum tax. The Near-Term Tax Free Fund will maintain a weighted-average portfolio maturity of five years or less.
The fund’s portfolio team applies a two-step approach in choosing investment, beginning by analyzing various macroeconomic factors in an attempt to forecast interest rate movements, and then positioning the fund’s portfolio by select-ing investments that it believes fi t that forecast.
Portfolio TeamFrank Holmes, Chief Investment Officer Years of Experience: 30
John Derrick, CFA Years of Experience: 14
Gross expense ratio as stated in the most recent prospectus. Capped expense ratio is a voluntary limit on total fund operating expenses (exclusive of any acquired fund fees and expenses, performance fees, taxes, brokerage commissions and interest) that U.S. Global Investors, Inc. can modify or terminate at any time. Performance data quoted above is historical. Past performance is no guarantee of future results. Results reflect the reinvestment of dividends and other earnings. Current performance may be higher or lower than the performance data quoted. The principal value and investment return of an investment will fluctuate so that your shares, when redeemed, may be worth more or less than their original cost. Performance does not include the effect of any direct fees described in the fund’s prospectus which, if applicable, would lower your total returns. Performance quoted for periods of one year or less is cumulative and not annualized. Obtain performance data current to the most recent month-end at www.usfunds.com or 1-800-US-FUNDS.
Tax-exempt income is federal income tax free. A portion of this income may be subject to state and local income taxes, and if applicable, may subject certain investors to the Alternative Minimum Tax as well. Each tax free fund may invest up to 20% of its assets in securities that pay taxable interest. Income or fund distributions attributable to capital gains are usually subject to both state and federal income taxes. Bond funds are subject to interest-rate risk; their value declines as interest rates rise. The tax free funds may be exposed to risks related to a concentration of investments in a particular state or geographic area. These investments present risks resulting from changes in economic conditions of the region or issuer.
Average Annual ReturnsAverage Annual Expense Ratio
1 MonthYear to
Date 1-year 3-year 5-year 10-year
Since Inception
(12/4/90) Gross Capped
Near-Term Tax Free Fund (as of 12/31/10)
-0.67% 2.95% 2.95% 3.73% 3.72% 3.63% 4.52% 1.52% 0.45%
Barclays Capital 3-Year Municipal Bond Index1
(as of 12/31/10)-0.32% 1.81% 1.81% 4.36% 4.22% 3.96% n/a n/a n/a
The chart illustrates the performance
of a hypothetical $10,000 investment
made in the fund during the depicted
time frame, compared to its benchmark
index. Figures include reinvestment of
capital gains and dividends, but the
performance does not include the effect
of any direct fees described in the fund’s
prospectus (e.g., short-term trading fees)
which, if applicable, would lower your
total returns.
Near-Term Tax Free Fund (NEARX) Barclays Capital 3-Year
Municipal Bond Index
Growth of $10,000 from 12/31/2000 to 12/31/2010
$9,000
$12,000
$15,000
Dec-10 Dec-09 Dec-08 Dec-07 Dec-06 Dec-05 Dec-04 Dec-03 Dec-02 Dec-01 Dec-00
Potential Risk/Reward
Low High
Portfolio StatisticsTotal Net Assets $29.1 Million
NAV $2.22
Standard Deviation 1.09%
Year-to-date Distributions ($ per share)
$0.050
30-day SEC Yield 1.63%
Tax Equivalent Yield(Based on 35% Tax Rate)
2.71%
Lipper CategoryShort/Intermediate
Municipal Debt Funds
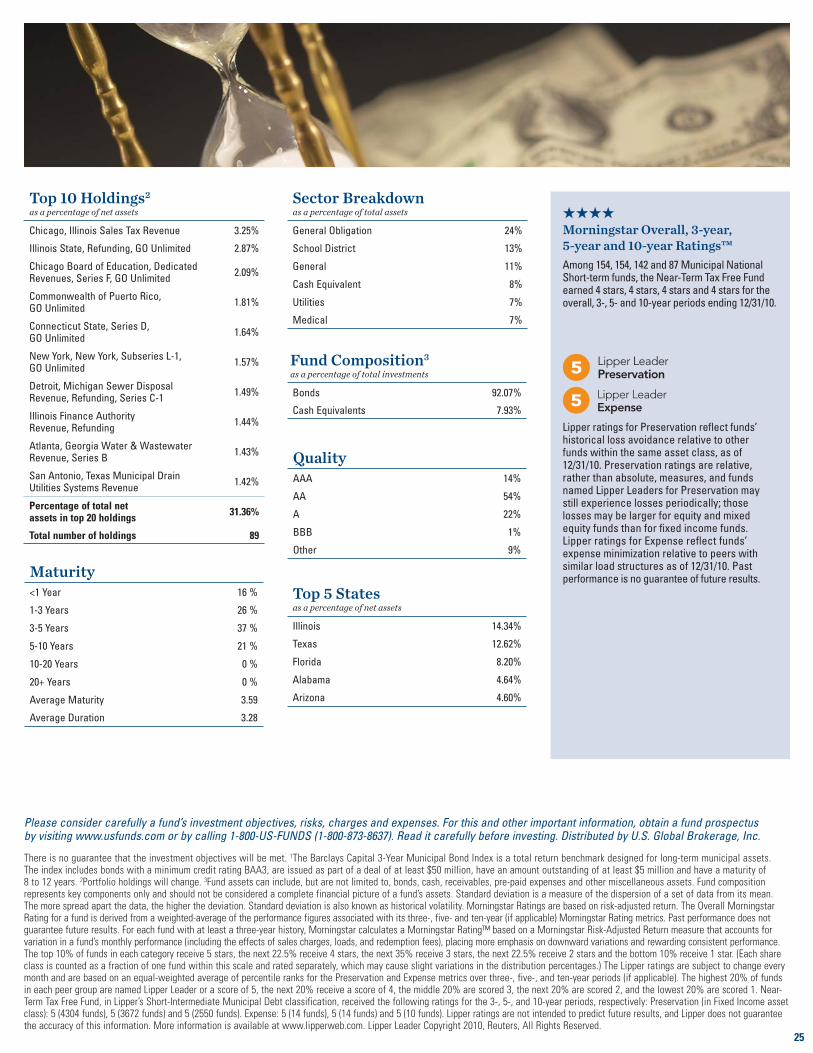
25
Top 5 States as a percentage of net assets
Illinois 14.34%
Texas 12.62%
Florida 8.20%
Alabama 4.64%
Arizona 4.60%
Top 10 Holdings2 as a percentage of net assets
Chicago, Illinois Sales Tax Revenue 3.25%
Illinois State, Refunding, GO Unlimited 2.87%
Chicago Board of Education, Dedicated Revenues, Series F, GO Unlimited
2.09%
Commonwealth of Puerto Rico, GO Unlimited
1.81%
Connecticut State, Series D, GO Unlimited
1.64%
New York, New York, Subseries L-1, GO Unlimited
1.57%
Detroit, Michigan Sewer Disposal Revenue, Refunding, Series C-1
1.49%
Illinois Finance Authority Revenue, Refunding
1.44%
Atlanta, Georgia Water & Wastewater Revenue, Series B
1.43%
San Antonio, Texas Municipal Drain Utilities Systems Revenue
1.42%
Percentage of total net assets in top 20 holdings
31.36%
Total number of holdings 89
Sector Breakdownas a percentage of total assets
General Obligation 24%
School District 13%
General 11%
Cash Equivalent 8%
Utilities 7%
Medical 7%
Please consider carefully a fund’s investment objectives, risks, charges and expenses. For this and other important information, obtain a fund prospectus by visiting www.usfunds.com or by calling 1-800-US-FUNDS (1-800-873-8637). Read it carefully before investing. Distributed by U.S. Global Brokerage, Inc.
There is no guarantee that the investment objectives will be met. 1The Barclays Capital 3-Year Municipal Bond Index is a total return benchmark designed for long-term municipal assets. The index includes bonds with a minimum credit rating BAA3, are issued as part of a deal of at least $50 million, have an amount outstanding of at least $5 million and have a maturity of 8 to 12 years. 2Portfolio holdings will change. 3Fund assets can include, but are not limited to, bonds, cash, receivables, pre-paid expenses and other miscellaneous assets. Fund composition represents key components only and should not be considered a complete financial picture of a fund’s assets. Standard deviation is a measure of the dispersion of a set of data from its mean. The more spread apart the data, the higher the deviation. Standard deviation is also known as historical volatility. Morningstar Ratings are based on risk-adjusted return. The Overall Morningstar Rating for a fund is derived from a weighted-average of the performance figures associated with its three-, five- and ten-year (if applicable) Morningstar Rating metrics. Past performance does not guarantee future results. For each fund with at least a three-year history, Morningstar calculates a Morningstar Rating™ based on a Morningstar Risk-Adjusted Return measure that accounts for variation in a fund’s monthly performance (including the effects of sales charges, loads, and redemption fees), placing more emphasis on downward variations and rewarding consistent performance. The top 10% of funds in each category receive 5 stars, the next 22.5% receive 4 stars, the next 35% receive 3 stars, the next 22.5% receive 2 stars and the bottom 10% receive 1 star. (Each share class is counted as a fraction of one fund within this scale and rated separately, which may cause slight variations in the distribution percentages.) The Lipper ratings are subject to change every month and are based on an equal-weighted average of percentile ranks for the Preservation and Expense metrics over three-, five-, and ten-year periods (if applicable). The highest 20% of funds in each peer group are named Lipper Leader or a score of 5, the next 20% receive a score of 4, the middle 20% are scored 3, the next 20% are scored 2, and the lowest 20% are scored 1. Near-Term Tax Free Fund, in Lipper’s Short-Intermediate Municipal Debt classification, received the following ratings for the 3-, 5-, and 10-year periods, respectively: Preservation (in Fixed Income asset class): 5 (4304 funds), 5 (3672 funds) and 5 (2550 funds). Expense: 5 (14 funds), 5 (14 funds) and 5 (10 funds). Lipper ratings are not intended to predict future results, and Lipper does not guarantee the accuracy of this information. More information is available at www.lipperweb.com. Lipper Leader Copyright 2010, Reuters, All Rights Reserved.
Fund Composition3 as a percentage of total investments
Bonds 92.07%
Cash Equivalents 7.93%
★★★★ Morningstar Overall, 3-year, 5-year and 10-year Ratings™
Among 154, 154, 142 and 87 Municipal National Short-term funds, the Near-Term Tax Free Fund earned 4 stars, 4 stars, 4 stars and 4 stars for the overall, 3-, 5- and 10-year periods ending 12/31/10.
Lipper ratings for Preservation refl ect funds’ historical loss avoidance relative to other funds within the same asset class, as of 12/31/10. Preservation ratings are relative, rather than absolute, measures, and funds named Lipper Leaders for Preservation may still experience losses periodically; those losses may be larger for equity and mixed equity funds than for fi xed income funds. Lipper ratings for Expense refl ect funds’ expense minimization relative to peers with similar load structures as of 12/31/10. Past performance is no guarantee of future results.
Quality AAA 14%
AA 54%
A 22%
BBB 1%
Other 9%
Maturity <1 Year 16 %
1-3 Years 26 %
3-5 Years 37 %
5-10 Years 21 %
10-20 Years 0 %
20+ Years 0 %
Average Maturity 3.59
Average Duration 3.28
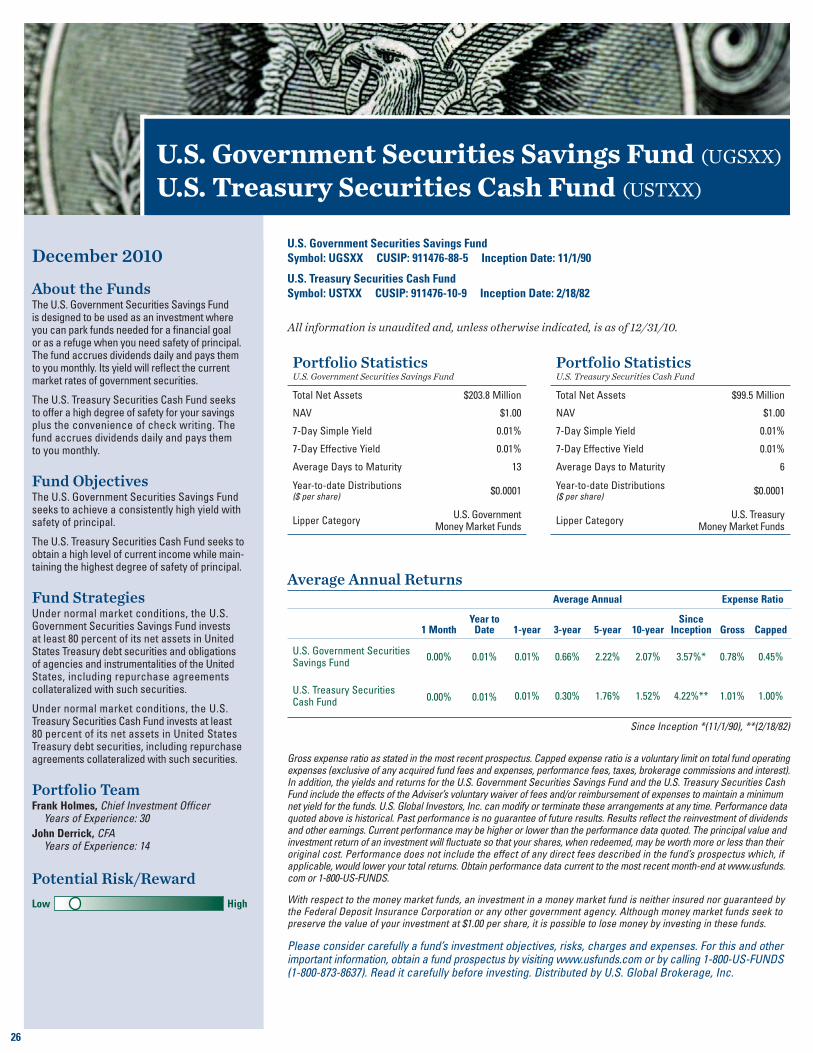
World Precious Minerals Fund
All information is unaudited and, unless otherwise indicated, is as of 12/31/10.
26
U.S. Government Securities Savings Fund (UGSXX)
U.S. Treasury Securities Cash Fund (USTXX)
December 2010
About the FundsThe U.S. Government Securities Savings Fund is designed to be used as an investment where you can park funds needed for a fi nancial goal or as a refuge when you need safety of principal. The fund accrues dividends daily and pays them to you monthly. Its yield will refl ect the current market rates of government securities.
The U.S. Treasury Securities Cash Fund seeks to offer a high degree of safety for your savings plus the convenience of check writing. The fund accrues dividends daily and pays them to you monthly.
Fund ObjectivesThe U.S. Government Securities Savings Fund seeks to achieve a consistently high yield with safety of principal.
The U.S. Treasury Securities Cash Fund seeks to obtain a high level of current income while main-taining the highest degree of safety of principal.
Fund StrategiesUnder normal market conditions, the U.S. Government Securities Savings Fund invests at least 80 percent of its net assets in United States Treasury debt securities and obligations of agencies and instrumentalities of the United States, including repurchase agreements collateralized with such securities.
Under normal market conditions, the U.S. Treasury Securities Cash Fund invests at least 80 percent of its net assets in United States Treasury debt securities, including repurchase agreements collateralized with such securities.
Portfolio TeamFrank Holmes, Chief Investment Officer Years of Experience: 30
John Derrick, CFA Years of Experience: 14
Gross expense ratio as stated in the most recent prospectus. Capped expense ratio is a voluntary limit on total fund operating expenses (exclusive of any acquired fund fees and expenses, performance fees, taxes, brokerage commissions and interest). In addition, the yields and returns for the U.S. Government Securities Savings Fund and the U.S. Treasury Securities Cash Fund include the effects of the Adviser’s voluntary waiver of fees and/or reimbursement of expenses to maintain a minimum net yield for the funds. U.S. Global Investors, Inc. can modify or terminate these arrangements at any time. Performance data quoted above is historical. Past performance is no guarantee of future results. Results reflect the reinvestment of dividends and other earnings. Current performance may be higher or lower than the performance data quoted. The principal value and investment return of an investment will fluctuate so that your shares, when redeemed, may be worth more or less than their original cost. Performance does not include the effect of any direct fees described in the fund’s prospectus which, if applicable, would lower your total returns. Obtain performance data current to the most recent month-end at www.usfunds.com or 1-800-US-FUNDS.
With respect to the money market funds, an investment in a money market fund is neither insured nor guaranteed by the Federal Deposit Insurance Corporation or any other government agency. Although money market funds seek to preserve the value of your investment at $1.00 per share, it is possible to lose money by investing in these funds.
Please consider carefully a fund’s investment objectives, risks, charges and expenses. For this and other important information, obtain a fund prospectus by visiting www.usfunds.com or by calling 1-800-US-FUNDS (1-800-873-8637). Read it carefully before investing. Distributed by U.S. Global Brokerage, Inc.
Average Annual ReturnsAverage Annual Expense Ratio
1 MonthYear to
Date 1-year 3-year 5-year 10-yearSince
Inception Gross Capped
U.S. Government Securities Savings Fund
0.00% 0.01% 0.01% 0.66% 2.22% 2.07% 3.57%* 0.78% 0.45%
U.S. Treasury Securities Cash Fund 0.00% 0.01% 0.01% 0.30% 1.76% 1.52% 4.22%** 1.01% 1.00%
Since Inception *(11/1/90), **(2/18/82)
Potential Risk/Reward
Low High
U.S. Government Securities Savings Fund
Symbol: UGSXX CUSIP: 911476-88-5 Inception Date: 11/1/90
U.S. Treasury Securities Cash Fund
Symbol: USTXX CUSIP: 911476-10-9 Inception Date: 2/18/82
Portfolio Statistics U.S. Government Securities Savings Fund
Total Net Assets $203.8 Million
NAV $1.00
7-Day Simple Yield 0.01%
7-Day Effective Yield 0.01%
Average Days to Maturity 13
Year-to-date Distributions ($ per share)
$0.0001
Lipper CategoryU.S. Government
Money Market Funds
Portfolio Statistics U.S. Treasury Securities Cash Fund
Total Net Assets $99.5 Million
NAV $1.00
7-Day Simple Yield 0.01%
7-Day Effective Yield 0.01%
Average Days to Maturity 6
Year-to-date Distributions ($ per share)
$0.0001
Lipper CategoryU.S. Treasury
Money Market Funds
All information is unaudited and, unless otherwise indicated, is as of 12/31/10.
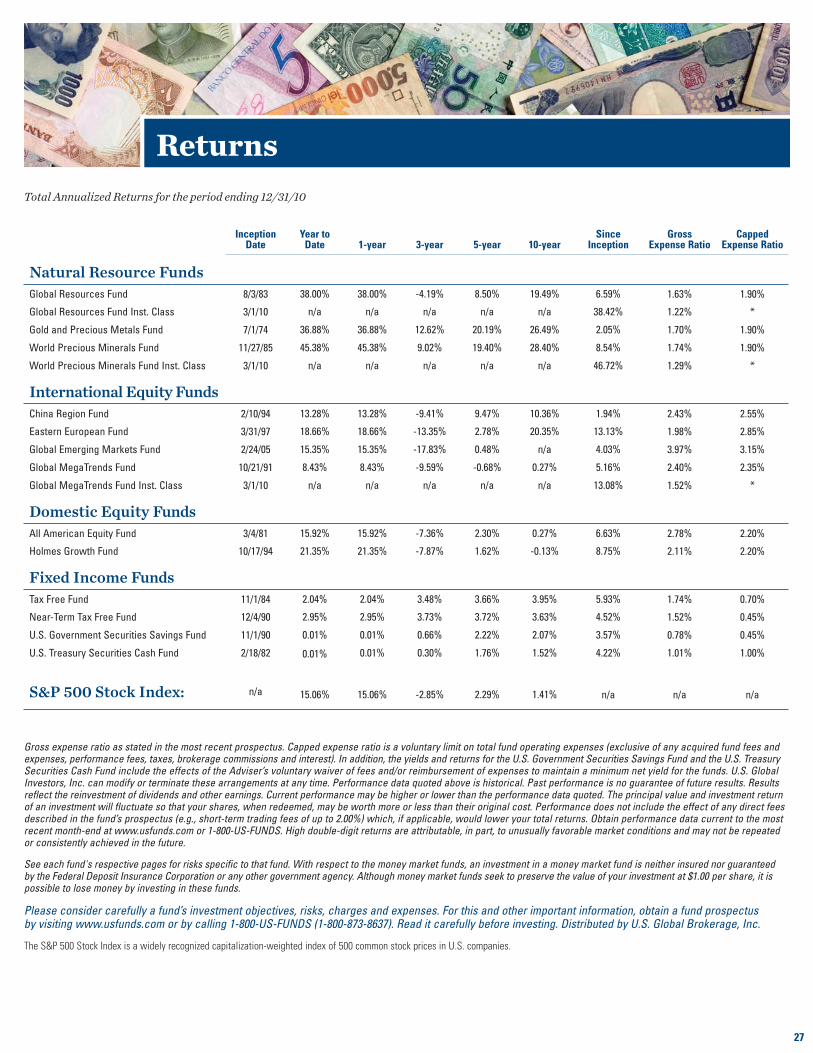
Inception Date
Year to Date 1-year 3-year 5-year 10-year
Since Inception
Gross Expense Ratio
Capped Expense Ratio
Natural Resource Funds
Global Resources Fund 8/3/83 38.00% 38.00% -4.19% 8.50% 19.49% 6.59% 1.63% 1.90%
Global Resources Fund Inst. Class 3/1/10 n/a n/a n/a n/a n/a 38.42% 1.22% *
Gold and Precious Metals Fund 7/1/74 36.88% 36.88% 12.62% 20.19% 26.49% 2.05% 1.70% 1.90%
World Precious Minerals Fund 11/27/85 45.38% 45.38% 9.02% 19.40% 28.40% 8.54% 1.74% 1.90%
World Precious Minerals Fund Inst. Class 3/1/10 n/a n/a n/a n/a n/a 46.72% 1.29% *
International Equity Funds
China Region Fund 2/10/94 13.28% 13.28% -9.41% 9.47% 10.36% 1.94% 2.43% 2.55%
Eastern European Fund 3/31/97 18.66% 18.66% -13.35% 2.78% 20.35% 13.13% 1.98% 2.85%
Global Emerging Markets Fund 2/24/05 15.35% 15.35% -17.83% 0.48% n/a 4.03% 3.97% 3.15%
Global MegaTrends Fund 10/21/91 8.43% 8.43% -9.59% -0.68% 0.27% 5.16% 2.40% 2.35%
Global MegaTrends Fund Inst. Class 3/1/10 n/a n/a n/a n/a n/a 13.08% 1.52% *
Domestic Equity Funds
All American Equity Fund 3/4/81 15.92% 15.92% -7.36% 2.30% 0.27% 6.63% 2.78% 2.20%
Holmes Growth Fund 10/17/94 21.35% 21.35% -7.87% 1.62% -0.13% 8.75% 2.11% 2.20%
Fixed Income Funds
Tax Free Fund 11/1/84 2.04% 2.04% 3.48% 3.66% 3.95% 5.93% 1.74% 0.70%
Near-Term Tax Free Fund 12/4/90 2.95% 2.95% 3.73% 3.72% 3.63% 4.52% 1.52% 0.45%
U.S. Government Securities Savings Fund 11/1/90 0.01% 0.01% 0.66% 2.22% 2.07% 3.57% 0.78% 0.45%
U.S. Treasury Securities Cash Fund 2/18/82 0.01% 0.01% 0.30% 1.76% 1.52% 4.22% 1.01% 1.00%
S&P 500 Stock Index: n/a 15.06% 15.06% -2.85% 2.29% 1.41% n/a n/a n/a
Total Annualized Returns for the period ending 12/31/10
Returns
Gross expense ratio as stated in the most recent prospectus. Capped expense ratio is a voluntary limit on total fund operating expenses (exclusive of any acquired fund fees and expenses, performance fees, taxes, brokerage commissions and interest). In addition, the yields and returns for the U.S. Government Securities Savings Fund and the U.S. Treasury Securities Cash Fund include the effects of the Adviser’s voluntary waiver of fees and/or reimbursement of expenses to maintain a minimum net yield for the funds. U.S. Global Investors, Inc. can modify or terminate these arrangements at any time. Performance data quoted above is historical. Past performance is no guarantee of future results. Results reflect the reinvestment of dividends and other earnings. Current performance may be higher or lower than the performance data quoted. The principal value and investment return of an investment will fluctuate so that your shares, when redeemed, may be worth more or less than their original cost. Performance does not include the effect of any direct fees described in the fund’s prospectus (e.g., short-term trading fees of up to 2.00%) which, if applicable, would lower your total returns. Obtain performance data current to the most recent month-end at www.usfunds.com or 1-800-US-FUNDS. High double-digit returns are attributable, in part, to unusually favorable market conditions and may not be repeated or consistently achieved in the future.
See each fund's respective pages for risks specific to that fund. With respect to the money market funds, an investment in a money market fund is neither insured nor guaranteed by the Federal Deposit Insurance Corporation or any other government agency. Although money market funds seek to preserve the value of your investment at $1.00 per share, it is possible to lose money by investing in these funds.
Please consider carefully a fund’s investment objectives, risks, charges and expenses. For this and other important information, obtain a fund prospectus by visiting www.usfunds.com or by calling 1-800-US-FUNDS (1-800-873-8637). Read it carefully before investing. Distributed by U.S. Global Brokerage, Inc.
The S&P 500 Stock Index is a widely recognized capitalization-weighted index of 500 common stock prices in U.S. companies.
27
www.usfunds.com • 1.800.US.FUNDS