Embed Size (px)
Citation preview
U.S. Fish and Wildlife ServiceRegion 2
Contaminants Program
bY
Stephen M. Robertson, Thomas W. SchultzLawrence R. Gamble and Thomas C. Maurer
U.S. Fish and Wildlife ServiceFish and Wildlife Enhancement
Corpus Christi Field OfficeCampus Box 338, 6300 Ocean Drive
Corpus Christi, Texas 78412
December 1991

CONTAMINANTS INVESTIGATION OFARANSAS DREDGE SPOIL ISLANDS, TEXAS,
1988-1989
Study Identifier
R2-88-2- 115
Prepared By
U.S. Fish and Wildlife ServiceEcological Services
Corpus Christi, Texas
Authors
Stephen M. RobertsonThomas W. Schultz
Lawrence R. GambleThomas C. Maurer
Under the Supervision of
Rogelio PerezField Supervisor
December 1991

ABSTRACT
Organochlorine, trace element, and petroleum hydrocarbon contaminants were examinedin sediments and biota from dredge spoil islands adjacent to Aransas National WildlifeRefuge, Texas. Trace elements were 200-500% higher in spoil sediments than local bays.Mercury levels were not elevated in either sediments or biota; other trace elements weredetected at moderate levels in most biota samples. Sheepshead minnows from Aransasdredge spoil sites had higher levels of most trace elements than sheepshead minnows froma control site in Flour Bluff, Texas, whereas trace element levels in water boatmen fromAransas dredge spoil sites were generally lower than water boatmen from an evaporationpond in California.
Organochlorines were not detected in sediments, and the low levels of aliphatichydrocarbons detected in sediments are assumed to be primarily of biogenic origin.Aromatic hydrocarbons were also detected in sediments and biota, but at very lowconcentrations. In general, this study indicates that a majority of contaminants evaluatedwere below levels of concern, however, chromium, copper, and lead were detected atelevated levels in both sediment and biota and should be considered as part of futuremonitoring programs.
ii

TABLE OF CONTENTS
ABSTRACT
LIST OF TABLES
LIST OF FIGURES
INTRODUCTION
METHODS AND MATERIALS
Sediment
Biota
Data Analysis
RESULTS AND DISCUSSION
Organochlorines
Trace Elements
Petroleum Hydrocarbons
CONCLUSIONS
ACKNOWLEDGEMENTS
LITERATURE CITED
Page
ii
iv
iv
1
3
3
3
8
9
9
9
21
24
24
25

LIST OF TABLES
Table
1. Elements and compounds analyzed in sediment and biota from theAransas Bay dredge spoil, Texas, 1988-89
2. Detection limits and analytical methods used in the analysisof sediment and biota samples collected from the Aransas Baydredge spoil islands, Texas, 1988-89
3. Geometric means and ranges of selected elements in sedimentsfrom spoil deposits in Aransas Bay, Texas, 1988-89, andcomparative data from other studies
4. Geometric means and ranges of selected trace elementsin sediments from spoil deposits by sample site in Aransas Bay,Texas, 198889
5. Arithmetic means and ranges of selected trace elements in biotafrom spoil deposits in Aransas Bay, Texas, 1988-89
6; Arithmetic means and ranges of selected elements in sheepsheadminnows (Qprinodon variegutus) from spoil deposits in AransasBay, Texas, 1988-89, and comparative data from a control siteand other studies and other species
7. Means and ranges of selected elements in water boatmen from spoildeposits in Aransas Bay, Texas, 1988-89, and comparative datafrom other studies
8. Arithmetic means and ranges of selected alkanes in sediments (ppmwet weight) from spoil deposits by sample site in Aransas Bay,Texas, 1988-89
LIST OF FIGURES
Figure
1. Location of Aransas Bay, Texas
Page
6
7
10
13
14
17
20
22
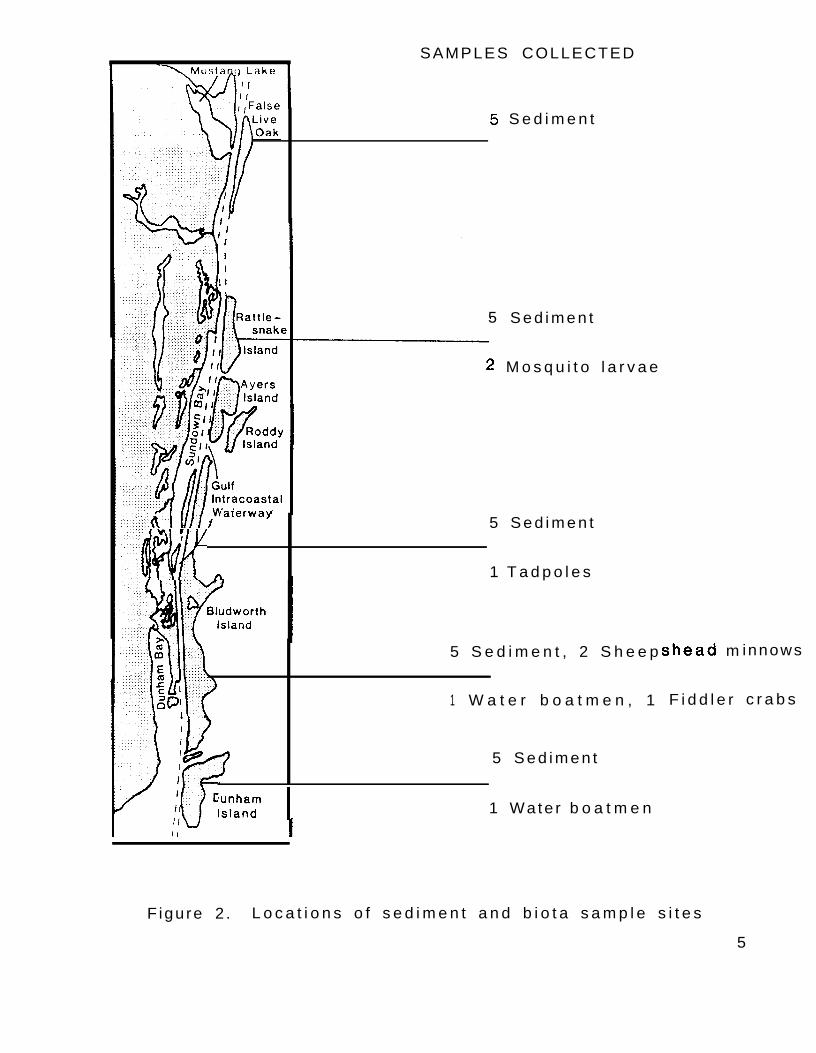
2. Location of sediment and biota sample sites
iV
INTRODUCTION
The deposition of dredge spoil material from the creation and maintenance of navigationchannels along the Texas coast has received a great deal of scrutiny from the U.S. Fish andWildlife Service (Service) and other resource agencies. Although numerous concerns havebeen raised regarding this activity (Natural Resource Maintenance Dredging Working Group1988), the disposal of contaminated dredge material is of special concern to the Service’sEnvironmental Contaminants program.
Agricultural activities, oil and gas exploration and production, petrochemical refining, oreprocessing plants, urban runoff, and municipal wastewater discharges are major contributorsof contaminants to Texas bay systems. These contaminants include petroleum hydrocarbons,heavy metals, and pesticides. Due to the hydrophobic nature of many of these contaminants,they tend to adsorb to suspended solids and sediments that settle out onto bay bottoms andinto existing navigation channels. In many areas, sediment samples have been found tocontain alarming levels of contaminants. In response to this problem, material that isdredged from navigation channels is often placed in confined disposal areas, if it isdetermined to be unacceptable for open water disposal (Palermo 1988).
After dredging has ceased, confined disposal areas can become attractive to a variety ofbirds, providing vegetated areas and ponded water for feeding and nesting. White andCromartie (1985) observed 56 species of birds feeding in a confined disposal area in NuecesBay, including great blue herons (Ardea herodias), snowy egrets (Egreffa fhula), tricoloredherons (Egret& tricolor), green-winged teal (Anas crecca), northern shoveler (Anas clypeafa),black necked stilts (Himanfopus mexicanus), American avocet (Recurvirosfra americana) andwillets (Cafopfrophorus semipalmafus).
Very little is known about the potential contaminant threats posed to birds that feed inponds found within confined disposal areas. Heavy metals (cadmium, mercury, lead,selenium, and zinc) were examined by White and Cromartie (1985) in three bird species,comparing those utilizing a confined disposal area to natural control sites. Only seleniumwas found at higher levels in birds feeding in the confined disposal area. They did notexamine these birds for other contaminants such as aromatic hydrocarbons, aliphatichydrocarbons, or organochlorines.
The primary goal of this study was to gain preliminary information on the potential threatthat contaminants in confined disposal areas adjacent to Aransas National Wildlife Refuge(Aransas NWR) pose to birds that utilize these areas, including the endangered whoopingcrane (Gnus americana) that often feeds on the dredge spoil study sites. In addition toconcerns over potential contaminants in the spoil materials and their effects on naturalresources, this study was also prompted by documentation by the Corps of Engineers in 1986of a sediment sample from within the study area with an unusually high level of mercury
t
I

c
(over 2 ppm). This sample was taken from an area which had received fugitive dredge spoilsediments from a breach in the containment dike on Rattlesnake Island. This high mercurylevel prompted great concern because there was no obvious or expected source to which itcould be attributed. This study was intended, in part, to follow up on this concern anddetermine if greater alarm over local mercury levels was warranted.

METHODS AND MATERIALS
Sediment
c
Surface soil and sediment samples were collected at 25 sites within five spoil areas adjacentto the Aransas NWR. Five sediment samples were taken at each of the five spoil islands.Samples were collected to ensure representative coverage of the various conditions withineach spoil area, such as in both wet and dry, high and low areas, etc. In dry areas, soil wasscraped from the top six inches with a stainless steel scoop. An Ekman dredge was used forsampling in wet or submerged areas. The Aransas Bay locality is shown in Figure 1, andFigure 2 shows the locations of the sample sites. Sample jars and lid liners were chemicallycleaned with acid and organic solvents according to U.S. Environmental Protection Agencyprocedures (EPA 1982). Sediment samples were analyzed for trace elements, aromatichydrocarbons, alkanes, pesticides, and PCBs (Table 1). Trace elements were analyzed atHazelton Laboratories of America, Inc. Using inductively coupled plasma emissionspectroscopy to determine levels of all of the elements except arsenic, selenium, andmercury. Arsenic and selenium levels were measured by hydride generation with atomicabsorption, and cold vapor atomic absorption was used for the mercury analysis. Blanks,duplicates, spiked samples, and standards were used for quality control and qualityassurance, and the results monitored by personnel of the Service’s Patuxent AnalyticalControl Facility (Patuxent). Aromatic hydrocarbons, alkanes, pesticides, and PCBs wereanalyzed at the Geochemical and Environmental Research group of Texas A&M University(GERG). Capillary gas chromatography (CGC) with flame ionization was used to determinealiphatic hydrocarbons. Pesticides and PCBs were analyzed by CGC with electron capture,and aromatic hydrocarbons were quantified by mass spectrometer in the SIM mode. Blanks,duplicates, spiked samples, and standards were used for quality control and qualityassurance, which was monitored by Patuxent. Elements and compounds analyzed in thisstudy are given in Table l., and the detection limits are shown in Table 2.
Biota
Composite samples of several organisms that utilize the ponds in the confined disposal areaswere collected for analysis. Sheepshead minnows, water boatmen, mosquito larvae, fiddlercrabs, and tadpoles were collected from among four spoil islands, and sheepshead minnowswere also collected from one control site in Corpus Christi, Texas. All biota samples wereanalyzed for organochlorines, trace elements, and aromatic hydrocarbons.
Analyses of 21 trace elements were performed at the Environmental Trace SubstanceResearch Center in Columbia, Missouri. Trace elements were determined using inductivelycoupled plasma emission spectroscopy. Hydride generation with atomic absorption was usedfor arsenic and selenium determination and cold vapor atomic absorption was used for
3

--_-_- Arc’.14 2 0 2 4 Study
UlltS. . . . . Refuge Boundary
Figure 1. Areaa included in the study.
P
SAMPLES COLLECTED
5 S e d i m e n t
5 S e d i m e n t
M o s q u i t o l a r v a e
larerway1,
I /if
tii n
5 S e d i m e n t
1 T a d p o l e s
5 S e d i m e n t , 2 S h e e p
1 W a t e r b o a t m e n , 1
5 S e d i m e n t
funhamIsland I 1 Wa te r b o a t m e n
shead m innows
F i d d l e r c r a b s
F igure 2 . L o c a t i o n s o f s e d i m e n t a n d b i o t a s a m p l e s i t e s
5

Table 1. Elements and compounds analyzed in sediment and biotafrom the Aransas Bay dredge spoil, Texas, 1989.
Elements OrganochlorinesAromatic
Hydrocarbons Alkanes'
AluminumAntimony'ArsenicBariumBerylliumBoronCadmiumChromiumCopperIronLeadMagnesiumManganeseMercuryMolybdenumNickelSeleniumSilverStrontiumThalliumTin'VanadiumZinc
alpha-BHC Naphthalene N-Cl2beta-BHC 2 Methyl Naphthalene N-Cl3delta-BHC Biphenyl N-Cl4gamma-BHC* _ 2,6 Dimethyl Naphthalene N-Cl5
Acenaphthene N-Cl6Total BHC1sLAldrinhepta epoxidealpha chlordanegamma chlordaneoxy chlordanetrans nonachlorcis nonachlorDieldrinEndrinMirexo,p' - DDEo,p' - DDDo,p' - DDTPIP' - DDEPIP' - DDDPIP' - DDTTotal DDT's'Total PCB'sToxapheneLindane'HeptachlorHCB
Methyl Naphthalene N-Cl7Flourene PristanePhenanthrene N-Cl8Anthracene Phytane
1 Methyl Phenanthrene N-Cl9Fluoranthrene N-C20
PyreneChrysene
Benzo(a)anthraceneBenzo(b)fluoranthreneBenzo(k)fluoranthrene
Benzo(a)pyreneBenzo(e)pyrene
PeryleneIndeno pyrene
Dibenzo anthraceneBenzo (g,h,i,)perylene
AcenaphthyleneMethyl Naphthalene
' Sediments only
' Biota only
6
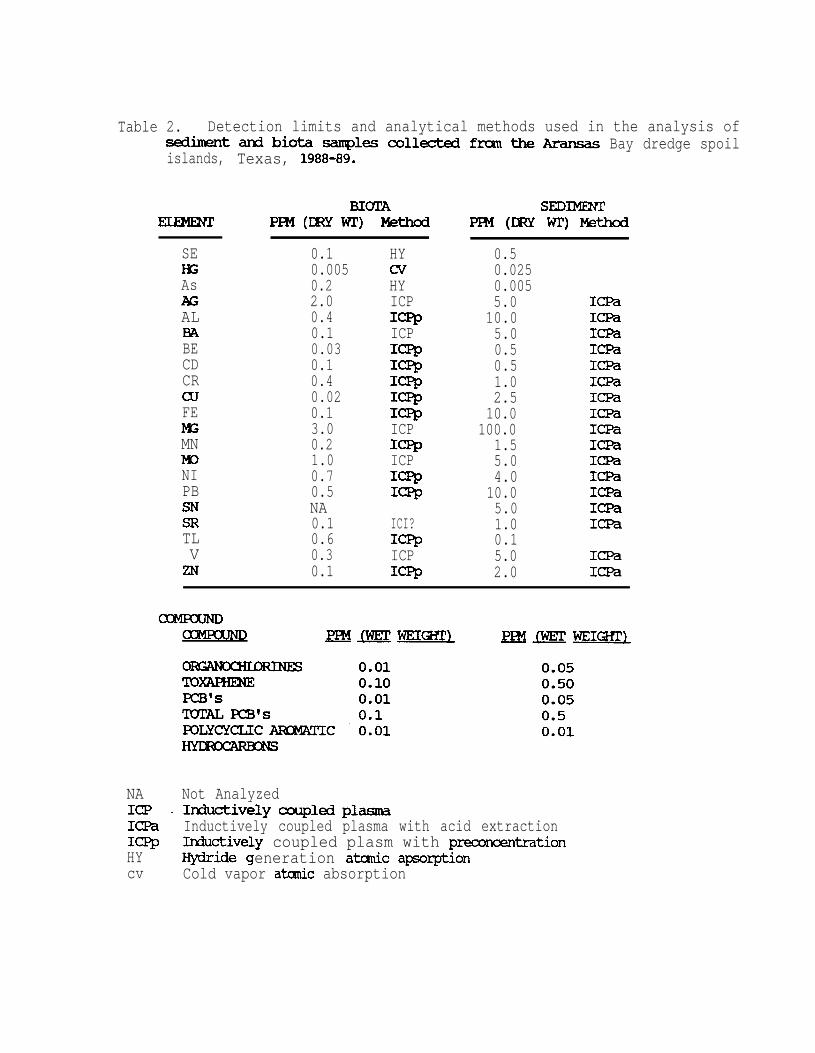
Table 2. Detection limits and analytical methods used in the analysis ofsedimentandbiot.asamlescollect&fmntheAransas Bay dredge spoilislands, Texas, 1988-85.
PPM (mY wy&hodSE 0.1l-c 0.005As 0.2AG 2.0AL 0.4B?i 0.1BE 0.03CD 0.1CR 0.4cu 0.02FE 0.1Ia 3.0MN 0.2Im 1.0NI 0.7PB 0.5SN NASR 0.1TL 0.6V 0.3ZN 0.1
HYc!vHYICPIcppICPIQ??IapIcppIspIcppICPIcppICPIcppIsp
ICI?10ICPIcpp
SEDlMEKTPFM (IXY w-r) Method
0.50.0250.0055.0 IC%
10.0 IC!Fa5.0 ICPa0.5 Icpa0.5 ICFB1.0 ICFB2.5 IC!.Pa10.0 ICFB
100.0 ICPa1.5 ICPa5.0 ICPa4.0 ICPa10.0 1C.h5.0 ICRl1.0 Icpa0.15.0 ICPa2.0 ICPa
NA Not AnalyzedICP - lixhctivelycoupledplasmIcpa Inductively coupled plasma with acid extractionIcpp IMuctively coupled plasm with preconcentrationHY Hydride generation atcxnic apsoxptioncv Cold vapor atmic absorption
mercury. Preconcentration methods were used to enhance detection limits for aluminum,beryllium, cadmium, chromium, copper, iron, manganese, nickel, lead, thallium, and zinc.
Analyses of organic compounds were performed at the GERG. Aromatic hydrocarbons,alkanes, and organochlorines were determined using gas chromatography with massspectrophotometry for confirmation. Patuxent monitored quality control at theselaboratories. Nominal detection limits for the chemicals and elements analyzed in biota aregiven in Table 2.
A n a l y s i sData
Minimum and maximum values were determined for all organochlorine, trace element, andpetroleum hydrocarbon concentrations found above detection limits. Geometric means weredetermined in those instances where more than 50% of the samples were above detectionlimits. In those cases where geometric means were calculated, one-half the detection limitwas used for those samples below detection limits. The numerical log of each value wastaken and then the mean of the logs was calculated. The antilog of the mean was thentaken to convert the value back to the arithmetic scale. Arithmetic means were calculatedwhen the number of samples was low (n=2). All trace elements and petroleumhydrocarbons are presented in parts per million (ppm) or the equivalent micrograms pergram @g/g>-
RESULTS AND DISCUSSION
ORGANOCHLORINES
Neither PCBs nor organochlorine pesticides were found above the detection limits insediment and biota samples of this study. The National Academy of Sciences and NationalAcademy of Engineers (1972) established a level of 1 ppm of total DDT in biota as therecommended level for protection of aquatic life. Samples in this study had concentrationsless than 0.05 ppm.
TRACE ELEMENTS
Sediments
Twenty-one of 23 trace elements were found above detection limits in sediment.Molybdenum and silver were the only elements not found above detection limits, althoughtin was found in only one sediment sample. The geometric mean and ranges of selectedtrace elements in sediment are presented in Table 3. These values are compared both toresults from a previous study (Gamble et al. 1989) on the overall bay system, and togeochemical baselines for minor elements in soils in the western United States (Shacklettand Boernaen 1984). All trace element in sediment data from this study are presented inparts per million (ppm) dry weight.
ArsenicArsenic was detected in all sediment samples. The geometric mean (GM) was 3.98 ppm(dry weight), with a minimum of 0.59 ppm and maximum of 7.46 ppm. These values areelevated as compared to the overall bay system mean of 1.8 ppm (Gamble et al. 1989), butare below levels of concern expressed by Eisler (1988).
CadmiumCadmium was not found above detection limits in any of the sediment samples from thestudy area. This is consistent with results reported from the surrounding bay system, whereonly 3% of the sediment samples were above detection limits for this element (Gamble etal. 1989). In contrast, much higher levels (up to 19.9 ppm wet weight) were detected byWhite and Cromartie (1985) in Corpus Christi Bay dredge spoil sediments.
ChromiumChromium was detected in all sediment samples, and ranged between 2.06 and 33.8 ppm,with a GM of 14.57 ppm. Some levels were elevated relative to values reported for the theGM of 5.9 in the local bay system (Gamble et al. 1989), warranting some concern. Thesource of elevated levels of chromium is likely from oil and gas production activities and
9

c
Table 3. Gecxnetricmeans andranges(inparentheses)ofselectedelementsin-ts &P" dry weight) frun spoil deposits in Aransas Bay,Texas, 1988-89, andcmpamtivedata frcanother studies.
lllcal Bays'corpus clqsti Soil BaselinesBay Spoil for Western U.S.3
(n=3, wetweight)
As
B
CD
CR
cu
PB
HG
.NI
SE
ZN
3.98(0.589-7.46)
254
25.46(2.26-186)
23
BDLS
14.57(2.06-33.8)
25
15.9(5.63-26.2)
25
23.96(5.1-66.2)
19
(0.03-0.05)4
(2.OZO.5)20
BDL
35.86(3.7-83.2)
25
(01;!5.0) (l.ZG2)
(5Z91)
-6(0.3-0.5) (2.E9.9)
(2.ZO.O) (8.::00)
(0.Z2.0) (4.?90)
(4.E9.0)49.2
(37.5-58.3) (5.5755)
(0.05-0.50) (OYO.7)0.046
(0.009-0.25)
(l.o~;~.o) (3%66)
(0.2-5.1) (l.Z.4)0.23
(0.04-1.4)
16.7 847.6(0.2-79.2) (330.3-2343.9) (1?180)
' Dab frcm Gamble et. al., 1989
*mtxfmnWhitearki Crmartie, 19853 Gecmetric means and expecbd 95% ramps frm Wells et. al., 19884Numbe.rofsamplesabvedetectionlimit5 Belmdetectionlimit' Fewer than l/2 n abcve detection limits
10

c
heavy shipping traffic in the Gulf Intracoastal Waterway (GIWW), where the maintenancedredging sediments originated.
CopperCopper was detected in all sediment samples, with a GM of 14.57 and a range of 5.63-26.2ppm dry weight. These levels were markedly elevated relative to samples collected from thesurrounding bays (GM = 3.2 ppm, Gamble et al. 1989), probably reflecting anthropogenicsources of contamination from shipping-related activity on the GIWW.
LeadLead was detected in 19 of 25 sediment samples. The GM of 23.96 ppm indicates elevatedlevels relative to a GM of 5.1 ppm from the surrounding bay system (Gamble et al. 1989),but lower than Corpus Christi Bay dredge spoil sites (GM = 49.2 ppm wet weight, Whiteand Cromartie 1985). Harrison (1987) determined that 13 ppm of lead is the backgroundlevel for soils in the vicinity of Corpus Christi, Texas.
MercuryThis element was detected in only two of 25 sediment samples, with a range of 0.02-0.05ppm. These levels can be considered characteristic background levels in uncontaminatedsediments (Eisler 1987), and little concern is warranted over mercury concentrations insurface sediments of these dredge spoil disposal areas. The high levels noted by the COE(1986) in fugitive sediments from dredge spoils in the vicinity may have been from a deepersediment layer. Deeper core sampling of these spoils may be required to resolve this issue.In contrast to the low levels detected by this study, somewhat higher levels averaging 0.5ppm wet weight were found by White and Cromartie (1985) in dredged sediments of theCorpus Christi, Texas area.
NickelNickel concentrations in sediment were detected in 80% of the sediment samples, with aGM of 9.7 and a range of 2.05-20.5. Although these values are slightly elevated relative tothe surrounding area, they are still within acceptable limits.
SeleniumSelenium was not detected in any of the sediment samples in this study. In the Aransas Baycomplex (Gamble et al. 1989), selenium was detected in 25% of sediment samples, andlevels up to 8.4 ppm wet weight were detected in dredge spoil in the Corpus Christi, Texasarea (White and Cromartie 1985).
ZincZinc levels in sediment ranged from 3.7 to 83.2 ppm, with a GM of 35.86. This value ishigher than surrounding areas (Gamble et al. 1989), but far lower than that from dredge
11

e
sediments measured in Corpus Christi Bay; 847.6 ppm wet weight (White and Cromartie1985).
Comparison Between Spoil Islands
The relative load of trace elements was compared by dividing analyses into groups by spoilisland (Table 4). North Bludworth spoil island consistently had the highest levels of selectedtrace elements, approaching double the overall average. Either the high mercury levelpreviously detected in a sample of fugitive sediment from Rattlesnake Island was anomalous,because sediment samples from that site consistently had the lowest levels of selected traceelements, or the source of the higher levels of mercury was from deeper layers of sedimentthat were not sampled in this study.
Biota
At the dredge spoil sites sampled for this study, macrofaunal diversity and density waslimited, narrowing the options for biota sampling. Sheepshead minnows, water boatmen,mosquito larvae, tadpoles, and fiddler crabs were collected from among the sites.
In biota samples, all but two (silver and thallium) of 19 elements were found above detectionlimits, although molybdenum was found only in mosquito larvae. The arithmetic means andranges of selected trace elements in biota are given in Table 5. All elemental tissueconcentrations are expressed as parts per million (ppm) dry weight.
ArsenicArsenic was detected in all biota samples, ranging from 0.85 ppm dry weight in waterboatmen from Dunham disposal island to 3.1 ppm in water boatmen from South Bludworth.Arsenic is a trace element that often receives special interest because of its ability, atelevated levels, to produce mutagenic, teratogenic, and carcinogenic effects in mammals(Nagymajtenyi et al. 1985). Although concentrations in most organisms are typically lessthan 1 ppm, marine organisms are an exception (Eisler 1988a). Arsenic levels in sheepsheadminnows from Aransas bay dredge spoil areas were measured at 1.45 ppm, greater than theNational Contaminants Biomonitoring Plan (NCBP) 85th percentile of 1.35 ppm’ for avariety of freshwater fish from across the U.S. (Schmitt and Brumbaugh 1990). Marine biotahave the ability to accumulate arsenic from seawater and food and typically have higherconcentrations than freshwater organisms (Maher 1985). These higher concentrations aregenerally not considered harmful to either the organism or to human consumers, because
* For this and further references to NCBP means and 85th percentiles, original wetweight data has been converted to approximate dry weight basis by multiplying by a factorof five.
12
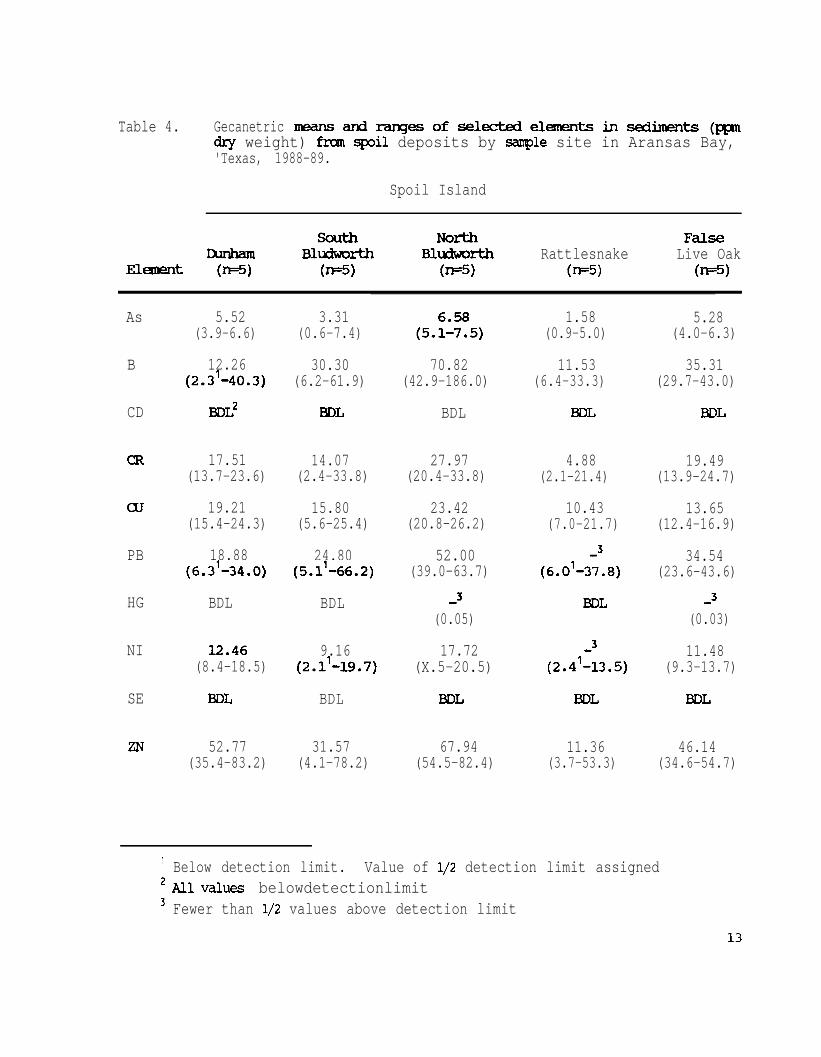
Table 4. Gecanetric mMnsandmnges0fselectedel~tsinsediments(ppndry weight) frm spoil deposits by saxple site in Aransas Bay,'Texas, 1988-89.
Spoil Island
Elanmt
scuthBlu3mrthw3
NorthBlerth0-1
Rattlesnake(n=5)
FdLSeLive Oak
(-5)
As 5.52(3.9-6.6)
B 12.26(2.3'-40.3)
CD BDL2
CR 17.51(13.7-23.6)
aJ 19.21(15.4-24.3)
PB 18.88(6.3'-34.0)
HG BDL
NI 12.46(8.4-18.5)
SE BDL
ZN 52.77(35.4-83.2)
' Below detection limit. Value of l/2 detection limit assigned2Allvalues belowdetectionlimit3 Fewer than l/2 values above detection limit
3.31(0.6-7.4)
30.30(6.2-61.9)
BDL
14.07(2.4-33.8)
15.80(5.6-25.4)
24.80(5.b66.2)
BDL
9.16(2.1'-19.7)
BDL
31.57(4.1-78.2)
70.82(42.9-186.0)
BDL
27.97(20.4-33.8)
23.42(20.8-26.2)
52.00(39.0-63.7)
-3(0.05)
17.72(X.5-20.5)
BDL
67.94(54.5-82.4)
1.58(0.9-5.0)
11.53(6.4-33.3)
BDL
4.88(2.1-21.4)
10.43(7.0-21.7)
-3(6.0'-37.8)
BDL
-3(2.4'-13.5)
BDL
11.36(3.7-53.3)
5.28(4.0-6.3)
35.31(29.7-43.0)
BDL
19.49(13.9-24.7)
13.65(12.4-16.9)
34.54(23.6-43.6)
-3(0.03)
11.48(9.3-13.7)
BDL
46.14(34.6-54.7)
13
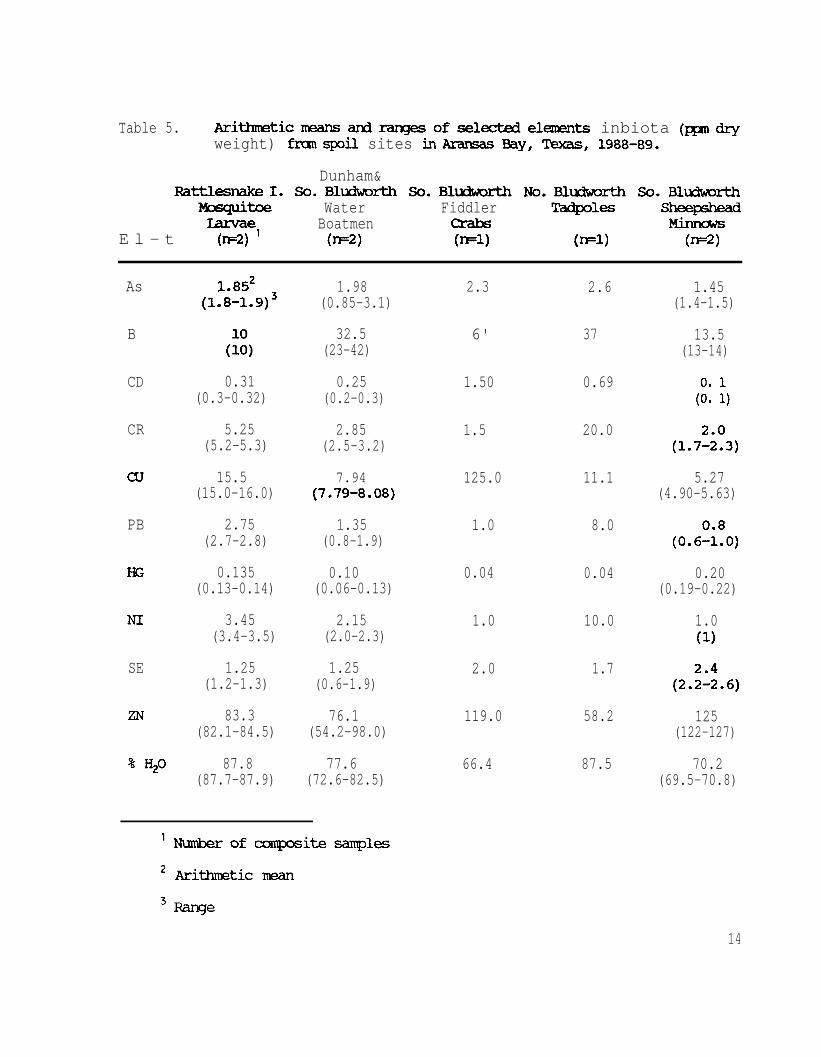
Table 5. ArithnmticmansarUraqesofselectedelemmts inbiota (ppndxyweight) frcanspoil sites i.nAransas Bay, Tews, 1988-89.
Dunham&RattlesnakeI. So.Bltirth So.Blkhmth No.BlMworth So.Bludworth
Mosquitoe Water Fiddler =QPl=Ianme Boatmen
E l - t (-2) ' 0-1 ow m=l) O-1
As
B
CD
CR
aJ
PB
HG
Nx
SE
ZN
% H20
1.8S2(1.8-1.9)3
0.31(0.3-0.32)
5.25(5.2-5.3)
15.5(15.0-16.0)
2.75(2.7-2.8)
0.135(0.13-0.14)
3.45(3.4-3.5)
1.25(1.2-1.3)
83.3(82.1-84.5)
87.8(87.7-87.9)
1.98(0.85-3.1)
32.5(23-42)
0.25(0.2-0.3)
2.85(2.5-3.2)
7.94(7.79-8.08)
1.35(0.8-1.9)
0.10(0.06-0.13)
2.15(2.0-2.3)
1.25(0.6-1.9)
76.1(54.2-98.0)
77.6(72.6-82.5)
2.3
6'
1.50
1.5
125.0
1.0
0.04
1.0
2.0
119.0
66.4
2.6
37
0.69
20.0
11.1
8.0
0.04
10.0
1.7
58.2
87.5
1.45(1.4-1.5)
13.5(13-14)
(:: :,
(1.7Y3)
5.27(4.90-5.63)
(0.6°;80)
0.20(0.19-0.22)
1.0(1)
(2.ki.6)
125(122-127)
70.2(69.5-70.8)
'Nmberofampcsitesanples
' Zurithnuztic man
3Range
14

the major form of arsenic in marine organisms (arsenobetaine) is considered relativelyharmless (Kaise et al. 1985).
CadmiumAll biota samples analyzed for this study had detectable levels of cadmium, ranging from 0.1ppm in sheepshead minnows to 1.5 ppm in fiddler crabs, both from South Bludworth.Cadmium levels in sheepshead minnows were below the NCBP 85th percentile of 0.25 ppm(converted from wet weight, Schmitt and Brumbaugh 1990).
Cadmium, generally considered a nonessential trace element (Eisler 1985a), is potentiallytoxic to most fish and wildlife, particularly freshwater organisms. Marine biota typicallycontain much higher concentrations than freshwater organisms due to the higher levels ofcadmium in seawater (Eisler 1985a).
Eisler (1971) determined in a laboratory study with the mummichog (FunduZus heteroclitus),an estuarine fish, that whole body fresh weight concentrations exceeding 5.0 ppm werepotentially lethal. In general, concentrations exceeding 2.0 ppm whole body, fresh weight,for vertebrate animals is considered evidence of probable cadmium contamination (Eisler1985a). The concentrations of cadmium in all sheepshead minnow and tadpole samplesfrom this study (approximately 0.03 and 0.09 ppm respectively, wet weight) were well belowthese levels.
Eisler (1985a) noted that cadmium tends to biomagnify through trophic levels. The datafrom this study agrees with this determination. The concentrations in fiddler crabs wereslightly higher than those in tadpoles, which in turn were higher than mosquito larvae. Eisler(1985a) determined that wildlife dietary intake exceeding 0.10 ppm cadmium (fresh weight)on a sustained basis should be viewed with caution. Phillips and Russo (1978) warned thatoysters are capable of accumulating extremely high levels of cadmium in edible portions, andthus represent a potential hazard to human consumers. The elevated levels of cadmiumcould have implications for whooping cranes, which at times feed heavily on a variety ofinvertebrates. Currently whooping cranes often feed in the immediate vicinity of the samplesites.
The source of cadmium detected in this study has not been determined. Anthropogenicsources of cadmium include fertilizers, municipal wastewater, smelter dust and the productsof cadmium-bearing materials in fossil fuels. Cadmium was seldom detected above detectionlimits in sediment (0.5 ppm) but a lower detection limit might have revealed some differencebetween sites.
ChromiumChromium was found above detection in all biota samples. Values ranged from 1.7 ppm in
15

sheepshead minnows from South Bludworth to 20 ppm in tadpoles from North Bludworth.Chromium is known to have both lethal and sublethal effects on fish and wildlife, andcurrent evidence suggests that tissue levels in fish and wildlife in excess of 4.0 ppm dryweight are indicative of chromium contamination (Eisler 1986). Both mosquito larvae fromRattlesnake Island (5.25 ppm) and tadpoles from North Bludworth (20 ppm) hadconcentrations that exceeded this level.
CopperCopper was detected in all biota samples, from a low of 4.9 ppm in sheepshead minnowsfrom South Bludsworth to a high of 125 ppm in fiddler crabs. Although copper is anessential element for both plants and animals, in sufficient concentration it may also be toxicto a variety of fish and wildlife (EPA 1980). Breteler (1984) placed copper as one of themajor threats to ecosystem health relative to other heavy metals.
The concentrations of copper in sea catfish from this area were generally low (GM = 0.06ppm wet weight: approximately 0.3 ppm DW). Sea catfish collected in the Lower LagunaMadre and South Bay, Texas (Gamble et al. 1988), contained GM levels of 0.36 ppm wetweight (approximately 1.8 ppm dry weight). Copper levels for sheepshead minnows in thecurrent study were considerably higher (GM=5.27 dry weight). Custer et al. (1986) in astudy at Narragansett Bay, Rhode Island, found that killifish (Fundulus sp.) from areas ofhigh contamination contained copper levels of 19.2 ppm dry weight, whereas killifish fromareas of “less contamination” contained 9.1 ppm. The NCBP geometric mean during 1984for a variety of fish species nationwide was recently reported as 0.65 ppm wet weight, orapproximately 3.25 ppm dry weight (Schmitt and Brumbaugh 1990). Based on these data,it would appear that copper levels in fish samples collected for this study (arithmetic meanof 5.27 ppm dry weight) are within acceptable limits. In addition, when compared to datafrom samples from other sites (Table 6), copper levels in samples from dredge spoil sitesare only slightly higher than a control sample collected for this study, and are considerablylower than values given for the same species on three National Wildlife Refuges in theregion (Table 6). Tadpoles and the invertebrates, however, contained much higherconcentrations of copper than the sheepshead minnows, indicating a potential threat tohigher order consumers, such as wading birds.
LeadLead was found above detection limits in all biota samples, ranging from a low of 0.6 ppmin sheepshead minnows to a high of 8 ppm in tadpoles. Lead, both a nonessential andnonbeneficial element, is toxic in most of its chemical forms and can bioaccumulate, causingsublethal effects to hematopoietic, vascular, nervous, renal and reproductive systems (Eisler1988b). Despite its toxicity, few threshold levels have been established for lead in the tissuesof aquatic organisms.
16
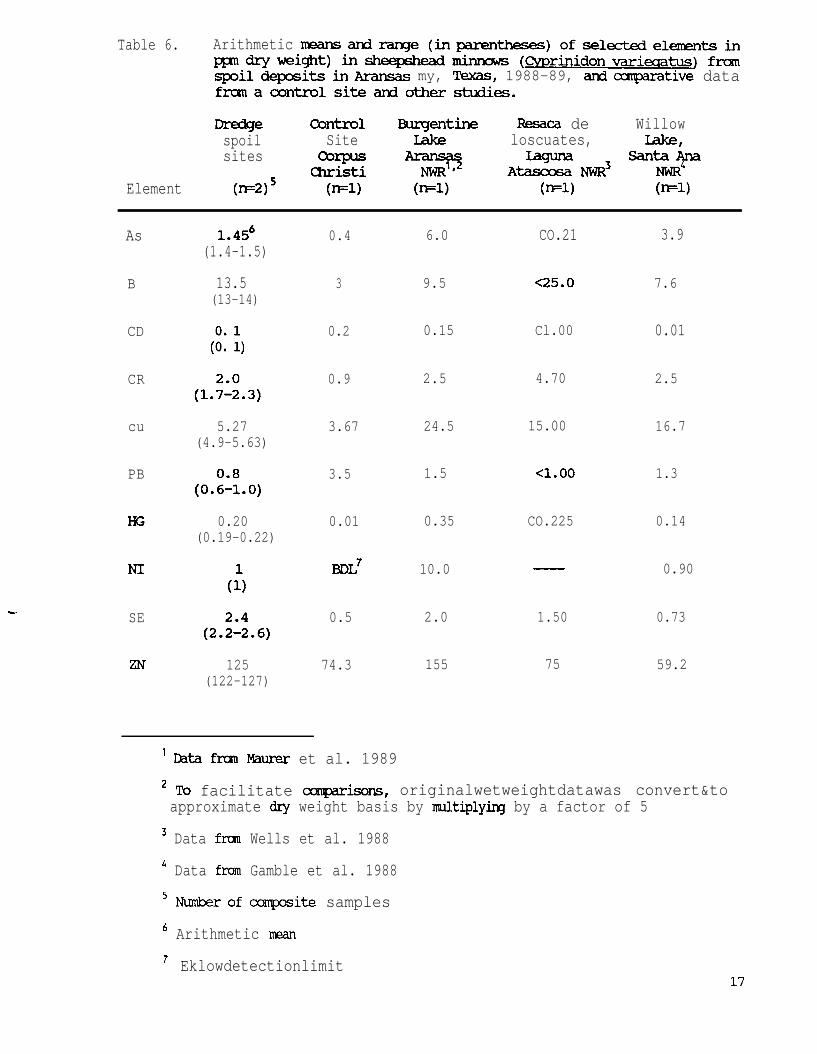
Table 6. Arithmetic mansandrarqe(inparentheses)ofseleztedelementsinppndrywei@t) insheepsheadminnom (Cvthnidonvarieqatus) fraPnSpoildepositsinAransas my, Texas, 1988-89, and amparative datafmnacontrolsiteandothershxIies.
Dredge Control Blmptine Resaca de Willowspoil Site loscuates, -,sites c=P= -73 SantaAna
Element (-2) 5Christi
(E)'NwR4
Wl) o-a m=l)
t SE
As
B
CD
CR
cu
PB
I-E
NI
ZN
1.4s6(1.4-1.5)
13.5(13-14)
(:: :,
(l.Z.3,
5.27(4.9-5.63)
(o.:z.o)
0.20(0.19-0.22)
(1')
(2.ii.6)
125(122-127)
0.4 6.0 CO.21 3.9
3 9.5 C25.0 7.6
0.2 0.15 Cl.00 0.01
0.9 2.5 4.70 2.5
3.67 24.5 15.00 16.7
3.5
0.01
BDL'
0.5
74.3
1.5
0.35
10.0
2.0
155
Cl.00
CO.225
1.50
75
1.3
0.14
0.90
0.73
59.2
' Data frm Mauler et al. 1989
2 To facilitate ccqarisons, originalwetweightdatawas convert&toapproximate dry weight basis by multiplyiq by a factor of 5
3 Data frm Wells et al. 1988
4 Data frum Gamble et al. 1988
5 Numberofcumposite samples
' Arithmetic mean
7 Eklowdetectionlimit17

The concentration of lead in sheepshead minnows (mean 0.8 ppm) was moderately abovethe NCBP mean of 0.55 ppm (adjusted to DW from Schmitt and Brumbaugh 1990). Theselead levels were higher than found in sea catfish in the Lower Laguna Madre and South Bay(Gamble et al. 1988), where the geometric mean was 0.09 ppm. Killifish collected by Custeret al. (1986) from areas of known heavy metal contamination in Narragansett Bay, RhodeIsland, contained lead levels of about 10.1 ppm dry weight, and killifish from “lesscontaminated” areas had levels of about 3.1 ppm. Lead levels in biota from these spoil areasshould be considered for future monitoring as part of the Service’s Biomonitoring ofEnvironmental Status and Trends (BEST) program.
MercuryThe concentration of mercury-in biota samples was highest in sheepshead minnows fromSouth Bludworth (0.22 ppm). Lowest values were found in fiddler crabs from SouthBludworth and tadpoles from North Bludworth, both at 0.04 ppm. Mercury concentrationsin biota are of special concern because mercury can bioconcentrate in organisms andbiomagnify through the food chain, impacting fish, wildlife, and humans (Eisler 1987b).Although mercury does occur naturally, it has no known biological function. Schmitt andBrumbaugh (1990) recently reported the NCBP mean for mercury in freshwater fish as 0.1ppm wet weight (about 0.50 ppm dry weight). Mercury concentrations below 0.5 ppm wetweight (about 2.5 ppm dry weight) in tissues are generally accepted as levels typical ofunpolluted environments (Abernathy and Cumbie 1977); all biota samples collected fromAransas Bay dredge spoils were below this level, indicating that mercury contamination isnot a major concern in the surface sediments and biota of these dredge spoil sites.
NickelNickel was detected in all biota samples, ranging from 1 ppm in fiddler crabs andsheepshead minnows from South Bludworth up to 10 ppm in tadpoles from NorthBludworth. Apparently because of its low toxicity to humans, there is a lack of residue dataon nickel for comparisons. In addition, nickel does not accumulate in aquatic organisms(Phillips and Russo 1978).
The Panel on Nickel (1975) considered nickel levels below 0.75 ppm wet weight (about 3.75ppm dry weight) to be normal for aquatic organisms. Except for tadpoles, all biota sampleswere below this level.
SeleniumAlthough selenium is an essential trace element, impacts to animals may result from bothselenium deficiency and selenium poisoning (Eisler 1985b). Potential effects of high levelsof selenium range from physical malformations during embryonic development to sterilityand death (Lemly and Smith 1987).
18
Residue levels of seleium in all biota samples collected during this study were below levelsconsidered to be harmful. Baumann and May (1984) considered that selenium levels of 10ppm dry weight (adjusted from wet weight) or more in fish tissue may cause toxic effects.All concentrations in sheepshead minnows collected during this study were below this level(maximum of 2.6 ppm), and only slightly above NCBP mean of 2.1 ppm (converted from wetweight, Schmitt and Brumbaugh 1990). Selenium qoncentrations in water boatmen (1.25ppm, Table 7) were far below those from water boatmen from a selenium-rich area inCalifornia (38 ppm).
ZincZinc is another essential micronutrient that in sufficient concentrations can result in lethalor sublethal effects. Marine fish and oysters have been noted to accumulate higher levelsthan freshwater organisms (Phillips and Russo 1978, Duke 1967).
The levels of zinc appear elevated in sheepshead minnows (mean=125 ppm) whencompared with zinc concentrations detected in fish from other studies. The NCBP mean(Schmitt and Brumbaugh 1990) for zinc in a variety of fish species is 108.5 ppm(approximated from wet weight). Gamble et al. (1989) found sea catfish in the Aransas Baycomplex had a geometric mean of 735 ppm (approximated from wet weight). Custer et al.(1986) detected 202 ppm dry weight zinc in killifish from a site considered highlycontaminated with heavy metals in Narragansett Bay, Rhode Island. Although the zinc levelsappear slightly elevated, the biological significance of these levels is not known. Theseconcentrations are well below the level of 1,000 ppm wet weight zinc used by Australia asa standard for sea foods (Talbot and Creagh, 1985). Zinc levels in biota from spoil areasshould be considered for future monitoring as a part of Aransas NWR’s portion of BEST.
Comparison between spoil sites
Biota comparisons between dredge spoil sites investigated in this study are hampered by thelimited biota available for collections. Water boatmen were collected from two of the studysites, Dunham and South Bludworth spoil islands (Table 7). Trace element levels in waterboatmen did not uniformly conform with geometric means of sediment trace elements fromtheir respective collection sites (Tables 4 and 7). However, this is not unexpected becausethe range measured for trace elements was broad and overlapping for these particular spoilislands.
19

Table 7. Mtsns and ranges of selected elements (pp dry weight) in waterboatmen fmnspoildeposits inAransascmprativedata frmothe.rstMies.
Bay, Texas, 1988-89, and
?imnsas Bay DredgespOil Sites
westfaTcmerssath Blem
Elementevaporationponds, CA'
b=l) m=l) 0-l)
c
As
B
CD
CR
a7
PB
HG
NI
SE
ZN
W2O
3.1
23
0.2
3.2
8.08
1.9
0.13
2.0
1.9
98
82.5
0.85
42
0.3
2.5
7.79
0.8
0.06
2.3
0.6
54.2
72.6
2
(00;63.0)3
200(150-570)
(2%)
(2f;620)
co.4(CO.4)
(242621)
(3Fl40)
(5:9120)
'rntafmn Schroeder et al. 1988
2Datarqxesentthe lavest gemetricmancmcent.rati0ninwaterboaixw.nfmmani.mIividualpond
3Fhnge of values measuredinllwaterboatmensamplesfmseveralpo&
20
PETROLEUM HYDROCARBONS
Sediment
.
All eleven of the selected aliphatic hydrocarbons (alkanes) were found above detection limitsin at least one sediment sample (Table 8). However, only pristane was detected in over50% of the samples. Nearly all alkanes were detected at relatively low levels, in the rangeof 0.01-0.1 ppm wet weight, with no samples exceeding 0.5 ppm.
Aliphatic hydrocarbons are a major component of petroleum products (Sandmeyer 1981,National Academy of Sciences 1985). Armstrong et al. (1979) listed several alkanes foundin crude oil at separator platforms in Trinity Bay, Texas, including several of the selectedalkanes investigated in this study. These selected alkanes are also components of kerosene,jet and turbo fuels, and lubricating oils (Sandmeyer 1981).
Several alkanes (the odd-numbered carbon n-alkanes) -are also produced by algae andphytoplankton (Blumer et al. 1971, Coates et al. 1986). In particular, n-pentadecane, n-heptadecane, n-nonadecane, and pristane have been noted as alkanes produced by marinealgae (Shaw et al. 1986). Pristane is also a component of calanoid copepods and may bedetected in fish that have fed on these copepods (Blumer et al. 1%3, Blumer 1967).
A determination of the contribution from petroleum and biogenic sources is possible onlyon a relative basis. A predominance of odd-numbered carbon n-alkanes would suggest abiogenic source (Sanders et al. 1980, National Academy of Sciences 1985). In petroleumhydrocarbons, there is no preponderance of odd or even-numbered carbon n-alkanes, andthe occurrence of phytane suggests a petroleum hydrocarbon source (National Academy ofScience, 1985). The alkane most frequently detected (pristane) is usually associated withbiogenic sources. Phytane was detected in nine sediment samples, however, always at lowerconcentrations than pristane, so it appears that the majority of alkanes detected in this studywere of biogenic origin.
Sediment samples from the dredge spoil study sites were analyzed for 24 polycyclic aromatichydrocarbons (PAHs); of these, 15 were detected in at least one of 25 samples. Only sixaromatics (l-methyl phenanthrene, perylene, fluoranthrene, pyrene, benzo (a) anthracene,and chrysene) were detected in over 50% of the samples. Although the last four weredetected in all samples, no levels above 0.03 ppm wet weight were detected for any PAHin any sample.
A variety of petroleum products are transported along the Gulf Intracoastal Waterway, fromwhich the spoil examined in this study originates. Because oil spillage is considered themajor source of PAHs in aquatic environments, these are the most likely sources of the
21

t
Table 8. Arithmetic m?ansand~es0fse1ectedalkanesinsediments(~wet weight) frcm spoil deposits by sample site in Aransas Bay,Texas, 1988-89.
south NorthBludworth Bludworth
(n=5) (n=5)Rattlesnake
(-5)
FalseLive Oak
@=5)
N-Cl2 BDL'(W-w
N-Cl3 BDL(Tridecane)
N-Cl5 E!DL(Fentadecane)
N-cl6 BDL(Hexadecane)
Prism -(0.01)
N-cl8 BlDL(-de==)
Phyhne BDL
N-Cl9 BDL(Nonadecane)
N-C20 BDL(Eicosane)
BDL
BDL
BDL
BDL
BDL
BDL
BDL
BDL
BDL
BDL
B.DL
BDL
B D L
BDL
BDL
BDL
(0.01)
0.18S3(0.11-0.45)
BDL
(0.01-0.03)
o.02g3(0.01-0.09)
0.042(0.02-0.1)
(0.13)
(0.02)
BDL
0.096(0.04-0.25)
BDL
(0.02-0.05)
(0.08-0.47)
--(0.05-0.26)
(0.01-0.11)
(0.02)
0.044(0.02-0.06)
- -(0.01)
0.02(0.01-0.03)
0.0263(0.01-0.08)
o.03s3(0.01-0.1)
' AllvaluesbelawdetectionlimitFewer than 50% of values above detection limit
3 Value of l/2 detection limit assigned to any value helm detection limit
22
PAHs detected in this study.
Biota
Biota, except for the sheepshead minnows, were analyzed for selected aromatic hydrocarbons(Table 1). Only one (acenaphthylene) of the 24 aromatic hydrocarbons was found evenapproaching 95% confidence interval detection limits. Levels of acenaphthylene (and allother PAHs) were below 0.01 ppm wet weight in all biota samples.
A large information base is developing for PAHs. This is primarily due to their toxicity, andseveral are among the most potent carcinogens known to exist (Eisler 1987a). Like thealiphatic hydrocarbons, PAHs may also be biogenically produced by microorganisms, algae,and macrophytes. A variety of other sources contribute to PAHs in the environment. Inaquatic environments, petroleum spillage is the major source of PAHs (Eisler 1987a).
Fish have been noted for containing unusually low levels of PAHs (Lawrence and Weber1984, Baumann et al. 1988). This has been attributed to their ability to rapidly metabolizePAHs (Neff et al. 1976, Lawrence and Weber 1984, Niimi and Palazzo 1986). Crustaceansalso have the enzymes necessary to metabolize PAHs (Statham et al. 1976). Bivalves,however, lack the necessary enzymes to metabolize PAHs, and therefore tend to accumulatethese compounds upon exposure. From the above, it is apparent that PAH contaminationdoes not currently pose a threat to fish and wildlife using the dredge spoil islands sampledin this study.
.
23

CONCLUSIONS
Based upon the results of this study, the sediments of the spoil islands evaluated appear tobe moderately contaminated with chromium, copper, and lead, most likely due to thedredging and deposition of sediments polluted from anthropogenic sources associated withshipping activity on the adjacent Gulf Intracoastal Waterway and the area’s oil and gasproduction activities. In addition, chromium, copper, and lead were detected in sufficientconcentration in amphibians and invertebrates from these spoil islands to pose a potentialthreat to fish and wildlife (particularly wading birds and shorebirds) that utilize thoseorganisms as a source of food. Despite being undetected in spoil sediments, cadmium wasdetected in mosquito larvae (5.25 ppm) and tadpoles (20 ppm) from these spoil islands, wellin excess of the 4.0 ppm criteria generally considered as the threshold for biological effectsin organisms. Such an occurrence is not unusual, given that the detection limit for cadmiumin sediments is 0.5 ppm, and organisms can bioconcentrate cadmium approximately 64 timesthat of their surrounding’s ambient levels. Implications of the above conclusions are thatmonitoring of potentially affected fish and wildlife resources, such as wading birds, shorebirdsand their prey items, should be periodically conducted to detect and possibly avoid adverseimpacts from the utilization of those dredge spoil islands as feeding habitat.
ACKNOWLEDGEMENTS
We thank the staff of the Aransas National Wildlife Refuge for facilitating field work for thisstudy. This report was reviewed by David Potter, Charlie Chandler, Brian Pridgeon, CharlieSanchez, and Lori Robertson, whom we thank for helpful and constructive comments.
c
24
LITERATURE CITED
Abernathy, A.R. and P.M. Cumbie. 1977. Mercury accumulation by largemouth bass(Micropterus salmoides) in recently impounded reservoirs. Bull. Environ. Contam.Toxicol. 17:595-602.
Armstrong, H.W., K. Fucik, J.W. Anderson, and J.M. Neff. 1979. Effects ofoilfield brine effluent on sediment and benthic organisms in Trinity Bay, Texas.Marine Environ. Res. 2:55-68.
Baumann, P.C. and T.W. May 1984. Selenium residues in fish from inlandwaters of the United States. Workshop proceedings: the effects of trace elementson aquatic ecosystems. Electric Power Research Institute. EPRI EA-3329, Project1631. 16 pp.
Baumann, P.C., J.L. Zajicek, and C.J. Schmitt. 1988. A better way to determine exposureof fish to polycyclic aromatic hydrocarbons. U.S. Fish Wildl. Serv. Information Bull.No. 88-14.
Blumer, M. 1967. Hydrocarbons in the digestive tract and liver of basking shark. Science.156:390-391.
Blumer, M., R.R.L. Guillard, and T. Chase. 1971. Hydrocarbons of marine phytoplankton.Marine Bio. 8:183-189.
Blumer, M. and M.M. Mullin. 1963. Pristane in zooplankton. Science. 140:974.
Breteler, R.J. 1984. Chemical Pollution of the Hudson-Raritan Estuary. NOAA Tech. Memo.NOWOMA 7.
Coates, M., D.W. Connel, J. Bodero, G.J. Miller, and R. Back. 1986. Aliphatic hydrocarbonsin Great Barrier Reef organisms and environment. Estuarine, Coastal and ShelfScience. 23:99-l 13.
Corps of Engineers. 1986. Biological assesment for Impacts to threatened and endangeredspecies. Habitat restoration, Aransas National Wildlife Refuge, Rattlesnake Island.US Army Engineer District, Galveston, Texas.
Custer, T.W., J.C. Franson, J.F. Moore, and J.E. Myers. 1986. Reproductive success andheavy metal contamination in Rhode Island common terns. Environ. Pol. 41:33-52.
25
Duke, T.W. 1967. Possible routes of zinc 65 from an experimental estuarine environment toman. J. Water Pollut. Control Fed. 39:536-542.
Eisler, R. 1971. Cadmium poisoning in Fundulus heteroclitus (Pisces: Cyprinodontidae) andother marine organisms. J. Fish Res. Board Canada. 28:1225-1234.
Eisler, R. 1985a. Cadmium hazards to fish, wildlife, and invertebrates: a synoptic review. U.S.Fish Wildl. Serv. Biol. Rep. 85 (1.2). 46 pp.
Eisler, R. 1985b. Selenium hazards to fish, wildlife, and invertebrates: a synoptic review.U.S. Fish Wildl. Serv. Biol. Rep. 85 (1.5) 57 pp.
Eisler, R. 1986. Chromium hazards to fish, wildlife, and invertebrates: a synoptic review.U.S. Fish Wildl. Serv. Biol. Rep. 85 (1.6). 60 pp.
Eisler, R. 1987a. Polycyclic aromatic hydrocarbon hazards to fish, wildlife, and invertebrates:a synoptic review. U.S. Fish Wildl. Serv. Biol. Rep. 85 (1.11). 81 pp.
Eisler, R. 1987b. Mercury hazards to fish, wildlife, and invertebrates: a synoptic review.U.S. Fish Wildl. Serv. Biol. Rep. 85 (1.10). 90 pp.
Eisler, R. 1988a. Arsenic hazards to fish, wildlife, and invertebrates: a synoptic review. U.S.Fish and Wildl. Serv. Biol. Rep. 85 (1.12). 92 pp.
Eisler, R. 1988b. Lead hazards to fish, wildlife, and invertebrates: a synoptic review. U.S.Fish Wildl. Serv. Biol. Rep. 85 (1.14). 134 pp.
Environmental Protection Agency. 1980. Ambient water quality criteria for copper.Washington, D.C. EPA 44015-80-036.
Environmental Protection Agency. 1982. Handbook for sampling and sample preservationof water and wastewater. EPA -600/4-82-029.
Gamble, L.R., G. Jackson, and T.M. Maurer. 1988. Organochlorine, trace element, andpetroleum hydrocarbon contaminants investigation of the Lower Rio Grande Valley,Texas, 1985-86. U.S. Fish Wildl. Serv., Ecological Services, Corpus Christi, TX.Unpublished document.
Gamble, L.R., G. Jackson and T.M. Maurer. 1989. Contaminants investigation of theAransas Bay complex, Texas, 1985-1986. U.S. Fish and Wildl. Serv., EcologicalServices, Corpus Christi, TX. Unpublished document.
26
Harrison, G. 1987. A survey of the lead distribution in the soil of Corpus Christi, Texas.Texas J. of Sci. 39:16-22.
Kaise, T., S. Watanabe, and K. Itoh. 1985. The acute toxicity of arsenobetaine.Chemosphere. 14:1327-1332.
Lawrence, J.F. and D.F. Weber. 1984. Determination of polycyclic aromatic hydrocarbonsin some Canadian commercial fish, shellfish, and meat products by liquidchromatography with confirmation by capillary gas chromatography-massspectrometry. J. Agric. Food Chain. 32:789-794.
Lemly, A.D. and G.J. Smith. 1987. Aquatic cycling of selenium: implications for fish andwildlife. U.S. Fish Wildl. Serv. Fish. Wildl. Leaflet 12. 10 pp.
Maher, W.A. 1985. The presence of arsenobetaine in marine mammals. Comp. Biochem.Physiol. 80C: 199-201.
Maurer, T.C., L.R. Gamble and G. Jackson. 1989. Contaminants investigation ofBurgentine Lake, Aransas National Wildlife Refuge, Texas. U.S. Fish Wildl. Serv.,Ecological Services, Corpus Christi, TX. Unpublished document.
Nagymajtenyi, L., A. Selypes, and G. Berencsi. 1985. Chromosomal aberrations and fetotoxiceffects of atmospheric arsenic exposure in mice. J. Appl. Toxicol. 5:61-63.
National Academy of Sciences. 1985. Oil in the sea: inputs, fates and effects. NationalAcademy Press, Washington, D.C. 601 pp.
National Academy of Sciences, National Academy of Engineers. 1972. Section Ill-freshwateraquatic life and wildlife, water quality criteria. Ecological Research Series. EPA-R3-033.
Natural Resource Agency Maintenance Dredging Working Group. 1988. Issue Paper:Evaluation of the U.S. Army Corps of Engineers’ 1975 Environmental Statement onmaintenance dredging of the Gulf Intracoastal Waterway, Texas Section. Unpublisheddocument. 35pp.
Neff, J.M., B.A. Cox, D. Dixit, and J.W. Anderson. 1976. Accumulation and release ofpetroleum-derived aromatic hydrocarbons by four species of marine animals. Mar.Bio. 38:279-289.
27
Niimi, A.J. and V. Palazzo. 1986. Biological half-lives of eight polycyclic aromatichydrocarbons (PAHs) in rainbow trout (Salmo gairdneri). Wat. Res. 20:503-507.
Palermo, M. R. 1988. Field evaluations of the quality of effluent from confined dredgedmaterial disposal areas. Tech. Report D-88-l. U.S. Army Corps of EngineersWaterway Experiment Station, Vicksburg, Ms. 62pp.
Panel on Nickel. 1975. Nickel. Committee on Medical and Biological Effects ofEnvironmental Pollutants, National Research Council, National Academy of Sciences.Wash., D.C. 277 pp.
Phillips, G.R. and R.C. Russo. 1978. Metal bioaccumlation in fisheries and aquaticinvertebrates: a literature review. Environmental Research Laboratory. Duluth, MN.EPA-600/3-78- 103.
Sanders, H.L., J.F. Grassle, G.R. Hampson, L.S. Morse, S. Garner-Price, and C.C. Jones.1980. Anatomy of an oil spill: long term effects from the grounding of the bargeFlorida off West Falmouth, Massachusetts. J. Marine Res. 38:265-380.
Sandmeyer, E.E. 1981. Aliphatic hydrocarbons. pp. 3175-3220. h Patty’s IndustrialHygiene and Toxicology, Vol. 2B, Toxicology. G.D. Clayton and F.E. Clayton (eds.).John Wiley and Sons, New York.
Schmitt, C.J. and W.G. Brumbaugh. 1990. National Contaminant Biomonitoring Program:concentrations of arsenic, cadmium, copper, lead, mercury, selenium and zinc in U.S.freshwater fish, 1976-1984. Arch. Environ. Contam. Toxicol. 19:731-747.
Schroeder, R.A., D.U. Palawski and J. P. Skorupa. 1988. Reconnaissance investigation ofwater quality, bottom sediment, and biota associated with irrigation drainage in theTulare Lake Bed Area, Southern San Joaquin Valley, California, 1986-87. U.S.Geological Survey, Water- resources Investigations Report 88-4001.
Shacklett, H.T. and J.G. Boernaen. 1984. Element concentrationsin soils and other surficialmaterials of the conterminous United States: U.S. Geological Survey ProffesionalPaper 1270, 105 p.
Shaw, D.G., T.E. Hogan, and D.J. McIntosh. 1986. Hydrocarbons in bivalve mollusks of PortValdez, Alaska: consequences of five years’ permitted discharge. Estuarine, Coastaland Shelf Science. 23:863-872.
28

Statham, C.N., M.J. Melancon, Jr., and J.J. Lech. 1976. Bioconcentration ofxenobiotics in trout bile: a proposed monitoring aid for some waterborne chemicals.Science 193:680-681.
Talbot, V. and S. Creagh. 1985. The derivation of threshold mean concentrationsof copper and zinc in seawater, to protect edible tropical rock oyster, Saccostreacuccullata, from exceeding the health (food) standards. Australian Dept. of Conserv.and Environ. Bulletin 212.
White, D.H. and E. Cromartie. 1985. Bird use and heavy metal accumulation inwaterbirds at dredge disposal impoundments, Corpus Christi, Texas. Bull. Environ.Con. Tox. 34:295-300.
29