Embed Size (px)
Citation preview

U.S. EXPERIENCE WITH SPRINKLERS
JOHN R. HALL, JR.
June 2013
National Fire Protection Association Fire Analysis and Research Division

U.S. EXPERIENCE WITH SPRINKLERS
JOHN R. HALL, JR.
June 2013
National Fire Protection Association Fire Analysis and Research Division
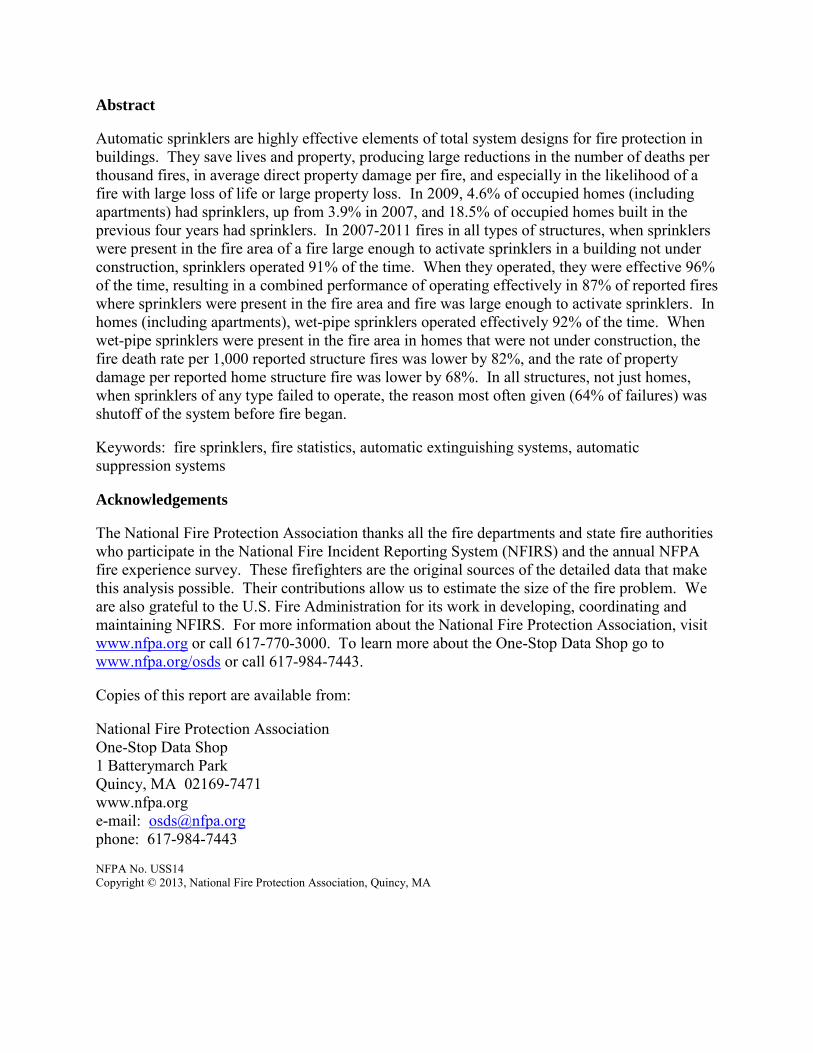
Abstract
Automatic sprinklers are highly effective elements of total system designs for fire protection in buildings. They save lives and property, producing large reductions in the number of deaths per thousand fires, in average direct property damage per fire, and especially in the likelihood of a fire with large loss of life or large property loss. In 2009, 4.6% of occupied homes (including apartments) had sprinklers, up from 3.9% in 2007, and 18.5% of occupied homes built in the previous four years had sprinklers. In 2007-2011 fires in all types of structures, when sprinklers were present in the fire area of a fire large enough to activate sprinklers in a building not under construction, sprinklers operated 91% of the time. When they operated, they were effective 96% of the time, resulting in a combined performance of operating effectively in 87% of reported fires where sprinklers were present in the fire area and fire was large enough to activate sprinklers. In homes (including apartments), wet-pipe sprinklers operated effectively 92% of the time. When wet-pipe sprinklers were present in the fire area in homes that were not under construction, the fire death rate per 1,000 reported structure fires was lower by 82%, and the rate of property damage per reported home structure fire was lower by 68%. In all structures, not just homes, when sprinklers of any type failed to operate, the reason most often given (64% of failures) was shutoff of the system before fire began. Keywords: fire sprinklers, fire statistics, automatic extinguishing systems, automatic suppression systems Acknowledgements The National Fire Protection Association thanks all the fire departments and state fire authorities who participate in the National Fire Incident Reporting System (NFIRS) and the annual NFPA fire experience survey. These firefighters are the original sources of the detailed data that make this analysis possible. Their contributions allow us to estimate the size of the fire problem. We are also grateful to the U.S. Fire Administration for its work in developing, coordinating and maintaining NFIRS. For more information about the National Fire Protection Association, visit www.nfpa.org or call 617-770-3000. To learn more about the One-Stop Data Shop go to www.nfpa.org/osds or call 617-984-7443. Copies of this report are available from: National Fire Protection Association One-Stop Data Shop 1 Batterymarch Park Quincy, MA 02169-7471 www.nfpa.org e-mail: [email protected] phone: 617-984-7443 NFPA No. USS14 Copyright © 2013, National Fire Protection Association, Quincy, MA

U.S. Experience With Sprinklers, 6/13 i NFPA Fire Analysis and Research, Quincy, MA
Executive Summary
Automatic sprinklers are highly effective and reliable elements of total system designs for fire protection in buildings. According to the 2009 American Housing Survey, in 2009, 4.6% of occupied homes (including multi-unit) had sprinklers, up from 3.9% in 2007, and 18.5% of occupied home built in the previous four years had sprinklers. Of reported 2007-2011 structure fires, an estimated 10% showed sprinklers present.* Sprinklers were reported as present in 57% of reported fires in health care properties. High-rise apartment buildings (47%), manufacturing facilities (48%), passenger terminals (51%), hotels and motels (52%), prisons and jails (53%), dormitories and barracks (53%), and high-rise office buildings (63%), all had sprinklers reported in roughly half or more of reported structure fires. In every other property uses, more than half of all reported fires were reported as sprinklers not present. Sprinklers are still rare in educational properties (36% of fires), stores and offices (24%), public assembly properties (23%), and especially homes (6%), where most fire deaths occur. There is considerable potential for expanded use of sprinklers to reduce the loss of life and property to fire. As defined in NFPA 13, section 3.4, a wet pipe sprinkler system has sprinklers attached to a piping system containing water so that water discharges immediately from sprinklers opened by heat from a fire, while a dry pipe sprinkler system has sprinklers attached to a piping system containing air or nitrogen under pressure so that sprinkler activation releases the air or nitrogen, allowing water pressure to open a valve and water to flow into the piping system and out the opened sprinklers. With wet-pipe sprinklers the fire death rate per 1,000 reported home structure fires was lower by 82% and the rate of property damage per reported home structure fire was lower by 68%. For more on NFPA’s Home Fire Sprinkler Initiative, go to http://www.firesprinklerinitiative.org. Sprinkler systems are carefully designed to activate early in a real fire (responding to heat not smoke) but not to activate in a non-fire situation. Each sprinkler reacts only to the fire conditions in its area. Water release in a fire is generally much less than would occur if the fire department had to suppress the fire, because later action means more fire, which means more water is needed. Water release with no fire is rare compared to water release in response to a fire. Sprinklers operated in 91% of all reported structure fires large enough to activate sprinklers, excluding buildings under construction and buildings without sprinklers in the fire area. When sprinklers operated, they were effective 96% of the time, resulting in a combined performance of operating effectively in 87% of all reported fires where sprinklers were present in the fire area and fire was large enough to activate them. The more widely used wet pipe sprinklers operated effectively 89% of the time, while dry pipe sprinklers operated effectively in 76% of cases. * These estimates are projections based on the detailed information collected in Version 5.0 of the U.S. Fire Administration's National Fire Incident Reporting System (NFIRS 5.0) and the NFPA's annual fire department experience survey. In this report, fires are excluded if they involve buildings under construction or failure or ineffectiveness because of a lack of sprinklers in the fire area. Because fires reported as confined fires are usually reported without sprinkler performance details or as fires too small to activate operating equipment, confined fires are not included in any analysis involving reliability or effectiveness of automatic extinguishing equipment. See Appendixes A and B for additional details of statistical methodology, including the distinction between confined and non-confined fires.

U.S. Experience With Sprinklers, 6/13 ii NFPA Fire Analysis and Research, Quincy, MA
When sprinklers fail to operate, the reason most often given (64% of failures) was shutoff of the system before fire began, as may occur in the course of routine inspection or maintenance. Other leading reasons included manual intervention that defeated the system (17%), lack of maintenance (6%), and inappropriate system for the type of fire (5%). Only 7% of sprinkler failures were attributed to component damage. When sprinklers operate but are ineffective, the reason usually had to do with an insufficiency of water applied to the fire, either because water did not reach the fire (44% of cases of ineffective performance) or because not enough water was released (30% of cases of ineffective performances). Other leading reasons were system component damage (8%), manual intervention that defeated the system (7%), lack of maintenance (7%), and inappropriate system for the type of fire (5%).
U.S. Experience With Sprinklers, 6/13 iii NFPA Fire Analysis and Research, Quincy, MA
Table of Contents
Executive Summary i
Table of Contents iii
List of Tables iv
Fact Sheet v NFPA Resource Page vii
Section 1. Presence of Sprinklers 1
General Statistics on Usage 2
Section 2. Type of Sprinkler 5
Section 3. Reliability and Effectiveness 7
Section 4. Impact of Sprinklers 31
Sprinkler Reduction in Loss of Life in Fire 31
Sprinkler Reduction in Loss of Property in Fire 32
Environmental Benefits of Home Sprinklers 34
Section 5. Water Damage From Sprinklers in the Absence of Fire 39
Section 6. Other Issues Related to Home Fire Sprinklers 43
Myths About Sprinklers 43
Costs and Benefits of Sprinklers 44
Section 7. Concluding Points 47
Section 8. Summary by Property Use 49
Appendix A: How National Estimates Statistics Are Calculated 59
Appendix B: Sprinkler-Related Data Elements in NFIRS 5.0 67
Appendix C: Selected Incidents 69

U.S. Experience With Sprinklers, 6/13 iv NFPA Fire Analysis and Research, Quincy, MA
List of Tables and Figures
Table 1-A. Sprinkler Usage by Category of Housing, 2007 and 2009 3 Table 1-1. Presence of Sprinklers in Structure Fires 4
Table 2-1. Type of Sprinkler Reported in Structure Fires Where Equipment Was Present 6 in Fire Area
Table 3-A. Fire With Areas of Origin That Could Be Room Larger Than Sprinkler Design 11 Area For Space Table 3-B. Sprinkler Success in Confining Fire to Room of Origin vs. Sprinkler Performance 12
Table 3-C. Reasons for Failure or Ineffectiveness as Number of 2005-2009 Structure Fires per 14 Year and Percentages of All Cases of Failure or Ineffectiveness
Table 3-D. Leading Areas of Origin for Fires in One- or Two-Family Homes 18
Table 3-1. Automatic Extinguishing Equipment Reliability and Effectiveness When Fire 19 Was Coded as Not Confined and Large Enough to Activate Equipment and Equipment Was Present in Area of Fire Table 3-2. Reasons for Failure to Operate When Fire Was Coded as Not Confined and 22 Large Enough to Activate Equipment and Equipment was Present in Area of Fire Table 3-3. Reasons for Ineffectiveness When Fire Was Coded as Not Confined and 24 Large Enough to Activate Equipment and Equipment Was Present in Area of Fire Table 3-4. Extent of Flame Damage for Sprinklers vs. Automatic Extinguishing 26 Equipment Absent Table 3-5. Number of Sprinklers Operating, by Type of Sprinkler 27 Table 3-6. Number Wet Pipe Sprinklers Operating, by Property Use Group 28 Table 3-7. Sprinkler Effectiveness Related to Number of Sprinklers Operating 29 Table 4-1. Estimated Reduction in Civilian Deaths per Thousand Fires Associated With 35 Wet Pipe Sprinklers Table 4-2. Characteristics of Fatal Victims When Wet Pipe Sprinklers Operate vs. No 36 Automatic Extinguishing Equipment Table 4-3. Estimated Reduction in Average Direct Property Damage per Fire Associated 37 With Wet Pipe Sprinklers Table 5-A. Non-Fire Sprinkler Activations by Major Property Use Group 40 Table 5-B. Non-Fire Sprinkler Activations by Likelihood of Water Release and Major 40 Property Use Group

NFPA Fire Analysis & Research
Statistics are based on 2007-2011 U.S. reported fires excluding buildings under construction and properties with no sprinklers in fire area. Almost no reported confined fires are large enough to activate operating sprinklers, and so confined fires are excluded from analysis of reliability and effectiveness.
U.S. Experience With Sprinklers, 6/13 v NFPA Fire Analysis and Research, Quincy, MA
U.S. Experience with Sprinklers Fact Sheet
Sprinklers save lives and protect property from fires.
Compared to properties without automatic extinguishing equipment and specifying wet-pipe sprinklers
The death rate per fire in sprinklered homes is lower by 82%.
Direct property damage per fire in sprinklered homes is lower by 68%.
Damage per Fire With Wet Pipe Sprinklers versus
Without Automatic Extinguishing Equipment, 2007-2011
*Health care includes hospitals, nursing homes, clinics, and doctor’s offices.
Sprinklers are reliable and effective.
In reported structure fires large enough to activate them, sprinklers operated in 91% of fires in sprinklered properties.
Wet-pipe sprinklers operated in 92% of these fires vs. 81% for dry-pipe sprinklers.
In reported structure fires large enough to activate them, sprinklers operated and were effective in 87% of fires in sprinklered properties.
Wet-pipe sprinklers operated and were effective in 89% of fires vs. 76% for dry-pipe sprinklers.
NFPA’s Fire Sprinkler Initiative: Bringing Safety Home seeks to encourage the use of home fire sprinklers and the adoption of fire sprinkler requirements for new construction. See www.firesprinklerinitiative.org.
$38,000
$7,000
$5,000
$8,000
$13,000
$55,000
$20,000
$14,000
$21,000
$53,000
$0 $20,000 $40,000 $60,000
Store or office
Home including apartment
Health care*
Educational
Eating or drinking
Without automatic extinguishing equipment
With wet pipe sprinklers

Statistics are based on 2007-2011 U.S. reported fires excluding buildings under construction and properties with no sprinklers in fire area. Almost no reported confined fires are large enough to activate operating sprinklers, and so confined fires are excluded from analysis of reliability and effectiveness.
U.S. Experience With Sprinklers, 6/13 vi NFPA Fire Analysis and Research, Quincy, MA
In 2007-2011 fires large enough to activate them, sprinklers operated in 91% of fires in sprinklered properties. The graph below is based on the other 9% in which sprinklers should have operated but did not.
In 2007-2011 fires where sprinklers operated, they were effective in 96% of the cases. The graph below is based on the other 4% in which the sprinkler was ineffective.
Usually only 1 or 2 sprinklers are required to control the fire.
When wet-pipe sprinklers operated, 88% of reported fires involved only 1 or 2 sprinklers. For dry-pipe sprinklers, 73% involved only 1 or 2 sprinklers.
5%
6%
7%
17%
64%
0% 10% 20% 30% 40% 50% 60% 70%
Inappropriate system for fire
Lack of maintenance
Damaged component
Manual intervention defeated system
System shut off before fire
Reasons When Sprinklers Fail to Operate, 2007-2011
5%
7%
7%
8%
30%
44%
0% 10% 20% 30% 40% 50%
Inappropriate system for fire
Lack of maintenance
Manual intervention defeated system
Damaged component
Not enough water released
Water did not reach fire
Reasons When Sprinklers Are Ineffective, 2007-2011

NFPA’s Fire Safety Resources
U.S. Experience with Sprinklers, 6/13 vii NFPA Fire Analysis and Research, Quincy, MA
Advocacy
Public Education
Codes & Standards
Research
Properly installed and maintained smoke alarms are necessary to provide a warning of any fire to all occupants. You can find out more information about smoke alarms here: NFPA Smoke Alarm Information Home fire sprinkler systems provide even greater protection. These systems respond quickly to reduce the heat, flames, and smoke from a fire until help arrives. More information about home fire sprinklers may be found at www.firesprinklerinitiative.org Simply put, smoke alarms and fire sprinklers save lives.
For consumers: NFPA has consumer safety information regarding causes, escape planning, fire & safety equipment, and many other topics. Sparky.org has important For Kids for kids delivered via fun games, activities, and cartoons. For public educators: Resources on fire safety education programs, educational messaging, grants & awards, and many other topics.
NFPA also develops and publishes, more than 300 consensus codes and standards intended to minimize the effects of fire, including: NFPA 101: Life Safety Code®: NFPA 13, Standard for the Installation of Sprinkler Systems. NFPA 13D, Standard for the Installation of Sprinkler Systems in One- and Two-Family Dwellings and Manufactured Homes. NFPA13R Standard For The Installation of Sprinkler Systems in Low-Rise Residential Occupancies
NFPA´s wealth of fire-related research includes investigations of technically significant fire incidents, fire data analysis, and the Charles S. Morgan Technical Library, one of the most comprehensive fire literature collections in the world. In addition, NFPA´s Fire Protection Research Foundation is a source of independent fire test data. Find out more at: www.nfpa.org/research

U.S. Experience With Sprinklers, 6/13 1 NFPA Fire Analysis and Research, Quincy, MA
Section 1. Presence of Sprinklers
Fire sprinklers are highly reliable and effective elements of total system designs for fire protection in buildings. They save lives and property, producing large reductions in the number of deaths per thousand fires, in average direct property damage per fire, and especially in the likelihood of a fire with large loss of life or large property loss. In 2007-2011, sprinklers were reported present in only 10% of reported structure fires. The left side of Table 1-1 indicates, by property use for 1980-1984 and 1994-1998, the number of structure fires per year where any type of automatic extinguishing equipment was present and the associated percentage of total structure fires. (The established generic name of “automatic extinguishing equipment” is misleading, because most such equipment is designed to control fires and not to fully extinguish them.) Prior to 1999, incident report coding did not distinguish different types of automatic extinguishing equipment and in particular did not distinguish sprinklers. The right side of Table 1-1 indicates, by property use for 2007-2011, the number of structure fires per year and the percentage of total structure fires where any type of automatic extinguishing equipment was present and where any type of sprinklers were present.1 The left side of Table 1-1 can be used to track trends in the usage of automatic extinguishing equipment by property use. Usage is up dramatically in most property use groups – department stores are a notable exception. For most property uses, nearly all automatic extinguishing equipment cited in fires is sprinklers. Exceptions are places with extensive use of wet or dry chemical systems to protect commercial cooking equipment – eating and drinking establishments (and the larger public assembly group they dominate) and grocery or convenience stores. The right side of Table 1-1 can be used to examine differences in presence of sprinklers in fires in different property uses. However, only one type of equipment can be coded in any one fire incident, and it should be the type closest to the fire. It is possible that some or most of the fires reported with dry (or possibly wet) chemical equipment protecting a commercial cooking surface were in properties that also had sprinkler systems. Of reported 2007-2011 structure fires in health care properties, an estimated 57% showed sprinklers present, with higher percentages for hospitals (63%) and nursing homes (69%) and a much lower percentage (not shown on Table 1-1) for the other health care properties, notably clinics and doctor’s offices (35%). Sprinklers were also reported as present in roughly half of reported fires in prisons and jails (53%), hotels and motels (52%), manufacturing facilities (48%), and high-rise apartment buildings (47%). In every other property use, more than half of all reported fires were reported as sprinklers not present.
1 Some fires after 1999 are coded as confined fires, which are fires confined to cooking vessel, chimney or flue, furnace or boiler, incinerator, commercial compactor, or trash receptacle. Confined fires permit limited reporting with most data fields not required and usually left blank. Confined fires combine with very low sprinkler usage to make estimates for one- and two-family homes too volatile and uncertain to list separately, and so estimates are provided only for all homes (including apartments) combined.

U.S. Experience With Sprinklers, 6/13 2 NFPA Fire Analysis and Research, Quincy, MA
Some of the highest usage percentages were for high-rise hotels (64%) and high-rise offices (63%). In general, high-rise properties show much more usage of fire protection systems and features than other properties of the some property use.2 The following properties where large numbers of people routinely are present show 37% or less of reported fires in properties with sprinklers present in 2007-2011:
Every type of public assembly property except passenger terminals Educational properties Homes (including apartments) Rooming or boarding homes Every type of store except department stores Offices except high-rise offices
Most fires in storage properties are not in warehouses but are in garages, barns, silos, and small outbuildings. It is these types of buildings that drive the very low percentage (4%) of reported fires with sprinklers in all storage properties combined. In 2007-2011, sprinklers were reported in only 6% of fires in homes (including apartments). Although the percentage of homes with some kind of automatic extinguishing equipment is up from 1% in 1980-1984 and 2% in 1994-1998 to 7% in 2007-2011, there is clearly great potential for expanded installation. General Statistics on Usage
The 2007 and 2009 American Housing Surveys included a question about sprinkler presence inside homes.3 The two surveys showed that 3.9% of occupied year-round housing units had sprinklers in 2007, rising to 4.6% in 2009. Table 1-A shows 2007 and 2009 sprinkler usage percentages for a number of different categories of housing units. Most of the usage percentages in Table 1-A rose by one-sixth to one-fourth between 2007 and 2009. The notable exceptions were occupied housing units in the Northeast, where the usage percentage rose by more than a third, and the occupied new construction category, where the usage percentage rose by more than half. In 2009, nearly one of every five occupied housing units built in the previous four years had sprinklers. In the inventory of single-family detached homes, nearly 1.4 million homes had sprinklers in 2009 and nearly 300,000 of those dwellings with sprinklers had been added to the inventory since 2007.
2 John R. Hall, Jr., High-Rise Building Fires, NFPA Fire Analysis and Research Division, November 2011. 3 American Housing Survey 2007 and 2009, U.S. Department of Commerce and U.S. Department of Housing and Urban Development, September 2008 and September 2010, Tables, 2-4, 2-25 (for 2007 survey) and special analysis provided by the survey report authors of statistics from the discontinued Table 2-25 (for 2009 survey).

U.S. Experience With Sprinklers, 6/13 3 NFPA Fire Analysis and Research, Quincy, MA
The Home Fire Sprinkler Coalition, formed in 1996, developed a variety of educational materials about the benefits of home fire sprinklers. These materials address common questions and misconceptions. They may be accessed through their web site www.homefiresprinkler.org.
Table 1-A. Sprinkler Usage by Category of Housing, 2007 and 2009
Category of Housing 2007 2009
Occupied year-round housing 3.9% 4.6% Occupied single-family detached homes 1.5% 1.9% Occupied single-family homes, either detached or attached 1.9% 2.2% Occupied housing units in all multi-unit buildings 10.6% 12.9% Occupied housing units in buildings with 2-4 units 2.9% 3.4% Occupied housing units in buildings with 5-9 units 5.8% 7.7% Occupied housing units in buildings with 10-19 units 12.1% 14.8% Occupied units in buildings with 20-49 units 16.3% 18.4% Occupied housing units in buildings with 50 or more units 27.3% 32.4% Occupied manufactured homes 0.9% 1.0% Owner-occupied housing units 2.3% 2.7% Renter-occupied housing units 7.2% 8.7% Occupied housing units built within last 4 years 11.8% 18.5% Occupied housing units in Northeast 3.3% 4.6% Occupied housing units in Midwest 2.7% 3.5% Occupied housing units in South 3.7% 4.4% Occupied housing units in West 5.7% 6.2% Housing units occupied by households below poverty level 4.6% 5.6% Housing units occupied by households with older adult head 5.2% 5.7% Source: American Housing Survey 2007 and 2009, U.S. Department of Commerce and U.S. Department of Housing and Urban Development, September 2008 and September 2010, Tables, 2-4, 2-25 (for 2007 survey) and special analysis provided by the survey report authors of statistics from the discontinued Table 2-25 (for 2009 survey). All safety equipment questions were deleted for the 2011 edition. Because sprinkler systems are so demonstrably effective, they can make a major contribution to fire protection in any property. NFPA 101®, Life Safety Code, NFPA 1®, Fire Code, and NFPA 5000®, Building Construction and Safety Code, have required sprinklers in all new one- and two-family homes, all nursing homes, and many nightclubs since the 2006 editions. The 2009 edition of the International Residential Code also added requirements for sprinklers in one- and two-family homes, effective January 2011. This protection can be expected to increase in areas that adopt and follow these codes. NFPA is supporting adoption of these requirements through its Fire Sprinkler Initiative (see http:/www.firesprinklerinitiative.org).

U.S. Experience With Sprinklers, 6/13 4 NFPA Fire Analysis and Research, Quincy, MA
Table 1-1. Presence of Sprinklers in Structure Fires
Number of Structure Fires With Equipment Present and
Percentage of Total Structure Fires in Property Use
Any Automatic Extinguishing Equipment Any Sprinkler
Property Use 1980-1984 1994-1998 2007-2011 2007-2011
All public assembly 4,280 (13%) 4,380 (26%) 7,720 (53%) 3,410 (23%) Variable-use amusement place 120 (8%) 140 (16%) 230 (19%) 190 (16%) Religious property 50 (2%) 90 (5%) 280 (16%) 200 (12%) Library or museum 80 (14%) 110 (28%) 240 (41%) 210 (37%) Eating or drinking establishment 3,310 (16%) 3,240 (29%) 4,710 (63%) 1,680 (23%) Passenger terminal 70 (20%) 60 (35%) 400 (52%) 390 (51%) Educational property 1,620 (13%) 1,820 (24%) 2,370 (42%) 2,020 (36%) Health care property* 6,920 (47%) 4,400 (68%) 3,810 (66%) 3,360 (57%) Nursing home 2,250 (61%) 2,060 (76%) 2,050 (75%) 1,880 (69%) Hospital 3,370 (47%) 1,650 (74%) 1,020 (78%) 830 (63%)
Hospital, clinic or doctor’s
office high rise
190 (84%) 150 (65%)
Hospital, clinic or doctor’s
office not high rise
1,060 (61%) 890 (51%)
Prison or jail 370 (10%) 430 (19%) 280 (57%) 260 (53%) All residential 7,090 (1%) 11,110 (3%) 32,550 (8%) 29,430 (8%) Home (including apartment) 5,120 (1%) 8,440 (2%) 25,620 (7%) 23,650 (6%) Apartment high rise
4,220 (51%) 3,880 (47%)
Apartment not high rise
17,520 (18%) 16,210 (17%)
Hotel or motel 1,590 (15%) 1,690 (35%) 2,090 (58%) 1,870 (52%) High rise
350 (74%) 300 (64%)
Not high rise
1,740 (56%) 1,570 (50%)
Dormitory or barracks 430 (16%) 620 (29%) 2,180 (57%) 2,020 (53%) Rooming or boarding home 70 (4%) 230 (17%) 1,130 (40%) 1,050 (37%) Board and care home Not available Not available 940 (51%) 860 (46%) Store or office 5,510 (13%) 5,230 (21%) 5,800 (33%) 4,230 (24%) Grocery or convenience store 1,160 (15%) 1,190 (27%) 1,880 (48%) 880 (23%) Laundry or dry cleaning or other professional service 330 (8%) 310 (13%) 310 (21%) 300 (19%) Department store 1,340 (44%) 1,100 (52%) 530 (47%) 470 (42%) Office 1,240 (12%) 1,470 (25%) 1,190 (36%) 1,100 (33%) High rise
210 (67%) 200 (63%)
Not high rise
970 (33%) 890 (30%)
Manufacturing facility 11,910 (44%) 6,400 (50%) 2,950 (56%) 2,530 (48%) All storage 1,430 (2%) 1,090 (3%) 830 (4%) 770 (4%) Warehouse excluding cold storage* 1,060 (13%) 740 (22%) 430 (34%) 400 (32%) All structures 38,620 (4%) 37,100 (7%) 59,380 (12%) 48,460 (10%)
* “Health care property” includes other facilities not listed separately. In 1980-84 and 1994-98, this category excludes doctor’s office and care of aged facilities without nursing staff (which are assumed to be residential board and care facilities). In 1980-1984 and 1994-1998, “warehouse” includes general warehouse, textile storage, processed food storage except cold storage and storage of wood, paper, plastics chemicals, and metals. Notes: These are structure fires reported to U.S. municipal fire departments and so exclude fire reported only to Federal or state agencies or industrial fire brigades. Post-1998 estimates are based only on fires reported in Version 5.0 of NFIRS and include fires reported as confined fires. After 1998, buildings under construction are excluded. Sprinkler statistics exclude partial systems and installations with no sprinklers in fire area. Source: NFIRS and NFPA survey.
U.S. Experience With Sprinklers, 6/13 5 NFPA Fire Analysis and Research, Quincy, MA
Section 2. Type of Sprinkler
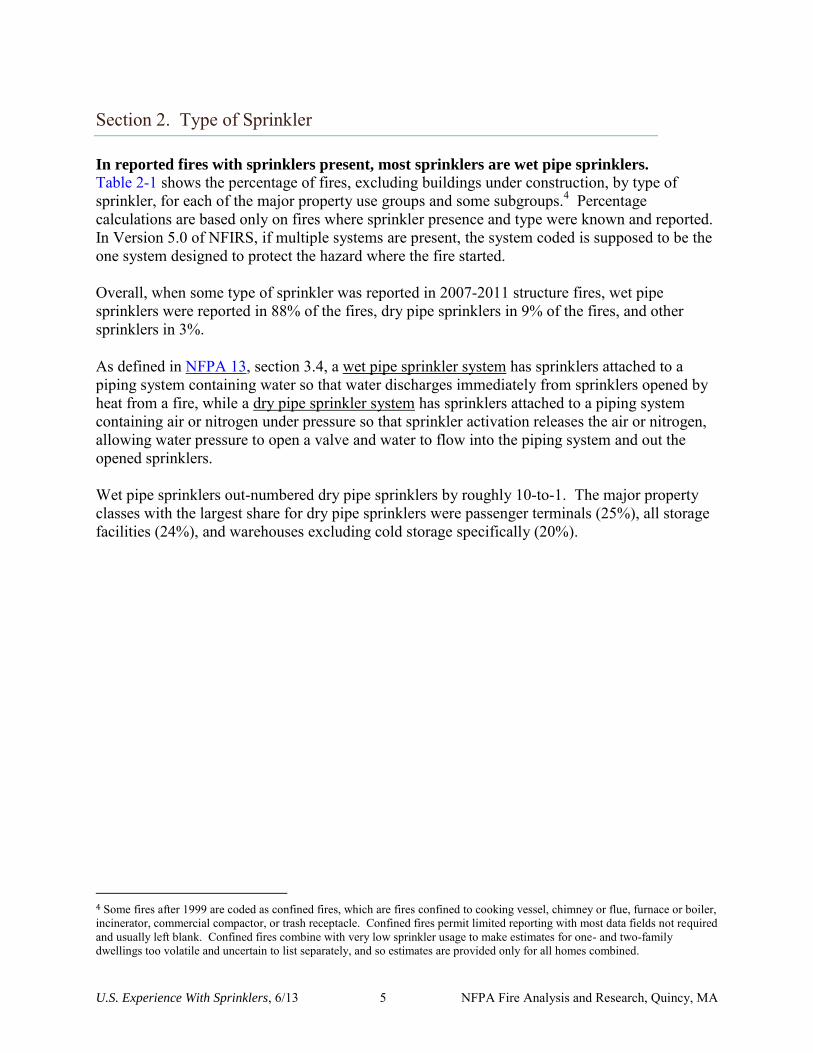
In reported fires with sprinklers present, most sprinklers are wet pipe sprinklers.
Table 2-1 shows the percentage of fires, excluding buildings under construction, by type of sprinkler, for each of the major property use groups and some subgroups.4 Percentage calculations are based only on fires where sprinkler presence and type were known and reported. In Version 5.0 of NFIRS, if multiple systems are present, the system coded is supposed to be the one system designed to protect the hazard where the fire started. Overall, when some type of sprinkler was reported in 2007-2011 structure fires, wet pipe sprinklers were reported in 88% of the fires, dry pipe sprinklers in 9% of the fires, and other sprinklers in 3%. As defined in NFPA 13, section 3.4, a wet pipe sprinkler system has sprinklers attached to a piping system containing water so that water discharges immediately from sprinklers opened by heat from a fire, while a dry pipe sprinkler system has sprinklers attached to a piping system containing air or nitrogen under pressure so that sprinkler activation releases the air or nitrogen, allowing water pressure to open a valve and water to flow into the piping system and out the opened sprinklers. Wet pipe sprinklers out-numbered dry pipe sprinklers by roughly 10-to-1. The major property classes with the largest share for dry pipe sprinklers were passenger terminals (25%), all storage facilities (24%), and warehouses excluding cold storage specifically (20%).
4 Some fires after 1999 are coded as confined fires, which are fires confined to cooking vessel, chimney or flue, furnace or boiler, incinerator, commercial compactor, or trash receptacle. Confined fires permit limited reporting with most data fields not required and usually left blank. Confined fires combine with very low sprinkler usage to make estimates for one- and two-family dwellings too volatile and uncertain to list separately, and so estimates are provided only for all homes combined.

U.S. Experience With Sprinklers, 6/13 6 NFPA Fire Analysis and Research, Quincy, MA
Table 2-1. Type of Sprinkler Reported in Structure Fires
Where Equipment Was Present in Fire Area, by Property Use
2007-2011 Structure Fires Reported to U.S. Fire Departments
Property Use
Fires per
year
with any
type of
sprinkler
Wet pipe
sprinklers
Dry pipe
sprinklers
Other
sprinklers*
All public assembly 3,410 82% 8% 10% Variable-use amusement place 190 87% 12% 1% Religious property 200 91% 7% 1% Library or museum 210 81% 13% 6% Eating or drinking establishment 1,680 79% 7% 14% Passenger terminal 390 74% 25% 1% Educational property 2,020 89% 9% 2% Health care property** 3,360 86% 11% 3% Nursing home 1,880 89% 9% 2% Hospital 830 89% 9% 2% Prison or jail 260 90% 6% 4% All residential 29,430 89% 9% 2% Home (including apartment) 23,650 89% 8% 2% Hotel or motel 1,870 90% 7% 3% Dormitory or barracks 2,020 89% 9% 2% Rooming or boarding home 1,050 88% 11% 0% Board and care home 860 91% 8% 1% Store or office 4,230 87% 10% 3% Grocery or convenience store 880 84% 10% 6% Laundry or dry cleaning or other professional service
300 84% 12% 4%
Department store 470 88% 11% 2% Office 1,100 89% 8% 3% Manufacturing facility 2,530 85% 12% 3% All storage 770 75% 24% 2% Warehouse excluding cold storage
400 79% 20% 1%
All structures *** 48,460 88% 9% 3% * Includes deluge and pre-action sprinkler systems and may include sprinklers of unknown or unreported type. ** Nursing home, hospital, clinic, doctor’s office, or development disability facility *** Includes some property uses that are not shown separately. Note: These are based on structure fires reported to U.S. municipal fire departments in NFIRS Version 5.0 and so exclude fires reported only to Federal or state agencies or industrial fire brigades. Row totals are shown in the leftmost column of percentages, and sums may not equal totals because of rounding error. In Version 5.0 of NFIRS, if multiple systems are present, the system coded is supposed to be the one system designed to protect the hazard where the fire started. This field is not required if the fire did not begin within the designed range of the system. Buildings under construction and partial systems are excluded. Source: NFIRS and NFPA survey.

U.S. Experience With Sprinklers, 6/13 7 NFPA Fire Analysis and Research, Quincy, MA
Section 3. Reliability and Effectiveness
Sprinklers operated in 91% of reported structure fires where sprinklers were present,
excluding buildings under construction, partial installations, and small fires.
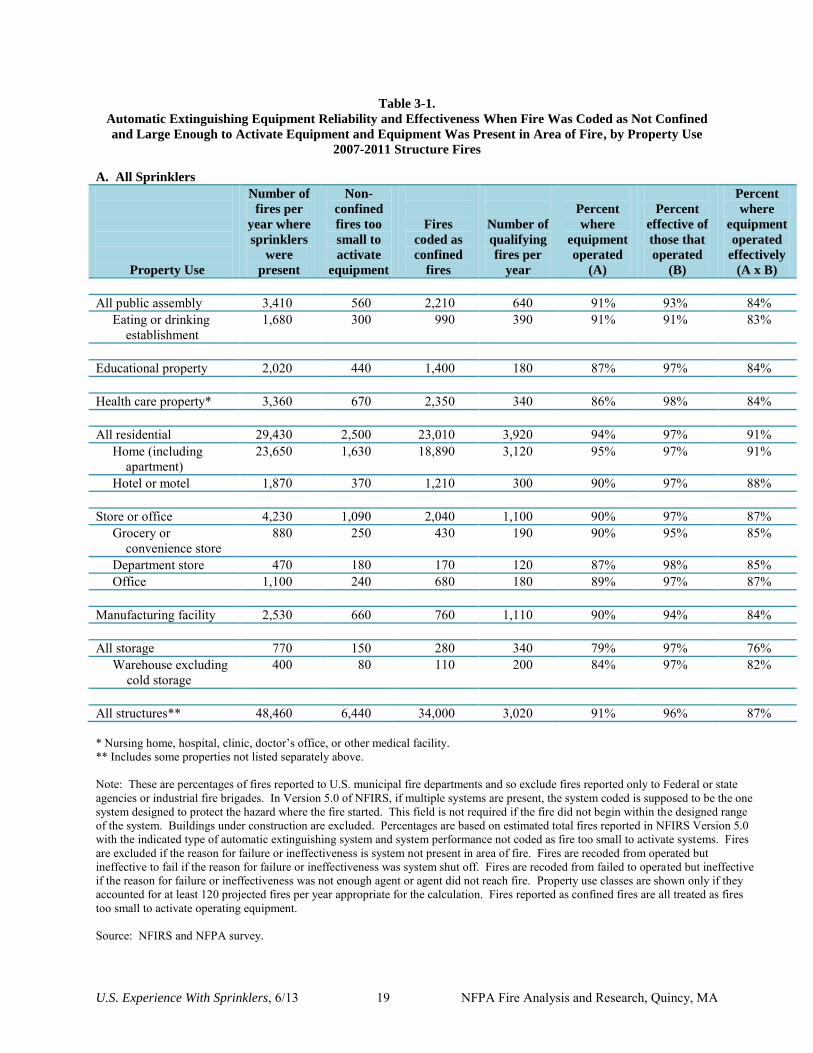
Table 3-1 shows: the number of structure fires per year where sprinklers were present, the percentage of fires where sprinklers operated, the percentage of operating equipment cases where sprinklers were effective, and the percentage of fires where sprinklers operated effectively (i.e., operated and were
effective). Table 3-1 also shows these statistics for specific types of sprinklers (specifically, for wet pipe and dry pipe sprinklers). For example, the percentage of fires where sprinklers operated was:
92% for wet pipe sprinklers, and 81% for dry pipe sprinklers.
For sprinklers that operated, sprinkler performance was deemed effective in 96% of the
cases, and sprinklers operated effectively 87% of the time (96% times 91%).
The percentage of fires where sprinklers operated effectively was as follows for specific types of sprinklers:
89% for wet pipe sprinklers, and 76% for dry pipe sprinklers.
Wet pipe sprinklers are more reliable than dry pipe sprinklers and more effective when they operate, resulting in a higher percentage of effective operation. A disadvantage of measuring sprinkler effectiveness by judgments made in incident reports is the ambiguity and subjectivity of the criterion of “effective,” which has never been precisely defined, let alone supported by an operational assessment protocol that could be executed consistently by different people. When sprinkler performance is deemed to be a failure (did not operate) or ineffective (operated but not effective), reasons for failure or ineffective can be reported:
System shut off Not enough agent (water) discharged to control the fire Agent (water) discharged but did not reach the fire Inappropriate system for type of fire Fire not in area protected by the system System component(s) damaged Lack of maintenance, including corrosion or heads painted Manual intervention defeated the system “Other” reason Undetermined reason

U.S. Experience With Sprinklers, 6/13 8 NFPA Fire Analysis and Research, Quincy, MA
Some combinations of coded entries are inconsistent (e.g., system operated but was not effective, and reason for ineffectiveness was systems shut off). The text box on Database Edits provides a detailed description of steps in the analysis designed to address these inconsistencies. Database Edits
In order to estimate reliability and effectiveness, the database must first be edited to remove fires, buildings, and systems where operation cannot be expected, such as buildings under construction. Statistics on reliability and effectiveness exclude partial systems, whether identified by coding under sprinkler presence or identified by reason for failure and ineffectiveness as equipment not in area of fire. Not all partial systems will be so identified and the codes and standards for many types of sprinklers do not require coverage in all areas. For example, concealed spaces and exterior locations may not be required to have coverage. The coding of reasons for failure or ineffectiveness has been used in this analysis to recode system performance entries. First, fires with reason for failure or ineffectiveness coded as sprinklers not in fire area are excluded from analysis because reliability and effectiveness cannot be judged in these situations. Second, the coding of performance as failure or ineffective is changed if that coding is inconsistent with the coded reason, as follows: If Performance = Not Effective And Reason = Then Change to: System shut off Performance = Failed to operate If Performance = Failed to Operate And Reason = Then Change to: Not enough agent OR Performance = Not effective Agent didn’t reach fire Finally, fires with reason for failure or ineffectiveness listed as “other” (unclassified), unknown, or blank are proportionally allocated over the known reasons. There is no way to know whether fires coded with “other” as reason for failure or ineffectiveness really had one of the coded reasons, had reason unknown, or had a known reason that was not one of the coded reasons. The following reasons for failure or ineffectiveness may be difficult to translate into a particular one of the NFIRS 5.0 reasons, even though they are not necessarily distinct, separate reasons themselves:
Specific design of sprinkler system proves inadequate to the size or location of fire, even though the type of sprinkler system is considered appropriate to the property use and hazard under applicable standards; or
Poor or obsolete (no longer compliant with current standards and codes) design installation, which does not take the form of an inappropriate type of system or of damaged components.
These reasons for failure or ineffectiveness could be coded as inappropriate system, component damage, or lack of maintenance, even though circumstances do not fit these designations well. Alternatively, these reasons could be coded in terms of their effect on performance, as not enough water released or water did not reach fire. If there is not a good fit between circumstances and
U.S. Experience With Sprinklers, 6/13 9 NFPA Fire Analysis and Research, Quincy, MA
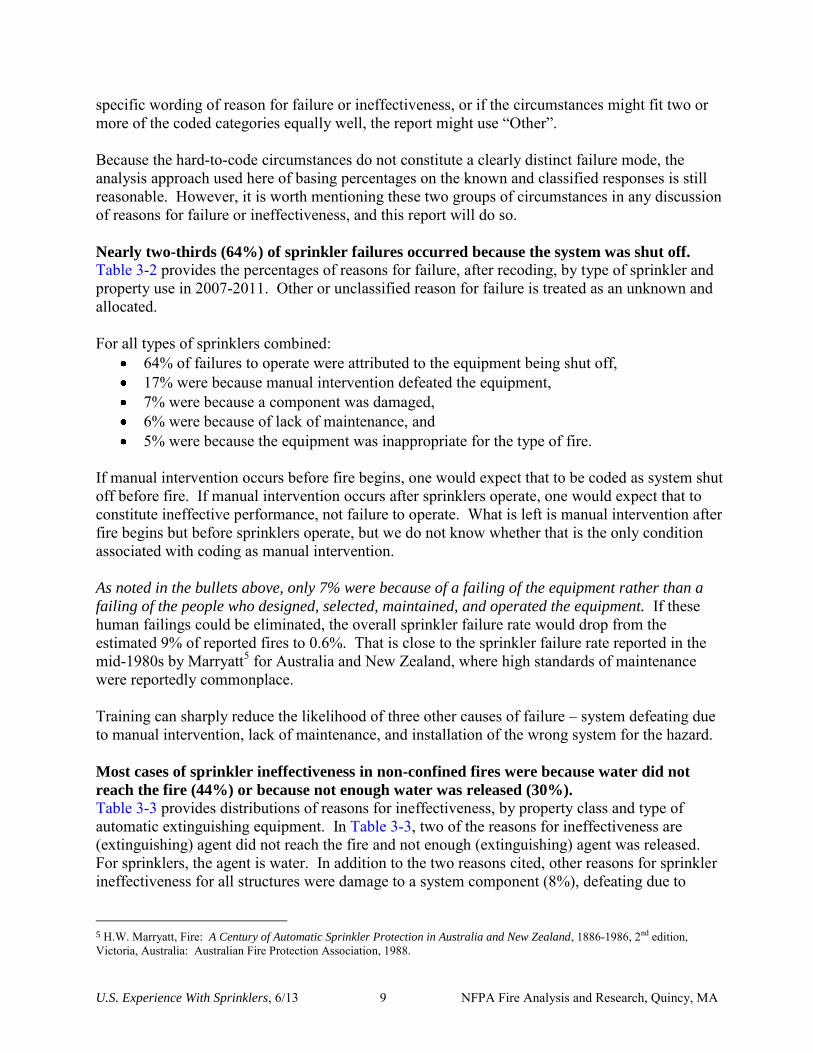
specific wording of reason for failure or ineffectiveness, or if the circumstances might fit two or more of the coded categories equally well, the report might use “Other”. Because the hard-to-code circumstances do not constitute a clearly distinct failure mode, the analysis approach used here of basing percentages on the known and classified responses is still reasonable. However, it is worth mentioning these two groups of circumstances in any discussion of reasons for failure or ineffectiveness, and this report will do so. Nearly two-thirds (64%) of sprinkler failures occurred because the system was shut off.
Table 3-2 provides the percentages of reasons for failure, after recoding, by type of sprinkler and property use in 2007-2011. Other or unclassified reason for failure is treated as an unknown and allocated. For all types of sprinklers combined:
64% of failures to operate were attributed to the equipment being shut off, 17% were because manual intervention defeated the equipment, 7% were because a component was damaged, 6% were because of lack of maintenance, and 5% were because the equipment was inappropriate for the type of fire.
If manual intervention occurs before fire begins, one would expect that to be coded as system shut off before fire. If manual intervention occurs after sprinklers operate, one would expect that to constitute ineffective performance, not failure to operate. What is left is manual intervention after fire begins but before sprinklers operate, but we do not know whether that is the only condition associated with coding as manual intervention. As noted in the bullets above, only 7% were because of a failing of the equipment rather than a
failing of the people who designed, selected, maintained, and operated the equipment. If these human failings could be eliminated, the overall sprinkler failure rate would drop from the estimated 9% of reported fires to 0.6%. That is close to the sprinkler failure rate reported in the mid-1980s by Marryatt5 for Australia and New Zealand, where high standards of maintenance were reportedly commonplace. Training can sharply reduce the likelihood of three other causes of failure – system defeating due to manual intervention, lack of maintenance, and installation of the wrong system for the hazard. Most cases of sprinkler ineffectiveness in non-confined fires were because water did not
reach the fire (44%) or because not enough water was released (30%).
Table 3-3 provides distributions of reasons for ineffectiveness, by property class and type of automatic extinguishing equipment. In Table 3-3, two of the reasons for ineffectiveness are (extinguishing) agent did not reach the fire and not enough (extinguishing) agent was released. For sprinklers, the agent is water. In addition to the two reasons cited, other reasons for sprinkler ineffectiveness for all structures were damage to a system component (8%), defeating due to
5 H.W. Marryatt, Fire: A Century of Automatic Sprinkler Protection in Australia and New Zealand, 1886-1986, 2nd edition, Victoria, Australia: Australian Fire Protection Association, 1988.

U.S. Experience With Sprinklers, 6/13 10 NFPA Fire Analysis and Research, Quincy, MA
manual intervention (7%), lack of maintenance (7%), and inappropriate equipment for the type of fire (5%). Insufficient (not enough) water can be released if there are problems with the system’s water supply. This reason for ineffectiveness can also overlap with other reasons, such as inappropriate equipment (if, for example, the hazard has changed under the equipment and now requires a higher water flow density than is provided by the now inappropriate equipment) and defeating by manual intervention (if, for example, the sprinklers are turned off prematurely so that insufficient water reaches the fire). Insufficient water also could be one of the reasons that could be cited if a flash fire or a fire with several points of origin overwhelms the system or if an explosion reduces the water flow but does not cause complete system failure. There are a number of different ways in which water may not reach the fire. One is shielded fires such as rack storage in a property with ceiling sprinklers only. Another is fire spread above exposed sprinklers, through unsprinklered concealed spaces, or via exterior surfaces. Another reason would be a deep-seated fire in bulk storage. A different kind of problem would be droplet sizes that are too small to penetrate the buoyant fire plume and reach the seat of the fire. A blockage in the pipes (e.g., due to mussels) that reduces but may not completely interrupt the flow of water might be coded as insufficient water, water did not reach fire, or even lack of maintenance. Even a well-maintained, complete, appropriate system requires the support of a well-considered integrated design for all the other elements of the building’s fire protection. Unsatisfactory sprinkler performance can result from an inadequate water supply or unique building construction features. More broadly, unsatisfactory fire protection performance can occur if the building’s design does not address all five elements of an integrated system – slowing the growth of fire, automatic detection, automatic suppression, confining the fire, and occupant evacuation. Effectiveness should be measured relative to the design objectives for a particular system. For most rooms in most properties, sprinklers are designed to confine fire to the room of origin. Some properties have some very large rooms in which the sprinkler installation is designed to confine fire to a design area that is much smaller than the entire room. These rooms could include large assembly areas; sales, showroom, or performance areas; and storage areas. Table 3-A shows the percentage of fires, by property use, that begin in five types of rooms that could be large enough to have a design area smaller than the entire room. Many of these rooms will not be that large. All these rooms combined do not account for a majority of fires in any type of property, and only stores and offices and warehouses have more than about one-seventh of their fires in such rooms.

U.S. Experience With Sprinklers, 6/13 11 NFPA Fire Analysis and Research, Quincy, MA
Table 3-A. Fires With Areas of Origin That Could Be Room Larger Than Sprinkler Design Area for Space
Percent of Structure Fires Excluding Buildings Under Construction, Sprinklers Not in Fire Area,
and Fires Coded as Confined Fires
2007-2011 Structure Fires With Sprinklers Present Reported to U.S. Fire Departments
Property Use
Large Assembly
Area
(At Least
100 People)
Sales,
Showroom or
Performance
Area
Unclassified
Storage
Area
Shipping,
Receiving or
Loading Area
Storage
Room Area,
Tank
or Bin
All
Areas
Combined
Warehouse excluding cold storage 0.2% 0.2% 13.2% 18.2% 8.5% 40.3% Store or office 0.2% 10.2% 4.6% 3.6% 4.2% 22.8% Public assembly excluding eating or drinking establishment 6.3% 1.4% 2.0% 0.3% 2.8% 14.8% Manufacturing facility 0.1% 0.0% 2.7% 2.5% 2.9% 8.2% Educational property 2.9% 0.5% 1.9% 0.3% 1.2% 6.8% Eating or drinking establishment 1.3% 0.1% 1.9% 0.3% 1.9% 5.5% Hotel or motel 0.5% 0.1% 1.5% 0.0% 1.5% 3.6% Health care property* 0.2% 0.0% 1.0% 0.2% 0.9% 2.3% Home (including apartment) 0.0% 0.1% 0.5% 0.0% 0.5% 1.1% * Hospital, clinic, doctor’s office, nursing home and development disability facility. Note: Percentages sum left to right and may not equal totals in last column because of rounding. Fires reported as confined fires are excluded because such fires could not be large enough to exceed the sprinkler design area. Statistics are based on structure fires reported to U.S. municipal fire departments and so exclude fires reported only to Federal or state agencies or industrial fire brigades. Statistics exclude buildings under construction, partial systems, and fires with sprinklers not in fire area reported as reason for failure or ineffectiveness of automatic extinguishing equipment. Source: NFIRS and NFPA survey. Sprinklers are designed to confine a fire to the room of origin or the design fire area,
whichever is smaller. Therefore, the benefits of sprinklers will tend to come in the following scenarios:
A fire that would otherwise have spread beyond the room of fire origin will be confined to the room of origin, resulting in a smaller fire-damaged area and less property damage.
A fire that would otherwise have grown larger than the design fire area in a room larger than
that area will be confined to the design fire area, resulting in a smaller fire-damaged area and less property damage.
A fire will be confined to an area smaller than the room or the design fire area, even though
that degree of success goes beyond the performance assured by the design, resulting in a smaller fire-damaged area and less property damage.
Table 3-4 provides direct measurement of sprinkler effect involving the first bulleted scenario above. For all structures combined, 51% have flame damage confined to room of origin when there is no automatic extinguishing equipment present. This rises to 86% of fires with flame damage confined to room of origin when any type of sprinkler is present.

U.S. Experience With Sprinklers, 6/13 12 NFPA Fire Analysis and Research, Quincy, MA
As noted, for most rooms in most properties, effective performance is indicated by confinement of fire to the room of origin. Table 3-B shows that when an operating system is judged effective, flame is usually confined to the room of origin (86% for all structures). When sprinklers fail to operate or are ineffective, it is much less likely that fire was confined to the room of origin. Table 3-B suggests that the property uses with larger percentages of floor space devoted to very large rooms (e.g., manufacturing, storage) are more likely to have fire spread beyond the room of origin even though sprinkler performance was judged effective.
Table 3-B. Sprinkler Success in Confining Fire to Room of Origin vs. Sprinkler Performance
by Property Use Group
2007-2011 Structure Fires Reported to U.S. Fire Departments Where Sprinklers Were Present in Fire Area,
Fire Was Not Coded as Confined and Was Large Enough to Activate Sprinklers,
and Building Was Not Under Construction
Percentage of Fires Confined to Room of Origin
Property Use
Where Sprinklers
Operated
Effectively
When Sprinklers
Failed to
Operate
When Sprinklers
Operated But Were
Not Effective
Public assembly 84% 64% 46% Eating or drinking establishment 83% 67% 40% Educational 93% 82% 22% Health care property* 92% 82% 86% Residential 92% 71% 40% Home (including apartment) 91% 68% 37% Hotel or motel 95% 75% 59% Store or office 81% 65% 62% Office 85% 75% 51% Manufacturing facility 76% 62% 41% Storage 73% 32% 42% Warehouse excluding cold storage 71% 41% 60% All structures** 86% 64% 46% * Hospital, clinic, doctor’s office, nursing home and development disability facility. **Includes some properties not separately listed above. Source: NFIRS and NFPA Survey. Table 3-B also suggests that confinement of fire to room of origin is more likely when sprinklers fail to operate than when sprinklers operate but are not effective. This is not so surprising as it may appear. When sprinklers fail to operate, the reason almost always has nothing to do with the fire, and so the fire sizes may have the full mix of fire sizes found in that kind of property. When sprinklers operate but are ineffective, the reason often has to do with an insufficiency of water delivered to the fire, which means the fire has to be large enough not only to activate the sprinklers but to overpower them. That in turn suggests a larger average fire size for ineffective sprinklers than for failed sprinklers.
U.S. Experience With Sprinklers, 6/13 13 NFPA Fire Analysis and Research, Quincy, MA
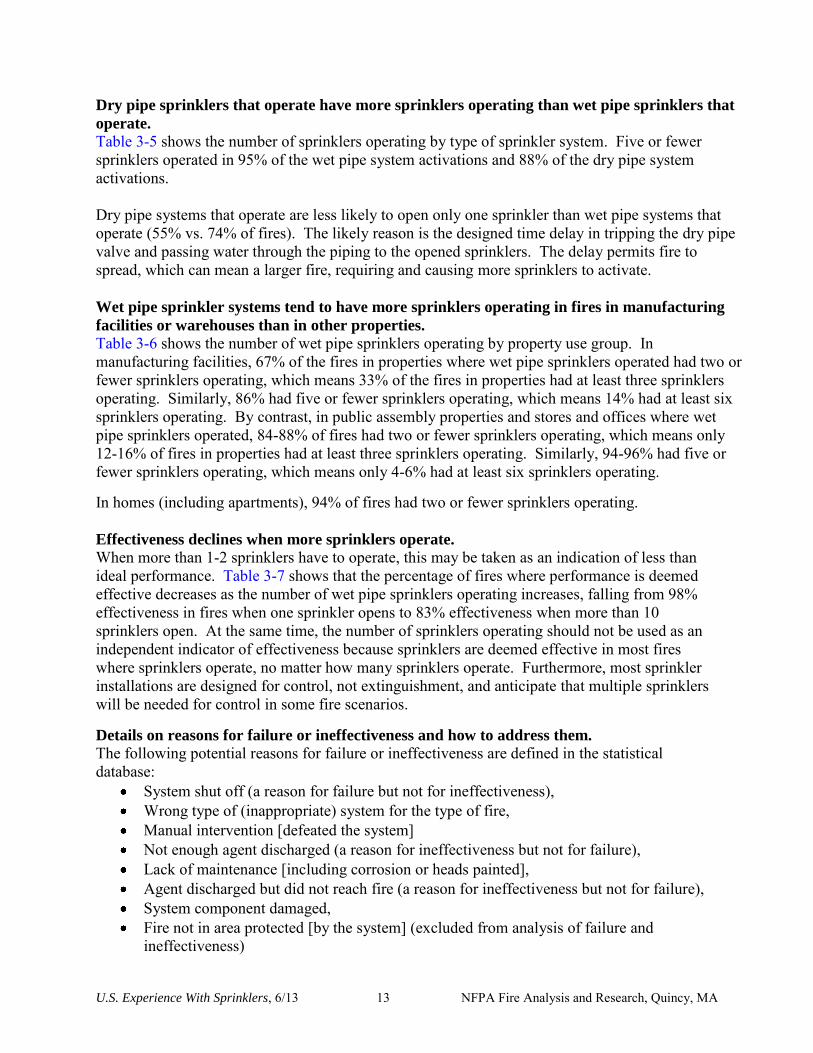
Dry pipe sprinklers that operate have more sprinklers operating than wet pipe sprinklers that
operate.
Table 3-5 shows the number of sprinklers operating by type of sprinkler system. Five or fewer sprinklers operated in 95% of the wet pipe system activations and 88% of the dry pipe system activations. Dry pipe systems that operate are less likely to open only one sprinkler than wet pipe systems that operate (55% vs. 74% of fires). The likely reason is the designed time delay in tripping the dry pipe valve and passing water through the piping to the opened sprinklers. The delay permits fire to spread, which can mean a larger fire, requiring and causing more sprinklers to activate. Wet pipe sprinkler systems tend to have more sprinklers operating in fires in manufacturing
facilities or warehouses than in other properties.
Table 3-6 shows the number of wet pipe sprinklers operating by property use group. In manufacturing facilities, 67% of the fires in properties where wet pipe sprinklers operated had two or fewer sprinklers operating, which means 33% of the fires in properties had at least three sprinklers operating. Similarly, 86% had five or fewer sprinklers operating, which means 14% had at least six sprinklers operating. By contrast, in public assembly properties and stores and offices where wet pipe sprinklers operated, 84-88% of fires had two or fewer sprinklers operating, which means only 12-16% of fires in properties had at least three sprinklers operating. Similarly, 94-96% had five or fewer sprinklers operating, which means only 4-6% had at least six sprinklers operating. In homes (including apartments), 94% of fires had two or fewer sprinklers operating. Effectiveness declines when more sprinklers operate.
When more than 1-2 sprinklers have to operate, this may be taken as an indication of less than ideal performance. Table 3-7 shows that the percentage of fires where performance is deemed effective decreases as the number of wet pipe sprinklers operating increases, falling from 98% effectiveness in fires when one sprinkler opens to 83% effectiveness when more than 10 sprinklers open. At the same time, the number of sprinklers operating should not be used as an independent indicator of effectiveness because sprinklers are deemed effective in most fires where sprinklers operate, no matter how many sprinklers operate. Furthermore, most sprinkler installations are designed for control, not extinguishment, and anticipate that multiple sprinklers will be needed for control in some fire scenarios.
Details on reasons for failure or ineffectiveness and how to address them.
The following potential reasons for failure or ineffectiveness are defined in the statistical database:
System shut off (a reason for failure but not for ineffectiveness), Wrong type of (inappropriate) system for the type of fire, Manual intervention [defeated the system] Not enough agent discharged (a reason for ineffectiveness but not for failure), Lack of maintenance [including corrosion or heads painted], Agent discharged but did not reach fire (a reason for ineffectiveness but not for failure), System component damaged, Fire not in area protected [by the system] (excluded from analysis of failure and
ineffectiveness)

U.S. Experience With Sprinklers, 6/13 14 NFPA Fire Analysis and Research, Quincy, MA
Table 3-C shows how each reason contributes to failure and ineffectiveness.
Table 3-C. Reasons for Failure or Ineffectiveness as Number of 2007-2011 Structure Fires per Year and
Percentages of All Cases of Failure or Ineffectiveness, for All Structures and Wet Pipe Sprinklers
Excluding Buildings Under Construction, Sprinklers Not in Fire Area, and Fires Coded as Confined Fires
Reason Failure Ineffectiveness Combined
System shut off 1,638 (42%) 0 (0%) 1,638 (42%) Manual intervention defeated system 568 (14%) 114 (3%) 682 (17%) Water discharged but did not reach fire
0 (0%) 516 (13%) 516 (13%)
Not enough water discharged 0 (0%) 385 (10%) 385 (10%) Lack of maintenance 196 (5%) 54 (1%) 251 (6%) System component damaged 183 (5%) 67 (2%) 250 (6%) Wrong type of (inappropriate) system for type of fire
161 (4%) 64 (2%) 225 (6%)
Total 2,746 (70%) 1,200 (30%) 3,946 (100%) Source: Calculated from percentages and numbers in Total lines of Tables 3-2B and 3-3B. The bulleted list above should add another category of potential reasons for failure or ineffectiveness which is similar to several of the identified reasons but sufficiently different from all of them that it may constitute some of the “other” or unclassified reported reasons for failure or ineffectiveness:
Because of poor or obsolete design, manufacture, or installation, the sprinklers are not able to deliver sufficient water in time and in the right place to control the fire.
If the “other” category for reasons for failure or ineffectiveness is not being used primarily to mean unknown or multiple reasons from the identified reasons, then the rankings in Table 3-C might change, except for the dominant leading reason of system shut off, which would remain the leading reason in any case. If the “other” reason suggested above – poor or obsolete design, manufacturing, or installation – is a major part of the reported “other reasons, then most of those cases might fit best with the “wrong system” identified reason, which might thereby move from last place to second place. In other words, not too much emphasis should be placed on the relative shares and rankings of the reasons ranking below system shut off. NFPA has compiled published incidents (see selected examples in Appendix C) that illustrate the different types of reasons for sprinkler failure or ineffectiveness. NFPA 25, Standard for the
Inspection, Testing, and Maintenance of Water-Based Fire Protection Systems, describes procedures to address most of these reasons that involve maintenance of an existing sprinkler system. An exception is systems designed to NFPA 13D, Standard for the Installation of
Sprinkler Systems in One- and Two-Family Dwellings and Manufactured Homes, (the home sprinkler standard), for which maintenance, inspection, and testing requirements are much fewer, reflecting the greater inherent reliability of the simpler design. These requirements are included in the NFPA 13D standard. When the reasons involve a need to modify the sprinkler system, procedures to trigger those changes are found in NFPA 1, Fire Code, and NFPA 1620, Standard
for Pre-Incident Planning.

U.S. Experience With Sprinklers, 6/13 15 NFPA Fire Analysis and Research, Quincy, MA
System shut off
The NFPA incident compilation includes cases of systems shut off because of building status (e.g., vacant, being remodeled, still under construction) and cases of systems shut off because of system problems (e.g., leak in system, dirt in water supply for both building and system, damage from earlier forklift collision). NFPA 25 addresses all these circumstances under rules for dealing with impairments (Chapter 14). When the system is shut off or otherwise impaired, NFPA 25 requires use of a tag to provide a visible reminder that the system is out of service, close oversight of the schedule and steps required to correct the impairment, and appropriate practices to assure safety in the building while the impairment exists. NFPA 25 also addresses valve supervision using a tamper switch connected to a central alarm monitoring system.
Manual intervention defeated system
NFPA standards for specific occupancies or for fire service operations provide guidance for fire protection and firefighting in a sprinklered building. These rules address the best use of fire suppression equipment in combination with fire sprinklers and the need to confirm that fire conditions no longer pose a threat before shutting off sprinklers.
Agent (water) did not reach fire
A number of conditions can result in this problem, but the most obvious one is a shielded fire. An incident identified in Appendix C (in the section on large fires where water did not reach fire) involved a convention center where a covering, operating like a temporary ceiling, blocked the sprinklers from reaching the fire. Shielding can also occur if fire grows under furniture (as in a residential property or an office) or under equipment (as in a manufacturing facility) or in the lower portions of an array of objects (as in a store or warehouse). An engineered solution to the problem is to place sprinklers under the shielding, as with in-rack sprinklers. The other principal alternative is to avoid arrangements where shielding and blocking are likely to occur. The periodic inspections needed to identify shielding and blocking situations and to correct such problems if discovered can be conducted as part of fire code inspections (e.g., in support of NFPA 1) or pre-incident planning (e.g., in accord with NFPA 1620.)
Not enough agent (water) discharged
The NFPA incident compilation identifies several cases of inadequate water flow; note that some are incidents where firefighters also found inadequate water flow for hydrants or hoses. Inadequate water flow can also occur if the system design is no longer adequate for the hazard being protected. These incidents may also be reported as cases of inappropriate system. NFPA 25 uses inspections and testing to address all sources of problems affecting water flow or delivered density, including standpipes, hose systems, fire service mains, fire pumps, and water storage tanks. If the problem is a system no longer appropriate for the hazard below it, NFPA 1 and NFPA 1620 are relevant, as discussed above under “inappropriate system”.

U.S. Experience With Sprinklers, 6/13 16 NFPA Fire Analysis and Research, Quincy, MA
NFPA 25 also provides a procedure for periodic investigation of pipes for obstructions (Chapter 13). Such obstructions can reduce water flow and result in a problem of not enough agent discharged.
Lack of maintenance
The NFPA compilation identifies an incident where a sprinkler was coated with cotton dust in a textile manufacturing plant and an incident where sediment built up in the system. NFPA 13 and NFPA 25 include requirements for special protection in settings or during activities with a high vulnerability to accumulation of dust, paint, or other substances, and NFPA 25 uses inspections to detect such accumulations when they occur. More generally, there is the question of how to organize Inspection, Testing, and Maintenance (ITM) activities so as to strike the best balance between risk (of failure or ineffectiveness) and cost. A visual inspection or a test can indicate a problem that, left unaddressed, could lead to sprinkler failure or ineffectiveness. An act of maintenance can restore the system to target or greater reliability and effectiveness. At every stage there are probabilities that create residual risk or needless cost, such as the following:
Likelihood that a real problem will not be identified versus likelihood that a problem will be reported when there is no real problem. This applies to visual inspection and testing.
Likelihood that the threshold (e.g., how much “loading” of material on a sprinkler) is too high, resulting in problems left unaddressed that eventually lead to failure or ineffectiveness, or too low, resulting in costly maintenance that ends up being unnecessary.
Likelihood that the frequency of inspection or testing is too high, leading to inspection-hours or tests that cost money but are not necessary to maintain high reliability and effectiveness, or too low, allowing problems to emerge and to remain long enough to prove decisive in a fire.
There are efforts underway to apply risk concepts to design inspection, testing and maintenance programs that balance risk and cost more explicitly and quantitatively. At this time, the main point is that it is too easy to oversimplify this issue into one of maintenance lacking or maintenance present. Differences in degree of maintenance or type of maintenance all matter, and all may make a large difference or a small difference in cost, reliability, effectiveness, and risk.
Inappropriate system for type of fire
“Inappropriate” system can refer to the wrong type of agent (e.g., water vs. chemical agent or carbon dioxide), the wrong type of system for the same agent (e.g., wet pipe vs. dry pipe), or the wrong design for the same system and agent (e.g., a design adequate only for Class I commodities vs. a design adequate for any class of commodities). The NFPA compilation identifies several cases where the system was inadequate for the hazard.

U.S. Experience With Sprinklers, 6/13 17 NFPA Fire Analysis and Research, Quincy, MA
The NFPA 13, NFPA 13D and NFPA 13R standards for installation of automatic extinguishing equipment provide detailed requirements for selecting the right agent, the right system, and the right design, but this is all relative to conditions at the initial installation. The need for a change in system design can be identified during routine, periodic inspections in support of the local fire code or pre-incident planning. Section 13.3.3 of NFPA 1 requires the property owner or occupant to maintain the design level of performance and protection of the sprinkler system and to evaluate the adequacy of the installed system if there are any changes in occupancy, use, process, or materials. NFPA 1620 requires periodic review, testing, updating and refinement of the pre-incident plan. NFPA 1620 also states that a mismatch of sprinkler system with type or arrangement of protected commodities is a sprinkler system design deficiency that should be noted on the pre-incident plan.
System component damaged
In the NFPA compilation of incidents of failure or ineffectiveness, the incidents involving component damage consist entirely of fires where automatic extinguishing equipment was damaged by explosions or by ceiling, roof, or building collapse, the latter nearly always as a consequence of fire. System component damage is rarely cited as the reason for sprinkler failure or ineffectiveness, which is consistent with the idea that the components are very reliable, absent a severe external cause like an explosion. Explosions are more severe than the design fires considered by NFPA 13, NFPA 13D, and NFPA 13R. NFPA 25 uses inspections and tests to detect less severe component damage.
Fire not in area protected
Under fire incident coding rules, automatic extinguishing equipment is deemed to be present in a building only if it is present in the area of fire. Therefore, fires are removed from the operationality and effectiveness analysis in the report if equipment was deemed to have failed or been ineffective because of fire outside area protected. However, some areas may be unprotected even in a system that is described as having complete coverage. NFPA 13 has provisions for sprinkler protection of concealed spaces and exterior locations, but coverage of these areas is required only in certain defined situations. The NFPA compilation includes several incidents involving partial coverage by any definition but also several incidents where coverage was described as complete but was not provided for areas of fire origin or of early fire growth in concealed or void spaces, on balconies or other outside locations, or above sprinklers in manufacturing or storage facilities. This long-standing dilemma over how to describe a lack of coverage in concealed spaces and exterior locations has become more complicated with the emergence of specialized installation standards, such as NFPA 13D and NFPA 13R, that also exempt certain rooms from coverage. Table 3-D shows the leading areas of fire origin for one- and two-family home fires coded as sprinklers present but failed or ineffective because of no sprinkler in the fire area.6 In other words, sprinklers were present somewhere in the home but not in the area of origin. Percentage 6 Fires with incident types indicating fire confined to cooking vessel, chimney or flue, boiler or fuel burner, compactor, incinerator, or trash are excluded from this table.

U.S. Experience With Sprinklers, 6/13 18 NFPA Fire Analysis and Research, Quincy, MA
shares for all these areas of origin for one- and two-family home fires, regardless of sprinkler status, are also included for comparison.
Table 3-D. Leading Areas of Origin for Fires in One- or Two-Family Homes
In Which Sprinklers Failed or were Ineffective Because They Were Not in the Fire Area
Excluding Buildings Under Construction
2007-2011 Structure Fires Reported to U.S. Fire Departments
Percent of Fires Where Wet-Pipe Sprinklers Percent of
Were Present But All
Area of Origin Not Present in Fire Area* Fires*
Attic or concealed space above top story 13% 5% Exterior balcony or unenclosed porch 11% 3% Wall assembly or concealed space 9% 4% Garage 8% 5% Exterior roof surface 7% 1% Laundry room or area 4% 5% Exterior wall surface 4% 5% Kitchen 3% 18% Unclassified structural area 3% 3% Other area of origin 38% 51% Total 100% 100% * Excludes fires coded as confined. ** Excludes dwelling garages coded as separate buildings. Source: NFIRS and NFPA survey. The listed concealed spaces and other structural areas, external areas, garages, and attics – that is, all the listed areas except for kitchens and laundry rooms – account for 55% of the non-confined fires where sprinklers are present but not in the fire area. These same areas accounted for only 26% of non-confined fires in one- or two-family homes in general.
U.S. Experience With Sprinklers, 6/13 19 NFPA Fire Analysis and Research, Quincy, MA
Table 3-1.
Automatic Extinguishing Equipment Reliability and Effectiveness When Fire Was Coded as Not Confined
and Large Enough to Activate Equipment and Equipment Was Present in Area of Fire, by Property Use
2007-2011 Structure Fires
A. All Sprinklers
Property Use
Number of
fires per
year where
sprinklers
were
present
Non-
confined
fires too
small to
activate
equipment
Fires
coded as
confined
fires
Number of
qualifying
fires per
year
Percent
where
equipment
operated
(A)
Percent
effective of
those that
operated
(B)
Percent
where
equipment
operated
effectively
(A x B)
All public assembly 3,410 560 2,210 640 91% 93% 84% Eating or drinking establishment
1,680 300 990 390 91% 91% 83%
Educational property 2,020 440 1,400 180 87% 97% 84% Health care property* 3,360 670 2,350 340 86% 98% 84% All residential 29,430 2,500 23,010 3,920 94% 97% 91% Home (including apartment)
23,650 1,630 18,890 3,120 95% 97% 91%
Hotel or motel 1,870 370 1,210 300 90% 97% 88% Store or office 4,230 1,090 2,040 1,100 90% 97% 87% Grocery or convenience store
880 250 430 190 90% 95% 85%
Department store 470 180 170 120 87% 98% 85% Office 1,100 240 680 180 89% 97% 87% Manufacturing facility 2,530 660 760 1,110 90% 94% 84% All storage 770 150 280 340 79% 97% 76% Warehouse excluding cold storage
400 80 110 200 84% 97% 82%
All structures** 48,460 6,440 34,000 3,020 91% 96% 87% * Nursing home, hospital, clinic, doctor’s office, or other medical facility. ** Includes some properties not listed separately above. Note: These are percentages of fires reported to U.S. municipal fire departments and so exclude fires reported only to Federal or state agencies or industrial fire brigades. In Version 5.0 of NFIRS, if multiple systems are present, the system coded is supposed to be the one system designed to protect the hazard where the fire started. This field is not required if the fire did not begin within the designed range of the system. Buildings under construction are excluded. Percentages are based on estimated total fires reported in NFIRS Version 5.0 with the indicated type of automatic extinguishing system and system performance not coded as fire too small to activate systems. Fires are excluded if the reason for failure or ineffectiveness is system not present in area of fire. Fires are recoded from operated but ineffective to fail if the reason for failure or ineffectiveness was system shut off. Fires are recoded from failed to operated but ineffective if the reason for failure or ineffectiveness was not enough agent or agent did not reach fire. Property use classes are shown only if they accounted for at least 120 projected fires per year appropriate for the calculation. Fires reported as confined fires are all treated as fires too small to activate operating equipment. Source: NFIRS and NFPA survey.

U.S. Experience With Sprinklers, 6/13 20 NFPA Fire Analysis and Research, Quincy, MA
Table 3-1. (Continued)
Automatic Extinguishing Equipment Reliability and Effectiveness When Fire Was Coded as Not Confined
and Large Enough to Activate Equipment and Equipment Was Present in Area of Fire, by Property Use
2007-2011 Structure Fires
B. Wet Pipe Sprinklers Only
Property Use
Number of
fires per
year where
sprinklers
were
present
Non-
confined
fires too
small to
activate
equipment
Fires
coded as
confined
fires
Number of
qualifying
fires per
year
Percent
where
equipment
operated
(A)
Percent
effective of
those that
operated
(B)
Percent
where
equipment
operated
effectively
(A x B)
All public assembly 2,810 480 1,770 550 92% 95% 88% Eating or drinking establishment 1,330 250 750 330 93% 94% 88% Educational property 1,810 390 1,250 170 87% 97% 84% Health care property* 2,900 590 2,020 300 87% 98% 85% All residential 26,280 2,240 20,370 3,670 95% 97% 92% Home (including apartment) 21,060 1,470 16,670 2,920 95% 97% 92% Hotel or motel 1,680 320 1,080 270 91% 97% 89% Store or office 3,680 970 1,710 990 91% 97% 88% Grocery or convenience store 740 220 340 170 90% 96% 87% Department store 410 160 140 110 87% 97% 85% Office 980 220 600 170 90% 98% 88% Manufacturing facility 2,160 570 670 920 91% 94% 86% All storage 570 120 200 260 85% 98% 83% Warehouse excluding cold storage 320 70 80 170 86% 97% 84% All structures** 42,520 5,680 29,690 7,150 92% 96% 89%
* Nursing home, hospital, clinic, doctor’s office, or other medical facility. ** Includes some properties not listed separately above. Note: These are percentages of fires reported to U.S. municipal fire departments and so exclude fires reported only to Federal or state agencies or industrial fire brigades. In Version 5.0 of NFIRS, if multiple systems are present, the system coded is supposed to be the one system designed to protect the hazard where the fire started. This field is not required if the fire did not begin within the designed range of the system. Buildings under construction are excluded. Percentages are based on estimated total fires reported in NFIRS Version 5.0 with the indicated type of automatic extinguishing system and system performance not coded as fire too small to activate systems. Fires are excluded if the reason for failure or ineffectiveness is system not present in area of fire. Fires are recoded from operated but ineffective to fail if the reason for failure or ineffectiveness was system shut off. Fires are recoded from failed to operated but ineffective if the reason for failure or ineffectiveness was not enough agent or agent did not reach fire. Property use classes are shown only if they accounted for at least 110 projected fires per year appropriate for the calculation. Fires reported as confined fires are all treated as fires too small to activate operating equipment. Source: NFIRS and NFPA survey.

U.S. Experience With Sprinklers, 6/13 21 NFPA Fire Analysis and Research, Quincy, MA
Table 3-1. (Continued)
Automatic Extinguishing Equipment Reliability and Effectiveness When Fire was Coded as not Confined and
Large Enough to Activate Equipment and Equipment Was Present in Area of Origin, by Property Use
2007-2011 Structure Fires
C. Dry Pipe Sprinklers Only
Property Use
Number of
fires per
year where
sprinklers
were
present
Non-
confined
fires too
small to
activate
equipment
Fires
coded as
confined
fires
Number of
qualifying
fires per
year
Percent
where
equipment
operated
(A)
Percent
effective of
those that
operated
(B)
Percent
where
equipment
operated
effectively
(A x B)
All residential 2,510 220 2,110 190 88% 96% 85% Homes 2,000 130 1,740 130 90% 95% 85% Store or office 430 100 250 80 81% 96% 78% Manufacturing facility 300 80 70 160 85% 90% 77% All storage 180 30 80 80 60% 93% 55% All structures* 4,530 620 3,250 660 81% 94% 76% * Includes some properties not listed separately above. Note: These are percentages of fires reported to U.S. municipal fire departments and so exclude fires reported only to federal or state agencies or industrial fire brigades. In Version 5.0 of NFIRS, if multiple systems are present, the system coded is supposed to be the one system designed to protect the hazard where the fire started. This field is not required if the fire did not begin within the designed range of the system. Buildings under construction are excluded. Percentages are based on estimated total fires reported in NFIRS Version 5.0 with the indicated type of automatic extinguishing system and system performance not coded as fire too small to activate systems. Fires are excluded if the reason for failure or ineffectiveness is system not present in area of fire. Fires are recoded from operated but ineffective to failed if the reason for failure or ineffectiveness was system shut off. Fires are recoded from failed to operated but ineffective if the reason for failure or ineffectiveness was not enough agent or agent did not reach fire. Property use classes are shown only if they accounted for at least 80 projected fires per year appropriate to the calculation. Fires reported as confined fires are reported without sprinkler performance details or as all treated as fires too small to activate operating equipment. Source: NFIRS and NFPA survey.

U.S. Experience With Sprinklers, 5/13 22 NFPA Fire Analysis and Research, Quincy, MA
Table 3-2.
Reasons for Failure to Operate When Fire Was Coded as Not Confined and
Large Enough to Activate Equipment and Equipment Was Present in Area of Fire, by Property Use
Based on Estimated Number of 2007-2011 Structure Fires per Year
A. All Sprinklers
Manual
Property Use
System
shut off
intervention
defeated
system
System
component
damaged
Lack of
maintenance
Inappropriate
system for
type of fire
Total
fires per
year
All public assembly 51% 13% 7% 13% 15% 61 Eating or drinking establishment 43% 11% 10% 21% 15% 34 All residential 59% 21% 8% 7% 4% 233 Home (including apartment) 64% 16% 9% 6% 5% 168 Store or office 62% 16% 11% 5% 6% 112 Manufacturing facility 65% 17% 7% 5% 5% 111 All structures* 64% 17% 7% 6% 5% 711 * Includes some properties not listed separately above. Note: Percentages are based on structure fires reported in NFIRS Version 5.0 to U.S. municipal fire departments and so exclude fires reported only to Federal or state agencies or industrial fire brigades. Figures reflect recodings explained in Introduction: Fires are excluded if the reason for failure or ineffectiveness is system not present in area of fire, unclassified or unknown. Fires are recoded from operated but ineffective to failed if the reason for failure or ineffectiveness was system shut off. Fires are recoded from failed to operated but ineffective if the reason for failure or ineffectiveness was not enough agent or agent did not reach fire. In Version 5.0 of NFIRS, if multiple systems are present, the system coded is supposed to be the one system designed to protect the hazard where the fire started. This field is not required if the fire did not begin within the designed range of the system. Buildings under construction are excluded. Property use groups are shown only if there were at least 10 fires per year involving failure to operate and 10 fires per year involving operation not effective. Fires reported as confined fires are all treated as fires too small to activate operating equipment. Fires reported with unclassified reason for failure, which accounted for 21% of fires with failure for all structures combined, are treated as cases of unknown reasons for failure. Source: NFIRS and NFPA survey.

U.S. Experience With Sprinklers, 6/13 23 NFPA Fire Analysis and Research, Quincy, MA
Table 3-2. (Continued)
Reasons for Failure to Operate When Fire Was Coded as Not Confined and
Large Enough to Activate Equipment and Equipment Was Present in Area of Fire, by Property Use
Based on Estimated Number of 2007-2011 Structure Fires per Year
B. Wet Pipe Sprinklers Only
Manual System Inappropriate Total
System intervention component Lack of system for fires
Property Use shut off defeated system damaged maintenance type of fire per year
All public assembly 55% 18% 7% 10% 10% 42 Eating or drinking establishment 50% 15% 14% 14% 7% 23 All residential 57% 24% 6% 8% 5% 202 Home (including apartment) 62% 19% 8% 6% 6% 146 Store or office 57% 19% 10% 6% 7% 92 Manufacturing facility 62% 20% 3% 7% 7% 81 All structures* 60% 21% 7% 7% 6% 549 C. Dry Pipe Sprinklers Only
Manual System Inappropriate Total
System intervention component Lack of system for fires
Property Use shut off defeated system damaged maintenance type of fire per year
All structures 80% 6% 9% 2% 2% 124 * Includes some properties not listed separately above. Note: Percentages are based on structure fires reported in NFIRS Version 5.0 to U.S. municipal fire departments and so exclude fires reported only to Federal or state agencies or industrial fire brigades. Figures reflect recodings explained in Introduction: Fires are excluded if the reason for failure or ineffectiveness is system not present in area of fire, unclassified or unknown. Fires are recoded from operated but ineffective to failed if the reason for failure or ineffectiveness was system shut off. Fires are recoded from failed to operated but ineffective if the reason for failure or ineffectiveness was not enough agent or agent did not reach fire. In Version 5.0 of NFIRS, if multiple systems are present, the system coded is supposed to be the one system designed to protect the hazard where the fire started. This field is not required if the fire did not begin within the designed range of the system. Buildings under construction are excluded. Property use groups are shown only if there were at least 10 fires per year involving failure to operate and 10 fires per year involving operation not effective. Fires reported as confined fires are all treated as fires too small to activate operating equipment. Fires reported with unclassified reason for failure, which accounted for 22% of wet pipe sprinkler fires with failure and 13% of dry-pipe sprinkler fires for all structures combined, are treated as cases of unknown reasons for failure. Source: NFIRS and NFPA survey.

U.S. Experience With Sprinklers, 6/13 24 NFPA Fire Analysis and Research, Quincy, MA
Table 3-3.
Reasons for Ineffectiveness When Fire Was Coded as Not Confined and Large Enough to Activate Equipment
and Equipment Was Present in Area of Fire, by Property Use
Based on Estimated Number of 2007-2011 Structure Fires per Year
A. All Sprinklers
Property Use
Water
did
not
reach
fire
Not
enough
water
released
System
Component
damaged
Manual
intervention
defeated
system
Lack
of
maintenance
Inappropriate
system
for
type of
fire
Fires
per
year
All public assembly 69% 21% 0% 0% 5% 5% 41 Eating or drinking establishment 69% 25% 0% 0% 6% 0% 33 All residential 39% 40% 7% 3% 5% 7% 119 Home (including apartment) 40% 35% 8% 3% 6% 9% 102 Store or office 39% 32% 8% 13% 4% 4% 34 Manufacturing facility 39% 26% 9% 9% 13% 6% 62 All structures** 44% 30% 8% 7% 7% 5% 300 * Includes some properties not listed separately above. Note: Percentages are based on structure fires reported in NFIRS Version 5.0 to U.S. municipal fire departments and so exclude fires reported only to Federal or state agencies or industrial fire brigades. Figures reflect recodings explained in Introduction: Fires are excluded if the reason for failure or ineffectiveness is system not present in area of fire. Fires are recoded from operated but ineffective to failed if the reason for failure or ineffectiveness was system shut off. Fires are recoded from failed to operated but ineffective if the reason for failure or ineffectiveness was not enough agent or agent did not reach fire. In Version 5.0 of NFIRS, if multiple systems are present, the system coded is supposed to be the one system designed to protect the hazard where the fire started. This field is not required if the fire did not begin within the designed range of the system. Buildings under construction are excluded. Property use groups are shown only if there were at least 10 fires per year involving failure to operate and 10 fires per year involving operation not effective. Fires reported as confined fires are all treated as fires too small to activate operating equipment. Fires reported with unclassified reason for ineffectiveness, which accounted for 10% of fires with ineffective performance for all structures combined, are treated as cases of unknown reasons for ineffectiveness. Source: NFIRS and NFPA survey.

U.S. Experience With Sprinklers, 6/13 25 NFPA Fire Analysis and Research, Quincy, MA
Table 3-3. (Continued)
Reasons for Ineffectiveness When Fire Was Coded as Not Confined and Large Enough to Activate Equipment
and Equipment Was Present in Area of Fire, by Property Use
Based on Estimated Number of 2007-2011 Structure Fires per Year
B. Wet Pipe Sprinklers Only
Property Use
Water
did
not
reach
fire
Not
enough
water
released
System
component
damaged
Manual
intervention
defeated
system
Lack
of
maintenance
Inappropriate
system
for
type of
fire
Total
fires
per
year
All public assembly 66% 26% 0% 0% 0% 8% 25 Eating or drinking establishment 66% 34% 0% 0% 0% 0% 17 All residential 42% 37% 8% 3% 3% 6% 108 Home (including apartment) 43% 33% 10% 4% 3% 7% 93 Store or office 34% 35% 6% 19% 0% 5% 29 Manufacturing facility 36% 31% 3% 12% 12% 6% 46 All structures* 43% 32% 6% 10% 5% 5% 240 C. Dry Pipe Sprinklers Only
Property Use
Water
did
not
reach
fire
Not
enough
water
released
System
component
damaged
Manual
intervention
defeated
system
Lack
of
maintenance
Inappropriate
system
for
type of
fire
Total
fires
per
year
All structures 42% 27% 11% 0% 12% 8% 33 * Includes some properties not listed above. Note: Percentages are based on structure fires reported in NFIRS Version 5.0 to U.S. municipal fire departments and so exclude fires reported only to Federal or state agencies or industrial fire brigades. Figures reflect recodings explained in Introduction: Fires are excluded if the reason for failure or ineffectiveness is system not present in area of fire. Fires are recoded from operated but ineffective to failed if the reason for failure or ineffectiveness was system shut off. Fires are recoded from failed to operated but ineffective if the reason for failure or ineffectiveness was not enough agent or agent did not reach fire. In Version 5.0 of NFIRS, if multiple systems are present, the system coded is supposed to be the one system designed to protect the hazard where the fire started. This field is not required if the fire did not begin within the designed range of the system. Buildings under construction are excluded. Property use groups are shown only if there were at least 10 fires per year involving failure to operate and 10 fires per year involving operation not effective. Fires reported as confined fires are all treated as fires too small to activate operating equipment. Fires reported with unclassified reason for ineffectiveness, which accounted for 10% of wet pipe sprinkler fires with ineffective performance and 10% of dry pipe sprinkler fires for all structures combined, are treated as cases of unknown reasons for ineffectiveness. Source: NFIRS and NFPA survey.
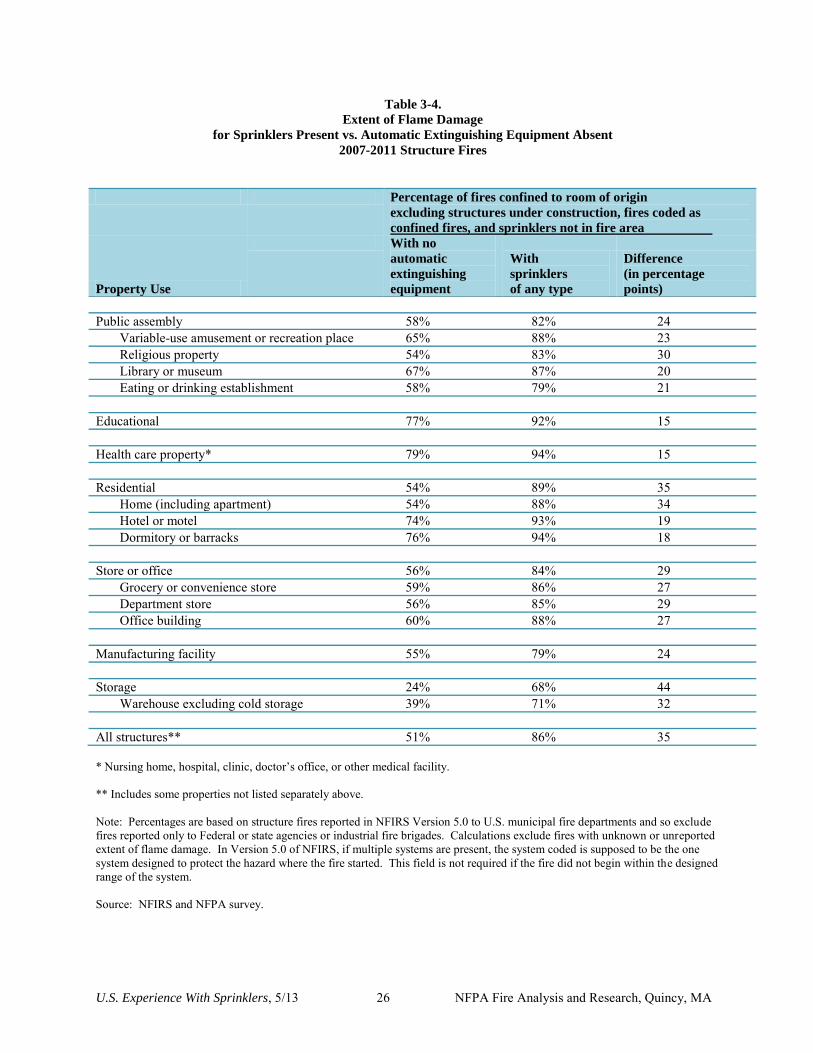
U.S. Experience With Sprinklers, 5/13 26 NFPA Fire Analysis and Research, Quincy, MA
Table 3-4.
Extent of Flame Damage
for Sprinklers Present vs. Automatic Extinguishing Equipment Absent
2007-2011 Structure Fires
Percentage of fires confined to room of origin
excluding structures under construction, fires coded as
confined fires, and sprinklers not in fire area
Property Use
With no
automatic
extinguishing
equipment
With
sprinklers
of any type
Difference
(in percentage
points)
Public assembly 58% 82% 24 Variable-use amusement or recreation place 65% 88% 23 Religious property 54% 83% 30 Library or museum 67% 87% 20 Eating or drinking establishment 58% 79% 21 Educational 77% 92% 15 Health care property* 79% 94% 15 Residential 54% 89% 35 Home (including apartment) 54% 88% 34 Hotel or motel 74% 93% 19 Dormitory or barracks 76% 94% 18 Store or office 56% 84% 29 Grocery or convenience store 59% 86% 27 Department store 56% 85% 29 Office building 60% 88% 27 Manufacturing facility 55% 79% 24 Storage 24% 68% 44 Warehouse excluding cold storage 39% 71% 32 All structures** 51% 86% 35 * Nursing home, hospital, clinic, doctor’s office, or other medical facility. ** Includes some properties not listed separately above. Note: Percentages are based on structure fires reported in NFIRS Version 5.0 to U.S. municipal fire departments and so exclude fires reported only to Federal or state agencies or industrial fire brigades. Calculations exclude fires with unknown or unreported extent of flame damage. In Version 5.0 of NFIRS, if multiple systems are present, the system coded is supposed to be the one system designed to protect the hazard where the fire started. This field is not required if the fire did not begin within the designed range of the system. Source: NFIRS and NFPA survey.

U.S. Experience With Sprinklers, 5/13 27 NFPA Fire Analysis and Research, Quincy, MA
Table 3-5.
Number of Sprinklers Operating, by Type of Sprinkler
2007-2011 Structure Fires
Percentage of structure fires where that many sprinklers operated
Number of
Sprinklers Wet Dry Other type All
Operating pipe pipe sprinkler sprinklers
1 74% 55% 51% 72% 2 or fewer 88% 73% 64% 86% 3 or fewer 92% 80% 72% 91% 4 or fewer 94% 85% 79% 93% 5 or fewer 95% 88% 84% 95% 6 or fewer 96% 90% 87% 96% 7 or fewer 97% 91% 88% 96% 8 or fewer 97% 92% 91% 97% 9 or fewer 97% 92% 91% 97% 10 or fewer 98% 94% 93% 98% 20 or fewer 99% 97% 99% 99% Note: Percentages are based on structure fires reported in NFIRS Version 5.0 to U.S. municipal fire departments and so exclude fires reported only to Federal or state agencies or industrial fire brigades. Percentages are based on fires where sprinklers were reported present and operating and there was reported information on number of sprinklers operating. Figures reflect recodings explained in Introduction: Fires are excluded if the reason for failure or ineffectiveness is system not present in area of fire. Fires are recoded from operated but ineffective to failed if the reason for failure or ineffectiveness was system shut off. Fires are recoded from failed to operated but ineffective if the reason for failure or ineffectiveness was not enough agent or agent did not reach fire. In Version 5.0 of NFIRS, if multiple systems are present, the system coded is supposed to be the one system designed to protect the hazard where the fire started. This field is not required if the fire did not begin within the designed range of the system. Buildings under construction are excluded, as are partial systems and fires reported as confined fires. Source: NFIRS and NFPA survey.

U.S. Experience With Sprinklers, 6/13 28 NFPA Fire Analysis and Research, Quincy, MA
Table 3-6.
Number of Wet Pipe Sprinklers Operating, by Property Use Group
2007-2011 Structure Fires
Percentage of structure fires where the indicated number of wet pipe sprinklers operated
Number of
Sprinklers
Operating
Public
assembly
Home
Hotel
or motel
Store or
office
Manufacturing
facility
Warehouse
excluding
cold storage
1 71% 84% 83% 66% 46% 49% 2 or fewer 88% 94% 95% 84% 67% 73% 3 or fewer 93% 96% 98% 90% 76% 81% 4 or fewer 95% 97% 98% 93% 83% 88% 5 or fewer 96% 98% 98% 94% 86% 89% 6 or fewer 97% 98% 99% 95% 89% 92% 7 or fewer 97% 98% 99% 96% 90% 92% 8 or fewer 98% 99% 99% 97% 91% 93% 9 or fewer 98% 99% 99% 97% 91% 94% 10 or fewer 98% 99% 99% 98% 93% 96% 20 or fewer 99% 100% 100% 99% 97% 98% Note: Percentages are based on structure fires reported in NFIRS Version 5.0 to U.S. municipal fire departments and so exclude fires reported only to Federal or state agencies or industrial fire brigades. Percentages are based on fires where sprinklers were reported present and operating and there was reported information on number of sprinklers operating. Figures reflect recodings explained in Introduction: Fires are excluded if the reason for failure or ineffectiveness is system not present in area of fire. Fires are recoded from operated but ineffective to failed if the reason for failure or ineffectiveness was system shut off. Fires are recoded from failed to operated but ineffective if the reason for failure or ineffectiveness was not enough agent or agent did not reach fire. In Version 5.0 of NFIRS, if multiple systems are present, the system coded is supposed to be the one system designed to protect the hazard where the fire started. This field is not required if the fire did not begin within the designed range of the system. Buildings under construction are excluded, as are partial systems and fires reported as confined fires. Source: NFIRS and NFPA survey.

U.S. Experience With Sprinklers, 3/12 29 NFPA Fire Analysis and Research, Quincy, MA
Table 3-7.
Sprinkler Effectiveness Related to
Number of Sprinklers Operating
2007-2011 Structure Fires
Percent of structure fires where sprinklers are effective
Wet pipe sprinklers Number of
Sprinklers
Operating
All sprinklers
All structures
All
structures
Manufacturing
facility
Warehouse
excluding
cold storage
1 98% 98% 96% 100% 2 95% 95% 96% 97% 3 to 5 92% 93% 94% 96% 6 to 10 81% 80% 87% 96% More than 10 83% 85% 86% 79% Total 96% 96% 94% 97% Note: Percentages are based on structure fires reported in NFIRS Version 5.0 to U.S. municipal fire departments and so exclude fires reported only to Federal or state agencies or industrial fire brigades. Percentages are based on fires where sprinklers were reported present and operating and there was reported information on number of sprinklers operating. Figures reflect recodings explained in Introduction: Fires are excluded if the reason for failure or ineffectiveness is system not present in area of fire. Fires are recoded from operated but ineffective to failed if the reason for failure or ineffectiveness was system shut off. Fires are recoded from failed to operated but ineffective if the reason for failure or ineffectiveness was not enough agent or agent did not reach fire. In Version 5.0 of NFIRS, if multiple systems are present, the system coded is supposed to be the one system designed to protect the hazard where the fire started. This field is not required if the fire did not begin within the designed range of the system. Buildings under construction are excluded as are partial systems. Because fires reported as confined fires are reported without sprinkler performance details or as fires too small to activate operating equipment, confined fires are not included in any analysis involving reliability or effectiveness of automatic extinguishing equipment. Source: NFIRS and NFPA survey.

U.S. Experience With Sprinklers, 6/13 30 NFPA Fire Analysis and Research, Quincy, MA

U.S. Experience With Sprinklers, 6/13 31 NFPA Fire Analysis and Research, Quincy, MA
Section 4. Impact of Sprinklers
A number of approaches can be and have been used to quantify the impact and value of sprinklers. These approaches may be grouped into the following three types:
Reduction in life loss per fire or property loss per fire;
Reduction in the likelihood of large fire size or severity, such as fire spread beyond room of origin, multiple deaths, or large property loss; and
Qualitative judgments as “effective” or “satisfactory” by fire investigators or others
completing incident reports, already discussed in the previous section.
Sprinkler Reduction in Loss of Life in Fire
For 2007-2011 home fires, the death rate per 1,000 fires was 82% lower with wet pipe
sprinklers than with no automatic extinguishing equipment.
Table 4-1 shows fire death rate reductions for various property use groups. Only the statistics for all residential properties and for homes (including apartments) are based on enough fatal fires, both with and without sprinklers, for reasonable confidence in the results. For properties other than homes, deaths tend to be extremely rare, with or without sprinklers. The associated rates of deaths per thousand fires will therefore be very sensitive to individual fires with large death tolls, fatal fires with unusual circumstances, the variability associated with analysis of confined fires, and fires with fatalities or other characteristics misreported. Educational properties are not shown in Table 4-1 because fatal fires are nearly unheard of in such properties, with or without sprinklers. The last major multiple-death school fire (Our Lady of Angels) was a half-century ago, and in recent decades individual fire fatalities at schools have been limited to staff and juvenile firesetters. The factors that make fatal injury possible even when sprinklers are present and operate would include the following, including those shown in Table 4-2:
1. Victims whose actions or lack of action add to their risk by prolonging their exposure to fire conditions, such as victims who (a) act irrationally; (b) go back into the building after safely escaping; (c) are unable to act to save themselves, such as people who are bedridden or under
restraint; or (d) are engaged in firefighting or rescue;
2. Victims of fires that are beyond the design limits of the system, such as fires that were (a) so close that the victim is deemed “intimate with ignition” (a victim condition no longer shown in the data but most closely approximated by “victim in area of fire origin”;

U.S. Experience With Sprinklers, 6/13 32 NFPA Fire Analysis and Research, Quincy, MA
they constituted 97% of fatal victims when sprinklers operated vs. 51% of fatal victims when no automatic extinguishing equipment was present, in Table 4-2); (b) very fast, such as explosions or flash fires; or (c) outside the sprinkler-protected area, such as fires originating on exterior areas of the building; and
3. Victims who are or may be unusually vulnerable to fire effects, such as
(a) older adults, age 65 or older (who constituted 59% of fatal victims when sprinklers operated vs. 30% of fatal victims when no automatic extinguishing equipment was present, in Table 4-2), or (b) people who are in poor health before fire begins.
In group 2 above, although we can no longer identify victims who were intimate with ignition, we can identify victims who were both in the fire area and involved with ignition. Those victims constituted 77% of fatal victims when wet pipe sprinklers operated vs. 39% of fatal victims when no automatic extinguishing equipment was present. “Involved with ignition” does not mean setting the fire. As Table 4-2 also shows, intentional fires account for 14% of fatal fire victims when no automatic extinguishing equipment was present, a much smaller share than the 39% of victims who were in the area of origin and involved in fire origin. When wet pipe sprinklers operated, the 6% of fatal victims who were killed by an intentional fire constituted a much smaller share than the 77% of victims who were in the area of origin and involved in fire origin. Nursing homes are not shown in Table 4-1 because most of their fire fatalities are individual deaths of people with multiple characteristics from the above numbered list. Most victims are located near the point of fire origin and have characteristics that make them much less able to respond effectively to a threatening fire and possibly more vulnerable to fire effects. The value of sprinklers in nursing homes is primarily limited to prevention of multiple deaths, such as the 16 deaths in a 2003 Connecticut nursing home fire and the 14 deaths in a 2003 Tennessee nursing home fire, neither of which involved a sprinklered facility. Such fires are too rare to be picked up in the simple average death rate comparisons in Table 4-1. Sprinkler Reduction in Loss of Property in Fire
For most property uses, the property damage rate per reported structure fire is 38-75%
lower than in properties with no automatic extinguishing equipment when wet pipe
sprinklers are present in structures that are not under construction, after excluding cases
of failure or ineffectiveness because of a lack of sprinklers in the fire area.
Table 4-3 shows a smaller reduction for stores and offices (30%) and no reduction for hotels and motels and for warehouses. As with death rates, loss rates can be very sensitive to individual fires with large losses, large loss fires with unusual circumstances, the variability associated with analysis of confined fires, and fire with losses or other characteristics misreported. Warehouses and hotels and motels appear to illustrate these factors. Two incidents accounted for 60% of the 2007-2011 total estimated direct property damage in warehouse fires with wet pipe

U.S. Experience With Sprinklers, 6/13 33 NFPA Fire Analysis and Research, Quincy, MA
sprinklers present (excluding fires in buildings under construction and fires with sprinklers not in fire area as reported reason for ineffectiveness or failure). The two fires had reported losses of $50 million and $45 million, but neither fire was captured by NFPA’s data base on large-loss fires, which is designed to capture any fire reported in news accounts or other sources as involving at least $5 million in loss. The larger fire was reported to have 600 sprinklers operating, but sprinkler operation was not reported. It would not be surprising if these two fires had loss amounts inadvertently inflated, which would explain why they were not captured by NFPA’s large-loss fire data base, and the larger fire may have had number of sprinklers operating inadvertently inflated as well. If these two fires are removed, the analysis shows an 18% reduction in loss per fire with wet-pipe sprinklers. One fire accounted for most (68%) of the 2007-2011 direct property damage in hotel and motel fires with wet pipe sprinklers present (and excluding buildings under construction and fires coded with sprinklers not in fire area as reason for failure or ineffectiveness). This fire was captured by NFPA’s large-loss fires data base. It was a $100 million Nevada fire where fire began when hot work ignited exterior trim. The complete coverage sprinkler system was reported as effective, and the sprinklers that operated were credited with containing the fire on the 32nd (top) story. If this one fire had been excluded from their analysis, we would have calculated a 55% reduction in loss per fire with wet-pipe sprinklers. In both cases, the influence of a small number of cases or errors and the limitations of gross statistics in these circumstances produce a misleading picture of the impact of sprinklers. It should also be noted that sprinklers are more common in warehouses that are larger and have higher values per square foot. This can mean that the average loss per fire in a sprinklered warehouse will not be a good estimate of the predicted average loss per fire if sprinklers were added to the unsprinklered warehouses, as our calculations implicitly assume. The use of average loss in unsprinklered warehouses as a proxy for average loss in sprinklered warehouses in the absence of sprinklers, as is done in this analysis, will produce a misleadingly low baseline for comparison and so a misleadingly low estimated reduction. Sprinklers cannot be expected to prevent large loss if the large loss was attributable to partial coverage, explosion or flash fire, system shutoff, or the loss of the system to collapse or collision before or early in the fire. In addition, other circumstances can lead to a large loss:
Sprinkler design may not be appropriate to the hazard being protected. In the simplest form, the contents may be capable of supporting a larger, more intense fire than the sprinkler system can handle. The problem may be insufficient sprinkler density or insufficient water flow, which in turn may reflect the system’s design, its age and maintenance, or its supporting water supply. Unlike explosions and flash fires, fire loads can be addressed by appropriate design, installation, maintenance, and operation. Although the effectiveness statement could be phrased to require a fully code-compliant installation, fire incident reports rarely have enough detail to confirm code compliance, and large property-loss fires are less likely than large life-loss fires to receive the detailed fire investigations that could confirm such details.

U.S. Experience With Sprinklers, 6/13 34 NFPA Fire Analysis and Research, Quincy, MA
The nature or configuration of contents may be sufficient to create a large loss even when sprinkler performance is deemed successful. Some bulk goods can shield a deep-seated fire from sprinklers. Rack storage may shield fires from ceiling sprinklers, although in-rack sprinklers should be sufficient to address such problems. High-piled stock may block sprinklers or even permit fire spread on the tops of contents above the sprinklers. And some areas – such as clean rooms – have contents so sensitive and valuable that even a small fire can produce a large financial loss.
Sprinklers should be designed appropriately for the hazard they protect. As an example of engineered design of sprinklers for a space with blocked-storage issues, see the final report from the Fire Protection Research Foundation project on a sprinkler design project for compact mobile shelving systems (go to http://www.nfpa.org, then to Research, then to Fire Protection Research Foundation, then to Reports and Proceedings, then to Suppression, then to Other Sprinkler Protection, then to the Compact Mobile Shelving
System Fire Testing Project Final Report.
A fire with a sufficient number of different points of origin can overwhelm any sprinkler system. Multiple points of origin can occur deliberately in an arson fire, but they can occur unintentionally or naturally, as when an outside fire spreads to numerous entry points in and on a building.
Environmental Benefits of Home Sprinklers
Because sprinklers keep fires smaller and use much less water than fire department hose streams to do so, there is a large favorable effect from sprinklers in the form of reduced fire-related water pollution and greenhouse gas emissions. See http://homefiresprinker.org/green-fire-sprinklers-education for a brief summary of findings from a recent study by FM Global research and a link to the full report of that study.

U.S. Experience With Sprinklers, 6/13 35 NFPA Fire Analysis and Research, Quincy, MA
Table 4-1.
Estimated Reduction in Civilian Deaths per Thousand Fires
Associated With Wet Pipe Sprinklers, by Property Use
2007-2011 Structure Fires
Property Use
Without
automatic
extinguishing
equipment
With
wet pipe
sprinklers
Percent
reduction
All public assembly 0.6 0.0 100% Residential 7.4 1.1 85% Home (including apartment) 7.4 1.3 82% Boarding or rooming house 9.6 1.5 84% Hotel or motel 7.3 0.0 100% Residential board and care home 5.7 0.7 88% Dormitory or barracks 1.1 0.0 100% Store or office 1.5 0.6 62% Manufacturing facility 2.3 0.3 88%
Warehouse excluding cold storage 3.5 1.4 61%
All structures 6.3 0.8 86%
Note: These are national estimates of structure fires reported to U.S. municipal fire departments, based on fires reported in NFIRS Version 5.0, and so exclude fires reported only to Federal or state agencies or industrial fire brigades. Figures exclude fires with sprinkler status unknown or unreported, partial sprinkler systems not in fire area, and structures under construction; and reflect recodings explained in Introduction: Fires are excluded if the reason for failure or ineffectiveness is system not present in area of fire. Fires are recoded from operated but ineffective to failed if the reason for failure or ineffectiveness was system shut off. Fires are recoded from failed to operated but ineffective if the reason for failure or ineffectiveness was not enough agent or agent did not reach fire. In Version 5.0 of NFIRS, if multiple systems are present, the system coded is supposed to be the one system designed to protect the hazard where the fire started. This field is not required if the fire did not begin within the designed range of the system. Source: NFIRS and NFPA survey.

U.S. Experience With Sprinklers, 6/13 36 NFPA Fire Analysis and Research, Quincy, MA
Table 4-2.
Characteristics of Fatal Victims
When Wet Pipe Sprinklers Operate vs. No Automatic Extinguishing Equipment
2007-2011 Structure Fires
Number of fire fatalities per year and
percent of total fire fatalities where victims had indicated characteristics
Victim Characteristic
When wet pipe sprinklers
operate, excluding
sprinklers not in fire area
No automatic
extinguishing
equipment
Victim in area of origin 20 (97%) 1,391 (51%) And involved in fire origin 16 (77%) 1,059 (39%) Not involved in fire origin 4 (20%) 331 (12%) Intentional fire 1 (6%) 371 (14%) Clothing on fire, whether or not 4 (19%) 207 (8%) escaping Victim age 65 or older 12 (59%) 807 (30%) Victim returned to fire, unable to 5 (25%) 557 (20%) act, or acted irrationally Victim physically disabled 3 (17%) 420 (15%) Victim asleep 3 (14%) 781 (29%) Note: Statistics are based on structure fires reported in NFIRS Version 5.0 to U.S. municipal fire departments and so exclude fire reported only to Federal or state agencies or industrial fire brigades. In Version 5.0 of NFIRS, if multiple systems are present, the system coded is supposed to be the one system designed to protect the hazard where the fire started. This field is not required if the fire did not begin within the designed range of the system. Buildings under construction are excluded. Note: Here is an example of how to read this table: Nearly all (97%) the people who died in fires despite the presence of wet-pipe sprinklers were located in the area of fire origin, hence closer to the fire and probably less able to escape than victims located farther from the fire, compared to only 51% of fatal victims in fires with no automatic extinguishing equipment present who were located in the area of fire origin. Source: NFIRS and NFPA survey.

U.S. Experience With Sprinklers, 6/13 37 NFPA Fire Analysis and Research, Quincy, MA
Table 4-3.
Estimated Reduction in Average Direct Property Damage per Fire
Associated With Wet Pipe Sprinklers, by Property Use
2007-2011 Structure Fires
Property Use
Without automatic
extinguishing
equipment
With wet pipe
sprinklers Percent reduction
All public assembly $47,000 $12,000 75% Eating or drinking establishment $53,000 $13,000 75% Educational property $21,000 $8,000 62% Health care property* $14,000 $5,000 65% Residential $20,000 $9,000 56% Home (including apartment) $20,000 $7,000 68% Boarding or rooming house $15,000 $5,000 69% Hotel or motel $31,000 $42,000 No reduction Residential board and care home $6,000 $3,000 57% Dormitory or barracks $4,000 $1,000 65% Store or office $55,000 $38,000 30% Manufacturing facility $145,000 $90,000 38%
Warehouse excluding cold storage $128,000 $262,000 No reduction *Nursing home, hospital, clinic, doctor’s office, or other medical facility. Note: These are national estimates of structure fires reported to U.S. municipal fire departments, based on fires reported in NFIRS Version 5.0, and so exclude fires reported only to Federal or state agencies or industrial fire brigades. Figures exclude fires with sprinkler status unknown or unreported, partial sprinkler systems not in fire area, and structures under construction; and reflect recodings explained in Introduction: Fires are excluded if the reason for failure or ineffectiveness is system not present in area of fire. Fires are recoded from operated but ineffective to failed if the reason for failure or ineffectiveness was system shut off. Fires are recoded from failed to operated but ineffective if the reason for failure or ineffectiveness was not enough agent or agent did not reach fire. Direct property damage is estimated to the nearest thousand dollars and has not been adjusted for inflation. In Version 5.0 of NFIRS, if multiple systems are present, the system coded is supposed to be the one system designed to protect the hazard where the fire started. This field is not required if the fire did not begin within the designed range of the system. Note: Most of the total loss involving sprinklered hotels and motels (68%) was projected from one Nevada fire that began on exterior trim and was stopped by sprinklers operating effectively on the top floor. There was no comparable fire in an unsprinklered hotel and so there was no proper basis for comparison between the two figures. Without that fire, the average loss per fire for sprinklered hotels and motels would have been lower by a factor of three, and we would have calculated a large reduction in average loss per fire due to sprinklers (55%). Note: Most of the total loss involving sprinklered warehouses (60%) was projected from two fires that are not reflected in NFPA’s data base on large-loss fires. It would not be surprising if these two fires had their reported losses inadvertently inflated. Without those fires, we would have calculated an 18% reduction in average loss per fire. Source: NFIRS and NFPA survey.

U.S. Experience With Sprinklers, 6/13 38 NFPA Fire Analysis and Research, Quincy, MA
U.S. Experience With Sprinklers, 6/13 39 NFPA Fire Analysis and Research, Quincy, MA
Section 5. Water Damage from Sprinklers in the Absence of Fire
Sprinkler systems can release water in the absence of fire, but the best available evidence indicates that this is a small source of loss compared to fire losses. For home sprinklers in particular, the threat from non-fire water damage is negligible. Sprinkler systems are carefully designed to activate early in a real fire but not in a non-fire situation. Each sprinkler reacts only to fire conditions in its area. Water release in a fire is generally much less than would occur if the fire department had to suppress the fire, because later action means more fire. A 2010 FM Global Research study of sprinkler versus hose stream water release, in a test space designed to represent an average home, found the following.7 “Comparing the water usage between the two tests, it was found that in order to extinguish the fire, the combination of sprinkler and hose stream discharge from the firefighters was 50% less than the hose stream alone. Additional analysis indicates that the reduction in water use achieved by using sprinklers could be as much as 91% if the results are extrapolated to a full-sized home.” Unintentional release of water in a non-fire activation of a sprinkler appears to be less likely and much less damaging, according to the best available evidence, than is unintentional water release involving other parts of a building's plumbing and water supply, which tends to be both more frequent and more costly per incident.8 NFPA analyzed the number of reported emergency responses in 2003 by U.S. fire departments where the reason for the response was either (a) non-fire unintentional sprinkler activation or (b) non-fire sprinkler activation from a malfunction or failure of the system. The year 2003 was the last one for which the public release file of NFIRS included non-fire incidents. Four property use groups accounted for nearly three-fourths of the reported non-fire sprinkler incidents. See Table 5-A. A sprinkler system can “activate” with no damaging release of water outside the sprinkler system. The most common example is a dry-pipe system that activates by flowing water into the pipes but does not release water outside the system. Such an activation would register in a centrally monitored system and could result in a fire department response. To estimate the fraction of incidents where water is released, an analysis was conducted on uncoded narratives for 2007 non-fire sprinkler incidents from Austin, TX (thanks to Karyl Kinsey) and the states of Minnesota and Massachusetts (thanks to Nora Gierok and Derryl Dion). Table 5-B shows the results, separating incidents confirmed as no water outside the system and, among incidents where water release was possible, those with water release outside the system confirmed.
7 Christopher J. Wieczorek, Benjamin Ditch, and Robert G. Bill, Jr., Technical Report: Environmental Impact of
Automatic Fire Sprinklers, FM Global Research Division, March 2010, p. ii. 8 Walter W. Maybee, “A Brief History of Fire Protection in the United States, Atomic Energy Commission, 1947-1975”, paper presented to the NFPA Fall Meeting, 1978. Paper is not limited to or focused on power plants and like facilities.

U.S. Experience With Sprinklers, 6/13 40 NFPA Fire Analysis and Research, Quincy, MA
Table 5-A. Non-Fire Sprinkler Activations
by Major Property Use Group, 2003
Property Use Reported incidents
Commercial properties (public assembly, 15,900 (36%) stores and offices) Manufacturing facilities 6,800 (15%) Homes (one- or two-family dwellings, 4,700 (11%) apartments) Warehouses excluding cold storage 4,100 (9%) Other property use groups 12,500 (28%) Total 44,000 (100%) Note: Projections from NFIRS to national estimates are based on non-fire emergency responses estimated by Michael Karter from the 2003 Fire Loss Experience Survey. Source: Unpublished analysis by Jennifer D. Flynn, NFPA Fire Analysis and Research Division, January 2008.
Table 5-B. Non-Fire Sprinkler Activations
by Likelihood of Water Release and Major Property Use Group
Warehouses
Type of Commercial Manufacturing excluding
Activation properties facilities Homes cold storage
(Based on:) (726 incidents) (206 incidents) (292 incidents) (165 incidents) No Water Released 50% 55% 50% 50% Definitely no water released except dry pipe system charging or release to drain or outside (45%) (48%) (46%) (44%) Activation with no mention of water flow (5%) (7%) (4%) (6%) outside system Possibly Water Released 50% 45% 50% 50% Break or damage to (29%) (30%) (27%) (38%) component Activation with mention (8%) (4%) (14%) (5%) of water flow release outside system Leak (5%) (2%) (2%) (1%) Freezing (7%) (6%) (6%) (6%) Nearby heat (2%) (2%) (1%) (1%) Total 100% 100% 100% 100% Confirmed water release 16% 7% 21% 12% outside system Source: Analysis of uncoded narratives from reported incidents in Austin (TX), Minnesota, and Massachusetts in 2007.

U.S. Experience With Sprinklers, 6/13 41 NFPA Fire Analysis and Research, Quincy, MA
If the confirmed water release percentages shown in Table 5-B are applied to the non-fire sprinkler incidents in Table 5-A, and the resulting water-damage incidents are compared to the 2003-2006 annual average number of fires where sprinklers were present in the same properties, then one can obtain a basis for comparison. Non-fire sprinkler incidents with confirmed water release outside the system, as a percentage of fire incidents where sprinklers operated, were as follows:
34% for commercial properties, 13% for manufacturing facilities, 5% for homes (including apartments), and 25% for warehouses excluding cold storage.
While the NFIRS reports do not include any estimates of dollar damage, only a handful of incidents mentioned extensive water damage. It seems likely that the average damage per non-fire sprinkler incident is considerably less than the average damage per fire incident in sprinklered properties. Even without any such adjustment, the percentages above are comparable to the estimate of 25% made by Marryatt based on mid-1980s data from sprinkler installations in Australia and New Zealand.9 Also, the Minnesota and Massachusetts incidents that dominate the combined data base probably reflect a bigger problem with freezing conditions than is true for the country as a whole. Roughly half of the commercial property confirmed water release incidents and roughly half of the warehouse incidents involved either freezing as a cited factor or a month of occurrence during December to February. Therefore, these two percentages would probably be somewhat lower if data with representative weather conditions were available. Whatever the actual rate for these incidents, many of them can be readily prevented by better design or safer practices. Common factors in component breaks are:
Exposure to freezing conditions, Damage from forklifts or other large vehicles, Misuse of sprinklers, notably their use as hangers or as a base for anchoring hangers, Damage by construction or similar workers, Vandalism or horseplay in the vicinity of sprinklers, and Damage from impact by large doors.
Non-fire activations can also be prevented by better design or safer practices. Common factors in such activations are:
Proximity to very high levels of ambient heat, like that produced by certain manufacturing processes, or
Testing or maintenance not conducted according to standard, resulting in water surge or alarm activation
9 H.W. Marryatt, Fire: A Century of Automatic Sprinkler Protection in Australia and New Zealand, 1886-1986, 2nd edition, Victoria, Australia: Australian Fire Protection Association, 1988, p. 435.

U.S. Experience With Sprinklers, 6/13 42 NFPA Fire Analysis and Research, Quincy, MA

U.S. Experience With Sprinklers, 6/13 43 NFPA Fire Analysis and Research, Quincy, MA
Section 6. Other Issues Related to Home Fire Sprinklers
Myths About Sprinklers
Much of the resistance to wider use of sprinklers stems from a cluster of concerns that are not so much issues as myths. Most Americans have had little contact with sprinkler systems outside of their portrayal in movies and television shows, where sprinklers all too often are portrayed inaccurately. One myth has to do with the likelihood or severity of water damage, which was discussed in Section 5 and is especially small for home fire sprinklers. A second myth has to do with aesthetics. People outside the fire community may think of the exposed pipe and sprinkler arrays that are common in some large manufacturing facilities. Inconspicuously mounted sprinklers, which are already common in offices and hotels and are available for homes, need to be better publicized. A third myth has to do with the risk of death, serious injury or significant property damage in fire. This was the principal reason cited by people without smoke alarms 30 years ago, when home smoke alarms were still rare, to explain why they did not have smoke alarms. If sprinklers are an excellent solution to a problem you (wrongly) think you do not have, then that would naturally reduce your interest in sprinklers and your sense of their value. A fourth myth has to do with the affordability of sprinklers. Sprinklers are not inexpensive, although their effectiveness, documented earlier, means most people will find them cost-effective. This often can be incorporated into reduced insurance costs and incentives applied by community planners in new developments. A 2008 study, conducted by Newport Partners under sponsorship of the Fire Protection Research Foundation, developed comprehensive and all-inclusive cost estimates for 30 diverse house plans in 10 communities.10 Cost per sprinklered square foot ranged from $0.38 to $3.66, with an average (mean) of $1.61 and a median of $1.42. Variables associated with higher cost systems included:
Extensive use of copper piping instead of CPVC or PEX plastic; On-site water supply (such as well water) instead of municipal water supply; Local requirements to sprinkler areas, like garages or attics, where coverage is not
required under NFPA 13D; Local sprinkler ordinances in effect for less than five years, or too brief a time for
market acceptance, increased competition, and resulting lower prices to take hold; and
Local sprinkler permit fees that are higher than the norm.
10 Newport Partners, Home Fire Sprinkler Cost Assessment – Final Report, Fire Protection Research Foundation, Quincy, MA, September 2008, pp. iv and 6.

U.S. Experience With Sprinklers, 6/13 44 NFPA Fire Analysis and Research, Quincy, MA
A 1977 survey done for the U.S. Fire Administration, back when only 22% of U.S. homes had smoke alarms, found that 74% of households with smoke alarms were very concerned about fire compared to only 45% of households that had no smoke alarms and no intention of obtaining smoke alarms. For households without smoke alarms, whether or not they intended to obtain smoke alarms, the leading reason cited for not having obtained one was no perception of need (don’t need one – 16%; no interest in one – 16%) and the second leading reason was cost (too expensive – 23%; not worth the money – 1%). These are the same reasons, in the same order, cited today by people not intending to obtain home fire sprinklers today.11 In survey after survey, we find that people’s perceptions and reasoning align for consistency with their actions. It is impossible today to believe that a large segment of the public once objected to smoke alarms on the basis of cost, but early in their adoption, it was true. The more people learn about home fire sprinklers, the more they are attracted to them, and there is no reason to expect this trend to stop. In fact, there is evidence that many homeowners are getting past these dated perceptions and moving on to more fact-based and positive views of home fire sprinklers. The Home Fire Sprinkler Coalition sponsored a December 2005 survey by Harris Interactive®.12 Among the findings were that 45% of homeowners considered a sprinklered home more desirable than an unsprinklered home, that 69% believe a fire sprinkler system increases the value of a home, that 38% say they would be more likely to purchase a new home with sprinklers than one without, and that 43% would be more likely to have home fire sprinklers installed if the cost could be included in the mortgage. These read like the emerging perceptions of a nation that sees value for the cost of home fire sprinklers and sees ways to handle that cost within their home-buying budget. Costs and Benefits of Sprinklers
Ever since the late 1970s, when traditional sprinkler technology and design were modified to operate effectively to protect lives in the smaller spaces of a typical home, there have been cost-benefit studies intended to direct and support national policy decisions on the value and need for home fire sprinklers. Similar analyses have been performed for home smoke alarms, fire-safe cigarettes, and mattresses and upholstered furniture with improved fire performance. Cost-benefit studies of home sprinklers have been conducted all over the world. Enough such studies have now been performed that it is possible to identify certain recurring erroneous or controversial choices and assumptions in most of these studies. 1. Sprinkler benefits are often under-estimated.
Sprinklers produce large reductions in deaths per thousand fires and in direct property damage per fire. However, sprinkler usage in homes is still so limited that there is not enough data on fires in single family homes with and without sprinklers. The best approach is to use data on all housing units, including multi-unit housing, because the spaces and causes of fires are very
11 Based on 2007 slide presentation of results of NAHB National Survey, conducted August 14-15, 2006, by Public Opinion Strategies, #06811. 12 See a summary of findings in a press release at http://www.homefiresprinkler.org/release/HarrisPoll.html.

U.S. Experience With Sprinklers, 6/13 45 NFPA Fire Analysis and Research, Quincy, MA
similar, and even the sprinkler design standards have similar differences from the traditional sprinkler standard. Some cost-benefit analyses have instead estimated benefits indirectly by estimating the fraction of fires where sprinklers will definitely activate. This approach produces a conservatively low estimate of sprinkler impact because it assigns none of the uncertainty of the calculation to the credit of sprinklers. Some cost-benefit analyses ignore all sprinkler impacts except the impact on death rates. Even if the principal rationale for home sprinklers is life safety, a proper cost-benefit analysis should capture all likely benefits just as it should capture all likely costs. In particular, the impact on property damage is a substantial part of the predictable benefit of sprinkler usage. Impacts on civilian injuries, firefighter deaths and injuries, and indirect loss (such as the cost of temporary housing) are less substantial and less certain; it is less essential to include these impacts in order to have a proper estimate of benefits. This is even more true for controversial trade-offs that are sometimes proposed, such as higher allowable housing density (which means smaller minimum allowable lot sizes and smaller minimum allowable building separation distances.) It is better not to include benefits like these in a base case cost-benefit analysis, although it may be useful to include them in a sensitivity analysis. In statistical analyses of property damage, the available data typically documents damage due to fire and omits damage due to water or firefighting. Some cost-benefit analyses attempt to add losses due to water damage from sprinklers in response to fire. These estimates are inappropriate for a couple of reasons. Sprinkler water damage, when it occurs, is far more than offset by reduced damage from water from fire hoses. If firefighting water damage is included in the calculation, it should be as an additional benefit from sprinklers. 2. Sprinkler costs are often over-estimated.
The base cost for home sprinklers is the installed cost per square foot. Many cost-benefit analyses have used exaggerated base costs. The extra cost may arise from the inclusion of design elements – such as copper piping, backflow preventers, or water demand charges – that are not required by a standard home sprinkler installation. The extra cost may also reflect exaggerated labor costs, labor hours, profit margins, and markups estimated by people who are setting estimates to avoid the work in question, not to compete for it. Recurring costs (such as inspection and maintenance) also tend to be exaggerated because the estimates do not reflect the substantial differences between the needs of a standard design for homes and the needs of a standard design for a traditional commercial system. An NFPA 13D system does not require professional inspection or maintenance. Water damage from non-fire activations are also included as a recurring cost in many cost-benefit analyses. These cost estimates tend to be highly speculative because, until recently, there has been no statistical data to anchor the estimates in reality. Special-study statistical analysis by NFPA (presented and discussed in Section 5) provides that missing data and shows that damage from non-fire water releases is much less, relative to annual fire damage, than had been widely assumed. Non-fire water damage is especially low for home sprinklers.
U.S. Experience With Sprinklers, 6/13 46 NFPA Fire Analysis and Research, Quincy, MA
3. Cost and benefit estimates often fail to fully reflect the characteristics of an NFPA 13D
standard design for home sprinklers.
Installed costs per square foot, the need for and cost of maintenance, water usage, the frequency of non-fire water releases, and the speed of reaction and impact on fire loss (human and property), all are significantly different and more favorable with standard home installations. A cost-benefit analysis that does not properly reflect the characteristics of the equipment it seeks to evaluate cannot be accurate. 4. In accounting for time, many cost-benefit analyses ignore or under-value out-year
sprinkler benefits.
Sprinklers are a fire safety strategy where all or nearly all the costs occur at the outset while the benefits are spaced out over the life of the system. Cost-benefit analyses normally employ a study period of fixed duration. Sprinklers will operate effectively as installed for more than 50 years. Use of a shorter period for analysis is equivalent to inappropriately under-estimating the benefits of sprinklers. Even if sprinkler costs are incorporated into a home mortgage and spaced out over the life of the mortgage, sprinkler benefits will last decades longer. A related issue is the controversy over whether to apply a discount rate to future lives saved. The rationale for the use of discount rates is based on the obvious preference people have for a dollar to spend today over a dollar to spend next year. However, the extension of discount rates to something like human life is not straightforward and remains controversial. The use of a discount rate where one should not be used or the use of an exaggerated rate will reduce the present value of out-year benefits and so under-estimate sprinkler benefits. 5. Baseline conditions used to evaluate sprinklers are often unrealistic.
A cost-benefit analysis needs to compare costs and benefits with home sprinklers to costs and benefits in a baseline situation. The baseline does not have to be the status quo, but if it is different, then its characteristics, costs and benefits need to be realistically and appropriately developed. Several cost-benefit analyses have chosen to use a baseline of universal working smoke alarms. This is not the status quo. Many smoke alarms are not working, and it would require significant technology upgrades and/or universal distribution of very effective educational programs to achieve universal operationality. Use of this alternative as a baseline for comparison without incorporation of the significant costs required to achieve the condition is at best seriously misleading and at worst deceptive. The perception that sprinklers cost too much or cost more than they are worth is so widespread that, unfortunately, many intelligent, well-meaning fire safety professionals do not look closely enough at a series of calculations that claim to confirm the point. Most fire safety policy questions are complex and involve the balancing of various benefits and costs. Fire safety professionals should make sure that they apply the best science and the best data to every policy question. When open-minded fire safety professionals meet that standard on the question of home sprinklers, they see that home sprinklers are a good choice.
U.S. Experience With Sprinklers, 6/13 47 NFPA Fire Analysis and Research, Quincy, MA
Section 7. Concluding Points
Fire sprinklers are highly reliable and effective elements of total system designs for fire protection in buildings. They save lives and property, producing large reductions in the number of deaths per thousand fires, in average direct property damage per fire, and especially in the likelihood of a fire with large loss of life or large property loss. Excluding fires too small to activate a sprinkler and cases of failure or ineffectiveness because of a lack of sprinklers in the fire area, wet pipe sprinklers operated in 92% of reported structure fires and operated effectively in 89% of fires. Three out of five (60%) of the failures occurred because the system had been shut off. There are certain fire situations where even a complete sprinkler system will have limited impact: (a) Explosions and flash fires that may overpower the system; (b) Fires that begin very close to a person (e.g., clothing ignition) or unusually sensitive and expensive property (e.g., an art gallery) where fatal injury or substantial property loss can occur before sprinklers can react; and (c) Fires that originate in unsprinklered areas (e.g., concealed wall spaces) or adjacent properties (e.g., exposure fires), which may grow to unmanageable size outside the range of the sprinkler system. These situations can arise when (a) sprinkler standards are based on design fires less severe than explosions or flash fires, as is the case for explosions in the NFPA 13, NFPA 13D, and NFPA 13R standards; (b) sprinkler objectives are defined in terms of a design fire area larger than the distance implied by a victim intimate with ignition; or (c) sprinkler standards exclude certain potential areas of fire origin from their definition of complete coverage, which is typically but not always the case. Sprinkler systems are so effective that it can be tempting to overstate just how effective they are. For example, some sprinkler proponents have focused too narrowly on the reliability of the components of the sprinkler system itself. If this were the only concern in sprinkler performance, then there would be little reason for concern at all, but human error is a relevant problem. On the other hand, human error is not a problem unique to sprinklers. In fact, all forms of active and passive fire protection tend to show more problems with human error than with intrinsic mechanical or electrical reliability. It is important for all concerned parties to (a) distinguish between human and mechanical problems because they require different strategies; (b) include both as concerns to be addressed when deciding when and how to install, maintain, and rely on sprinklers and other automatic extinguishing systems; (c) strive to use performance analysis in assessing any other element of fire protection; and (d) remember that the different elements of fire protection support and reinforce one another and so must always be designed and considered as a system.
Because sprinkler systems are sophisticated enough to require competent fire protection engineering and function best in buildings where there is a complete integrated system of

U.S. Experience With Sprinklers, 6/13 48 NFPA Fire Analysis and Research, Quincy, MA
fire protection, it is especially important that proper procedures be used in the installation and maintenance of sprinkler systems. This means careful adherence to the relevant standards:
NFPA 13, Standard for the Installation of Sprinkler Systems; NFPA 13D, Standard for the Installation of Sprinkler Systems in One- and Two-
Family Dwellings and Manufactured Homes; NFPA 13R, Standard for the Installation of Sprinkler Systems in Residential
Occupancies Up to and Including Four Stories in Height; and NFPA 25, Standard for the Inspection, Testing and Maintenance of Water-Based
Fire Protection Systems. Because sprinkler systems are so demonstrably effective, they can make a major contribution to fire protection in any property. NFPA 101®, Life Safety Code; NFPA 1, Fire Code; and NFPA 5000®, Building Construction and Safety Code, have required sprinklers in all new one- and two-family homes, all nursing homes, and many nightclubs since the 2006 editions. The 2009 edition of the International Residential Code also added requirements for sprinklers in one- or two-family dwellings, effective January 2011. This protection can be expected to increase in areas that adopt and follow these revised codes. For more on NFPA’s Fire Sprinkler Initiative, go to http://www.firesprinklerinitiative.org. For relevant research on sprinklers, go to http://www.nfpa.org, then to Research, then Fire Protection Research Foundation, then Reports and Proceedings, then Suppression.

U.S. Experience With Sprinklers, 6/13 49 NFPA Fire Analysis and Research, Quincy, MA
Section 8. Summary by Property Use
This section summarizes key facts for each of several property use groups. Homes* (Including Apartments)
In 2007-2011, 6% of reported home structure fires** indicated some type of
sprinkler was present (89% wet pipe, 8% dry pipe, 2% other).
The 2009 American Housing Survey reported that 5% of occupied year-round housing units had sprinklers. The percentage was higher for housing units in multi-unit buildings (13%) than for single family homes (2%).
Wet pipe sprinklers operated in 95% of fires and operated effectively in 92% of fires.*** When failure occurred, leading reasons were system shutoff (62%) and manual intervention defeated system (19%). When operating equipment was ineffective, leading reasons were water did not reach fire (43%), not enough water released (33%), and component damaged (10%).
Only one or two sprinklers operated in 94% of reported fires where wet pipe sprinklers operated.
In homes, deaths per thousand reported fires were 82% lower when wet pipe sprinklers were present, compared to fires with no automatic extinguishing equipment present.
In homes, direct property damage per reported fire was 68% lower when wet pipe sprinklers were present, compared to fires with no automatic extinguishing equipment present.
* Home includes single family homes, duplexes, rowhouses, apartments, flats, and manufactured homes. ** Excluding buildings under construction. *** Estimates of reliability and effectiveness are based only on fires and installations where the fire should have activated and been controlled by an operational system, therefore excluding buildings under construction, fires with sprinklers not in fire area reported as reason for failure or ineffectiveness, fires reported as too small to activate equipment, and fires reported as confined to cooking vessel, chimney or flue, fuel burner or boiler, commercial compactor, incinerator, or trash. Source: 2007-2011 NFIRS and NFPA survey except where noted.

U.S. Experience With Sprinklers, 6/13 50 NFPA Fire Analysis and Research, Quincy, MA
Hotels and Motels
In 2007-2011, 52% of reported hotel or motel structure fires* indicated some type
of sprinkler was present (90% wet pipe, 7% dry pipe, 3% other).
Wet pipe sprinklers operated in 91% of fires and operated effectively in 89% of fires.**
Only one or two sprinklers operated in 95% of reported fires where wet pipe sprinklers operated.
In hotels and motels, deaths per thousand reported fires were 100% lower when wet pipe sprinklers were present, compared to fires with no automatic extinguishing equipment present.
* Excluding buildings under construction. ** Estimates of reliability and effectiveness are based only on fires and installations where the fire should have activated and been controlled by an operational system, therefore excluding buildings under construction, fires with sprinklers not in fire area reported as reason for failure or ineffectiveness, fires reported as too small to activate equipment, and fires reported as confined to cooking vessel, chimney or flue, fuel burner or boiler, commercial compactor, incinerator, or trash. Source: 2007-2011 NFIRS and NFPA survey except where noted.
U.S. Experience With Sprinklers, 6/13 51 NFPA Fire Analysis and Research, Quincy, MA
Public Assembly Properties
In 2007-2011, 23% of reported public assembly structure fires* indicated some
type of sprinkler was present (82% wet pipe, 8% dry pipe, 10% other). In properties with more than one type of automatic extinguishing equipment present, only the type closest to the fire is reported, which means sprinklers may also have been present in some of the 30% of public assembly structure fires where some type of automatic extinguishing equipment other than sprinklers was reported present.
Wet pipe sprinklers operated in 92% of fires and operated effectively in 88% of
fires.** When failure occurred, leading reasons were system shutoff (55%) and manual intervention defeated system (18%). When operating equipment was ineffective, leading reasons were water did not reach fire (66%) and not enough water released (26%).
Only one or two sprinklers operated in 88% of reported fires where wet pipe sprinklers operated.
In public assembly properties, deaths per thousand reported fires were 100% lower when wet pipe sprinklers were present, compared to fires with no automatic extinguishing systems present.
In public assembly properties, direct property damage per reported fire was 75% lower when wet pipe sprinklers were present, compared to fires with no automatic extinguishing equipment present.
* Excluding buildings under construction. ** Estimates of reliability and effectiveness are based only on fires and installations where the fire should have activated and been controlled by an operational system, therefore excluding buildings under construction, fires with sprinklers not in fire area reported as reason for failure or ineffectiveness, fires reported as too small to activate equipment, and fires reported as confined to cooking vessel, chimney or flue, fuel burner or boiler, commercial compactor, incinerator, or trash. Note: Public assembly properties include eating or drinking establishments, places of worship, theaters, libraries and museums, passenger terminals, and fixed or variable use entertainment properties, including stadiums, arenas, and concert halls. Source: 2007-2011 NFIRS and NFPA survey except where noted.
U.S. Experience With Sprinklers, 6/13 52 NFPA Fire Analysis and Research, Quincy, MA
Eating or Drinking Establishments
In 2007-2011, 23% of reported eating or drinking establishment structure fires*
indicated some type of sprinkler was present (79% wet pipe, 7% dry pipe, 14% other). In properties with more than one type of automatic extinguishing equipment present, only the type closest to the fire is reported, which mean sprinklers may have been present in some of the 40% of eating and drinking establishment structure fires where some type of automatic extinguishing equipment other than sprinklers was reported present.
Wet pipe sprinklers operated in 93% of fires and operated effectively in 88% of
fires.** When failure occurred, leading reasons were system shutoff (50%) and manual intervention defeated system (15%). When operating equipment was ineffective, leading reasons were water did not reach fire (66%) and not enough water released (34%).
In eating or drinking establishments, direct property damage per reported fire was 75% lower when wet pipe sprinklers were present, compared to fires with no automatic extinguishing equipment present.
* Excluding buildings under construction. ** Estimates of reliability and effectiveness are based only on fires and installations where the fire should have activated and been controlled by an operational system, therefore excluding buildings under construction, fires with sprinklers not in fire area reported as reason for failure or ineffectiveness, fires reported as too small to activate equipment, and fires reported as confined to cooking vessel, chimney or flue, fuel burner or boiler, commercial compactor, incinerator, or trash. Source: 2007-2011 NFIRS and NFPA survey except where noted.

U.S. Experience With Sprinklers, 6/13 53 NFPA Fire Analysis and Research, Quincy, MA
Educational Properties
In 2007-2011, 36% of reported educational property structure fires* indicated
some type of sprinklers was present (89% wet pipe, 9% dry pipe, 2% other).
Wet pipe sprinklers operated in 87% of fires and operated effectively in 84% of fires.**
In educational properties, direct property damage per reported fire was 62% lower when wet pipe sprinklers were present, compared to fires with no automatic extinguishing equipment present.
* Excluding buildings under construction. ** Estimates of reliability and effectiveness are based only on fires and installations where the fire should have activated and been controlled by an operational system, therefore excluding buildings under construction, fires with sprinklers not in fire area reported as reason for failure or ineffectiveness, fires reported as too small to activate equipment, and fires reported as confined to cooking vessel, chimney or flue, fuel burner or boiler, commercial compactor, incinerator, or trash. Source: 2007-2011 NFIRS and NFPA survey except where noted.

U.S. Experience With Sprinklers, 6/13 54 NFPA Fire Analysis and Research, Quincy, MA
Health Care Properties
In 2007-2011, 57% of reported health care property structure fires* indicated
some type of sprinkler was present (86% wet pipe, 11% dry pipe, 3% other).
Wet pipe sprinklers operated in 87% of fires and operated effectively in 85% of fires.**
In health care properties, direct property damage per reported fire was 65% lower when wet pipe sprinklers were present, compared to fires with no automatic extinguishing equipment present.
The category of health care properties includes a number of specific property types that were excluded or not specifically identified in NFIRS prior to 1999. The excluded properties are doctor’s offices. The properties not specifically identified are: Ambulatory care facility Development disability facility Alcohol or substance abuse recovery center Hospice Hemodialysis unit Some properties that were specifically identified prior to 1999 are not specifically identified now: Sanatorium or sanitarium Institution for deaf, mute, or blind Institution for physical rehabilitation
* Excluding buildings under construction. ** Estimates of reliability and effectiveness are based only on fires and installations where the fire should have activated and been controlled by an operational system, therefore excluding buildings under construction, fires with sprinklers not in fire area reported as reason for failure or ineffectiveness, fires reported as too small to activate equipment, and fires reported as confined to cooking vessel, chimney or flue, fuel burner or boiler, commercial compactor, incinerator, or trash. Source: 2007-2011 NFIRS and NFPA survey except where noted.

U.S. Experience With Sprinklers, 6/13 55 NFPA Fire Analysis and Research, Quincy, MA
Stores and Offices
In 2007-2011, 24% of reported store and office structure fires* indicated some
type of sprinkler was present (87% wet pipe, 10% dry pipe, 3% other).
Wet pipe sprinklers operated in 91% of fires and operated effectively in 88% of fires.** When failure occurred, leading reasons were system shutoff (57%) and manual intervention defeated system (19%). When operating equipment was ineffective, leading reasons were not enough water released (35%), water did not reach fire (34%), and manual intervention defected system (19%).
Only one or two sprinklers operated in 84% of reported fires where wet pipe sprinklers operated.
In stores and offices, deaths per thousand reported fires were 62% lower when wet pipe sprinklers were present, compared to fires with no automatic extinguishing equipment present.
In stores and offices, direct property damage per reported fire was 30% lower when wet pipe sprinklers were present, compared to fires with no automatic extinguishing equipment present.
* Excluding buildings under construction. ** Estimates of reliability and effectiveness are based only on fires and installations where the fire should have activated and been controlled by an operational system, therefore excluding buildings under construction, fires with sprinklers not in fire area reported as reason for failure or ineffectiveness, fires reported as too small to activate equipment, and fires reported as confined to cooking vessel, chimney or flue, fuel burner or boiler, commercial compactor, incinerator, or trash. Source: 2007-2011 NFIRS and NFPA survey except where noted.

U.S. Experience With Sprinklers, 6/13 56 NFPA Fire Analysis and Research, Quincy, MA
Manufacturing Facilities
In 2007-2011, 48% of reported manufacturing facility structure fires* indicated
some type of sprinkler was present (85% wet pipe, 12% dry pipe, 3% other).
Wet pipe sprinklers operated in 91% of the fires and operated effectively in 86% of the fires.** When failure occurred, leading reasons were system shutoff (62%) and manual intervention defeated system (20%). When operating equipment was ineffective, leading reasons were water did not reach fire (36%) and not enough water released (31%).
Only one or two sprinklers operated in 67% of reported fires where wet pipe sprinklers operated.
In manufacturing facilities, deaths per thousand reported fires were 88% lower when wet pipe sprinklers were present, compared to fires with automatic extinguishing equipment present.
In manufacturing facilities, direct property damage per reported fire was 38% lower when wet pipe sprinklers were present, compared to fires with no automatic extinguishing equipment present.
* Excluding buildings under construction. ** Estimates of reliability and effectiveness are based only on fires and installations where the fire should have activated and been controlled by an operational system, therefore excluding buildings under construction, fires with sprinklers not in fire area reported as reason for failure or ineffectiveness, fires reported as too small to activate equipment, and fires reported as confined to cooking vessel, chimney or flue, fuel burner or boiler, commercial compactor, incinerator, or trash. Source: 2007-2011 NFIRS and NFPA survey except where noted.

U.S. Experience With Sprinklers, 6/13 57 NFPA Fire Analysis and Research, Quincy, MA
Warehouses Excluding Cold Storage
In 2007-2011, 32% of structure fires in warehouses (excluding cold storage)
reported some type of sprinkler was present (79% wet pipe, 20% dry pipe, 1% other).
Wet pipe sprinklers operated in 86% of fires and operated effectively in 84% of
fires.**
Only one or two sprinklers operated in 73% of reported fires where wet pipe sprinklers operated.
In warehouses excluding cold storage, deaths per thousand reported fires were 61% lower when wet pipe sprinklers were present, compared to fires with no automatic extinguishing equipment present.
* Excluding buildings under construction. ** Estimates of reliability and effectiveness are based only on fires and installations where the fire should have activated and been controlled by an operational system, therefore excluding buildings under construction, fires with sprinklers not in fire area reported as reason for failure or ineffectiveness, fires reported as too small to activate equipment, and fires reported as confined to cooking vessel, chimney or flue, fuel burner or boiler, commercial compactor, incinerator, or trash. Source: 2007-2011 NFIRS and NFPA survey except where noted.

U.S. Experience With Sprinklers, 6/13 58 NFPA Fire Analysis and Research, Quincy, MA

U.S. Experience With Sprinklers, 6/13 59 NFPA Fire Analysis and Research, Quincy, MA
Appendix A. How National Estimates Statistics Are Calculated
The statistics in this analysis are estimates derived from the U.S. Fire Administration’s (USFA’s) National Fire Incident Reporting System (NFIRS) and the National Fire Protection Association’s (NFPA’s) annual survey of U.S. fire departments. NFIRS is a voluntary system by which participating fire departments report detailed factors about the fires to which they respond. Roughly two-thirds of U.S. fire departments participate, although not all of these departments provide data every year. Fires reported to federal or state fire departments or industrial fire brigades are not included in these estimates. NFIRS provides the most detailed incident information of any national database not limited to large fires. NFIRS is the only database capable of addressing national patterns for fires of all sizes by specific property use and specific fire cause. NFIRS also captures information on the extent of flame spread, and automatic detection and suppression equipment. For more information about NFIRS visit http://www.nfirs.fema.gov/. Copies of the paper forms may be downloaded from http://www.nfirs.fema.gov/documentation/design/NFIRS_Paper_Forms_2008.pdf. NFIRS has a wide variety of data elements and code choices. The NFIRS database contains coded information. Many code choices describe several conditions. These cannot be broken down further. For example, area of origin code 83 captures fires starting in vehicle engine areas, running gear areas or wheel areas. It is impossible to tell the portion of each from the coded data. Methodology may change slightly from year to year.
NFPA is continually examining its methodology to provide the best possible answers to specific questions, methodological and definitional changes can occur. Earlier editions of the same report may have used different methodologies to
produce the same analysis, meaning that the estimates are not directly
comparable from year to year.
NFPA’s fire department experience survey provides estimates of the big
picture.
Each year, NFPA conducts an annual survey of fire departments which enables us to capture a summary of fire department experience on a larger scale. Surveys are sent to all municipal departments protecting populations of 50,000 or more and a random sample, stratified by community size, of the smaller departments. Typically, a total of roughly 3,000 surveys are returned, representing about one of every ten U.S. municipal fire departments and about one third of the U.S. population. The survey is stratified by size of population protected to reduce the uncertainty of the final estimate. Small rural communities have fewer people protected per

U.S. Experience With Sprinklers, 6/13 60 NFPA Fire Analysis and Research, Quincy, MA
department and are less likely to respond to the survey. A larger number must be surveyed to obtain an adequate sample of those departments. (NFPA also makes follow-up calls to a sample of the smaller fire departments that do not respond, to confirm that those that did respond are truly representative of fire departments their size.) On the other hand, large city departments are so few in number and protect such a large proportion of the total U.S. population that it makes sense to survey all of them. Most respond, resulting in excellent precision for their part of the final estimate. The survey includes the following information: (1) the total number of fire incidents, civilian deaths, and civilian injuries, and the total estimated property damage (in dollars), for each of the major property use classes defined in NFIRS; (2) the number of on-duty firefighter injuries, by type of duty and nature of illness; 3) the number and nature of non-fire incidents; and (4) information on the type of community protected (e.g., county versus township versus city) and the size of the population protected, which is used in the statistical formula for projecting national totals from sample results. The results of the survey are published in the annual report Fire Loss in the United States. To download a free copy of the report, visit http://www.nfpa.org/assets/files/PDF/OS.fireloss.pdf.
Projecting NFIRS to National Estimates
As noted, NFIRS is a voluntary system. Different states and jurisdictions have different reporting requirements and practices. Participation rates in NFIRS are not necessarily uniform across regions and community sizes, both factors correlated with frequency and severity of fires. This means NFIRS may be susceptible to systematic biases. No one at present can quantify the size of these deviations from the ideal, representative sample, so no one can say with confidence that they are or are not serious problems. But there is enough reason for concern so that a second database -- the NFPA survey -- is needed to project NFIRS to national estimates and to project different parts of NFIRS separately. This multiple calibration approach makes use of the annual NFPA survey where its statistical design advantages are strongest. Scaling ratios are obtained by comparing NFPA’s projected totals of residential structure fires, non-residential structure fires, vehicle fires, and outside and other fires, and associated civilian deaths, civilian injuries, and direct property damage with comparable totals in NFIRS. Estimates of specific fire problems and circumstances are obtained by multiplying the NFIRS data by the scaling ratios. Reports for incidents in which mutual aid was given are excluded from NFPA’s analyses. Analysts at the NFPA, the USFA and the Consumer Product Safety Commission developed the specific basic analytical rules used for this procedure. "The National Estimates Approach to U.S. Fire Statistics," by John R. Hall, Jr. and Beatrice Harwood, provides a more detailed explanation of national estimates.

U.S. Experience With Sprinklers, 6/13 61 NFPA Fire Analysis and Research, Quincy, MA
Version 5.0 of NFIRS, first introduced in 1999, used a different coding structure for many data elements, added some property use codes, and dropped others. The essentials of the approach described by Hall and Harwood are still used, but some modifications have been necessary to accommodate the changes in NFIRS 5.0. Figure A.1 shows the percentage of fires originally collected in the NFIRS 5.0 system. Each year’s release version of NFIRS data also includes data collected in older versions of NFIRS that were converted to NFIRS 5.0 codes.
Figure A.1. Fires Originally Collected in NFIRS 5.0 by Year
From 1999 data on, analyses are based on scaling ratios using only data originally collected in NFIRS 5.0:
NFPA survey projections NFIRS totals (Version 5.0)
For 1999 to 2001, the same rules may be applied, but estimates for these years in this form will be less reliable due to the smaller amount of data originally collected in NFIRS 5.0; they should be viewed with extreme caution.
NFIRS 5.0 introduced six categories of confined structure fires, including: cooking fires confined to the cooking vessel, confined chimney or flue fires, confined incinerator fire, confined fuel burner or boiler fire or delayed ignition, confined commercial compactor fire, and trash or rubbish fires in a structure with no flame damage to the structure or its
contents.
7%
21%
48%
65%
79%
88% 94% 94% 97% 99% 100%
0%
20%
40%
60%
80%
100%
1999 2000 2001 2002 2003 2004 2005 2006 2007 2008 2009

U.S. Experience With Sprinklers, 6/13 62 NFPA Fire Analysis and Research, Quincy, MA
Although causal and other detailed information is typically not required for these incidents, it is provided in some cases. Some analyses, particularly those that examine cooking equipment, heating equipment, fires caused by smoking materials, and fires started by playing with fire, may examine the confined fires in greater detail. Because the confined fire incident types describe certain scenarios, the distribution of unknown data differs from that of all fires. Consequently, allocation of unknowns must be done separately. Some analyses of structure fires show only non-confined fires. In these tables, percentages shown are of non-confined structure fires rather than all structure fires. This approach has the advantage of showing the frequency of specific factors in fire causes, but the disadvantage of possibly overstating the percentage of factors that are seldom seen in the confined fire incident types and of understating the factors specifically associated with the confined fire incident types. Other analyses include entries for confined fire incident types in the causal tables and show percentages based on total structure fires. In these cases, the confined fire incident type is treated as a general causal factor.
For most fields other than Property Use and Incident Type, NFPA allocates unknown data proportionally among known data. This approach assumes that if the missing data were known, it would be distributed in the same manner as the known data. NFPA makes additional adjustments to several fields. Casualty and loss projections can be
heavily influenced by the inclusion or exclusion of unusually serious fire.
In the formulas that follow, the term “all fires” refers to all fires in NFIRS on the dimension studied. The percentages of fires with known or unknown data are provided for non-confined fires and associated losses, and for confined fires only. Cause of Ignition: This field is used chiefly to identify intentional fires. “Unintentional” in this field is a specific entry and does not include other fires that were not intentionally set: failure of equipment or heat source, act of nature, or “other” (unclassified).” The last should be used for exposures but has been used for other situations as well. Fires that were coded as under investigation and those that were coded as undetermined after investigation were treated as unknown. Factor Contributing to Ignition: In this field, the code “none” is treated as an unknown and allocated proportionally. For Human Factor Contributing to Ignition, NFPA enters a code for “not reported” when no factors are recorded. “Not reported” is treated as an unknown, but the code “none” is treated as a known code and not allocated. Multiple entries are allowed in both of these fields. Percentages are calculated on the total number of fires, not entries, resulting in sums greater than 100%. Although Factor Contributing to Ignition is only required when the cause of ignition was

U.S. Experience With Sprinklers, 6/13 63 NFPA Fire Analysis and Research, Quincy, MA
coded as: 2) unintentional, 3) failure of equipment or heat source; or 4) act of nature, data is often present when not required. Consequently, any fire in which no factor contributing to ignition was entered was treated as unknown. In some analyses, all entries in the category of mechanical failure, malfunction (factor contributing to ignition 20-29) are combined and shown as one entry, “mechanical failure or malfunction.” This category includes:
21. Automatic control failure; 22. Manual control failure; 23. Leak or break. Includes leaks or breaks from containers or pipes. Excludes
operational deficiencies and spill mishaps; 25. Worn out; 26. Backfire. Excludes fires originating as a result of hot catalytic converters; 27. Improper fuel used; Includes the use of gasoline in a kerosene heater and the like;
and 20. Mechanical failure or malfunction, other.
Entries in “electrical failure, malfunction” (factor contributing to ignition 30-39) may also be combined into one entry, “electrical failure or malfunction.” This category includes:
31. Water-caused short circuit arc; 32. Short-circuit arc from mechanical damage; 33. Short-circuit arc from defective or worn insulation; 34. Unspecified short circuit arc; 35. Arc from faulty contact or broken connector, including broken power lines and
loose connections; 36. Arc or spark from operating equipment, switch, or electric fence; 37. Fluorescent light ballast; and 30. Electrical failure or malfunction, other.
Heat Source. In NFIRS 5.0, one grouping of codes encompasses various types of open flames and smoking materials. In the past, these had been two separate groupings. A new code was added to NFIRS 5.0, which is code 60: “Heat from open flame or smoking material, other.” NFPA treats this code as a partial unknown and allocates it proportionally across the codes in the 61-69 range, shown below.
61. Cigarette; 62. Pipe or cigar; 63. Heat from undetermined smoking material; 64. Match; 65. Lighter: cigarette lighter, cigar lighter; 66. Candle;

U.S. Experience With Sprinklers, 6/13 64 NFPA Fire Analysis and Research, Quincy, MA
67 Warning or road flare, fuse; 68. Backfire from internal combustion engine. Excludes flames and sparks from an
exhaust system, (11); and 69. Flame/torch used for lighting. Includes gas light and gas-/liquid-fueled lantern.
In addition to the conventional allocation of missing and undetermined fires, NFPA multiplies fires with codes in the 61-69 range by
All fires in range 60-69 All fires in range 61-69
The downside of this approach is that heat sources that are truly a different type of open flame or smoking material are erroneously assigned to other categories. The grouping “smoking materials” includes codes 61-63 (cigarettes, pipes or cigars, and heat from undetermined smoking material, with a proportional share of the code 60s and true unknown data. Equipment Involved in Ignition (EII). NFIRS 5.0 originally defined EII as the piece of equipment that provided the principal heat source to cause ignition if the equipment malfunctioned or was used improperly. In 2006, the definition was modified to “the piece of equipment that provided the principal heat source to cause ignition.” However, much of the data predates the change. Individuals who have already been trained with the older definition may not change their practices. To compensate, NFPA treats fires in which EII = NNN and heat source is not in the range of 40-99 as an additional unknown. To allocate unknown data for EII, the known data is multiplied by
All fires (All fires – blank – undetermined – [fires in which EII =NNN and heat
source <>40-99]) In addition, the partially unclassified codes for broad equipment groupings (i.e., code 100 - heating, ventilation, and air conditioning, other; code 200 - electrical distribution, lighting and power transfer, other; etc.) were allocated proportionally across the individual code choices in their respective broad groupings (heating, ventilation, and air conditioning; electrical distribution, lighting and power transfer, other; etc.). Equipment that is totally unclassified is not allocated further. This approach has the same downside as the allocation of heat source 60 described above. Equipment that is truly different is erroneously assigned to other categories. In some analyses, various types of equipment are grouped together.

U.S. Experience With Sprinklers, 6/13 65 NFPA Fire Analysis and Research, Quincy, MA
Code Grouping EII
Code
NFIRS definitions
Central heat 132 Furnace or central heating unit 133 Boiler (power, process or
heating) Fixed or portable space heater 131 Furnace, local heating unit,
built-in 123 Fireplace with insert or stove 124 Heating stove 141 Heater, excluding catalytic and
oil-filled 142 Catalytic heater 143 Oil-filled heater Fireplace or chimney 120 Fireplace or chimney 121 Fireplace, masonry 122 Fireplace, factory-built 125 Chimney connector or vent
connector 126 Chimney – brick, stone or
masonry 127 Chimney-metal, including
stovepipe or flue Fixed wiring and related equipment
210 Unclassified electrical wiring
211 Electrical power or utility line 212 Electrical service supply wires
from utility 213 Electric meter or meter box 214 Wiring from meter box to circuit
breaker 215 Panel board, switch board or
circuit breaker board 216 Electrical branch circuit 217 Outlet or receptacle 218 Wall switch 219 Ground fault interrupter Transformers and power supplies
221 Distribution-type transformer
222 Overcurrent, disconnect equipment
223 Low-voltage transformer

U.S. Experience With Sprinklers, 6/13 66 NFPA Fire Analysis and Research, Quincy, MA
224 Generator 225 Inverter 226 Uninterrupted power supply
(UPS) 227 Surge protector 228 Battery charger or rectifier 229 Battery (all types) Lamp, bulb or lighting
230 Unclassified lamp or lighting
231 Lamp-tabletop, floor or desk 232 Lantern or flashlight 233 Incandescent lighting fixture 234 Fluorescent light fixture or
ballast 235 Halogen light fixture or lamp 236 Sodium or mercury vapor light
fixture or lamp 237 Work or trouble light 238 Light bulb 241 Nightlight 242 Decorative lights – line voltage 243 Decorative or landscape lighting
– low voltage 244 Sign Cord or plug 260 Unclassified cord or plug 261 Power cord or plug, detachable
from appliance 262 Power cord or plug-
permanently attached 263 Extension cord
Torch, burner or soldering iron 331 Welding torch 332 Cutting torch 333 Burner, including Bunsen
burners 334 Soldering equipment Portable cooking or warming equipment
631 Coffee maker or teapot
632 Food warmer or hot plate 633 Kettle 634 Popcorn popper 635 Pressure cooker or canner 636 Slow cooker
U.S. Experience With Sprinklers, 6/13 67 NFPA Fire Analysis and Research, Quincy, MA
637 Toaster, toaster oven, counter-top broiler
638 Waffle iron, griddle 639 Wok, frying pan, skillet 641 Breadmaking machine Equipment was not analyzed separately for confined fires. Instead, each confined fire incident type was listed with the equipment or as other known equipment. Item First Ignited. In most analyses, mattress and pillows (item first ignited 31) and bedding, blankets, sheets, and comforters (item first ignited 32) are combined and shown as “mattresses and bedding.” In many analyses, wearing apparel not on a person (code 34) and wearing apparel on a person (code 35) are combined and shown as “clothing.” In some analyses, flammable and combustible liquids and gases, piping and filters (item first ignited 60-69) are combined and shown together. Area of Origin. Two areas of origin: bedroom for more than five people (code 21) and bedroom for less than five people (code 22) are combined and shown as simply “bedroom.” Chimney is no longer a valid area of origin code for non-confined fires. Rounding and percentages. The data shown are estimates and generally rounded. An entry of zero may be a true zero or it may mean that the value rounds to zero. Percentages are calculated from unrounded values. It is quite possible to have a percentage entry of up to 100% even if the rounded number entry is zero. The same rounded value may account for a slightly different percentage share. Because percentages are expressed in integers and not carried out to several decimal places, percentages that appear identical may be associated with slightly different values.

U.S. Experience With Sprinklers, 6/13 68 NFPA Fire Analysis and Research, Quincy, MA

U.S. Experience With Sprinklers, 6/13 69 NFPA Fire Analysis and Research, Quincy, MA
Appendix B Data Elements in NFIRS 5.0 Related to Automatic Extinguishing Systems
M1. Presence of Automatic Extinguishment System
This is to be coded based on whether a system was or was not present in the area of fire and is designed to extinguish the fire that developed. (The latter condition might exclude, for example, a range hood dry chemical extinguishing system from being considered if the fire began in a toaster.) Codes:
N None Present 1 Present U Undetermined (restored to coding in 2004)
M2. Type of Automatic Extinguishment System
If multiple systems are present, this is to be coded in terms of the (presumably) one system designed to protect the hazard where the fire started. This is a required field if the fire began within the designed range of the system. It is not clear whether questions might arise over a system that is not located in the area of fire origin but has the area of fire origin within its designed range; this has to do with the interpretation of the “area” of fire origin. Codes:
1 Wet pipe sprinkler 2 Dry pipe sprinkler 3 Other sprinkler system 4 Dry chemical system 5 Foam system 6 Halogen type system 7 Carbon dioxide system 0 Other special hazard system U Undetermined
M3. Automatic Extinguishment System Operation
This is designed to capture the “operation and effectiveness” of the system relative to area of fire origin. It is also said to provide information on the “reliability” of the system. The instructions say that “effective” does not necessarily mean complete extinguishment but does mean containment and control until the fire department can complete extinguishment. Codes:
1 System operated and was effective 2 System operated and was not effective
U.S. Experience With Sprinklers, 6/13 70 NFPA Fire Analysis and Research, Quincy, MA
3 Fire too small to activate the system 4 System did not operate 0 Other U Undetermined
M4. Number of Sprinklers Operating
The instructions say this is not an indication of the effectiveness of the sprinkler system. The instructions do not explicitly indicate whether this data element is relevant if the automatic extinguishment system is not a sprinkler system (as indicated in M2). The actual number is recorded in the blank provided; there are no codes. M5. Automatic Extinguishment System Failure Reason
This is designed to capture the (one) reason why the system “failed to operate or did not operate properly.” The instructions also say that this data element provides information on the “effectiveness” of the equipment. It is not clear whether this is to be completed if the system operated properly but was not effective. Text shown in brackets is text shown in the instructions but not on the form. Note that for code 4, the phrase “wrong” is replaced by “inappropriate” in the instructions; the latter term is more precise and appropriate, although it is possible for the type of fire to be unexpected in a given occupancy. Codes:
1 System shut off 2 Not enough agent discharged [to control the fire] 3 Agent discharged but did not reach [the] fire 4 Wrong type of system [Inappropriate system for the type of fire] 5 Fire not in area protected [by the system] 6 System components damaged 7 Lack of maintenance [including corrosion or heads painted] 8 Manual intervention [defeated the system] 0 Other ____________ [Other reason system not effective] U Undetermined

U.S. Experience With Sprinklers, 6/13 71 NFPA Fire Analysis and Research, Quincy, MA
Appendix C: Selected Incidents
The following published incidents are detailed examples reinforcing the need for proper inspection and testing maintenance programs and reflect the analysis discussed in the reliability and effectiveness section of the report. The collection may not be representative of all fires in terms of relative frequency or specific circumstances. Included are short articles from the “Firewatch” column in NFPA Journal and incidents from the large-loss and catastrophic fires report. It is important to remember that this is anecdotal information. Anecdotes show what can happen; they are not a source to learn about what typically occurs. NFPA’s Fire Incident Data Organization (FIDO) identifies significant fires through a clipping service, the Internet and other sources. Additional information is obtained from the fire service and federal and state agencies. FIDO is the source for articles published in the “Firewatch” column of the NFPA Journal.

U.S. Experience With Sprinklers, 6/13 72 NFPA Fire Analysis and Research, Quincy, MA
LARGE FIRES IN WHICH SPRINKLERS HAD BEEN SHUT OFF BEFORE FIRE
State: Massachusetts
Dollar Loss: $26,000,000
Month: July 2007
Time: 4:14 am
Property Characteristics and Operating Status: This three-story, irregularly-shaped former mill building was used by 56 mercantile businesses and covered 350,000 square feet (32,500 square meters). It was of unprotected ordinary construction. The building was closed at the time of the fire. Fire Protection Systems: There was no smoke detection equipment present. There was a full-coverage combination wet-and dry-pipe sprinkler system. A sprinkler valve in the area of ignition was padlocked shut, allowing the fire to quickly overwhelm the rest of the system. The fire department was not notified that the system was shut down. Fire Development: Investigators believe the fire started after welding was done in the basement the day before, without a permit from the fire department. Contributing Factors and Other Details: Several code noncompliance issues, such as the welding and shutting down the sprinkler system, contributed to the fire. Four hundred firefighters from 78 fire departments in two states responded to this fire. Nine firefighters were injured. The loss was estimated at $16,000,000 to the structure and $10,000,000 to the contents. Stephen G. Badger, 2008, “Large-Loss Fires in the United States in 2007”, NFPA Journal Fire Analysis and Research, Quincy, MA.

U.S. Experience With Sprinklers, 6/13 73 NFPA Fire Analysis and Research, Quincy, MA
Location,
Dollar Loss,
Date,
Time
Property
Characteristics and
Operating Status
Fire Protection
Systems
Fire
Development
Contributing
Factors and
Other Details
Maryland $11,000,000 May, 2005 7:00 p.m.
This storage complex consisted of a one-story vacant warehouse of unprotected ordinary construction and a second warehouse of unprotected noncombustible construction and covered 100,000 square feet (9,290 square meters). The site was closed.
There was no detection equipment present. There was a complete coverage dry-pipe sprinkler system present. The system was not operational, as it had been shut down when building became vacant.
This was an incendiary fire. The fire caused a complete collapse of the older brick building and fire damage to the steel storage building.
Four firefighters were injured. The loss was $10,000,000 to the structure and $1,000,000 to the contents.
Stephen G. Badger, 2006, “Large-Loss Fires for 2005”, NFPA Journal, November/December, 68.
Location,
Dollar Loss,
Date,
Time
Property
Characteristics and
Operating Status
Fire Protection Systems
Fire Development
Contributing
Factors and
Other Details
Colorado $15,000,000 April, 1999 2:58 p.m.
This two-story single-family home had a ground-floor area of more than 5,000 square feet (464 square meters). The type of construction wasn’t reported. No one was home when the fire broke out.
The house had an automatic detection system of unknown type and coverage, which operated. It also had a residential set-pipe sprinkler system, but it had been shut down during remodeling.
A light fixture in a closet ignited structural members. No details on the fire’s subsequent growth and spread were reported. No injuries were reported.
None reported.
Stephen G. Badger and Thomas Johnson, 2000, “1999 Large-Loss Fires and Explosions”, NFPA Journal, November/December, 93.

U.S. Experience With Sprinklers, 6/13 74 NFPA Fire Analysis and Research, Quincy, MA
LARGE FIRES IN WHICH INAPPROPRIATE SYSTEM WAS USED FOR TYPE OF FIRE
Location,
Dollar Loss,
Date,
Time
Property
Characteristics and
Operating Status
Fire Protection Systems
Fire Development:
Contributing
Factors and
Other Details
Arizona $100,000,000 August, 2000 4:58 p.m.
The fire broke out in a warehouse containing a home and garden supply company and a pharmaceuticals distribution company. The construction and height of the structure weren’t reported. Employees were working in one of the companies when the fire broke out.
No information was available on automatic detection equipment. A sprinkler system, whose type and extent of coverage weren’t known, wasn’t adequate for the stored merchandise.
Due to litigation, officials are releasing no information on the fire’s development.
None reported.
Stephen G. Badger, 2001, “Large-Loss Fires of 2000”, NFPA Journal, November/December, 61.
Location,
Dollar Loss,
Date,
Time
Property
Characteristics and
Operating Status
Fire Protection Systems
Fire Development:
Contributing
Factors and
Other Details
Pennsylvania $6,000,000 August, 1999 5:57 p.m.
This approximately 50-foot (15.2 meters) steel manufacturing building was of unprotected, noncombustible construction with a ground-floor area of 20,000 square feet (1,858 square meters). Although the plant was closed for the night, maintenance workers were inside.
The plant didn’t have any automatic detection equipment, but it did have a partial coverage wet-pipe sprinkler system. The sprinklers were ineffective because of missing heads and the fact that the system wasn’t designed for this hazard. The system outside the area did help stop the fire spread.
Investigators haven’t determined the cause of this fire, but they believe it started in a dip-tank area. Six firefighters were injured fighting the blaze.
The poorly maintained sprinkler system wasn’t designed for the hazard involved, and heads were missing.
Stephen G. Badger and Thomas Johnson., 2000, “1999 Large-Loss Fires and Explosions”, NFPA Journal, November/December, 85-86.
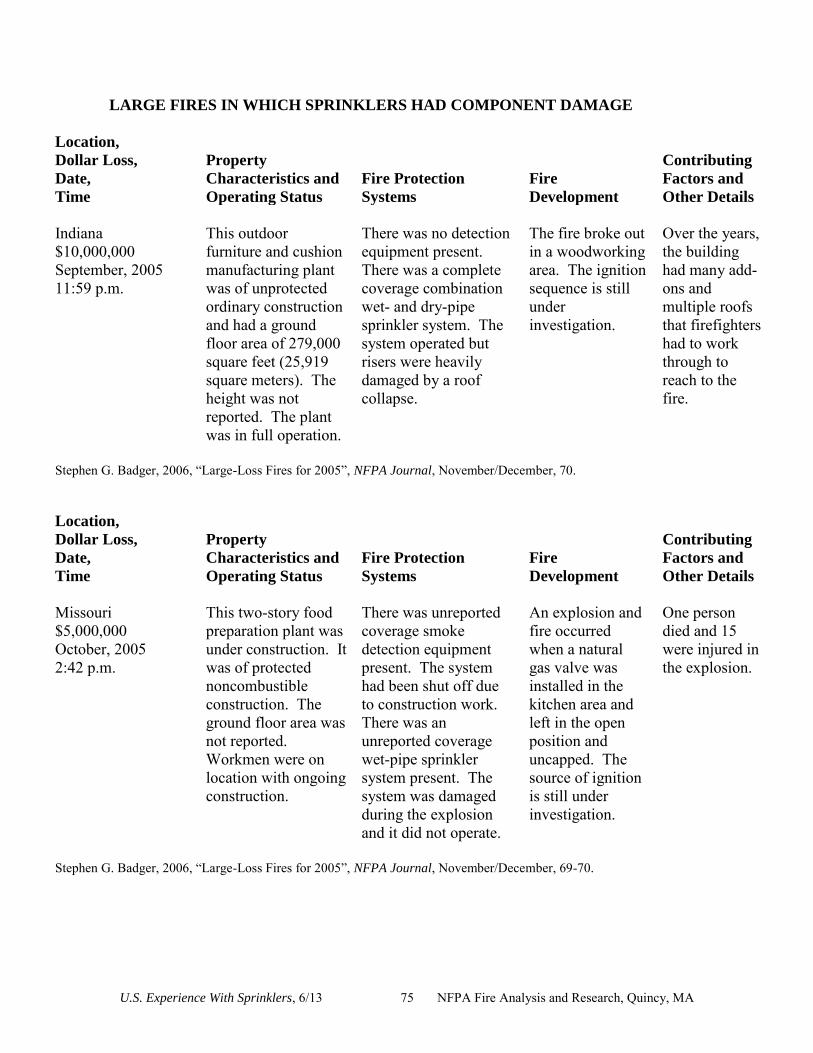
U.S. Experience With Sprinklers, 6/13 75 NFPA Fire Analysis and Research, Quincy, MA
LARGE FIRES IN WHICH SPRINKLERS HAD COMPONENT DAMAGE
Location,
Dollar Loss,
Date,
Time
Property
Characteristics and
Operating Status
Fire Protection
Systems
Fire
Development
Contributing
Factors and
Other Details
Indiana $10,000,000 September, 2005 11:59 p.m.
This outdoor furniture and cushion manufacturing plant was of unprotected ordinary construction and had a ground floor area of 279,000 square feet (25,919 square meters). The height was not reported. The plant was in full operation.
There was no detection equipment present. There was a complete coverage combination wet- and dry-pipe sprinkler system. The system operated but risers were heavily damaged by a roof collapse.
The fire broke out in a woodworking area. The ignition sequence is still under investigation.
Over the years, the building had many add-ons and multiple roofs that firefighters had to work through to reach to the fire.
Stephen G. Badger, 2006, “Large-Loss Fires for 2005”, NFPA Journal, November/December, 70.
Location,
Dollar Loss,
Date,
Time
Property
Characteristics and
Operating Status
Fire Protection
Systems
Fire
Development
Contributing
Factors and
Other Details
Missouri $5,000,000 October, 2005 2:42 p.m.
This two-story food preparation plant was under construction. It was of protected noncombustible construction. The ground floor area was not reported. Workmen were on location with ongoing construction.
There was unreported coverage smoke detection equipment present. The system had been shut off due to construction work. There was an unreported coverage wet-pipe sprinkler system present. The system was damaged during the explosion and it did not operate.
An explosion and fire occurred when a natural gas valve was installed in the kitchen area and left in the open position and uncapped. The source of ignition is still under investigation.
One person died and 15 were injured in the explosion.
Stephen G. Badger, 2006, “Large-Loss Fires for 2005”, NFPA Journal, November/December, 69-70.

U.S. Experience With Sprinklers, 6/13 76 NFPA Fire Analysis and Research, Quincy, MA
Location,
Dollar Loss,
Date,
Time
Property
Characteristics and
Operating Status
Fire Protection
Systems
Fire
Development
Contributing
Factors and
Other Details
Minnesota $10,000,000 March, 2001 5:08 a.m.
Two-story wood products manufacturing plant of unprotected wood frame construction was in full operation at the time the fire broke out. The ground floor area was not reported.
There was no automatic detection equipment present. A dry-pipe sprinkler system was present. The extent of coverage was not reported. A ceiling collapse preceding the fire damaged the system, rendering it ineffective.
A roof collapse caused by a heavy snow load is believed to have caused wires to spark and ignite dust that had accumulated above the ceiling. The fire then spread to pallets of wood product.
None reported.
Stephen G. Badger, November, 2002, “Large-Loss Fires in the United States 2001”, 13-14. Location,
Dollar Loss,
Date,
Time
Property
Characteristics and
Operating Status
Fire Protection Systems
Fire Development
Contributing
Factors and
Other Details Washington $7,000,000 December, 1999 3:23 a.m.
This 12-foot (3.7 meter) retail tool store was of unprotected, ordinary construction with a ground-floor area of 102,000 square feet (9,475.8 square meters). The store of origin, which was one of six businesses in the strip mall, covered a ground-floor area of 32,400 square feet (3,010 square meters). The store was closed.
No information was reported on automatic detection equipment. The entire strip mall had a shared wet-pipe sprinkler system, which had been disabled in the store of origin by a prior forklift incident. The sprinkler in the adjoining business helped control fire spread. There was also a dry-pipe system in a dry storage area.
Cardboard boxes containing plastic tarps failed and fell from rack storage, landing within a foot (.03 meters) of a heater. The propane heater was set up to help dry out the stock made wet by the sprinkler incident earlier in the day. The heater ignited the boxes and the blower pushed the burning embers into other storage. No injuries were reported.
With the sprinkler system disabled, there was no water flow alarm to notify the fire department, allowing the fire to burn a long time before the neighboring business’ sprinkler activated.
Stephen G. Badger and Thomas Johnson, 2000, “1999 Large-Loss Fires and Explosions”, NFPA Journal, November/December, 91.
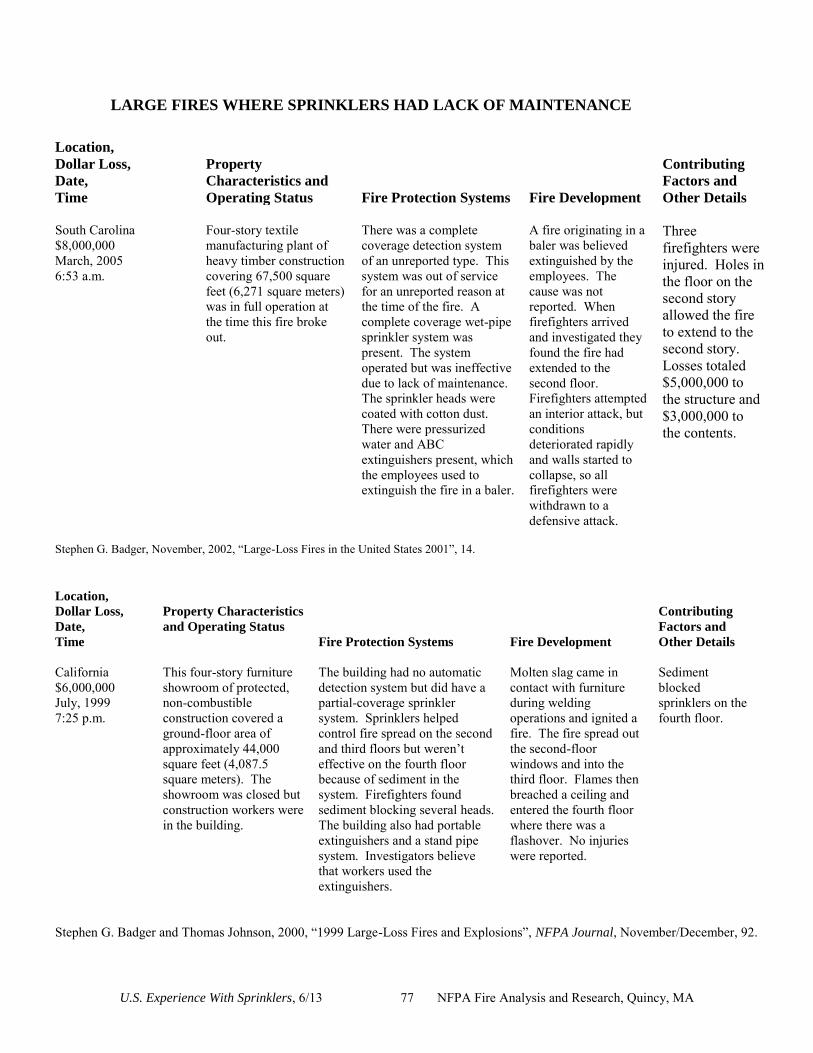
U.S. Experience With Sprinklers, 6/13 77 NFPA Fire Analysis and Research, Quincy, MA
LARGE FIRES WHERE SPRINKLERS HAD LACK OF MAINTENANCE
Location,
Dollar Loss,
Date,
Time
Property
Characteristics and
Operating Status
Fire Protection Systems
Fire Development
Contributing
Factors and
Other Details
South Carolina $8,000,000 March, 2005 6:53 a.m.
Four-story textile manufacturing plant of heavy timber construction covering 67,500 square feet (6,271 square meters) was in full operation at the time this fire broke out.
There was a complete coverage detection system of an unreported type. This system was out of service for an unreported reason at the time of the fire. A complete coverage wet-pipe sprinkler system was present. The system operated but was ineffective due to lack of maintenance. The sprinkler heads were coated with cotton dust. There were pressurized water and ABC extinguishers present, which the employees used to extinguish the fire in a baler.
A fire originating in a baler was believed extinguished by the employees. The cause was not reported. When firefighters arrived and investigated they found the fire had extended to the second floor. Firefighters attempted an interior attack, but conditions deteriorated rapidly and walls started to collapse, so all firefighters were withdrawn to a defensive attack.
Three firefighters were injured. Holes in the floor on the second story allowed the fire to extend to the second story. Losses totaled $5,000,000 to the structure and $3,000,000 to the contents.
Stephen G. Badger, November, 2002, “Large-Loss Fires in the United States 2001”, 14.
Location,
Dollar Loss,
Date,
Time
Property Characteristics
and Operating Status
Fire Protection Systems
Fire Development
Contributing
Factors and
Other Details
California $6,000,000 July, 1999 7:25 p.m.
This four-story furniture showroom of protected, non-combustible construction covered a ground-floor area of approximately 44,000 square feet (4,087.5 square meters). The showroom was closed but construction workers were in the building.
The building had no automatic detection system but did have a partial-coverage sprinkler system. Sprinklers helped control fire spread on the second and third floors but weren’t effective on the fourth floor because of sediment in the system. Firefighters found sediment blocking several heads. The building also had portable extinguishers and a stand pipe system. Investigators believe that workers used the extinguishers.
Molten slag came in contact with furniture during welding operations and ignited a fire. The fire spread out the second-floor windows and into the third floor. Flames then breached a ceiling and entered the fourth floor where there was a flashover. No injuries were reported.
Sediment blocked sprinklers on the fourth floor.
Stephen G. Badger and Thomas Johnson, 2000, “1999 Large-Loss Fires and Explosions”, NFPA Journal, November/December, 92.
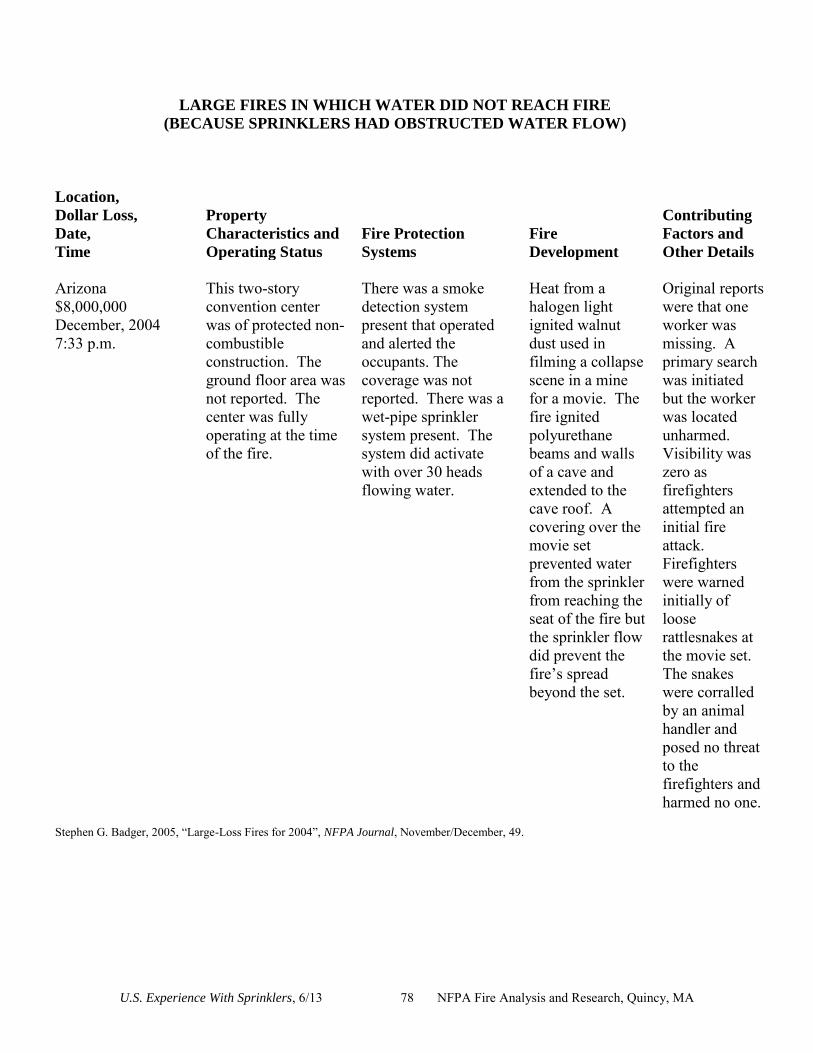
U.S. Experience With Sprinklers, 6/13 78 NFPA Fire Analysis and Research, Quincy, MA
LARGE FIRES IN WHICH WATER DID NOT REACH FIRE
(BECAUSE SPRINKLERS HAD OBSTRUCTED WATER FLOW)
Location,
Dollar Loss,
Date,
Time
Property
Characteristics and
Operating Status
Fire Protection
Systems
Fire
Development
Contributing
Factors and
Other Details
Arizona $8,000,000 December, 2004 7:33 p.m.
This two-story convention center was of protected non-combustible construction. The ground floor area was not reported. The center was fully operating at the time of the fire.
There was a smoke detection system present that operated and alerted the occupants. The coverage was not reported. There was a wet-pipe sprinkler system present. The system did activate with over 30 heads flowing water.
Heat from a halogen light ignited walnut dust used in filming a collapse scene in a mine for a movie. The fire ignited polyurethane beams and walls of a cave and extended to the cave roof. A covering over the movie set prevented water from the sprinkler from reaching the seat of the fire but the sprinkler flow did prevent the fire’s spread beyond the set.
Original reports were that one worker was missing. A primary search was initiated but the worker was located unharmed. Visibility was zero as firefighters attempted an initial fire attack. Firefighters were warned initially of loose rattlesnakes at the movie set. The snakes were corralled by an animal handler and posed no threat to the firefighters and harmed no one.
Stephen G. Badger, 2005, “Large-Loss Fires for 2004”, NFPA Journal, November/December, 49.

U.S. Experience With Sprinklers, 6/13 79 NFPA Fire Analysis and Research, Quincy, MA
LARGE FIRES IN WHICH SPRINKLERS DID NOT DISCHARGE ENOUGH WATER
Fire in drying oven causes significant loss, Oregon
A large food-processing plant was the site of a significant fire loss when debris build-up on gas burners dislodged and ignited dust and food products. A dry-pipe sprinklers system providing full coverage to the building failed to operate during the fire and efforts by employees to control the fire were unsuccessful. The single-story, steel-frame building measured 400 feet (121 meters) in length and 200 feet (60 meters) in width. It had metal walls, a metal roof and two food dryers with a dividing wall between them inside the building. The three-section dryers had multiple doors allowing access to the blower section on the bottom, conveyor in the middle, and gas-fired burners and ventilation on the top section. Fire protection included multiple portable fire extinguishers and a fire pump and sprinkler system fed by a water storage reservoir. The plant was operating at the time of the fire. An employee observed smoke in a section of the building and found a fire burning in the middle section of one of the food dryers. For nearly 10 minutes, employees tried to extinguish the fire using portable fire extinguishers and water-spray equipment that was not designed for fire protection. A 911 call from the employees alerted the fire department, which arrived 27 minutes after alarm. Firefighters extinguished the fire and limited damage to just two sections of the oven, and the onions in the oven. There was, however, smoke damage throughout the building. Investigators examined the equipment and found debris covering the gas-fired burners that had fallen off or was dislodged and then ignited. Evidence of previous fires was also noted as employees reported product often ignites within the oven but is usually easily extinguished. Damage to the building, which was valued at more than $12 million with contents of $300,000, had losses estimated at $3 million and $130,000 in content loss. Investigators also found the fire pump room covered in an oily residue and the fuel tank to the fire pump empty. Some 256 sprinklers fused during the fire, but were ineffective due to a lack of water being pumped from the reservoir. Two employees suffered smoke inhalation during extinguishment attempts. Kenneth J. Tremblay, 2007, “Firewatch,” NFPA Journal, November/December 22.
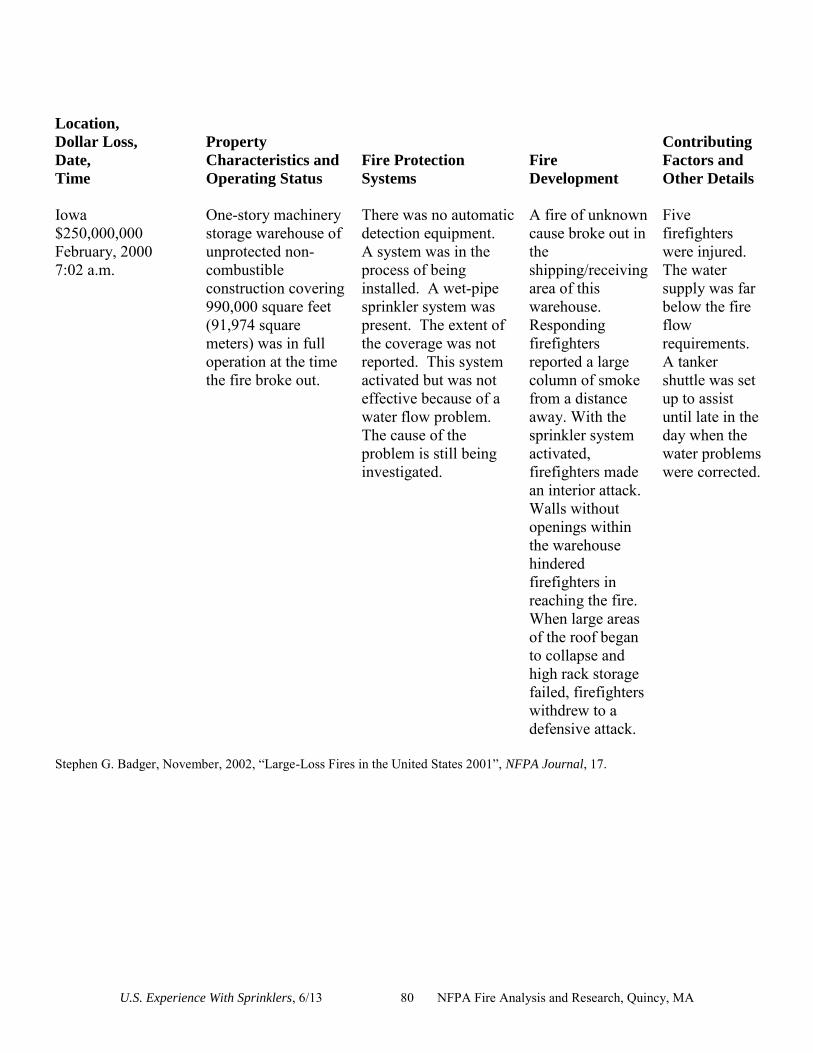
U.S. Experience With Sprinklers, 6/13 80 NFPA Fire Analysis and Research, Quincy, MA
Location,
Dollar Loss,
Date,
Time
Property
Characteristics and
Operating Status
Fire Protection
Systems
Fire
Development
Contributing
Factors and
Other Details
Iowa $250,000,000 February, 2000 7:02 a.m.
One-story machinery storage warehouse of unprotected non-combustible construction covering 990,000 square feet (91,974 square meters) was in full operation at the time the fire broke out.
There was no automatic detection equipment. A system was in the process of being installed. A wet-pipe sprinkler system was present. The extent of the coverage was not reported. This system activated but was not effective because of a water flow problem. The cause of the problem is still being investigated.
A fire of unknown cause broke out in the shipping/receiving area of this warehouse. Responding firefighters reported a large column of smoke from a distance away. With the sprinkler system activated, firefighters made an interior attack. Walls without openings within the warehouse hindered firefighters in reaching the fire. When large areas of the roof began to collapse and high rack storage failed, firefighters withdrew to a defensive attack.
Five firefighters were injured. The water supply was far below the fire flow requirements. A tanker shuttle was set up to assist until late in the day when the water problems were corrected.
Stephen G. Badger, November, 2002, “Large-Loss Fires in the United States 2001”, NFPA Journal, 17.

U.S. Experience With Sprinklers, 6/13 81 NFPA Fire Analysis and Research, Quincy, MA
Location,
Dollar Loss,
Date,
Time
Property
Characteristics and
Operating Status
Fire Protection Systems
Fire Development
Contributing
Factors and
Other Details
Oregon $8,501,000 March, 2004 8:21 a.m.
This one-story petroleum recycling plant was of heavy-timber, construction and covered 186,900 square feet. The plant was in full operation at the time.
No information was reported on any detection equipment. There was a complete coverage dry-pipe sprinkler system present. The system operated, but its rate of application was insufficient to control the fire.
A spark from an oxy/acetylene cutting torch fell into an open sludge-oil pit and ignited the contents instantaneously. The fire grew out of control quickly despite the activation of the sprinkler system. The fire spread through several businesses inside the building.
Firefighters reported insufficient water pressure in hydrants originally. Two firefighters were injured. Damage to the structure was estimated at $3,000,000 and $5,501,000 to the contents.
Stephen G. Badger, 2005, “Large-Loss Fires for 2004”, NFPA Journal, November/December, 47.