Embed Size (px)
Citation preview

US Equity: The Classic Alternative
December 2011
Artio Global Management LLC
Presented by:
Tim Devlin, Portfolio Strategist, US Equities, Artio Global Management LLC

What Happened to the “Classic” Asset Class?
This material is provided for informational purposes only and does not in any sense constitute a solicitation or offer for the purchase or sale of securities. The views expressed are also subject to change based on market and other conditions. Furthermore, the opinions expressed do not constitute investment advice or recommendation.
• Domestic stocks dominated institutional investors’ allocations for decades
• More recent diversification into foreign markets and “alternative” investments has often been funded by reducing US equity exposure
• Performance of alternative investments has been mixed (but the fees have been consistent)
• Liability-driven investing (LDI) has also risen, again funded by reducing US equity exposure
• Can LDI produce adequate real returns? Will future contributions be necessary?
• Long time horizon of most institutional investors should allow for greater risk tolerance (and better expected returns) than is often exhibited
2

US Equities Have Delivered Strong Long-Term ReturnsBut correspondingly high levels of risk
Source: Center for Research in Security Prices (CRSP); Graduate School of Business, The University of Chicago. Russell Investment Group; BofA ML Small Cap Research. Past performance does not guarantee future results.
3
Need to update
Small Caps
Large Caps
Growth of $112/31/1925-9/30/2011
Micro Caps
Mid Caps
AnnualizedReturn Std Dev
Micro 11.8% 32.7%Small 11.1% 26.6%Mid 10.8% 22.6%Large 9.1% 18.0%

A 10 Year Horizon Makes Volatility More Manageable
4
Source: Furey Research, FactSet, Ibbotson and Artio Global Management. Past performance does not guarantee future results. For informational purposes only.
-5%
0%
5%
10%
15%
20%
25%
30%
1935
1937
1939
1941
1943
1945
1947
1949
1951
1953
1955
1957
1959
1961
1963
1965
1967
1969
1971
1973
1975
1977
1979
1981
1983
1985
1987
1989
1991
1993
1995
1997
1999
2001
2003
2005
2007
2009
2011
Smallcap S&P 500 Index
SmallcapAvg Ann 10 year return: 12.10%Frequency of 10 year loss: 2.60%
S&P 500 IndexAvg Ann 10 year return: 10.54%Frequency of 10 year loss: 5.19%
Trailing 10-Year Nominal Annualized Total Return(1/1/35-9/30/11)

Stocks Have Helped Preserve Purchasing Power Over Time
5
-10%
-5%
0%
5%
10%
15%
20%
1935
1937
1939
1941
1943
1945
1947
1949
1951
1953
1955
1957
1959
1961
1963
1965
1967
1969
1971
1973
1975
1977
1979
1981
1983
1985
1987
1989
1991
1993
1995
1997
1999
2001
2003
2005
2007
2009
2011
Smallcap S&P 500 Index
Trailing 10-Year Real Annualized Total Return(1/1/35-9/30/11)
SmallcapAvg Ann 10 year return: 8.40%Frequency of 10 year loss: 6.49%
S&P 500 IndexAvg Ann 10 year return: 6.91%Frequency of 10 year loss: 15.58%
Source: Furey Research, FactSet, Ibbotson and Artio Global Management. Past performance does not guarantee future results. For informational purposes only.

1,302
473 486
639
530
9121 17 4
0
5
10
15
20
25
30
35
40
<250M 250-500M 500M-1B 1-3B 3-20B 20-50 B 50-100 B 100-200B >200B0
200
400
600
800
1,000
1,200
1,400
Ave
rag
e #
Co
veri
ng
An
aly
sts
P
er C
om
pa
ny
Company Market Capitalization ($)
Nu
mb
er o
f Sto
ck
sWhere Should Active Risk be Focused?Sell side coverage drops sharply as capitalization decreases
6
Source: Bloomberg , FactSet and Artio Global Management. Calculated using stocks in the Russell 3000 and Russell Microcap Indexes with duplicate companies removed; market capitalizations and analyst coverage as of 9/30/11.
• 3 analysts, on average, cover companies with under $250 million market cap while 37 cover the four largest
• Some small and microcap companies have no analyst coverage at all
• Limited analyst coverage may result in market inefficiencies and mispricings
Number of stocks (small universe)
Number of stocks (mid and large universe)
Average Analyst Coverage

7
* YTD ending 11/3/11. Source: Bloomberg and Artio Global Management . Reflects data for takeovers of US-based publicly companies.
• Takeovers disproportionately favor smaller companies
US Takeover Activity By Deal Size(2006-2011)
M&A: An Underappreciated Tailwind for Smaller Caps
278266
171
130
178
119102
114
4531
6746
3042
196 16 2110 7 5 4 1 3
0
50
100
150
200
250
300
350
2006 2007 2008 2009 2010 2011 YTD*
Dea
l C
ou
nt
<$1B $1-5B $5-20B >$20B

51.1%
29.9%
24.2% 23.4%
0%
10%
20%
30%
40%
50%
60%
<$1B $1-5B $5-20B >$20B
Deal Sizes
8
• Since 2006, 734 companies in the Russell 2000 Index have been acquired, at an average premium of 32%
Average Premium1/1/06-11/3/11
Smaller Acquisitions Have Received Larger Premiums
YTD ending 11/3/11. Source: Bloomberg and Artio Global Management . Reflects data for takeovers of US-based publicly companies.

-5.0%
-4.0%
-3.0%
-2.0%
-1.0%
0.0%
1.0%
2.0%
3.0%
4.0%
5.0%
Aug
-06
Dec
-06
Ap
r-07
Aug
-07
Dec
-07
Ap
r-08
Aug
-08
Dec
-08
Ap
r-09
Aug
-09
Dec
-09
Ap
r-10
Aug
-10
Dec
-10
Ap
r-11
Aug
-11
Exc
ess
Ret
urn
What Does Active Risk Look Like?Excess return does not occur in a straight line
9
There is no such thing as a free lunch!
Monthly variance relative to benchmark1
(8/1/06-9/30/11)
Source: Artio Global Management . 1. Excess return calculated by taking the Artio US Midcap Composite gross of fee monthly returns and subtracting the Russell Midcap Index return. Tracking error is the standard deviation of the excess returns. Past performance does not guarantee future results. For informational purposes only.
Annualized Excess Return: 2.5% Tracking Error: 5.1%
10
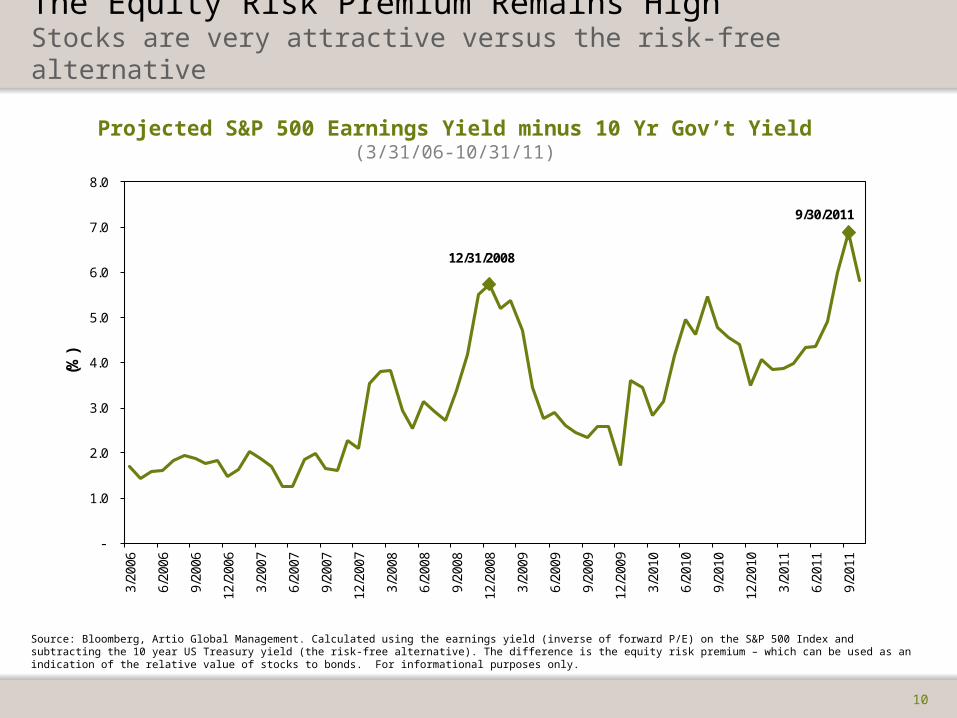
The Equity Risk Premium Remains HighStocks are very attractive versus the risk-free alternative
Source: Bloomberg, Artio Global Management. Calculated using the earnings yield (inverse of forward P/E) on the S&P 500 Index and subtracting the 10 year US Treasury yield (the risk-free alternative). The difference is the equity risk premium – which can be used as an indication of the relative value of stocks to bonds. For informational purposes only.
-
1.0
2.0
3.0
4.0
5.0
6.0
7.0
8.0
3/20
06
6/20
06
9/20
06
12/2
006
3/20
07
6/20
07
9/20
07
12/2
007
3/20
08
6/20
08
9/20
08
12/2
008
3/20
09
6/20
09
9/20
09
12/2
009
3/20
10
6/20
10
9/20
10
12/2
010
3/20
11
6/20
11
9/20
11
(%)
12/31/2008
9/30/2011
Projected S&P 500 Earnings Yield minus 10 Yr Gov’t Yield(3/31/06-10/31/11)

Stock Correlations Coming Off Extreme High LevelsGreater dispersion of returns is favorable for stock selection
11
Source: Birinyi Associates.This material is provided for informational purposes only and does not in any sense constitute a solicitation or offer for the purchase or sale of securities. The views expressed are also subject to change based on market and other conditions. Furthermore, the opinions expressed do not constitute investment advice or recommendation.
0.0
0.1
0.2
0.3
0.4
0.5
0.6
0.7
0.8
0.9
1.0
Jan
-80
Jul-
81
Jan
-83
Jul-
84
Jan
-86
Jul-
87
Jan
-89
Jul-
90
Jan
-92
Jul-
93
Jan
-95
Jul-
96
Jan
-98
Jul-
99
Jan
-01
Jul-
02
Jan
-04
Jul-
05
Jan
-07
Jul-
08
Jan
-10
Jul-
11
Co
rre
lati
on
(x
)
S&P 500 Member Correlation w/ Market: Rolling 50 Days
(1/2/80-10/24/11)

12
Investment Opportunities

13
• Largecap banks still unwinding bad credits, losses
• Working through bad loans, but still selling assets
• Basel III standards to be fully implemented in 2019
• Reinvestment risk, mortgage litigation costs hurt EPS
• Many small and midcap banks have clean balance sheets
• Are banks lending? Better question is where are commercial borrowers?
• We see opportunities in:
• Select regional banks—those with conservative loan loss provisioning and underwriting
• Asset management firms & the credit card industry
FinancialsSlow-motion credit cleansing ongoing
This material is provided for informational purposes only and does not in any sense constitute a solicitation or offer for the purchase or sale of securities. The views expressed are also subject to change based on market and other conditions. Furthermore, the opinions expressed do not constitute investment advice or recommendation.

•After lagging for several years due to the new health care legislation, sector has outperformed YTD through September 30, 2011
•Companies with products or services that reduce costs and have equal or better patient outcomes should thrive in the market, regardless of any impact of the new legislation
•Examples of where we see opportunities include:
•Orphan diseases—First to market provides pricing power
•Medical technology—Less invasive treatment approaches
•Pharmaceuticals—Generic drug manufacturers
This material is provided for informational purposes only and does not in any sense constitute a solicitation or offer for the purchase or sale of securities. The views expressed are also subject to change based on market and other conditions. Furthermore, the opinions expressed do not constitute investment advice or recommendation.
14
Healthcare
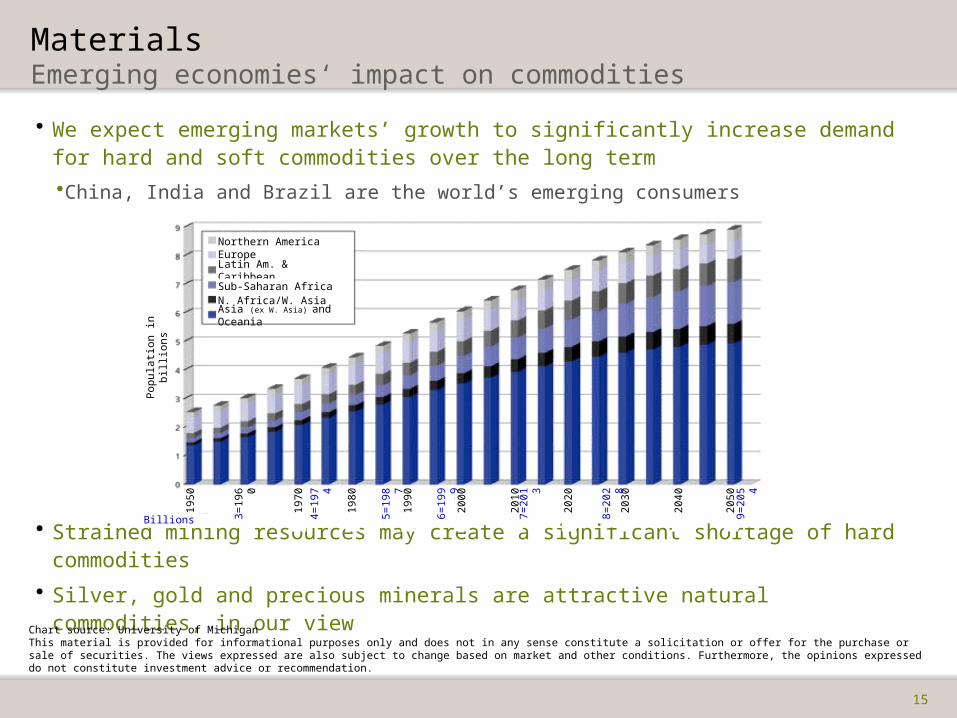
• We expect emerging markets’ growth to significantly increase demand for hard and soft commodities over the long term
•China, India and Brazil are the world’s emerging consumers
• Strained mining resources may create a significant shortage of hard commodities
• Silver, gold and precious minerals are attractive natural commodities, in our view
MaterialsEmerging economies‘ impact on commodities
15
Chart source: University of MichiganThis material is provided for informational purposes only and does not in any sense constitute a solicitation or offer for the purchase or sale of securities. The views expressed are also subject to change based on market and other conditions. Furthermore, the opinions expressed do not constitute investment advice or recommendation.
Northern AmericaEurope
Latin Am. & Caribbean
Sub-Saharan AfricaN. Africa/W. Asia
Asia (ex W. Asia) and Oceania
Pop
ulat
ion
in b
illio
ns
1950
1970
1980
1990
2000
2010
2020
2030
2040
2050
3=19
60
4=19
74
5=19
87
6=19
99
7=20
13
8=20
28
9=20
54
Billions

16
• Store closures allow new concepts to enter new markets; saturated and crowded concepts are churned
• Innovation and changes in consumer behavior are a large part of this
• Unemployment rate and luxury goods sales are not correlated in the US
• We see opportunities in luxury goods and select specialty retailers
This material is provided for informational purposes only and does not in any sense constitute a solicitation or offer for the purchase or sale of securities. Artio Global Management LLC may or may not hold any of the above listed companies. The views expressed are also subject to change based on market and other conditions. Furthermore, the opinions expressed do not constitute investment advice or recommendation.
Consumer discretionaryMarket share gain potential & novelty are key considerations

17
TechnologyConsumer & enterprise usage trends matter
• Semiconductors and hardware industries still the most cyclical in tech
• Semi use in autos, industrials, white goods and computing is smoothing out inherent lumpiness
• Cloud computing is a cost-savings/utilization play with legs
• Trending user behavior is taxing the network with heavy payloads and storage demands
• Our investment focus includes: changing hardware formats, network management and the storing of heavy data and mobility
This material is provided for informational purposes only and does not in any sense constitute a solicitation or offer for the purchase or sale of securities. Artio Global Management LLC may or may not hold any of the above listed companies. The views expressed are also subject to change based on market and other conditions. Furthermore, the opinions expressed do not constitute investment advice or recommendation.

What Happened to the “Classic” Asset Class?
This material is provided for informational purposes only and does not in any sense constitute a solicitation or offer for the purchase or sale of securities. The views expressed are also subject to change based on market and other conditions. Furthermore, the opinions expressed do not constitute investment advice or recommendation.
• Domestic stocks offer strong return potential and help protect long-term purchasing power
• Smaller stocks have a long-term return advantage, are under-analyzed and often benefit disproportionately from company takeovers- Also better suited for active management than larger stocks
• The pendulum has swung too far away from equities and toward alternatives- “A compensation scheme masquerading as an asset class”
• News Alert: Investing involves risk!- Stocks: long history helps understand the uncertainty- Alternatives: opaque, uncertain, unlimited … but marketed quite differently
• All things being equal, you can afford to be more aggressive (i.e., take on more risk) with a longer time horizon
“Classic” never goes out of style
18

19
DisclosuresThis material is provided for informational purposes only and does not in any sense constitute a solicitation or offer for the purchase or sale of securities.
The views expressed solely reflect those of Artio Global Management LLC (“Artio Global”) and its managers, and do not necessarily reflect the views of any affiliated companies.
The material may contain forward- or backward-looking statements regarding intent or beliefs on current or past expectations. Readers are cautioned that such statements are not a guarantee of future performance, involve risks and uncertainties, and actual results may differ materially from those statements as a result of various factors. The views expressed are also subject to change based on market and other conditions. Furthermore, the opinions expressed do not constitute investment advice or recommendation by Artio Global Management LLC or affiliated companies.
A significant portion of the information used by Artio Global Management is received from external sources and has been adapted for use in Artio Global Management's analytical and risk management systems framework. This report has been created using information believed to be reliable but we do not warrant its accuracy or completeness. While every effort is made to insure the validity of the information received, Artio Global Management cannot be responsible for any inaccuracies that may occur.
All material in this presentation, unless specifically indicated otherwise, is under copyright to Artio Global. None of the material, nor its content, nor any copy of it, may be altered in any way, transmitted to, copied, or distributed to any other party, without the prior express written permission of Artio Global.
Certain information contained herein is derived from historical price data from various indices and does not purport to represent investment results of an actual portfolio. These results do not reflect the deductions for investment management fees. Past results do not guarantee future results.
Any securities mentioned in this presentation should not be construed as a recommendation to buy, sell or hold such security. This material is provided for discussion purposes only and does not in any sense constitute a solicitation or offer for the purchase or sale of securities.