Embed Size (px)
Citation preview
STRATEGY NOTE
USA | Equity Strategy
US September 10, 2017
US Equity StrategyJEF's SMID-Cap Themes: 8 is enough, go withthe Momentum and 7 other themes
EQU
ITY STRATEG
Y AM
ERIC
AS
Steven G. DeSanctis, CFA *Equity Strategist
(212) 284-2056 [email protected] Bredenoord, CFA *
Equity Associate(212) 336-7341 [email protected]
* Jefferies LLC
^Prior trading day's closing price unlessotherwise noted.
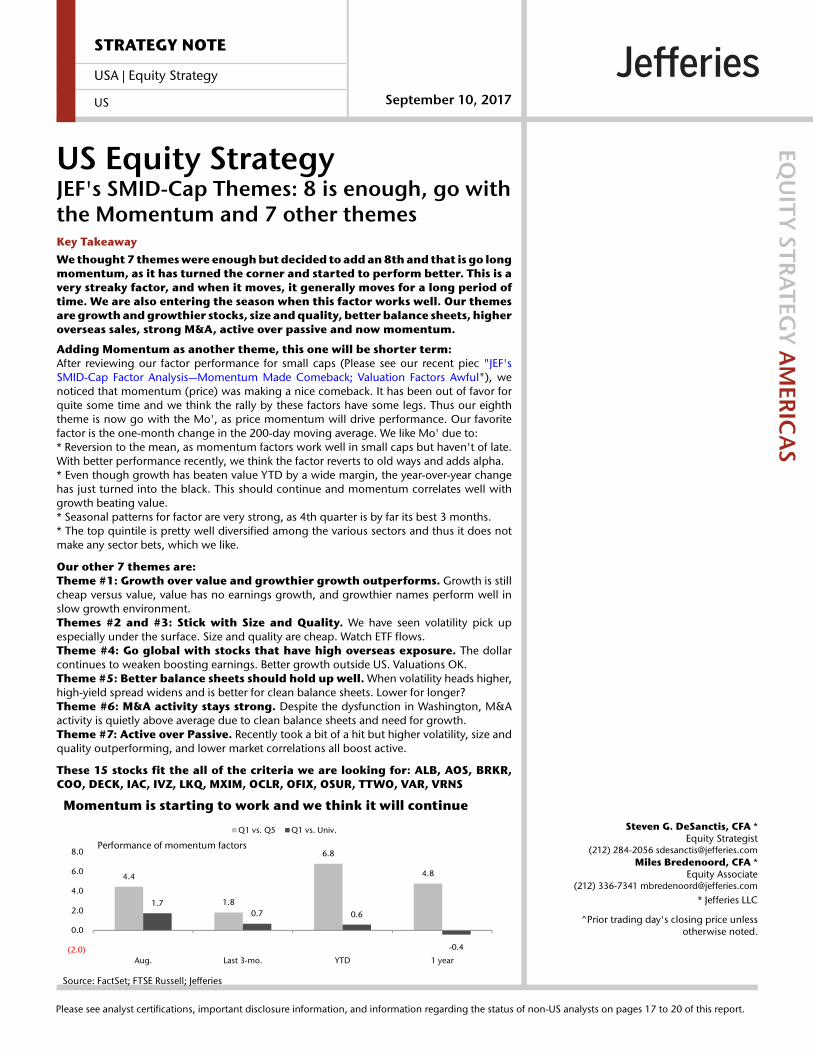
Key TakeawayWe thought 7 themes were enough but decided to add an 8th and that is go longmomentum, as it has turned the corner and started to perform better. This is avery streaky factor, and when it moves, it generally moves for a long period oftime. We are also entering the season when this factor works well. Our themesare growth and growthier stocks, size and quality, better balance sheets, higheroverseas sales, strong M&A, active over passive and now momentum.
Adding Momentum as another theme, this one will be shorter term:After reviewing our factor performance for small caps (Please see our recent piec "JEF'sSMID-Cap Factor Analysis—Momentum Made Comeback; Valuation Factors Awful"), wenoticed that momentum (price) was making a nice comeback. It has been out of favor forquite some time and we think the rally by these factors have some legs. Thus our eighththeme is now go with the Mo', as price momentum will drive performance. Our favoritefactor is the one-month change in the 200-day moving average. We like Mo' due to:* Reversion to the mean, as momentum factors work well in small caps but haven't of late.With better performance recently, we think the factor reverts to old ways and adds alpha.* Even though growth has beaten value YTD by a wide margin, the year-over-year changehas just turned into the black. This should continue and momentum correlates well withgrowth beating value.* Seasonal patterns for factor are very strong, as 4th quarter is by far its best 3 months.* The top quintile is pretty well diversified among the various sectors and thus it does notmake any sector bets, which we like.
Our other 7 themes are:Theme #1: Growth over value and growthier growth outperforms. Growth is stillcheap versus value, value has no earnings growth, and growthier names perform well inslow growth environment.Themes #2 and #3: Stick with Size and Quality. We have seen volatility pick upespecially under the surface. Size and quality are cheap. Watch ETF flows.Theme #4: Go global with stocks that have high overseas exposure. The dollarcontinues to weaken boosting earnings. Better growth outside US. Valuations OK.Theme #5: Better balance sheets should hold up well. When volatility heads higher,high-yield spread widens and is better for clean balance sheets. Lower for longer?Theme #6: M&A activity stays strong. Despite the dysfunction in Washington, M&Aactivity is quietly above average due to clean balance sheets and need for growth.Theme #7: Active over Passive. Recently took a bit of a hit but higher volatility, size andquality outperforming, and lower market correlations all boost active.
These 15 stocks fit the all of the criteria we are looking for: ALB, AOS, BRKR,COO, DECK, IAC, IVZ, LKQ, MXIM, OCLR, OFIX, OSUR, TTWO, VAR, VRNS
Momentum is starting to work and we think it will continue
Source: FactSet; FTSE Russell; Jefferies
4.4
1.8
6.8
4.8
1.70.7 0.6
-0.4(2.0)
0.0
2.0
4.0
6.0
8.0
Aug. Last 3-mo. YTD 1 year
Q1 vs. Q5 Q1 vs. Univ.
Performance of momentum factors
Please see analyst certifications, important disclosure information, and information regarding the status of non-US analysts on pages 17 to 20 of this report.
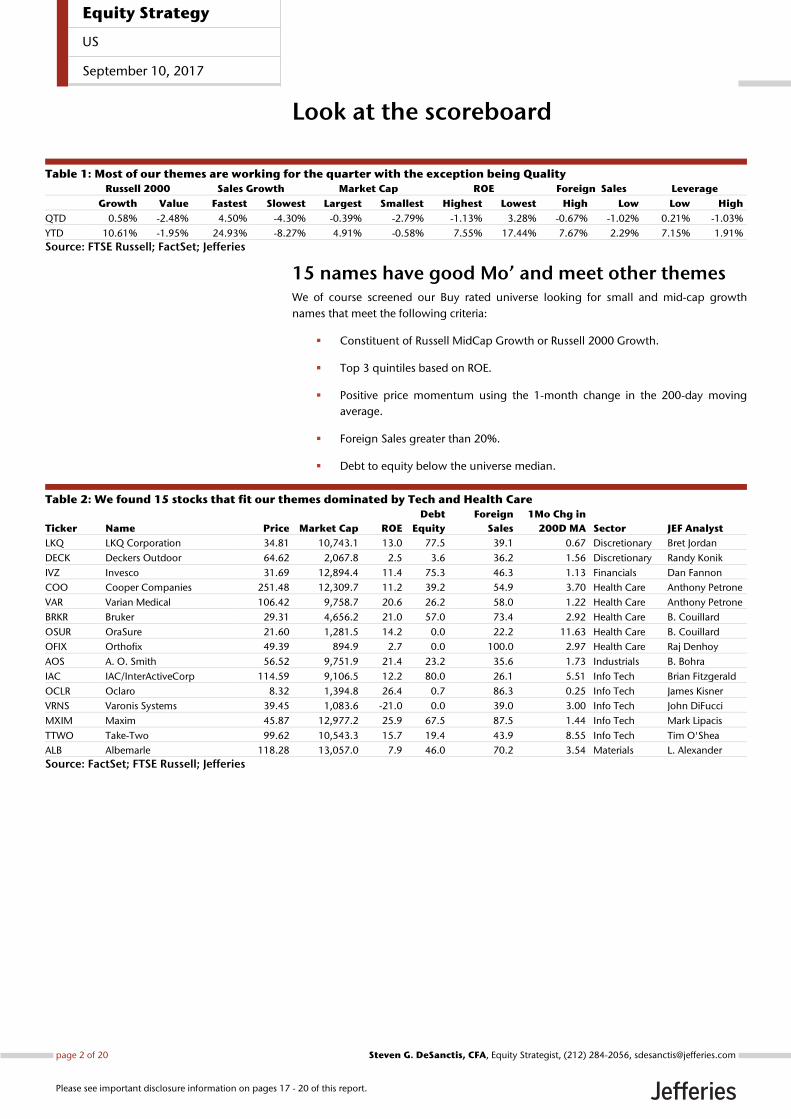
Look at the scoreboard
Table 1: Most of our themes are working for the quarter with the exception being Quality
Russell 2000 Sales Growth Market Cap ROE Foreign Sales Leverage
Growth Value Fastest Slowest Largest Smallest Highest Lowest High Low Low High
QTD 0.58% -2.48% 4.50% -4.30% -0.39% -2.79% -1.13% 3.28% -0.67% -1.02% 0.21% -1.03%
YTD 10.61% -1.95% 24.93% -8.27% 4.91% -0.58% 7.55% 17.44% 7.67% 2.29% 7.15% 1.91%
Source: FTSE Russell; FactSet; Jefferies
15 names have good Mo’ and meet other themes We of course screened our Buy rated universe looking for small and mid-cap growth
names that meet the following criteria:
Constituent of Russell MidCap Growth or Russell 2000 Growth.
Top 3 quintiles based on ROE.
Positive price momentum using the 1-month change in the 200-day moving
average.
Foreign Sales greater than 20%.
Debt to equity below the universe median.
Table 2: We found 15 stocks that fit our themes dominated by Tech and Health Care
Ticker
Name
Price
Market Cap
ROE
Debt
Equity
Foreign
Sales
1Mo Chg in
200D MA
Sector
JEF Analyst
LKQ LKQ Corporation 34.81 10,743.1 13.0 77.5 39.1 0.67 Discretionary Bret Jordan
DECK Deckers Outdoor 64.62 2,067.8 2.5 3.6 36.2 1.56 Discretionary Randy Konik
IVZ Invesco 31.69 12,894.4 11.4 75.3 46.3 1.13 Financials Dan Fannon
COO Cooper Companies 251.48 12,309.7 11.2 39.2 54.9 3.70 Health Care Anthony Petrone
VAR Varian Medical 106.42 9,758.7 20.6 26.2 58.0 1.22 Health Care Anthony Petrone
BRKR Bruker 29.31 4,656.2 21.0 57.0 73.4 2.92 Health Care B. Couillard
OSUR OraSure 21.60 1,281.5 14.2 0.0 22.2 11.63 Health Care B. Couillard
OFIX Orthofix 49.39 894.9 2.7 0.0 100.0 2.97 Health Care Raj Denhoy
AOS A. O. Smith 56.52 9,751.9 21.4 23.2 35.6 1.73 Industrials B. Bohra
IAC IAC/InterActiveCorp 114.59 9,106.5 12.2 80.0 26.1 5.51 Info Tech Brian Fitzgerald
OCLR Oclaro 8.32 1,394.8 26.4 0.7 86.3 0.25 Info Tech James Kisner
VRNS Varonis Systems 39.45 1,083.6 -21.0 0.0 39.0 3.00 Info Tech John DiFucci
MXIM Maxim 45.87 12,977.2 25.9 67.5 87.5 1.44 Info Tech Mark Lipacis
TTWO Take-Two 99.62 10,543.3 15.7 19.4 43.9 8.55 Info Tech Tim O'Shea
ALB Albemarle 118.28 13,057.0 7.9 46.0 70.2 3.54 Materials L. Alexander
Source: FactSet; FTSE Russell; Jefferies
Equity Strategy
US
September 10, 2017
page 2 of 20 , Equity Strategist, (212) 284-2056, [email protected] G. DeSanctis, CFA
Please see important disclosure information on pages 17 - 20 of this report.
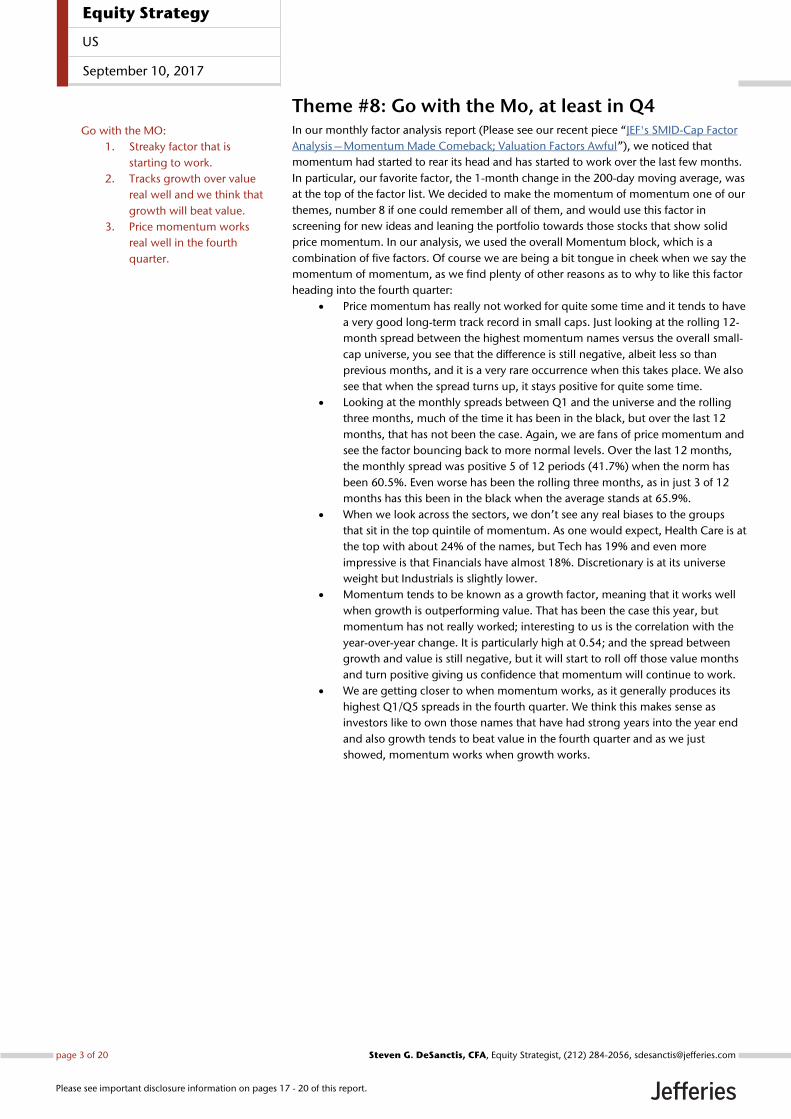
Theme #8: Go with the Mo, at least in Q4 In our monthly factor analysis report (Please see our recent piece “JEF's SMID-Cap Factor
Analysis—Momentum Made Comeback; Valuation Factors Awful”), we noticed that
momentum had started to rear its head and has started to work over the last few months.
In particular, our favorite factor, the 1-month change in the 200-day moving average, was
at the top of the factor list. We decided to make the momentum of momentum one of our
themes, number 8 if one could remember all of them, and would use this factor in
screening for new ideas and leaning the portfolio towards those stocks that show solid
price momentum. In our analysis, we used the overall Momentum block, which is a
combination of five factors. Of course we are being a bit tongue in cheek when we say the
momentum of momentum, as we find plenty of other reasons as to why to like this factor
heading into the fourth quarter:
Price momentum has really not worked for quite some time and it tends to have
a very good long-term track record in small caps. Just looking at the rolling 12-
month spread between the highest momentum names versus the overall small-
cap universe, you see that the difference is still negative, albeit less so than
previous months, and it is a very rare occurrence when this takes place. We also
see that when the spread turns up, it stays positive for quite some time.
Looking at the monthly spreads between Q1 and the universe and the rolling
three months, much of the time it has been in the black, but over the last 12
months, that has not been the case. Again, we are fans of price momentum and
see the factor bouncing back to more normal levels. Over the last 12 months,
the monthly spread was positive 5 of 12 periods (41.7%) when the norm has
been 60.5%. Even worse has been the rolling three months, as in just 3 of 12
months has this been in the black when the average stands at 65.9%.
When we look across the sectors, we don’t see any real biases to the groups
that sit in the top quintile of momentum. As one would expect, Health Care is at
the top with about 24% of the names, but Tech has 19% and even more
impressive is that Financials have almost 18%. Discretionary is at its universe
weight but Industrials is slightly lower.
Momentum tends to be known as a growth factor, meaning that it works well
when growth is outperforming value. That has been the case this year, but
momentum has not really worked; interesting to us is the correlation with the
year-over-year change. It is particularly high at 0.54; and the spread between
growth and value is still negative, but it will start to roll off those value months
and turn positive giving us confidence that momentum will continue to work.
We are getting closer to when momentum works, as it generally produces its
highest Q1/Q5 spreads in the fourth quarter. We think this makes sense as
investors like to own those names that have had strong years into the year end
and also growth tends to beat value in the fourth quarter and as we just
showed, momentum works when growth works.
Go with the MO:
1. Streaky factor that is
starting to work.
2. Tracks growth over value
real well and we think that
growth will beat value.
3. Price momentum works
real well in the fourth
quarter.
Equity Strategy
US
September 10, 2017
page 3 of 20 , Equity Strategist, (212) 284-2056, [email protected] G. DeSanctis, CFA
Please see important disclosure information on pages 17 - 20 of this report.
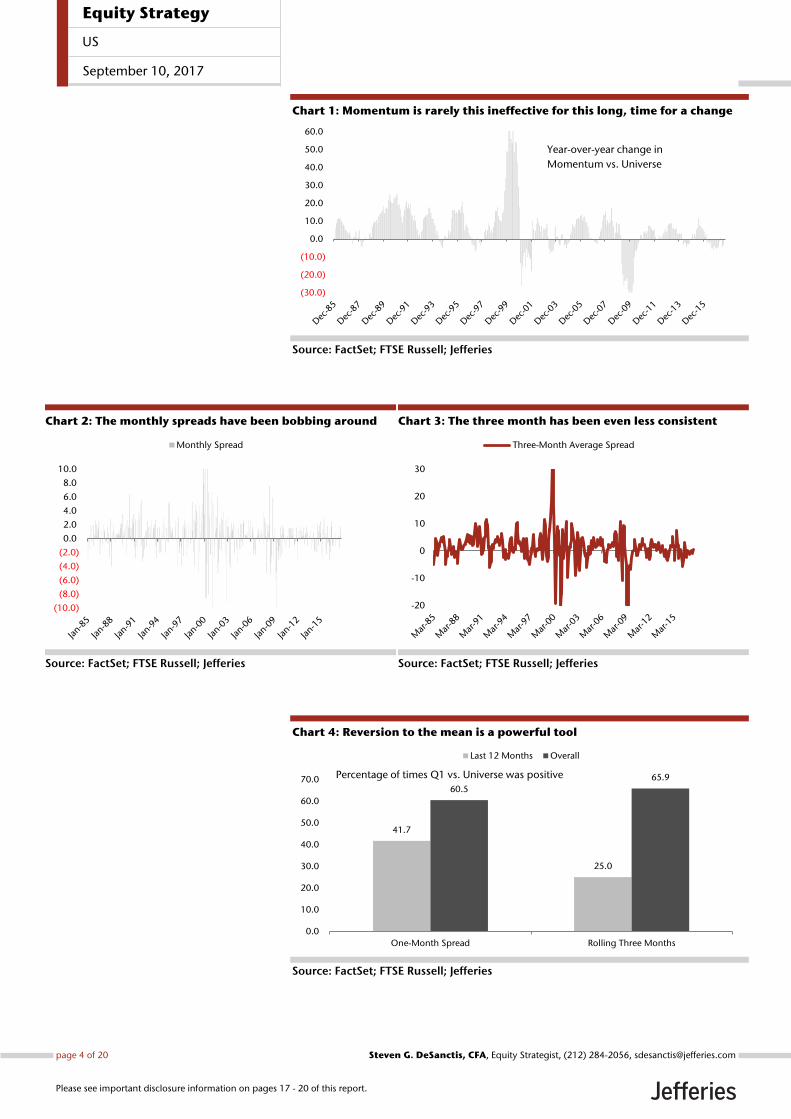
Chart 1: Momentum is rarely this ineffective for this long, time for a change
Source: FactSet; FTSE Russell; Jefferies
Chart 2: The monthly spreads have been bobbing around
Source: FactSet; FTSE Russell; Jefferies
Chart 3: The three month has been even less consistent
Source: FactSet; FTSE Russell; Jefferies
Chart 4: Reversion to the mean is a powerful tool
Source: FactSet; FTSE Russell; Jefferies
(30.0)
(20.0)
(10.0)
0.0
10.0
20.0
30.0
40.0
50.0
60.0
Year-over-year change in
Momentum vs. Universe
(10.0)
(8.0)
(6.0)
(4.0)
(2.0)
0.0
2.0
4.0
6.0
8.0
10.0
Monthly Spread
-20
-10
0
10
20
30
Three-Month Average Spread
41.7
25.0
60.5
65.9
0.0
10.0
20.0
30.0
40.0
50.0
60.0
70.0
One-Month Spread Rolling Three Months
Last 12 Months Overall
Percentage of times Q1 vs. Universe was positive
Equity Strategy
US
September 10, 2017
page 4 of 20 , Equity Strategist, (212) 284-2056, [email protected] G. DeSanctis, CFA
Please see important disclosure information on pages 17 - 20 of this report.
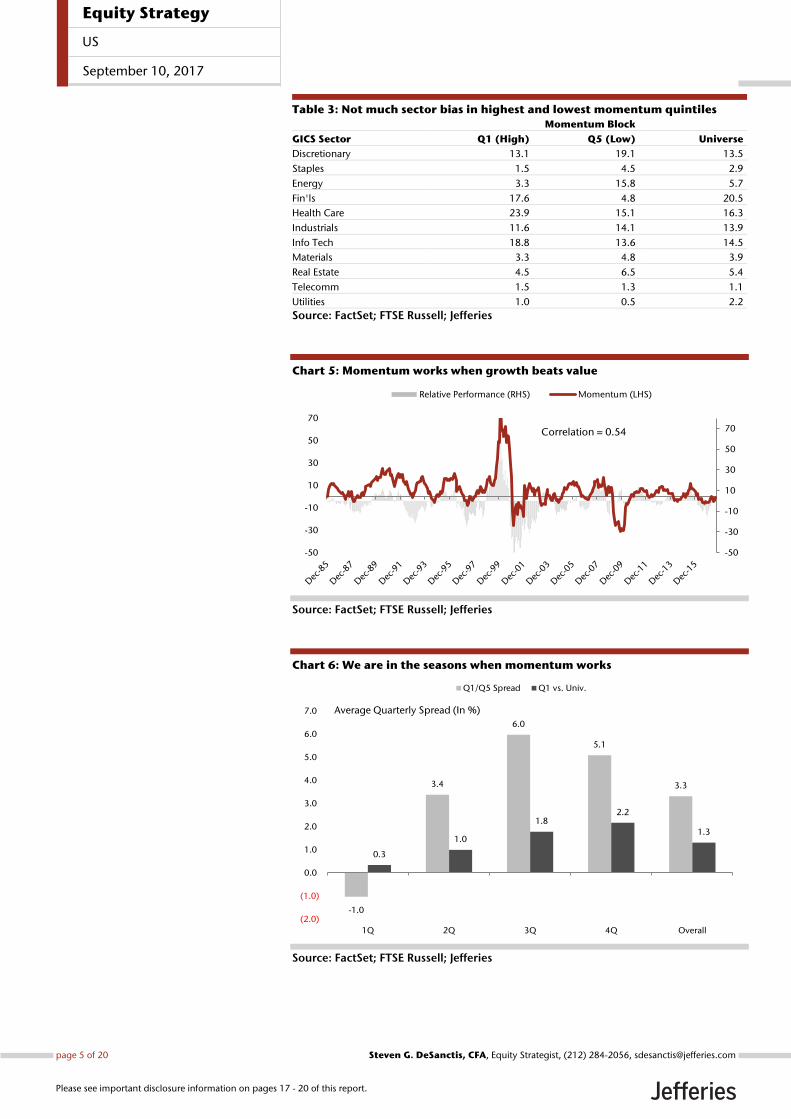
Table 3: Not much sector bias in highest and lowest momentum quintiles
Momentum Block
GICS Sector Q1 (High) Q5 (Low) Universe
Discretionary 13.1 19.1 13.5
Staples 1.5 4.5 2.9
Energy 3.3 15.8 5.7
Fin'ls 17.6 4.8 20.5
Health Care 23.9 15.1 16.3
Industrials 11.6 14.1 13.9
Info Tech 18.8 13.6 14.5
Materials 3.3 4.8 3.9
Real Estate 4.5 6.5 5.4
Telecomm 1.5 1.3 1.1
Utilities 1.0 0.5 2.2
Source: FactSet; FTSE Russell; Jefferies
Chart 5: Momentum works when growth beats value
Source: FactSet; FTSE Russell; Jefferies
Chart 6: We are in the seasons when momentum works
Source: FactSet; FTSE Russell; Jefferies
-50
-30
-10
10
30
50
70
-50
-30
-10
10
30
50
70
Relative Performance (RHS) Momentum (LHS)
Correlation = 0.54
-1.0
3.4
6.0
5.1
3.3
0.3
1.0
1.82.2
1.3
(2.0)
(1.0)
0.0
1.0
2.0
3.0
4.0
5.0
6.0
7.0
1Q 2Q 3Q 4Q Overall
Q1/Q5 Spread Q1 vs. Univ.
Average Quarterly Spread (In %)
Equity Strategy
US
September 10, 2017
page 5 of 20 , Equity Strategist, (212) 284-2056, [email protected] G. DeSanctis, CFA
Please see important disclosure information on pages 17 - 20 of this report.
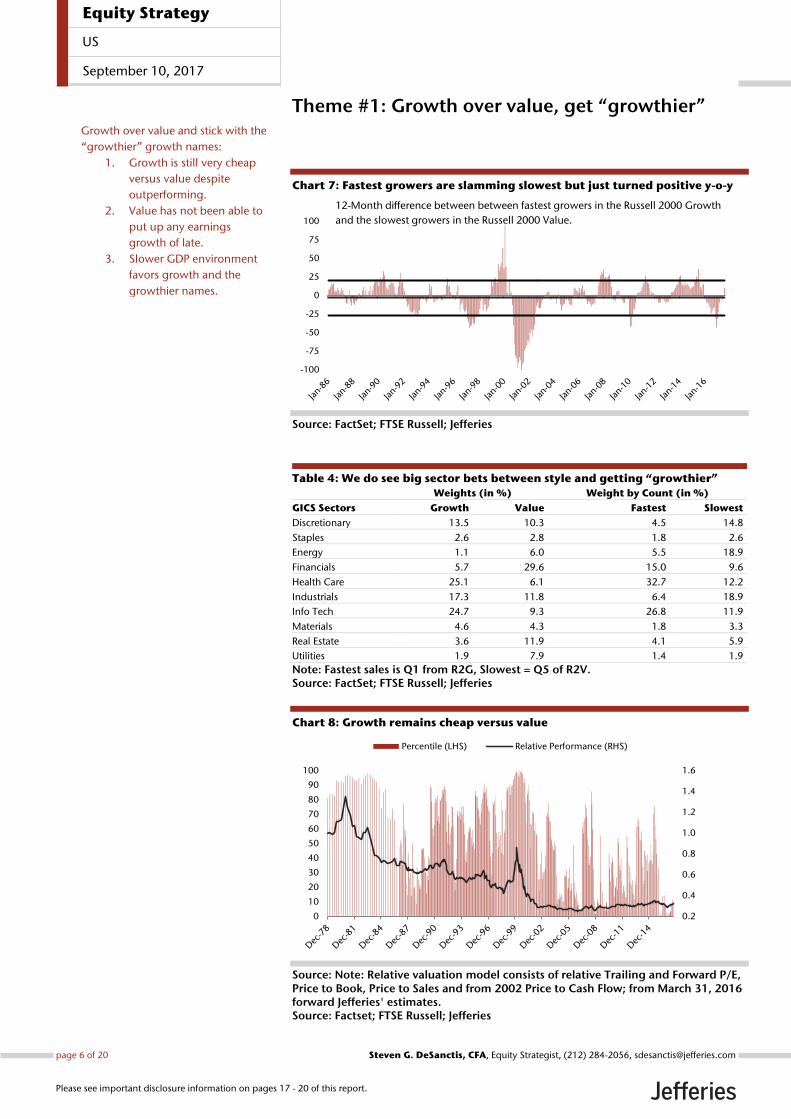
Theme #1: Growth over value, get “growthier”
Chart 7: Fastest growers are slamming slowest but just turned positive y-o-y
Source: FactSet; FTSE Russell; Jefferies
Table 4: We do see big sector bets between style and getting “growthier”
Weights (in %) Weight by Count (in %)
GICS Sectors Growth Value Fastest Slowest
Discretionary 13.5 10.3 4.5 14.8
Staples 2.6 2.8 1.8 2.6
Energy 1.1 6.0 5.5 18.9
Financials 5.7 29.6 15.0 9.6
Health Care 25.1 6.1 32.7 12.2
Industrials 17.3 11.8 6.4 18.9
Info Tech 24.7 9.3 26.8 11.9
Materials 4.6 4.3 1.8 3.3
Real Estate 3.6 11.9 4.1 5.9
Utilities 1.9 7.9 1.4 1.9
Note: Fastest sales is Q1 from R2G, Slowest = Q5 of R2V. Source: FactSet; FTSE Russell; Jefferies
Chart 8: Growth remains cheap versus value
Source: Note: Relative valuation model consists of relative Trailing and Forward P/E, Price to Book, Price to Sales and from 2002 Price to Cash Flow; from March 31, 2016 forward Jefferies' estimates. Source: Factset; FTSE Russell; Jefferies
-100
-75
-50
-25
0
25
50
75
100
12-Month difference between between fastest growers in the Russell 2000 Growth
and the slowest growers in the Russell 2000 Value.
0.2
0.4
0.6
0.8
1.0
1.2
1.4
1.6
0
10
20
30
40
50
60
70
80
90
100
Percentile (LHS) Relative Performance (RHS)
Growth over value and stick with the
“growthier” growth names:
1. Growth is still very cheap
versus value despite
outperforming.
2. Value has not been able to
put up any earnings
growth of late.
3. Slower GDP environment
favors growth and the
growthier names.
Equity Strategy
US
September 10, 2017
page 6 of 20 , Equity Strategist, (212) 284-2056, [email protected] G. DeSanctis, CFA
Please see important disclosure information on pages 17 - 20 of this report.
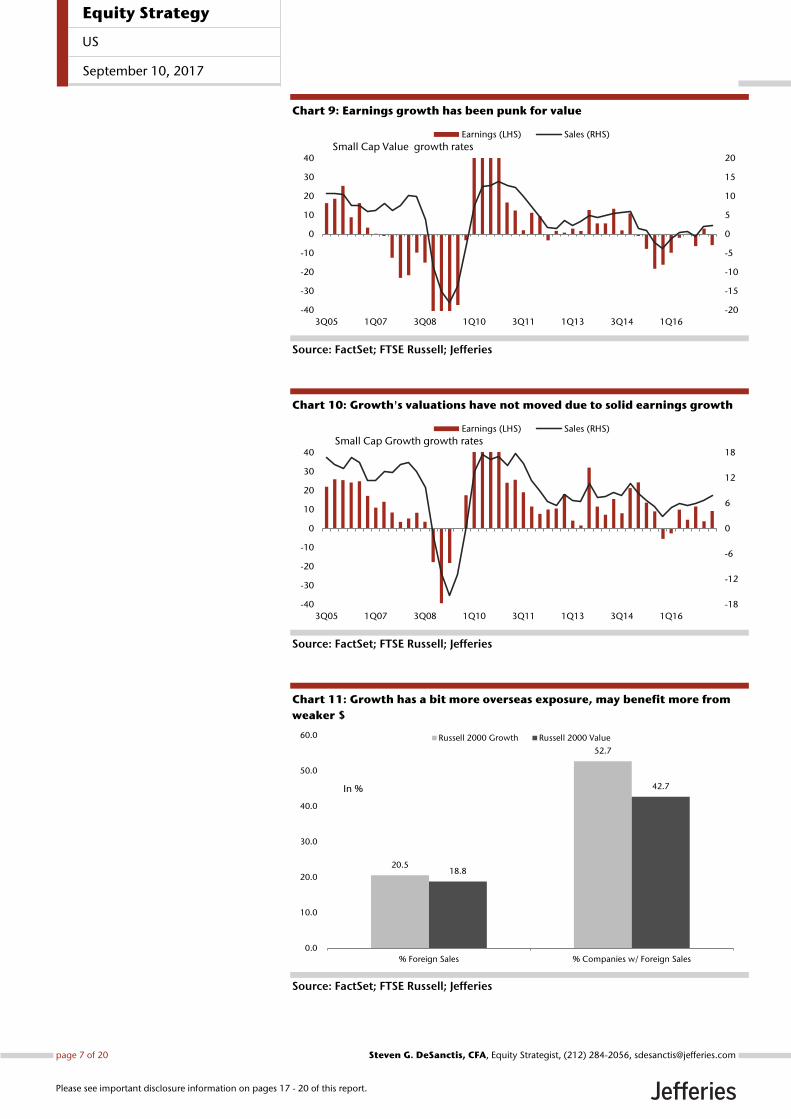
Chart 9: Earnings growth has been punk for value
Source: FactSet; FTSE Russell; Jefferies
Chart 10: Growth's valuations have not moved due to solid earnings growth
Source: FactSet; FTSE Russell; Jefferies
Chart 11: Growth has a bit more overseas exposure, may benefit more from
weaker $
Source: FactSet; FTSE Russell; Jefferies
-20
-15
-10
-5
0
5
10
15
20
-40
-30
-20
-10
0
10
20
30
40
3Q05 1Q07 3Q08 1Q10 3Q11 1Q13 3Q14 1Q16
Earnings (LHS) Sales (RHS)
Small Cap Value growth rates
-18
-12
-6
0
6
12
18
-40
-30
-20
-10
0
10
20
30
40
3Q05 1Q07 3Q08 1Q10 3Q11 1Q13 3Q14 1Q16
Earnings (LHS) Sales (RHS)
Small Cap Growth growth rates
20.5
52.7
18.8
42.7
0.0
10.0
20.0
30.0
40.0
50.0
60.0
% Foreign Sales % Companies w/ Foreign Sales
Russell 2000 Growth Russell 2000 Value
In %
Equity Strategy
US
September 10, 2017
page 7 of 20 , Equity Strategist, (212) 284-2056, [email protected] G. DeSanctis, CFA
Please see important disclosure information on pages 17 - 20 of this report.
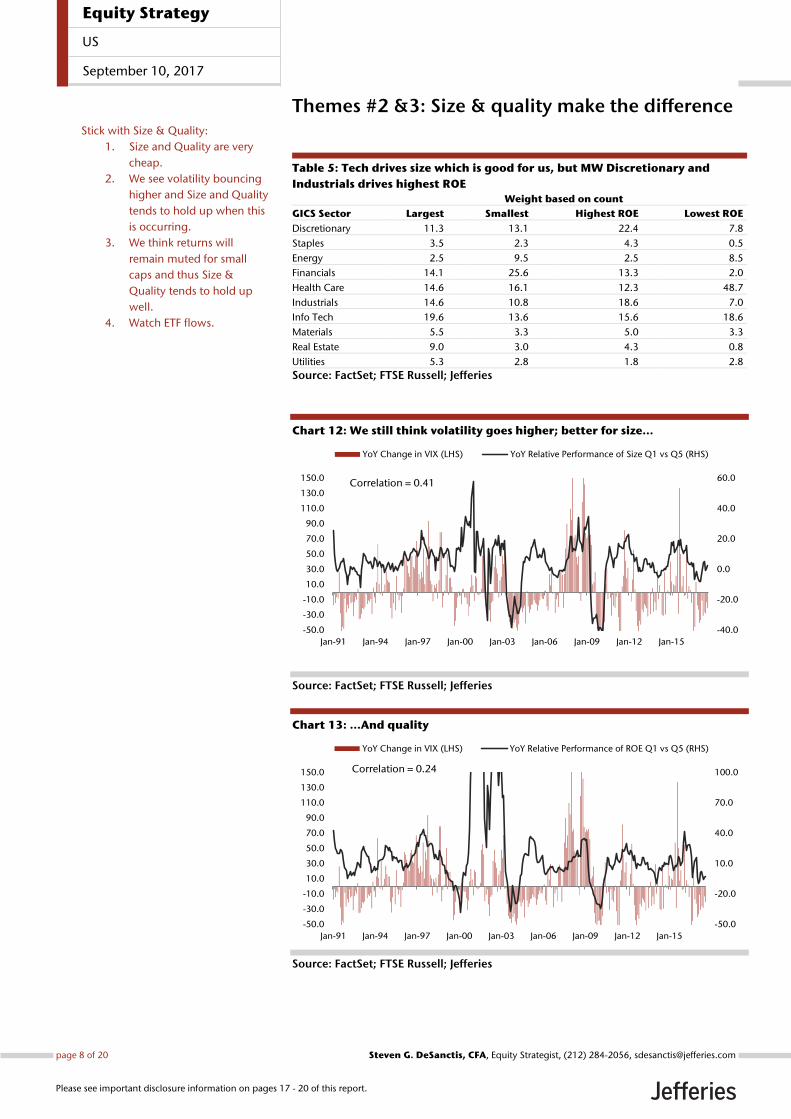
Themes #2 &3: Size & quality make the difference
Table 5: Tech drives size which is good for us, but MW Discretionary and
Industrials drives highest ROE
Weight based on count
GICS Sector Largest Smallest Highest ROE Lowest ROE
Discretionary 11.3 13.1 22.4 7.8
Staples 3.5 2.3 4.3 0.5
Energy 2.5 9.5 2.5 8.5
Financials 14.1 25.6 13.3 2.0
Health Care 14.6 16.1 12.3 48.7
Industrials 14.6 10.8 18.6 7.0
Info Tech 19.6 13.6 15.6 18.6
Materials 5.5 3.3 5.0 3.3
Real Estate 9.0 3.0 4.3 0.8
Utilities 5.3 2.8 1.8 2.8
Source: FactSet; FTSE Russell; Jefferies
Chart 12: We still think volatility goes higher; better for size...
Source: FactSet; FTSE Russell; Jefferies
Chart 13: ...And quality
Source: FactSet; FTSE Russell; Jefferies
-40.0
-20.0
0.0
20.0
40.0
60.0
-50.0
-30.0
-10.0
10.0
30.0
50.0
70.0
90.0
110.0
130.0
150.0
Jan-91 Jan-94 Jan-97 Jan-00 Jan-03 Jan-06 Jan-09 Jan-12 Jan-15
YoY Change in VIX (LHS) YoY Relative Performance of Size Q1 vs Q5 (RHS)
Correlation = 0.41
-50.0
-20.0
10.0
40.0
70.0
100.0
-50.0
-30.0
-10.0
10.0
30.0
50.0
70.0
90.0
110.0
130.0
150.0
Jan-91 Jan-94 Jan-97 Jan-00 Jan-03 Jan-06 Jan-09 Jan-12 Jan-15
YoY Change in VIX (LHS) YoY Relative Performance of ROE Q1 vs Q5 (RHS)
Correlation = 0.24
Stick with Size & Quality:
1. Size and Quality are very
cheap.
2. We see volatility bouncing
higher and Size and Quality
tends to hold up when this
is occurring.
3. We think returns will
remain muted for small
caps and thus Size &
Quality tends to hold up
well.
4. Watch ETF flows.
Equity Strategy
US
September 10, 2017
page 8 of 20 , Equity Strategist, (212) 284-2056, [email protected] G. DeSanctis, CFA
Please see important disclosure information on pages 17 - 20 of this report.
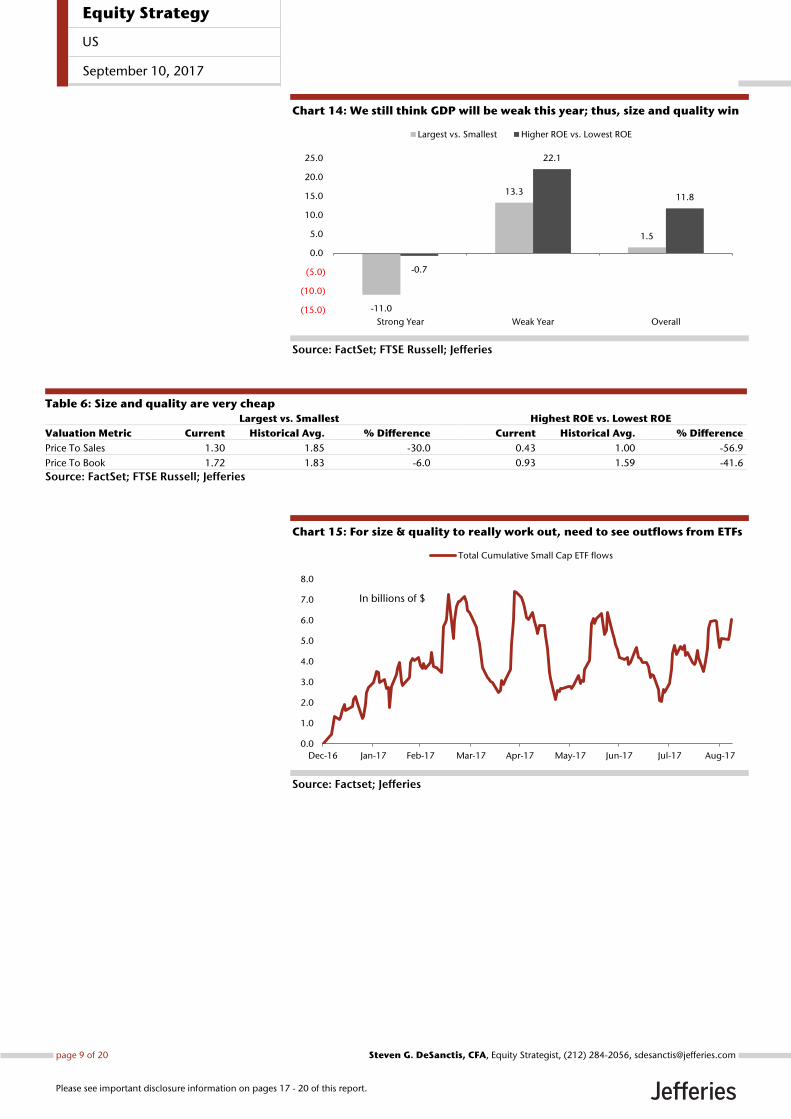
Chart 14: We still think GDP will be weak this year; thus, size and quality win
Source: FactSet; FTSE Russell; Jefferies
Table 6: Size and quality are very cheap
Largest vs. Smallest Highest ROE vs. Lowest ROE
Valuation Metric Current Historical Avg. % Difference Current Historical Avg. % Difference
Price To Sales 1.30 1.85 -30.0 0.43 1.00 -56.9
Price To Book 1.72 1.83 -6.0 0.93 1.59 -41.6
Source: FactSet; FTSE Russell; Jefferies
Chart 15: For size & quality to really work out, need to see outflows from ETFs
Source: Factset; Jefferies
-11.0
13.3
1.5
-0.7
22.1
11.8
(15.0)
(10.0)
(5.0)
0.0
5.0
10.0
15.0
20.0
25.0
Strong Year Weak Year Overall
Largest vs. Smallest Higher ROE vs. Lowest ROE
0.0
1.0
2.0
3.0
4.0
5.0
6.0
7.0
8.0
Dec-16 Jan-17 Feb-17 Mar-17 Apr-17 May-17 Jun-17 Jul-17 Aug-17
Total Cumulative Small Cap ETF flows
In billions of $
Equity Strategy
US
September 10, 2017
page 9 of 20 , Equity Strategist, (212) 284-2056, [email protected] G. DeSanctis, CFA
Please see important disclosure information on pages 17 - 20 of this report.
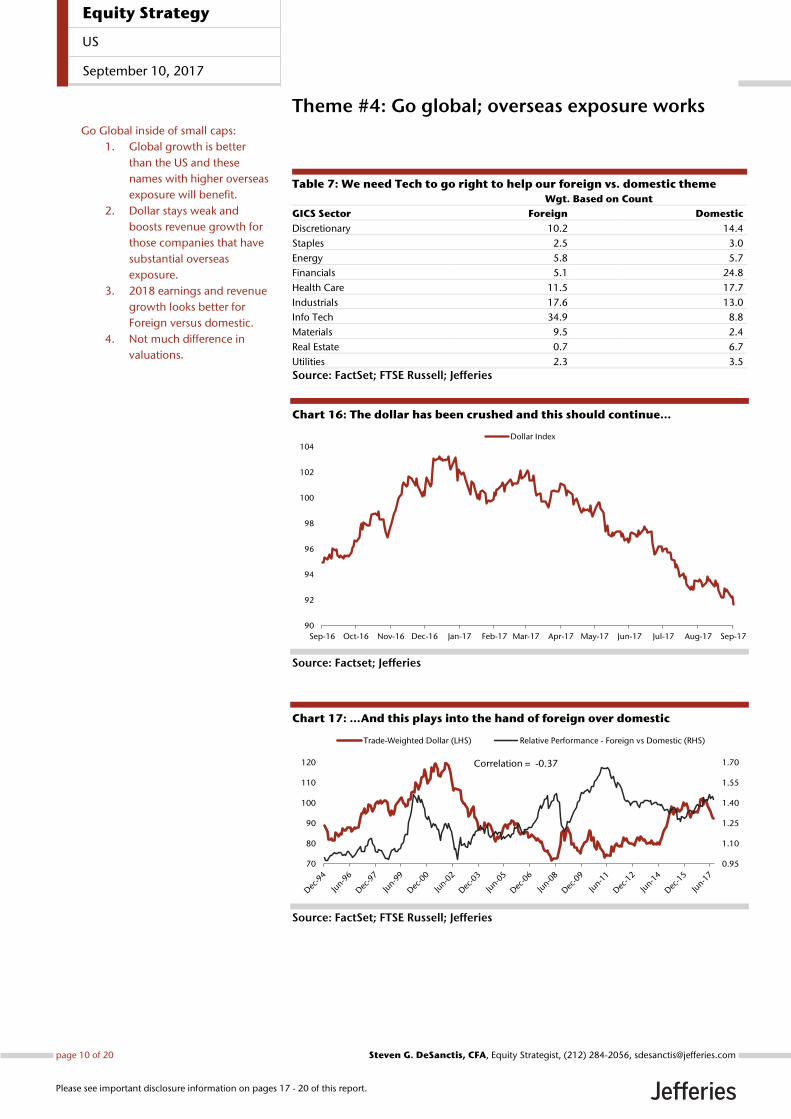
Theme #4: Go global; overseas exposure works
Table 7: We need Tech to go right to help our foreign vs. domestic theme
Wgt. Based on Count
GICS Sector Foreign Domestic
Discretionary 10.2 14.4
Staples 2.5 3.0
Energy 5.8 5.7
Financials 5.1 24.8
Health Care 11.5 17.7
Industrials 17.6 13.0
Info Tech 34.9 8.8
Materials 9.5 2.4
Real Estate 0.7 6.7
Utilities 2.3 3.5
Source: FactSet; FTSE Russell; Jefferies
Chart 16: The dollar has been crushed and this should continue...
Source: Factset; Jefferies
Chart 17: …And this plays into the hand of foreign over domestic
Source: FactSet; FTSE Russell; Jefferies
90
92
94
96
98
100
102
104
Sep-16 Oct-16 Nov-16 Dec-16 Jan-17 Feb-17 Mar-17 Apr-17 May-17 Jun-17 Jul-17 Aug-17 Sep-17
Dollar Index
0.95
1.10
1.25
1.40
1.55
1.70
70
80
90
100
110
120
Trade-Weighted Dollar (LHS) Relative Performance - Foreign vs Domestic (RHS)
Correlation = -0.37
Go Global inside of small caps:
1. Global growth is better
than the US and these
names with higher overseas
exposure will benefit.
2. Dollar stays weak and
boosts revenue growth for
those companies that have
substantial overseas
exposure.
3. 2018 earnings and revenue
growth looks better for
Foreign versus domestic.
4. Not much difference in
valuations.
Equity Strategy
US
September 10, 2017
page 10 of 20 , Equity Strategist, (212) 284-2056, [email protected] G. DeSanctis, CFA
Please see important disclosure information on pages 17 - 20 of this report.
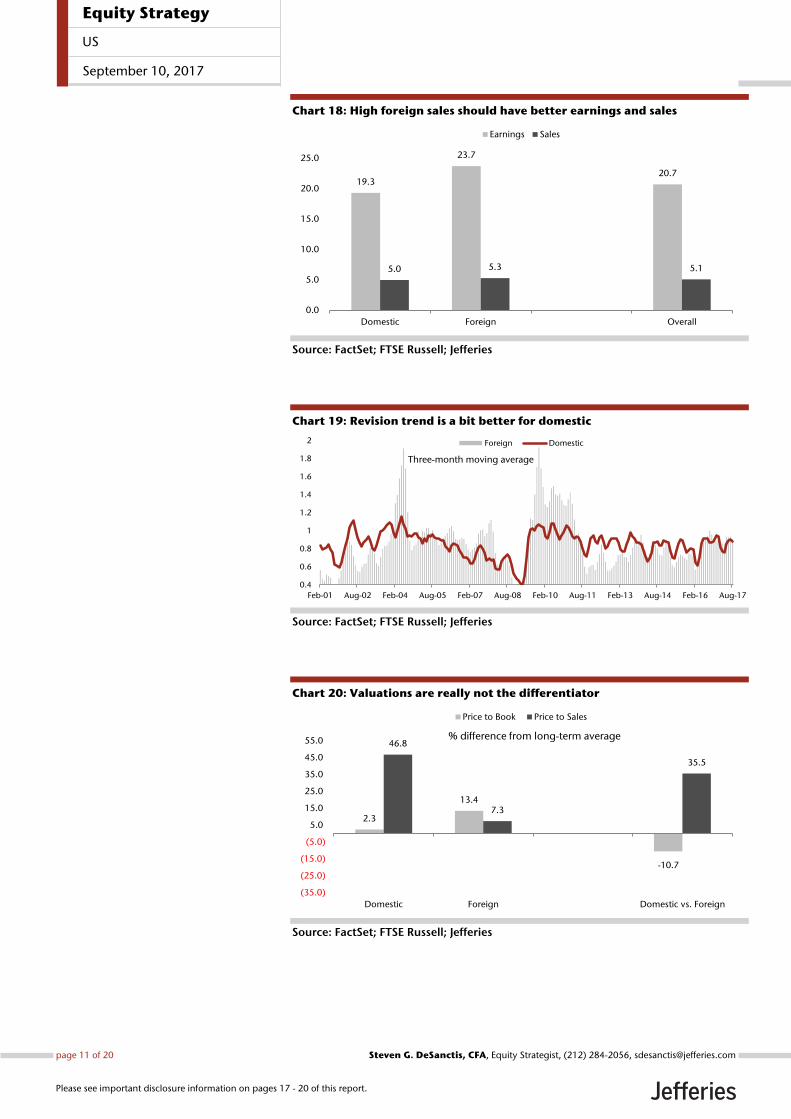
Chart 18: High foreign sales should have better earnings and sales
Source: FactSet; FTSE Russell; Jefferies
Chart 19: Revision trend is a bit better for domestic
Source: FactSet; FTSE Russell; Jefferies
Chart 20: Valuations are really not the differentiator
Source: FactSet; FTSE Russell; Jefferies
19.3
23.7
20.7
5.0 5.3 5.1
0.0
5.0
10.0
15.0
20.0
25.0
Domestic Foreign Overall
Earnings Sales
0.4
0.6
0.8
1
1.2
1.4
1.6
1.8
2
Feb-01 Aug-02 Feb-04 Aug-05 Feb-07 Aug-08 Feb-10 Aug-11 Feb-13 Aug-14 Feb-16 Aug-17
Foreign Domestic
Three-month moving average
2.3
13.4
-10.7
46.8
7.3
35.5
(35.0)
(25.0)
(15.0)
(5.0)
5.0
15.0
25.0
35.0
45.0
55.0
Domestic Foreign Domestic vs. Foreign
Price to Book Price to Sales
% difference from long-term average
Equity Strategy
US
September 10, 2017
page 11 of 20 , Equity Strategist, (212) 284-2056, [email protected] G. DeSanctis, CFA
Please see important disclosure information on pages 17 - 20 of this report.
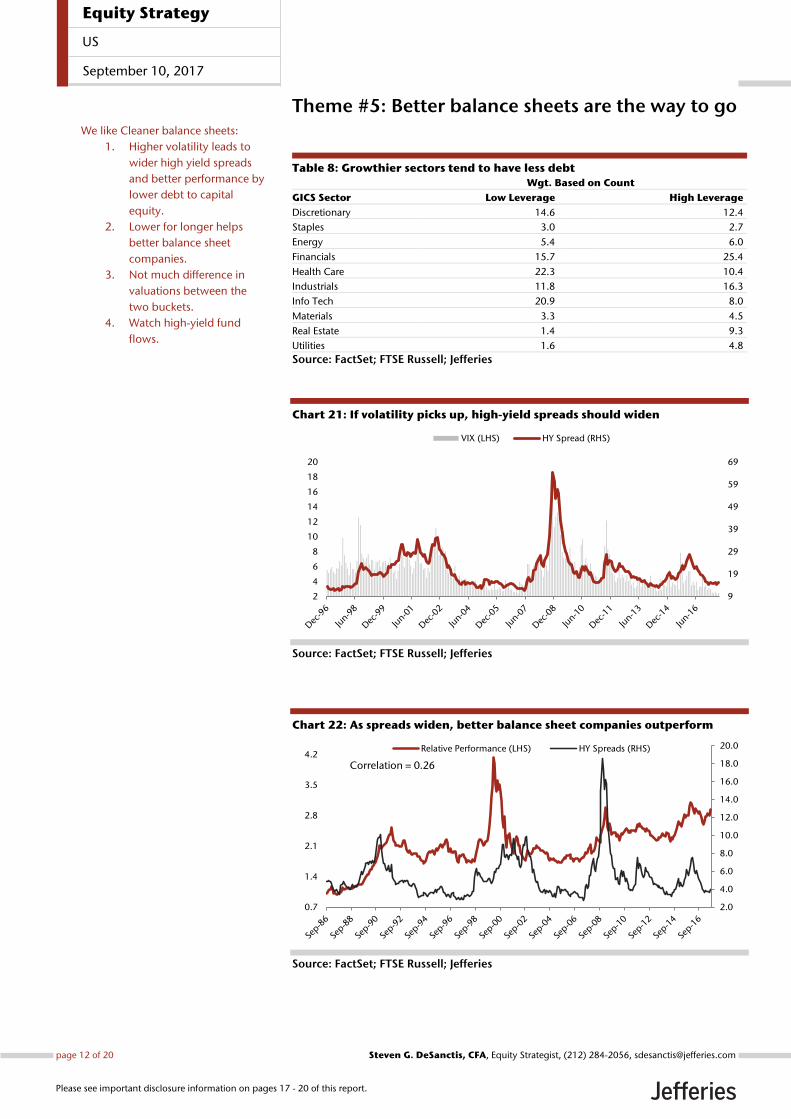
Theme #5: Better balance sheets are the way to go
Table 8: Growthier sectors tend to have less debt
Wgt. Based on Count
GICS Sector Low Leverage High Leverage
Discretionary 14.6 12.4
Staples 3.0 2.7
Energy 5.4 6.0
Financials 15.7 25.4
Health Care 22.3 10.4
Industrials 11.8 16.3
Info Tech 20.9 8.0
Materials 3.3 4.5
Real Estate 1.4 9.3
Utilities 1.6 4.8
Source: FactSet; FTSE Russell; Jefferies
Chart 21: If volatility picks up, high-yield spreads should widen
Source: FactSet; FTSE Russell; Jefferies
Chart 22: As spreads widen, better balance sheet companies outperform
Source: FactSet; FTSE Russell; Jefferies
9
19
29
39
49
59
69
2
4
6
8
10
12
14
16
18
20
VIX (LHS) HY Spread (RHS)
2.0
4.0
6.0
8.0
10.0
12.0
14.0
16.0
18.0
20.0
0.7
1.4
2.1
2.8
3.5
4.2Relative Performance (LHS) HY Spreads (RHS)
Correlation = 0.26
We like Cleaner balance sheets:
1. Higher volatility leads to
wider high yield spreads
and better performance by
lower debt to capital
equity.
2. Lower for longer helps
better balance sheet
companies.
3. Not much difference in
valuations between the
two buckets.
4. Watch high-yield fund
flows.
Equity Strategy
US
September 10, 2017
page 12 of 20 , Equity Strategist, (212) 284-2056, [email protected] G. DeSanctis, CFA
Please see important disclosure information on pages 17 - 20 of this report.
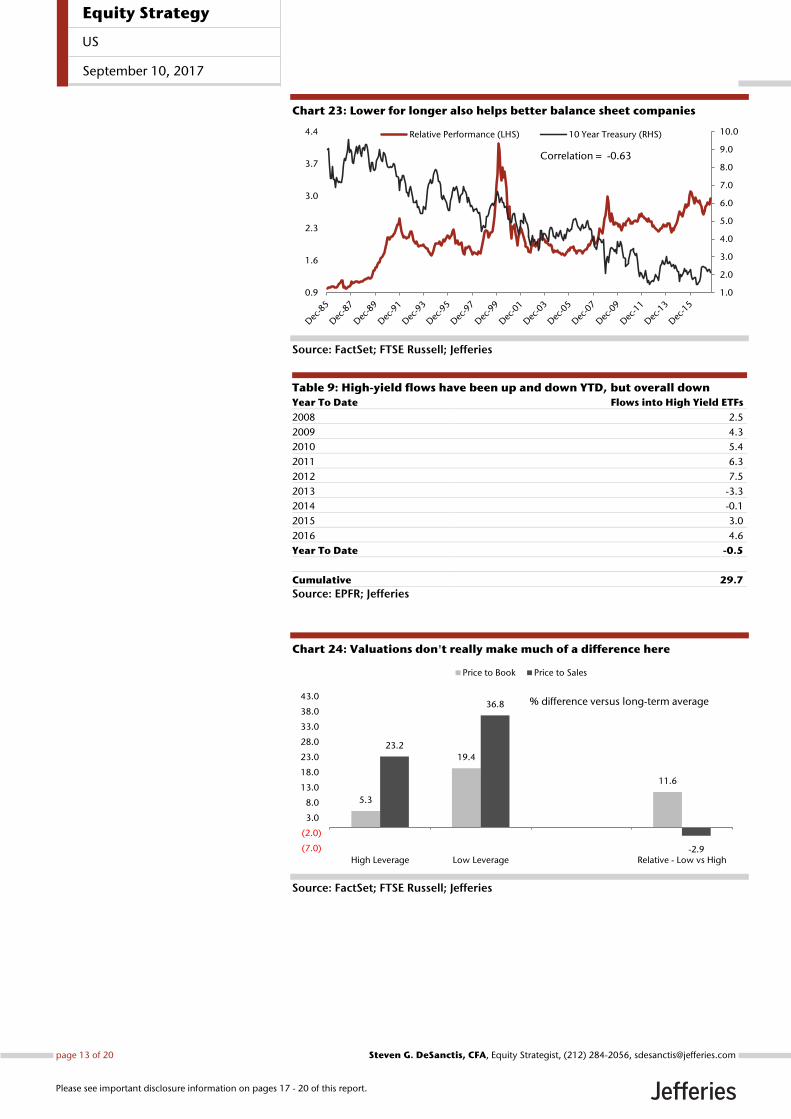
Chart 23: Lower for longer also helps better balance sheet companies
Source: FactSet; FTSE Russell; Jefferies
Table 9: High-yield flows have been up and down YTD, but overall down
Year To Date Flows into High Yield ETFs
2008 2.5
2009 4.3
2010 5.4
2011 6.3
2012 7.5
2013 -3.3
2014 -0.1
2015 3.0
2016 4.6
Year To Date -0.5
Cumulative 29.7
Source: EPFR; Jefferies
Chart 24: Valuations don't really make much of a difference here
Source: FactSet; FTSE Russell; Jefferies
1.0
2.0
3.0
4.0
5.0
6.0
7.0
8.0
9.0
10.0
0.9
1.6
2.3
3.0
3.7
4.4 Relative Performance (LHS) 10 Year Treasury (RHS)
Correlation = -0.63
5.3
19.4
11.6
23.2
36.8
-2.9(7.0)
(2.0)
3.0
8.0
13.0
18.0
23.0
28.0
33.0
38.0
43.0
High Leverage Low Leverage Relative - Low vs High
Price to Book Price to Sales
% difference versus long-term average
Equity Strategy
US
September 10, 2017
page 13 of 20 , Equity Strategist, (212) 284-2056, [email protected] G. DeSanctis, CFA
Please see important disclosure information on pages 17 - 20 of this report.
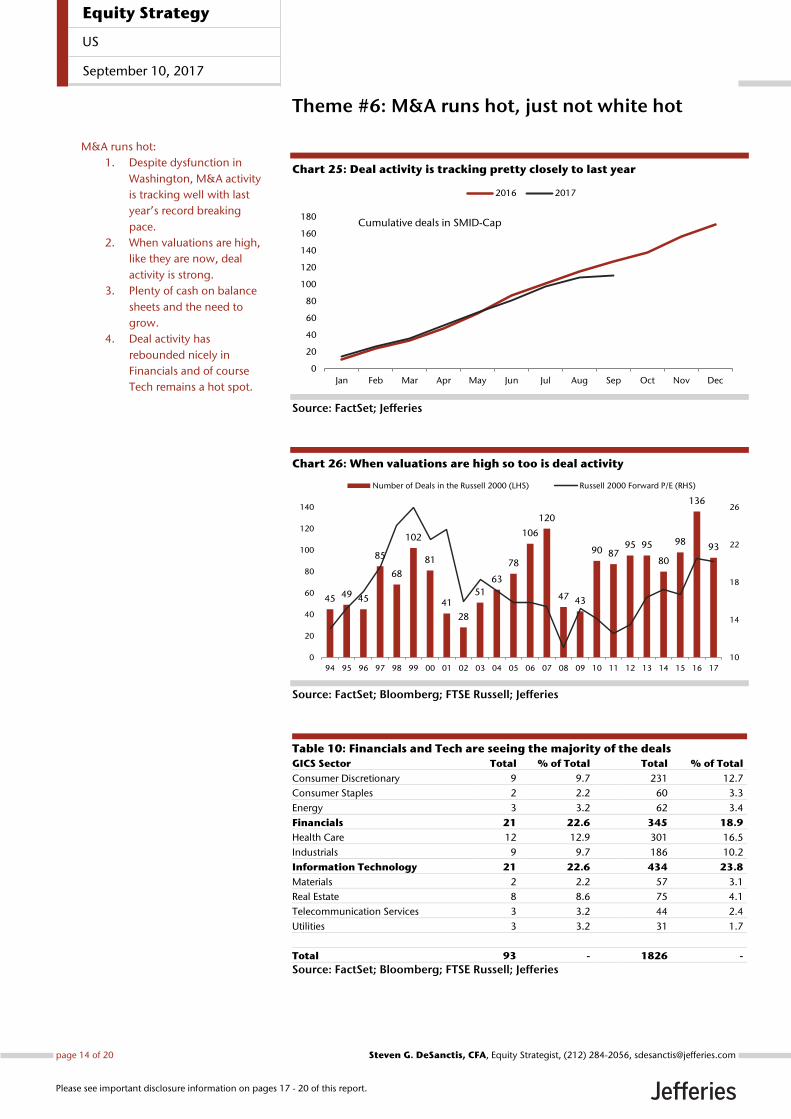
Theme #6: M&A runs hot, just not white hot
Chart 25: Deal activity is tracking pretty closely to last year
Source: FactSet; Jefferies
Chart 26: When valuations are high so too is deal activity
Source: FactSet; Bloomberg; FTSE Russell; Jefferies
Table 10: Financials and Tech are seeing the majority of the deals
GICS Sector Total % of Total Total % of Total
Consumer Discretionary 9 9.7 231 12.7
Consumer Staples 2 2.2 60 3.3
Energy 3 3.2 62 3.4
Financials 21 22.6 345 18.9
Health Care 12 12.9 301 16.5
Industrials 9 9.7 186 10.2
Information Technology 21 22.6 434 23.8
Materials 2 2.2 57 3.1
Real Estate 8 8.6 75 4.1
Telecommunication Services 3 3.2 44 2.4
Utilities 3 3.2 31 1.7
Total 93 - 1826 -
Source: FactSet; Bloomberg; FTSE Russell; Jefferies
0
20
40
60
80
100
120
140
160
180
Jan Feb Mar Apr May Jun Jul Aug Sep Oct Nov Dec
2016 2017
Cumulative deals in SMID-Cap
45 49 45
85
68
102
81
41
28
51
63
78
106
120
47 43
90 8795 95
80
98
136
93
10
14
18
22
26
0
20
40
60
80
100
120
140
94 95 96 97 98 99 00 01 02 03 04 05 06 07 08 09 10 11 12 13 14 15 16 17
Number of Deals in the Russell 2000 (LHS) Russell 2000 Forward P/E (RHS)
M&A runs hot:
1. Despite dysfunction in
Washington, M&A activity
is tracking well with last
year’s record breaking
pace.
2. When valuations are high,
like they are now, deal
activity is strong.
3. Plenty of cash on balance
sheets and the need to
grow.
4. Deal activity has
rebounded nicely in
Financials and of course
Tech remains a hot spot.
Equity Strategy
US
September 10, 2017
page 14 of 20 , Equity Strategist, (212) 284-2056, [email protected] G. DeSanctis, CFA
Please see important disclosure information on pages 17 - 20 of this report.
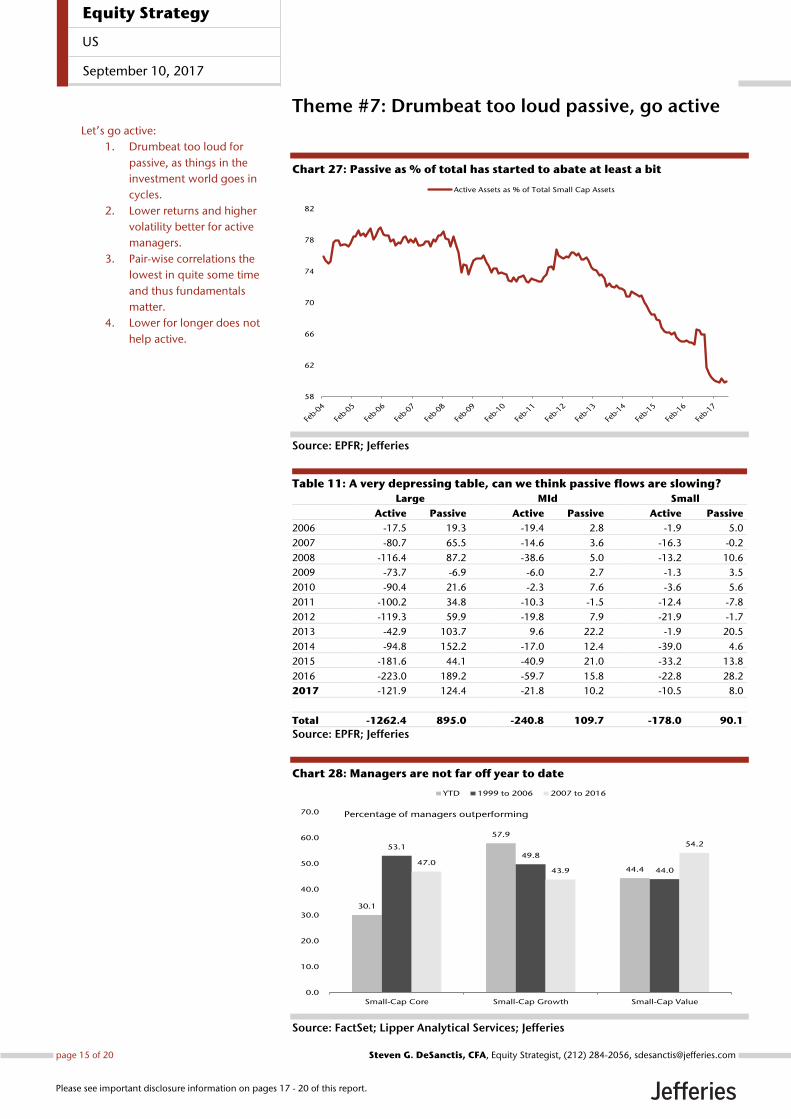
Theme #7: Drumbeat too loud passive, go active
Chart 27: Passive as % of total has started to abate at least a bit
Source: EPFR; Jefferies
Table 11: A very depressing table, can we think passive flows are slowing?
Large MId Small
Active Passive Active Passive Active Passive
2006 -17.5 19.3 -19.4 2.8 -1.9 5.0
2007 -80.7 65.5 -14.6 3.6 -16.3 -0.2
2008 -116.4 87.2 -38.6 5.0 -13.2 10.6
2009 -73.7 -6.9 -6.0 2.7 -1.3 3.5
2010 -90.4 21.6 -2.3 7.6 -3.6 5.6
2011 -100.2 34.8 -10.3 -1.5 -12.4 -7.8
2012 -119.3 59.9 -19.8 7.9 -21.9 -1.7
2013 -42.9 103.7 9.6 22.2 -1.9 20.5
2014 -94.8 152.2 -17.0 12.4 -39.0 4.6
2015 -181.6 44.1 -40.9 21.0 -33.2 13.8
2016 -223.0 189.2 -59.7 15.8 -22.8 28.2
2017 -121.9 124.4 -21.8 10.2 -10.5 8.0
Total -1262.4 895.0 -240.8 109.7 -178.0 90.1
Source: EPFR; Jefferies
Chart 28: Managers are not far off year to date
Source: FactSet; Lipper Analytical Services; Jefferies
58
62
66
70
74
78
82
Active Assets as % of Total Small Cap Assets
30.1
57.9
44.4
53.149.8
44.047.0
43.9
54.2
0.0
10.0
20.0
30.0
40.0
50.0
60.0
70.0
Small-Cap Core Small-Cap Growth Small-Cap Value
YTD 1999 to 2006 2007 to 2016
Percentage of managers outperforming
Let’s go active:
1. Drumbeat too loud for
passive, as things in the
investment world goes in
cycles.
2. Lower returns and higher
volatility better for active
managers.
3. Pair-wise correlations the
lowest in quite some time
and thus fundamentals
matter.
4. Lower for longer does not
help active.
Equity Strategy
US
September 10, 2017
page 15 of 20 , Equity Strategist, (212) 284-2056, [email protected] G. DeSanctis, CFA
Please see important disclosure information on pages 17 - 20 of this report.
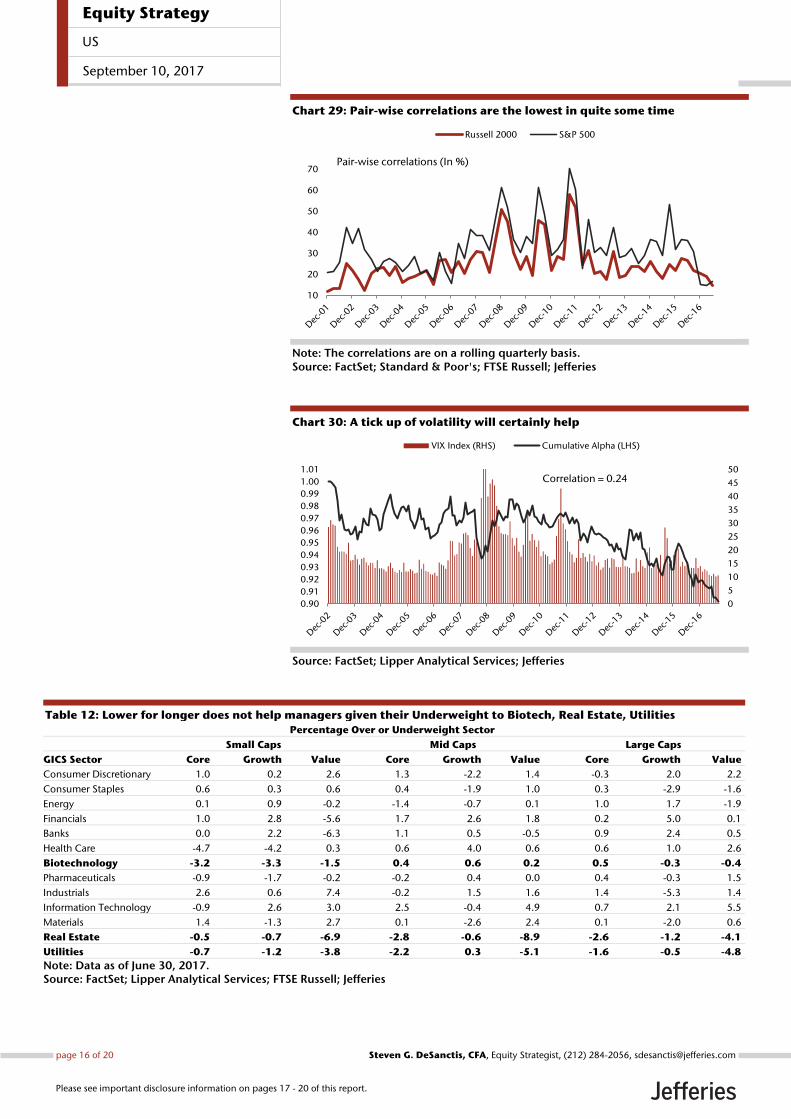
Chart 29: Pair-wise correlations are the lowest in quite some time
Note: The correlations are on a rolling quarterly basis. Source: FactSet; Standard & Poor's; FTSE Russell; Jefferies
Chart 30: A tick up of volatility will certainly help
Source: FactSet; Lipper Analytical Services; Jefferies
Table 12: Lower for longer does not help managers given their Underweight to Biotech, Real Estate, Utilities
Percentage Over or Underweight Sector
Small Caps Mid Caps Large Caps
GICS Sector Core Growth Value Core Growth Value Core Growth Value
Consumer Discretionary 1.0 0.2 2.6 1.3 -2.2 1.4 -0.3 2.0 2.2
Consumer Staples 0.6 0.3 0.6 0.4 -1.9 1.0 0.3 -2.9 -1.6
Energy 0.1 0.9 -0.2 -1.4 -0.7 0.1 1.0 1.7 -1.9
Financials 1.0 2.8 -5.6 1.7 2.6 1.8 0.2 5.0 0.1
Banks 0.0 2.2 -6.3 1.1 0.5 -0.5 0.9 2.4 0.5
Health Care -4.7 -4.2 0.3 0.6 4.0 0.6 0.6 1.0 2.6
Biotechnology -3.2 -3.3 -1.5 0.4 0.6 0.2 0.5 -0.3 -0.4
Pharmaceuticals -0.9 -1.7 -0.2 -0.2 0.4 0.0 0.4 -0.3 1.5
Industrials 2.6 0.6 7.4 -0.2 1.5 1.6 1.4 -5.3 1.4
Information Technology -0.9 2.6 3.0 2.5 -0.4 4.9 0.7 2.1 5.5
Materials 1.4 -1.3 2.7 0.1 -2.6 2.4 0.1 -2.0 0.6
Real Estate -0.5 -0.7 -6.9 -2.8 -0.6 -8.9 -2.6 -1.2 -4.1
Utilities -0.7 -1.2 -3.8 -2.2 0.3 -5.1 -1.6 -0.5 -4.8
Note: Data as of June 30, 2017. Source: FactSet; Lipper Analytical Services; FTSE Russell; Jefferies
10
20
30
40
50
60
70
Russell 2000 S&P 500
Pair-wise correlations (In %)
0
5
10
15
20
25
30
35
40
45
50
0.90
0.91
0.92
0.93
0.94
0.95
0.96
0.97
0.98
0.99
1.00
1.01
VIX Index (RHS) Cumulative Alpha (LHS)
Correlation = 0.24
Equity Strategy
US
September 10, 2017
page 16 of 20 , Equity Strategist, (212) 284-2056, [email protected] G. DeSanctis, CFA
Please see important disclosure information on pages 17 - 20 of this report.
Analyst Certification:I, Steven G. DeSanctis, CFA, certify that all of the views expressed in this research report accurately reflect my personal views about the subjectsecurity(ies) and subject company(ies). I also certify that no part of my compensation was, is, or will be, directly or indirectly, related to the specificrecommendations or views expressed in this research report.I, Miles Bredenoord, CFA, certify that all of the views expressed in this research report accurately reflect my personal views about the subjectsecurity(ies) and subject company(ies). I also certify that no part of my compensation was, is, or will be, directly or indirectly, related to the specificrecommendations or views expressed in this research report.As is the case with all Jefferies employees, the analyst(s) responsible for the coverage of the financial instruments discussed in this report receivescompensation based in part on the overall performance of the firm, including investment banking income. We seek to update our research asappropriate, but various regulations may prevent us from doing so. Aside from certain industry reports published on a periodic basis, the large majorityof reports are published at irregular intervals as appropriate in the analyst's judgement.
Investment Recommendation Record(Article 3(1)e and Article 7 of MAR)
Recommendation Published , 15:08 ET. September 10, 2017Recommendation Distributed , 15:08 ET. September 10, 2017
Company Specific DisclosuresFor Important Disclosure information on companies recommended in this report, please visit our website at https://javatar.bluematrix.com/sellside/Disclosures.action or call 212.284.2300.
Explanation of Jefferies RatingsBuy - Describes securities that we expect to provide a total return (price appreciation plus yield) of 15% or more within a 12-month period.Hold - Describes securities that we expect to provide a total return (price appreciation plus yield) of plus 15% or minus 10% within a 12-month period.Underperform - Describes securities that we expect to provide a total return (price appreciation plus yield) of minus 10% or less within a 12-monthperiod.The expected total return (price appreciation plus yield) for Buy rated securities with an average security price consistently below $10 is 20% or morewithin a 12-month period as these companies are typically more volatile than the overall stock market. For Hold rated securities with an averagesecurity price consistently below $10, the expected total return (price appreciation plus yield) is plus or minus 20% within a 12-month period. ForUnderperform rated securities with an average security price consistently below $10, the expected total return (price appreciation plus yield) is minus20% or less within a 12-month period.NR - The investment rating and price target have been temporarily suspended. Such suspensions are in compliance with applicable regulations and/or Jefferies policies.CS - Coverage Suspended. Jefferies has suspended coverage of this company.NC - Not covered. Jefferies does not cover this company.Restricted - Describes issuers where, in conjunction with Jefferies engagement in certain transactions, company policy or applicable securitiesregulations prohibit certain types of communications, including investment recommendations.Monitor - Describes securities whose company fundamentals and financials are being monitored, and for which no financial projections or opinionson the investment merits of the company are provided.
Valuation MethodologyJefferies' methodology for assigning ratings may include the following: market capitalization, maturity, growth/value, volatility and expected totalreturn over the next 12 months. The price targets are based on several methodologies, which may include, but are not restricted to, analyses of marketrisk, growth rate, revenue stream, discounted cash flow (DCF), EBITDA, EPS, cash flow (CF), free cash flow (FCF), EV/EBITDA, P/E, PE/growth, P/CF,P/FCF, premium (discount)/average group EV/EBITDA, premium (discount)/average group P/E, sum of the parts, net asset value, dividend returns,and return on equity (ROE) over the next 12 months.
Jefferies Franchise PicksJefferies Franchise Picks include stock selections from among the best stock ideas from our equity analysts over a 12 month period. Stock selectionis based on fundamental analysis and may take into account other factors such as analyst conviction, differentiated analysis, a favorable risk/rewardratio and investment themes that Jefferies analysts are recommending. Jefferies Franchise Picks will include only Buy rated stocks and the numbercan vary depending on analyst recommendations for inclusion. Stocks will be added as new opportunities arise and removed when the reason forinclusion changes, the stock has met its desired return, if it is no longer rated Buy and/or if it triggers a stop loss. Stocks having 120 day volatility inthe bottom quartile of S&P stocks will continue to have a 15% stop loss, and the remainder will have a 20% stop. Franchise Picks are not intendedto represent a recommended portfolio of stocks and is not sector based, but we may note where we believe a Pick falls within an investment stylesuch as growth or value.
Risks which may impede the achievement of our Price Target
Equity Strategy
US
September 10, 2017
page 17 of 20 , Equity Strategist, (212) 284-2056, [email protected] G. DeSanctis, CFA
Please see important disclosure information on pages 17 - 20 of this report.
This report was prepared for general circulation and does not provide investment recommendations specific to individual investors. As such, thefinancial instruments discussed in this report may not be suitable for all investors and investors must make their own investment decisions basedupon their specific investment objectives and financial situation utilizing their own financial advisors as they deem necessary. Past performance ofthe financial instruments recommended in this report should not be taken as an indication or guarantee of future results. The price, value of, andincome from, any of the financial instruments mentioned in this report can rise as well as fall and may be affected by changes in economic, financialand political factors. If a financial instrument is denominated in a currency other than the investor's home currency, a change in exchange rates mayadversely affect the price of, value of, or income derived from the financial instrument described in this report. In addition, investors in securities suchas ADRs, whose values are affected by the currency of the underlying security, effectively assume currency risk.
Other Companies Mentioned in This Report• A.O. Smith Corporation (AOS: $56.52, BUY)• Albemarle Corporation (ALB: $118.28, BUY)• Bruker Corporation (BRKR: $29.31, BUY)• Deckers Outdoor (DECK: $64.62, BUY)• IAC / InterActiveCorp (IAC: $114.59, BUY)• Invesco Ltd. (IVZ: $31.69, BUY)• LKQ Corporation (LKQ: $34.81, BUY)• Maxim Integrated Products, Inc. (MXIM: $45.87, BUY)• Oclaro Inc (OCLR: $8.32, BUY)• OraSure Technologies, Inc. (OSUR: $21.60, BUY)• Orthofix International NV (OFIX: $49.39, BUY)• Take-Two Interactive Software, Inc. (TTWO: $99.62, BUY)• The Cooper Companies, Inc. (COO: $251.48, BUY)• Varian Medical Systems, Inc. (VAR: $106.42, BUY)• Varonis Systems, Inc. (VRNS: $39.45, BUY)
For Important Disclosure information on companies recommended in this report, please visit our website at https://javatar.bluematrix.com/sellside/Disclosures.action or call 212.284.2300.
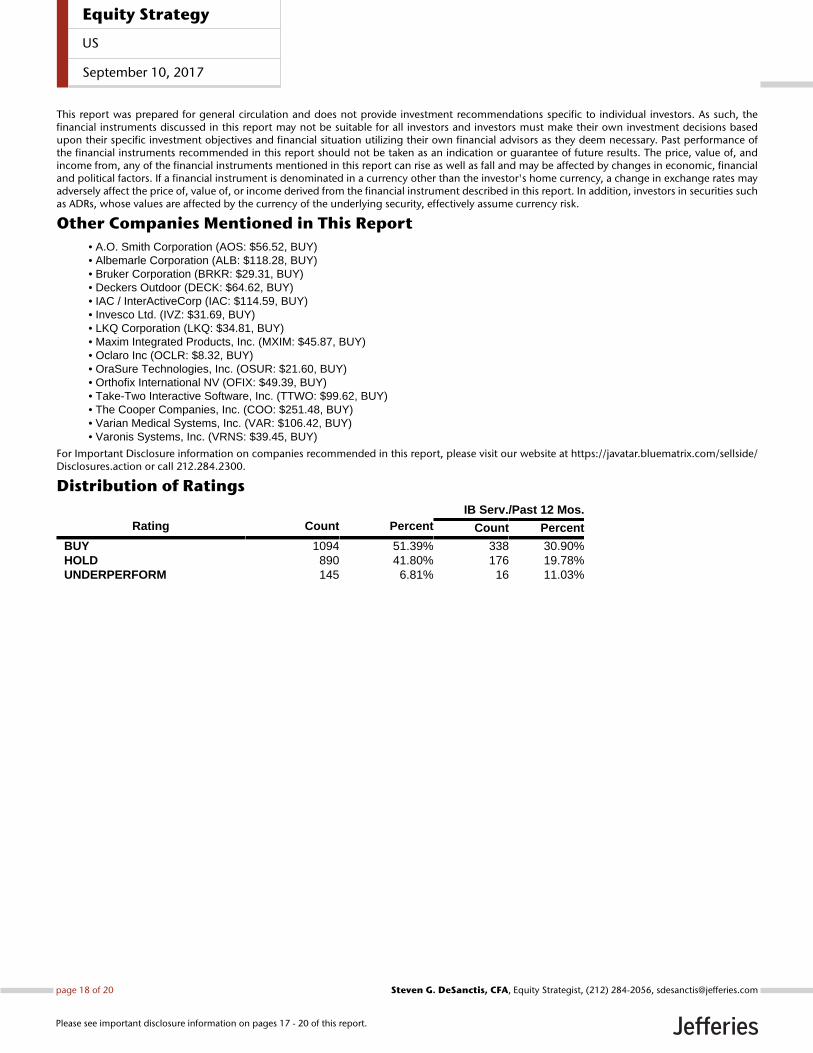
Distribution of RatingsIB Serv./Past 12 Mos.
Rating Count Percent Count Percent
BUY 1094 51.39% 338 30.90%HOLD 890 41.80% 176 19.78%UNDERPERFORM 145 6.81% 16 11.03%
Equity Strategy
US
September 10, 2017
page 18 of 20 , Equity Strategist, (212) 284-2056, [email protected] G. DeSanctis, CFA
Please see important disclosure information on pages 17 - 20 of this report.
Other Important DisclosuresJefferies does and seeks to do business with companies covered in its research reports. As a result, investors should be aware that Jefferies may have aconflict of interest that could affect the objectivity of this report. Investors should consider this report as only a single factor in making their investmentdecision.Jefferies Equity Research refers to research reports produced by analysts employed by one of the following Jefferies Group LLC (“Jefferies”) groupcompanies:United States: Jefferies LLC which is an SEC registered firm and a member of FINRA.United Kingdom: Jefferies International Limited, which is authorized and regulated by the Financial Conduct Authority; registered in England andWales No. 1978621; registered office: Vintners Place, 68 Upper Thames Street, London EC4V 3BJ; telephone +44 (0)20 7029 8000; facsimile +44 (0)207029 8010.Hong Kong: Jefferies Hong Kong Limited, which is licensed by the Securities and Futures Commission of Hong Kong with CE number ATS546; locatedat Suite 2201, 22nd Floor, Cheung Kong Center, 2 Queen’s Road Central, Hong Kong.Singapore: Jefferies Singapore Limited, which is licensed by the Monetary Authority of Singapore; located at 80 Raffles Place #15-20, UOB Plaza 2,Singapore 048624, telephone: +65 6551 3950.Japan: Jefferies (Japan) Limited, Tokyo Branch, which is a securities company registered by the Financial Services Agency of Japan and is a memberof the Japan Securities Dealers Association; located at Hibiya Marine Bldg, 3F, 1-5-1 Yuraku-cho, Chiyoda-ku, Tokyo 100-0006; telephone +813 52516100; facsimile +813 5251 6101.India: Jefferies India Private Limited (CIN - U74140MH2007PTC200509), which is licensed by the Securities and Exchange Board of India as a MerchantBanker (INM000011443), Research Analyst (INH000000701) and a Stock Broker with Bombay Stock Exchange Limited (INB011491033) and NationalStock Exchange of India Limited (INB231491037) in the Capital Market Segment; located at 42/43, 2 North Avenue, Maker Maxity, Bandra-KurlaComplex, Bandra (East) Mumbai 400 051, India; Tel +91 22 4356 6000.This material has been prepared by Jefferies employing appropriate expertise, and in the belief that it is fair and not misleading. The information setforth herein was obtained from sources believed to be reliable, but has not been independently verified by Jefferies. Therefore, except for any obligationunder applicable rules we do not guarantee its accuracy. Additional and supporting information is available upon request. Unless prohibited by theprovisions of Regulation S of the U.S. Securities Act of 1933, this material is distributed in the United States ("US"), by Jefferies LLC, a US-registeredbroker-dealer, which accepts responsibility for its contents in accordance with the provisions of Rule 15a-6, under the US Securities Exchange Act of1934. Transactions by or on behalf of any US person may only be effected through Jefferies LLC. In the United Kingdom and European EconomicArea this report is issued and/or approved for distribution by Jefferies International Limited and is intended for use only by persons who have, or havebeen assessed as having, suitable professional experience and expertise, or by persons to whom it can be otherwise lawfully distributed. JefferiesInternational Limited Equity Research personnel are separated from other business groups and are not under their supervision or control. JefferiesInternational Limited has implemented policies to (i) address conflicts of interest related to the preparation, content and distribution of research reports,public appearances, and interactions between research analysts and those outside of the research department; (ii) ensure that research analysts areinsulated from the review, pressure, or oversight by persons engaged in investment banking services activities or other persons who might be biased intheir judgment or supervision; and (iii) promote objective and reliable research that reflects the truly held opinions of research analysts and prevents theuse of research reports or research analysts to manipulate or condition the market or improperly favor the interests of the Jefferies International Limitedor a current or prospective customer or class of customers. Jefferies International Limited may allow its analysts to undertake private consultancywork. Jefferies International Limited’s conflicts management policy sets out the arrangements Jefferies International Limited employs to manage anypotential conflicts of interest that may arise as a result of such consultancy work. Jefferies International Ltd, its affiliates or subsidiaries, may make amarket or provide liquidity in the financial instruments referred to in this investment recommendation. For Canadian investors, this material is intendedfor use only by professional or institutional investors. None of the investments or investment services mentioned or described herein is available toother persons or to anyone in Canada who is not a "Designated Institution" as defined by the Securities Act (Ontario). In Singapore, Jefferies SingaporeLimited is regulated by the Monetary Authority of Singapore. For investors in the Republic of Singapore, this material is provided by Jefferies SingaporeLimited pursuant to Regulation 32C of the Financial Advisers Regulations. The material contained in this document is intended solely for accredited,expert or institutional investors, as defined under the Securities and Futures Act (Cap. 289 of Singapore). If there are any matters arising from, orin connection with this material, please contact Jefferies Singapore Limited, located at 80 Raffles Place #15-20, UOB Plaza 2, Singapore 048624,telephone: +65 6551 3950. In Japan this material is issued and distributed by Jefferies (Japan) Limited to institutional investors only. In Hong Kong,this report is issued and approved by Jefferies Hong Kong Limited and is intended for use only by professional investors as defined in the Hong KongSecurities and Futures Ordinance and its subsidiary legislation. In the Republic of China (Taiwan), this report should not be distributed. The researchin relation to this report is conducted outside the PRC. This report does not constitute an offer to sell or the solicitation of an offer to buy any securitiesin the PRC. PRC investors shall have the relevant qualifications to invest in such securities and shall be responsible for obtaining all relevant approvals,licenses, verifications and/or registrations from the relevant governmental authorities themselves. In India this report is made available by JefferiesIndia Private Limited. In Australia this information is issued solely by Jefferies International Limited and is directed solely at wholesale clients withinthe meaning of the Corporations Act 2001 of Australia (the "Act") in connection with their consideration of any investment or investment servicethat is the subject of this document. Any offer or issue that is the subject of this document does not require, and this document is not, a disclosuredocument or product disclosure statement within the meaning of the Act. Jefferies International Limited is authorised and regulated by the FinancialConduct Authority under the laws of the United Kingdom, which differ from Australian laws. Jefferies International Limited has obtained relief underAustralian Securities and Investments Commission Class Order 03/1099, which conditionally exempts it from holding an Australian financial serviceslicence under the Act in respect of the provision of certain financial services to wholesale clients. Recipients of this document in any other jurisdictionsshould inform themselves about and observe any applicable legal requirements in relation to the receipt of this document.
This report is not an offer or solicitation of an offer to buy or sell any security or derivative instrument, or to make any investment. Any opinion orestimate constitutes the preparer's best judgment as of the date of preparation, and is subject to change without notice. Jefferies assumes no obligationto maintain or update this report based on subsequent information and events. Jefferies, its associates or affiliates, and its respective officers, directors,and employees may have long or short positions in, or may buy or sell any of the securities, derivative instruments or other investments mentioned ordescribed herein, either as agent or as principal for their own account. Upon request Jefferies may provide specialized research products or servicesto certain customers focusing on the prospects for individual covered stocks as compared to other covered stocks over varying time horizons orunder differing market conditions. While the views expressed in these situations may not always be directionally consistent with the long-term views
Equity Strategy
US
September 10, 2017
page 19 of 20 , Equity Strategist, (212) 284-2056, [email protected] G. DeSanctis, CFA
Please see important disclosure information on pages 17 - 20 of this report.
expressed in the analyst's published research, the analyst has a reasonable basis and any inconsistencies can be reasonably explained. This materialdoes not constitute a personal recommendation or take into account the particular investment objectives, financial situations, or needs of individualclients. Clients should consider whether any advice or recommendation in this report is suitable for their particular circumstances and, if appropriate,seek professional advice, including tax advice. The price and value of the investments referred to herein and the income from them may fluctuate. Pastperformance is not a guide to future performance, future returns are not guaranteed, and a loss of original capital may occur. Fluctuations in exchangerates could have adverse effects on the value or price of, or income derived from, certain investments. This report has been prepared independently ofany issuer of securities mentioned herein and not in connection with any proposed offering of securities or as agent of any issuer of securities. Noneof Jefferies, any of its affiliates or its research analysts has any authority whatsoever to make any representations or warranty on behalf of the issuer(s).Jefferies policy prohibits research personnel from disclosing a recommendation, investment rating, or investment thesis for review by an issuer priorto the publication of a research report containing such rating, recommendation or investment thesis. Any comments or statements made herein arethose of the author(s) and may differ from the views of Jefferies.
This report may contain information obtained from third parties, including ratings from credit ratings agencies such as Standard & Poor’s. Reproductionand distribution of third party content in any form is prohibited except with the prior written permission of the related third party. Third party contentproviders do not guarantee the accuracy, completeness, timeliness or availability of any information, including ratings, and are not responsible forany errors or omissions (negligent or otherwise), regardless of the cause, or for the results obtained from the use of such content. Third party contentproviders give no express or implied warranties, including, but not limited to, any warranties of merchantability or fitness for a particular purpose oruse. Third party content providers shall not be liable for any direct, indirect, incidental, exemplary, compensatory, punitive, special or consequentialdamages, costs, expenses, legal fees, or losses (including lost income or profits and opportunity costs) in connection with any use of their content,including ratings. Credit ratings are statements of opinions and are not statements of fact or recommendations to purchase, hold or sell securities. Theydo not address the suitability of securities or the suitability of securities for investment purposes, and should not be relied on as investment advice.
Jefferies research reports are disseminated and available primarily electronically, and, in some cases, in printed form. Electronic research issimultaneously available to all clients. Additional research products including models are available on Jefferies Global Markets Portal. This report orany portion hereof may not be reprinted, sold or redistributed without the written consent of Jefferies. Neither Jefferies nor any officer nor employee ofJefferies accepts any liability whatsoever for any direct, indirect or consequential damages or losses arising from any use of this report or its contents.
For Important Disclosure information, please visit our website at https://javatar.bluematrix.com/sellside/Disclosures.action or call 1.888.JEFFERIES
© 2017 Jefferies Group LLC
Equity Strategy
US
September 10, 2017
page 20 of 20 , Equity Strategist, (212) 284-2056, [email protected] G. DeSanctis, CFA
Please see important disclosure information on pages 17 - 20 of this report.