Embed Size (px)
Citation preview
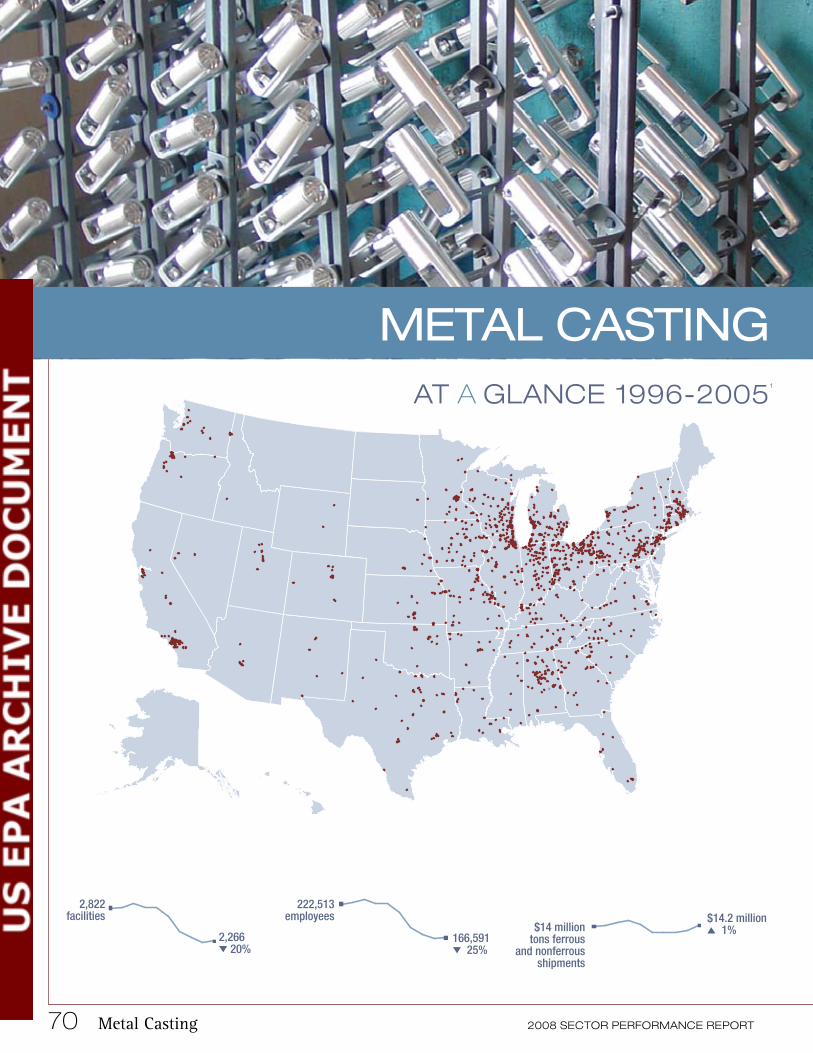
70 Metal Casting 2008 SECTOR PERFORMANCE REPORT
metal Casting
2,266 20%
2,822facilities
222,513 employees
166,591 25%
$14 million tons ferrous
and nonferrous shipments
$14.2 million 1%
AT A GLANCE 1996-20051
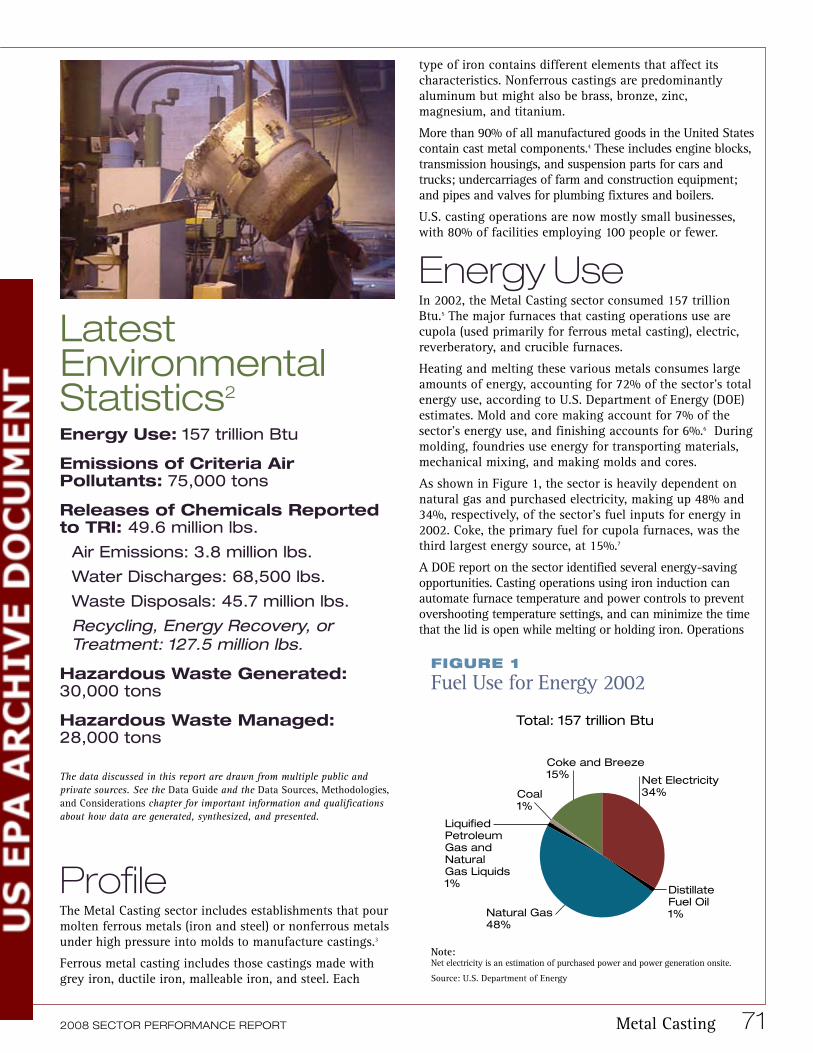
Latest Environmental Statistics2
Energy Use: 157 trillion Btu
Emissions of Criteria Air Pollutants: 75,000 tons
Releases of Chemicals Reported to TRI: 49.6 million lbs.
air emissions: 3.8 million lbs.
Water Discharges: 68,500 lbs.
Waste Disposals: 45.7 million lbs.
Recycling, Energy Recovery, or Treatment: 127.5 million lbs.
Hazardous Waste Generated: 30,000 tons
Hazardous Waste Managed: 28,000 tons
The data discussed in this report are drawn from multiple public and private sources. See the Data Guide and the Data Sources, Methodologies, and Considerations chapter for important information and qualifications about how data are generated, synthesized, and presented.
Profile The Metal Casting sector includes establishments that pour molten ferrous metals (iron and steel) or nonferrous metals under high pressure into molds to manufacture castings.3
Ferrous metal casting includes those castings made with grey iron, ductile iron, malleable iron, and steel. Each
2008 SECTOR PERFORMANCE REPORT
type of iron contains different elements that affect its characteristics. Nonferrous castings are predominantly aluminum but might also be brass, bronze, zinc, magnesium, and titanium.
More than 90% of all manufactured goods in the United States contain cast metal components.4 These includes engine blocks, transmission housings, and suspension parts for cars and trucks; undercarriages of farm and construction equipment; and pipes and valves for plumbing fixtures and boilers.
U.S. casting operations are now mostly small businesses, with 80% of facilities employing 100 people or fewer.
Energy UseIn 2002, the Metal Casting sector consumed 157 trillion Btu.5 The major furnaces that casting operations use are cupola (used primarily for ferrous metal casting), electric, reverberatory, and crucible furnaces.
Heating and melting these various metals consumes large amounts of energy, accounting for 72% of the sector’s total energy use, according to U.S. Department of Energy (DOE) estimates. Mold and core making account for 7% of the sector’s energy use, and finishing accounts for 6%.6 During molding, foundries use energy for transporting materials, mechanical mixing, and making molds and cores.
As shown in Figure 1, the sector is heavily dependent on natural gas and purchased electricity, making up 48% and 34%, respectively, of the sector’s fuel inputs for energy in 2002. Coke, the primary fuel for cupola furnaces, was the third largest energy source, at 15%.7
A DOE report on the sector identified several energy-saving opportunities. Casting operations using iron induction can automate furnace temperature and power controls to prevent overshooting temperature settings, and can minimize the time that the lid is open while melting or holding iron. Operations
Figure 1
Fuel Use for Energy 2002
Total: 157 trillion Btu
Coke and Breeze15% Net Electricity
Coal 34%1%
LiquifiedPetroleumGas andNaturalGas Liquids1%
DistillateFuel Oil
Natural Gas 1%48%
Note:Net electricity is an estimation of purchased power and power generation onsite.
Source: U.S. Department of Energy
Metal Casting 71
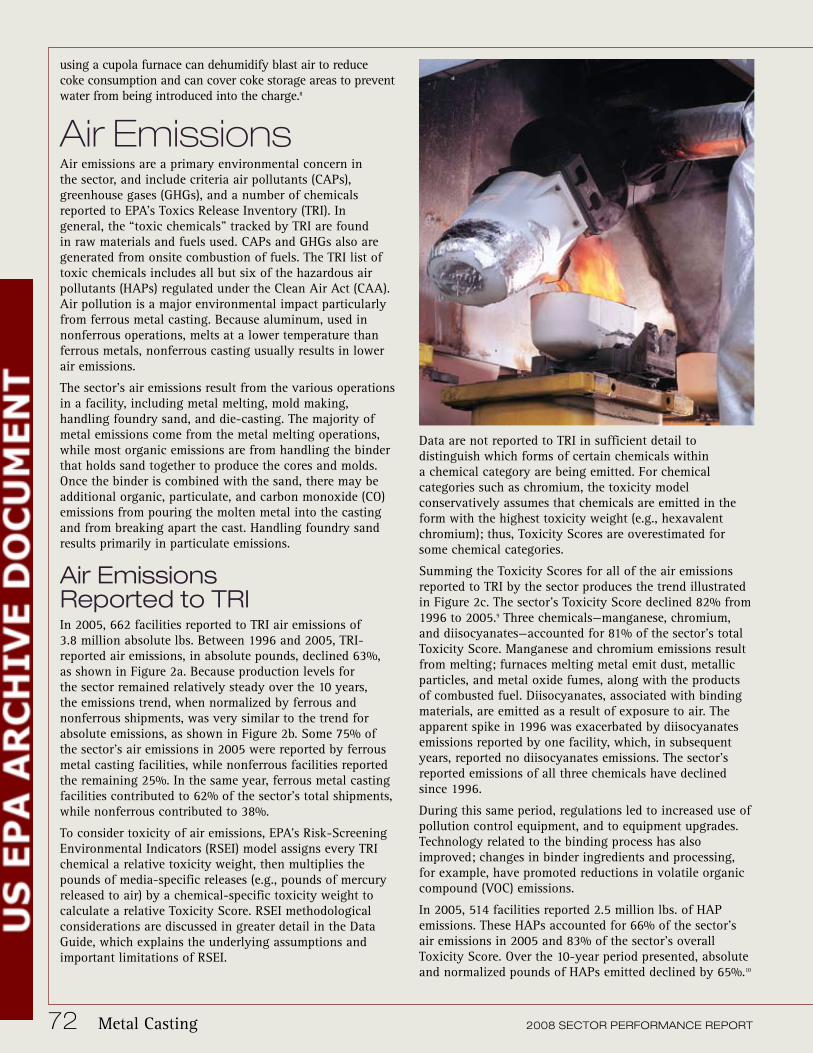
using a cupola furnace can dehumidify blast air to reduce coke consumption and can cover coke storage areas to prevent water from being introduced into the charge.8
Air EmissionsAir emissions are a primary environmental concern in the sector, and include criteria air pollutants (CAPs), greenhouse gases (GHGs), and a number of chemicals reported to EPA’s Toxics Release Inventory (TRI). In general, the “toxic chemicals” tracked by TRI are found in raw materials and fuels used. CAPs and GHGs also are generated from onsite combustion of fuels. The TRI list of toxic chemicals includes all but six of the hazardous air pollutants (HAPs) regulated under the Clean Air Act (CAA). Air pollution is a major environmental impact particularly from ferrous metal casting. Because aluminum, used in nonferrous operations, melts at a lower temperature than ferrous metals, nonferrous casting usually results in lower air emissions.
The sector’s air emissions result from the various operations in a facility, including metal melting, mold making, handling foundry sand, and die-casting. The majority of metal emissions come from the metal melting operations, while most organic emissions are from handling the binder that holds sand together to produce the cores and molds. Once the binder is combined with the sand, there may be additional organic, particulate, and carbon monoxide (CO) emissions from pouring the molten metal into the casting and from breaking apart the cast. Handling foundry sand results primarily in particulate emissions.
Data are not reported to TRI in sufficient detail to distinguish which forms of certain chemicals within a chemical category are being emitted. For chemical categories such as chromium, the toxicity model conservatively assumes that chemicals are emitted in the form with the highest toxicity weight (e.g., hexavalent chromium); thus, Toxicity Scores are overestimated for some chemical categories.
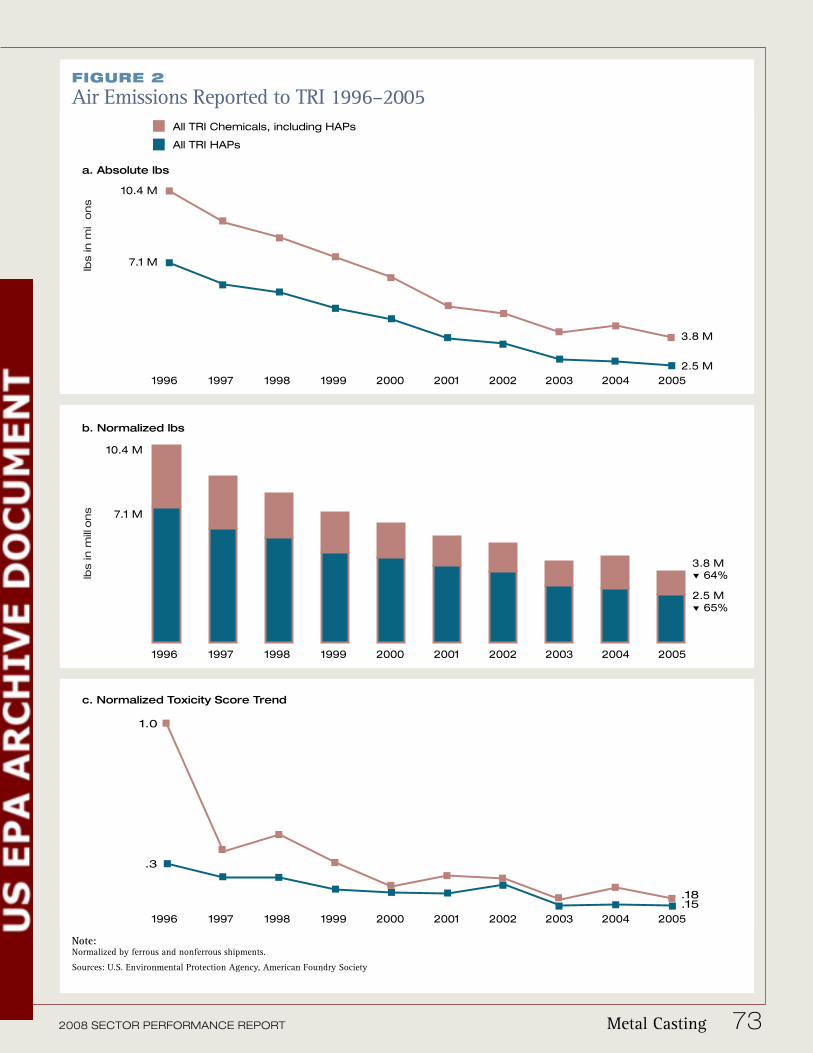
Air Emissions Reported to TRIIn 2005, 662 facilities reported to TRI air emissions of 3.8 million absolute lbs. Between 1996 and 2005, TRI-reported air emissions, in absolute pounds, declined 63%, as shown in Figure 2a. Because production levels for the sector remained relatively steady over the 10 years, the emissions trend, when normalized by ferrous and nonferrous shipments, was very similar to the trend for absolute emissions, as shown in Figure 2b. Some 75% of the sector’s air emissions in 2005 were reported by ferrous metal casting facilities, while nonferrous facilities reported the remaining 25%. In the same year, ferrous metal casting facilities contributed to 62% of the sector’s total shipments,
Summing the Toxicity Scores for all of the air emissions reported to TRI by the sector produces the trend illustrated in Figure 2c. The sector’s Toxicity Score declined 82% from 1996 to 2005.9 Three chemicals—manganese, chromium, and diisocyanates—accounted for 81% of the sector’s total Toxicity Score. Manganese and chromium emissions result from melting; furnaces melting metal emit dust, metallic particles, and metal oxide fumes, along with the products of combusted fuel. Diisocyanates, associated with binding materials, are emitted as a result of exposure to air. The apparent spike in 1996 was exacerbated by diisocyanates emissions reported by one facility, which, in subsequent years, reported no diisocyanates emissions. The sector’s reported emissions of all three chemicals have declined since 1996.
while nonferrous contributed to 38%. During this same period, regulations led to increased use of
To consider toxicity of air emissions, EPA’s Risk-Screening Environmental Indicators (RSEI) model assigns every TRI chemical a relative toxicity weight, then multiplies the pounds of media-specific releases (e.g., pounds of mercury released to air) by a chemical-specific toxicity weight to
pollution control equipment, and to equipment upgrades. Technology related to the binding process has also improved; changes in binder ingredients and processing, for example, have promoted reductions in volatile organic compound (VOC) emissions.
calculate a relative Toxicity Score. RSEI methodological In 2005, 514 facilities reported 2.5 million lbs. of HAP considerations are discussed in greater detail in the Data emissions. These HAPs accounted for 66% of the sector’s Guide, which explains the underlying assumptions and air emissions in 2005 and 83% of the sector’s overall important limitations of RSEI. Toxicity Score. Over the 10-year period presented, absolute
and normalized pounds of HAPs emitted declined by 65%.10
72 Metal Casting 2008 SECTOR PERFORMANCE REPORT
2008 SECTOR PERFORMANCE REPORT Metal Casting 73
Figure 2
Air Emissions Reported to TRI 1996–2005
Note:Normalized by ferrous and nonferrous shipments.
Sources: U.S. Environmental Protection Agency, American Foundry Society
a. Absolute lbs
10.4 M
7.1 M
3.8 M
2.5 M
All TRI Chemicals, including HAPs
All TRI HAPs
1996 1997 1998 1999 2000 2001 2002 2003 2004 2005
1996 1997 1998 999
lbs in
mi
ons
g
All R HAP
b. Normalized lbs
7.1 M
10.4 M
2.5 M
3.8 M
1996 1997 1998 1999 2000 2001 2002 2003 2004 2005
5
64%
65%
lbs in
mill
ons
bs n
o
n
All R HAPs
N li l
7 1
1 4 M
2 5
M
1996 1997 1998 1999 2000 2001 2002 2003 200 2005
1996 1997 1998 1999 2000 2001 2002 2003 2004 2005
64
65%
c. Normalized Toxicity Score Trend
1.0
.18
.15
.3
lb
milio
nlb
s in
io
74 Metal Casting 2008 SECTOR PERFORMANCE REPORT
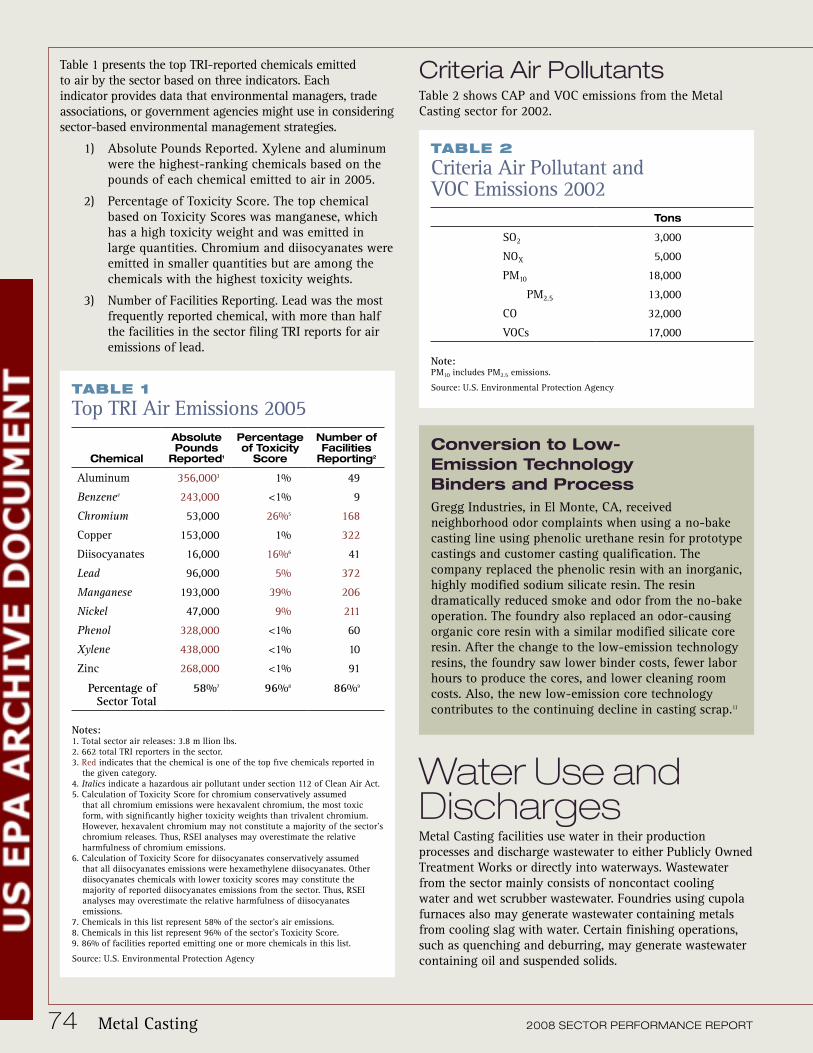
Table 1 presents the top TRI-reported chemicals emitted to air by the sector based on three indicators. Each indicator provides data that environmental managers, trade associations, or government agencies might use in considering sector-based environmental management strategies.
1) Absolute Pounds Reported. Xylene and aluminum were the highest-ranking chemicals based on the pounds of each chemical emitted to air in 2005.
2) Percentage of Toxicity Score. The top chemical based on Toxicity Scores was manganese, which has a high toxicity weight and was emitted in large quantities. Chromium and diisocyanates were emitted in smaller quantities but are among the chemicals with the highest toxicity weights.
3) Number of Facilities Reporting. Lead was the most frequently reported chemical, with more than half the facilities in the sector filing TRI reports for air emissions of lead.
Criteria Air PollutantsTable 2 shows CAP and VOC emissions from the Metal Casting sector for 2002.
Water Use and DischargesMetal Casting facilities use water in their production processes and discharge wastewater to either Publicly Owned Treatment Works or directly into waterways. Wastewater from the sector mainly consists of noncontact cooling water and wet scrubber wastewater. Foundries using cupola furnaces also may generate wastewater containing metals from cooling slag with water. Certain finishing operations, such as quenching and deburring, may generate wastewater containing oil and suspended solids.
Table 1
Top TRI Air Emissions 2005
Chemical
Absolute Pounds
Reported1
Percentage of Toxicity
Score
Number of Facilities
Reporting2
Aluminum 356,0003 1% 49
Benzene4 243,000 <1% 9
Chromium 53,000 26%5 168
Copper 153,000 1% 322
Diisocyanates 16,000 16%6 41
Lead 96,000 5% 372
Manganese 193,000 39% 206
Nickel 47,000 9% 211
Phenol 328,000 <1% 60
Xylene 438,000 <1% 10
Zinc 268,000 <1% 91
Percentage of Sector Total
58%7 96%8 86%9
Notes:1. Total sector air releases: 3.8 m llion lbs.2. 662 total TRI reporters in the sector.3. Red indicates that the chemical is one of the top five chemicals reported in
the given category.4. Italics indicate a hazardous air pollutant under section 112 of Clean Air Act. 5. Calculation of Toxicity Score for chromium conservatively assumed
that all chromium emissions were hexavalent chromium, the most toxic form, with significantly higher toxicity weights than trivalent chromium. However, hexavalent chromium may not constitute a majority of the sector’s chromium releases. Thus, RSEI analyses may overestimate the relative harmfulness of chromium emissions.
6. Calculation of Toxicity Score for diisocyanates conservatively assumed that all diisocyanates emissions were hexamethylene diisocyanates. Other diisocyanates chemicals with lower toxicity scores may constitute the majority of reported diisocyanates emissions from the sector. Thus, RSEI analyses may overestimate the relative harmfulness of diisocyanates emissions.
7. Chemicals in this list represent 58% of the sector’s air emissions.8. Chemicals in this list represent 96% of the sector’s Toxicity Score. 9. 86% of facilities reported emitting one or more chemicals in this list.
Source: U.S. Environmental Protection Agency
Table 2
Criteria Air Pollutant and VOC Emissions 2002
Tons
SO2 3,000
NOX 5,000
PM10 18,000
PM2.5 13,000
CO 32,000
VOCs 17,000
Note:PM10 includes PM2.5 emissions.
Source: U.S. Environmental Protection Agency
Conversion to Low- Emission Technology Binders and ProcessGregg Industries, in El Monte, CA, received neighborhood odor complaints when using a no-bake casting line using phenolic urethane resin for prototype castings and customer casting qualification. The company replaced the phenolic resin with an inorganic, highly modified sodium silicate resin. The resin dramatically reduced smoke and odor from the no-bake operation. The foundry also replaced an odor-causing organic core resin with a similar modified silicate core resin. After the change to the low-emission technology resins, the foundry saw lower binder costs, fewer labor hours to produce the cores, and lower cleaning room costs. Also, the new low-emission core technology contributes to the continuing decline in casting scrap.11
Some processes for making cores require strongly acidic or basic substances for scrubbing the off gases and can generate sludges or liquors. These sludges or liquors are typically pH-controlled prior to discharge to the sewer system.
Hazardous Waste ManagementBoth ferrous and nonferrous facilities generate hazardous waste, including hazardous waste from finishing operations. Ferrous facilities generate hazardous wastes mostly from pollution control equipment, especially from melting furnaces. Nonferrous facilities tend to produce hazardous wastes as foundry sand contaminated with heavy metals. About 2% of all spent foundry sand is hazardous. Casting sands used in the production of brass or
Every facility discharging process wastewater directly bronze castings may also exhibit toxicity characteristics for to waterways must apply for a National Pollutant lead or cadmium, making them a hazardous waste. Discharge Elimination System permit. The permits typically set numeric limits on specific pollutants and include monitoring and reporting requirements. For metal casters, regulated pollutants and the associated limits vary depending on the type of casting operation (aluminum, copper, zinc, or ferrous casting), but most facilities are regulated in their discharges of copper, lead, zinc, and total suspended solids (TSS).12
In 2005, 170 facilities reported to EPA’s National Biennial RCRA Hazardous Waste Report (BR) generating 30,000 tons of hazardous waste. Wastes captured by air pollution control equipment were the largest source of hazardous waste. Facilities reported managing 28,000 tons of hazardous waste in 2005, most of which was managed through destruction or treatment.16
In 2005, 236 facilities reported water discharges of TRI chemicals totaling 68,500 lbs.13 This represented a decline of 52% since 1996.14
Facilities with materials exposed to precipitation also are regulated for stormwater runoff, usually under a general permit providing sector-specific limits. Depending on the type of foundry, stormwater requirements for metal casting facilities may include effluent limits on copper, zinc, iron, aluminum, and TSS.
Waste Generation and Management Waste management is another key environmental issue for Metal Casting facilities. Metal casting wastes fall into four main categories: sand, slag, dust, and other. The sand used to create molds and cores accounts for a large portion of the waste generated at foundries.15 The high-quality sand required for casting is expensive, so foundries reuse sand to the extent possible. Sand that no longer can be used by iron or steel foundries is often landfilled or beneficially reused.
Slag, which can make up about 25% of a foundry’s solid waste stream, is a glassy mass with a complex chemical structure. Slag is composed of metal oxides from the melting process, melted refractories, sand, coke ash (if coke is used), and other materials. Large quantities of slag are generated from iron foundries using cupola furnaces.
During casting, some metal is converted to dust or fumes and collected by pollution control equipment such as baghouses, electrostatic precipitators, or wet scrubbers.
2008 SECTOR PERFORMANCE REPORT Metal Casting 75
No
rmaliz
ed
lbs
high recycling rate derives partly from the nature of the Waste Management industry; if a problem occurs in the casting, the defective Reported to TRI product can be melted down and cast again, on or offsite.
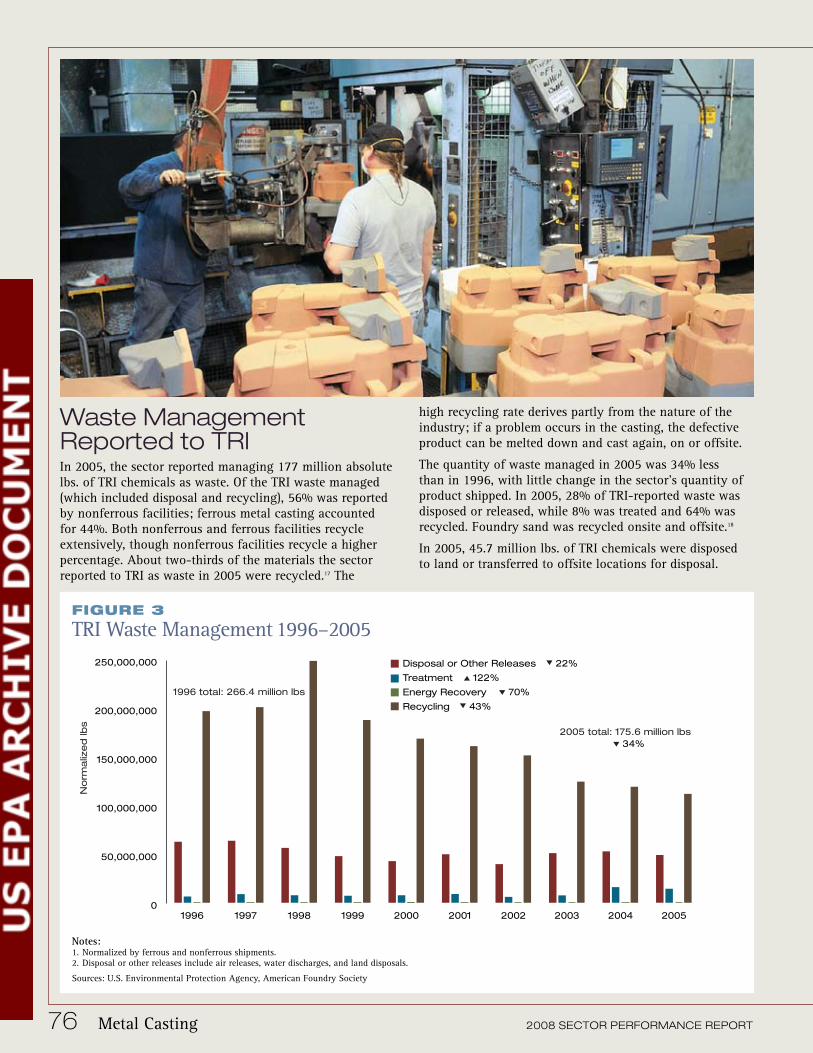
In 2005, the sector reported managing 177 million absolute The quantity of waste managed in 2005 was 34% less lbs. of TRI chemicals as waste. Of the TRI waste managed than in 1996, with little change in the sector’s quantity of (which included disposal and recycling), 56% was reported product shipped. In 2005, 28% of TRI-reported waste was by nonferrous facilities; ferrous metal casting accounted disposed or released, while 8% was treated and 64% was for 44%. Both nonferrous and ferrous facilities recycle recycled. Foundry sand was recycled onsite and offsite.18 extensively, though nonferrous facilities recycle a higher In 2005, 45.7 million lbs. of TRI chemicals were disposed percentage. About two-thirds of the materials the sector to land or transferred to offsite locations for disposal. reported to TRI as waste in 2005 were recycled.17 The
Figure 3
TRI Waste Management 1996–2005250,000,000 Disposal or Other Releases 22%
Treatment 122%
1996 total: 266.4 million lbs Energy Recovery 70%
Recycling 43%200,000,000
2005 total: 175.6 million lbs34%
150,000,000
100,000,000
50,000,000
01996 1997 1998 1999 2000 2001 2002 2003 2004 2005
Notes:1. Normalized by ferrous and nonferrous shipments.2. Disposal or other releases include air releases, water discharges, and land disposals.
Sources: U.S. Environmental Protection Agency, American Foundry Society
76 Metal Casting 2008 SECTOR PERFORMANCE REPORT
Manganese accounted for about one-third of the total determined that the industry beneficially reuses 2.6 million pounds disposed. As shown in Table 3, lead and copper tons of sand per year, representing 28% of the total tons of were the chemicals most frequently reported as disposed. sand available for reuse. The most common barrier to reuse The sector’s disposals and other releases were driven by that respondents noted was lack of a local market for used ferrous metal casting facilities, which accounted for 75% of foundry sand.20 disposals and releases.
Other Environmental Table 3 Management ActivityTop TRI Disposals 2005
Absolute Number of Pounds Facilities
Chemical Reported1 Reporting2
Aluminum 7,709,0003 31
Chromium 7,112,000 149
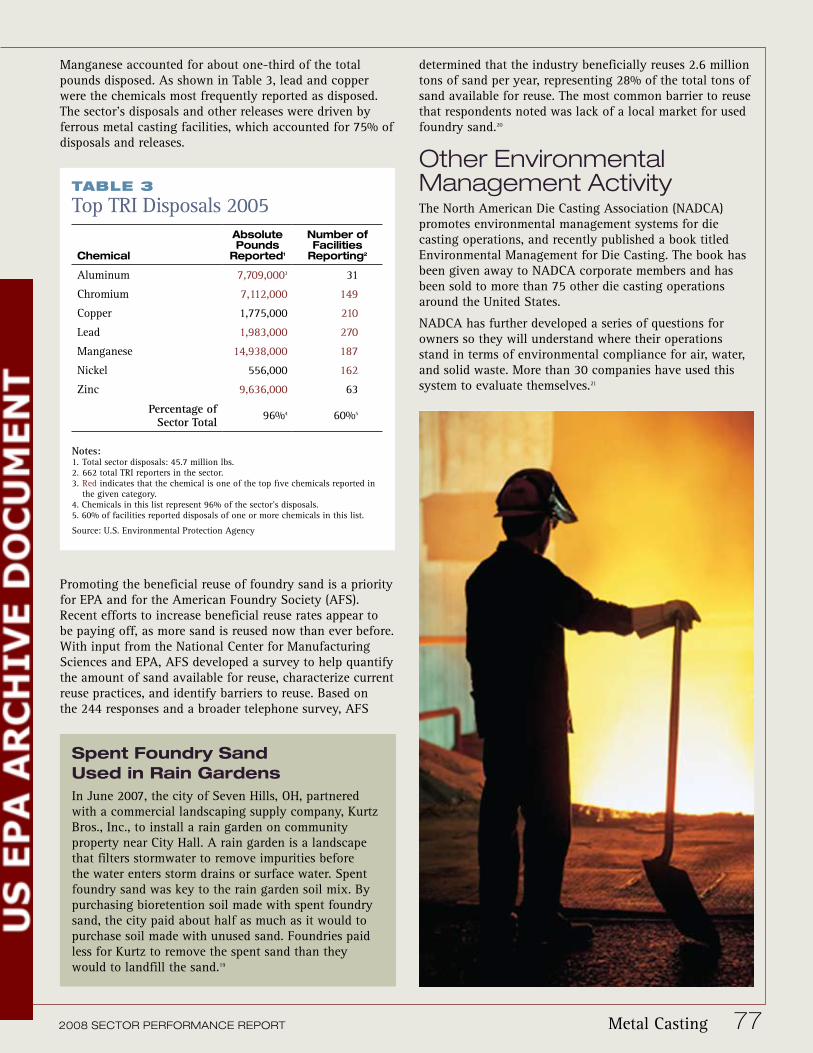
The North American Die Casting Association (NADCA) promotes environmental management systems for die casting operations, and recently published a book titled Environmental Management for Die Casting. The book has been given away to NADCA corporate members and has been sold to more than 75 other die casting operations around the United States.
Copper 1,775,000 210
Lead 1,983,000 270
Manganese 14,938,000 187
NADCA has further developed a series of questions for owners so they will understand where their operations stand in terms of environmental compliance for air, water,
Nickel 556,000 162 and solid waste. More than 30 companies have used this Zinc 9,636,000 63 system to evaluate themselves.21
Percentage of 96%4 60%5
Sector Total
Notes:1. Total sector disposals: 45.7 million lbs.2. 662 total TRI reporters in the sector.3. Red indicates that the chemical is one of the top five chemicals reported in
the given category.4. Chemicals in this list represent 96% of the sector’s disposals.5. 60% of facilities reported disposals of one or more chemicals in this list.
Source: U.S. Environmental Protection Agency
Promoting the beneficial reuse of foundry sand is a priority for EPA and for the American Foundry Society (AFS). Recent efforts to increase beneficial reuse rates appear to be paying off, as more sand is reused now than ever before. With input from the National Center for Manufacturing Sciences and EPA, AFS developed a survey to help quantify the amount of sand available for reuse, characterize current reuse practices, and identify barriers to reuse. Based on the 244 responses and a broader telephone survey, AFS
Spent Foundry Sand Used in Rain GardensIn June 2007, the city of Seven Hills, OH, partnered with a commercial landscaping supply company, Kurtz Bros., Inc., to install a rain garden on community property near City Hall. A rain garden is a landscape that filters stormwater to remove impurities before the water enters storm drains or surface water. Spent foundry sand was key to the rain garden soil mix. By purchasing bioretention soil made with spent foundry sand, the city paid about half as much as it would to purchase soil made with unused sand. Foundries paid less for Kurtz to remove the spent sand than they would to landfill the sand.19
2008 SECTOR PERFORMANCE REPORT Metal Casting 77