Embed Size (px)
Citation preview

US Economic OutlookAhmad Ijaz
Center for Business and Economic Research
Culverhouse College of Commerce
The University of Alabama
Composite Can and Tube Institute Annual Meeting
Point Clear, Alabama | May 19, 2017

Overview: U.S. Economy
• The current economic recovery (now into its 8thyear) has been the slowest recovery in postwar history.
• Compared to its peak in 4th quarter 2007, GDP is only about 12 percent higher while the number of employed is only 3.5 million higher.
• Advance estimate of inflation adjusted GDP growth in the first quarter of 2017 was only 0.7 percent – the weakest in
three years, with consumer spending and inventory accumulation slowing sharply.
• Growth in second half is expected to be around 3.4 percent, led primarily by consumer spending. For the year, the
rate of growth is estimated to be around 2.2 percent, followed by approximately 2.7 percent in 2018. The economy
grew by 1.6 percent in 2016.
• Consumer spending will remain the main source of growth, rising by 2.5 percent in 2017.
• After dropping by 0.5 percent, nonresidential business spending will increase by 4.5 percent in both 2017 and 2018. .
• However, weak wage growth in some sectors of the economy and relatively high debt levels ($12.7 trillion) will
continue to keep consumers cautious, despite the job growth seen in recent months, historically employment growth
is still relatively sluggish, and most of the jobs being added are either temporary (about 30 to 40 percent), part-time
and/or in low wage sectors of the economy.
• After a 1.2 percent drop in 2016, industrial production index will rise 1.9 percent in 2017 and 2.9 percent in 2018.
Industrial production in paper and related products will rise by 0.7 percent in 2017, following a 2.6 percent drop in
2016. Payroll employment in paper and related products industry will rise 0.4 percent, at about the same pace as
2016.

Post-recession Average Real GDP Growth
Time period Average growth
1976 - 1980 2.59%
1983 - 1989 3.75%
1992 - 1998 3.17%
2002 - 2007 2.39%
2010 - 2016 1.72%Source: U.S. Bureau of Economic Analysis

Post-recession Average Real GDP Growth
0.00%
0.50%
1.00%
1.50%
2.00%
2.50%
3.00%
3.50%
4.00%
'76-'80 '83-'89 '92-'98 '02-'07 '10-'16
Source: U.S. Bureau of Economic Analysis

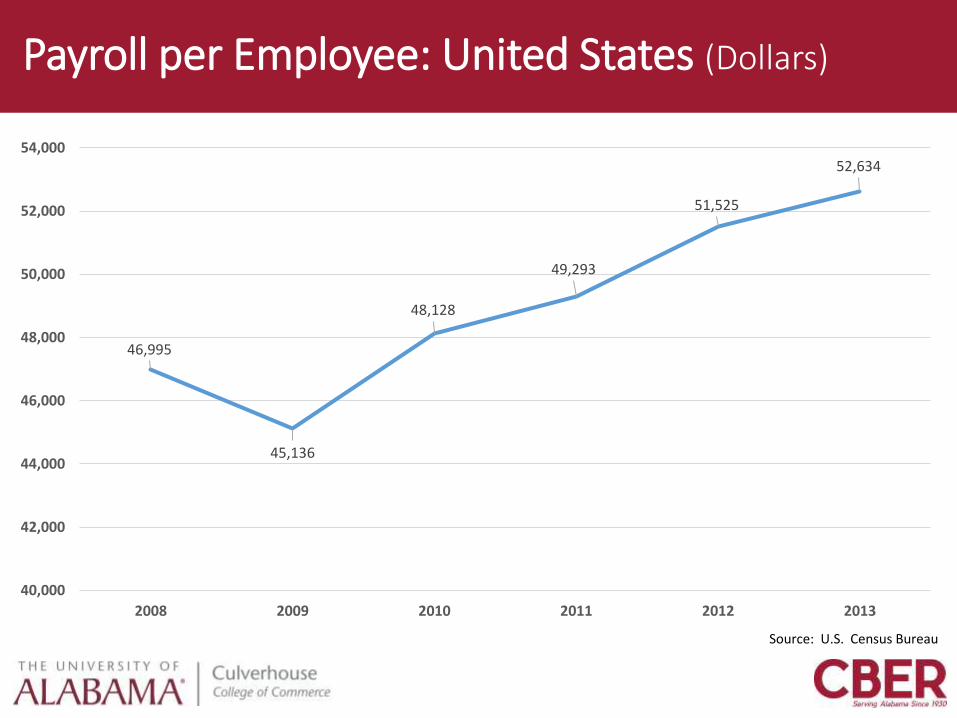
Post-recession Average Employment Growth
Time period Average growth
1976 - 1980 2.48%
1983 - 1989 2.40%
1992 - 1998 2.21%
2002 - 2007 0.99%
2010 - 2016 1.51%Source: U.S. Bureau of Labor Statistics
Post-recession Average Employment Growth
0.00%
0.50%
1.00%
1.50%
2.00%
2.50%
'76-'80 '83-'89 '92-'98 '02-'07 '10-'16
Source: U.S. Bureau of Labor Statistics

Labor Force Participation Rate
55.0
57.0
59.0
61.0
63.0
65.0
67.0
69.0
United States
Source: Bureau of Labor Statistics

Labor Productivity in the U.S.
-2.0%
-1.0%
0.0%
1.0%
2.0%
3.0%
4.0%
5.0%
1970 1973 1976 1979 1982 1985 1988 1991 1994 1997 2000 2003 2006 2009 2012 2015
Source: Bureau of Labor Statistics and Bureau of Economic Analysis Data

GDP Growth
0.0%
0.5%
1.0%
1.5%
2.0%
2.5%
3.0%
3.5%
4.0%
10 States with highest GDP growth in 2016
-7.0%
-6.0%
-5.0%
-4.0%
-3.0%
-2.0%
-1.0%
0.0%
1.0%
No
rth D
akota
Wyo
min
g
Oklah
om
a
West V
irginia
Lou
isiana
Ne
w M
exico
Mo
ntan
a
Kan
sas
De
laware
Texas
10 States with lowest GDP growth in 2016
Source: Bureau of Economic Analysis

Shares of U.S. Gross Domestic Product and Nonfarm Employment by Industry (2016)
21.3414.24
3.95
4.65
8.5015.67
19.77
5.74
12.01
15.40
3.86
10.82
11.698.56
12.82
13.95
6.0610.97
0.00
10.00
20.00
30.00
40.00
50.00
60.00
70.00
80.00
90.00
100.00
Share of GDP Share of Non-farm Employment
Retail trade
Professional andbusiness services
Manufacturing
Leisure and hospitality
Government
Finance activities
Education and healthservices
Construction
All Other
Source: Estimates based on Bureau of Labor Statistics and Bureau of Economic Analysis Data
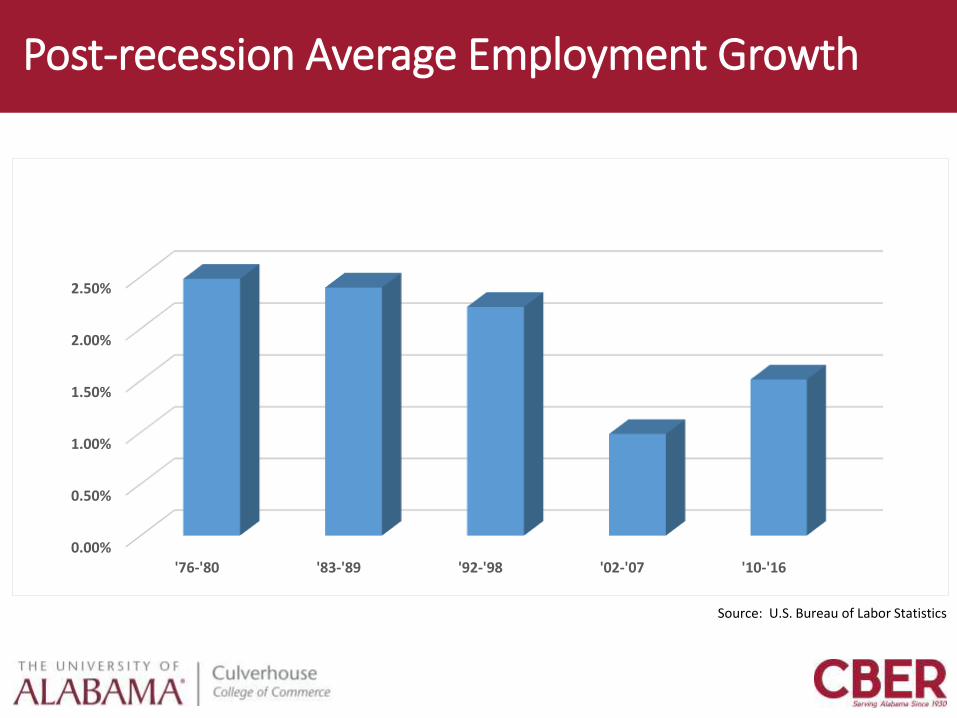
Inflation Adjusted Chained 2009 Dollars
(Annual Percent Change)
Source: Bureau of Economic Analysis and IHS Global Insight.
-30
-25
-20
-15
-10
-5
0
5
10
15
20
2000 2001 2002 2003 2004 2005 2006 2007 2008 2009 2010 2011 2012 2013 2014 2015 2016 2017
GDP
CONS. SPENDING
NON-RESIDENTIALINVESTMENTS
RESIDENTIALINVESTMENTS
U.S. Economy(GDP, Consumer Spending and Investments)

Gross Domestic Product: Expansion remains on Track(Inflation Adjusted Annual Percent Change)
-4
-3
-2
-1
0
1
2
3
4
5
6
1/1
/90
1/1
/91
1/1
/92
1/1
/93
1/1
/94
1/1
/95
1/1
/96
1/1
/97
1/1
/98
1/1
/99
1/1
/00
1/1
/01
1/1
/02
1/1
/03
1/1
/04
1/1
/05
1/1
/06
1/1
/07
1/1
/08
1/1
/09
1/1
/10
1/1
/11
1/1
/12
1/1
/13
1/1
/14
1/1
/15
1/1
/16
1/1
/17
1/1
/18
1/1
/19
1/1
/20
1/1
/21
1/1
/22
1/1
/23
1/1
/24
1/1
/25
Source: U.S. Department of Commerce and IHS Global Insight.

Consumer Spending, Total and Nondurables(Annual Percent Change, 2009 Chained Dollars)
-3
-2
-1
0
1
2
3
4
5
6
1/1
/90
1/1
/91
1/1
/92
1/1
/93
1/1
/94
1/1
/95
1/1
/96
1/1
/97
1/1
/98
1/1
/99
1/1
/00
1/1
/01
1/1
/02
1/1
/03
1/1
/04
1/1
/05
1/1
/06
1/1
/07
1/1
/08
1/1
/09
1/1
/10
1/1
/11
1/1
/12
1/1
/13
1/1
/14
1/1
/15
1/1
/16
1/1
/17
1/1
/18
1/1
/19
1/1
/20
1/1
/21
1/1
/22
1/1
/23
1/1
/24
1/1
/25
Total Nondurable GoodsSource: U.S. Department of Commerce and IHS Global Insight.

Consumer Sentiment Index(supported by improving household finances)
Source: University of Michigan and IHS Global Insight
40
60
80
100
120
1/1
/90
1/1
/91
1/1
/92
1/1
/93
1/1
/94
1/1
/95
1/1
/96
1/1
/97
1/1
/98
1/1
/99
1/1
/00
1/1
/01
1/1
/02
1/1
/03
1/1
/04
1/1
/05
1/1
/06
1/1
/07
1/1
/08
1/1
/09
1/1
/10
1/1
/11
1/1
/12
1/1
/13
1/1
/14
1/1
/15
1/1
/16
1/1
/17
1/1
/18
1/1
/19
1/1
/20
1/1
/21
1/1
/22
1/1
/23
1/1
/24
1/1
/25

Factors Affecting Consumer Spending
• Positive• Employment growth
• Wage acceleration
• Rising asset Values
• Income tax cuts in 2018
• Expansion of e-commerce sales
• Positive
• Negative• High consumer and student debt burdens
• Payroll cycle economics
• Asset and income inequality (significant increase in part-time and temporary jobs)

Nonfarm Employment, Nondurable Goods and Paper Product (Annual Percent Change)
-10
-8
-6
-4
-2
0
2
1/1
/91
1/1
/92
1/1
/93
1/1
/94
1/1
/95
1/1
/96
1/1
/97
1/1
/98
1/1
/99
1/1
/00
1/1
/01
1/1
/02
1/1
/03
1/1
/04
1/1
/05
1/1
/06
1/1
/07
1/1
/08
1/1
/09
1/1
/10
1/1
/11
1/1
/12
1/1
/13
1/1
/14
1/1
/15
1/1
/16
1/1
/17
1/1
/18
1/1
/19
1/1
/20
1/1
/21
1/1
/22
1/1
/23
1/1
/24
1/1
/25
Nondurable Manufacturing Paper Products
Source: U.S. Department of Commerce and IHS Global Insight.

Change in Inventories, Total and Manufacturing(Billions of Chained 2009 Dollars)
-200
-150
-100
-50
0
50
100
1/1
/90
1/1
/91
1/1
/92
1/1
/93
1/1
/94
1/1
/95
1/1
/96
1/1
/97
1/1
/98
1/1
/99
1/1
/00
1/1
/01
1/1
/02
1/1
/03
1/1
/04
1/1
/05
1/1
/06
1/1
/07
1/1
/08
1/1
/09
1/1
/10
1/1
/11
1/1
/12
1/1
/13
1/1
/14
1/1
/15
1/1
/16
1/1
/17
1/1
/18
1/1
/19
1/1
/20
1/1
/21
1/1
/22
1/1
/23
1/1
/24
1/1
/25
Total Business Total Manufacturing
Source: U.S. Department of Commerce and IHS Global Insight.

Industrial Production Index(Annual Percent Change)
-20
-15
-10
-5
0
5
10
15
20
1/1
/90
1/1
/91
1/1
/92
1/1
/93
1/1
/94
1/1
/95
1/1
/96
1/1
/97
1/1
/98
1/1
/99
1/1
/00
1/1
/01
1/1
/02
1/1
/03
1/1
/04
1/1
/05
1/1
/06
1/1
/07
1/1
/08
1/1
/09
1/1
/10
1/1
/11
1/1
/12
1/1
/13
1/1
/14
1/1
/15
1/1
/16
1/1
/17
1/1
/18
1/1
/19
1/1
/20
1/1
/21
1/1
/22
1/1
/23
1/1
/24
1/1
/25
Paper and Paper Products Converted Paper Products
Bags, Coated and Treated Paper Residual Paper Products
Source: U.S. Department of Commerce and IHS Global Insight.

Nonresidential and Residential Business Investments(Annual Percent Change, Chained 2009 Dollars)
-30
-25
-20
-15
-10
-5
0
5
10
15
20
1/1
/90
1/1
/91
1/1
/92
1/1
/93
1/1
/94
1/1
/95
1/1
/96
1/1
/97
1/1
/98
1/1
/99
1/1
/00
1/1
/01
1/1
/02
1/1
/03
1/1
/04
1/1
/05
1/1
/06
1/1
/07
1/1
/08
1/1
/09
1/1
/10
1/1
/11
1/1
/12
1/1
/13
1/1
/14
1/1
/15
1/1
/16
1/1
/17
1/1
/18
1/1
/19
1/1
/20
1/1
/21
1/1
/22
1/1
/23
1/1
/24
1/1
/25
Nonresidential ResidentialSource: U.S. Department of Commerce and IHS Global Insight.

U.S. Recessions: Total Non-farm Employment
90
92
94
96
98
100
102
104
0 10 20 30 40 50 60 70 80 90
Months
Jan-80
Jul-81
Jul-90
Mar-01
Dec-07
Source: Estimates based on Bureau of Labor Statistics Data

U.S. Economic Forecast
(Percent change unless otherwise noted) 2016 2017 2018 2019 2020
Real GDP 1.6 2.2 2.7 2.4 2.2
Consumption 2.7 2.5 3.2 2.8 3.2
Residential Investment 3.5 11.7 4.7 2.7 3.1
Commercial, Healthcare Structures 12.9 10.1 15.4 6.1 5.1
Nonresidential Fixed Investment 6.0 2.1 -0.2 4.6 4.5
Federal Government -2.5 0.0 0.7 0.3 -0.8
State & Local Government 0.2 2.9 0.9 0.8 1.4
Exports 4.3 0.1 -0.3 3.1 3.1
Imports 4.4 4.6 1.2 4.9 4.9
Payroll Employment 1.9 2.1 1.7 1.2 1.2
Unemployment Rate 6.2 5.3 4.9 4.7 4.7
CPI Inflation 1.6 0.1 1.2 2.5 2.5
Light Vehicle Sales (Millions) 16.44 17.39 17.47 17.78 17.78

Paperboard Manufacturing Snapshot
2002 2007
Number of establishments 2,669 2,409
Value of shipments ($ Millions) 43,494 50,935
Annual payroll ($ Millions) 7,091 7,385
Total employment 184,884 165,978
Value of shipments per establishment ($1,000)
16,296 21,144
Value of shipments per employee ($1,000) 235 307
Value of shipments per $ of payroll ($) 6.13 6.9
Payroll per employee ($) 38,355 44,493
Employees per establishment 69.27 68.9
Value of shipments per capita ($) 151 169
Population per establishment 107,765 125,044

Value of Shipments: United States
Source: U.S. Census Bureau

Employees Per Establishments: United States
Source: U.S. Census Bureau

Number of Establishments: United States
2,345
2,241
2,205
2,1312,117
2,088
1,950
2,000
2,050
2,100
2,150
2,200
2,250
2,300
2,350
2,400
2008 2009 2010 2011 2012 2013
Source: U.S. Census Bureau

Number of Employees: United States
162,515
147,593
142,868141,159
137,468138,684
120,000
125,000
130,000
135,000
140,000
145,000
150,000
155,000
160,000
165,000
2008 2009 2010 2011 2012 2013
Source: U.S. Census Bureau

U.S. Recessions- Paperboard Container Manufacturing Employment
70.0
75.0
80.0
85.0
90.0
95.0
100.0
105.0
0 20 40 60 80 100 120
Months
Jul-90
Mar-01
Dec-07
Source: Estimates based on Bureau of Labor Statistics Data
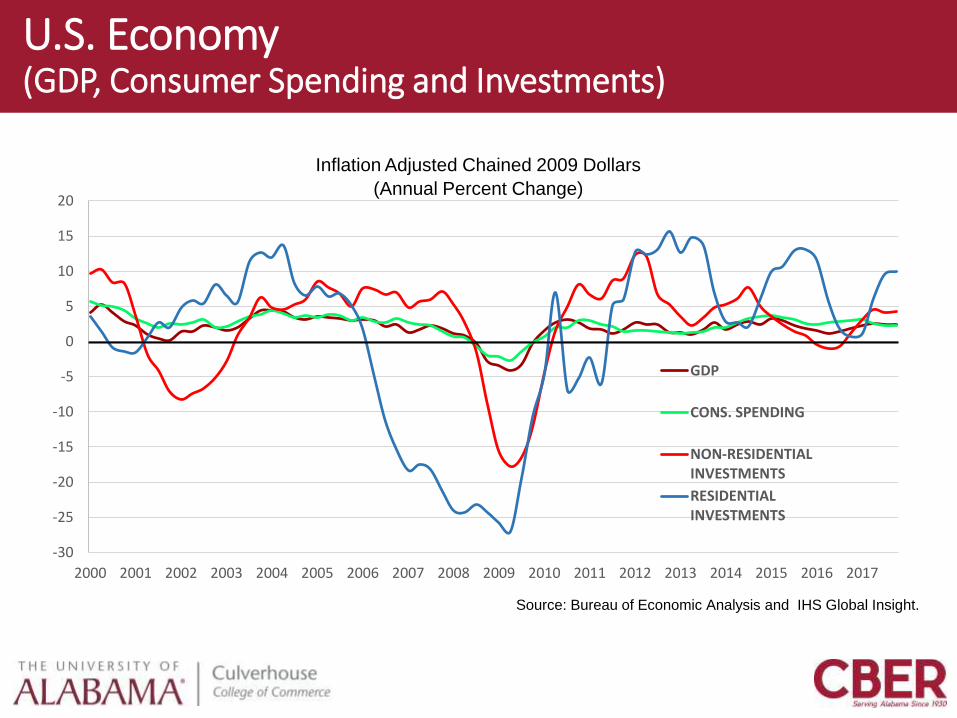
Payroll per Employee: United States (Dollars)
46,995
45,136
48,128
49,293
51,525
52,634
40,000
42,000
44,000
46,000
48,000
50,000
52,000
54,000
2008 2009 2010 2011 2012 2013
Source: U.S. Census Bureau

Average Weekly Earnings, 2016
$882
$1,058
$1,112
$1,041
$990
$0 $200 $400 $600 $800 $1,000 $1,200
All private sector industries
Manufacturing
Paper and paper products
Converted paper products
Paperboard containers
Source: Bureau of Labor Statistics, CES
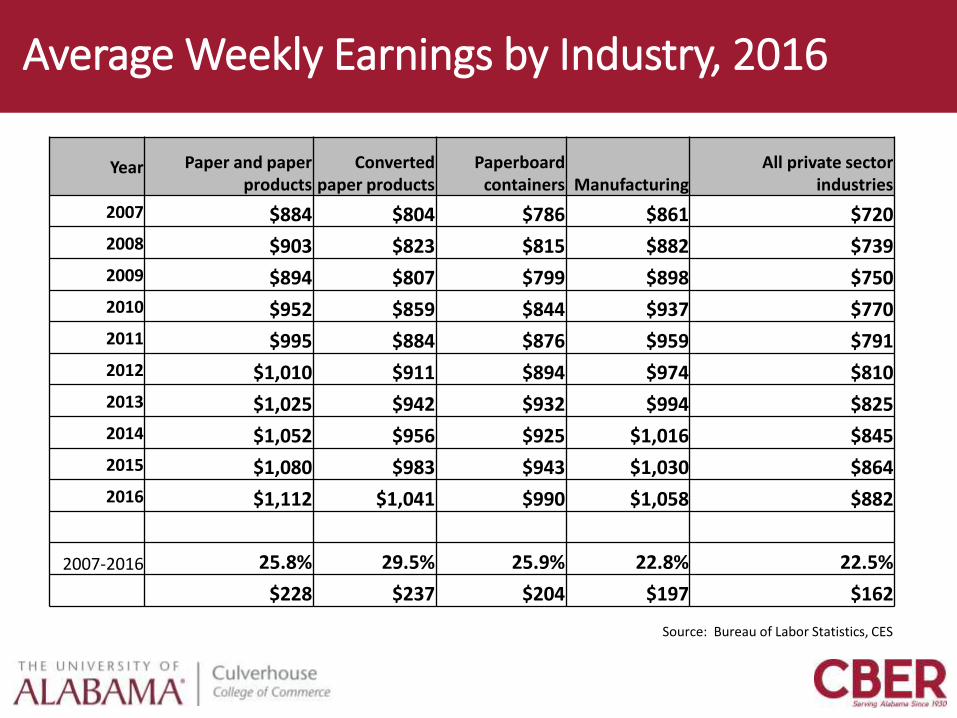
Average Weekly Earnings by Industry, 2016
Year Paper and paper products
Converted paper products
Paperboard containers Manufacturing
All private sector industries
2007 $884 $804 $786 $861 $720
2008 $903 $823 $815 $882 $739
2009 $894 $807 $799 $898 $750
2010 $952 $859 $844 $937 $770
2011 $995 $884 $876 $959 $791
2012 $1,010 $911 $894 $974 $810
2013 $1,025 $942 $932 $994 $825
2014 $1,052 $956 $925 $1,016 $845
2015 $1,080 $983 $943 $1,030 $864
2016 $1,112 $1,041 $990 $1,058 $882
2007-2016 25.8% 29.5% 25.9% 22.8% 22.5%
$228 $237 $204 $197 $162
Source: Bureau of Labor Statistics, CES

Average Weekly Earnings by Industry, 2016
$600
$700
$800
$900
$1,000
$1,100
$1,200
2007 2008 2009 2010 2011 2012 2013 2014 2015 2016
Paper and paper products Converted paper products Paperboard containers Manufacturing All private sector industries
Source: Bureau of Labor Statistics, CES

Employment by Industry (Thousands)
Year
Industries
Paper andPaper
products
Pulp, paper, and
paperboard mills
Converted paper
products
Paperboard containers
Corrugated and solid
fiber boxes
Folding boxes and
miscellaneous paperboard
containers
Paper bags and coated and
treated paper
Stationery and other converted
paper products
ManufacturingAll private
sector industries
2007 458 132 326 172 110 62 73 81 13,878 115,778
2008 445 126 318 167 106 60 71 80 13,403 114,737
2009 407 117 290 151 94 56 65 75 11,848 108,747
2010 395 112 282 147 93 54 62 73 11,529 107,864
2011 387 109 278 145 92 53 63 70 11,727 109,848
2012 380 108 272 142 90 52 61 68 11,927 112,251
2013 378 107 271 144 90 53 61 66 12,020 114,531
2014 373 104 269 143 91 52 60 65 12,185 117,062
2015 373 101 271 147 93 54 59 65 12,335 119,789
2016 371 100 271 148 93 55 60 63 12,348 122,0772007-2016 -19.1% -24.3% -17.0% -14.0% -15.3% -11.9% -18.3% -22.0% -11.0% 5.4%
-87 -32 -55 -24 -17 -7 -13 -18 -1,530 6,300
Source: Bureau of Labor Statistics, CES

Change in Employment (Percent)
-14.00
-12.00
-10.00
-8.00
-6.00
-4.00
-2.00
0.00
2.00
4.00
2008 2009 2010 2011 2012 2013 2014 2015 2016
Paperboard containers Paper bags and coated and treated paper
Stationery and other converted paper products Manufacturing
All private sector industries Source: Bureau of Labor Statistics, CES
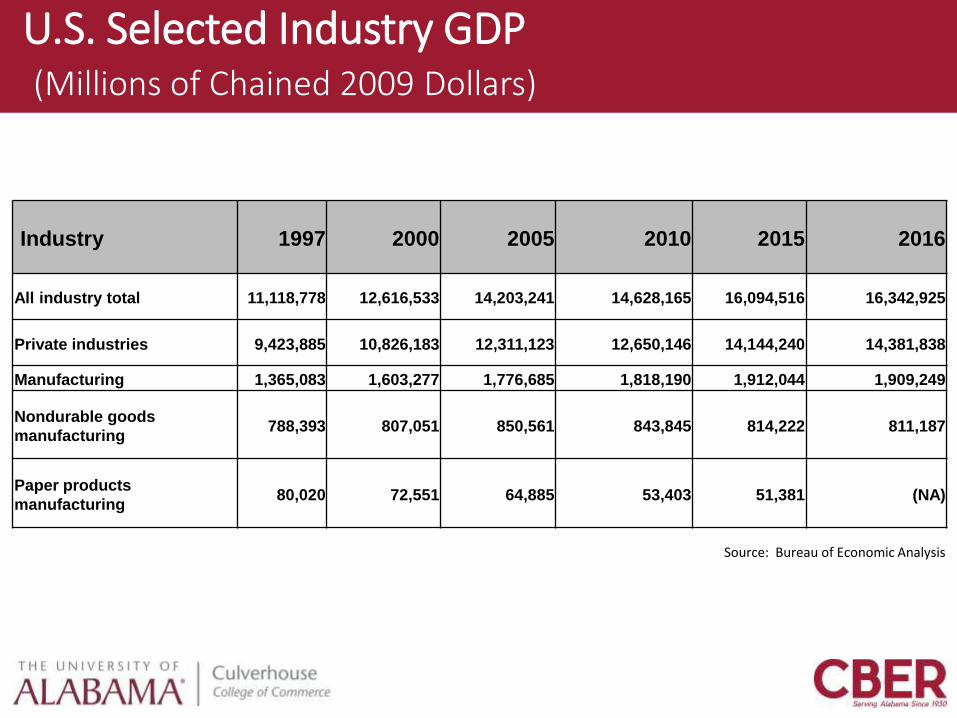
U.S. Selected Industry GDP(Millions of Chained 2009 Dollars)
Industry 1997 2000 2005 2010 2015 2016
All industry total 11,118,778 12,616,533 14,203,241 14,628,165 16,094,516 16,342,925
Private industries 9,423,885 10,826,183 12,311,123 12,650,146 14,144,240 14,381,838
Manufacturing 1,365,083 1,603,277 1,776,685 1,818,190 1,912,044 1,909,249
Nondurable goods
manufacturing788,393 807,051 850,561 843,845 814,222 811,187
Paper products
manufacturing80,020 72,551 64,885 53,403 51,381 (NA)
Source: Bureau of Economic Analysis

Annual Percent Change in GDP
-15.00%
-10.00%
-5.00%
0.00%
5.00%
10.00%
1998 1999 2000 2001 2002 2003 2004 2005 2006 2007 2008 2009 2010 2011 2012 2013 2014 2015 2016
All industry total Manufacturing Nondurable goods manufacturing Paper products manufacturing
Source: Bureau of Economic Analysis

Paper Industry Share of Total GDP (Percent)
0.00%
0.10%
0.20%
0.30%
0.40%
0.50%
0.60%
0.70%
0.80%
1997 1998 1999 2000 2001 2002 2003 2004 2005 2006 2007 2008 2009 2010 2011 2012 2013 2014 2015
Source: Bureau Economic Analysis

Paper Industry Forecast (Industrial Production)
(Percent change unless otherwise noted)
2016 2017 2018 2019 2020
Paper and Paper Products -2.4 -1.2 0.0 0.7 0.7
Pulp and Paper Mills -3.3 -2.1 -0.5 0.1 0.3
Converted Paper Products -1.5 -0.4 0.5 0.9 0.9
Bags, Coated and Treated
Paper -6.3 -2.7 0.4 0.9 1.0
Other Paper Products -0.4 0.9 1.3 1.7 1.5
Source: IHS Global Insight

Economy will continue to grow at around 2 to 2.5 percent rate for the next two to three years
Thank youCenter for Business and Economic Research
Culverhouse College of Commerce
The University of Alabama
205-348-6191
http://cber.cba.ua.edu