Embed Size (px)
Citation preview

US Downstream Capital Projects, Turnaround & Maintenance Market Outlook 2018BROUGHT TO YOU BY
NOVEMBER 2017 US DOWNSTREAM CAPITAL PROJECTS, TURNAROUND & MAINTENANCE MARKET OUTLOOK 2018 | 2
CLICK HERE >>
About Petrochemical Update
Through independent market research and large-scale international downstream conferences, Petrochemical Update helps decision makers anticipate the downstream future and formulate timely plans in the face of rapid change.
Our analysts are known for independence, fundamental research, foresight and original thinking. Our clients are petrochemical operators, refining operators, LNG operators, contractors, service providers and other consultancy firms.
Disclaimer The information and opinions in this whitepaper were prepared by Petrochemical Update (FCBI Energy Ltd.) and its partners. Petrochemical Update (FCBI Energy Ltd.) has no obligation to tell you when opinions or information in this report change.
Petrochemical Update (FCBI Energy Ltd.) makes every effort to use reliable, comprehensive information, but we make no representation that it is accurate or complete.
In no event shall Petrochemical Update (FCBI Energy Ltd.) and its partners be liable for any damages, losses, expenses, loss of data, loss of opportunity or profit caused by the use of the material or contents of this report.
No part of this document may be distributed, resold, copied or adapted without Petrochemical Update’s (FCBI Energy Ltd.) prior written permission.
AuthorMartina Asbury
NOVEMBER 2017 US DOWNSTREAM CAPITAL PROJECTS, TURNAROUND & MAINTENANCE MARKET OUTLOOK 2018 | 3
CLICK HERE >>
Table of Contents
1. OVERVIEW . . . . . . . . . . . . . . . . . . . . . . . . . . . . . . . . . . . . . . . . . . . . . . . . . . . . . . . . . . . . . . . . 4
2. DOWNSTREAM CONSTRUCTION MARKET OVERVIEW . . . . . . . . . . . . . . . . . . . . . . . . . . . . . . . . 7
2.1. Impact of Hurricane Harvey . . . . . . . . . . . . . . . . . . . . . . . . . . . . . . . . . . . . . . . . . . . . . . . . . . . . . . . . . 7
2.2. Petrochemical Construction Market . . . . . . . . . . . . . . . . . . . . . . . . . . . . . . . . . . . . . . . . . . . . . . . . . 9
2.2.1. Market Overview and Near-term Outlook . . . . . . . . . . . . . . . . . . . . . . . . . . . . . . . . . . . . . . . . . . 9
2.2.2. Projects Update . . . . . . . . . . . . . . . . . . . . . . . . . . . . . . . . . . . . . . . . . . . . . . . . . . . . . . . . . . . . . . . . . . . 11
2.3.Refining Construction Market . . . . . . . . . . . . . . . . . . . . . . . . . . . . . . . . . . . . . . . . . . . . . . . . . . . . . . . . 16
2.3.1. Market Overview and Near-term Outlook . . . . . . . . . . . . . . . . . . . . . . . . . . . . . . . . . . . . . . . . . . 16
2.3.2. Projects Update . . . . . . . . . . . . . . . . . . . . . . . . . . . . . . . . . . . . . . . . . . . . . . . . . . . . . . . . . . . . . . . . . . . 17
2.4. Liquefied Natural Gas Market . . . . . . . . . . . . . . . . . . . . . . . . . . . . . . . . . . . . . . . . . . . . . . . . . . . . . . . . 18
2.4.1. Market Overview and Near-term Outlook . . . . . . . . . . . . . . . . . . . . . . . . . . . . . . . . . . . . . . . . . . 18
2.4.2. Projects Update . . . . . . . . . . . . . . . . . . . . . . . . . . . . . . . . . . . . . . . . . . . . . . . . . . . . . . . . . . . . . . . . . . . 20
2.5.Craft Labor Availability and Work Force Development . . . . . . . . . . . . . . . . . . . . . . . . . . . . . . . . 23
2.6.US Gulf Coast Productivity Data . . . . . . . . . . . . . . . . . . . . . . . . . . . . . . . . . . . . . . . . . . . . . . . . . . . . . . 23
2.6.1. Recent Impact of Hurricane Activity on GC Labor Productivity . . . . . . . . . . . . . . . . . . . . . . 24
2.6.2.USA City & State Construction Productivity Factors (norms negating storm impact) . . . . . 25
2.7.Construction Equipment Rates and Wage Rates . . . . . . . . . . . . . . . . . . . . . . . . . . . . . . . . . . . . . . 27
2.8.Factors Affecting Field Labor Productivity . . . . . . . . . . . . . . . . . . . . . . . . . . . . . . . . . . . . . . . . . . . . 29
3. DOWNSTREAM CONSTRUCTION INNOVATION . . . . . . . . . . . . . . . . . . . . . . . . . . . . . . . . . . . . . 30
3.1.Advanced Work Packaging . . . . . . . . . . . . . . . . . . . . . . . . . . . . . . . . . . . . . . . . . . . . . . . . . . . . . . . . . . . 32
3.2.4D/5D Construction Models . . . . . . . . . . . . . . . . . . . . . . . . . . . . . . . . . . . . . . . . . . . . . . . . . . . . . . . . . 32
3.3.The Digital Imperative for Construction Productivity . . . . . . . . . . . . . . . . . . . . . . . . . . . . . . . . . . 32
3.3.1. Data Analytics . . . . . . . . . . . . . . . . . . . . . . . . . . . . . . . . . . . . . . . . . . . . . . . . . . . . . . . . . . . . . . . . . . . . . 33
3.3.2. Convergence of the Physical to the Digital Ecosystem . . . . . . . . . . . . . . . . . . . . . . . . . . . . . . 33
3.3.3. Technologies Reshaping the Future of Construction Productivity . . . . . . . . . . . . . . . . . . . 35
3.3.4. Reinventing Culture – People are first, always . . . . . . . . . . . . . . . . . . . . . . . . . . . . . . . . . . . . . . 36
4. MAINTENANCE AND RELIABILITY . . . . . . . . . . . . . . . . . . . . . . . . . . . . . . . . . . . . . . . . . . . . . . . . . 37
4.1.The “Smart Jobsite” Becomes the “Digital Asset” . . . . . . . . . . . . . . . . . . . . . . . . . . . . . . . . . . . . . . . 37
4.2.Life Cycle Asset Performance Management . . . . . . . . . . . . . . . . . . . . . . . . . . . . . . . . . . . . . . . . . . 37
4.3.People Advantage . . . . . . . . . . . . . . . . . . . . . . . . . . . . . . . . . . . . . . . . . . . . . . . . . . . . . . . . . . . . . . . . . . . 40
4.4.Operator Reliability Case Study . . . . . . . . . . . . . . . . . . . . . . . . . . . . . . . . . . . . . . . . . . . . . . . . . . . . . . . 41
5. SHUTDOWNS AND TURNAROUNDS . . . . . . . . . . . . . . . . . . . . . . . . . . . . . . . . . . . . . . . . . . . . . . . 42
5.1.TAR Activity and Spending Trends . . . . . . . . . . . . . . . . . . . . . . . . . . . . . . . . . . . . . . . . . . . . . . . . . . . . 42
5.2.STO Performance Improvement Strategies . . . . . . . . . . . . . . . . . . . . . . . . . . . . . . . . . . . . . . . . . . . 43
5.2.1.Drive a Culture of Safety . . . . . . . . . . . . . . . . . . . . . . . . . . . . . . . . . . . . . . . . . . . . . . . . . . . . . . . . . . . . 43
5.2.2. Improve Effectiveness and Reduce Costs . . . . . . . . . . . . . . . . . . . . . . . . . . . . . . . . . . . . . . . . . . . 43
5.2.3. Manage Resources . . . . . . . . . . . . . . . . . . . . . . . . . . . . . . . . . . . . . . . . . . . . . . . . . . . . . . . . . . . . . . . . 44
5.3.Integration of Capital Projects and Turnarounds . . . . . . . . . . . . . . . . . . . . . . . . . . . . . . . . . . . . . . 45
6. CONCLUSION . . . . . . . . . . . . . . . . . . . . . . . . . . . . . . . . . . . . . . . . . . . . . . . . . . . . . . . . . . . . . . . . 46
NOVEMBER 2017 US DOWNSTREAM CAPITAL PROJECTS, TURNAROUND & MAINTENANCE MARKET OUTLOOK 2018 | 4
CLICK HERE >>
1. OVERVIEW
This whitepaper provides a construction market overview for Refining, Petrochemicals and LNG that includes a near term market outlook, projects update and construction cost analysis in the Gulf Coast and northeast regions of the United States.
A segment of the report is dedicated to an in-depth focus on how construction innovation practices, technology, processes and tools, such as the integration of data across the project lifecycle, are improving construction productivity.
Finally, an overview of maintenance and reliability activities, emerging trends and shutdown and turnaround improvement strategies is explored.
US Refining Trajectories
The major trends in new US refining capacity include processing the wave of lighter crudes produced from US shale plays, as well as adhering to Tier 3 fuel regulations.
The US currently has 18.2 MMBbl/cd of refining capacity with a refining fleet comprised primarily of complex facilities well suited to handle heavy, sour crude oils. Thus, US refiners are disadvantaged by an increasing share of crude production from lighter shale crude extracted as a by-product of US abundant reserves of shale gas.
In total, the US is expected to add between 450 Mbpd and 600 Mbpd of new refining capacity by the early 2020s,” says Lee Nichols in a recent Hydrocarbon Processing view of Global Refining Outlook.
For the first time in 40 years, new construction of refineries in the US in on the horizon. These are smaller in capacity and less complex they are tailored specifically to feedstock from shale basins in Texas and North Dakota where they are co-located. The industry is rapidly responding with pipelines and infrastructure to transport refined products to the Gulf Coast or nearby consumers.
BP Energy Outlook forecasts that the US becomes energy self-sufficient in 2023. Natural gas replaces oil as the leading fuel in US energy consumption around 2023 – increasing its share from 31% today to 39% in 2035. Oil’s share of the fuel mix falls to 29% by 2035, the lowest level on record.
US Petrochemicals Secure in Global Trade Winds
Some 10.3 million tonnes of ethylene capacity will enter the U.S. market before the end of 2019, according to global petrochemical market information provider ICIS. This represents an increase of 36% of existing US capacity by 2018/2019.
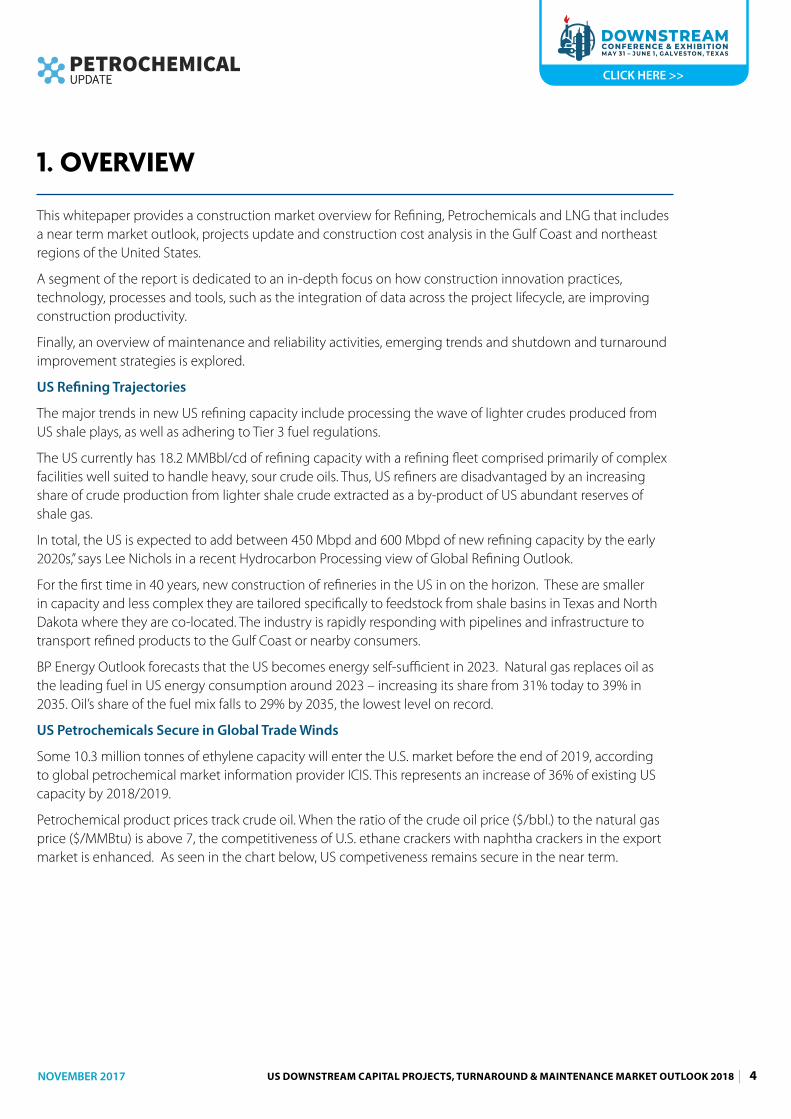
Petrochemical product prices track crude oil. When the ratio of the crude oil price ($/bbl.) to the natural gas price ($/MMBtu) is above 7, the competitiveness of U.S. ethane crackers with naphtha crackers in the export market is enhanced. As seen in the chart below, US competiveness remains secure in the near term.
NOVEMBER 2017 US DOWNSTREAM CAPITAL PROJECTS, TURNAROUND & MAINTENANCE MARKET OUTLOOK 2018 | 5
CLICK HERE >>
Figure 1. Oil to Gas Ratio Image Source: American Chemistry Council
The primary driver behind this is the abundance of a 30-year supply of US shale gas that can be profitably produced at $4.00 per million BTUs or less, cites IHS data. At least 85% of U.S. petrochemical production is natural gas or natural gas liquid (NGL) as feedstock, while 75% of the world uses oil and naphtha based production.
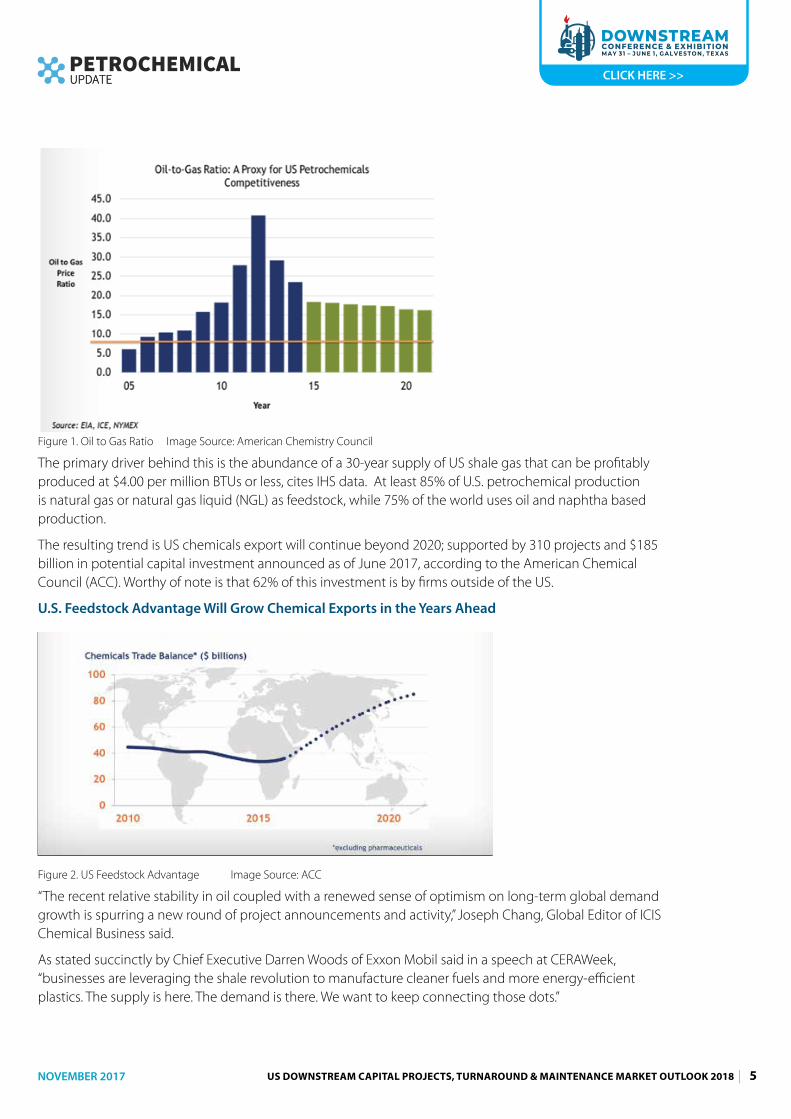
The resulting trend is US chemicals export will continue beyond 2020; supported by 310 projects and $185 billion in potential capital investment announced as of June 2017, according to the American Chemical Council (ACC). Worthy of note is that 62% of this investment is by firms outside of the US.
U.S. Feedstock Advantage Will Grow Chemical Exports in the Years Ahead
Figure 2. US Feedstock Advantage Image Source: ACC
“The recent relative stability in oil coupled with a renewed sense of optimism on long-term global demand growth is spurring a new round of project announcements and activity,” Joseph Chang, Global Editor of ICIS Chemical Business said.
As stated succinctly by Chief Executive Darren Woods of Exxon Mobil said in a speech at CERAWeek, “businesses are leveraging the shale revolution to manufacture cleaner fuels and more energy-efficient plastics. The supply is here. The demand is there. We want to keep connecting those dots.”
NOVEMBER 2017 US DOWNSTREAM CAPITAL PROJECTS, TURNAROUND & MAINTENANCE MARKET OUTLOOK 2018 | 6
CLICK HERE >>
By demand, Woods is referring to global growing demand for polyethylene from customers producing performance films, high-pressure pipe, and packaging.
North American polyethylene production to over 54 billion pounds per year by 2020, up from 44 billion pounds as of the end of 2014. This increase assumes 75% of the announced polyethylene projects are built and commissioned by 2020.
Excess North American polyethylene production available for export will be 6–9 billion pounds within the 2016–2020-time frame, assuming 75% of the announced polyethylene projects are built and commissioned by 2020.
In the Northeast, development of a Marcellus and Utica shale ethane storage hub is being explored. The ethane is being shipped out of the region for cracking via pipelines, such as the Sunoco Logistics Mariner East and Mariner West projects, as well as the ATEX Express. Kinder Morgan also is building the $500 Utopia Pipeline to send up to 75,000 barrels of ethane to Canada each day. As the Upper Ohio Valley waits to learn of PTT’s final investment decision, Royal Dutch Shell is moving forward with a petrochemical plant at Monaca, Pa.
Flurry of US LNG Comes Onstream in 2018
The US stands to become the world’s third-largest exporter by 2020, when it’s expected to ship about 8.3bn cubic feet a day of capacity, or 14% of the world’s share, according to London-based consultant Energy Aspects Ltd.
After 2020, U.S. exports of LNG grow at a more modest rate as U.S.-sourced LNG becomes less competitive in global energy markets.
Room for additional US LNG production is limited as no sales and purchase agreements have been signed since developer Venture Global and Shell agreed to a 20-year deal in February 2016.
Project developers will need to convince buyers that now is the time to secure supplies for the next wave of LNG demand. Primary destination of US exports are East Asia and India Egypt, Pakistan and Jordan – all new importers – made up three of the top five fastest growing LNG importing countries in the world. (Source: ICIS Market Outlook).
More than $88 billion in LNG projects are currently planned, being built or in operation across the U.S.
Engineering and Construction Trends - Goodbye, Silos! Hello, Productivity!
In its “2017 Engineering and Construction Trends – Survival of the Biggest”, PwC states that even though prices have slowly begun to recover, most oil giants are still cautious about new initiatives with major capital expenditures.
Three trends are identified: (1) contracting will get tougher, shifting risk to E&C firms; (2) market consolidation will continue and grow stronger; and (3) competition will continue to grow from E&C players in China, Korea, and India. Those who survive to compete will reduce costs and adopt new technology trends.
Every aspect of the anatomy of a capital project is being penetrated by technology-based software solutions to improve estimating, cost management, contracting, materials management, construction productivity, interface management, and 4D/5D visual performance tracking models. While “data analytics” (mining data to solve problems) is important, the big pay-off is in the availability of a single source of accurate data across the business, project and asset that powers collaboration and decision-making.
The implications to the energy sector, including downstream, is a digital imperative that will require both Owner and EPC organizations to disrupt and to some extent reinvent their company culture; business models; their project execution work processes and practices; and their ways of working. Companies that fail to adapt cloud-based, integrated databases and mobile field technology face extinction.
NOVEMBER 2017 US DOWNSTREAM CAPITAL PROJECTS, TURNAROUND & MAINTENANCE MARKET OUTLOOK 2018 | 7
CLICK HERE >>
The face of field construction is changing with less time spent in job trailers; real time access to drawings on intrinsically safe electronic tablets; mobile management of daily logs, review and approval of change orders, checklists, and punch lists; greater consistency in project documentation; and simplified contract management and digital workflows.
Reliability and Maintenance Trends (incl. TARs)
Refineries and petrochemical facilities are continuously challenged to improve performance metrics in the areas of energy, availability and safety.
With increasing pressure to reduce operations and maintenances budgets and justify return on investment of maintenance spend while clearly articulating risks, the environment is poised to welcome technology advances.
Machine learning offers downstream companies the opportunity to do more with fewer people. Decision-support systems enabled by artificial intelligence can reduce organization layers, removing traditional centralized spans of management hierarchy and replacing them with more localized control. New algorithms enable predictive maintenance that no longer requires sign-off from higher-level managers. Frontline risk-taking promotes rapid innovation by speeding up iterations and decision making to support nimbler, test-and-learn approaches.
Colin Powell said, “Great leaders are almost always great simplifiers.” Simplicity and intuitiveness in the design of new technology solutions is required. Front line supervisors are inundated with growing numbers of systems, procedures, and other controls designed to positively impact results are having the opposite effect.
At the work face, user interfaces need to be “foreman friendly” to encourage usage. The return on investment in technology innovations will fall very short of expectations unless people engage in the game because they are listened to, respected, encouraged to take risks, want to.
2. DOWNSTREAM CONSTRUCTION MARKET OVERVIEW
2.1. Impact of Hurricane HarveyThe most significant impact from Hurricane Harvey is the more than 60 lives lost during torrential rainfall over several days that peaked above 50 inches in many areas in Texas and Louisiana. The Category 4 storm came ashore in Corpus Cristi on Aug. 25, 2017, as the most powerful hurricane to hit Texas in more than 50 years. Unleashing an estimated 27 trillion gallons of water, the storm displaced more than one million people and damaged some 200,000 homes in its path of destruction stretching for more than 300 miles. Early estimates put the damage at $190 billion, more than Hurricane Katrina in 2005 and Hurricane Sandy in 2012 combined, according to AccuWeather.
While Harvey largely spared oil and petrochemical plants along the US Gulf Coast from significant damage, thousands of homes and businesses were subjected to massive flooding for more than seven days.
The storm shut down roughly a quarter of the nation’s refinery capacity and more than a dozen petrochemical plants halted operations. Ports were closed and key fuel pipelines serving the Midwest and US Northeast were partially or completely shut down.
Industrial Information Resources (IRR) is tracking 42 capital projects worth $7.4 billion now in the construction phase and 19 capital projects worth nearly $2.6 billion expected to start construction before year end in Harris County. These projects will compete with rebuild efforts in infrastructure, commercial and residential sectors,
NOVEMBER 2017 US DOWNSTREAM CAPITAL PROJECTS, TURNAROUND & MAINTENANCE MARKET OUTLOOK 2018 | 8
CLICK HERE >>
driving up costs and causing labor shortages. “Labor shortages pose a long-term issue,” said IIR’s Anthony Salemme. “There are already shortages in mechanical crafts, and now there will be shortages in the soft crafts like painting, insulation and laborers.”
IHS Markit ‘Hurricane Harvey Update September 7’ reported the following:
Refining
Affected facilities represent more than 30% of US refining capacity. As of September 7, IHS Markit estimated 8 of the 20 refineries were operating at “normal” rates. All but one of the other 12 were beginning restart procedures or actively ramping up production. Including those partially operational, IHS Markit estimates that 2.9 million b/d of distillation capacity (16 percent of U.S. total) was offline as of September 6. The faster-than-expected recovery by the refining industry has calmed product markets.
Ethylene Approximately 70% of the total US production for ethylene and 65% of the total ethylene equivalent consumption capacity is in Texas. With most units impacted by the storm, 54% of total U.S. ethylene production and 36% of total U.S. ethylene consumption capacity was offline on September 7; many units had begun to restart operations.
Polyethylene
Approximately 40% of U.S. polyethylene production capacity was lost or constrained due to mechanical or logistical issues. Only a single digit percentage of the capacity was expected to remain offline for more than 30 days.
The first day business day following the landfall of Hurricane Harvey on the Texas coast saw the issuance of a flurry of Force Majeure declarations.
Second wave projects announced recently, including LyondellBasell, DowDuPont, ExxonMobil and BASF, remain unchanged, while others will repair damage from Harvey before making final investment decisions on previously announced projects.
“The lasting damage is mostly confined to housing and small businesses like retail, bars and restaurants, dry cleaners, grocery stores, etc.,” said Bill Gilmer, director of the University of Houston’s Institute for Regional Forecasting. Gilmer predicts about 18 months of rebuilding work in Houston. “We are on the brink of a short but intense boom led by reconstruction,” Gilmer said. “After every storm comes the clean-up and repair, and we will see soaring sales of automobiles, wallboard, carpet, and furniture.”
There are hundreds of plants in terminals, distribution, manufacturing, food/beverage, metals, and other markets that will now have new spend to re-start operations, Salemme said. “Equipment required to re-start these plants are not available or in inventory (supply chain), exacerbating the situation and construction schedules,” he added.
In the months ahead, there could be shortages of construction materials and items like valves, pumps, and copper, Salemme said. “Everybody is going to want it all at the same time.”
Hurricane Irma has compounded the situation, as repairs in Florida and the East Coast require the same laborers, insulators, copper wiring, and more, he added.
The impact on the Gulf Coast construction labor market is examined further in section 2.6 herein.
NOVEMBER 2017 US DOWNSTREAM CAPITAL PROJECTS, TURNAROUND & MAINTENANCE MARKET OUTLOOK 2018 | 9
CLICK HERE >>
2.2. Petrochemical Construction Market2.2.1. Market Overview and Near-term Outlook
Driven by the continued low cost of natural gas liquids, a primary feedstock for building-block chemicals such as ethylene, the US petrochemical industry continues to enjoy optimism about future investment and the chemical industry shows no signs of slowing down. thanks to the.
Industrial Info is tracking $2.68 trillion in active North American projects, including more than $172 billion that are planned to kick off in Texas and Louisiana from now through 2018. As in previous years, the highest-value industries in regard to planned projects are the Chemical Processing Industry and Oil & Gas Production Industry, which account for $37.9 billion and $59.9 billion in planned project starts, respectively.
Global demand for ethylene and other chemicals remains strong, providing export opportunities for US producers, resulting in increased investment in the US.
Some 10.3 million tonnes of ethylene capacity will enter the U.S. market before the end of 2019, according to global petrochemical market information provider ICIS. This represents an increase of 36% of existing US capacity by 2018/2019.
“While many projects were shelved or in doubt amid the crude oil price decline in 2014-2015, the recent relative stability in oil coupled with a renewed sense of optimism on long-term global demand growth is spurring a new round of project announcements and activity,” Joseph Chang, Global Editor of ICIS Chemical Business said.
$86 billion worth of petrochemical projects has been completed or started construction in the U.S., and another $100 billion has been proposed.
The American Chemistry Council (ACC) estimates there are 310 projects currently under construction or planned and $185 billion in potential capital investment as of mid-year 2017, up from the 97 projects and $72 billion in March 2013.
Positive earnings and stable demand are pushing a second wave of petrochemical construction projects.
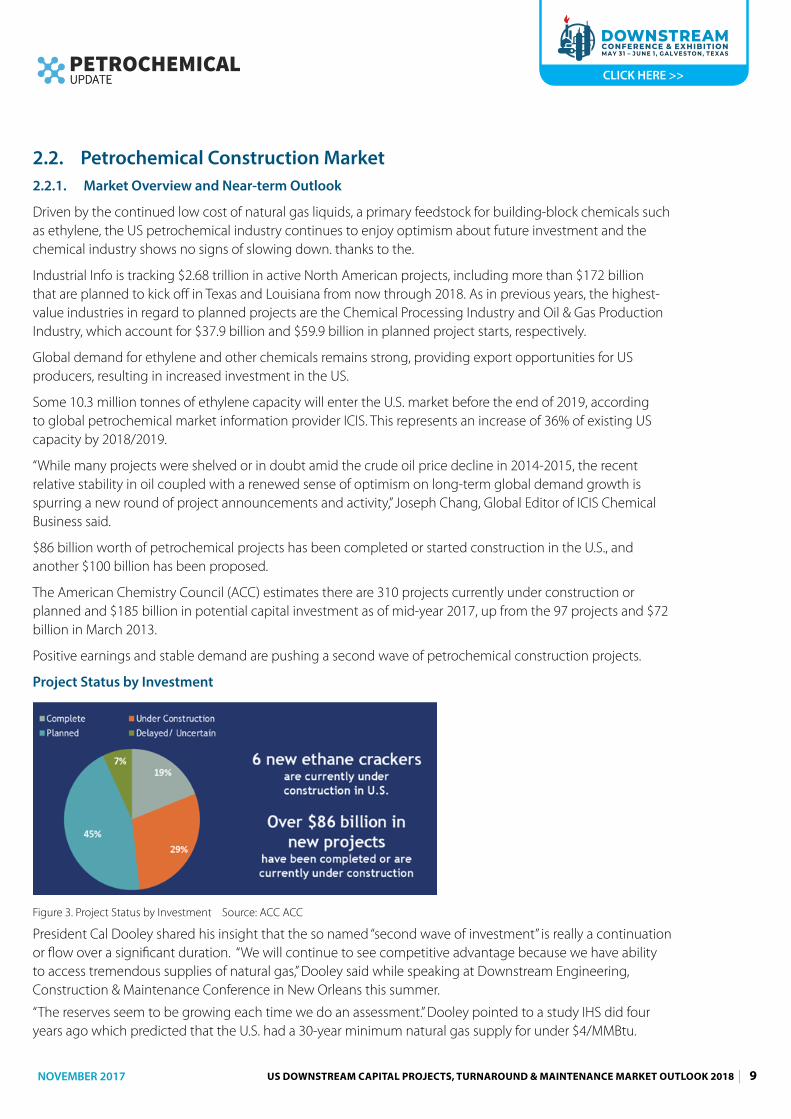
Project Status by Investment
Figure 3. Project Status by Investment Source: ACC ACC
President Cal Dooley shared his insight that the so named “second wave of investment” is really a continuation or flow over a significant duration. “We will continue to see competitive advantage because we have ability to access tremendous supplies of natural gas,” Dooley said while speaking at Downstream Engineering, Construction & Maintenance Conference in New Orleans this summer.
“The reserves seem to be growing each time we do an assessment.” Dooley pointed to a study IHS did four years ago which predicted that the U.S. had a 30-year minimum natural gas supply for under $4/MMBtu.
NOVEMBER 2017 US DOWNSTREAM CAPITAL PROJECTS, TURNAROUND & MAINTENANCE MARKET OUTLOOK 2018 | 10
CLICK HERE >>
U.S. natural gas prices are at their lowest price since 2002, according to an August study issued by the U.S. Energy Information Administration (EIA).
“Fundamentally, the situation has changed,” Dooley adds. “Fifteen years ago, we were one of the highest cost manufacturers in chemicals. Today, the U.S. is arguably one of the most competitive global manufacturers of chemicals, and it’s all because of hydraulic fracturing and the low cost of natural gas.”
Exports of chemicals linked to shale gas are projected to reach $123 billion by 2030, notes ACC, more than double the total in 2014. That will drive the trade surplus from these chemicals to increase from $19.5 billion to $48.3 billion by 2030. “If you go back about 2012, we were exporting about 173 million in chemical products, we will see that increase in 2021 to about 245 million,” Dooley said.
Dow Chemical has committed to spending $4 billion spread over the next five years on a series of expansions, mostly in the U.S. Manav Lahoti, commercial director for The Dow Chemical Company’s U.S. olefins market, says a second wave of industrial investment is all but certain. “We don’t think the second wave is going to be as large as the first,” Lahoti says, adding that it’s probably a good thing. “We think the second wave, for us at least, needs to be smaller. It will allow us to leverage some of the skills and lessons learned from the first wave. We feel productivity will be better as a result.”
DowDuPont retains Dow’s former position as the largest producer and consumer of ethylene in the US, and Dow’s Freeport, Texas complex is the largest integrated chemical manufacturing complex in the Western hemisphere.
The increased production of U.S. ethylene and the associated investment in new U.S. polyethylene capacity will increase North American polyethylene production to over 54 billion pounds per year by 2020, up from 44 billion pounds as of the end of 2014. This increase assumes 75% of the announced polyethylene projects are built and commissioned by 2020.
Excess North American polyethylene production available for export will be 6–9 billion pounds within the 2016–2020-time frame, assuming 75% of the announced polyethylene projects are built and commissioned by 2020.
According to data from Platts Analytics, the US will have a PE surplus of about 4.11 million mt during 2017 and this will touch 5.94 million mt in 2018. It will then rise on to 7.13 million mt in 2019 and 7.54 million mt in 2020. About 1.7 million mt/year of new polyethylene capacity is expected to start up by end-2017.
Insufficient Owner Organization Capabilities Threaten Capital Effectiveness
Amid this ongoing surge of complex mega-projects, IPA research of 30 leading chemical and petrochemical companies depicts chemicals companies are struggling to staff project organizations with experienced talent. Even with recognition of continued shortage of owner project competencies, less than half have developed strategies to deal with resource shortages.
In fact, staffing has declined over the last 3 years. Experience levels for engineering leads, construction managers, and project managers for chemicals have declined significantly over the last decade. The survey shows that estimating, project management, and construction management are currently the three most difficult functions to staff.
IPA’s research findings are unequivocal: owner engineering supports better project outcomes. In fact, IPA data show robust owner teams drive lower capital costs and more predictable cost performance; the cost avoidance more than compensates for the cost of the owner staff. Having a functionally integrated Owner team in place at project sanction is a key determinant to achieving business outcomes.
NOVEMBER 2017 US DOWNSTREAM CAPITAL PROJECTS, TURNAROUND & MAINTENANCE MARKET OUTLOOK 2018 | 11
CLICK HERE >>
Digital Disruption Key to Best in Class Life Cycle Asset Competitiveness
A consistent theme throughout this paper is the new world order brought on by digital transformation. Falling way behind all other industry sections, asset-intensive refining and petrochemical companies are perfectly positioned to adopt new technology solutions to cope with the new “normal” in crude oil pricing, declining construction productivity and changing labor demographics, according to industry executives.
In the current reality, asset management and capital project execution are separated by a great divide in data availability and accuracy. Manual processes at asset handover feed manual processes for equipment installation, repairs, logistics, and maintenance. Permeating all the way to distribution terminals running 20-30-year-old software and paper bill of laden the result is dissatisfied customers. Assets are built to generate return on investment and that translates to a customer-focused business model for life cycle asset performance.
“The next generation of really successful companies will be those that manifest their intellectual property in digital form and take advantage of the transformation opportunities that exist for them,” said David Holmes, CTO Energy for DellEMC.
2.2.2. Projects Update
First Wave US Ethylene Cracker Investments
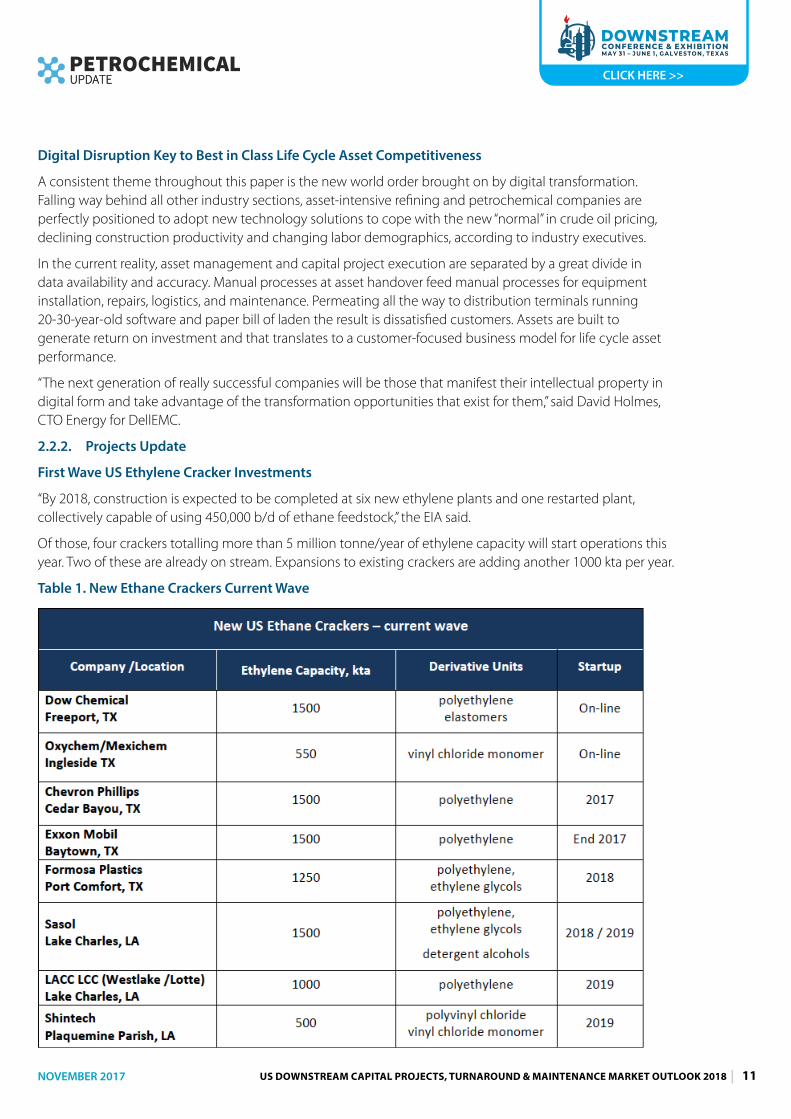
“By 2018, construction is expected to be completed at six new ethylene plants and one restarted plant, collectively capable of using 450,000 b/d of ethane feedstock,” the EIA said.
Of those, four crackers totalling more than 5 million tonne/year of ethylene capacity will start operations this year. Two of these are already on stream. Expansions to existing crackers are adding another 1000 kta per year.
Table 1. New Ethane Crackers Current Wave
NOVEMBER 2017 US DOWNSTREAM CAPITAL PROJECTS, TURNAROUND & MAINTENANCE MARKET OUTLOOK 2018 | 12
CLICK HERE >>
Projects in construction in 2016-2017 were subject to labor and raw material shortages resulting in higher costs. Even in the face of such challenges, the two 2017 startups at the time of this writing are shining examples of effective capital mega-project execution.
Ingleside Ethylene, LLC, the 50/50 JV between Occidental Chemical Corporation, a subsidiary of Occidental Petroleum Corporation, and Mexichem, S.A.B. de C.V. began operations in February on schedule and on budget after start of construction by CB&I in 2Q 2014. Near Corpus Cristi, the facility produces 550 kta of ethylene to produce vinyl chloride monomer (VCM), polyvinyl chloride (PVC resin) and PVC piping systems. Total investment in the project was approximately $1.5 billion.
The newly merged DowDuPont in late March announced the completion of the construction phase of its 1500 mtpa within one week of the originally planned date, which was set approximately two years ago. Measured by total investment per metric ton of capacity, this new ethylene unit represents the least capital-intensive ethylene investment in the region. At peak activity, the construction phase involved more than 3,000 Dow employees and contractors. The project achieved more than five million consecutive work hours without a lost-time incident.
The Freeport ethylene unit is the cornerstone of a $6-B investment in the US Gulf Coast. The new plant will produce some 1.5 million tonnes/year ethylene, and plans are in place to increase that capacity to 2 million tonnes/year, making it the world’s largest ethylene production plant.
In September 2017 DowDuPont announced startup of both the cracker and its new ELITE enhanced polyethylene production facility at Freeport. Both units will continue to ramp up through Q3 and are expected to reach full rates in Q4 2017.
The 400 kta ELITE polyethylene production unit is the first of four new derivative units at Dow’s manufacturing sites in Texas and Louisiana. Dow’s ELITE enhanced polyethylene resins are known for their versatility and high-performance attributes in food and industrial packaging applications.
The remaining derivative assets to come online in the US Gulf Coast include:
� New specialty low density polyethylene (capacity: 350 kta) for industrial and supply chain packaging applications, expected to startup later this year;
� Next generation NORDEL metallocene EPDM (capacity: 200 kta) to deliver solutions for higher-margin applications for infrastructure and consumer durables end-markets, expected to startup in early 2018;
� Bi-modal gas phase de-bottleneck (125 kta) to enable more offerings for high-performance pipe and fitting applications, as well as the cap and closure market, to follow later in 2018;
� High melt index specialty and conventional polyolefin elastomers (capacity: 320 kta) for high-performance flexible packaging end-markets, expected to come online in late 2018;
� World-scale polyethylene unit based on Dow’s proprietary Solution Process technology (capacity: 600 kta) to meet demand in food and specialty packaging, expected to come online by 2022.
As these derivatives projects now begin construction, Fluor can take advantage of a natural transition of craft labor from its completion of Dow’s cracker to Dow’s derivative units. Jack Penley, senior vice president of Construction & Fabrication for Fluor said, “We are proud of our craft workforce’s attention to safety, productivity and experience on the Freeport site over the past five years.” More than 400 craft professionals are expected at peak construction for Fluor’s scope, with mechanical completion planned for 2018.
Both Chevron Phillips and Exxon Mobil are next in line to come onstream this year.
Chevron Phillips announced mechanical completion of its new bimodal HDPE and LLDPE, each at a capacity of 500 kta, at Old Ocean, TX facility in June 2017. More recently the company announced it has completed commissioning and begun startup of two new polyethylene units with product slates including metallocene
NOVEMBER 2017 US DOWNSTREAM CAPITAL PROJECTS, TURNAROUND & MAINTENANCE MARKET OUTLOOK 2018 | 13
CLICK HERE >>
LLDPE film, bi-modal film and pipe products in September. Its 1500 kta cracker at Cedar Bayou is expects to complete construction in March 2018 with a transition to full production by mid-2018.
Exxon Mobil’s ethane cracker with a capacity of up to 1500 kta will provide ethylene feedstock for two new 650 kta high-performance polyethylene units at the nearby Mont Belview facility is currently being commissioned. Exxon Mobil is also expanding its polyethylene capacity by 650 kta at its Beaumont facility; startup in 2019.
Taiwan’s Formosa Plastics new 1250 kta cracker facility in Point Comfort, Texas is scheduled to come on line in 2018. It will provide feedstock to a 525 kta PE unit, a 625 kta LDPE unit and a 1,000 kta mono-ethylene glycol unit (MEG) with flexibility to produce DEG, TGE, and PEG. Formosa Plastics is also planning to build a 1200 kta cracker in Louisiana.
Sasol announced in June 2016 that its costs to build the cracker and derivative units in Louisiana spiked from $8.1 billion to $11 billion, attributing the bust to construction delays caused by heavy rains, higher labor costs and scope control in it lump sum contract. Completion is now targeted for late 2018-2019.
LyondellBasell recently completed ethylene expansion projects at the company’s La Porte, Channelview and Corpus Christi sites in Texas, finalizing a multi-year plan to increase ethylene capacity in the US by 900 kta. The company began construction of a world-scale polyethylene (PE) plant at its La Porte Complex, which utilizes the company’s proprietary Hyperzone PE technology and will more than double that site’s PE capacity to 2 B pounds (900 kta) per year upon completion in 2019.
2020-2025 Investments
Positive earnings and stable demand are pushing a second wave of petrochemical construction projects. “Second quarter earnings showed solid growth against a benign macroeconomic backdrop with expansion in manufacturing activity in all three key regions – the U.S., Europe and China/Asia. Companies were largely able to grow volumes and show improvement on price year-on-year,” Joseph Chang, Global Editor of ICIS Chemical Business said.
NOVEMBER 2017 US DOWNSTREAM CAPITAL PROJECTS, TURNAROUND & MAINTENANCE MARKET OUTLOOK 2018 | 14
CLICK HERE >>
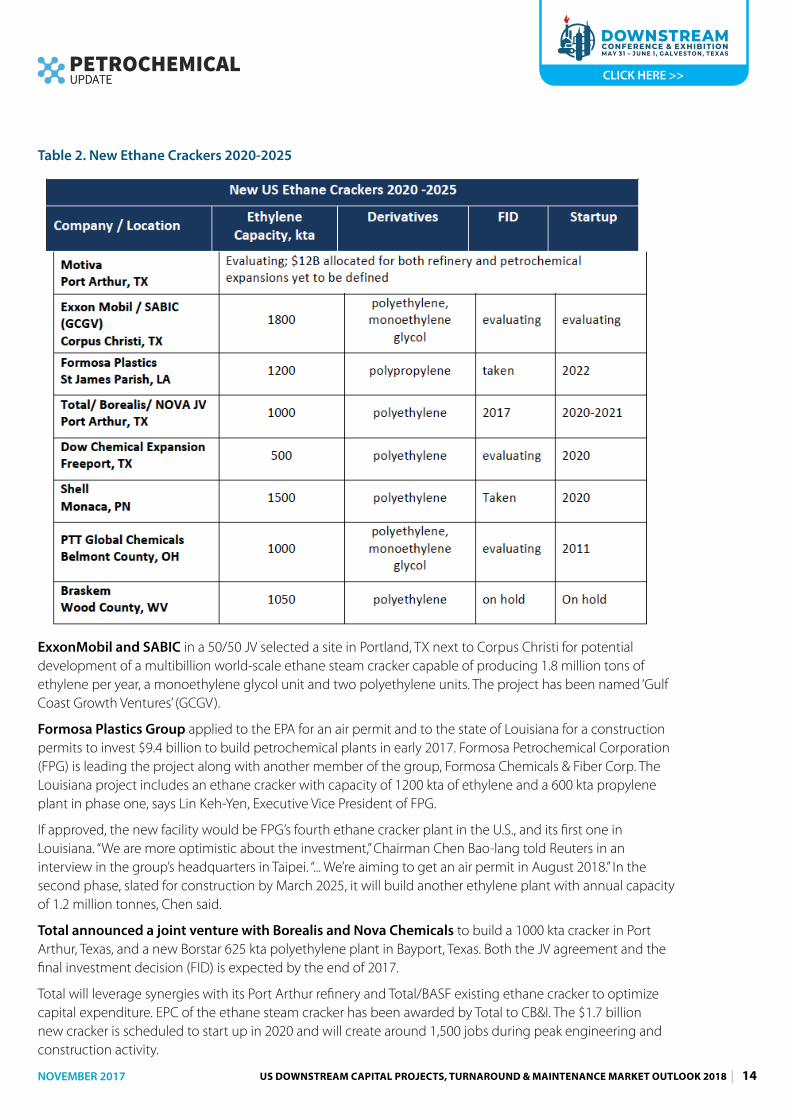
Table 2. New Ethane Crackers 2020-2025
ExxonMobil and SABIC in a 50/50 JV selected a site in Portland, TX next to Corpus Christi for potential development of a multibillion world-scale ethane steam cracker capable of producing 1.8 million tons of ethylene per year, a monoethylene glycol unit and two polyethylene units. The project has been named ‘Gulf Coast Growth Ventures’ (GCGV).
Formosa Plastics Group applied to the EPA for an air permit and to the state of Louisiana for a construction permits to invest $9.4 billion to build petrochemical plants in early 2017. Formosa Petrochemical Corporation (FPG) is leading the project along with another member of the group, Formosa Chemicals & Fiber Corp. The Louisiana project includes an ethane cracker with capacity of 1200 kta of ethylene and a 600 kta propylene plant in phase one, says Lin Keh-Yen, Executive Vice President of FPG.
If approved, the new facility would be FPG’s fourth ethane cracker plant in the U.S., and its first one in Louisiana. “We are more optimistic about the investment,” Chairman Chen Bao-lang told Reuters in an interview in the group’s headquarters in Taipei. “... We’re aiming to get an air permit in August 2018.” In the second phase, slated for construction by March 2025, it will build another ethylene plant with annual capacity of 1.2 million tonnes, Chen said.
Total announced a joint venture with Borealis and Nova Chemicals to build a 1000 kta cracker in Port Arthur, Texas, and a new Borstar 625 kta polyethylene plant in Bayport, Texas. Both the JV agreement and the final investment decision (FID) is expected by the end of 2017.
Total will leverage synergies with its Port Arthur refinery and Total/BASF existing ethane cracker to optimize capital expenditure. EPC of the ethane steam cracker has been awarded by Total to CB&I. The $1.7 billion new cracker is scheduled to start up in 2020 and will create around 1,500 jobs during peak engineering and construction activity.
NOVEMBER 2017 US DOWNSTREAM CAPITAL PROJECTS, TURNAROUND & MAINTENANCE MARKET OUTLOOK 2018 | 15
CLICK HERE >>
“After significant investments in US LNG and US shale gas in 2016, this almost $2-B investment signals our determination to strengthen our presence in the United States, where we have operated for 60 years and have more than 6,000 employees,” said Patrick Pouyanné, Chairman and CEO of Total.
In addition to the 500kta expansion of its newly started cracker, DowDupont says it will begin construction on a new 600 kta PE unit on the U.S. Gulf Coast and add 350 kta of incremental PE capacity through various debottlenecks. Among other investments, Dow announced it will invest in a new, $100 million state-of-the-art innovation center at its global headquarters in Michigan.
Learning for the Second Wave
Contractor and owner communicating on the front end, managers listening to craft labor, innovations in recruiting and training and productivity were all hurdles the first wave had to creatively overcome, experts said.
“When we talk about mega projects, these can be classified in the wild as a beast…hard to train, known for size and complexity. Some become landmark. Some become catastrophes,” said Stevie Toups, Senior Vice President of Turner Industries. “When looking at the first phase of the mega projects, we have seen a few come online that have been unparalleled views of excellence in this industry.” To meet labor shortages we need to turn broaden the net of sources of recruitment using online services to find skilled labor.
Northeast Region Activity
Shell announced in April that it would start construction on its 1500 kta cracker and polyethylene project in Monaca, Pennsylvania in late 2017. Startup is expected in the early 2020s. Shell remains the only company in Appalachian region to take an FID decision.
PPT Global Chemicals officials have publicly cited that a decision will be made on this investment before year end. Optimism regarding the $6 billion holds firm, says Belmont County Port Authority Director Larry Merry and Mike Jacoby, who serves as vice president of business development for Appalachian Partnership for Economic Growth.
Odebrecht and Braskem first announced intentions to build an ethane cracker near Parkersburg in 2013: Appalachian Shale Cracker Enterprise. West Virginia Department of Commerce General Counsel Josh Jarrell confirmed that although Odebrecht is no longer participating in the project, Braskem retains an interest in the land. “It’s not dead,” Jarrell said of the possible Wood County ethane cracker. “We’re anxiously waiting for them to take another step with us.”
Derivatives other than Polyethylene and Ethylene Glycols
LyondellBasell decided to greenlight its $2.4 billion propylene oxide /tertiary butyl alcohol (PO/TBA) project likely to be in Bayport, Texas. The 470 kta PO and 1000 kta TBA plant will be the largest of its kind and yield the most PO of any plant in the world when it starts up in 2021, the company said. LyondellBasell said the all front-end engineering design (FEED) works had already been completed and all environmental permits received. Construction is expected to start by the second half of 2018.
The project is the single-largest capital investment in the company’s history. At the peak of construction, the project is expected to create up to 2,500 jobs and approximately 160 permanent positions when operational.
LyondellBasell CEO Bob Patel conceded to investors in April that the company had rushed a few projects early on and would transfer this lesson to robust front-end scope development on future projects. “One thing LyondellBasell won’t do this time is rush on front end engineering. It was one of the first companies to debottleneck and lift cracker capacity on the U.S. Gulf in the initial wave of shale-based petrochemicals investment. It has time now to be more considered as it maps out the lie of the land,” said Nigel Davis, Insight Editor at ICIS.
NOVEMBER 2017 US DOWNSTREAM CAPITAL PROJECTS, TURNAROUND & MAINTENANCE MARKET OUTLOOK 2018 | 16
CLICK HERE >>
ChevronPhillips said it is looking at an aromatics project in the U.S. using its proprietary on-purpose benzene production Aromax process, which uses light liquids prevalent in U.S. shale formations.
Braskem America Inc. is investing $675 million to build what will become North America’s largest polypropylene (PP) production line at the company’s existing manufacturing site in La Porte, TX. The project is in construction and is expected to startup in 2020. The so named “Delta” PP unit will add another 450 kta of production capacity for homopolymers, random copolymers, impact copolymers, and reactor thermoplastic polyolefins to the La Porte plant’s current PP production capacity of 354 kta, Braskem said.
China’s Wanhua Chemical announced plans to build a $1.12 billion methyl di-p phenylene isocyanate (MDI) plant in Louisiana, after the state’s economic development arm promised it a $4.3 million infrastructure grant earlier this year. marks the second-largest Chinese investment in Louisiana’s chemical manufacturing industry.
Yuhuang Chemical Inc has purchased 1,300 riverfront acres in St. James Parish for its proposed $1.85 billion methanol complex. The first phase will start operations by early 2018. The company plans to add a second methanol plant and a methanol derivatives plant in future phases. The St. James plant will be able to produce up to 1.7 million tons of methanol per year, the majority of which will be shipped to China for use in Shandong Yuhuang’s chemical operations. A small portion of production will be sold to customers in North America.
2.3. Refining Construction Market2.3.1. Market Overview and Near-term Outlook
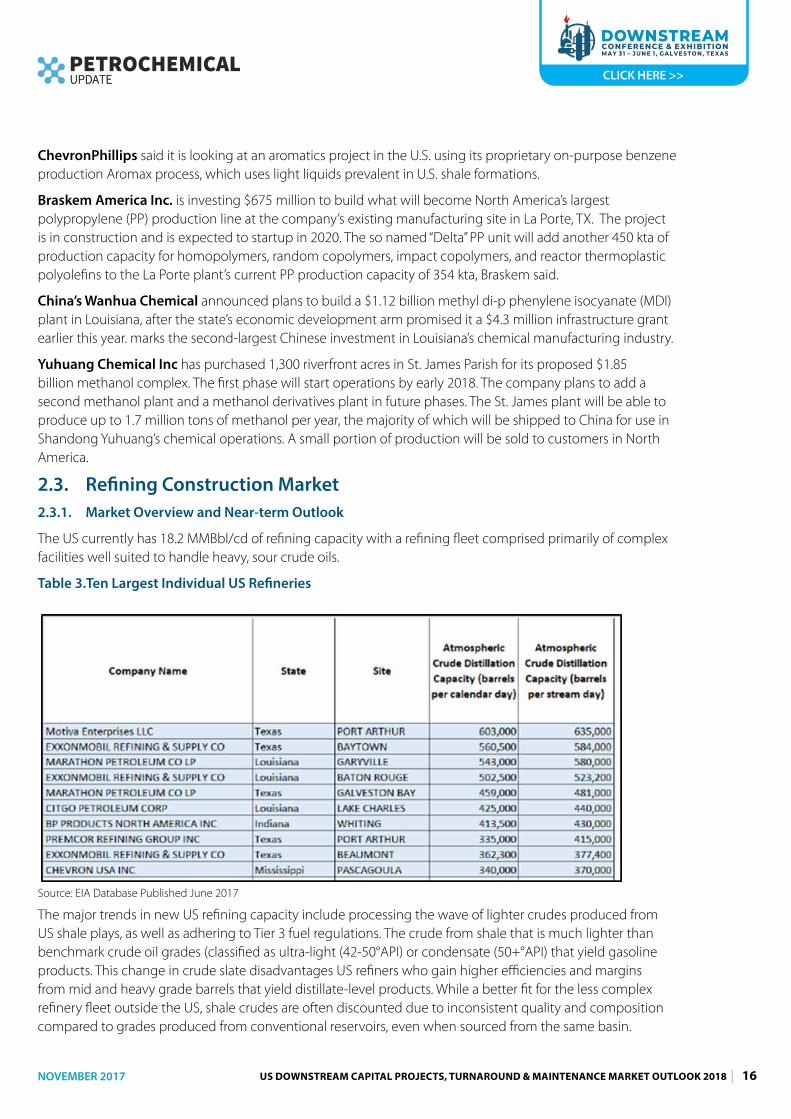
The US currently has 18.2 MMBbl/cd of refining capacity with a refining fleet comprised primarily of complex facilities well suited to handle heavy, sour crude oils.
Table 3.Ten Largest Individual US Refineries
Source: EIA Database Published June 2017
The major trends in new US refining capacity include processing the wave of lighter crudes produced from US shale plays, as well as adhering to Tier 3 fuel regulations. The crude from shale that is much lighter than benchmark crude oil grades (classified as ultra-light (42-50°API) or condensate (50+°API) that yield gasoline products. This change in crude slate disadvantages US refiners who gain higher efficiencies and margins from mid and heavy grade barrels that yield distillate-level products. While a better fit for the less complex refinery fleet outside the US, shale crudes are often discounted due to inconsistent quality and composition compared to grades produced from conventional reservoirs, even when sourced from the same basin.
NOVEMBER 2017 US DOWNSTREAM CAPITAL PROJECTS, TURNAROUND & MAINTENANCE MARKET OUTLOOK 2018 | 17
CLICK HERE >>
There are 723 active refining-related projects worth $80.5 billion in North America, according to Industrial Information Resources.
In total, the US is expected to add between 450 Mbpd and 600 Mbpd of new refining capacity by the early 2020s,” says Lee Nichols in a recent Hydrocarbon Processing view of Global Refining Outlook.
Reshuffling the Owner Deck
A landmark transfer of ownership occurred on May 1 as Saudi Aramco assumed full ownership of the US’s largest refinery in Port Arthur, TX with the dissolution of Motiva Enterprises, formerly a 50/50 JV with its partner Royal Dutch Shell. Under the breakup agreement, Aramco retained the Motiva name.
Already the company has announced plans to invest up to $30B in Motiva by 2023; the initial $12B is invested in refinery capacity expansion and petrochemicals at Port Arthur.
Open to acquisitions as well, Saudi Aramco President and Chief Executive Amin Al Nasser confirmed “we are investing in long-term job creation and the future of the refining industry in the United States, and we are delivering on Vision 2030 to expand the US-Saudi partnership.”
Already the second largest source of US crude imports behind Canada, Saudi Aramco holds a strategic market advantage in its optionality to source its own crude or decide to buy advantaged feedstock from US or Canada.
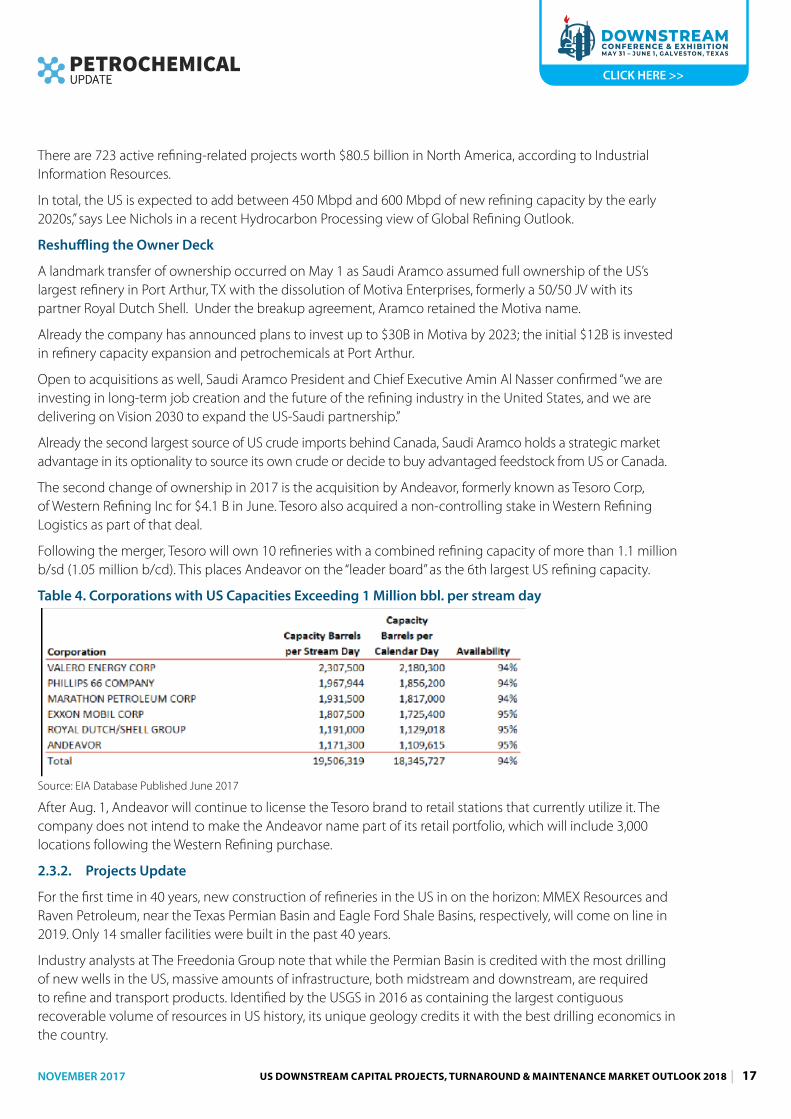
The second change of ownership in 2017 is the acquisition by Andeavor, formerly known as Tesoro Corp, of Western Refining Inc for $4.1 B in June. Tesoro also acquired a non-controlling stake in Western Refining Logistics as part of that deal.
Following the merger, Tesoro will own 10 refineries with a combined refining capacity of more than 1.1 million b/sd (1.05 million b/cd). This places Andeavor on the “leader board” as the 6th largest US refining capacity.
Table 4. Corporations with US Capacities Exceeding 1 Million bbl. per stream day
Source: EIA Database Published June 2017
After Aug. 1, Andeavor will continue to license the Tesoro brand to retail stations that currently utilize it. The company does not intend to make the Andeavor name part of its retail portfolio, which will include 3,000 locations following the Western Refining purchase.
2.3.2. Projects Update
For the first time in 40 years, new construction of refineries in the US in on the horizon: MMEX Resources and Raven Petroleum, near the Texas Permian Basin and Eagle Ford Shale Basins, respectively, will come on line in 2019. Only 14 smaller facilities were built in the past 40 years.
Industry analysts at The Freedonia Group note that while the Permian Basin is credited with the most drilling of new wells in the US, massive amounts of infrastructure, both midstream and downstream, are required to refine and transport products. Identified by the USGS in 2016 as containing the largest contiguous recoverable volume of resources in US history, its unique geology credits it with the best drilling economics in the country.
NOVEMBER 2017 US DOWNSTREAM CAPITAL PROJECTS, TURNAROUND & MAINTENANCE MARKET OUTLOOK 2018 | 18
CLICK HERE >>
The MMEX Pecos Country refinery with a 50,000-bpd capacity and investment of $450 million is slated to begin construction in early 2018 following the permitting process. Located near the Sulfur Junction spur of the Texas Pacifico Railroad, the 250-acre facility targeted on come on line in 2019 will utilize its connection to existing railways to export diesel, gasoline and jet fuels; liquefied petroleum gas; and crude oil to western Mexico and South America.
The Raven Petroleum South Texas Energy Complex just outside of Laredo in Duval County will refine 50,000 bbl/d of Eagle Ford shale light crude oil and produce diesel fuel, jet fuel, naphtha, gasoline, and LGP gas products for export. It is located strategically to rail, pipelines, and highway access. Its investment target is $500 million.
Meridian Energy Group expects to start selling gasoline and diesel in the first half of 2018 from its new-build 55,000 b/d Davis refinery in North Dakota, said CEO Bill Prentice in a press release in May. Phase 1 comprised of a 27,500 b/d hydro skimmer, a diesel hydrotreater, a naphtha hydrotreater and a salt water treatment plant is expected to come online in IH2018 pending final state environmental approvals. Changes to Phase 2 configuration include deletion of the fluid catalytic cracking unit and addition of a catalytic reforming unit. Prentice said the refinery will produce about one-third gasoline, one-third diesel with a bit of jet fuel, and one-third low sulfur fuel oil, which can be shipped by rail to the Great Lakes, where it can be blended in marine fuel.
Recent and proposed investments at Exxon Mobil refineries are as follows:
� Beaumont, TX: (1) increased capacity by 20,000 bpd and added flexibility to process light crudes; (2) increased production of ultra-low sulfur fuels by approximately 40,000 bpd utilizing a proprietary catalyst system to produce gasoline that will meet EPA’s Tier 3 specifications; (3) potential expansion of light crude refining capacity. If the project proceeds, construction would begin in 2019, followed by unit start-up in 2022.
� Baytown, TX - 50,000 tons/ year synthetic lubricant base stocks manufacturing facility using a proprietary metallocene catalyst
� Baton Rouge, LA: (1) recently completed, state-of-the-art aviation lubricants blending, packaging and distribution facility; (2) Sulfur Expansion Project, which increases raw material flexibility and capacity and decreases site sulfur emissions.
2.4. Liquefied Natural Gas Market2.4.1. Market Overview and Near-term Outlook
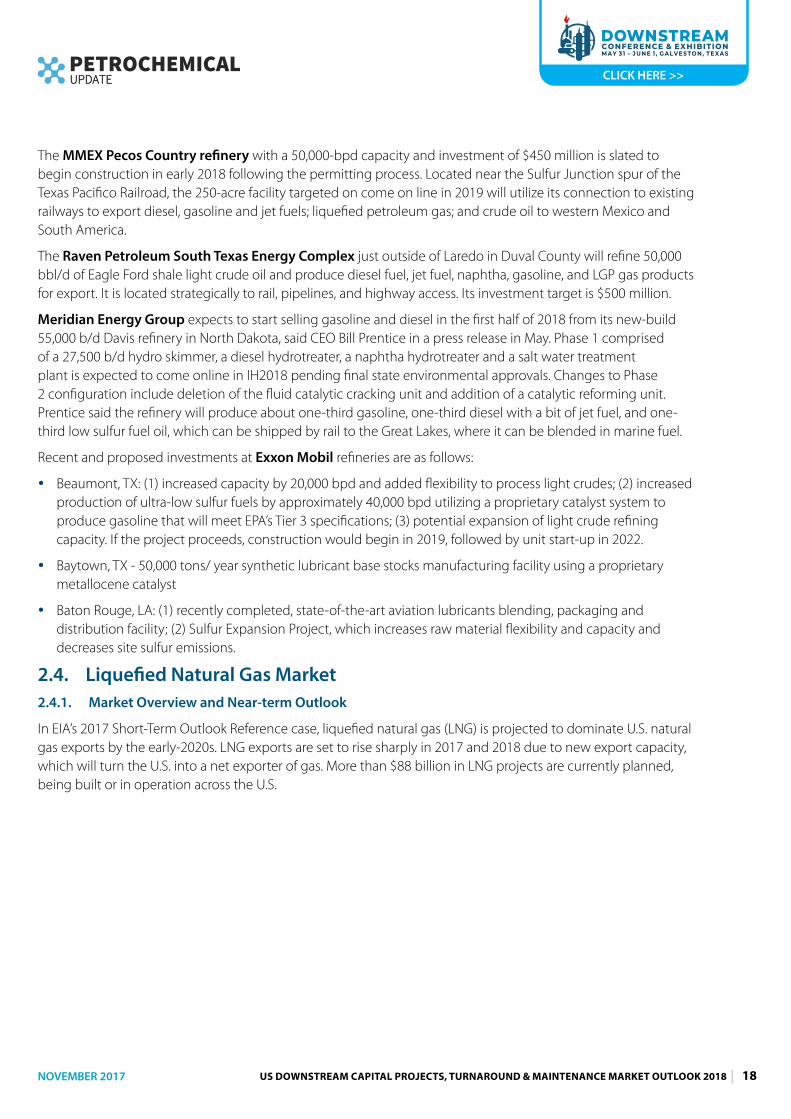
In EIA’s 2017 Short-Term Outlook Reference case, liquefied natural gas (LNG) is projected to dominate U.S. natural gas exports by the early-2020s. LNG exports are set to rise sharply in 2017 and 2018 due to new export capacity, which will turn the U.S. into a net exporter of gas. More than $88 billion in LNG projects are currently planned, being built or in operation across the U.S.
NOVEMBER 2017 US DOWNSTREAM CAPITAL PROJECTS, TURNAROUND & MAINTENANCE MARKET OUTLOOK 2018 | 19
CLICK HERE >>
Figure 4. EIA’s 2017 Short-Term Energy Outlook
The US stands to become the world’s third-largest exporter by 2020, when it’s expected to ship about 8.3bn cubic feet a day of capacity, or 14% of the world’s share, according to Energy Aspects Ltd. After 2020, U.S. exports of LNG grow at a more modest rate as U.S.-sourced LNG becomes less competitive in global energy markets.
Ted Michael, an LNG analyst with Genscape, tagged “a new world order” for natural gas with the US as the swing provider, allowing emerging countries to take advantage of low prices. Mexico, followed by Chile, are the largest importer of shipped-in LNG from the US. New unexpected customers in the Middle East already taking advantage of the change by using tankers docked at their shores that are basically floating factories, able to convert chilled fuel shipped into the country back into gas, so it can be distributed on their pipelines. Outfitting ships with regasification plants are a third of the cost of building an onshore facility, and can be installed in a quarter of the time.
U.S. Department of Energy (DOE) has authorized 19.2 Bcf/D from planned and operational facilities in Texas, Louisiana, Florida, Georgia, and Maryland LNG exports to non-FTA countries. “These projects, if built, would position the U.S. to be the dominant LNG exporter in the world,” DOE said in a statement.
The ‘Petroleum Economist – LNG Insights Sept 2017 Issue’ cites that the global LNG market is expected to shift into surplus in the coming 12 months and remain oversupplied until 2022-2024.
BMI Research in its September 2017 report ‘LNG: Global Industry Trends,’ cites that supply will peak in 2018 and that global demand from Asia and MENA will not keep pace with supply driving down spot LNG prices over 2018 and 2019.
Gas Strategies 2017 cautions that the LNG market glut prior to 2025 may disappear before it starts, depending on the stability of the Australian project startups in 2017-18 and the appetite of the behemoth of China and India to absorb unexpectant large volumes of LNG.
NOVEMBER 2017 US DOWNSTREAM CAPITAL PROJECTS, TURNAROUND & MAINTENANCE MARKET OUTLOOK 2018 | 20
CLICK HERE >>
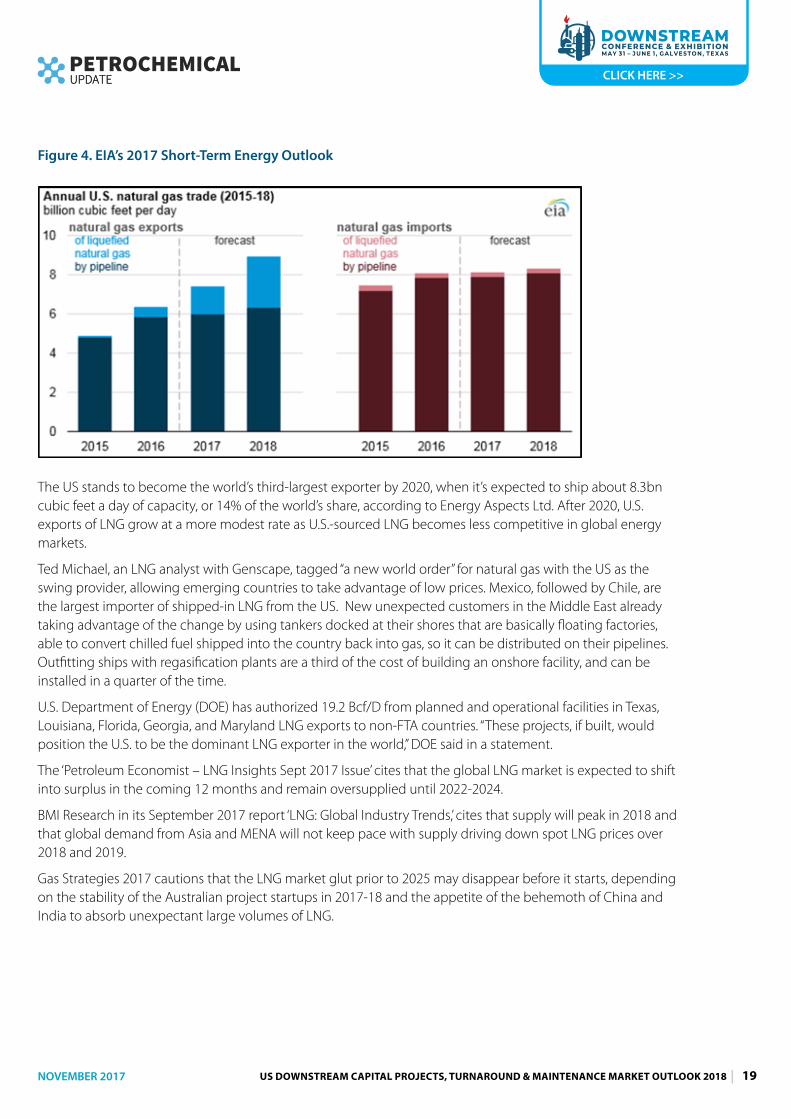
Figure 5. New LNG Production 2017-2018
Source: ICIS Market Outlook
LNG trade is changing to mirror the evolving needs of new buyers who face uncertainties in their own gas markets related to, for example, the global economy, domestic gas exploration, and the liberalization of electricity and gas markets.
Companies that sell LNG will increasingly need a large enough portfolio and sufficient flexibility to supply a growing number of countries, including more developing economies.
From a global perspective, “The industry is moving in the direction of a more flexible and transparent market,” says Hiroshi Hashimoto, senior analyst of the gas group at the Institute of Energy Economics, Japan.
While the first wave of large-scale LNG projects was underpinned by 20-year sales-purchase agreements, a McKinsey & Company survey of LNG buyers and experts now suggests more than half expect their next LNG term contract to last for just 5-9 years.
McKinsey & Company concurs with changing buyer behavior and notes that LNG is increasing seen as an attractive transport fuel and alternative to high cost domestic production. It forecasts the LNG market will be oversupplied in 2022-2025, but additional investments are required longer term to meet global demand. Project financing of new liquefaction plants is more challenging in a liquid spot price market.
“Now the door is open and customer expectations are for more attractive, flexible contract structures, it’s hard to see the industry go back to the long-term offtake model with limited buyer-resale options,” says Bernadette Cullinane, a partner in Deloitte Consulting’s energy division.
2.4.2. Projects Update
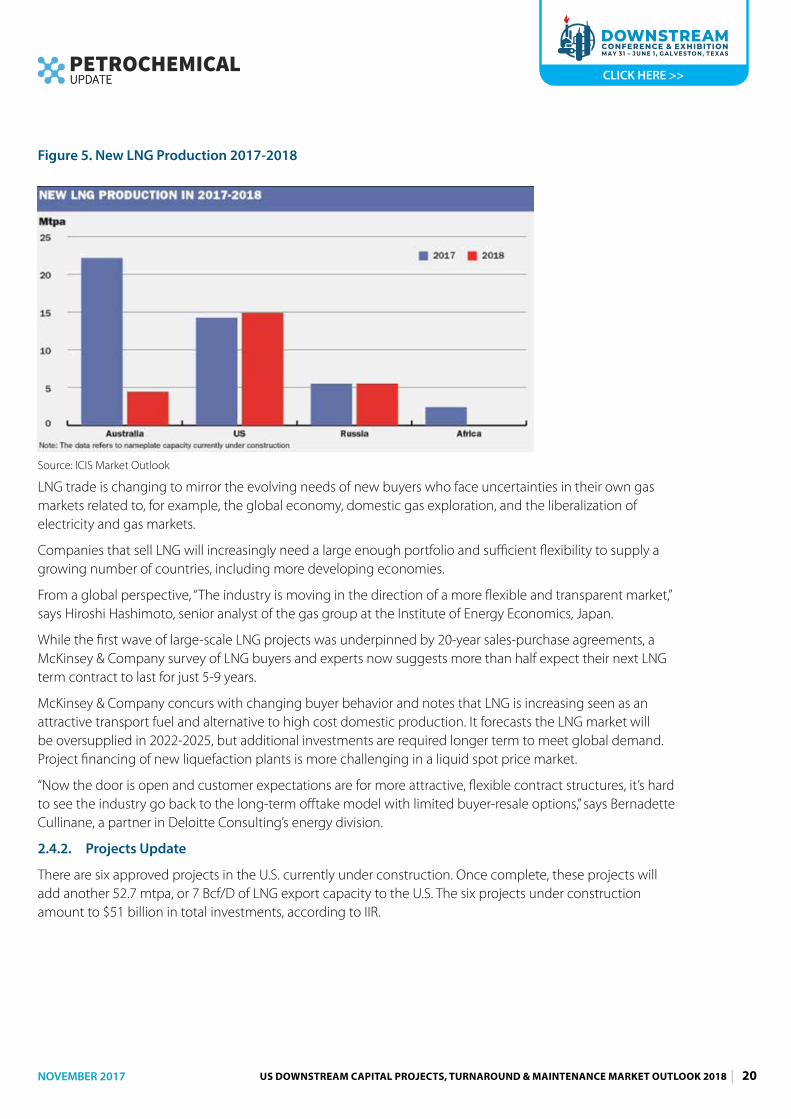
There are six approved projects in the U.S. currently under construction. Once complete, these projects will add another 52.7 mtpa, or 7 Bcf/D of LNG export capacity to the U.S. The six projects under construction amount to $51 billion in total investments, according to IIR.
NOVEMBER 2017 US DOWNSTREAM CAPITAL PROJECTS, TURNAROUND & MAINTENANCE MARKET OUTLOOK 2018 | 21
CLICK HERE >>
Table 5. Approved LNG Projects Under Construction
Source: Industrial Info Resources
The first LNG export facility in the Lower 48, Cheniere’s 3.5 Bcf/d Sabine Pass, began operations in 2016 and is starting its third train this year. Cheniere Energy is expected to complete Train 4 by the end of 2017 and Train 5 by the end of 2019. Alone is expected to own 7% of the world’s export capacity in 2020, according to Energy Aspects.
Sempra Energy’s 2.1 Bcf/d Cameron LNG and its EPC partners (CB&I and Chiyoda) began construction on the first three of five trains in Louisiana. Commercial operations are expected for Trains 1, 2 and 3 in early, mid and end of 2018, respectively, and the first full year of commercial operations will be 2019. The total cost of the Cameron LNG project is estimated at $10 billion, the company said.
All three Freeport LNG trains are now under construction by a joint venture among CB&I, Zachry Industrial, and Chiyoda International Corporation. The first two trains are on schedule to start up operations by September 2018 and February 2019, respectively. The third train is expected to be in operation by August 2019. With $5-7B benefits to the US economy each year, the project is estimated to create more than 3500 on site jobs. 13.9MYA facility is expected to surpass $14B.
Cheniere Corpus Christi Trains 1 and 2 began construction in 2015. The liquefaction project is expected to be in service in 2018. The project is being designed for five trains with a total capacity of 22.5 MTA. Start of construction of Train 3 in 2017 is unconfirmed.
Dominion Energy is nearing completion of its Cove Point LNG terminal on the Chesapeake Bay in Maryland. The project is 92% complete and on track for 4Q2017 startup.
Elba Island LNG project construction began on November 1, 2016. Investment is targeted at $2 billion. Initial start-up is expected mid 2018 with final units coming on by the end of 2019.
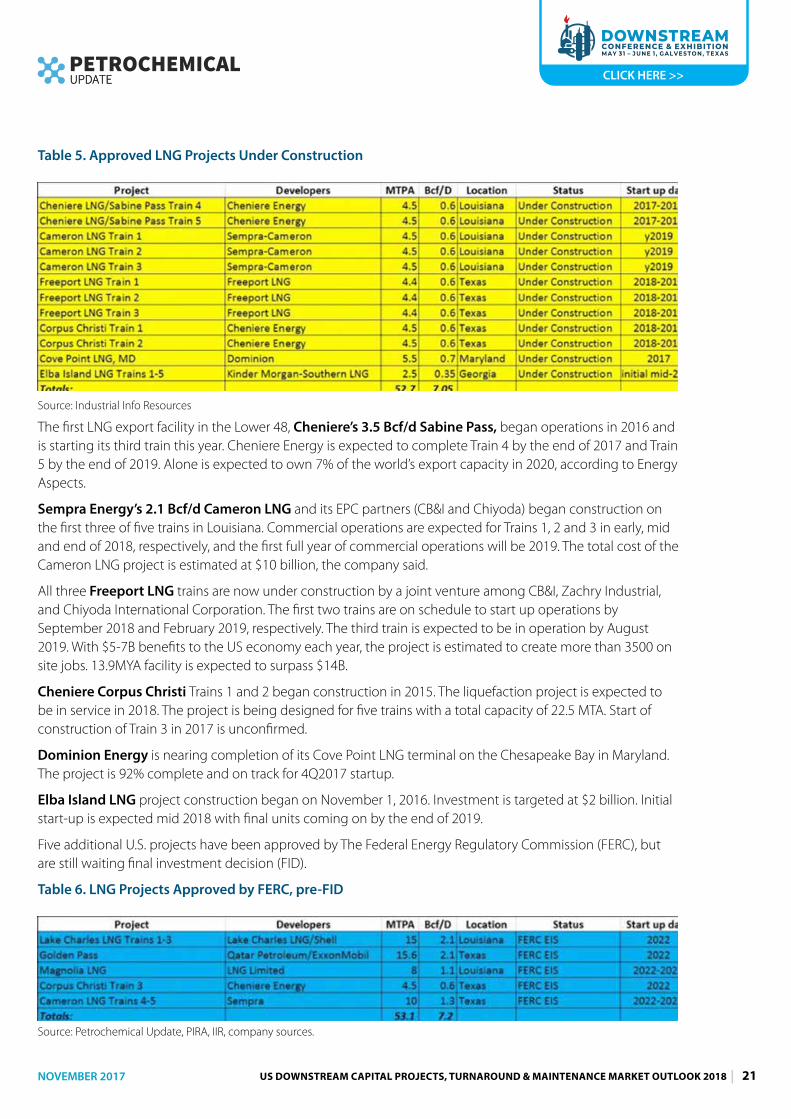
Five additional U.S. projects have been approved by The Federal Energy Regulatory Commission (FERC), but are still waiting final investment decision (FID).
Table 6. LNG Projects Approved by FERC, pre-FID
Source: Petrochemical Update, PIRA, IIR, company sources.
NOVEMBER 2017 US DOWNSTREAM CAPITAL PROJECTS, TURNAROUND & MAINTENANCE MARKET OUTLOOK 2018 | 22
CLICK HERE >>
Shell Lake Charles LNG did not receive final investment as expected in August 2016, although the project has gotten approval from both FERC and DOE. Spokesman Ray Fisher told the American Press that the move was part of a larger decision by Shell to reassess its capital projects. Shell recently increased the terminal’s export capacity after updating its design. A review of the project is underway by Shell and other industry specialists.
Golden Pass LNG at a capacity of $15.6MTA is a $10B investment with total economic gains reaching a staggering $31B across the US. FERC approval was received in December 2016. Over 9000 jobs will be created during construction and 3800 permanent jobs across the US, including the site, pipelines and natural gas exploration and production. A joint venture between Qatar Petroleum (70 percent) and ExxonMobil (30 percent), the facility is targeted to come online in 2021.
Magnolia LNG is the only project among its peers that’s “shovel ready,” as COO John Baguley told American Press. The only thing standing in its way is financing. It has all its permitting from DOE and FERC, as well as a lease on the Calcasieu Ship Channel. It’s the only company with a full EPC contract in place, although Venture Global has an EPC for its storage tanks.
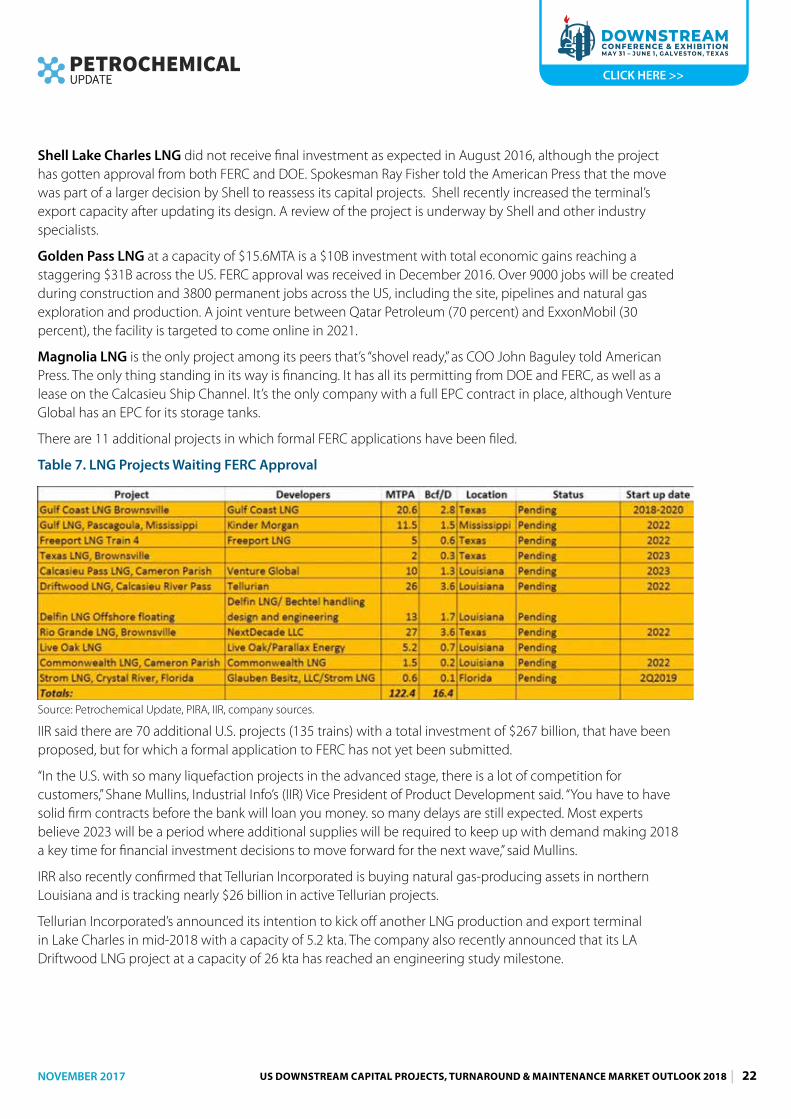
There are 11 additional projects in which formal FERC applications have been filed.
Table 7. LNG Projects Waiting FERC Approval
Source: Petrochemical Update, PIRA, IIR, company sources.
IIR said there are 70 additional U.S. projects (135 trains) with a total investment of $267 billion, that have been proposed, but for which a formal application to FERC has not yet been submitted.
“In the U.S. with so many liquefaction projects in the advanced stage, there is a lot of competition for customers,” Shane Mullins, Industrial Info’s (IIR) Vice President of Product Development said. “You have to have solid firm contracts before the bank will loan you money. so many delays are still expected. Most experts believe 2023 will be a period where additional supplies will be required to keep up with demand making 2018 a key time for financial investment decisions to move forward for the next wave,” said Mullins.
IRR also recently confirmed that Tellurian Incorporated is buying natural gas-producing assets in northern Louisiana and is tracking nearly $26 billion in active Tellurian projects.
Tellurian Incorporated’s announced its intention to kick off another LNG production and export terminal in Lake Charles in mid-2018 with a capacity of 5.2 kta. The company also recently announced that its LA Driftwood LNG project at a capacity of 26 kta has reached an engineering study milestone.
NOVEMBER 2017 US DOWNSTREAM CAPITAL PROJECTS, TURNAROUND & MAINTENANCE MARKET OUTLOOK 2018 | 23
CLICK HERE >>
2.5. Craft Labor Availability and Work Force DevelopmentFinding skilled craft workers to build America’s new petrochemical projects will be a challenge in 2018 with craft hours peaking at nearly 164 million hours in 2018, as existing mega-projects near completion. This increasing demand for labor paired with reduced labor availability will force companies to rethink their strategies for attracting, keeping and maximizing the contributions of skilled workers.
Owners are looking at options to train the new workers. Cheniere is funding welding programs in Louisiana for both high school, technical colleges and returning serviceman.
The construction industry is undergoing a rapid digital transformation through disruptive technologies require new skill sets. Culture is a talent magnet, and construction companies need to shift and adopt a culture that challenges the status quo and embraces innovation wholeheartedly. The industry has trouble attracting younger workers in part because leaders aren’t working closely enough with the universities, schools and community colleges that can transition workers into construction. Younger workers also live technology-infused lives, and expect modern worksites to embrace technology as well, says Olfa Handi, CEO of Concord Technology.
One major challenge for EPC firms is attracting millennials into the construction sector. The use of the latest data modelling and field mobility is attracting younger workers. EPC companies are recognizing the need to collaborate with colleges to educate and train craftsmen.
Fluor is focusing on building the pipeline of skilled craft professionals by offering training to encourage individuals to choose craft careers, said Mark Fields, President of Energy and Chemicals Americas at Fluor. “Through our pre-employment training, after-hours training at jobsites and supervisory training, we provide comprehensive training at every stage of a worker’s career at no cost,” he added. Fluor opened the U.S. Gulf Coast Craft Training Center in Texas, which offers pre-employment, tuition-free, industry-recognized training in the welding, pipefitting, instrumentation, millwright and electrical disciplines. “Students are under no obligation to work for Fluor after graduation, and we have had more than 300 students graduate from the program since it opened last year,” Fields said.
Fluor has initiated holistic training to focus not just on the craft, but also on leadership skills to help craft laborers plan and prepare for advancement. “We are conducting leadership training courses at sites to improve our foremen and general foremen’s skills in effective communication, work planning and safety leadership,” Fields said. “We also offer after-hours craft training, at no cost, at our jobsites, to encourage our employees to enhance their skills and career growth.”
While training initiatives are in full force, owners and contractors still must deal with the present shortage of craft labor and productivity challenges.
2.6. US Gulf Coast Productivity DataThe term “U.S. Gulf Coast Productivity” (USGC Productivity) is specific to estimating and budgeting of construction work in capital projects. It is used when determining if effective labor production goals are being realized at construction site(s). Labor construction productivity values are used in resource planning, project control activity, and benchmarking with similar construction projects.
USGC Productivity is an industry term related to the efficiency and output of construction field labor performance or production. A productivity measure is typically expressed as the ratio of output to inputs in a production process, i.e., output per unit of labor. Labor productivity is defined here as the number of man-hours to complete a unit of work in a specific time duration.
USGC construction workhour norms that are widely used in “process/ refinery/manufacturing” construction sectors are based on thousands of completed facilities over the past 25 years. Numerous final labor man-hour completion reports related to these projects have been compiled over years to form the historical basis of
NOVEMBER 2017 US DOWNSTREAM CAPITAL PROJECTS, TURNAROUND & MAINTENANCE MARKET OUTLOOK 2018 | 24
CLICK HERE >>
USGC Productivity. These work-hour averages or norms are used by Owner and Engineering. Procurement and Construction (EPC) companies executing work in the states of Texas, Louisiana, Alabama and Mississippi, i.e., the USGC.
2.6.1. Recent Impact of Hurricane Activity on GC Labor Productivity
The impact of Hurricane Harvey is explored in section 2.1 herein. While many petrochemical facilities and refineries located in the USGC were shut down for at least 1-2 weeks and some experienced minor damage, the longer-term impact is from additional demand on the already challenging labor shortage, as flooded commercial and residential properties compete for craft labor to repair and rebuild. This may be further compounded by similar storm recovery efforts in Florida and Puerto Rica.
Industrial investment in the U.S. Gulf Coast is expected to hit $51.9 billion in 2018 and will require an all kinds of labor including pipefitters, ironworkers, and other craftsman, according to Industrial Information Resources (IIR). The USGC needed some 37,000 travellers to meet labor demand, and now hurricanes have exacerbated the situation.
“Labor will remain tight and wages should increase,” Salemme said. “Shortages in mechanical and electrical crafts will be the worst. Operators will be in extreme shortages and soft crafts such as painters will now experience shortages where there were none prior.”
Harris County, which includes the Houston Ship Channel, Baytown, Texas City, Galveston, and Freeport, have shortages of local journeymen in 10 of the 12 studied crafts, according to Salemme.
Houston construction labor competes with Corpus Christi, Texas, and Lake Charles, Louisiana, which are paying higher wages and per diems to attract labor to the large mega projects that have been underway for several years now. A tight labor market has allowed for extra compensated journeymen in several crafts, including scaffold builders, pipefitters/plumbers, boilermakers, operators, and welders. Millwrights, electrical and instrumentation persons are expected to be in high demand for plant re-commissioning, Salemme said.
“We are hearing that some owners and contractors are paying $85 per day per diem without travel restrictions,” Salemme said. “This is not necessarily a new practice, as owners and contractors have paid per diems, completion bonuses and other compensation in lieu of raising wages as a means of attracting labor these past few years.”
“It will be important to assess how the delays at construction sites already in progress, which are already at high/historical levels of current man-hours, will affect the labor market,” Salemme said. More large projects are expected to start construction before year end.
John G. McConville CCP, Operations Director at Compass International, predicts hourly base wage rates in table 10 below to increase significantly by 3.5% to 6.5% this quarter and into 1Q 2018. Some current CAPEX projects that are underway will be delayed by perhaps 2-3 months; others 12 months or more; driving CAPEX costs upwards by at least 2.5% to 5% due to the increased costs of field labor, bulk materials and extended field in-directs, says McConville.
McConville predicts the biggest challenge will be with skilled pipefitters, welders, electricians and instrumentation installers. Insulators, carpenters, roofers, masons and painters will also be in demand for the next 6 to 12 months to meet the demands of the repair effort. Base hourly rates will increase in the next two quarters, cites McConville.
The cost of bulk materials such as ready mixed concrete, plywood, lumber, rebar and imported stone is also expected to rise in the next three to six months by at 5% to 10%.
NOVEMBER 2017 US DOWNSTREAM CAPITAL PROJECTS, TURNAROUND & MAINTENANCE MARKET OUTLOOK 2018 | 25
CLICK HERE >>
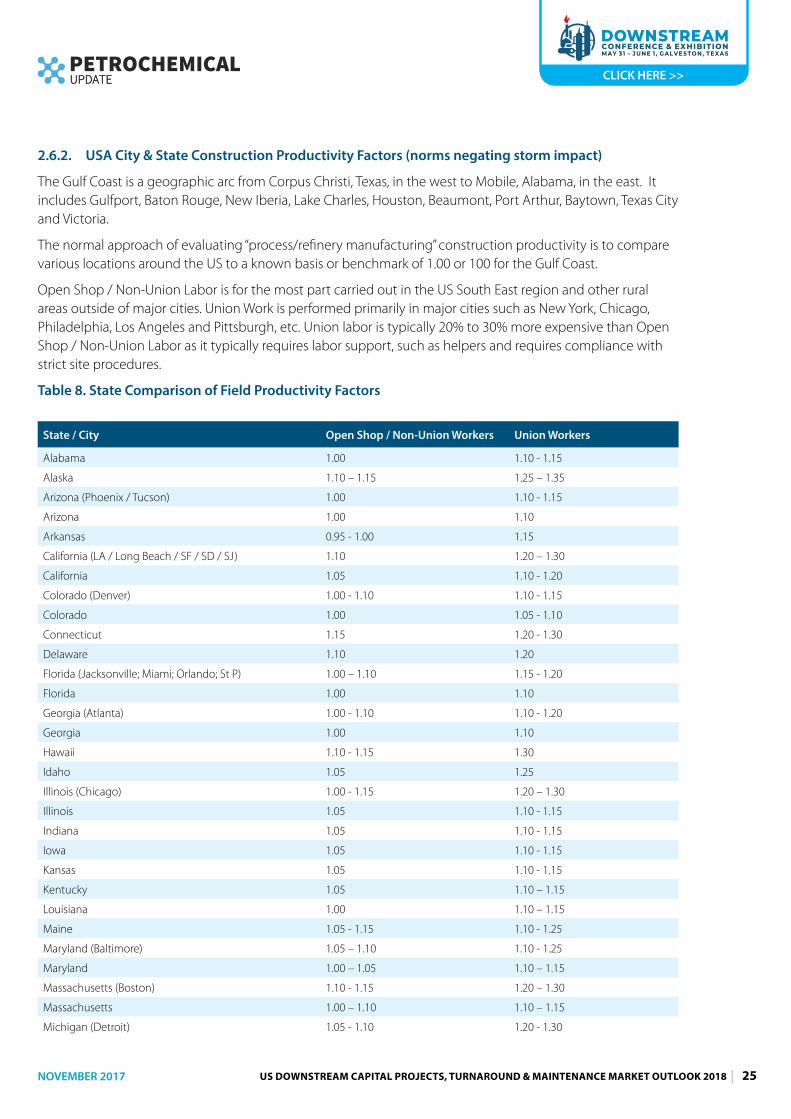
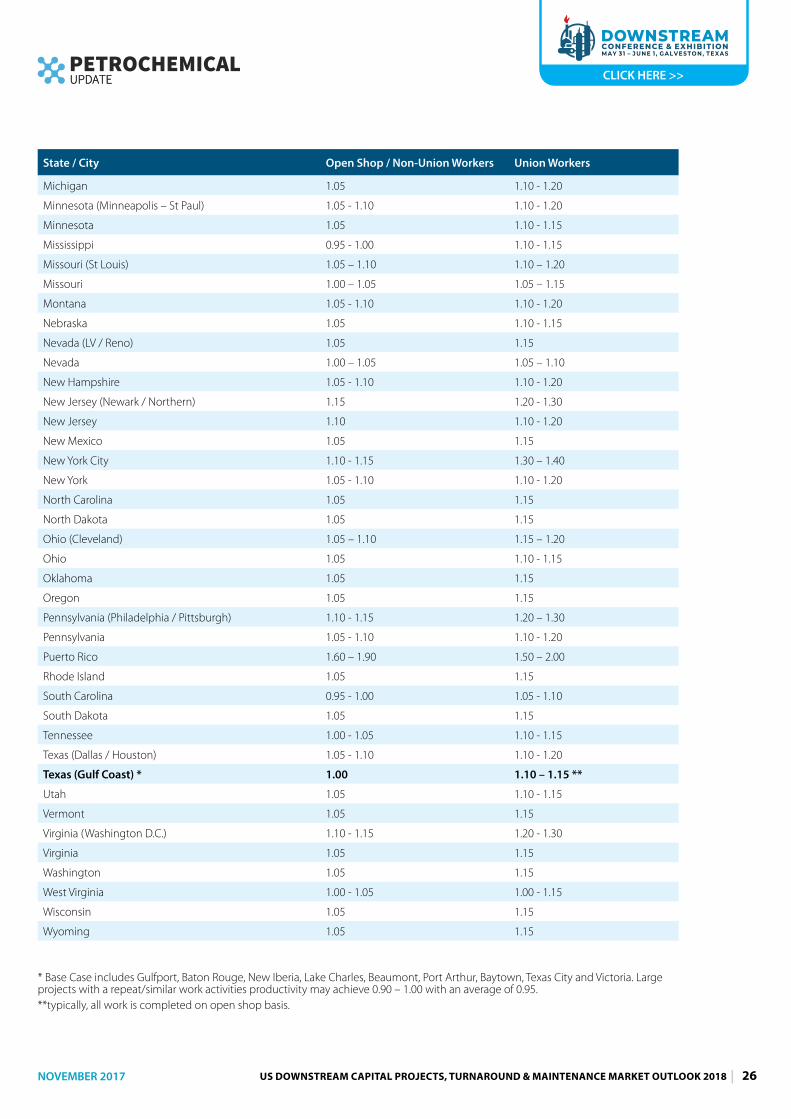
2.6.2. USA City & State Construction Productivity Factors (norms negating storm impact)
The Gulf Coast is a geographic arc from Corpus Christi, Texas, in the west to Mobile, Alabama, in the east. It includes Gulfport, Baton Rouge, New Iberia, Lake Charles, Houston, Beaumont, Port Arthur, Baytown, Texas City and Victoria.
The normal approach of evaluating “process/refinery manufacturing” construction productivity is to compare various locations around the US to a known basis or benchmark of 1.00 or 100 for the Gulf Coast.
Open Shop / Non-Union Labor is for the most part carried out in the US South East region and other rural areas outside of major cities. Union Work is performed primarily in major cities such as New York, Chicago, Philadelphia, Los Angeles and Pittsburgh, etc. Union labor is typically 20% to 30% more expensive than Open Shop / Non-Union Labor as it typically requires labor support, such as helpers and requires compliance with strict site procedures.
Table 8. State Comparison of Field Productivity Factors
State / City Open Shop / Non-Union Workers Union Workers
Alabama 1.00 1.10 - 1.15
Alaska 1.10 – 1.15 1.25 – 1.35
Arizona (Phoenix / Tucson) 1.00 1.10 - 1.15
Arizona 1.00 1.10
Arkansas 0.95 - 1.00 1.15
California (LA / Long Beach / SF / SD / SJ) 1.10 1.20 – 1.30
California 1.05 1.10 - 1.20
Colorado (Denver) 1.00 - 1.10 1.10 - 1.15
Colorado 1.00 1.05 - 1.10
Connecticut 1.15 1.20 - 1.30
Delaware 1.10 1.20
Florida (Jacksonville; Miami; Orlando; St P) 1.00 – 1.10 1.15 - 1.20
Florida 1.00 1.10
Georgia (Atlanta) 1.00 - 1.10 1.10 - 1.20
Georgia 1.00 1.10
Hawaii 1.10 - 1.15 1.30
Idaho 1.05 1.25
Illinois (Chicago) 1.00 - 1.15 1.20 – 1.30
Illinois 1.05 1.10 - 1.15
Indiana 1.05 1.10 - 1.15
Iowa 1.05 1.10 - 1.15
Kansas 1.05 1.10 - 1.15
Kentucky 1.05 1.10 – 1.15
Louisiana 1.00 1.10 – 1.15
Maine 1.05 - 1.15 1.10 - 1.25
Maryland (Baltimore) 1.05 – 1.10 1.10 - 1.25
Maryland 1.00 – 1.05 1.10 – 1.15
Massachusetts (Boston) 1.10 - 1.15 1.20 – 1.30
Massachusetts 1.00 – 1.10 1.10 – 1.15
Michigan (Detroit) 1.05 - 1.10 1.20 - 1.30
NOVEMBER 2017 US DOWNSTREAM CAPITAL PROJECTS, TURNAROUND & MAINTENANCE MARKET OUTLOOK 2018 | 26
CLICK HERE >>
State / City Open Shop / Non-Union Workers Union Workers
Michigan 1.05 1.10 - 1.20
Minnesota (Minneapolis – St Paul) 1.05 - 1.10 1.10 - 1.20
Minnesota 1.05 1.10 - 1.15
Mississippi 0.95 - 1.00 1.10 - 1.15
Missouri (St Louis) 1.05 – 1.10 1.10 – 1.20
Missouri 1.00 – 1.05 1.05 – 1.15
Montana 1.05 - 1.10 1.10 - 1.20
Nebraska 1.05 1.10 - 1.15
Nevada (LV / Reno) 1.05 1.15
Nevada 1.00 – 1.05 1.05 – 1.10
New Hampshire 1.05 - 1.10 1.10 - 1.20
New Jersey (Newark / Northern) 1.15 1.20 - 1.30
New Jersey 1.10 1.10 - 1.20
New Mexico 1.05 1.15
New York City 1.10 - 1.15 1.30 – 1.40
New York 1.05 - 1.10 1.10 - 1.20
North Carolina 1.05 1.15
North Dakota 1.05 1.15
Ohio (Cleveland) 1.05 – 1.10 1.15 – 1.20
Ohio 1.05 1.10 - 1.15
Oklahoma 1.05 1.15
Oregon 1.05 1.15
Pennsylvania (Philadelphia / Pittsburgh) 1.10 - 1.15 1.20 – 1.30
Pennsylvania 1.05 - 1.10 1.10 - 1.20
Puerto Rico 1.60 – 1.90 1.50 – 2.00
Rhode Island 1.05 1.15
South Carolina 0.95 - 1.00 1.05 - 1.10
South Dakota 1.05 1.15
Tennessee 1.00 - 1.05 1.10 - 1.15
Texas (Dallas / Houston) 1.05 - 1.10 1.10 - 1.20
Texas (Gulf Coast) * 1.00 1.10 – 1.15 **
Utah 1.05 1.10 - 1.15
Vermont 1.05 1.15
Virginia (Washington D.C.) 1.10 - 1.15 1.20 - 1.30
Virginia 1.05 1.15
Washington 1.05 1.15
West Virginia 1.00 - 1.05 1.00 - 1.15
Wisconsin 1.05 1.15
Wyoming 1.05 1.15
* Base Case includes Gulfport, Baton Rouge, New Iberia, Lake Charles, Beaumont, Port Arthur, Baytown, Texas City and Victoria. Large projects with a repeat/similar work activities productivity may achieve 0.90 – 1.00 with an average of 0.95.**typically, all work is completed on open shop basis.
NOVEMBER 2017 US DOWNSTREAM CAPITAL PROJECTS, TURNAROUND & MAINTENANCE MARKET OUTLOOK 2018 | 27
CLICK HERE >>
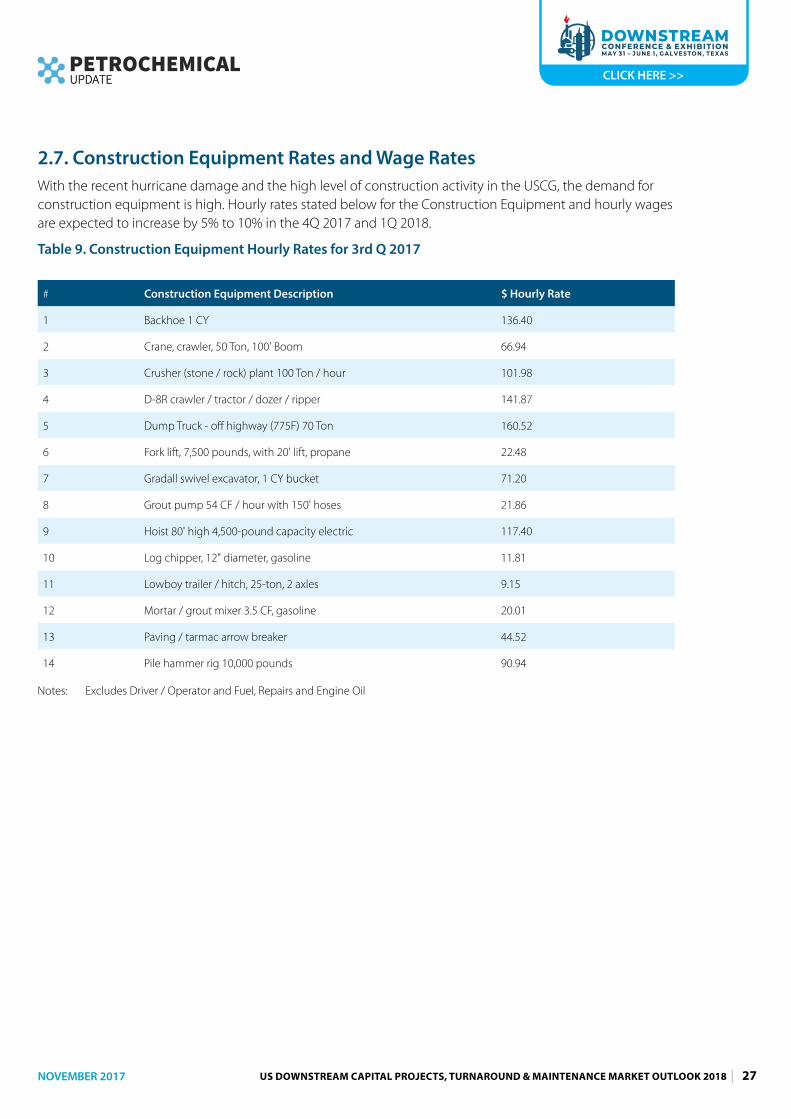
2.7. Construction Equipment Rates and Wage RatesWith the recent hurricane damage and the high level of construction activity in the USCG, the demand for construction equipment is high. Hourly rates stated below for the Construction Equipment and hourly wages are expected to increase by 5% to 10% in the 4Q 2017 and 1Q 2018.
Table 9. Construction Equipment Hourly Rates for 3rd Q 2017
# Construction Equipment Description $ Hourly Rate
1 Backhoe 1 CY 136.40
2 Crane, crawler, 50 Ton, 100' Boom 66.94
3 Crusher (stone / rock) plant 100 Ton / hour 101.98
4 D-8R crawler / tractor / dozer / ripper 141.87
5 Dump Truck - off highway (775F) 70 Ton 160.52
6 Fork lift, 7,500 pounds, with 20' lift, propane 22.48
7 Gradall swivel excavator, 1 CY bucket 71.20
8 Grout pump 54 CF / hour with 150' hoses 21.86
9 Hoist 80' high 4,500-pound capacity electric 117.40
10 Log chipper, 12" diameter, gasoline 11.81
11 Lowboy trailer / hitch, 25-ton, 2 axles 9.15
12 Mortar / grout mixer 3.5 CF, gasoline 20.01
13 Paving / tarmac arrow breaker 44.52
14 Pile hammer rig 10,000 pounds 90.94
Notes: Excludes Driver / Operator and Fuel, Repairs and Engine Oil
NOVEMBER 2017 US DOWNSTREAM CAPITAL PROJECTS, TURNAROUND & MAINTENANCE MARKET OUTLOOK 2018 | 28
CLICK HERE >>
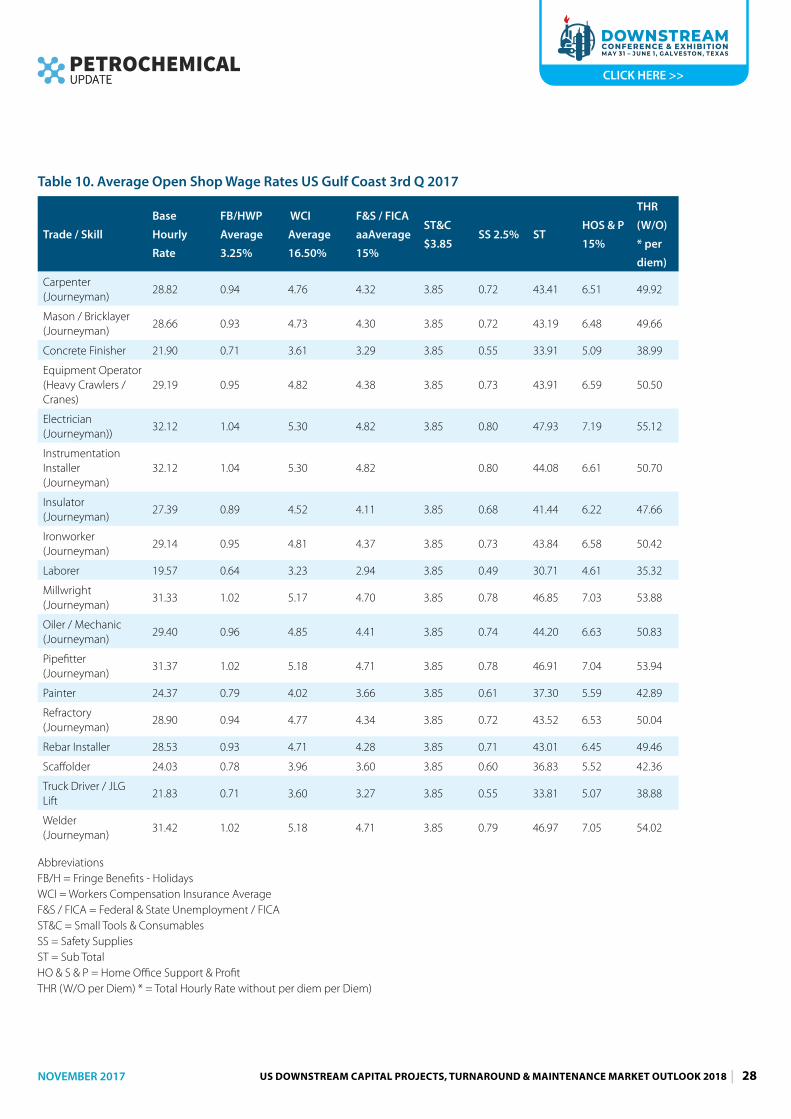
Table 10. Average Open Shop Wage Rates US Gulf Coast 3rd Q 2017
Trade / Skill
Base
Hourly
Rate
FB/HWP
Average
3.25%
WCI
Average
16.50%
F&S / FICA
aaAverage
15%
ST&C
$3.85SS 2.5% ST
HOS & P
15%
THR
(W/O)
* per
diem)
Carpenter (Journeyman)
28.82 0.94 4.76 4.32 3.85 0.72 43.41 6.51 49.92
Mason / Bricklayer (Journeyman)
28.66 0.93 4.73 4.30 3.85 0.72 43.19 6.48 49.66
Concrete Finisher 21.90 0.71 3.61 3.29 3.85 0.55 33.91 5.09 38.99
Equipment Operator (Heavy Crawlers / Cranes)
29.19 0.95 4.82 4.38 3.85 0.73 43.91 6.59 50.50
Electrician (Journeyman))
32.12 1.04 5.30 4.82 3.85 0.80 47.93 7.19 55.12
Instrumentation Installer (Journeyman)
32.12 1.04 5.30 4.82 0.80 44.08 6.61 50.70
Insulator (Journeyman)
27.39 0.89 4.52 4.11 3.85 0.68 41.44 6.22 47.66
Ironworker (Journeyman)
29.14 0.95 4.81 4.37 3.85 0.73 43.84 6.58 50.42
Laborer 19.57 0.64 3.23 2.94 3.85 0.49 30.71 4.61 35.32
Millwright (Journeyman)
31.33 1.02 5.17 4.70 3.85 0.78 46.85 7.03 53.88
Oiler / Mechanic (Journeyman)
29.40 0.96 4.85 4.41 3.85 0.74 44.20 6.63 50.83
Pipefitter (Journeyman)
31.37 1.02 5.18 4.71 3.85 0.78 46.91 7.04 53.94
Painter 24.37 0.79 4.02 3.66 3.85 0.61 37.30 5.59 42.89
Refractory (Journeyman)
28.90 0.94 4.77 4.34 3.85 0.72 43.52 6.53 50.04
Rebar Installer 28.53 0.93 4.71 4.28 3.85 0.71 43.01 6.45 49.46
Scaffolder 24.03 0.78 3.96 3.60 3.85 0.60 36.83 5.52 42.36
Truck Driver / JLG Lift
21.83 0.71 3.60 3.27 3.85 0.55 33.81 5.07 38.88
Welder (Journeyman)
31.42 1.02 5.18 4.71 3.85 0.79 46.97 7.05 54.02
AbbreviationsFB/H = Fringe Benefits - HolidaysWCI = Workers Compensation Insurance Average F&S / FICA = Federal & State Unemployment / FICAST&C = Small Tools & ConsumablesSS = Safety SuppliesST = Sub TotalHO & S & P = Home Office Support & ProfitTHR (W/O per Diem) * = Total Hourly Rate without per diem per Diem)
NOVEMBER 2017 US DOWNSTREAM CAPITAL PROJECTS, TURNAROUND & MAINTENANCE MARKET OUTLOOK 2018 | 29
CLICK HERE >>
2.8. Factors Affecting Field Labor ProductivityMcConville notes many factors decrease labor productivity, including but not limited to:
� weather: extreme temperatures hot or cold; continuous rain or snow conditions; major hurricanes or storms;
� crew size too small or too large;
� inadequate worker skill or lack of experience;
� union vs. non-union tensions on the same site;
� unsuitable, inappropriate, or incorrectly sized construction equipment; lack of trained equipment operators;
� “hot work” in operating facilities requiring work permits for shut downs, demolition, hot taps, welding, etc.;
� inadequate crew supervision;
� limited access to work areas caused by congested work areas, stairs, numerous floor levels and inadequate access roads;
� frequent work stoppages and re-starts as the result of contractual disputes between the contracting parties;
� negative worker attitude caused by unsatisfactory temporary site infrastructure (inadequate temporary toilets, change rooms, lunch tents, drinking water); poor communications and tolerance of poor housekeeping;
� site logistics: inadequate or poor material handling of owner or contractor furnished material or equipment hindering start or continuity of work at the work face;
� extended work week more than 40-50 hours; overtime; shift work and
� limitations on utilizing construction equipment in confined / tight work areas.
Other measures that bolster productivity include, but are not limited to the following:
� offer competitive wage rates, per diems if necessary
� engage the workforce with frequent communications on progress;
� solicit feedback and recommendations from workforce on improvements to daily ways of working;
� address and rectify delays and barriers; and
� provide clean change rooms, lunch areas, toilets, and worker parking areas; adequate water and food lunch trucks on the jobsite.
Modularization moves a percentage of the project work offsite to fabrication yards, and helps ensures that our onsite resource needs match craft availability. Advanced work packaging involves construction early in FEED and ensures adequate materials., labor and construction equipment are at the work face. This will be discussed in greater detail in section 3 herein.
NOVEMBER 2017 US DOWNSTREAM CAPITAL PROJECTS, TURNAROUND & MAINTENANCE MARKET OUTLOOK 2018 | 30
CLICK HERE >>
3. DOWNSTREAM CONSTRUCTION INNOVATION
Over 80% of the cost for construction projects are related to materials and labor management in the field. The average project in our industry last 3 to 5 years and has capital expenditures of $2.4 Billion. A 10% cost reduction for mega projects results in millions of dollars in savings impacting the projects bottom line.
Transformation, enabled through digital solutions, tools and technology to improve journeys is critical to address issues related to current complexity, size and risk of major capital projects that has outgrown the ability of humans to effectively handle the sheer volumes of data required to build, operate and maintain assets.
If there is one predominant theme in the downstream construction industry, it is imperative that Owners and EPC contractors together address the “mission critical “issue of declining field productivity over the past 4 decades.
Per the February edition of McKinsey Quarterly, “Bold, tightly integrated digital strategies will be the biggest differentiator between companies that win and companies that don’t, and the biggest payouts will go to those that initiate digital disruptions.”
Virtually every other industry sector has embraced data-driven, collaborative information management platforms and integrated applications, with media/entertainment, retail, high tech, health care, travel/transport and telecom at the forefront.
Further the industry must address the expectations and harness the appetite for innovation found in the millennial generation that is already emerging as primary resource pool for capital projects and asset performance management. In a recent article Olfa Handi, CEO of Concord Technologies, states “Millennials simply want what everybody wants: A working environment that is intuitive, collaborative and flexible. Young engineers want to learn. They want to be valued, to contribute, and to feel a sense of satisfaction after a job well done. The catch: They want all this from day one. Millennials want workplace technology that allows them to connect and contribute.”
Like a giant slowing awakening from a deep sleep, Owner and EPCs companies are recognizing that legacy, a core element of project delivery supported by document-centric, functional, independent data silos must be reinvented. Companies that embrace digitization and accelerate the speed of adoption, especially in the face of record high years of capital investment and record low years of skilled craft labor availability, are the winners.
McKinsey & Company, in its publication “Reinventing Construction: A Route to Higher Productivity” (February 2017) identified seven areas that simultaneously could boost productivity by 50 to 60 percent. They are reshaping regulation; rewiring the contractual framework to reshape industry dynamics; rethinking design and engineering processes; improving procurement and supply-chain management; improving onsite execution; infusing digital technology, new materials, and advanced automation; and reskilling the workforce.
3.1. Advanced Work Packaging
Increasingly Owners are implementing the process and tools of Advanced Work Packaging (AWP) outlined in the early work of the Construction Owners Association of Alberta (COAA) in 2005 and later endorsed by the Construction Industry Institute (CII) in 2013 in CII Publication 272.
The driver behind AWP is the bold statistic that 37% of craft labor is time on tools; 15% of craft labor is waiting on material.
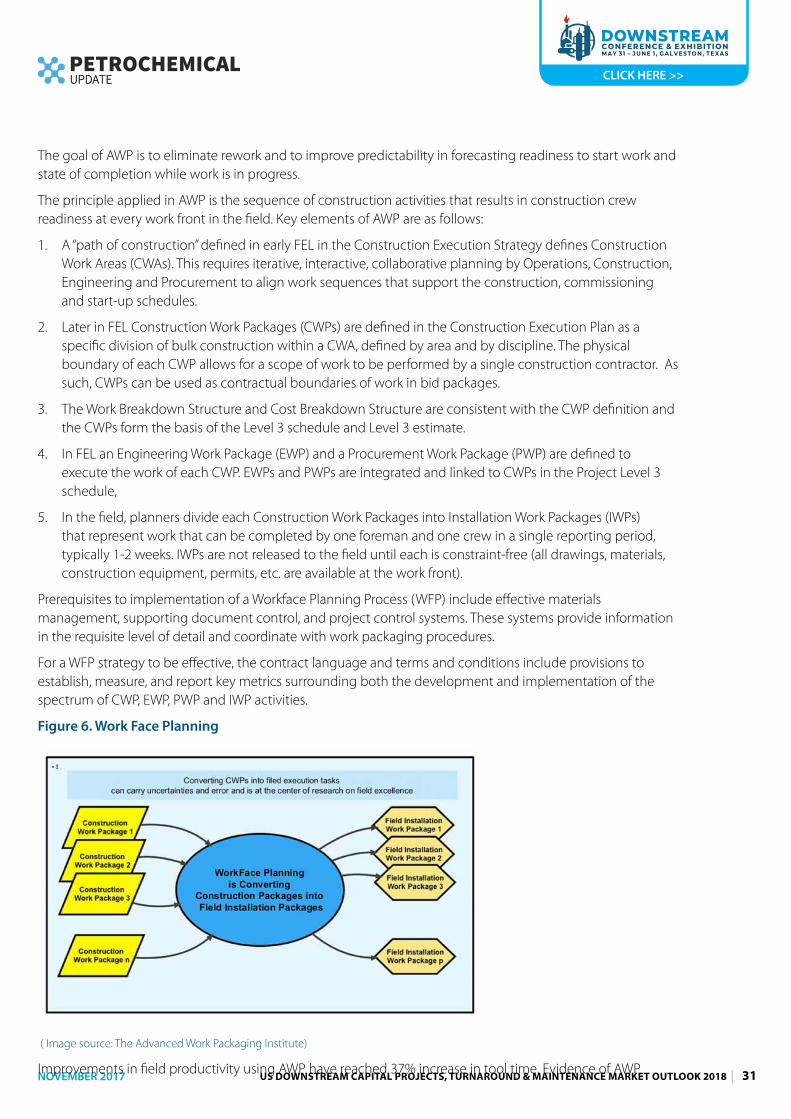
NOVEMBER 2017 US DOWNSTREAM CAPITAL PROJECTS, TURNAROUND & MAINTENANCE MARKET OUTLOOK 2018 | 31
CLICK HERE >>
The goal of AWP is to eliminate rework and to improve predictability in forecasting readiness to start work and state of completion while work is in progress.
The principle applied in AWP is the sequence of construction activities that results in construction crew readiness at every work front in the field. Key elements of AWP are as follows:
1. A “path of construction” defined in early FEL in the Construction Execution Strategy defines Construction Work Areas (CWAs). This requires iterative, interactive, collaborative planning by Operations, Construction, Engineering and Procurement to align work sequences that support the construction, commissioning and start-up schedules.
2. Later in FEL Construction Work Packages (CWPs) are defined in the Construction Execution Plan as a specific division of bulk construction within a CWA, defined by area and by discipline. The physical boundary of each CWP allows for a scope of work to be performed by a single construction contractor. As such, CWPs can be used as contractual boundaries of work in bid packages.
3. The Work Breakdown Structure and Cost Breakdown Structure are consistent with the CWP definition and the CWPs form the basis of the Level 3 schedule and Level 3 estimate.
4. In FEL an Engineering Work Package (EWP) and a Procurement Work Package (PWP) are defined to execute the work of each CWP. EWPs and PWPs are integrated and linked to CWPs in the Project Level 3 schedule,
5. In the field, planners divide each Construction Work Packages into Installation Work Packages (IWPs) that represent work that can be completed by one foreman and one crew in a single reporting period, typically 1-2 weeks. IWPs are not released to the field until each is constraint-free (all drawings, materials, construction equipment, permits, etc. are available at the work front).
Prerequisites to implementation of a Workface Planning Process (WFP) include effective materials management, supporting document control, and project control systems. These systems provide information in the requisite level of detail and coordinate with work packaging procedures.
For a WFP strategy to be effective, the contract language and terms and conditions include provisions to establish, measure, and report key metrics surrounding both the development and implementation of the spectrum of CWP, EWP, PWP and IWP activities.
Figure 6. Work Face Planning
( Image source: The Advanced Work Packaging Institute)
Improvements in field productivity using AWP have reached 37% increase in tool time. Evidence of AWP
NOVEMBER 2017 US DOWNSTREAM CAPITAL PROJECTS, TURNAROUND & MAINTENANCE MARKET OUTLOOK 2018 | 32
CLICK HERE >>
implementation benefits also include over 25% savings in chemical project construction and engineering costs, according to the AWP Institute.
While adoption is penetrating the downstream industry with leaders such as Dow and Exxon Mobil, Owners are recognizing they must lead the change and that AWP starts early in FEED. “In the end, you will be going to turnover conditioning activities, so you need to work that back to your construction packages, and back to your design packages, so it all must flow,” said William Lewis, Senior Manager, and Projects Coordinator at SABIC, in a panel at the PCU DECM Conference. “I have seen a lot of cases where they try to use a form of Advanced Work Packaging, and don’t bring all the factors to the table, and that is just a recipe for failure.”
Traditional contracting, staffing and compensation strategies are not well suited to support a lifecycle integrated delivery of projects using AWP. Additionally, technology infrastructure to manage work packages is needed to avoid the chaos of manual administration.
3.2. 4D/5D Construction Models4D/ 5D model technologies enable the development and visualization of work packages by providing the dimension of time (4D) and cost (5D). The visualization of work progress and cost data enable effective, timely decisions and prioritization of work in the field.
Owners, EPC’s and software vendors are recognizing the need to attribute the 3D model with metadata that can flow seamlessly into the 4D model. Metadata provides information about other data, and helps applications find and share information more efficiently by describing the content and context (“attributes”) of an object.
Deployment of 4D models (3D model + time) provides the flexibility for the users of the 3D CAD model to easily test planning scenarios and progress status of completion. The display can be structured by area, module, unit, pipe, or system. A 4D model has the powerful ability to visualize the planning of the completions /commissioning phase. It saves significant time in generating both IWPs and test packages. Finally, it eliminates scheduling and spatial conflicts in construction sequencing. Operations and maintenance can engage at the work face through 4D models that bring time and scope together.
Deployment of 5D models adds cost as a function. 5D models provide linkage of real time material data to IWPs, placing material control in the hands of the construction and field workface planner teams. It also facilitates 30, 60, and 90 days look ahead planning with the capability to visualize when materials are expected to be delivered to site. Allowing earlier risk identification, the 5D platform allows owners and contractors to analyze the impact of changes on project costs and scheduling and make better decisions.
Indeed, for construction and project delivery, a big part of the digital journey is moving from document-centric to data-center work flows, where a single source of data “truth” exists at all time; where the same information can be access from the corporate, home office engineering, job trailer and the field; where human errors that propagated error, rework and manual entries are eliminated; where real-time data transparency between all parties promotes collaboration and technical accuracy.
3.3. The Digital Imperative for Construction ProductivityThe future is now.
The dynamic space in which the construction industry finds itself is a state where hardware and software are fast becoming a commodity; where every person on the project regardless of company designation has fast, easy access to trusted data in the cloud; and where the elimination of data silos drives collaboration.
Downstream industry drivers include the complexity and size of projects (many more than $5 billion); reduced facility footprint to minimize bulk materials and thus capital spend; modularization to limited craft labor at the
NOVEMBER 2017 US DOWNSTREAM CAPITAL PROJECTS, TURNAROUND & MAINTENANCE MARKET OUTLOOK 2018 | 33
CLICK HERE >>
site; and compression of project execution duration to reach first product, especially from mega-projects that are in the field for years.
When software is a service solution in the cloud, projects are no longer tethered to physical location, as all participants have access to same data in any geography and time zone.
3.3.1. Data Analytics
“Businesses are drowning in data, but starving for insights. Pulling actionable insights from your data is paramount to making the right decisions.” – Forrester’s 2017 Technology Predictions.
Big data is a broad term for data sets so large or complex that traditional data processing applications are inadequate. Challenges include analysis, capture, data curation, search, sharing, storage, transfer, visualization, and information privacy.
Construction-sector companies and vendors are embracing data science - the growing need to analyze and interpret vast amounts of data collected on projects for planning; decision-making; project transparency; risk mitigation; and resource planning.
Leading EPC firm Bechtel has created a data analytics team, hiring data scientists to mine the company’s growing datasets. Data analytics, along with the deployment of the latest handheld devices and 4D and 5D modelling, has improved decision-making in areas such as piping productivity and staff logistics, according to Joe Thompson, Senior Vice President, General Manager – Downstream & Chemicals, Bechtel Oil, Gas & Chemicals. “It’s really paying big dividends for us...we see data analytics to be a big differentiator in the future,” he said.
Having disjointed data repositories with little or no understanding of available data or how it relates to the projects historically, currently and predictively, is a recipe for continued mediocrity. Technology that enables organizations to mine into vast amounts of historical and current project documentation and lessons learned exists today. By having the intelligent search engine capable of understanding a project query, an organization becomes capable of putting its project history to work for its future and increases productivity of team members across the board to perform their jobs more effectively when powered by what was previously “dead data.”
New national and international standards, classifications, and data dictionaries are converging and replacing proprietary approaches—facilitating the development of what we regard as a new “construction operating system.” (Paul Wilkinson, Procure)
3.3.2. Convergence of the Physical to the Digital Ecosystem
According to the World Economic Forum, by 2020 there will be 50 billion networked devices worldwide. That means that hyper connectivity is exponentially increasing the digital interconnection of people and things, anytime, anywhere.
Digital information exchange is set to accelerate as design, construction, and asset data is increasingly standardized and integrated. For capital projects, digital transformation includes data powered analytics, cloud computing, automation, asset visualization, Internet of Things, social media and more.
Cloud- based solutions reduce client investment in IT hardware and support. The cloud is a network of distributed servers hosted on the Internet; managed in a highly automated way; and is shared by many applications at the same time with speed, realizability and security.
For too long the downstream industry has lacked an integrated platform that spans project planning, design, construction, operations and maintenance. In addition, Owners and EPCs often use different platforms that do not sync with one another.
In a recent survey by Dodge Data Analysts the highest risk for both Owners and EPCs was deemed to be poor
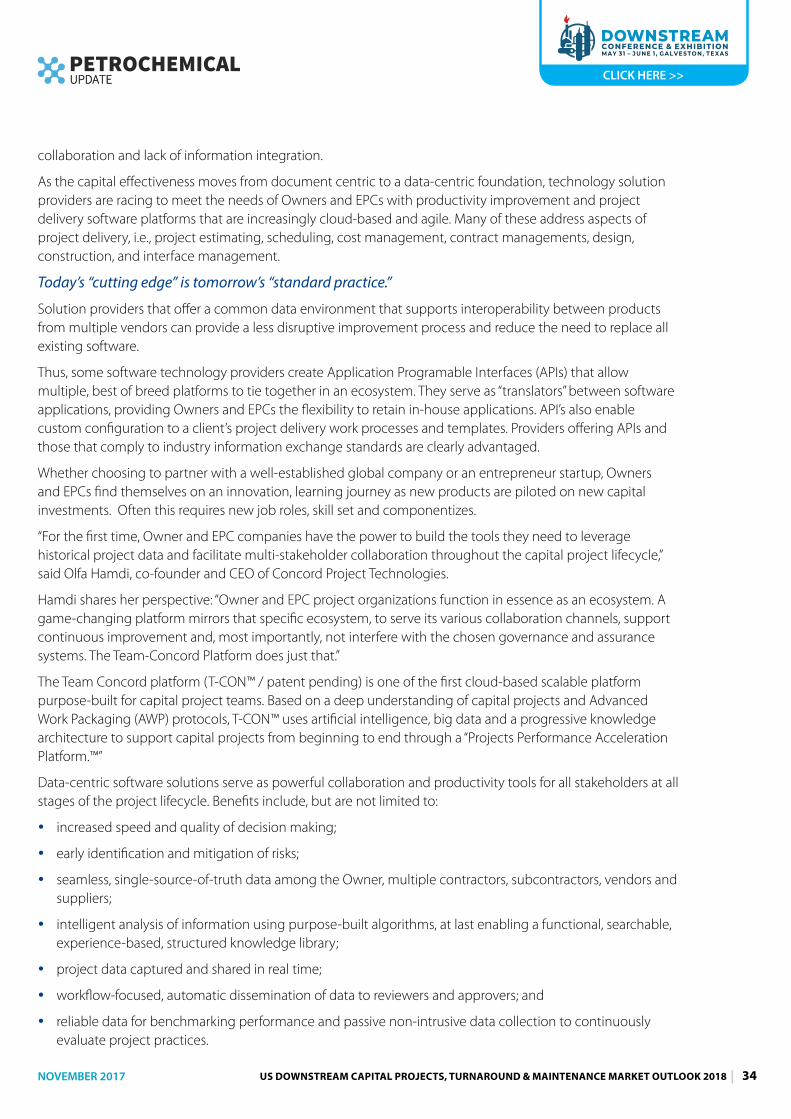
NOVEMBER 2017 US DOWNSTREAM CAPITAL PROJECTS, TURNAROUND & MAINTENANCE MARKET OUTLOOK 2018 | 34
CLICK HERE >>
collaboration and lack of information integration.
As the capital effectiveness moves from document centric to a data-centric foundation, technology solution providers are racing to meet the needs of Owners and EPCs with productivity improvement and project delivery software platforms that are increasingly cloud-based and agile. Many of these address aspects of project delivery, i.e., project estimating, scheduling, cost management, contract managements, design, construction, and interface management.
Today’s “cutting edge” is tomorrow’s “standard practice.”
Solution providers that offer a common data environment that supports interoperability between products from multiple vendors can provide a less disruptive improvement process and reduce the need to replace all existing software.
Thus, some software technology providers create Application Programable Interfaces (APIs) that allow multiple, best of breed platforms to tie together in an ecosystem. They serve as “translators” between software applications, providing Owners and EPCs the flexibility to retain in-house applications. API’s also enable custom configuration to a client’s project delivery work processes and templates. Providers offering APIs and those that comply to industry information exchange standards are clearly advantaged.
Whether choosing to partner with a well-established global company or an entrepreneur startup, Owners and EPCs find themselves on an innovation, learning journey as new products are piloted on new capital investments. Often this requires new job roles, skill set and componentizes.
“For the first time, Owner and EPC companies have the power to build the tools they need to leverage historical project data and facilitate multi-stakeholder collaboration throughout the capital project lifecycle,” said Olfa Hamdi, co-founder and CEO of Concord Project Technologies.
Hamdi shares her perspective: “Owner and EPC project organizations function in essence as an ecosystem. A game-changing platform mirrors that specific ecosystem, to serve its various collaboration channels, support continuous improvement and, most importantly, not interfere with the chosen governance and assurance systems. The Team-Concord Platform does just that.”
The Team Concord platform (T-CON™ / patent pending) is one of the first cloud-based scalable platform purpose-built for capital project teams. Based on a deep understanding of capital projects and Advanced Work Packaging (AWP) protocols, T-CON™ uses artificial intelligence, big data and a progressive knowledge architecture to support capital projects from beginning to end through a “Projects Performance Acceleration Platform.™”
Data-centric software solutions serve as powerful collaboration and productivity tools for all stakeholders at all stages of the project lifecycle. Benefits include, but are not limited to:
� increased speed and quality of decision making;
� early identification and mitigation of risks;
� seamless, single-source-of-truth data among the Owner, multiple contractors, subcontractors, vendors and suppliers;
� intelligent analysis of information using purpose-built algorithms, at last enabling a functional, searchable, experience-based, structured knowledge library;
� project data captured and shared in real time;
� workflow-focused, automatic dissemination of data to reviewers and approvers; and
� reliable data for benchmarking performance and passive non-intrusive data collection to continuously evaluate project practices.
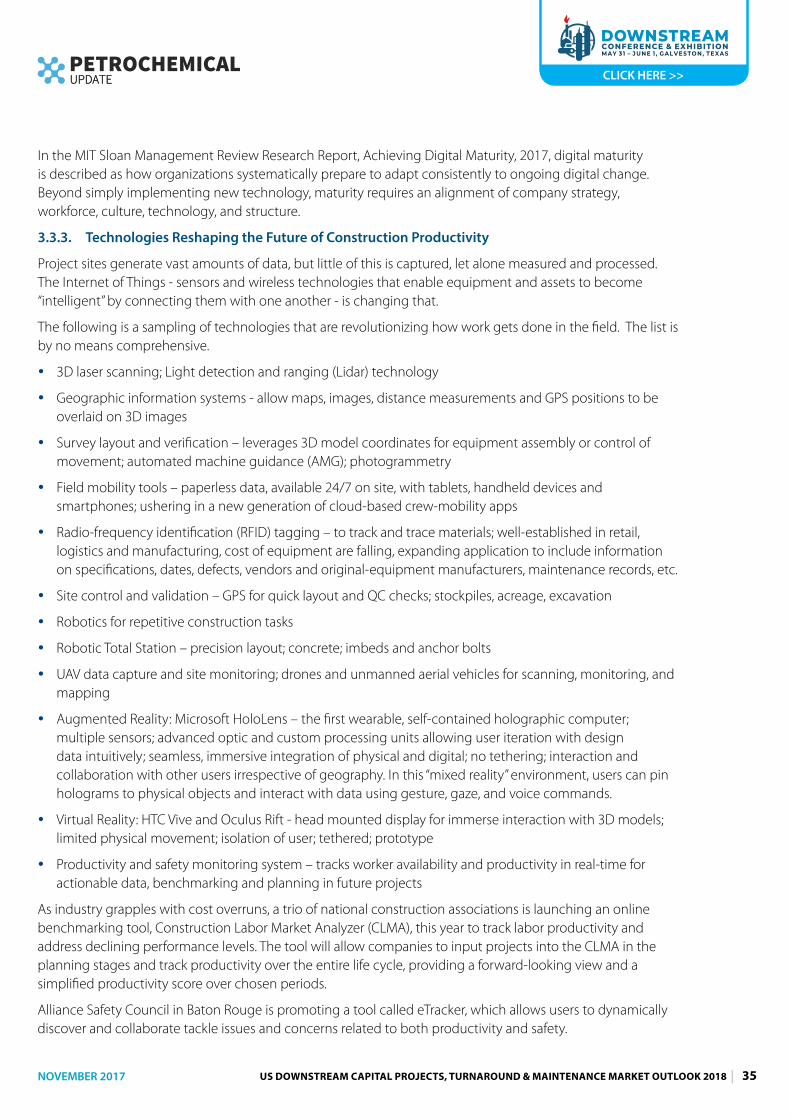
NOVEMBER 2017 US DOWNSTREAM CAPITAL PROJECTS, TURNAROUND & MAINTENANCE MARKET OUTLOOK 2018 | 35
CLICK HERE >>
In the MIT Sloan Management Review Research Report, Achieving Digital Maturity, 2017, digital maturity is described as how organizations systematically prepare to adapt consistently to ongoing digital change. Beyond simply implementing new technology, maturity requires an alignment of company strategy, workforce, culture, technology, and structure.
3.3.3. Technologies Reshaping the Future of Construction Productivity
Project sites generate vast amounts of data, but little of this is captured, let alone measured and processed. The Internet of Things - sensors and wireless technologies that enable equipment and assets to become “intelligent” by connecting them with one another - is changing that.
The following is a sampling of technologies that are revolutionizing how work gets done in the field. The list is by no means comprehensive.
� 3D laser scanning; Light detection and ranging (Lidar) technology
� Geographic information systems - allow maps, images, distance measurements and GPS positions to be overlaid on 3D images
� Survey layout and verification – leverages 3D model coordinates for equipment assembly or control of movement; automated machine guidance (AMG); photogrammetry
� Field mobility tools – paperless data, available 24/7 on site, with tablets, handheld devices and smartphones; ushering in a new generation of cloud-based crew-mobility apps
� Radio-frequency identification (RFID) tagging – to track and trace materials; well-established in retail, logistics and manufacturing, cost of equipment are falling, expanding application to include information on specifications, dates, defects, vendors and original-equipment manufacturers, maintenance records, etc.
� Site control and validation – GPS for quick layout and QC checks; stockpiles, acreage, excavation
� Robotics for repetitive construction tasks
� Robotic Total Station – precision layout; concrete; imbeds and anchor bolts
� UAV data capture and site monitoring; drones and unmanned aerial vehicles for scanning, monitoring, and mapping
� Augmented Reality: Microsoft HoloLens – the first wearable, self-contained holographic computer; multiple sensors; advanced optic and custom processing units allowing user iteration with design data intuitively; seamless, immersive integration of physical and digital; no tethering; interaction and collaboration with other users irrespective of geography. In this “mixed reality” environment, users can pin holograms to physical objects and interact with data using gesture, gaze, and voice commands.
� Virtual Reality: HTC Vive and Oculus Rift - head mounted display for immerse interaction with 3D models; limited physical movement; isolation of user; tethered; prototype
� Productivity and safety monitoring system – tracks worker availability and productivity in real-time for actionable data, benchmarking and planning in future projects
As industry grapples with cost overruns, a trio of national construction associations is launching an online benchmarking tool, Construction Labor Market Analyzer (CLMA), this year to track labor productivity and address declining performance levels. The tool will allow companies to input projects into the CLMA in the planning stages and track productivity over the entire life cycle, providing a forward-looking view and a simplified productivity score over chosen periods.
Alliance Safety Council in Baton Rouge is promoting a tool called eTracker, which allows users to dynamically discover and collaborate tackle issues and concerns related to both productivity and safety.
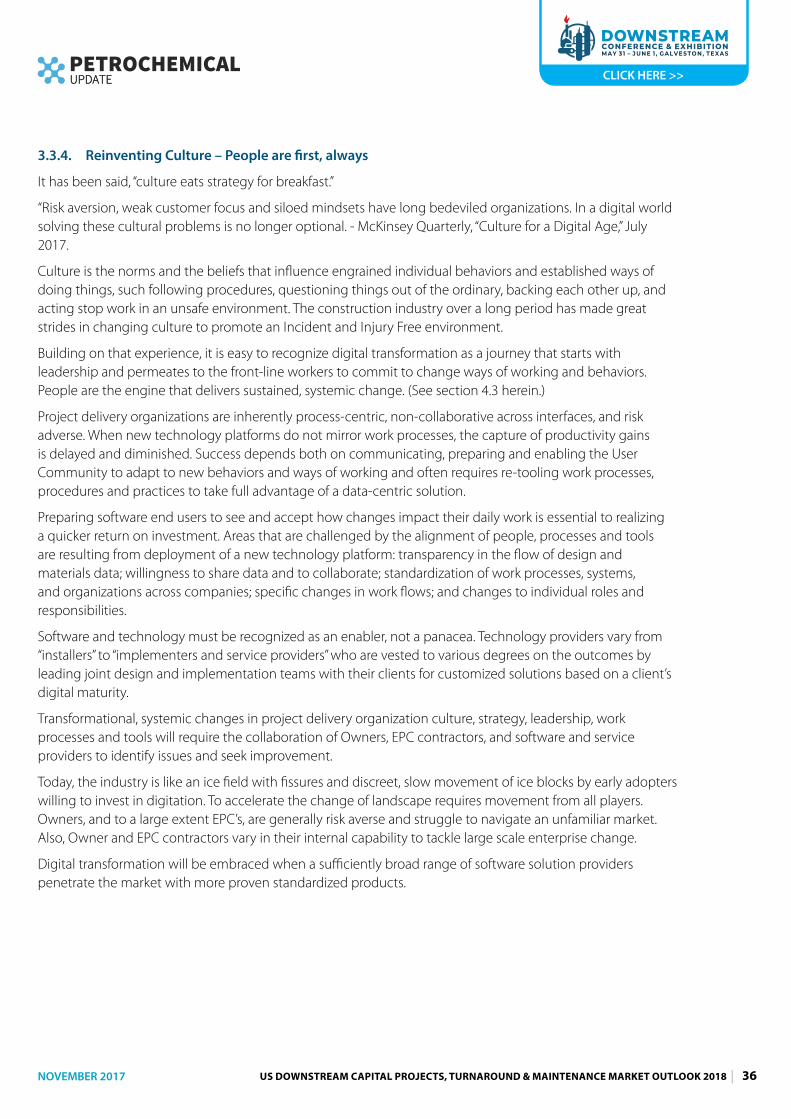
NOVEMBER 2017 US DOWNSTREAM CAPITAL PROJECTS, TURNAROUND & MAINTENANCE MARKET OUTLOOK 2018 | 36
CLICK HERE >>
3.3.4. Reinventing Culture – People are first, always
It has been said, “culture eats strategy for breakfast.”
“Risk aversion, weak customer focus and siloed mindsets have long bedeviled organizations. In a digital world solving these cultural problems is no longer optional. - McKinsey Quarterly, “Culture for a Digital Age,” July 2017.
Culture is the norms and the beliefs that influence engrained individual behaviors and established ways of doing things, such following procedures, questioning things out of the ordinary, backing each other up, and acting stop work in an unsafe environment. The construction industry over a long period has made great strides in changing culture to promote an Incident and Injury Free environment.
Building on that experience, it is easy to recognize digital transformation as a journey that starts with leadership and permeates to the front-line workers to commit to change ways of working and behaviors. People are the engine that delivers sustained, systemic change. (See section 4.3 herein.)
Project delivery organizations are inherently process-centric, non-collaborative across interfaces, and risk adverse. When new technology platforms do not mirror work processes, the capture of productivity gains is delayed and diminished. Success depends both on communicating, preparing and enabling the User Community to adapt to new behaviors and ways of working and often requires re-tooling work processes, procedures and practices to take full advantage of a data-centric solution.
Preparing software end users to see and accept how changes impact their daily work is essential to realizing a quicker return on investment. Areas that are challenged by the alignment of people, processes and tools are resulting from deployment of a new technology platform: transparency in the flow of design and materials data; willingness to share data and to collaborate; standardization of work processes, systems, and organizations across companies; specific changes in work flows; and changes to individual roles and responsibilities.
Software and technology must be recognized as an enabler, not a panacea. Technology providers vary from “installers” to “implementers and service providers” who are vested to various degrees on the outcomes by leading joint design and implementation teams with their clients for customized solutions based on a client’s digital maturity.
Transformational, systemic changes in project delivery organization culture, strategy, leadership, work processes and tools will require the collaboration of Owners, EPC contractors, and software and service providers to identify issues and seek improvement.
Today, the industry is like an ice field with fissures and discreet, slow movement of ice blocks by early adopters willing to invest in digitation. To accelerate the change of landscape requires movement from all players. Owners, and to a large extent EPC’s, are generally risk averse and struggle to navigate an unfamiliar market. Also, Owner and EPC contractors vary in their internal capability to tackle large scale enterprise change.
Digital transformation will be embraced when a sufficiently broad range of software solution providers penetrate the market with more proven standardized products.
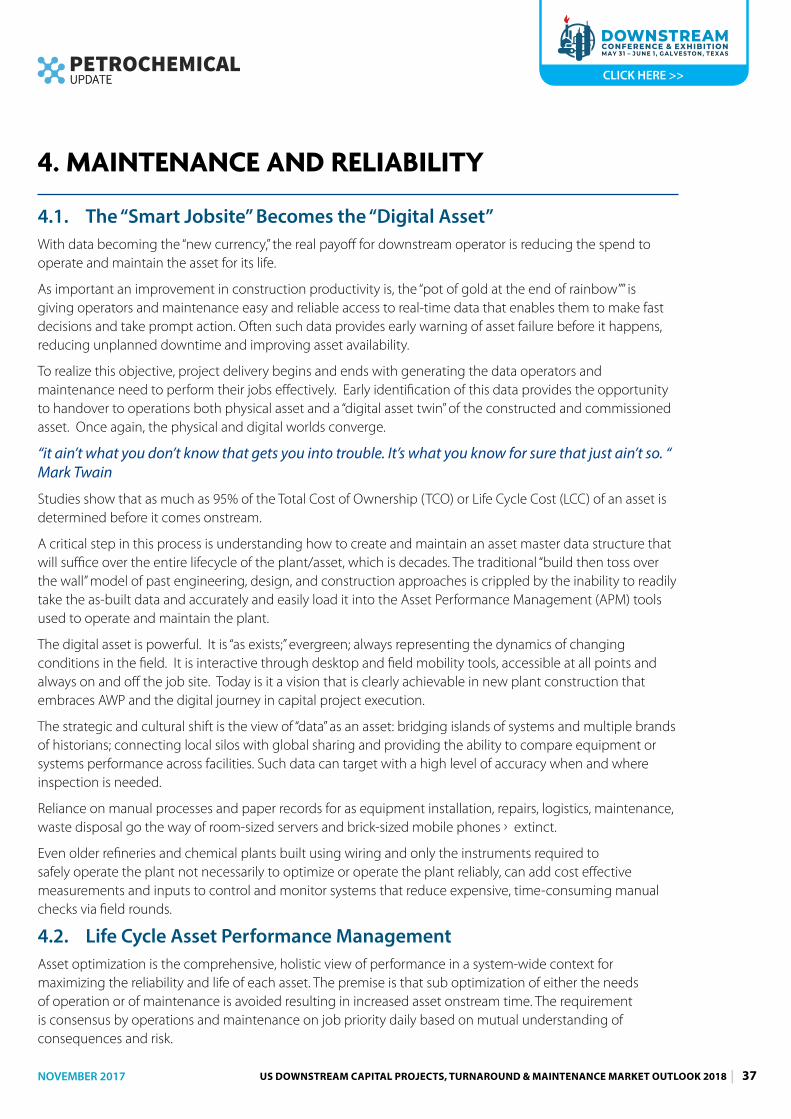
NOVEMBER 2017 US DOWNSTREAM CAPITAL PROJECTS, TURNAROUND & MAINTENANCE MARKET OUTLOOK 2018 | 37
CLICK HERE >>
4. MAINTENANCE AND RELIABILITY
4.1. The “Smart Jobsite” Becomes the “Digital Asset”With data becoming the “new currency,” the real payoff for downstream operator is reducing the spend to operate and maintain the asset for its life.
As important an improvement in construction productivity is, the “pot of gold at the end of rainbow”” is giving operators and maintenance easy and reliable access to real-time data that enables them to make fast decisions and take prompt action. Often such data provides early warning of asset failure before it happens, reducing unplanned downtime and improving asset availability.
To realize this objective, project delivery begins and ends with generating the data operators and maintenance need to perform their jobs effectively. Early identification of this data provides the opportunity to handover to operations both physical asset and a “digital asset twin” of the constructed and commissioned asset. Once again, the physical and digital worlds converge.
“it ain’t what you don’t know that gets you into trouble. It’s what you know for sure that just ain’t so. “ Mark Twain
Studies show that as much as 95% of the Total Cost of Ownership (TCO) or Life Cycle Cost (LCC) of an asset is determined before it comes onstream.
A critical step in this process is understanding how to create and maintain an asset master data structure that will suffice over the entire lifecycle of the plant/asset, which is decades. The traditional “build then toss over the wall” model of past engineering, design, and construction approaches is crippled by the inability to readily take the as-built data and accurately and easily load it into the Asset Performance Management (APM) tools used to operate and maintain the plant.
The digital asset is powerful. It is “as exists;” evergreen; always representing the dynamics of changing conditions in the field. It is interactive through desktop and field mobility tools, accessible at all points and always on and off the job site. Today is it a vision that is clearly achievable in new plant construction that embraces AWP and the digital journey in capital project execution.
The strategic and cultural shift is the view of “data” as an asset: bridging islands of systems and multiple brands of historians; connecting local silos with global sharing and providing the ability to compare equipment or systems performance across facilities. Such data can target with a high level of accuracy when and where inspection is needed.
Reliance on manual processes and paper records for as equipment installation, repairs, logistics, maintenance, waste disposal go the way of room-sized servers and brick-sized mobile phones › extinct.
Even older refineries and chemical plants built using wiring and only the instruments required to safely operate the plant not necessarily to optimize or operate the plant reliably, can add cost effective measurements and inputs to control and monitor systems that reduce expensive, time-consuming manual checks via field rounds.
4.2. Life Cycle Asset Performance Management Asset optimization is the comprehensive, holistic view of performance in a system-wide context for maximizing the reliability and life of each asset. The premise is that sub optimization of either the needs of operation or of maintenance is avoided resulting in increased asset onstream time. The requirement is consensus by operations and maintenance on job priority daily based on mutual understanding of consequences and risk.
NOVEMBER 2017 US DOWNSTREAM CAPITAL PROJECTS, TURNAROUND & MAINTENANCE MARKET OUTLOOK 2018 | 38
CLICK HERE >>
“Strategies to deliver asset care have not changed,” said David Rosenthal, a Reliability Consultant with more than 35 years of experience in the petrochemical industry. “They are based mostly on criticality. Some companies take a Process Safety Management approach by risk-ranking assets by the consequences of failure to Environmental, Safety and Health (EHS) issues. Some are ranking assets by criticality from a combination of EHS risks, Production risks, Maintenance cost risks and other factors as appropriate. However, many operations are still reactive-maintenance based.”
Equipment criticality assessment is long recognized as the basis for a maintenance work order management system that defines maintenance strategy; prioritizes and schedules preventive, predictive and corrective maintenance; defines priorities for shutdowns and turnarounds; identifies training needs; and sets spares philosophy. However, one factor alone should not dictate the real priority of the work order; the consequence, probability and risk of each work order must be assessed.
The ever-present tension between operations and maintenance exists regarding equipment criticality, work priority and system condition. In many cases, the operating team mainly dictates priority from the view of production loss only.
On the front-line, human behaviors override management systems. In many companies, the operations supervisor insists on designating the job as priority, irrespective of the criticality level. Equipment changeover from running to standby poses a risk to onstream time and is resisted. The “if it’s not broke, don’t fix it” mentality prevails. And sometimes the result is an unplanned outage or a planned outage with more scope than can be reasonable executed in during the outage duration.
In his role as Petrochemicals Availability Engineer responsible for both TAR and routine maintenance in BP’s Manufacturing Excellence organization, Kevin Strader shared that his biggest challenge is helping the organization to define work scope, budget and return on investment on discreet maintenance activities. A big component of that is articulating risks associated with doing, or not doing, the work. In this coaching and mentoring role, he also advises the organization on how to improve execution efficiency. We need a “project management skills and the some of the rigor that comes with capital project justification and prioritization of capital spend, he says.
“Reliability, a strategic issue, is concerned with avoiding failures of equipment and processes,” said veteran O&M consultant Paul Barringer. “Operators can avoid failures by proper design and careful operation of equipment by trained personnel… that’s how you get to a failure free environment.” Maintenance is focused on minimum cost to maintain uptime.”
Barringer adds that operating a profitable petrochemical plant requires a balance between avoiding and repairing failures. “Many owners utilized their maintenance groups to establish care for their assets when their true function was to execute care and restore function,” said Rosenthal.
Predictive and preventive maintenance spending increases equipment service life and reduce the number of costly equipment replacements. Operating expenses are also reduced with decreased emissions and higher operating efficiencies. to achieve top-quartile performance, downstream operators are embracing Total productive maintenance (TPM) as a management system aimed at improving the integrity of plant assets through diagnostic techniques, maintenance work processes and world-class employees.
Condition-Based Maintenance (CBM) incorporate real-time condition monitoring data recording, analysis and decision making. “Technology and data are speeding up the diagnosis of failure,” Rosenthal said. “The earlier failure is diagnosed, the less expensive the repair becomes while uptime is increased. Condition-based tools are getting increasingly sophisticated in recognizing failure patterns.”
NOVEMBER 2017 US DOWNSTREAM CAPITAL PROJECTS, TURNAROUND & MAINTENANCE MARKET OUTLOOK 2018 | 39
CLICK HERE >>
Maintenance Meets Technology Innovation
“We’re not in Kansas anymore.” – Dorothy, Wizard of Oz
In asset intensive refining and chemicals sectors, businesses need to rethink and redo the way they design, operate, maintain, and dispose of their assets. Today’s technology renders the traditional silo-based approaches a severe competitive disadvantage.
Early adopters of this new paradigm can expect faster commissioning of new assets, lower operations cost due to improved asset reliability, longer asset life, and better decommissioning and disposal costs.
In operations, the application of digital technologies to functions such as maintenance is already improving plant and network performance and minimizing downtime, reducing operating costs by 2 to 10 percent. These solutions can also improve safety, prevent releases that could result in fines and penalties, and extend the life of expensive process equipment.
Increased computational power have dramatically increased the ability to process massive data sets toward actionable insights, delivering insights much closer to real time versus what normally took days or weeks.
Advanced analytics is the autonomous processing of data using sophisticated tools to discover insights and make recommendations. It provides intelligence to improve decision making and can especially enhance journeys where nonlinear thinking is required. With predictive analytics, this data can be automatically analyzed and alert of abnormal operation or imminent failure.
Asset Framework normalizes tag and asset naming, units of measure, and times zones. Standard data structure to build the data models upon is essential to collaboration across people and systems.
Flexible software platforms leverage historical and real-time operational data fed to algorithms to model the precursors to failure across all assets and systems. This intelligence provides a refined set of recommendations for action needed at a system and individual asset level and when to take that action to maximize uptime and performance. The models can predict where and how that system stress increase will cause a breakdown with months — not just days — of notice.
Intelligent process automation (IPA) is an emerging set of new technologies that combines fundamental process redesign with robotic process automation and machine learning. IPA can replace human effort in processes that involve aggregating data from multiple systems or taking a piece of information from a written document and entering it as a standardized data input. There are also automation approaches that can take on higher-level tasks.
Technology is rapidly penetrating the way work gets done. making it safer and smarter. Evolving failures can be recognized long before the emergence of real ones. Some examples are the following:
� non-intrusive and wide area sensing with wireless communications allow points of measurement to be added at a fraction of the cost and time compared to their wired equivalents. With no process penetrations, they can be installed without downtime;
� diagnostic systems based on proprietary, self-learning statistical algorithms can process data from installed sensors on the diagnosed mechanical part
� video analytics use drones or fixed cameras can limit personnel access to hazardous area or work from heights; and
� corrosion can be identified without removal of insulation and excessive scaffolding; real-time, continuous visibility of temperature and thickness of zones and lines most at risk enables projected corrosion rates.
Reliability organizations are writing tomorrow’s history with the introduction of machine learning that can make predictions on inputs and provide insights on recognized patterns and smart workflows that track the
NOVEMBER 2017 US DOWNSTREAM CAPITAL PROJECTS, TURNAROUND & MAINTENANCE MARKET OUTLOOK 2018 | 40
CLICK HERE >>
status of a process in real time, manage handoffs between different groups, and provide statistical data on bottlenecks.
Harnessing the power of wireless sensors to capture data from hundreds if not thousands of unmonitored processes, devices and systems subject to unplanned failures or degraded operations is a fast return on investment. This data can be automatically analyzed and alert of abnormal operation or imminent failure.
Wireless mobile worker technology allows access to real-time monitoring and data aggregation, as well as procedures, enabling fast, accurate repair decisions before unplanned downtime occurs. This takes advantage of the more effective management of work requirements, improved planning and scheduling, and logistics optimization.
The steps in this digital journey follow a familiar theme, and like at all change initiatives, success or failure lies with user adoption – in this case, front line supervisors, operators and maintenance technicians performing the work:
� define a digital roadmap consistent with the company strategy, which includes a solution architecture that can accommodate for a “develop once, deploy global” approach to smart add-on solutions;
� preferentially use common off-the-shelf software;
� make data globally accessible and interpretable based upon a uniform asset-based data model; and
� leverage data in smart applications for performance analytics, predictive analytics and prescriptive analytics to operate with foresight and deliver business benefits.
For this digital journey to succeed, the need of the customer, specifically front-line operations and maintenance, must be met; with the end game to reimagine, simplify and streamline the “customer” role and responsibilities and address long lists of conflicting job expectations
4.3. People AdvantageSavvy Owner companies are also recognizing the need for behavioral change that fosters critical thinking and problem solving. Great companies build a People Advantage that enables and energizes people. It’s activated through a clear plan of implementation. It’s sustained by the attention that senior leaders give to enabling the best in people.
Complexity is being recognized as the enemy of excellence. The growing, dazzling array of laws, regulations, rules, and procedures serve as a false assurance that bad things never happen and when they do—they never happen again. Companies add more processes, new procedures, more reports and internal audits for compliance in response to near misses and incidents. It’s a vicious cycle that ultimately cascades on the shoulders of front-line supervisors who are simply overwhelmed and frustrated.
Many large corporations in downstream sector have a culture characterized by tradition, rules, maintaining the status quo and using control to minimize risk. “The organization must strive to change from a culture in which operations runs the machines and maintenance fixes them when they break to a culture in which maintenance and operations work together to ensure the machines run when needed.” Source: Life Cycle Engineering
After decades of system-based improvement and quality initiatives, the level of apparent system failures remain too high, says Brian Fils, Director of Operations Excellence at Endeavor Management. The failure rate on organization change programs is upwards of 80%. The reason: they neglect the underlying organizational and personal behaviors, says Fils.
For the last 25 years, the emphasis has been on management systems. These systems focus on controlling risks and results by controlling how people work. While value-added, they must evolve to be in sync with a culture that places a greater premium on adaptability, flexibility, situational awareness, and innovation. The
NOVEMBER 2017 US DOWNSTREAM CAPITAL PROJECTS, TURNAROUND & MAINTENANCE MARKET OUTLOOK 2018 | 41
CLICK HERE >>
next 25 years will unleash people to act and think critically enabling people to excel, to go beyond, to create a human force that achieves excellence and lowers risks.
The key to breaking the vicious circle of complexity is engraining strong behavioral pillars that complement systems. As the industry knows from its journey to Incident and Injury Free, this is not a quick fix. This is the call of leadership to bring out the best in people.
Critical thinking is a learned competency through practice. Nurture a passion for curiosity, model it every day, give people the time to question, and the authority to make decisions down to where the information lives – at the frontline.
In the book Never and Never Again® five key critical-thinking behaviors are cited as fundamental to operational excellence:
1. A Questioning Attitude is Pervasive Every change from “normal” must be understood and actioned. Everyone must feel empowered and obligated to ask the hard questions even when that might seemingly slow down action.
2. Act with Integrity and Courage All employees can be relied upon to do what they say they will and what is expected, whether someone is looking or not. They have the courage to do what is right. They make good quality decisions and own those decisions. They hold themselves and each other accountable for doing the job safely and correctly every time.
3. Engage Everyone Good ideas, innovation, preventive actions, and superb execution of operations come from people. Some surveys have found that 30% of workers are engaged in, enthusiastic about and committed to their workplace. Nearly half can be characterized as “not engaged” and another 20% are actively disengaged. Reality is that many front-line workers have “checked out” and simplify go through the motions every day.
4. Increase Knowledge This is not about training. This is individuals who show up at the job with personal commitment each day to make themselves and the people around them better. They utilize the expertise of others and openly share what they know.
5. Use a Structured Approach Where procedures exist, they are strictly followed. People recognize there is a right way to perform their tasks, they do it that way, and they expect the same from others. The caution is that procedures that are not crisp, clear, and simple result are ignored, which elevates operational risk.
4.4 Operator Reliability Case StudyA leading strategy consulting firm was engaged by a major mid-continent refiner and pipeline company (MCR) to assess and drive implementation of changes to improve safety, reliability, and overall business performance across all its facilities. The product of a recent merger of two refining companies, MCR was struggling to define a standard culture and operating philosophy.
The outcome of our assessment showed two important needs: 1) clearly defined and aligned behaviors (operational Integrity) and 2) a management system to define a standard way of operating.
We were contracted to begin work on the first element of their management system:
The Voice of the Frontline
• Simplify, simply, simplify.
• We are overwhelmed with conflicting initiatives.
• Don’t give us another procedure or rule.
• Take stuff off our plate that doesn’t add value.
• You pay us to think. Give us time to do it.
• See our work with your own eyes.
Never and Never Again®
NOVEMBER 2017 US DOWNSTREAM CAPITAL PROJECTS, TURNAROUND & MAINTENANCE MARKET OUTLOOK 2018 | 42
CLICK HERE >>
Leadership, Behaviors, and Accountability. The scope of this effort included corporate staff, all five refineries and their subsidiary pipeline company.
Partnering with MCR, the strategy consulting firm utilized our 4-step approach to culture change (aka LAAS) to deliver the desired outcomes.
During the Leadership Phase, we worked with the Executive and Refinery Leadership Team and engaged unions to define common the core values and behaviors for all employees. In workshops leaders determined “what good looks like,” and set expectations for behaviors as the “way we work.”
During the Awareness Phase, we conducted operational Integrity kick-off sessions with over 2,000 employees to “make the case for change” and establish expectation for these behaviors.
During the Action Phase, our roll sheet Process was used to develop role description sheets for every position in the company from CEO to entry-level operator. Every employee translates his/her accountabilities in the new culture and management system to their day-to-day work. Supervisors, Managers, and Senior Executives conducted one-on-one meetings with all their direct reports to review the expectations on the role description sheets and develop Improvement Action Plan Worksheets. The worksheets, along with coaching we provided to all employees, were used to internalize the culture change.
The Sustainment Phase focused on ensuring the leadership, behaviors and accountabilities met all regulatory requirements and satisfied other internal systems, such as the EHS management system. We also aligned the existing performance and talent management processes around the new culture and behaviors. Finally, we re-focused the Supervisor School around Operations Integrity, developed a new Safety Leadership School and integrated the culture into existing refinery behavior-based safety programs.
The results of this initial focus on leadership, behaviors, and accountability was outstanding. Not only did safety performance improve, but the CEO stated in his Q4 2014 earnings call that “the increased focus on Operational Integrity resulted in a 5% year-over-year improvement in utilization and a 50% improvement in lost profit opportunity.” This translated to approximately $200 million in EBIT improvement in 2014, a nearly 200-fold return on their investment in the project.
5. SHUTDOWNS AND TURNAROUNDS
Now more than ever, turnarounds do triple duty as a time for key maintenance activities, inspection and a strategic time to implement capital improvements.
American Fuel and Petrochemical Manufacturers (AFPM) cites the top 3 causes for turnaround (TAR) failure as (1) unrealistic targets for turnaround success; (2) inability to integrate with capital projects; and (3) ineffective turnaround strategy and /or steering teams.
AP Networks in its whitepaper “Benchmarking and Optimizing Maintenance Work Scope for Turnarounds” cites that the turnaround work scope is the most critical item related to performance outcomes, as it is the foundation for cost, schedule, and plant reliability. Minimizing the amount of scope and the level of scope growth during the turnaround execution window is the primary driver of competiveness.
Planning starting as early as 36 months in advance and adhering to the scope freeze are prerequisites to successful turnaround execution.
5.1.TAR Activity and Spending TrendsScheduled plant outages, turnarounds (TARs) and shutdowns are expected to increase by 5.4% to $10.43
NOVEMBER 2017 US DOWNSTREAM CAPITAL PROJECTS, TURNAROUND & MAINTENANCE MARKET OUTLOOK 2018 | 43
CLICK HERE >>
billion across all U.S. industrial markets in 2017, with the petroleum refining industry to see the biggest increase, according to Industrial Info Resources.
Refiners will increase planned maintenance spend by 38.5% to $1.26 billion next year, in the consultancy’s estimates. The chemicals-processing sector will see a 4% increase.
Recent deferrals of planned maintenance turnaround activity are leading to an increase in demand for craft labor in the first half of 2017. Some 7,000 additional craftsmen may be needed to undertake planned turnaround work in Q1 2017, according to Industrial Info Resources.
Although turnarounds and shutdowns are often planned months or even years in advance, Emerson Process Management found that 74% of plant turnarounds and outages fail to meet performance goals. Oracle Corporation concurs.
40% of turnarounds miss their schedule and/or budget targets by 30% or more. Schedule overruns average five days longer than planned, with an average cost impact of $2 million per day late. Five-day overruns equate to around $8 million for a turnaround project valued at $39 million, consultants at Aveva said in a recent webinar.
To meet start-up targets, operators typically include KPIs based on meeting plant and manpower mobilisation dates, ramp up and safety inductions requirements, as well as document approval cycle times, Peter Young, supply chain consultant for Aveva, told Petrochemical Update. KPIs should be designed such that operators and contractors share the rewards of on-time start up and share the costs of delays, Young said. “To avoid claims, there should be more upside to meeting the target, than downside ‘penalties’,” he said.
5.2. STO Performance Improvement Strategies 5.2.1. Drive a Culture of Safety
Reliability and safety go hand-in-hand to prevent incidents with the potential to affect the workforce and wider community.
“Our workloads have increased substantially over the years to meet OSHA and corporate safety regulations. The industry is asked to do more work with the same amount of money,” Joe Kilburg, maintenance manager at DuPont said. “We need more scaffolding than ever before, for example. Finding qualified skillsets to know how to work with these safety guidelines and details is a challenge.”
The plant’s safety team should be part of the turnaround process from beginning to end and continuously develop their safety strategy, said Gilbert Cuzdey, Senior Safety Specialist at Axiall in Lake Charles, Louisiana. Cuzdey’s team has developed a safety strategy that focuses on four key components: pre-screening, timing, interactivity and schedule changes. After each outage, the safety team, plant engineers, project managers and security team meets to review what went well and what can be improved for the next outage.
5.2.2. Improve Effectiveness and Reduce Costs
“Cost reductions are the biggest challenges, and we find ourselves doing more with less money,” Frank Tanner, maintenance section leader at Celanese said. “We have to streamline processes to get the results we need.”
“As we collect the scope of work from operations, we also capture the justification for performing each one of those maintenance repairs or activities,” said Jaime Plascencia, senior turnaround coordinator for Tesoro. “If there is any wish work, we go through a risk ranking tool. We decide if it makes sense to add this work to the turnaround. Having the right scope and completing the proper justifications and risk ranking is essential.”
Valero’s turnaround team at Three Rivers includes a full-time inspector to examine historical refinery performance to decrease discovery work. Valero also brings in the foreman and supervisors who will work on the turnaround one month early to align them with the plan and execution.
NOVEMBER 2017 US DOWNSTREAM CAPITAL PROJECTS, TURNAROUND & MAINTENANCE MARKET OUTLOOK 2018 | 44
CLICK HERE >>
Integrating the turnaround process with the overall reliability program allows the turnaround team to understand that health of equipment before, during and after the turnaround event.
Predictive technologies and analytics provide in depth insight into the condition of plant equipment. Turnaround teams can use equipment data to accurately pinpoint and prioritize the scope of work of the outage.
Increasingly Operators are adopting intuitive software solutions to source and manipulate information sets to deliver a more detailed and accurate work scope. A shared, cloud-based platform can provide a transparent work approval process which logs reviews, comments and job sign-off during the event for owners and contractors. Field mobility tools, such as tablets and handheld devices, status work progression and job completion signoff. Some benefits of these are as follows: improved adherence to schedule; improved manageability of evolving scope; improved resource utilization; reduced manning levels; improved quality and safety; elimination of paper in the field; automated and accurate reporting; and improved data collection for post turnaround review.
Analytics capabilities measure and analyze performance; plan future activities based on hard data and capture and leverage best practices within the organization.
Advanced sustainment and lean operation methods are used by operators like Suncor, Shell, and ExxonMobil in TARs to achieve 15-20% improvement in schedule attainment and work order quality. Advanced sustainment methods focus on building people skills and interactions, while lean operations focus on improving the process.
Technology can provide extensive asset reports and craft efficiency data; however, if this information is overwhelming and fails to communicate a succinct “real-time” message to supervisors and craft, it is not effective in identifying root causes and correct actions. Jorge Mastellari, senior vice president of Argo Consulting said, “What technology misses is the effective human interactions that are critical for proper problem-solving and decision-making.”
“Visual management techniques, if implemented properly, represent the targets and the status in real time. If the right people are in the room at the time and at the right frequency, collaboration, accountability and problem-solving happen naturally, because everyone is looking at the same data. The end game is to convert front line people from passive by-standers to active problem solvers,” Mastellari said.
5.2.3. Manage Resources
Turnarounds typically occur once every three to five years, and sometimes as much as every seven years. “Even veterans may have only worked through three or four turnarounds,” Nikki Bishop, Director of the global turnaround program at Emerson Process Management said. “This leaves little in the way of collective experience of how to plan and keep these complex projects moving effectively.”
The number of on-site contractors can rise 300% during turnarounds and up to 30% of contractors’ working days can be lost due to training requirements and problem resolutions, according to studies by oil services firm Rider Hunt International.
Finding enough qualified craftsman and planners remains a key challenge at plants. “Electrical instrumentation is a skill that is difficult to find. So many people can do electrical work, but what we need is to find more people who can specialize on electrical work at a plant, who know our process and our safety standards,” Kilburg said. “It is a challenge to find someone who understands the variable drives and gears.”
Selecting vendors as much as two years out, one year before the scope is frozen, has been the key to a successful turnaround strategy at Valero. During the vendor selection process, we look at detailed breakdown of equipment and manpower loading by craft and by day,” Edelman said. Pena describes a process at Covestro that ensures material is on site and ready to go 60 days prior to the turnaround to give the contractors time to verify and inspect the materials before the event.
NOVEMBER 2017 US DOWNSTREAM CAPITAL PROJECTS, TURNAROUND & MAINTENANCE MARKET OUTLOOK 2018 | 45
CLICK HERE >>
5.3. Integration of Capital Projects and TurnaroundsTurnarounds and outages are a strategic time when maintenance initiates inspection, cleaning, repair and major overhauls of equipment. At the same time, companies are using this window of downtime to implement capital improvements. Combining these goals can make outages more complicated and risky if they are not integrated well.
“Typical turnaround activities, such as catalyst bed replacement and critical rotating equipment maintenance, become even more complex when concurrent activities, like welding and the fabrication of new assets and piping, are added,” said Nikki Bishop, director of the global turnaround program at Emerson Process Management. “For example, scaffolding for the turnaround may obstruct access of a crane used for a capital project. If both projects are not integrated as one event, this creates unnecessary delays.”
At the AIChE Spring Meeting and Global Congress on Process Safety in March, two best practices for integrating capital work in turnaround events were presented:
1. managing both events as one, thus having the capital project IFCs completed before turnaround scope freeze date; and
2. automation utilizing asset health insight (beyond a single data point) with integrating risk analysis into the deferred maintenance decision-making.
“Having additional online asset health trends ensures only the assets that need attention during a turnaround are part of the scope, and provides confidence that an asset requiring attention was not missed when reducing overall scope. Automation (smart diagnostics and online asset health monitoring) can mitigate discovery work once the turnaround begins.”
Borrowing some lines from Heinz Block’s Maximizing Machinery Uptime, p 392, some sage advice when integrating capital work into maintenance outages is to integrate the teams (one leader and one team responsible for planning and scheduling both maintenance and capital); to integrate the schedule - one key milestone plan; to merge reviews; and to include only capital work that requires a unit shutdown.
NOVEMBER 2017 US DOWNSTREAM CAPITAL PROJECTS, TURNAROUND & MAINTENANCE MARKET OUTLOOK 2018 | 46
CLICK HERE >>
6. CONCLUSION
Today’s downstream industry landscape continues to be marked by increasing project complexity and labor risks, with decreasing stakeholder and investor risk tolerance and higher expectations of stability in return on investment.
To stay competitive and thrive in the face of global economic uncertainty, rapidly changing workforce composition, and increasingly regulatory as well as internal rules and processes for compliance, operators are embracing new technology that enables their most important asset, their people, to perform jobs more effectively.
Driven by an abundance of a 30-year supply of US shale gas that can be profitably produced at $4.00 per million BTUs or less. some 10.3 million tonnes of ethylene capacity will enter the U.S. market before the end of 2019, representing an increase of 36% of existing US capacity by 2018/2019. New investment in U.S. ethylene and polyethylene capacity will push North American polyethylene production to over 54 billion pounds per year by 2020, exceeding domestic demand and driving huge growth in export volumes. In the words of Exxon’s CEO “These projects are export machines.”
With more than $88 billion in LNG projects are currently planned, being built or in operation across the U.S., it stands to become the world’s third-largest exporter by 2020. While the first wave of large-scale LNG projects was underpinned by 20-year sales-purchase agreements, changing buyer behavior is predicted to reduce LNG term contract to 5-9 years. Some predict an oversupplied LNG market in 2022-2025 with additional investments are required longer term to meet global demand.
Transformation, enabled through digital solutions, tools and technology is critical to address issues related to current complexity, size and risk of major capital projects that has outgrown the ability of humans to effectively handle the sheer volumes of data required to build, operate and maintain assets.
If there is one predominant theme in the downstream construction industry, it is imperative that Owners and EPC contractors together address the “mission critical “issue of declining field productivity over the past 4 decades.
The economic climate remains challenging, and challenges bring opportunity. Now is the time to hire the best talent, for business and engineering to align early on the best opportunities to develop, and for owners and contractors to collaborate closely on approaches such as workforce development and the imperative to improve field productivity.
Technology is rapidly penetrating the way work gets done, making it safer and smarter. The strategic and cultural shift is the view of “data” as an asset: bridging islands of systems and multiple brands of historians; connecting local silos with global sharing and providing the ability to compare equipment or systems performance across facilities.
Reliability organizations are writing tomorrow’s history with the introduction of machine learning that can make predictions on inputs and provide insights on recognized patterns and smart workflows that track the status of a process in real time, manage handoffs between different groups, and provide statistical data on bottlenecks.