Embed Size (px)
Citation preview
U.S. DEPARTMENT OF VETERANS AFFAIRS
American Indian and Alaska Native Veterans:
Lasting Contributions
Lindsay F. Holiday, Gabriel Bell, Robert E. Klein and Michael R. Wells
Office of Policy
Assistant Secretary for Policy, Planning, and Preparedness
September 2006
2
American Indian and Alaska Native Veterans:
Lasting Contributions
Lindsay F. Holiday, Gabriel Bell, Robert E. Klein and Michael R. Wells
Office of Policy
Assistant Secretary for Policy, Planning, and Preparedness Department of Veterans Affairs
Introduction In November 2001, President George W. Bush proclaimed National American Indian Heritage Month by celebrating the role of the indigenous peoples of North America in shaping our Nation’s history and culture. He said: “American Indian and Alaska Native cultures have made remarkable contributions to our national identity. Their unique spiritual, artistic, and literary contributions, together with their vibrant customs and celebrations, enliven and enrich our land.” An important part of the overall contribution of American Indian and Alaska Native (AIAN) peoples to our Nation is the vital part played by American Indian men and women in protecting and preserving our freedoms. Their contributions to our armed forces have been made throughout our history, from the Revolution to the war against terror. The courage, spirit, and warrior tradition of American Indians have long been recognized as contributing to the individual qualities which distinguished American Indians in the military. During early wars, for example, the scouting and tracking abilities of American Indians, among many other skills, were particularly useful in battle. Later years saw American Indians more highly integrated into the military and playing expanded roles. American Indians in the U.S. Military: Historical Highlights Some highlights of the experience of American Indians in our Nation’s military follow:1
1 The information on American Indians in the military comes from a series of reports from the Department of Defense in honor of American Indian Heritage month. These reports can be found using the following link: http://www.dod.mil/specials/nativeamerican01/.
3
Early Wars (before WW I):
• During the American Revolution, the War of 1812, and the Civil War (both for the Union and Confederacy), scouting skills of American Indian soldiers were exploited.
• Tyonajanegen, an Oneida Indian, distinguished herself at the battle of Oriskany during the American Revolution, fighting along side her husband of Dutch descent.
• Sacajawea, a Shoshone woman, guided Lewis and Clark on their expedition west.
• In 1866, the Indian Scouts were established by the U.S. Army; one year later, 474 Indians served. The Scouts accompanied Gen. Pershing to Mexico in pursuit of Poncho Villa in 1916. The Indian Scouts were an integral part of the Army until 1947.
• American Indian soldiers accompanied Teddy Roosevelt to Cuba as Rough Riders in the Spanish-American War.
• Four American Indian nuns worked as nurses for the War Department in Cuba during the Spanish-American War.
• In the early war period, 16 American Indians were awarded the military’s highest honor, the Congressional Medal of Honor.
World War I:
• About 12,000 American Indians served during WW I.
• About 600 Oklahoma Choctaw and Cherokee men served in the Texas 124th Infantry, which saw action in France, and were recognized widely for their combat skills and bravery.
• Fourteen American Indian women served in the Army Nurse Corps.
• The Choctaw language was used to code messages to confuse German code-breakers.
• Four American Indians were awarded the Croix de Guerre, France’s highest military honor, for their valor.
• In 1919, American Indian soldiers and sailors were granted U.S. citizenship, five years before the Snyder Indian Citizenship Act granted citizenship to all American Indians.
4
World War II:
• More than 44,000 American Indians served in the military from 1941 to 1945, including 800 women.
• An estimated 99 percent of healthy male American Indians ages 21 to 44 were registered for the draft.
• Nearly 20 percent of the American Indian population, both men and women, were either in the armed forces or working for the war effort on the home front.
• Six American Indians earned the Congressional Medal of Honor for service during WW II.
• Ira Hayes, a Pima Indian from Arizona, was one of six marines to raise the flag on Mt. Suribachi in Iwo Jima.
• The Navajo language was used to code messages in the Pacific theater of operations. Over 400 Navajo “Code Talkers” served in the Marine Corps by war’s end.
Korean War:
• More than 10,000 American Indians served during the Korean War.
• Three American Indians were awarded the Congressional Medal of Honor.
• Among notable American Indians serving during the Korean War were former Colorado Senator Ben Nighthorse Campbell and Vice Admiral Joseph “Jocko” Clark, a Cherokee, who was commander of the Navy’s 7th fleet during the war.
Vietnam War:
• More than 42,000 American Indians served in the Armed Forces between 1965 and 1975.
• The Senator Matsunaga Project, as mandated in Public Law 101-507, studied Post-Traumatic Stress Disorder (PTSD) among American Indian Vietnam veterans. The study found relatively high levels of exposure to combat, stress and PTSD among them.
5
Post-Vietnam Era:
• During the Gulf War2
• Several American Indians lost their lives in the Gulf War, including Lori Piestewa, a Hopi Indian from Arizona, who died in the ambush in which Jessica Lynch and her compatriots were captured. Squaw Peak in Arizona was officially re-named Piestewa Peak in her honor.
, more than 3,000 American Indians served in the Gulf region.
• As of 1980, at least 60 women served as Eskimo Scouts in the Alaska National Guard, patrolling the western Alaska coastline. The Scouts, organized during WW II, represent the only unit of the Alaska Guard to have a continuous active duty mission.
American Indians in the Current Active Duty Military The latest data from the Department of Defense (July 2005) show that more than 24,000 among 1.4 million active duty military are American Indians,3
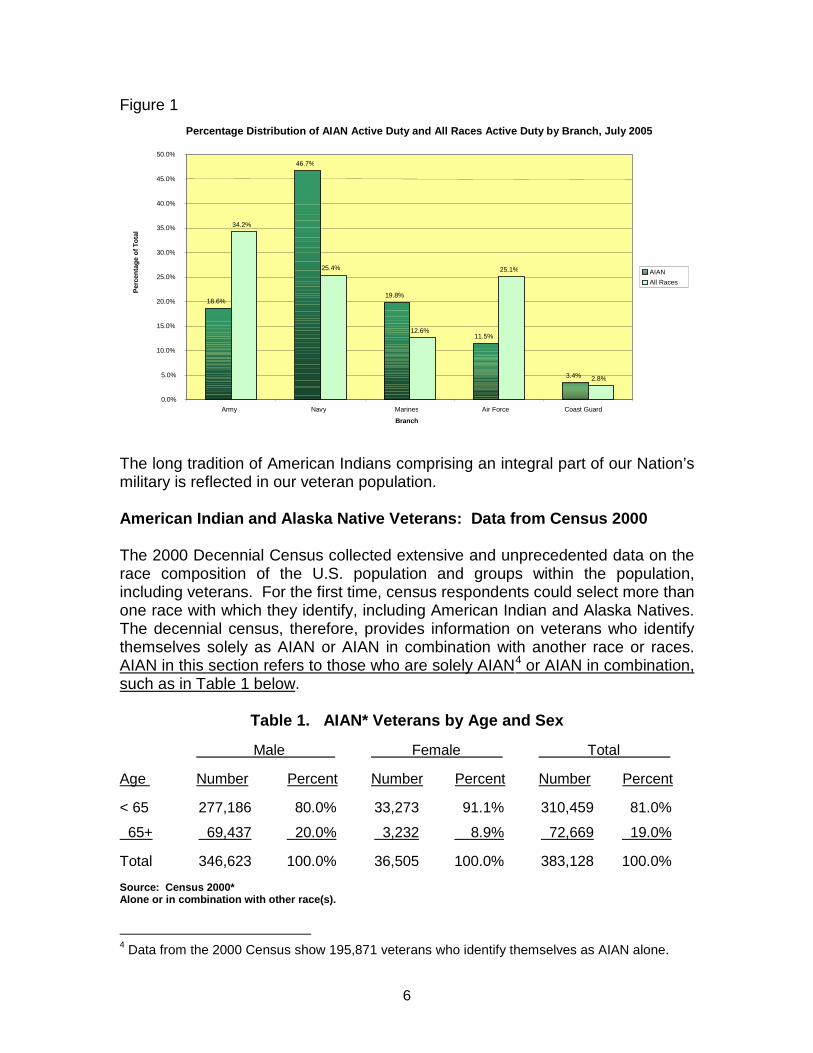
including nearly 3,900 women. American Indians represent roughly two percent of the active duty force. By branch, the distribution of American Indians differs from the distribution of the overall active duty military, as Figure 1 below shows:
• Among American Indians in the active duty military, nearly one-half are in the Navy, compared to one-quarter of all active duty members.
• American Indians are also “over-represented” in the Marines (20 percent v. 13 percent of all active duty) and “under-represented” in the Army (19 percent v. 34 percent) and Air Force (12 percent v. 25 percent).
• It is estimated that American Indians males in the active duty military represent more than 3 percent of all American Indian males 20 to 44 years old. It is estimated that among all males 20 to 44, 2 percent are in the active duty military. This continues a trend which indicates that American Indian males serve in greater proportion than eligible males in general.
2 Includes Desert Storm/Shield and Operations Enduring Freedom and Iraqi Freedom. 3 The DOD number is somewhat understated in that American Indians of mixed ancestry (that is, those who are of another race or races as well as American Indian) are not included. The number includes members of the Coast Guard as well as DOD branches. Source: DOD, IDS, “Active Duty report by Gender and Race-Ethnic Group-3035 (EO) Jul 2005,” and DOD, IDS, “Active Duty Age Change Report, Sept, 1987-July 2005.”
6
Figure 1
The long tradition of American Indians comprising an integral part of our Nation’s military is reflected in our veteran population. American Indian and Alaska Native Veterans: Data from Census 2000 The 2000 Decennial Census collected extensive and unprecedented data on the race composition of the U.S. population and groups within the population, including veterans. For the first time, census respondents could select more than one race with which they identify, including American Indian and Alaska Natives. The decennial census, therefore, provides information on veterans who identify themselves solely as AIAN or AIAN in combination with another race or races. AIAN in this section refers to those who are solely AIAN4
or AIAN in combination, such as in Table 1 below.
Table 1. AIAN* Veterans by Age and Sex
Male Female Total
Age Number Percent Number Percent Number Percent
< 65 277,186 80.0% 33,273 91.1% 310,459 81.0%
65+ 69,437 20.0% 3,232 8.9% 72,669 19.0%
Total 346,623 100.0% 36,505 100.0% 383,128 100.0%
Source: Census 2000* Alone or in combination with other race(s).
4 Data from the 2000 Census show 195,871 veterans who identify themselves as AIAN alone.
Percentage Distribution of AIAN Active Duty and All Races Active Duty by Branch, July 2005
18.6%
46.7%
19.8%
11.5%
3.4%
34.2%
25.4%
12.6%
25.1%
2.8% 0.0% 5.0%
10.0% 15.0% 20.0% 25.0% 30.0% 35.0% 40.0% 45.0% 50.0%
Army Navy Marines Air Force Coast Guard Branch
Perc
enta
ge o
f Tot
al
AIAN All Races
7
Number by Age
• More than 383,000 veterans identified themselves as AIAN, representing 1.5 percent of the more than 26 million veterans.
• Among AIAN veterans, nearly 73,000 were 65 or older, representing 19 percent of all AIAN veterans. Among veterans of all races, 37 percent were 65 or older (data not shown). Therefore, in the aggregate, AIAN veterans are younger than veterans in general, reflecting in part, the increasing proportion of AIAN in the military in recent years.
Number by Sex
• More than 36,000 female veterans were AIAN, representing nearly 10 percent of all AIAN veterans, 4 percentage points more than the 6 percent of women among veterans in general.
• Only 9 percent of female AIAN veterans are 65 or older compared to 20 percent of their male counterparts.
Period of Service
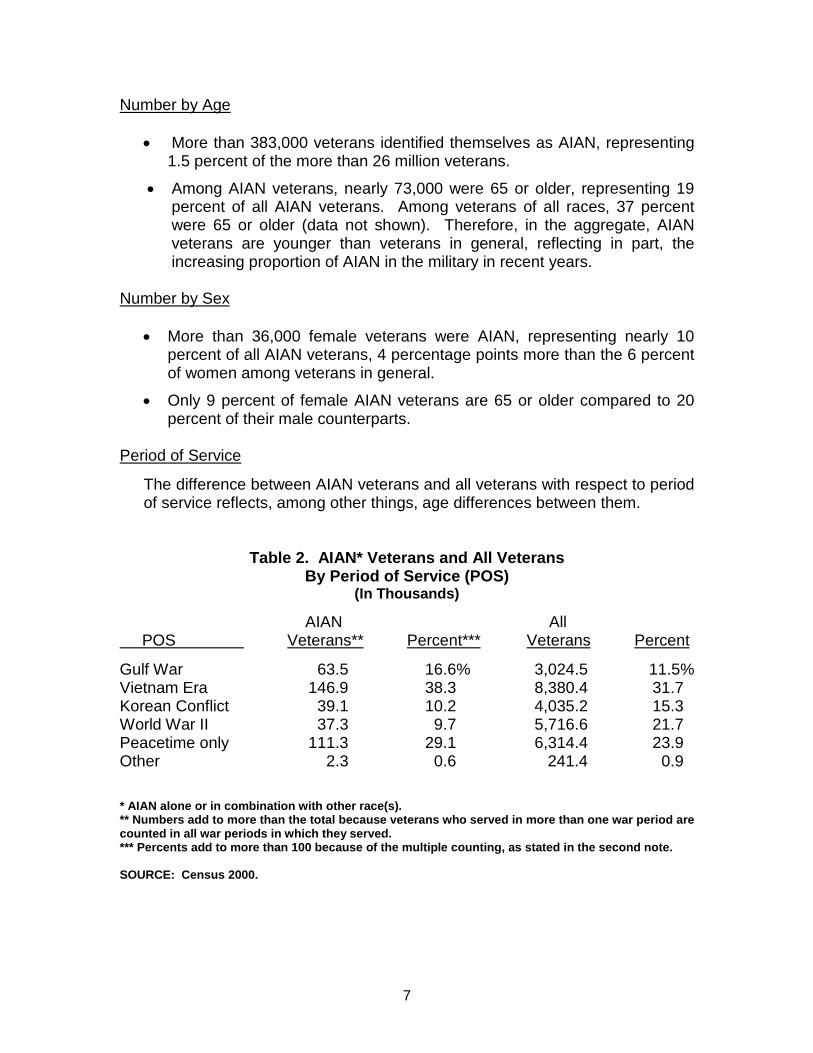
The difference between AIAN veterans and all veterans with respect to period of service reflects, among other things, age differences between them.
Table 2. AIAN* Veterans and All Veterans By Period of Service (POS)
(In Thousands) AIAN All POS Veterans** Percent*** Veterans Percent Gulf War 63.5 16.6% 3,024.5 11.5% Vietnam Era 146.9 38.3 8,380.4 31.7 Korean Conflict 39.1 10.2 4,035.2 15.3 World War II 37.3 9.7 5,716.6 21.7 Peacetime only 111.3 29.1 6,314.4 23.9 Other 2.3 0.6 241.4 0.9 * AIAN alone or in combination with other race(s). ** Numbers add to more than the total because veterans who served in more than one war period are counted in all war periods in which they served. *** Percents add to more than 100 because of the multiple counting, as stated in the second note. SOURCE: Census 2000.
8
• Compared to veterans in general, a higher proportion of AIAN veterans served in later periods—the Gulf War and peacetime (i.e., between the Vietnam Era and the Gulf War—data not shown), and the Vietnam Era.
• Compared to veterans in general, a smaller proportion of AIAN veterans served in earlier periods, such as Korea and WW II.
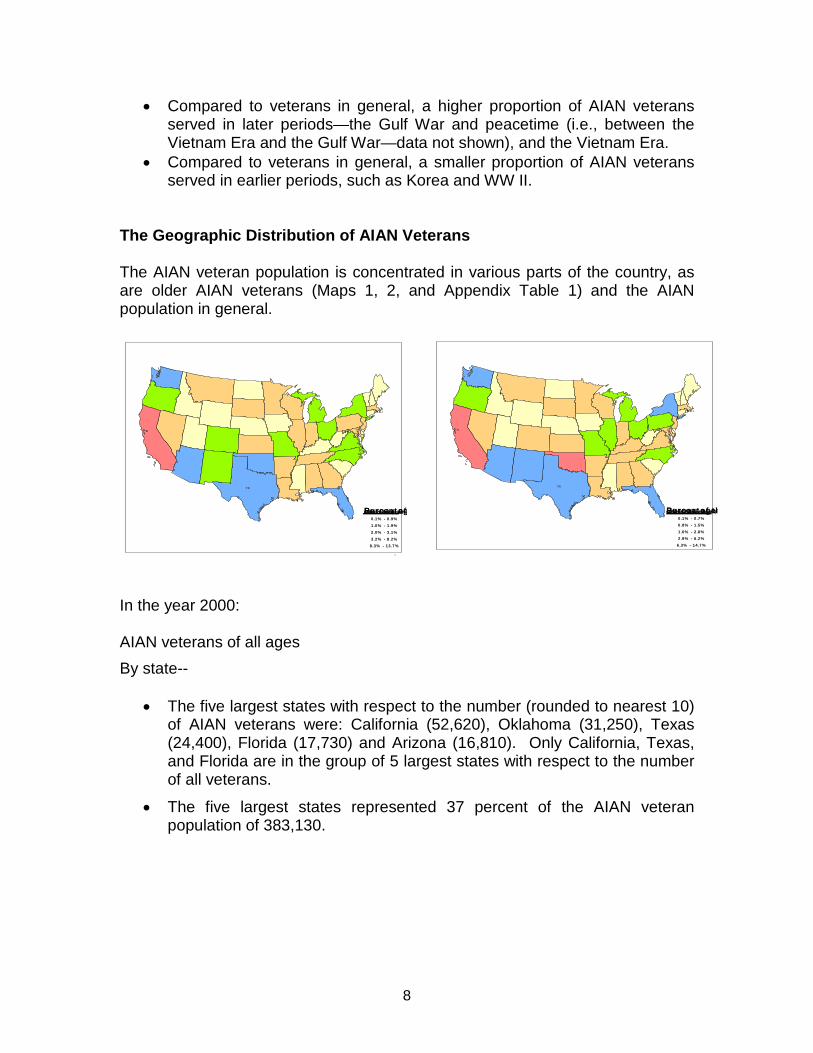
The Geographic Distribution of AIAN Veterans The AIAN veteran population is concentrated in various parts of the country, as are older AIAN veterans (Maps 1, 2, and Appendix Table 1) and the AIAN population in general.
TX
TXCA
CAMT
Office of Policy, Plann Office of the Actuary Percentag Bureau of AIAN Percentage
0.1% - 0.9%
1.0% - 1.9%
2.0% - 3.1%
3.2% - 8.2%
8.3% - 13.7%
TX
TXCA
CAMT
Office of Policy, Planning, Office of the Actuary (008Percentage Bureau of th AIAN 65+ Percentage
0.1% - 0.7%
0.8% - 1.5%
1.6% - 2.8%
2.9% - 6.2%
6.3% - 14.7%
In the year 2000: AIAN veterans of all ages By state--
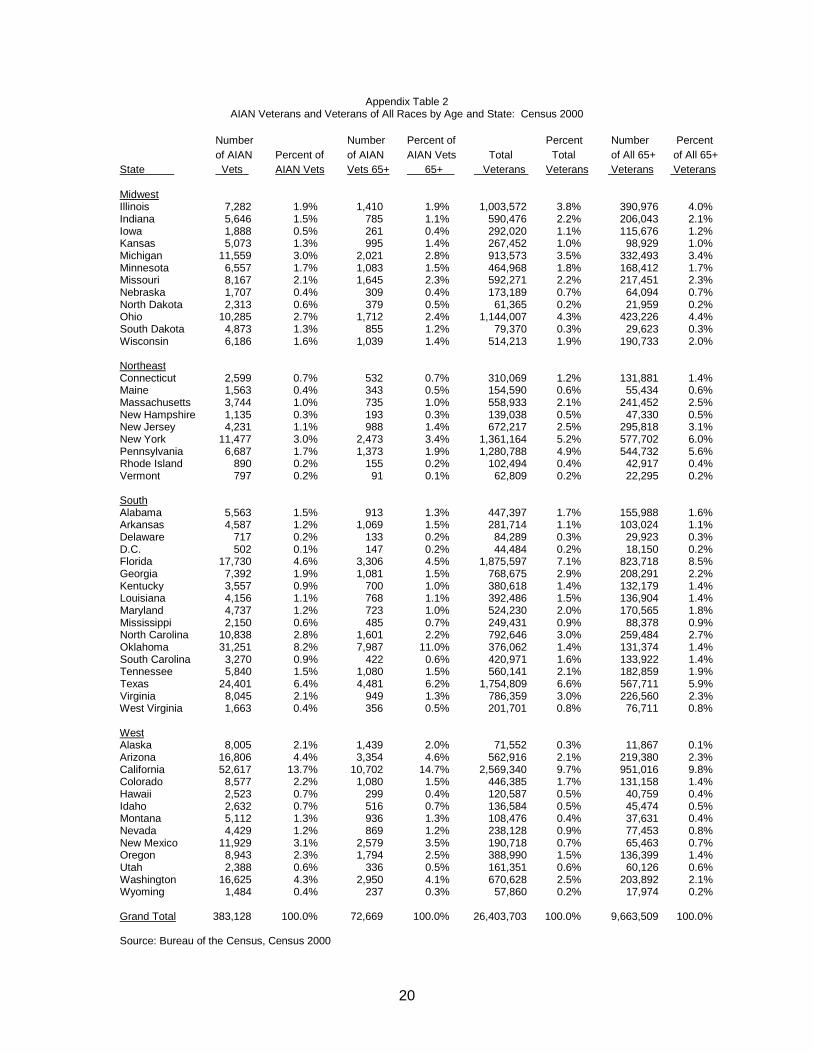
• The five largest states with respect to the number (rounded to nearest 10) of AIAN veterans were: California (52,620), Oklahoma (31,250), Texas (24,400), Florida (17,730) and Arizona (16,810). Only California, Texas, and Florida are in the group of 5 largest states with respect to the number of all veterans.
• The five largest states represented 37 percent of the AIAN veteran population of 383,130.
9
By region5
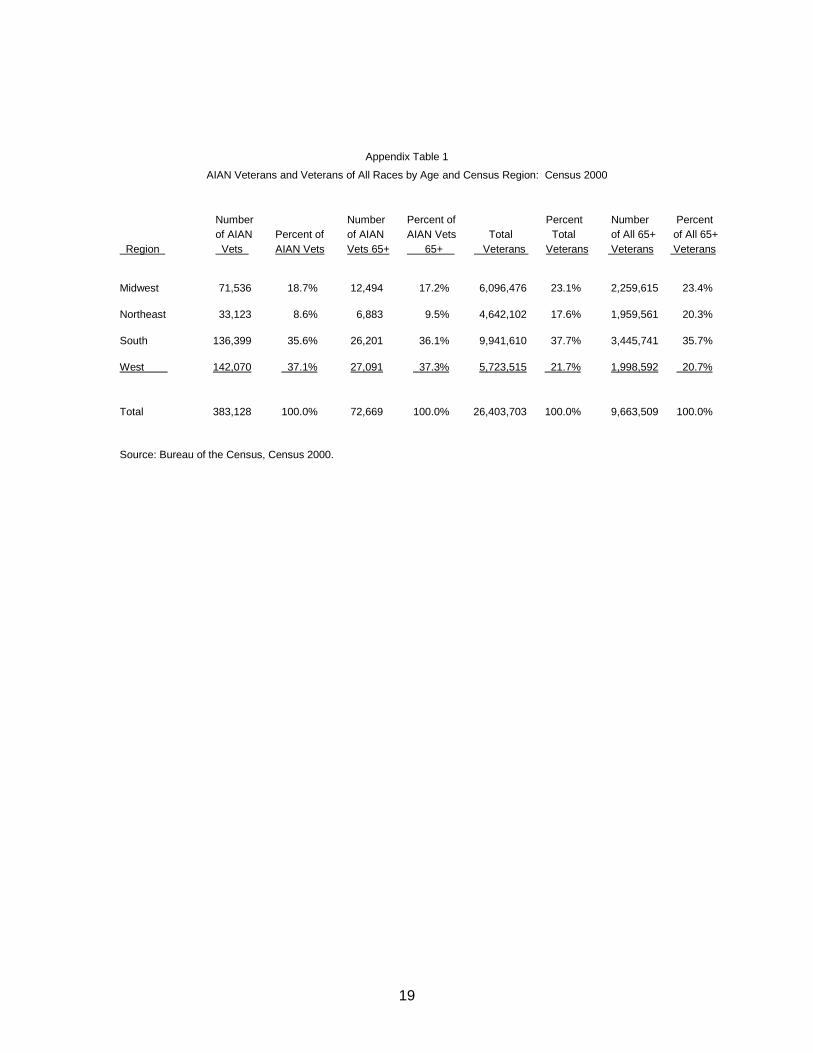
• The West and South, with 37 percent and 36 percent of the AIAN veteran population respectively (see Appendix Table 1), accounted for nearly three-quarters of all AIAN veterans. The Northeast contained only 9 percent of AIAN veterans. In contrast, 18 percent of all veterans lived in the Northeast and 22 percent in the West.
--
• In rank order, from highest to lowest, AIAN veterans lived in the West, South, Midwest, and Northeast--all veterans in the South, Midwest, West, and Northeast.
AIAN veterans 65 or older By state—
• The five largest states with respect to the number (rounded to nearest 10) of older AIAN veterans were the same as those for all AIAN veterans: California (10,700), Oklahoma (7,990), Texas (4,480), Arizona (3,350), and Florida (3,310), with Arizona having more older AIAN veterans than Florida, which is not the case for AIAN veterans in general. Only California, Texas, and Florida are in the group of 5 largest states with respect to the number of all older veterans.
• The five largest states represented 41 percent of the 72,670 older AIAN veterans.
• The five smallest states for older AIAN veterans were: New Hampshire (190), Rhode Island (160), DC (150), Delaware (130), and Vermont (90). Only DC and Vermont are in the smallest group with respect to the number of all older veterans.
Number by Census Region:
• The West and South, with 37 percent and 36 percent of the older AIAN veteran population respectively (see Appendix Table 1), accounted for nearly three-quarters of older AIAN veterans, roughly the same as that for all AIAN veterans. The Northeast contained only 10 percent of older AIAN veterans. In contrast, 20 percent of all older veterans lived in the Northeast and 21 percent in the West.
5 Northeast Region includes Maine, New Hampshire, Vermont, Massachusetts, Rhode Island, Connecticut, New York, New Jersey, and Pennsylvania.
Midwest Region includes Ohio, Indiana, Illinois, Michigan, Wisconsin, Minnesota, Iowa, Missouri, North Dakota, South Dakota, Nebraska, and Kansas.
South Region includes Delaware, Maryland, District of Columbia, Virginia, West Virginia, North Carolina, South Carolina, Georgia, Florida, Kentucky, Tennessee, Alabama, Mississippi, Arkansas, Louisiana, Oklahoma, and Texas.
West Region includes Montana, Idaho, Wyoming, Colorado, New Mexico, Arizona, Utah, Nevada, Washington, Oregon, California, Alaska, and Hawaii.
10
• In rank order, from highest to lowest, older AIAN veterans lived in the West, South, Midwest, and Northeast--all older veterans in the South, Midwest, with the West, and Northeast having virtually equal proportions (a fraction percentage point over 20 percent).
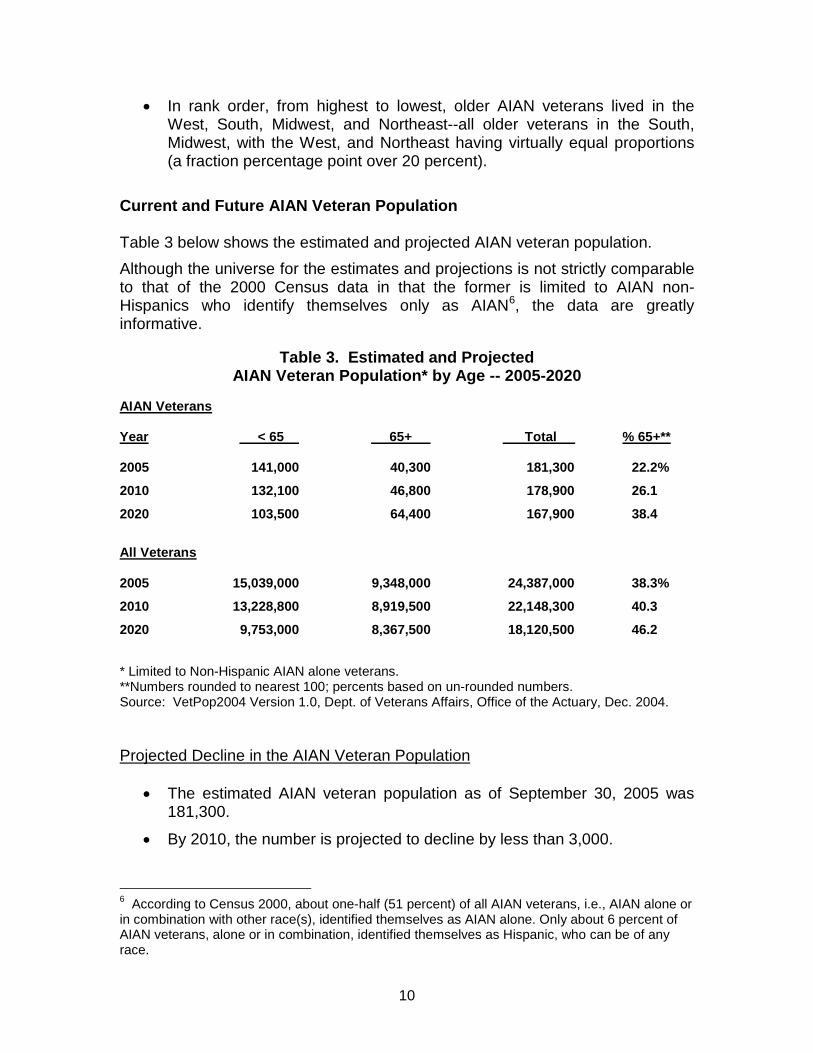
Current and Future AIAN Veteran Population Table 3 below shows the estimated and projected AIAN veteran population. Although the universe for the estimates and projections is not strictly comparable to that of the 2000 Census data in that the former is limited to AIAN non-Hispanics who identify themselves only as AIAN6
, the data are greatly informative.
Table 3. Estimated and Projected AIAN Veteran Population* by Age -- 2005-2020
AIAN Veterans Year < 65 65+ Total % 65+** 2005 141,000 40,300 181,300 22.2%
2010 132,100 46,800 178,900 26.1
2020 103,500 64,400 167,900 38.4
All Veterans 2005 15,039,000 9,348,000 24,387,000 38.3%
2010 13,228,800 8,919,500 22,148,300 40.3
2020 9,753,000 8,367,500 18,120,500 46.2
* Limited to Non-Hispanic AIAN alone veterans. **Numbers rounded to nearest 100; percents based on un-rounded numbers. Source: VetPop2004 Version 1.0, Dept. of Veterans Affairs, Office of the Actuary, Dec. 2004. Projected Decline in the AIAN Veteran Population
• The estimated AIAN veteran population as of September 30, 2005 was 181,300.
• By 2010, the number is projected to decline by less than 3,000.
6 According to Census 2000, about one-half (51 percent) of all AIAN veterans, i.e., AIAN alone or in combination with other race(s), identified themselves as AIAN alone. Only about 6 percent of AIAN veterans, alone or in combination, identified themselves as Hispanic, who can be of any race.
11
• By 2020, however, the number is projected to be nearly 168,000, a decline of 7 percent from 2005. This is in sharp contrast to the projected decline of 26 percent of the overall veteran population in that period.
• The relatively slower rate of decline in the number of AIAN veterans can be explained, in part, by increasing proportions of AIAN in the armed forces and the relatively younger age distribution of AIAN veterans compared to veterans in general.
Projected AIAN Veteran Population 65 or Older
• In contrast to the older veteran population in general, the population of older AIAN veterans is projected to increase between 2005 and 2020, from 40,300 to 64,400, an increase of nearly 60 percent. The number of older veterans in general is projected to decline by one-tenth in that period.
• Among both veterans in general and AIAN veterans, the proportion of older veterans is projected to increase. The proportion is smaller, however, for AIAN veterans than veterans in general. In 2010, for example, about one-quarter of AIAN veterans are projected to be 65 or older compared to 40 percent of veterans in general. The difference indicates AIAN veterans are younger than veterans in general in part because of their increasing proportions in recent years in the armed forces.
Socioeconomic Status of AIAN Veterans Such measures as educational attainment, income, home ownership and employment are all indicators of social and economic well-being. They are not the only measures of well-being; alone or in combination they do not capture completely how well off, economically and otherwise, someone is. They are perhaps only partial dimensions of quality of life. They are, nevertheless, telling measures which are important to present, as done in table 4 below:
12
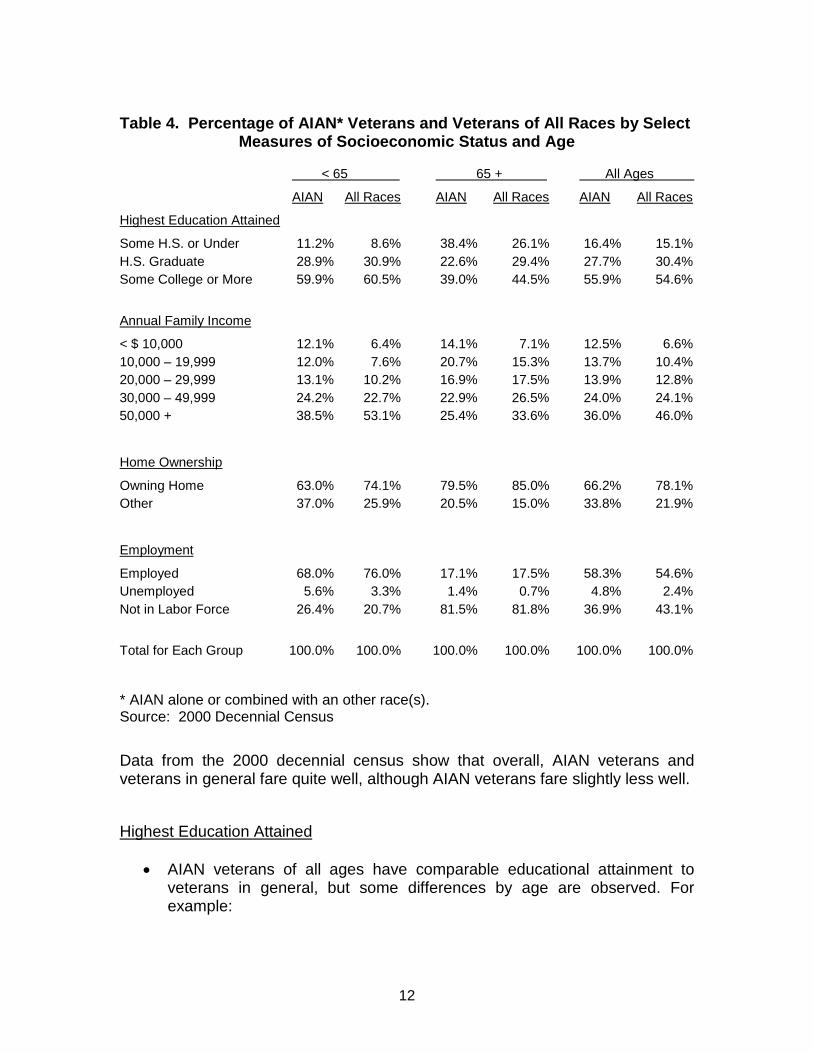
Table 4. Percentage of AIAN* Veterans and Veterans of All Races by Select
Measures of Socioeconomic Status and Age < 65 65 + All Ages
AIAN All Races AIAN All Races AIAN All Races
Highest Education Attained
Some H.S. or Under 11.2% 8.6% 38.4% 26.1% 16.4% 15.1% H.S. Graduate 28.9% 30.9% 22.6% 29.4% 27.7% 30.4% Some College or More 59.9% 60.5% 39.0% 44.5% 55.9% 54.6%
Annual Family Income
< $ 10,000 12.1% 6.4% 14.1% 7.1% 12.5% 6.6% 10,000 – 19,999 12.0% 7.6% 20.7% 15.3% 13.7% 10.4% 20,000 – 29,999 13.1% 10.2% 16.9% 17.5% 13.9% 12.8% 30,000 – 49,999 24.2% 22.7% 22.9% 26.5% 24.0% 24.1% 50,000 + 38.5% 53.1% 25.4% 33.6% 36.0% 46.0%
Home Ownership
Owning Home 63.0% 74.1% 79.5% 85.0% 66.2% 78.1% Other 37.0% 25.9% 20.5% 15.0% 33.8% 21.9%
Employment
Employed 68.0% 76.0% 17.1% 17.5% 58.3% 54.6% Unemployed 5.6% 3.3% 1.4% 0.7% 4.8% 2.4% Not in Labor Force 26.4% 20.7% 81.5% 81.8% 36.9% 43.1%
Total for Each Group 100.0% 100.0% 100.0% 100.0% 100.0% 100.0% * AIAN alone or combined with an other race(s). Source: 2000 Decennial Census Data from the 2000 decennial census show that overall, AIAN veterans and veterans in general fare quite well, although AIAN veterans fare slightly less well. Highest Education Attained
• AIAN veterans of all ages have comparable educational attainment to veterans in general, but some differences by age are observed. For example:
13
o Older AIAN veterans are much more likely not to have completed high school than all veterans of that age (38 v. 26 percent).
o Compared to older veterans in general, older AIAN veterans were less likely to have completed high school (23 v. 29 percent) or have at least some college (39 v. 45 percent).
• Overall, younger veterans, AIAN and veterans in general, have higher educational attainment than older veterans.
Annual Family Income
• AIAN veterans in general are more likely to have family incomes in the ranges below 30,000 dollars and less likely in the range of 50,000 dollars or more than veterans of all races.
• The proportion of AIAN veterans with less than 10,000 dollars of household income is about twice the proportion of veterans in general, although the proportion is fairly small (13 and 7 percent, respectively).
• Among veterans under age 65, 39 percent of AIAN veterans and 53 percent of veterans in general had incomes of 50,000 dollars or more.
• Veterans 65 or older in general had lower income than their younger counterparts among both AIAN veterans and veterans of all races.
Home Ownership
• A solid majority of veterans own their own homes, although AIAN veterans are less likely to than veterans in general (66 percent v. 78 percent, respectively).
• Veterans 65 or older are more likely to own their own homes than those under 65, both among AIAN and veterans of all races. Sixty-three percent of AIAN veterans under 65 own homes, compared to 74 percent of veterans in general of that age.
Employment
• Among veterans of all ages, nearly 60 percent of AIAN veterans and 55 percent of veterans of all races were employed.
• Among those under 65, who are more likely to be in the labor force than those 65 or over, 68 percent of AIAN veterans and 76 percent of veterans of all races were employed. About 6 percent of AIAN veterans under 65 were unemployed compared to 3 percent of veterans in general of that age.
14
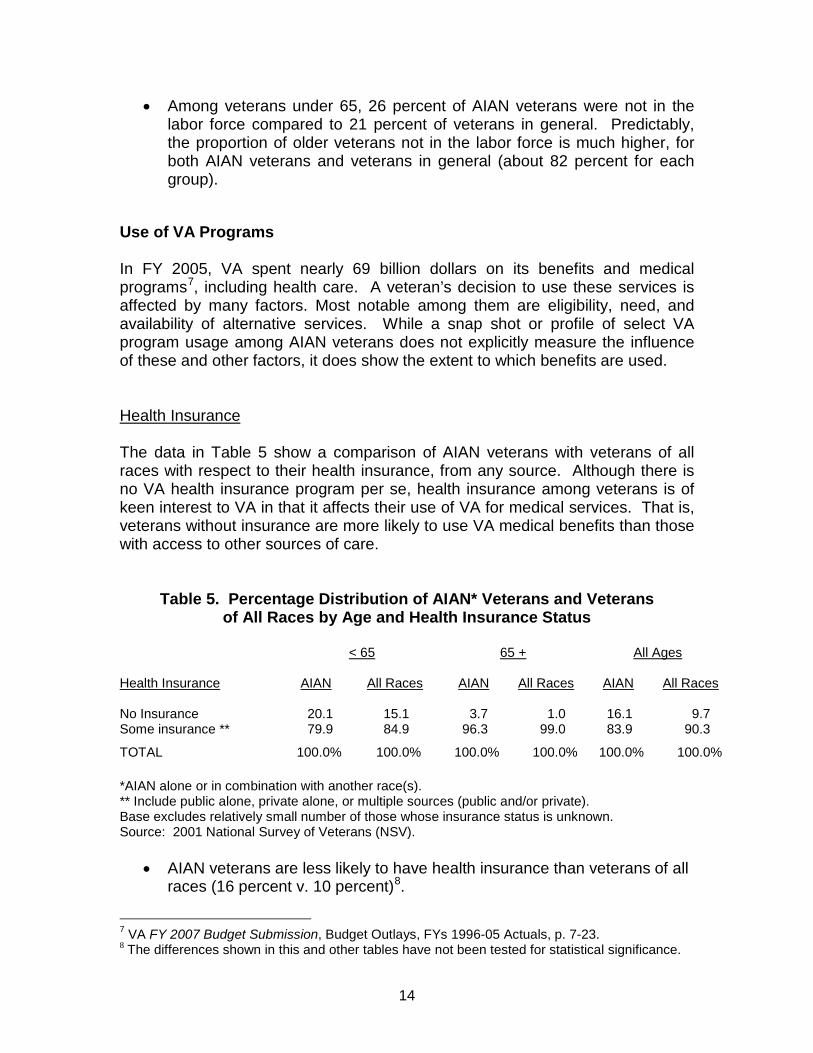
• Among veterans under 65, 26 percent of AIAN veterans were not in the labor force compared to 21 percent of veterans in general. Predictably, the proportion of older veterans not in the labor force is much higher, for both AIAN veterans and veterans in general (about 82 percent for each group).
Use of VA Programs In FY 2005, VA spent nearly 69 billion dollars on its benefits and medical programs7
, including health care. A veteran’s decision to use these services is affected by many factors. Most notable among them are eligibility, need, and availability of alternative services. While a snap shot or profile of select VA program usage among AIAN veterans does not explicitly measure the influence of these and other factors, it does show the extent to which benefits are used.
Health Insurance The data in Table 5 show a comparison of AIAN veterans with veterans of all races with respect to their health insurance, from any source. Although there is no VA health insurance program per se, health insurance among veterans is of keen interest to VA in that it affects their use of VA for medical services. That is, veterans without insurance are more likely to use VA medical benefits than those with access to other sources of care.
Table 5. Percentage Distribution of AIAN* Veterans and Veterans of All Races by Age and Health Insurance Status
< 65 65 + All Ages Health Insurance AIAN All Races AIAN All Races AIAN All Races No Insurance 20.1 15.1 3.7 1.0 16.1 9.7 Some insurance ** 79.9 84.9 96.3 99.0 83.9 90.3
TOTAL 100.0% 100.0% 100.0% 100.0% 100.0% 100.0% *AIAN alone or in combination with another race(s). ** Include public alone, private alone, or multiple sources (public and/or private). Base excludes relatively small number of those whose insurance status is unknown. Source: 2001 National Survey of Veterans (NSV).
• AIAN veterans are less likely to have health insurance than veterans of all races (16 percent v. 10 percent)8
7 VA FY 2007 Budget Submission, Budget Outlays, FYs 1996-05 Actuals, p. 7-23.
.
8 The differences shown in this and other tables have not been tested for statistical significance.
15
• Among AIAN veterans under 65, 20 percent reported no insurance compared to 15 percent of veterans of all ages.
• Both AIAN veterans and veterans of all races over 65 are much more likely to have insurance than their younger counterparts. This, in large measure, reflects Medicare eligibility at age 65.
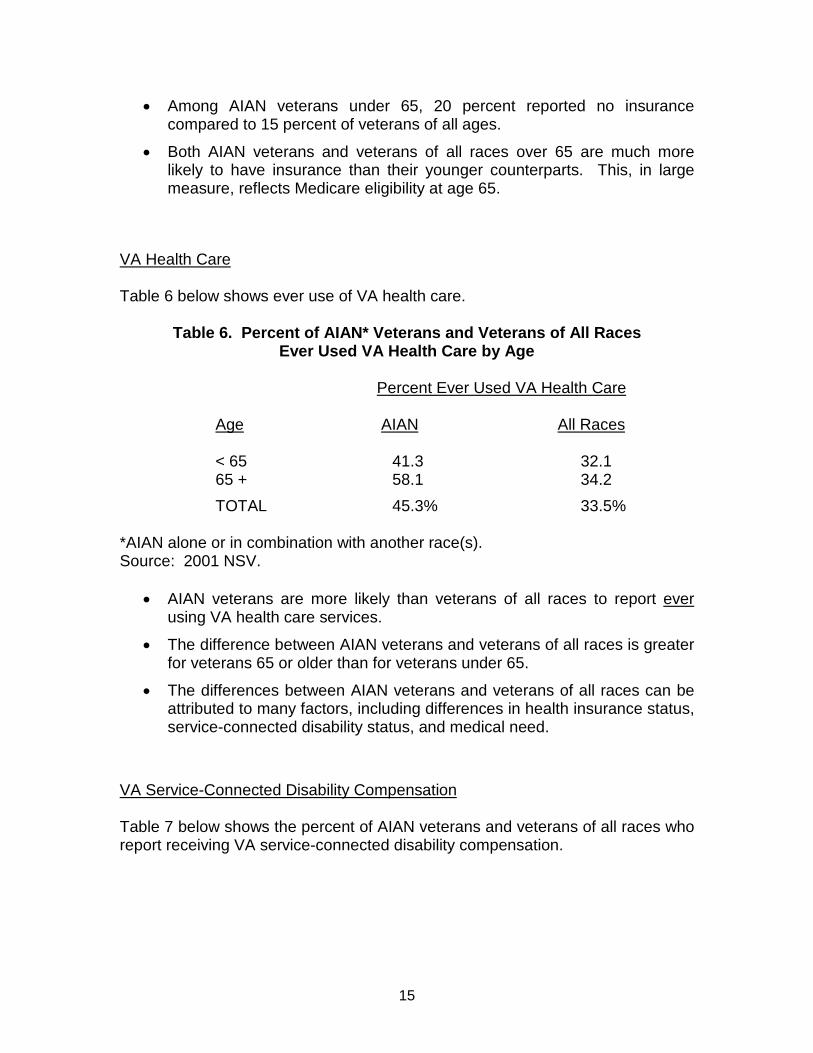
VA Health Care Table 6 below shows ever use of VA health care.
Table 6. Percent of AIAN* Veterans and Veterans of All Races Ever Used VA Health Care by Age
Percent Ever Used VA Health Care Age AIAN All Races < 65 41.3 32.1 65 + 58.1 34.2 TOTAL 45.3% 33.5%
*AIAN alone or in combination with another race(s). Source: 2001 NSV.
• AIAN veterans are more likely than veterans of all races to report ever using VA health care services.
• The difference between AIAN veterans and veterans of all races is greater for veterans 65 or older than for veterans under 65.
• The differences between AIAN veterans and veterans of all races can be attributed to many factors, including differences in health insurance status, service-connected disability status, and medical need.
VA Service-Connected Disability Compensation Table 7 below shows the percent of AIAN veterans and veterans of all races who report receiving VA service-connected disability compensation.
16
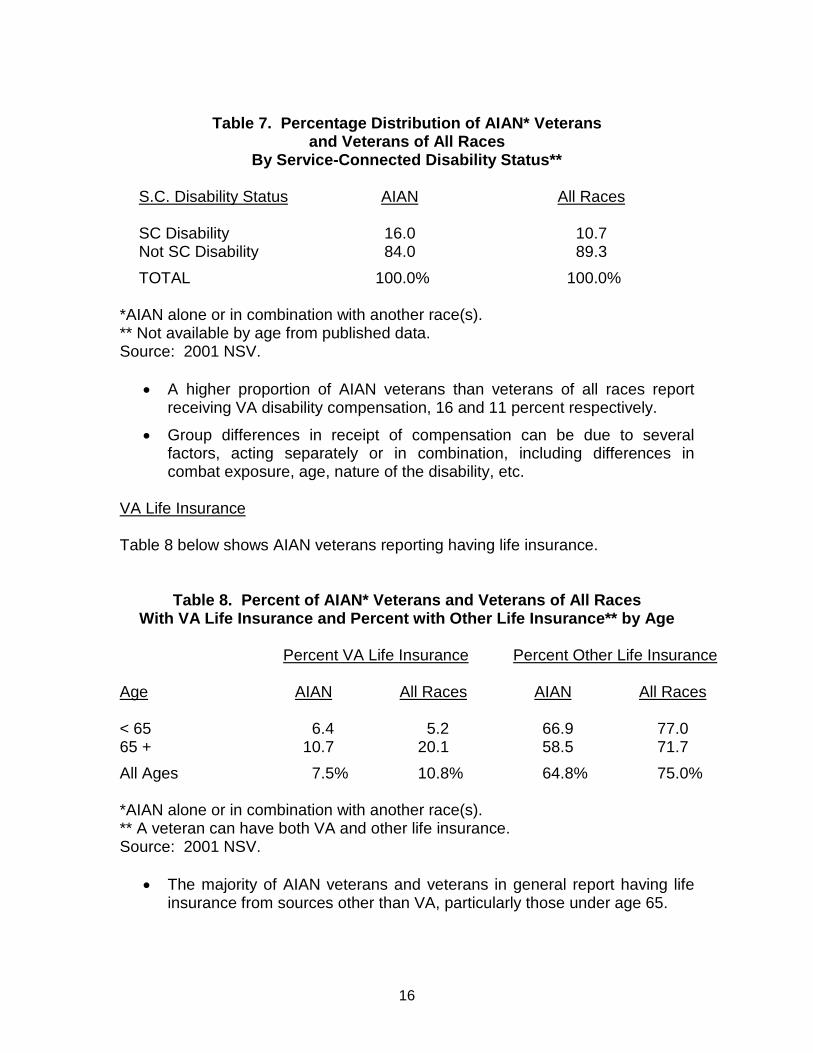
Table 7. Percentage Distribution of AIAN* Veterans
and Veterans of All Races By Service-Connected Disability Status**
S.C. Disability Status AIAN All Races SC Disability 16.0 10.7 Not SC Disability 84.0 89.3 TOTAL 100.0% 100.0%
*AIAN alone or in combination with another race(s). ** Not available by age from published data. Source: 2001 NSV.
• A higher proportion of AIAN veterans than veterans of all races report receiving VA disability compensation, 16 and 11 percent respectively.
• Group differences in receipt of compensation can be due to several factors, acting separately or in combination, including differences in combat exposure, age, nature of the disability, etc.
VA Life Insurance Table 8 below shows AIAN veterans reporting having life insurance.
Table 8. Percent of AIAN* Veterans and Veterans of All Races With VA Life Insurance and Percent with Other Life Insurance** by Age
Percent VA Life Insurance Percent Other Life Insurance Age AIAN All Races AIAN All Races < 65 6.4 5.2 66.9 77.0 65 + 10.7 20.1 58.5 71.7 All Ages 7.5% 10.8% 64.8% 75.0% *AIAN alone or in combination with another race(s). ** A veteran can have both VA and other life insurance. Source: 2001 NSV.
• The majority of AIAN veterans and veterans in general report having life insurance from sources other than VA, particularly those under age 65.
17
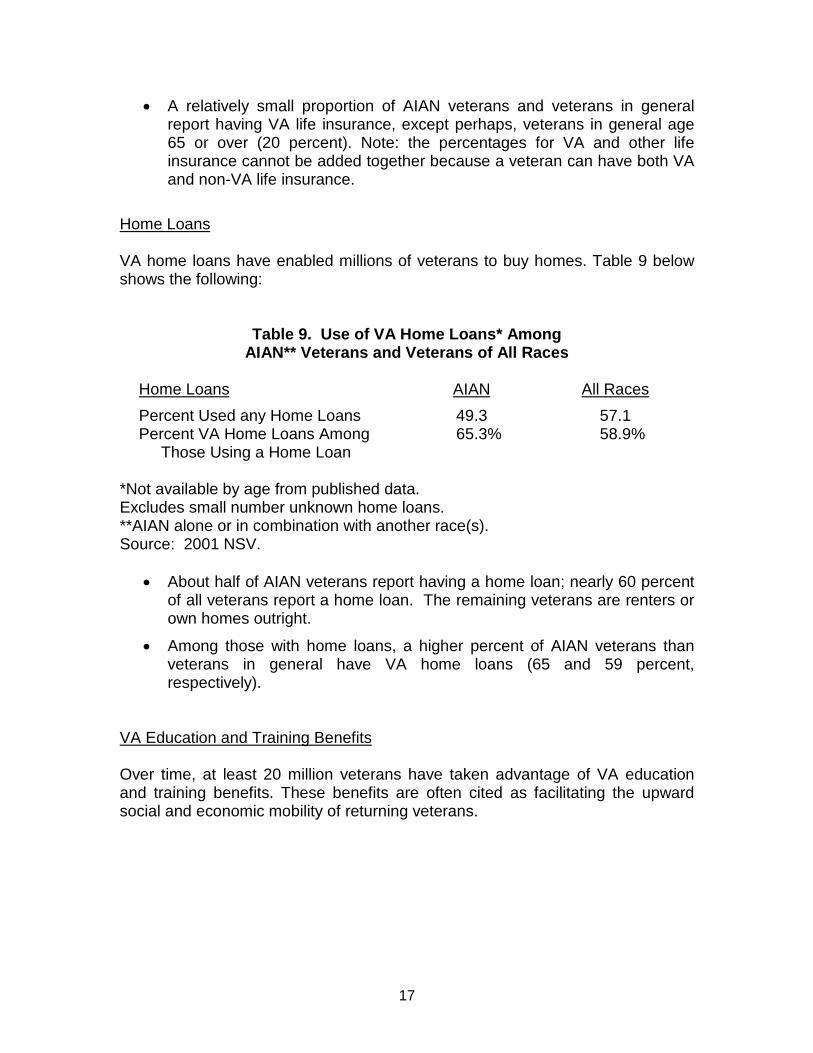
• A relatively small proportion of AIAN veterans and veterans in general report having VA life insurance, except perhaps, veterans in general age 65 or over (20 percent). Note: the percentages for VA and other life insurance cannot be added together because a veteran can have both VA and non-VA life insurance.
Home Loans VA home loans have enabled millions of veterans to buy homes. Table 9 below shows the following:
Table 9. Use of VA Home Loans* Among
AIAN** Veterans and Veterans of All Races
Home Loans AIAN All Races Percent Used any Home Loans 49.3 57.1 Percent VA Home Loans Among Those Using a Home Loan
65.3% 58.9%
*Not available by age from published data. Excludes small number unknown home loans. **AIAN alone or in combination with another race(s). Source: 2001 NSV.
• About half of AIAN veterans report having a home loan; nearly 60 percent
of all veterans report a home loan. The remaining veterans are renters or own homes outright.
• Among those with home loans, a higher percent of AIAN veterans than veterans in general have VA home loans (65 and 59 percent, respectively).
VA Education and Training Benefits Over time, at least 20 million veterans have taken advantage of VA education and training benefits. These benefits are often cited as facilitating the upward social and economic mobility of returning veterans.
18
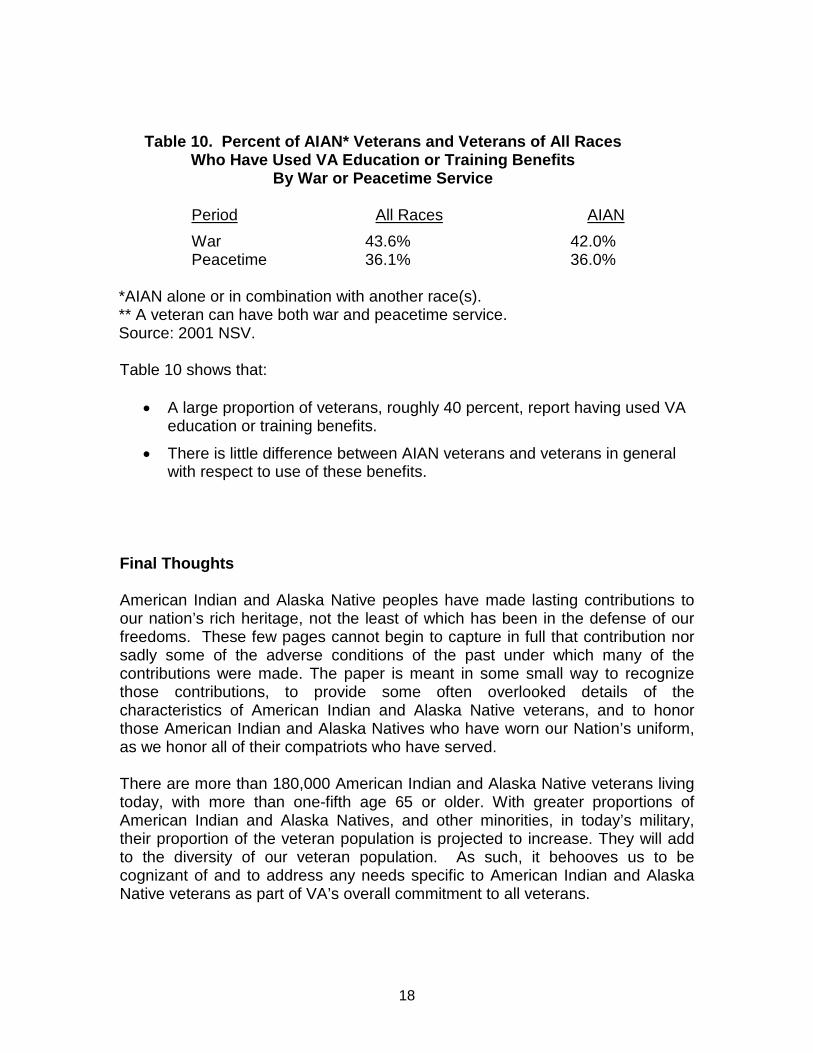
Table 10. Percent of AIAN* Veterans and Veterans of All Races Who Have Used VA Education or Training Benefits
By War or Peacetime Service
Period All Races AIAN War 43.6% 42.0% Peacetime 36.1% 36.0%
*AIAN alone or in combination with another race(s). ** A veteran can have both war and peacetime service. Source: 2001 NSV. Table 10 shows that:
• A large proportion of veterans, roughly 40 percent, report having used VA education or training benefits.
• There is little difference between AIAN veterans and veterans in general with respect to use of these benefits.
Final Thoughts American Indian and Alaska Native peoples have made lasting contributions to our nation’s rich heritage, not the least of which has been in the defense of our freedoms. These few pages cannot begin to capture in full that contribution nor sadly some of the adverse conditions of the past under which many of the contributions were made. The paper is meant in some small way to recognize those contributions, to provide some often overlooked details of the characteristics of American Indian and Alaska Native veterans, and to honor those American Indian and Alaska Natives who have worn our Nation’s uniform, as we honor all of their compatriots who have served. There are more than 180,000 American Indian and Alaska Native veterans living today, with more than one-fifth age 65 or older. With greater proportions of American Indian and Alaska Natives, and other minorities, in today’s military, their proportion of the veteran population is projected to increase. They will add to the diversity of our veteran population. As such, it behooves us to be cognizant of and to address any needs specific to American Indian and Alaska Native veterans as part of VA’s overall commitment to all veterans.
19
Appendix Table 1
AIAN Veterans and Veterans of All Races by Age and Census Region: Census 2000
Number Number Percent of Percent Number Percent of AIAN Percent of of AIAN AIAN Vets Total Total of All 65+ of All 65+ Region Vets AIAN Vets Vets 65+ 65+ Veterans Veterans Veterans Veterans
Midwest 71,536 18.7% 12,494 17.2% 6,096,476 23.1% 2,259,615 23.4%
Northeast 33,123 8.6% 6,883 9.5% 4,642,102 17.6% 1,959,561 20.3%
South 136,399 35.6% 26,201 36.1% 9,941,610 37.7% 3,445,741 35.7%
West 142,070 37.1% 27,091 37.3% 5,723,515 21.7% 1,998,592 20.7%
Total 383,128 100.0% 72,669 100.0% 26,403,703 100.0% 9,663,509 100.0%
Source: Bureau of the Census, Census 2000.
20
Appendix Table 2 AIAN Veterans and Veterans of All Races by Age and State: Census 2000
Number Number Percent of Percent Number Percent of AIAN Percent of of AIAN AIAN Vets Total Total of All 65+ of All 65+ State Vets AIAN Vets Vets 65+ 65+ Veterans Veterans Veterans Veterans Midwest Illinois 7,282 1.9% 1,410 1.9% 1,003,572 3.8% 390,976 4.0% Indiana 5,646 1.5% 785 1.1% 590,476 2.2% 206,043 2.1% Iowa 1,888 0.5% 261 0.4% 292,020 1.1% 115,676 1.2% Kansas 5,073 1.3% 995 1.4% 267,452 1.0% 98,929 1.0% Michigan 11,559 3.0% 2,021 2.8% 913,573 3.5% 332,493 3.4% Minnesota 6,557 1.7% 1,083 1.5% 464,968 1.8% 168,412 1.7% Missouri 8,167 2.1% 1,645 2.3% 592,271 2.2% 217,451 2.3% Nebraska 1,707 0.4% 309 0.4% 173,189 0.7% 64,094 0.7% North Dakota 2,313 0.6% 379 0.5% 61,365 0.2% 21,959 0.2% Ohio 10,285 2.7% 1,712 2.4% 1,144,007 4.3% 423,226 4.4% South Dakota 4,873 1.3% 855 1.2% 79,370 0.3% 29,623 0.3% Wisconsin 6,186 1.6% 1,039 1.4% 514,213 1.9% 190,733 2.0% Northeast Connecticut 2,599 0.7% 532 0.7% 310,069 1.2% 131,881 1.4% Maine 1,563 0.4% 343 0.5% 154,590 0.6% 55,434 0.6% Massachusetts 3,744 1.0% 735 1.0% 558,933 2.1% 241,452 2.5% New Hampshire 1,135 0.3% 193 0.3% 139,038 0.5% 47,330 0.5% New Jersey 4,231 1.1% 988 1.4% 672,217 2.5% 295,818 3.1% New York 11,477 3.0% 2,473 3.4% 1,361,164 5.2% 577,702 6.0% Pennsylvania 6,687 1.7% 1,373 1.9% 1,280,788 4.9% 544,732 5.6% Rhode Island 890 0.2% 155 0.2% 102,494 0.4% 42,917 0.4% Vermont 797 0.2% 91 0.1% 62,809 0.2% 22,295 0.2% South Alabama 5,563 1.5% 913 1.3% 447,397 1.7% 155,988 1.6% Arkansas 4,587 1.2% 1,069 1.5% 281,714 1.1% 103,024 1.1% Delaware 717 0.2% 133 0.2% 84,289 0.3% 29,923 0.3% D.C. 502 0.1% 147 0.2% 44,484 0.2% 18,150 0.2% Florida 17,730 4.6% 3,306 4.5% 1,875,597 7.1% 823,718 8.5% Georgia 7,392 1.9% 1,081 1.5% 768,675 2.9% 208,291 2.2% Kentucky 3,557 0.9% 700 1.0% 380,618 1.4% 132,179 1.4% Louisiana 4,156 1.1% 768 1.1% 392,486 1.5% 136,904 1.4% Maryland 4,737 1.2% 723 1.0% 524,230 2.0% 170,565 1.8% Mississippi 2,150 0.6% 485 0.7% 249,431 0.9% 88,378 0.9% North Carolina 10,838 2.8% 1,601 2.2% 792,646 3.0% 259,484 2.7% Oklahoma 31,251 8.2% 7,987 11.0% 376,062 1.4% 131,374 1.4% South Carolina 3,270 0.9% 422 0.6% 420,971 1.6% 133,922 1.4% Tennessee 5,840 1.5% 1,080 1.5% 560,141 2.1% 182,859 1.9% Texas 24,401 6.4% 4,481 6.2% 1,754,809 6.6% 567,711 5.9% Virginia 8,045 2.1% 949 1.3% 786,359 3.0% 226,560 2.3% West Virginia 1,663 0.4% 356 0.5% 201,701 0.8% 76,711 0.8% West Alaska 8,005 2.1% 1,439 2.0% 71,552 0.3% 11,867 0.1% Arizona 16,806 4.4% 3,354 4.6% 562,916 2.1% 219,380 2.3% California 52,617 13.7% 10,702 14.7% 2,569,340 9.7% 951,016 9.8% Colorado 8,577 2.2% 1,080 1.5% 446,385 1.7% 131,158 1.4% Hawaii 2,523 0.7% 299 0.4% 120,587 0.5% 40,759 0.4% Idaho 2,632 0.7% 516 0.7% 136,584 0.5% 45,474 0.5% Montana 5,112 1.3% 936 1.3% 108,476 0.4% 37,631 0.4% Nevada 4,429 1.2% 869 1.2% 238,128 0.9% 77,453 0.8% New Mexico 11,929 3.1% 2,579 3.5% 190,718 0.7% 65,463 0.7% Oregon 8,943 2.3% 1,794 2.5% 388,990 1.5% 136,399 1.4% Utah 2,388 0.6% 336 0.5% 161,351 0.6% 60,126 0.6% Washington 16,625 4.3% 2,950 4.1% 670,628 2.5% 203,892 2.1% Wyoming 1,484 0.4% 237 0.3% 57,860 0.2% 17,974 0.2% Grand Total 383,128 100.0% 72,669 100.0% 26,403,703 100.0% 9,663,509 100.0% Source: Bureau of the Census, Census 2000
21
Acknowledgments The authors wish to thank: Mike McLendon, former VA Deputy Assistant Secretary for Policy,
and Steve Meskin, former VA Chief Actuary, for encouraging this work. Jin Kim for programming assistance on select Census 2000 and ACS
data. Janet Somers for assistance in creating the tables, maps, and figures.
Henry Caplan for providing VA budget statistics.
Cathy Tomczak for facilitating the inclusion of DOD data on active duty
military. The author cited immediately below assumes sole responsibility for any remaining shortcomings of this paper: Robert E. Klein, Ph.D. For more information, please contact Michael R. Wells at 202-273-5106, or [email protected]