Embed Size (px)
Citation preview
U.S. DEPARTMENT OF THE INTERIORU.S. GEOLOGICAL SURVEY
Thickness and geometry ofCenozoic deposits inCalifornia Wash area,Nevada, based on gravityand seismic-reflection databy V.E. Langenheim1, J.J. Miller2, W.R. Page2, and J.A. Grow2
Open-File Report 01-393
2001
Prepared in cooperation with the National Park Service
This report is preliminary and has not been reviewed for conformity withU.S. Geological Survey editorial standards or with the North AmericanStratigraphic Code. Any use of trade, firm, or product names is fordescriptive purposes only and does not imply endorsement by the U.S.Government.
U.S. DEPARTMENT OF THE INTERIORU.S. GEOLOGICAL SURVEY
1Menlo Park, California2Denver, Colorado, Nevada
2
TABLE OF CONTENTS
Abstract ....................................................................................................................3Introduction..............................................................................................................3Acknowledgments....................................................................................................3Geologic Setting.......................................................................................................3Drill Hole Data and Physical Properties ..................................................................5Gravity and Aeromagnetic Data ..............................................................................6Seismic-Reflection Data ..........................................................................................7Depth to Basement...................................................................................................9 Method .................................................................................................................9 Results................................................................................................................11Discussion and Recommendations ........................................................................12References..............................................................................................................14
TABLES
Table 1. Sonic velocities and corresponding densities of Cenozoic deposits.........6Table 2. Recording parameters ...............................................................................8Table 3. Density-depth functions..........................................................................11
FIGURES
Figure 1. Topographic map of the region. ............................................................17Figure 2. Geologic map of study area....................................................................18Figure 3. Gravity map of study area .....................................................................19Figure 4. Aeromagnetic map of study area...........................................................20Figure 5. Seismic-reflection and potential-field data along LV-1 ........................21Figure 6. Seismic-reflection and potential-field data along LV-1aext .................22Figure 7. Seismic-reflection and potential-field data along LV-3 ........................23Figure 8. Schematic diagram of gravity separation method .................................24Figure 9. Configuration of the basin fill ...............................................................25Figure 10. Interpretation of LV-1 .........................................................................27
3
ABSTRACTGravity and seismic-reflection data provide insights into the subsurface stratigraphy
and structure of the California Wash area of southern Nevada. This area is part of theLower Colorado flow system and stratigraphic and structural data are important inputsinto developing the hydrogeologic framework. These data indicate that the basin beneathCalifornia Wash reaches depths of 2-3 km. The eastern margin of the basin coincideswith a system of young (Quaternary and late Tertiary) faults, although both seismic andgravity data indicate that the major basin-bounding fault is 2-3 km west of the mappedyoung faults. Dry Lake Valley, the adjacent valley to the west, is characterized bythinner basin fill. The basin configuration beneath both California Wash and Dry LakeValleys based on the inversion of gravity data is unconstrained because of the lack ofgravity stations north of 36030’. Broad aeromagnetic anomalies beneath pre-Cenozoicbasement in the Muddy Mountains and Arrow Canyon Range reflect Precambrianbasement at depths of ~ 5 km. These rocks are probably barriers to ground-water flow,except where fractured.
INTRODUCTION
At the request of the National Park Service, the U.S. Geological Survey
conducted analysis of gravity and seismic-reflection data in support of hydrogeologic
framework studies of the California Wash area, Nevada (Fig. 1). Gravity data were
inverted for thickness of alluvial deposits using a method developed by Jachens and
Moring (1990). The inversion was constrained by picks on the thickness of the Cenozoic
deposits from three seismic-reflection profiles. Two different models were created to
provide limits on the configuration of the ground-water basin and locate faults within the
basin.
ACKNOWLEDGEMENTS
We wish to thank the National Park Service Water Resources Division (Fort Collins, CO)for supporting this work. We thank Sue Beard and Bob Bohannon (U.S. GeologicalSurvey) for their thoughtful and thought-provoking reviews.
GEOLOGIC SETTING
The mountain ranges in the study area (box in Fig. 1) expose Paleozoic and
Mesozoic sedimentary rocks (Fig. 2). These rocks are presumably underlain by
Precambrian crystalline basement rocks, such as those exposed in the Virgin Mountains,
4
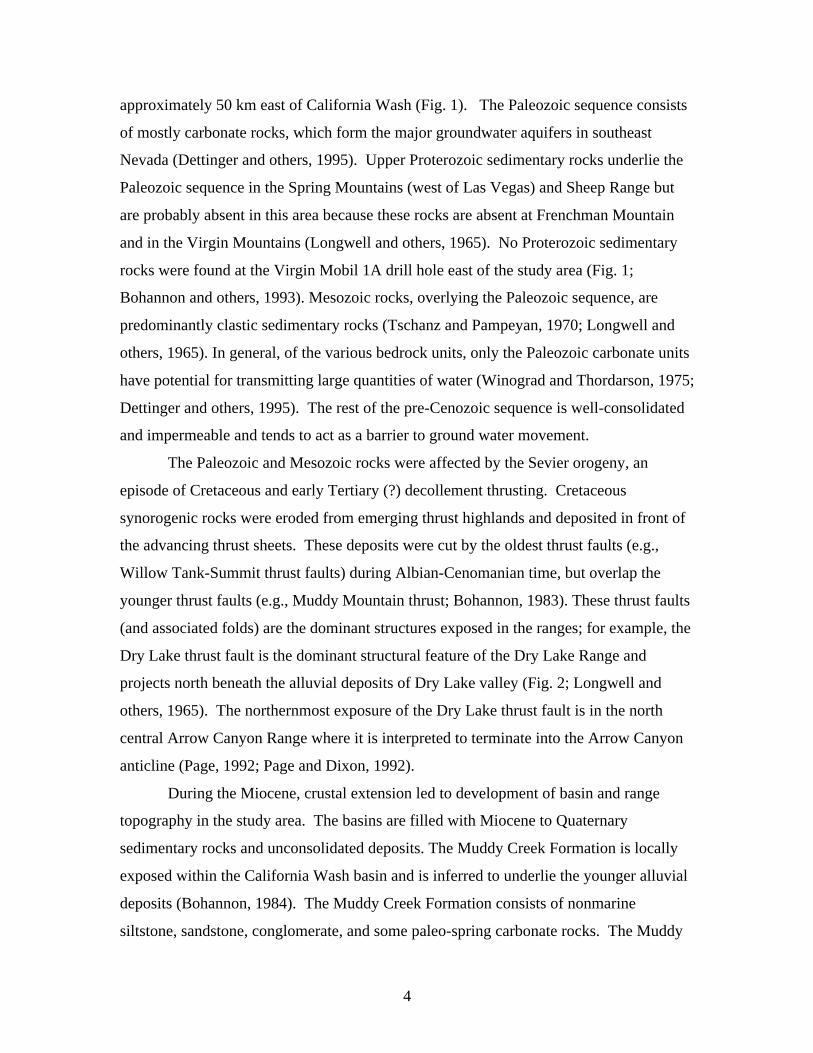
approximately 50 km east of California Wash (Fig. 1). The Paleozoic sequence consists
of mostly carbonate rocks, which form the major groundwater aquifers in southeast
Nevada (Dettinger and others, 1995). Upper Proterozoic sedimentary rocks underlie the
Paleozoic sequence in the Spring Mountains (west of Las Vegas) and Sheep Range but
are probably absent in this area because these rocks are absent at Frenchman Mountain
and in the Virgin Mountains (Longwell and others, 1965). No Proterozoic sedimentary
rocks were found at the Virgin Mobil 1A drill hole east of the study area (Fig. 1;
Bohannon and others, 1993). Mesozoic rocks, overlying the Paleozoic sequence, are
predominantly clastic sedimentary rocks (Tschanz and Pampeyan, 1970; Longwell and
others, 1965). In general, of the various bedrock units, only the Paleozoic carbonate units
have potential for transmitting large quantities of water (Winograd and Thordarson, 1975;
Dettinger and others, 1995). The rest of the pre-Cenozoic sequence is well-consolidated
and impermeable and tends to act as a barrier to ground water movement.
The Paleozoic and Mesozoic rocks were affected by the Sevier orogeny, an
episode of Cretaceous and early Tertiary (?) decollement thrusting. Cretaceous
synorogenic rocks were eroded from emerging thrust highlands and deposited in front of
the advancing thrust sheets. These deposits were cut by the oldest thrust faults (e.g.,
Willow Tank-Summit thrust faults) during Albian-Cenomanian time, but overlap the
younger thrust faults (e.g., Muddy Mountain thrust; Bohannon, 1983). These thrust faults
(and associated folds) are the dominant structures exposed in the ranges; for example, the
Dry Lake thrust fault is the dominant structural feature of the Dry Lake Range and
projects north beneath the alluvial deposits of Dry Lake valley (Fig. 2; Longwell and
others, 1965). The northernmost exposure of the Dry Lake thrust fault is in the north
central Arrow Canyon Range where it is interpreted to terminate into the Arrow Canyon
anticline (Page, 1992; Page and Dixon, 1992).
During the Miocene, crustal extension led to development of basin and range
topography in the study area. The basins are filled with Miocene to Quaternary
sedimentary rocks and unconsolidated deposits. The Muddy Creek Formation is locally
exposed within the California Wash basin and is inferred to underlie the younger alluvial
deposits (Bohannon, 1984). The Muddy Creek Formation consists of nonmarine
siltstone, sandstone, conglomerate, and some paleo-spring carbonate rocks. The Muddy
5
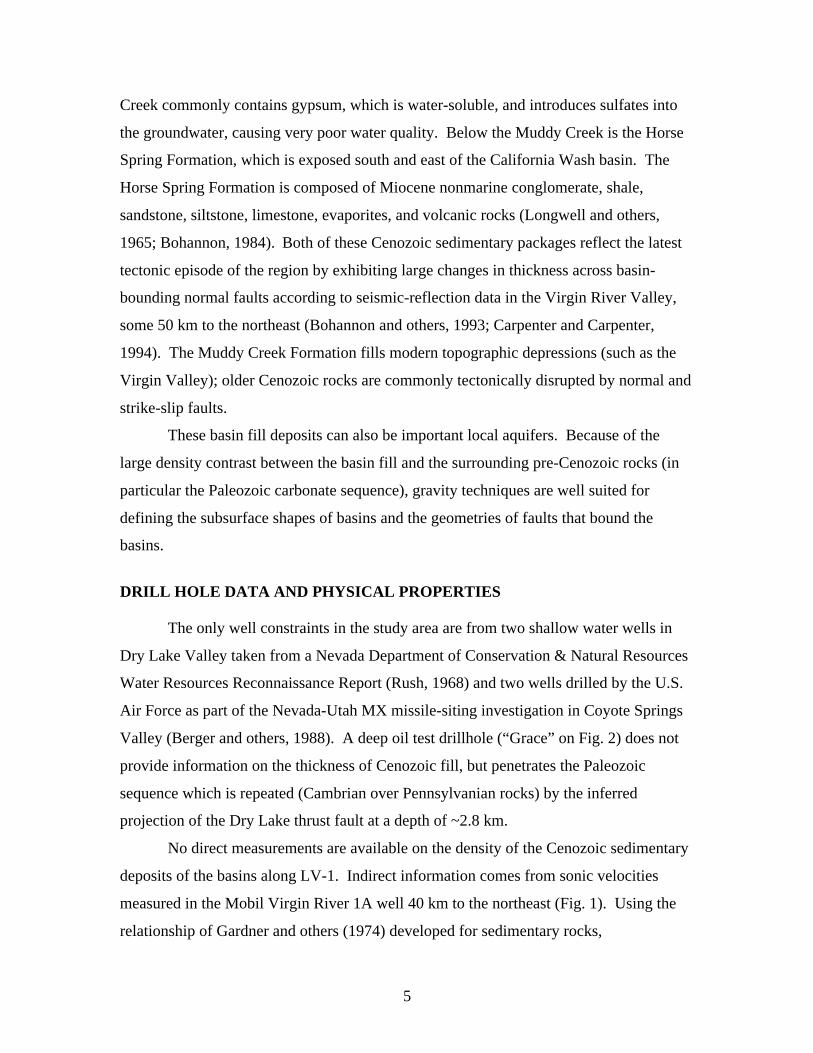
Creek commonly contains gypsum, which is water-soluble, and introduces sulfates into
the groundwater, causing very poor water quality. Below the Muddy Creek is the Horse
Spring Formation, which is exposed south and east of the California Wash basin. The
Horse Spring Formation is composed of Miocene nonmarine conglomerate, shale,
sandstone, siltstone, limestone, evaporites, and volcanic rocks (Longwell and others,
1965; Bohannon, 1984). Both of these Cenozoic sedimentary packages reflect the latest
tectonic episode of the region by exhibiting large changes in thickness across basin-
bounding normal faults according to seismic-reflection data in the Virgin River Valley,
some 50 km to the northeast (Bohannon and others, 1993; Carpenter and Carpenter,
1994). The Muddy Creek Formation fills modern topographic depressions (such as the
Virgin Valley); older Cenozoic rocks are commonly tectonically disrupted by normal and
strike-slip faults.
These basin fill deposits can also be important local aquifers. Because of the
large density contrast between the basin fill and the surrounding pre-Cenozoic rocks (in
particular the Paleozoic carbonate sequence), gravity techniques are well suited for
defining the subsurface shapes of basins and the geometries of faults that bound the
basins.
DRILL HOLE DATA AND PHYSICAL PROPERTIES
The only well constraints in the study area are from two shallow water wells in
Dry Lake Valley taken from a Nevada Department of Conservation & Natural Resources
Water Resources Reconnaissance Report (Rush, 1968) and two wells drilled by the U.S.
Air Force as part of the Nevada-Utah MX missile-siting investigation in Coyote Springs
Valley (Berger and others, 1988). A deep oil test drillhole (“Grace” on Fig. 2) does not
provide information on the thickness of Cenozoic fill, but penetrates the Paleozoic
sequence which is repeated (Cambrian over Pennsylvanian rocks) by the inferred
projection of the Dry Lake thrust fault at a depth of ~2.8 km.
No direct measurements are available on the density of the Cenozoic sedimentary
deposits of the basins along LV-1. Indirect information comes from sonic velocities
measured in the Mobil Virgin River 1A well 40 km to the northeast (Fig. 1). Using the
relationship of Gardner and others (1974) developed for sedimentary rocks,
6
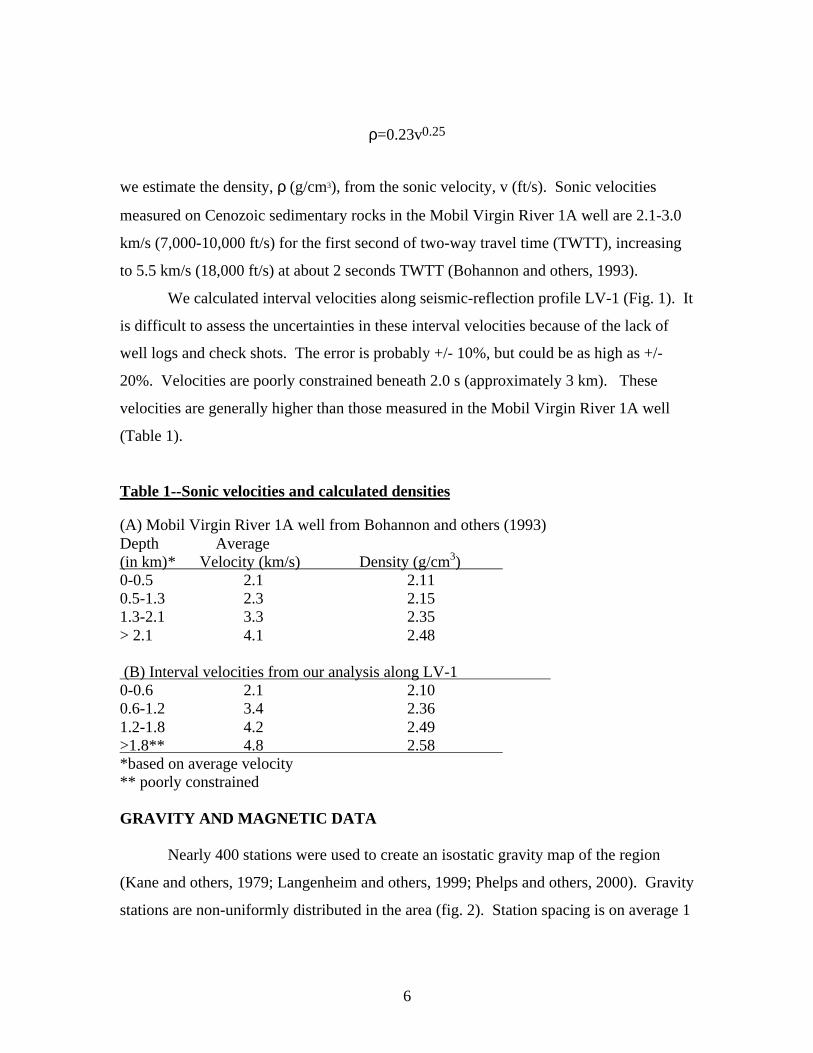
ρ=0.23v0.25
we estimate the density, ρ (g/cm3), from the sonic velocity, v (ft/s). Sonic velocities
measured on Cenozoic sedimentary rocks in the Mobil Virgin River 1A well are 2.1-3.0
km/s (7,000-10,000 ft/s) for the first second of two-way travel time (TWTT), increasing
to 5.5 km/s (18,000 ft/s) at about 2 seconds TWTT (Bohannon and others, 1993).
We calculated interval velocities along seismic-reflection profile LV-1 (Fig. 1). It
is difficult to assess the uncertainties in these interval velocities because of the lack of
well logs and check shots. The error is probably +/- 10%, but could be as high as +/-
20%. Velocities are poorly constrained beneath 2.0 s (approximately 3 km). These
velocities are generally higher than those measured in the Mobil Virgin River 1A well
(Table 1).
Table 1--Sonic velocities and calculated densities
(A) Mobil Virgin River 1A well from Bohannon and others (1993)Depth Average(in km) * Velocity (km/s) Density (g/cm3) 0-0.5 2.1 2.110.5-1.3 2.3 2.151.3-2.1 3.3 2.35> 2.1 4.1 2.48
(B) Interval velocities from our analysis along LV-1 0-0.6 2.1 2.100.6-1.2 3.4 2.361.2-1.8 4.2 2.49>1.8** 4.8 2.58 *based on average velocity** poorly constrained
GRAVITY AND MAGNETIC DATA
Nearly 400 stations were used to create an isostatic gravity map of the region
(Kane and others, 1979; Langenheim and others, 1999; Phelps and others, 2000). Gravity
stations are non-uniformly distributed in the area (fig. 2). Station spacing is on average 1
7
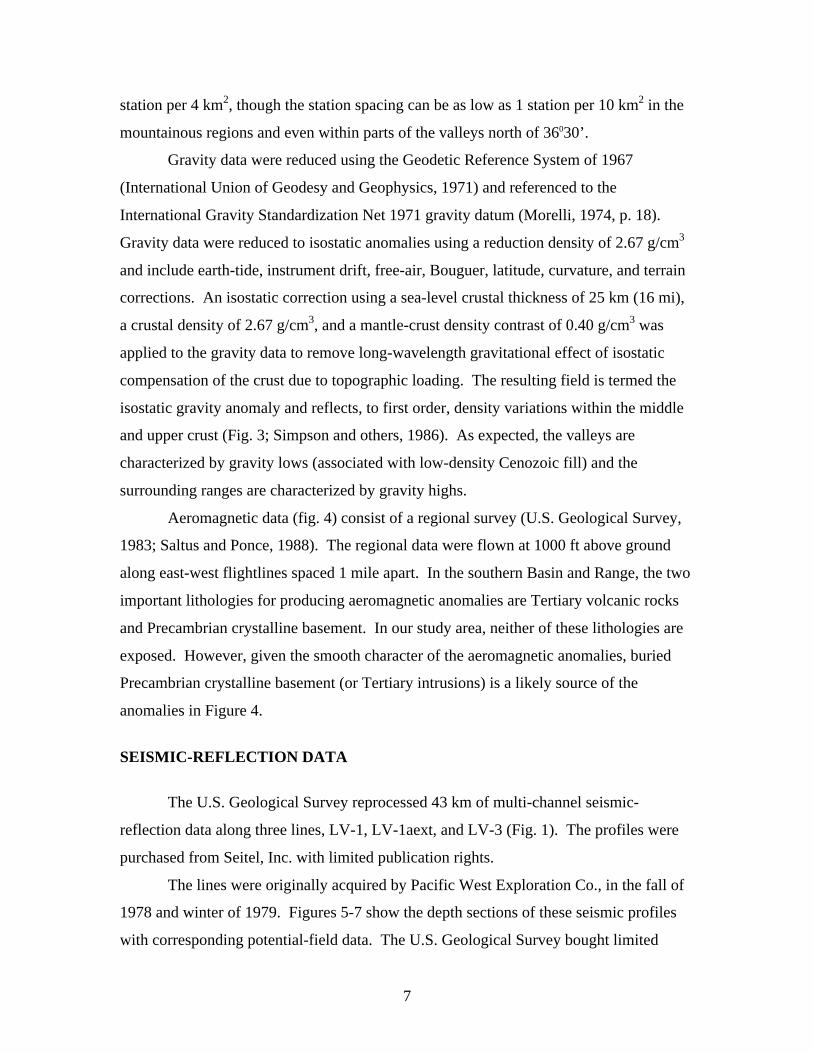
station per 4 km2, though the station spacing can be as low as 1 station per 10 km2 in the
mountainous regions and even within parts of the valleys north of 36030’.
Gravity data were reduced using the Geodetic Reference System of 1967
(International Union of Geodesy and Geophysics, 1971) and referenced to the
International Gravity Standardization Net 1971 gravity datum (Morelli, 1974, p. 18).
Gravity data were reduced to isostatic anomalies using a reduction density of 2.67 g/cm3
and include earth-tide, instrument drift, free-air, Bouguer, latitude, curvature, and terrain
corrections. An isostatic correction using a sea-level crustal thickness of 25 km (16 mi),
a crustal density of 2.67 g/cm3, and a mantle-crust density contrast of 0.40 g/cm3 was
applied to the gravity data to remove long-wavelength gravitational effect of isostatic
compensation of the crust due to topographic loading. The resulting field is termed the
isostatic gravity anomaly and reflects, to first order, density variations within the middle
and upper crust (Fig. 3; Simpson and others, 1986). As expected, the valleys are
characterized by gravity lows (associated with low-density Cenozoic fill) and the
surrounding ranges are characterized by gravity highs.
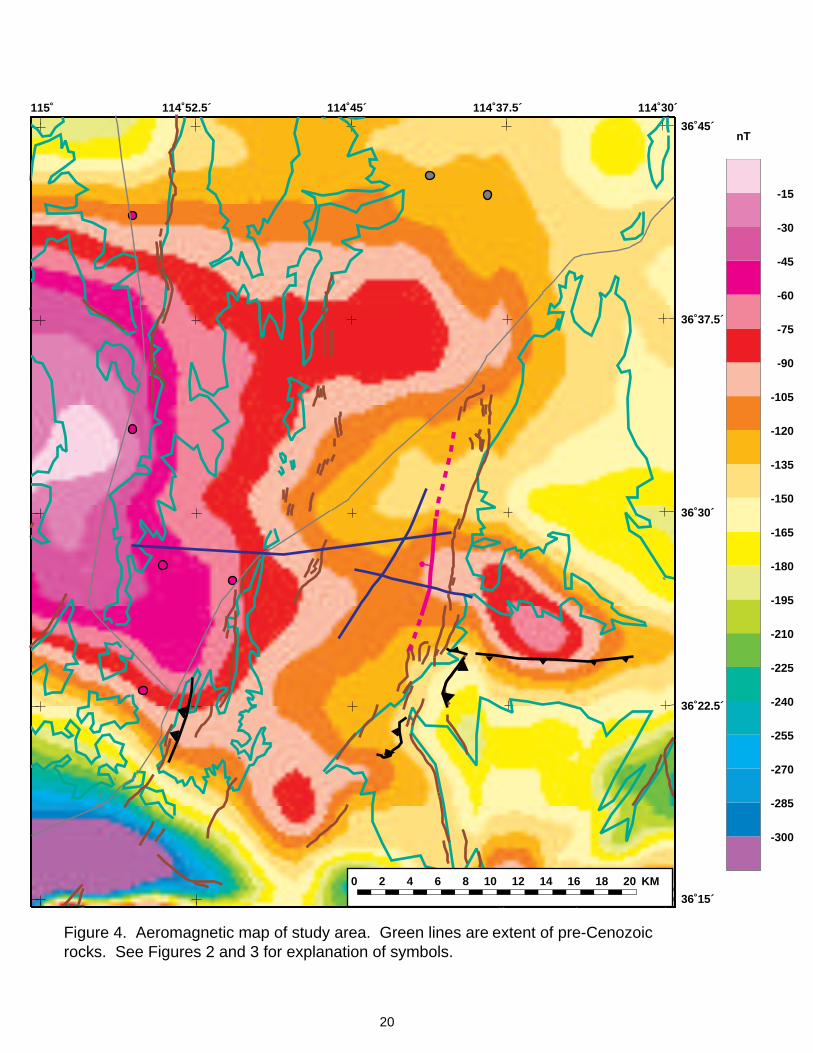
Aeromagnetic data (fig. 4) consist of a regional survey (U.S. Geological Survey,
1983; Saltus and Ponce, 1988). The regional data were flown at 1000 ft above ground
along east-west flightlines spaced 1 mile apart. In the southern Basin and Range, the two
important lithologies for producing aeromagnetic anomalies are Tertiary volcanic rocks
and Precambrian crystalline basement. In our study area, neither of these lithologies are
exposed. However, given the smooth character of the aeromagnetic anomalies, buried
Precambrian crystalline basement (or Tertiary intrusions) is a likely source of the
anomalies in Figure 4.
SEISMIC-REFLECTION DATA
The U.S. Geological Survey reprocessed 43 km of multi-channel seismic-
reflection data along three lines, LV-1, LV-1aext, and LV-3 (Fig. 1). The profiles were
purchased from Seitel, Inc. with limited publication rights.
The lines were originally acquired by Pacific West Exploration Co., in the fall of
1978 and winter of 1979. Figures 5-7 show the depth sections of these seismic profiles
with corresponding potential-field data. The U.S. Geological Survey bought limited
8
publication rights of these seismic-reflection data for three reasons: (1) to obtain
independent data on the thickness of Cenozoic fill as constraints for the gravity inversion,
(2) to calculate the density of the basin fill from seismic velocities (see above section on
drill holes and physical properties), and (3) to image the structure within the basin fill.
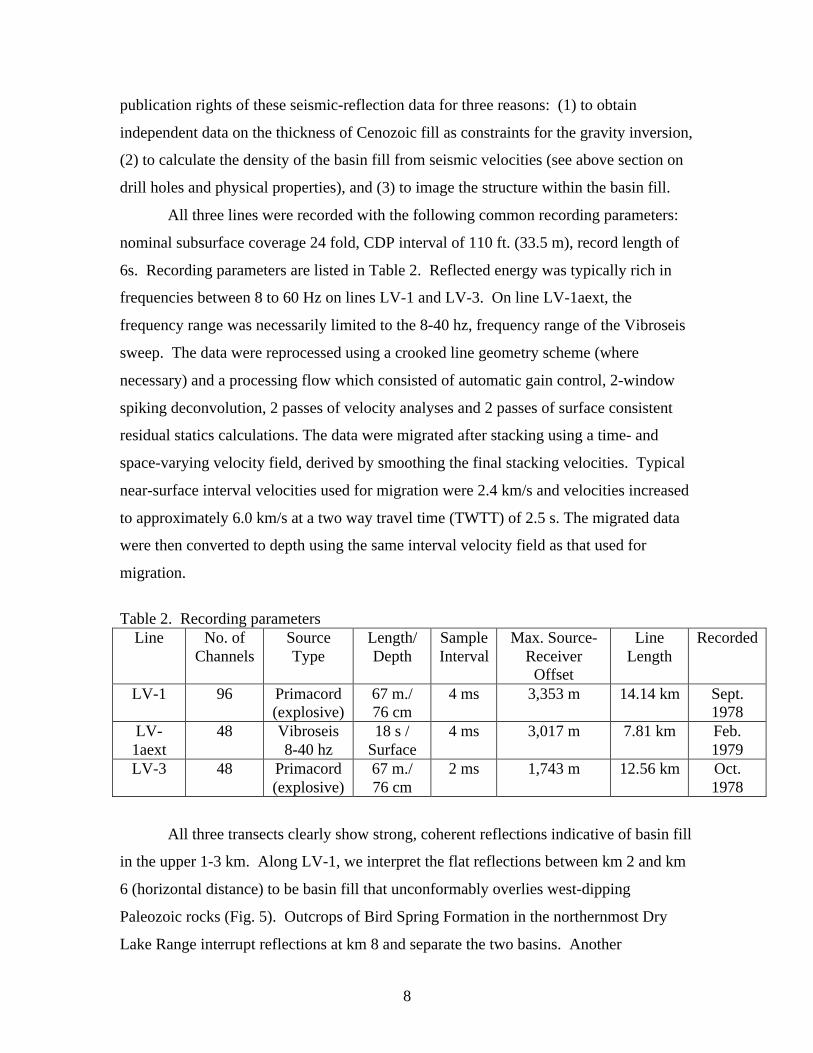
All three lines were recorded with the following common recording parameters:
nominal subsurface coverage 24 fold, CDP interval of 110 ft. (33.5 m), record length of
6s. Recording parameters are listed in Table 2. Reflected energy was typically rich in
frequencies between 8 to 60 Hz on lines LV-1 and LV-3. On line LV-1aext, the
frequency range was necessarily limited to the 8-40 hz, frequency range of the Vibroseis
sweep. The data were reprocessed using a crooked line geometry scheme (where
necessary) and a processing flow which consisted of automatic gain control, 2-window
spiking deconvolution, 2 passes of velocity analyses and 2 passes of surface consistent
residual statics calculations. The data were migrated after stacking using a time- and
space-varying velocity field, derived by smoothing the final stacking velocities. Typical
near-surface interval velocities used for migration were 2.4 km/s and velocities increased
to approximately 6.0 km/s at a two way travel time (TWTT) of 2.5 s. The migrated data
were then converted to depth using the same interval velocity field as that used for
migration.
Table 2. Recording parametersLine No. of
ChannelsSourceType
Length/Depth
SampleInterval
Max. Source-Receiver
Offset
LineLength
Recorded
LV-1 96 Primacord(explosive)
67 m./76 cm
4 ms 3,353 m 14.14 km Sept.1978
LV-1aext
48 Vibroseis8-40 hz
18 s /Surface
4 ms 3,017 m 7.81 km Feb.1979
LV-3 48 Primacord(explosive)
67 m./76 cm
2 ms 1,743 m 12.56 km Oct.1978
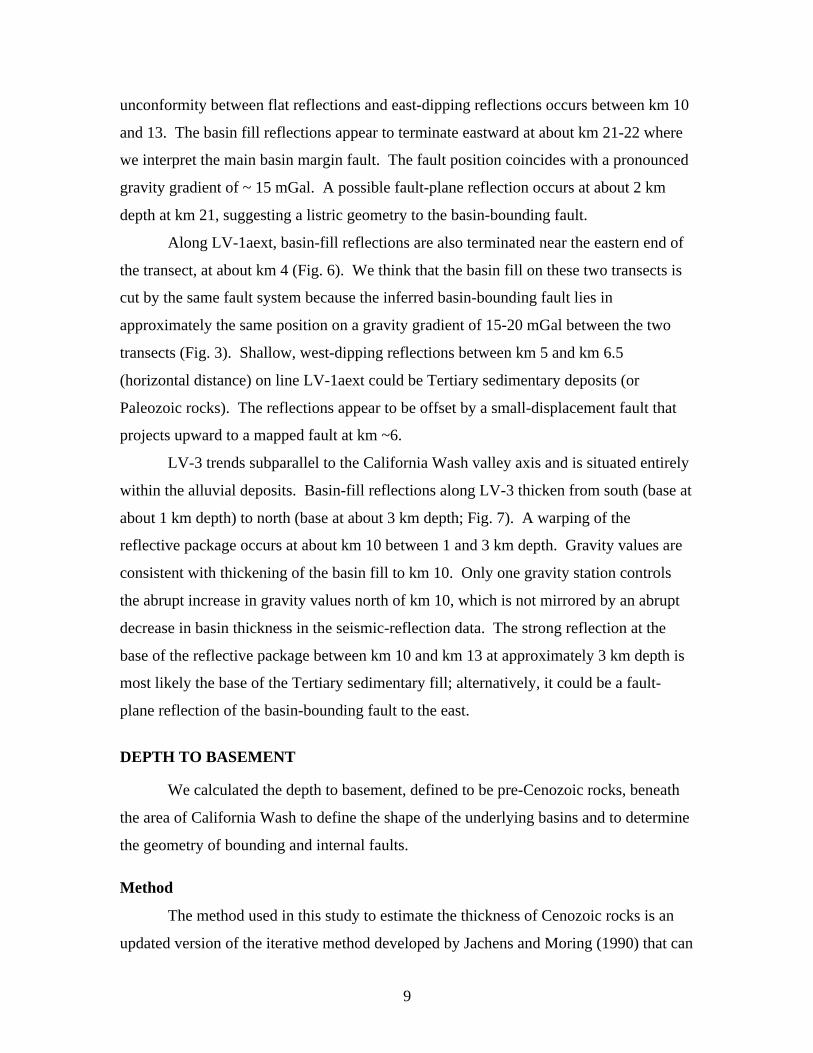
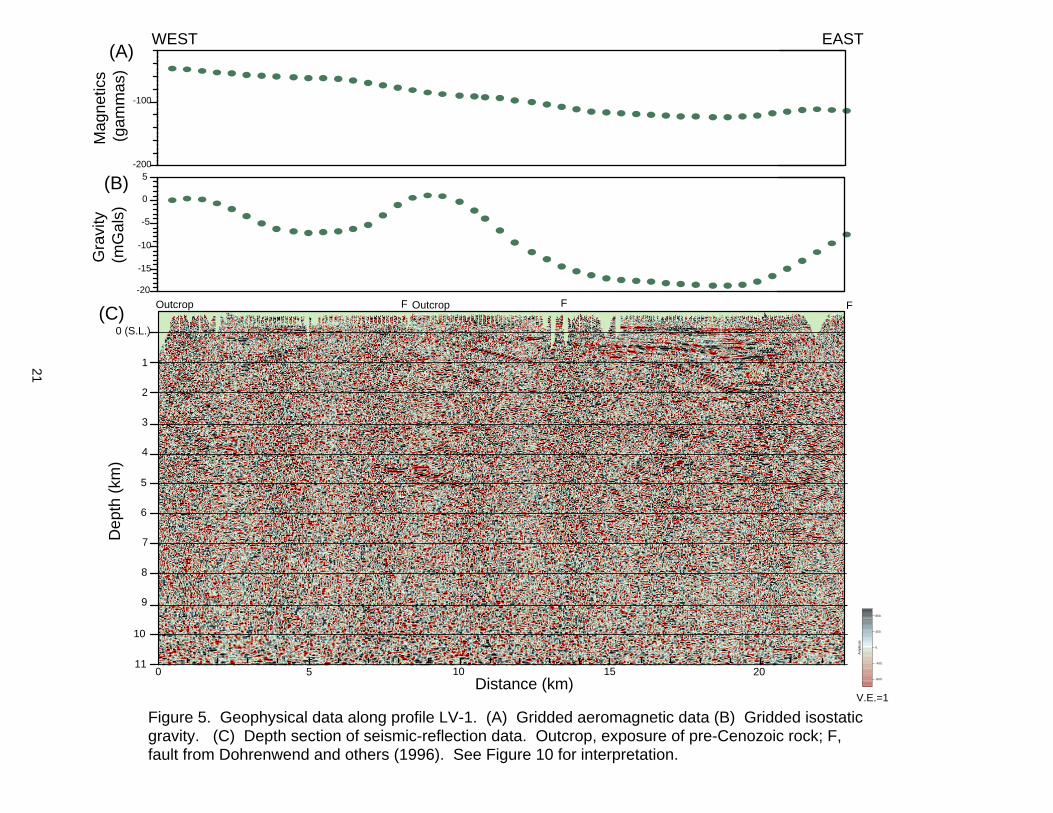
All three transects clearly show strong, coherent reflections indicative of basin fill
in the upper 1-3 km. Along LV-1, we interpret the flat reflections between km 2 and km
6 (horizontal distance) to be basin fill that unconformably overlies west-dipping
Paleozoic rocks (Fig. 5). Outcrops of Bird Spring Formation in the northernmost Dry
Lake Range interrupt reflections at km 8 and separate the two basins. Another
9
unconformity between flat reflections and east-dipping reflections occurs between km 10
and 13. The basin fill reflections appear to terminate eastward at about km 21-22 where
we interpret the main basin margin fault. The fault position coincides with a pronounced
gravity gradient of ~ 15 mGal. A possible fault-plane reflection occurs at about 2 km
depth at km 21, suggesting a listric geometry to the basin-bounding fault.
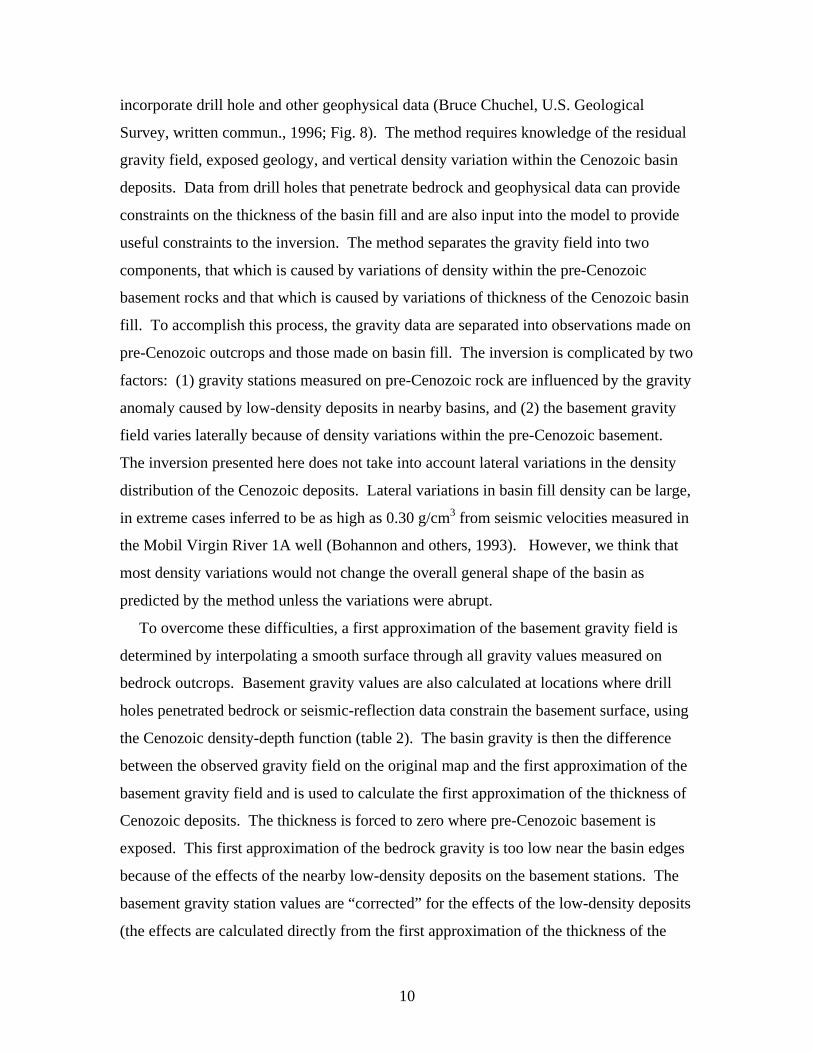
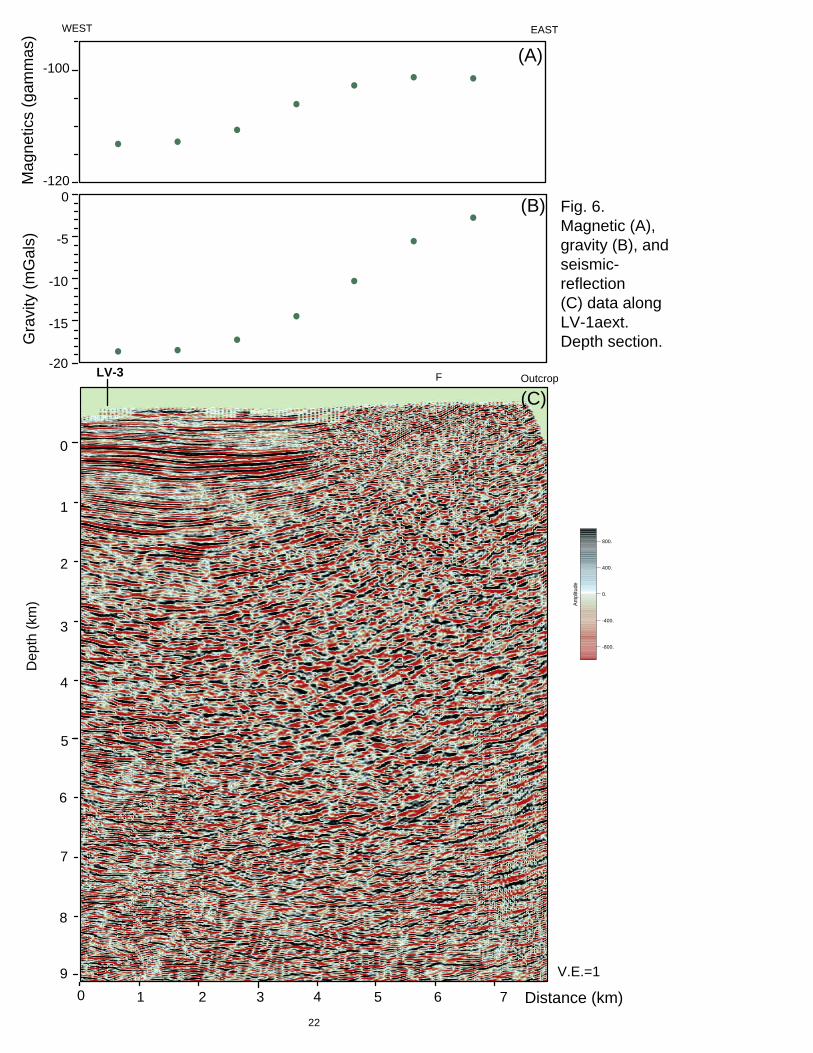
Along LV-1aext, basin-fill reflections are also terminated near the eastern end of
the transect, at about km 4 (Fig. 6). We think that the basin fill on these two transects is
cut by the same fault system because the inferred basin-bounding fault lies in
approximately the same position on a gravity gradient of 15-20 mGal between the two
transects (Fig. 3). Shallow, west-dipping reflections between km 5 and km 6.5
(horizontal distance) on line LV-1aext could be Tertiary sedimentary deposits (or
Paleozoic rocks). The reflections appear to be offset by a small-displacement fault that
projects upward to a mapped fault at km ~6.
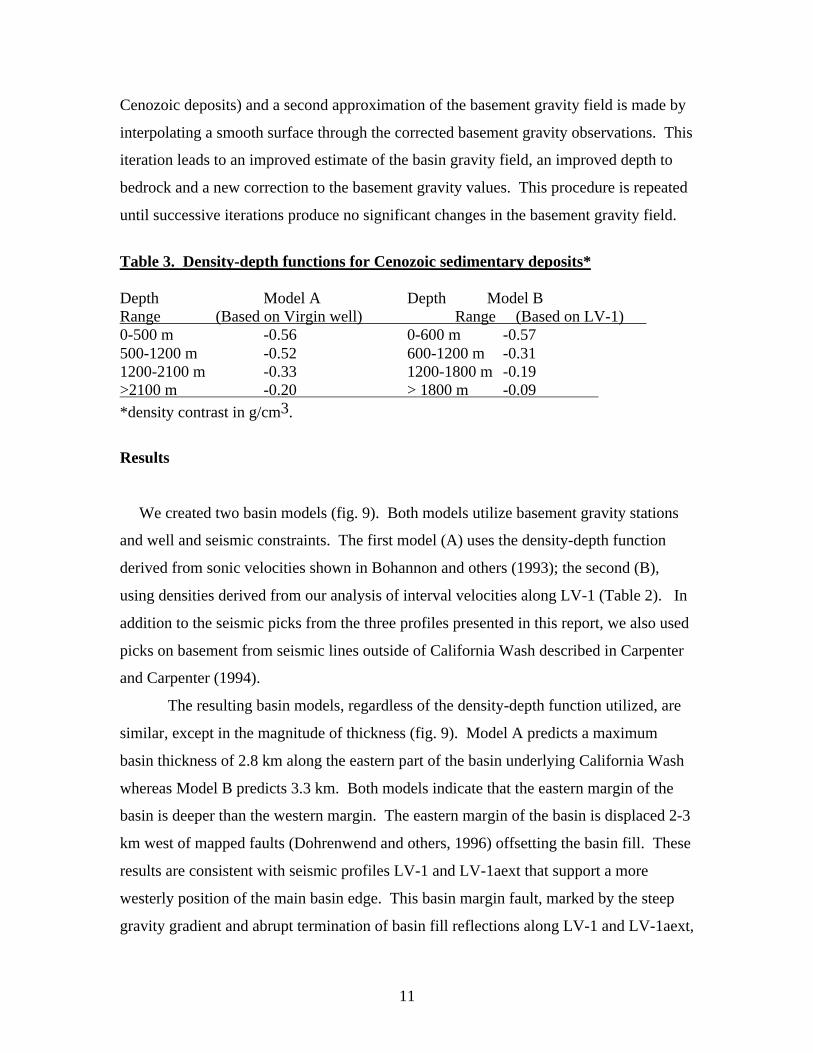
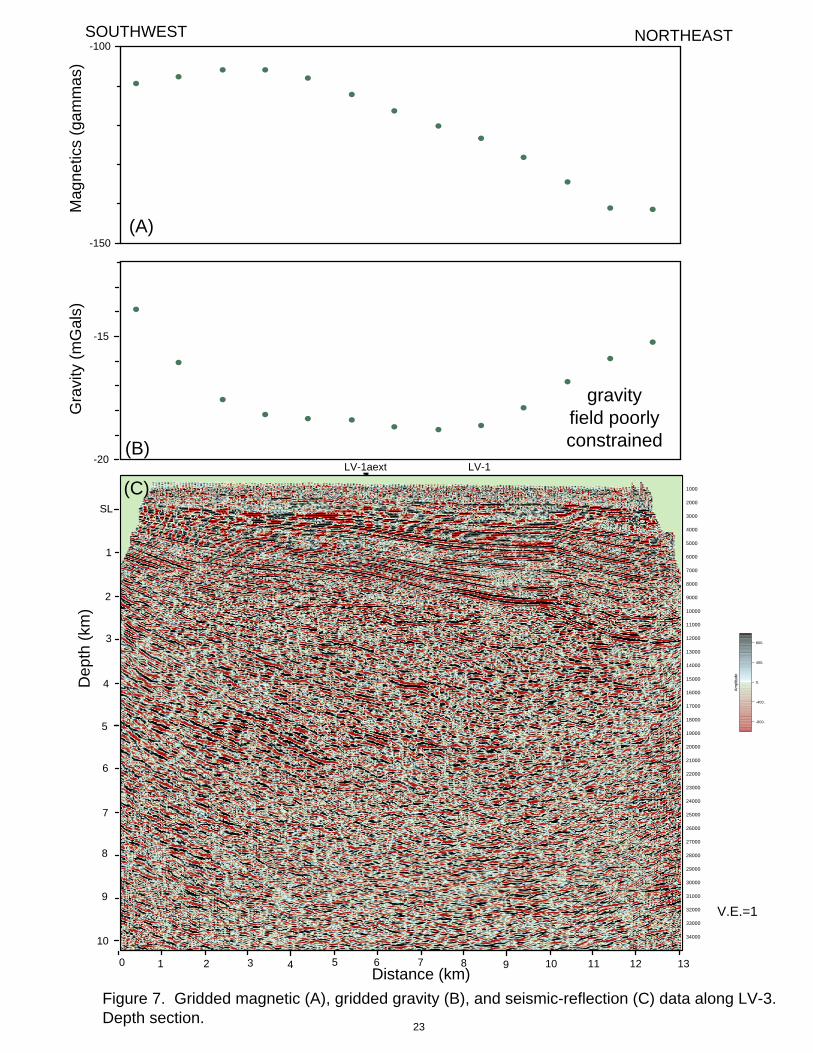
LV-3 trends subparallel to the California Wash valley axis and is situated entirely
within the alluvial deposits. Basin-fill reflections along LV-3 thicken from south (base at
about 1 km depth) to north (base at about 3 km depth; Fig. 7). A warping of the
reflective package occurs at about km 10 between 1 and 3 km depth. Gravity values are
consistent with thickening of the basin fill to km 10. Only one gravity station controls
the abrupt increase in gravity values north of km 10, which is not mirrored by an abrupt
decrease in basin thickness in the seismic-reflection data. The strong reflection at the
base of the reflective package between km 10 and km 13 at approximately 3 km depth is
most likely the base of the Tertiary sedimentary fill; alternatively, it could be a fault-
plane reflection of the basin-bounding fault to the east.
DEPTH TO BASEMENT
We calculated the depth to basement, defined to be pre-Cenozoic rocks, beneath
the area of California Wash to define the shape of the underlying basins and to determine
the geometry of bounding and internal faults.
Method
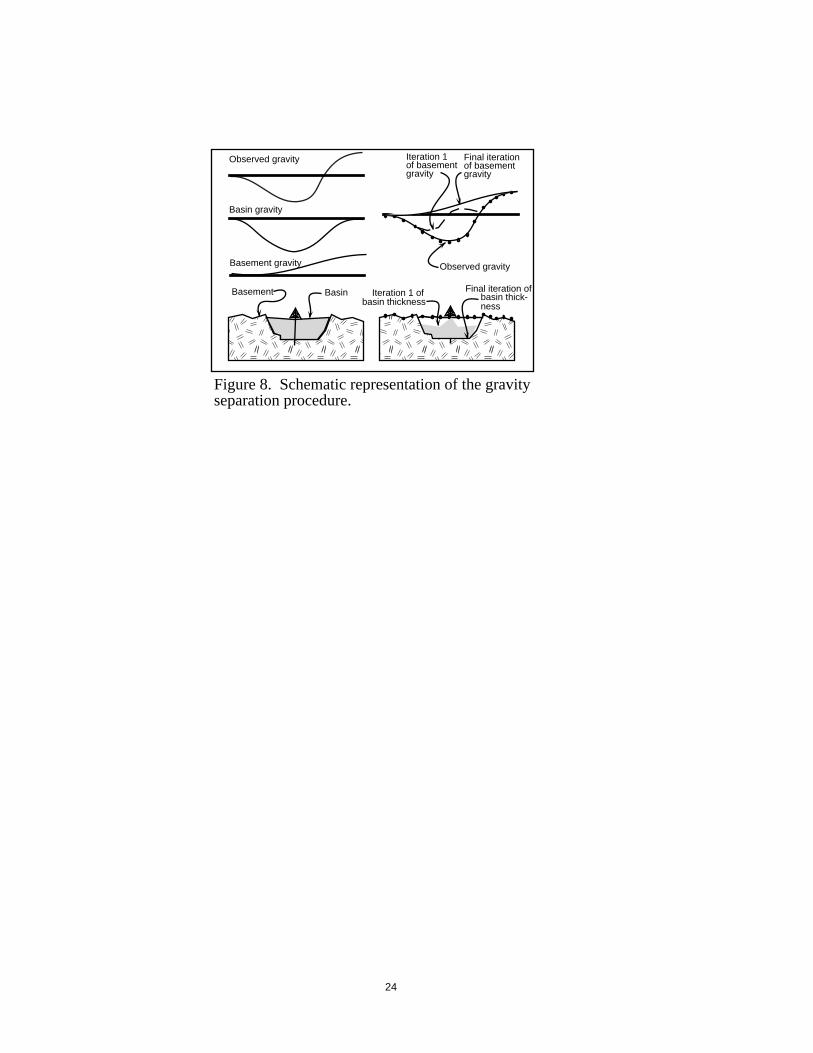
The method used in this study to estimate the thickness of Cenozoic rocks is an
updated version of the iterative method developed by Jachens and Moring (1990) that can
10
incorporate drill hole and other geophysical data (Bruce Chuchel, U.S. Geological
Survey, written commun., 1996; Fig. 8). The method requires knowledge of the residual
gravity field, exposed geology, and vertical density variation within the Cenozoic basin
deposits. Data from drill holes that penetrate bedrock and geophysical data can provide
constraints on the thickness of the basin fill and are also input into the model to provide
useful constraints to the inversion. The method separates the gravity field into two
components, that which is caused by variations of density within the pre-Cenozoic
basement rocks and that which is caused by variations of thickness of the Cenozoic basin
fill. To accomplish this process, the gravity data are separated into observations made on
pre-Cenozoic outcrops and those made on basin fill. The inversion is complicated by two
factors: (1) gravity stations measured on pre-Cenozoic rock are influenced by the gravity
anomaly caused by low-density deposits in nearby basins, and (2) the basement gravity
field varies laterally because of density variations within the pre-Cenozoic basement.
The inversion presented here does not take into account lateral variations in the density
distribution of the Cenozoic deposits. Lateral variations in basin fill density can be large,
in extreme cases inferred to be as high as 0.30 g/cm3 from seismic velocities measured in
the Mobil Virgin River 1A well (Bohannon and others, 1993). However, we think that
most density variations would not change the overall general shape of the basin as
predicted by the method unless the variations were abrupt.
To overcome these difficulties, a first approximation of the basement gravity field is
determined by interpolating a smooth surface through all gravity values measured on
bedrock outcrops. Basement gravity values are also calculated at locations where drill
holes penetrated bedrock or seismic-reflection data constrain the basement surface, using
the Cenozoic density-depth function (table 2). The basin gravity is then the difference
between the observed gravity field on the original map and the first approximation of the
basement gravity field and is used to calculate the first approximation of the thickness of
Cenozoic deposits. The thickness is forced to zero where pre-Cenozoic basement is
exposed. This first approximation of the bedrock gravity is too low near the basin edges
because of the effects of the nearby low-density deposits on the basement stations. The
basement gravity station values are “corrected” for the effects of the low-density deposits
(the effects are calculated directly from the first approximation of the thickness of the
11
Cenozoic deposits) and a second approximation of the basement gravity field is made by
interpolating a smooth surface through the corrected basement gravity observations. This
iteration leads to an improved estimate of the basin gravity field, an improved depth to
bedrock and a new correction to the basement gravity values. This procedure is repeated
until successive iterations produce no significant changes in the basement gravity field.
Table 3. Density-depth functions for Cenozoic sedimentary deposits*
Depth Model A Depth Model BRange (Based on Virgin well) Range (Based on LV-1) 0-500 m -0.56 0-600 m -0.57500-1200 m -0.52 600-1200 m -0.311200-2100 m -0.33 1200-1800 m -0.19>2100 m -0.20 > 1800 m -0.09
*density contrast in g/cm3.
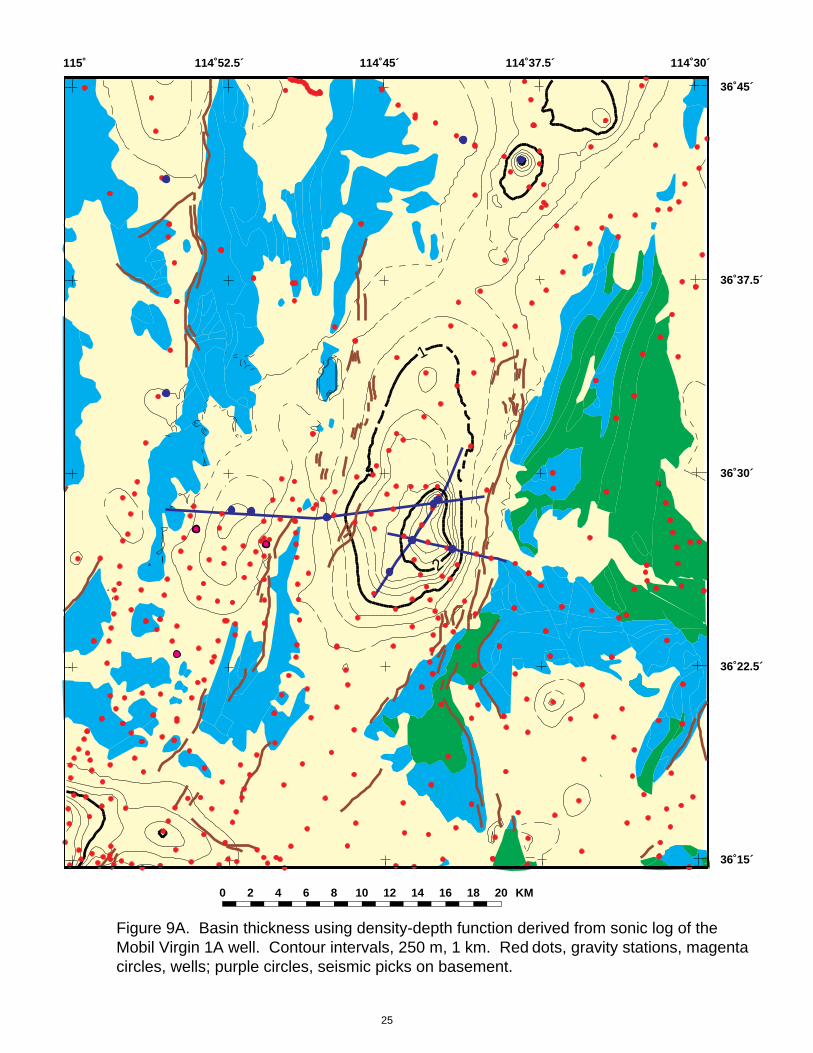
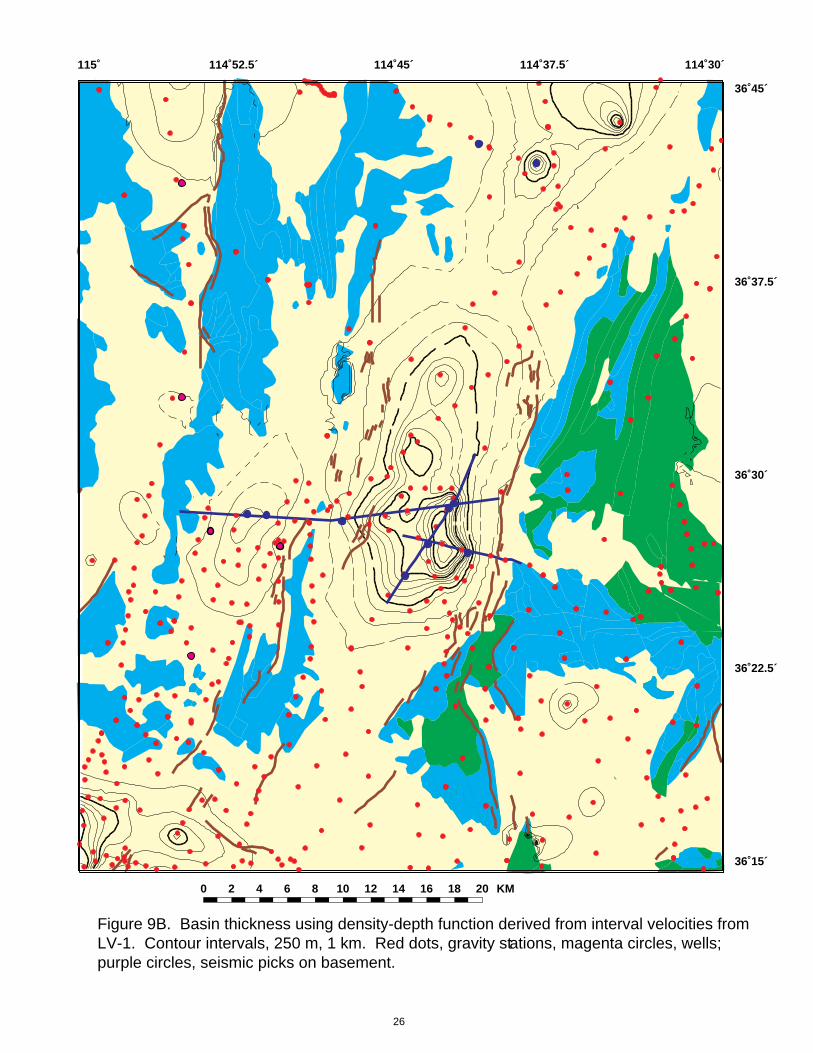
Results
We created two basin models (fig. 9). Both models utilize basement gravity stations
and well and seismic constraints. The first model (A) uses the density-depth function
derived from sonic velocities shown in Bohannon and others (1993); the second (B),
using densities derived from our analysis of interval velocities along LV-1 (Table 2). In
addition to the seismic picks from the three profiles presented in this report, we also used
picks on basement from seismic lines outside of California Wash described in Carpenter
and Carpenter (1994).
The resulting basin models, regardless of the density-depth function utilized, are
similar, except in the magnitude of thickness (fig. 9). Model A predicts a maximum
basin thickness of 2.8 km along the eastern part of the basin underlying California Wash
whereas Model B predicts 3.3 km. Both models indicate that the eastern margin of the
basin is deeper than the western margin. The eastern margin of the basin is displaced 2-3
km west of mapped faults (Dohrenwend and others, 1996) offsetting the basin fill. These
results are consistent with seismic profiles LV-1 and LV-1aext that support a more
westerly position of the main basin edge. This basin margin fault, marked by the steep
gravity gradient and abrupt termination of basin fill reflections along LV-1 and LV-1aext,
12
is assumed to be part of the California Wash fault zone. The western margin of this basin
is less pronounced according to both the gravity and seismic data. Basin fill is thinner (<
1 km) beneath Dry Lake Valley to the west. Neither the gravity nor the seismic-
reflection data indicate major basin-bounding faults in Dry Lake Valley. The gently-
dipping eastern edge of the basin is ~250 m west of mapped young faults along the
eastern margin of Dry Lake Valley (Fig. 2). We find no evidence that these mapped
young faults have dip-slip displacements of > 100 m. If the eastern margin is structurally
controlled, the margin consists of several, small-displacement normal (or strike-slip)
faults with a cumulative offset of less than 1 km.
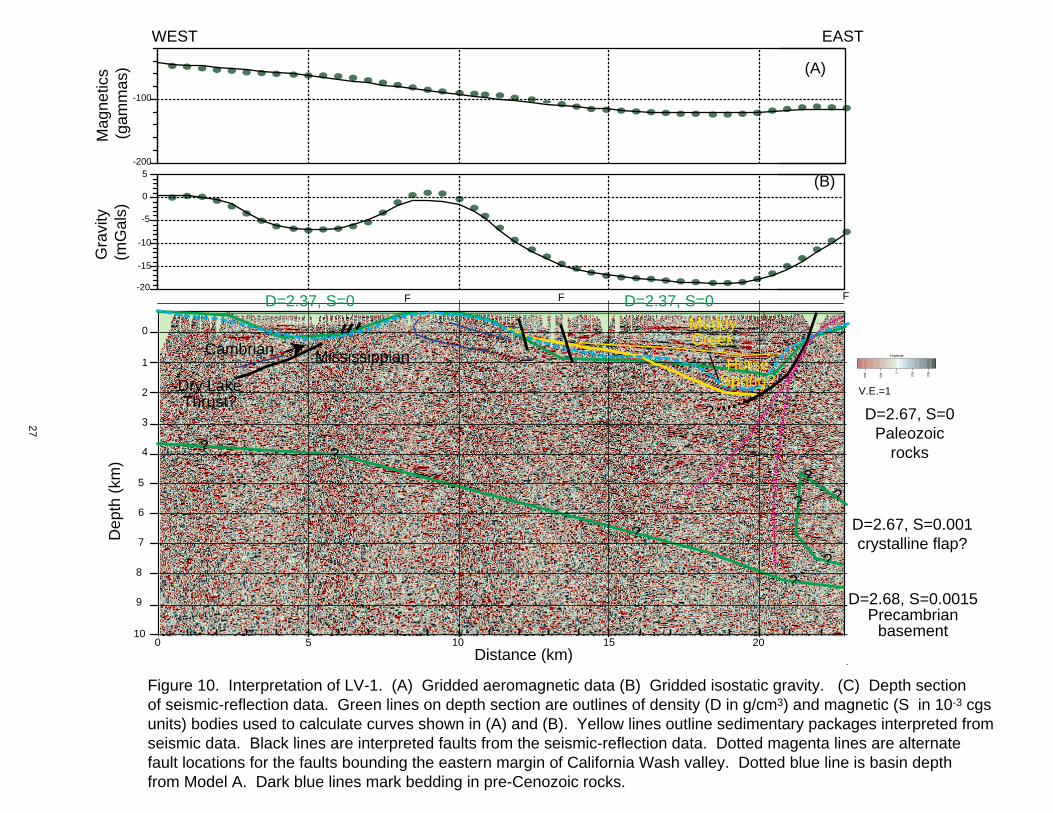
DISCUSSION AND RECOMMENDATIONS
Figure 10 shows the interpretation of seismic-reflection profile, LV-1, with
constraints from modeling of the gravity and magnetic data. Based on the seismic data,
we define two Cenozoic sedimentary packages based on an unconformity in the
California Wash basin between km 12 and 20 at 0.5 km depth. We interpret that the
upper package consists of relatively undeformed Muddy Creek Formation and that the
lower package is Horse Spring Formation based on more extensive seismic information
and a deep drill hole (Mobil Virgin River 1A well on Fig. 1) in the Virgin River Valley
area. Most likely the lower package consists of the Bitter Ridge limestone member of the
Horse Spring Formation, which is exposed at the south end of California Wash valley
(Bohannon, 1984). Similar unconformities occur on both LV-1aext (at km 0 and 1.4 km
depth) and LV-3 (see km 10 at a depth of 1 km). Below the sedimentary fill of Dry Lake
Valley, the Dry Lake thrust separates west-dipping relatively coherent reflections of the
upper plate from disrupted reflections in the lower plate at km 6 and 0.5 km depth.
Upper-plate rocks at the base of the thrust are most likely the Cambrian Nopah Formation
which occurs in surface exposures of the thrust ~ 14 km south of LV-1 near Apex and 12
km north of LV-1 in the Arrow Canyon Range (Page, 1992; Page and Dixon, 1992).
Along LV-1, the Dry Lake thrust projects eastward above the Dry Lake Range, and
lower-plate rocks of the Bird Spring Formation are exposed at the surface between km 8
and 9. The lower-plate rocks become steeply overturned on the western flank of the
13
exposures near LV-1, beneath the projected trace of the thrust fault (Longwell and others,
1965).
Based on modeling of the magnetic data, we suggest that the strong reflections at
4-5 km depth between km 7 and 10 are the top of magnetic Precambrian crystalline
basement. Another Precambrian high based on magnetic data at the eastern end of the
profile is inferred, although its geometry is not constrained by the seismic-reflection data.
Its western edge is roughly coincident with a change in the predominant dip of the
reflections between 2-8 km depth, with predominantly west-dipping reflections east of
km 20 and predominantly east-dipping reflections west of km 19. One possible
interpretation of the change in dip is a concave-downward fault that offsets Precambrian
magnetic basement, perhaps similar to the geometry proposed for north-northeast-
striking, oblique-slip faults in the Candy Peak area in the extreme northeast corner of the
study area (Anderson and Barnhard, 1993).
The accuracy of the basin models depends on how well constrained various input
parameters are. The inversion uses geology compiled at a scale of 1:1,000,000 (Stewart
and Carlson, 1978). More precise knowledge of the basement lithologies and contacts
would improve the model. Larger uncertainties, though, arise from the distribution of
gravity data and poor constraints on the density-depth function.
The basin models suffer from sparse gravity data, particularly for the area north of
36030’. Thus, the details of the basin shape and location must be viewed with caution,
especially in those areas without seismic-reflection or gravity data. For instance, the
eastern third of the gravity profile along LV-3 is constrained by a single gravity station in
the basin and probably accounts for the apparent discrepancy between the seismic-
reflection and gravity data. More gravity data in this area could help resolve whether the
deep reflection at 3 km depth is the base of the sedimentary fill or a fault-plane reflection.
Gravity data in the basins are needed for a better gravity inversion. Detailed, high-
resolution gravity profiles along the margins of the basins would locate strands of faults
(see Phelps and others (2000) for an example from Coyote Springs Valley or Langenheim
and others (1998) for an example from Las Vegas Valley). Basement gravity stations are
particularly needed in the northwestern Muddy Mountains and the Arrow Canyon Range
to help control the inversion in the northern part of the study area.
14
Additional drill-hole data and a better density-depth function would allow us to
greatly refine the current models of the basins. Because our models are constrained only
by basement gravity stations and spatially limited well and seismic data, the basement
gravity field cannot resolve basement gravity anomalies that have wavelengths less than
the spacing between basement outcrops with gravity observations and wells and seismic
control points (as much as 10 km across in some areas). In these areas, the basin model
may not be accurate. Drill-hole data, particularly those wells that provide depths to
basement rocks, could greatly improve the resolution of the basement gravity field.
Additional geophysical data, such as electrical data, would also provide much needed,
independent constraints on basin thickness. Additional seismic-reflection data would not
only improve the basin thickness model, but also image the geometry of basin-bounding
and thrust faults that are important inputs to a hydrogeologic framework. The density-
depth function based on interval velocities could be improved by borehole gravity
surveys or by seismic-refraction data.
Higher-resolution aeromagnetic data could highlight intrabasinal faults. High-
resolution aeromagnetic data covering the area of Albuquerque, New Mexico, were
successful in mapping faults within the basin fill (Grauch and others, 2001). A high-
resolution aeromagnetic survey in the Virgin Valley area, Nevada-Arizona-Utah imaged
not only faults within the Tertiary deposits, but also paleochannels (Jachens and others,
1998). High-resolution aeromagnetic data could also resolve the magnitude of strike-slip
movement on faults bounding the eastern margin of California Wash basin.
REFERENCES
Anderson, R.E., and Barnhardt, 1993, Aspects of three-dimensional strain at the marginof the extensional orogen, Virgin River depression area, Nevada, Utah andArizona: Geological Society of America Bulletin, v. 105, p. 1019-1052.
Bohannon, R.G., 1983, Mesozoic and Cenozoic tectonic development of the Muddy,North Muddy, and northern Black Mountains, Clark county, Nevada in Miller,D.M., Todd, V.R., and Howard, K.A., eds., Tectonic and Stratigraphic Studies inthe Eastern Great Basin: Geological Society of America Memoir 157, p. 125-148.
Bohannon, R.G., 1984, Nonmarine sedimentary rocks of Tertiary age in the Lake Meadregion, southeastern Nevada and northwestern Arizona: U.S. Geological SurveyProfessional Paper 1259, 72 p.
Bohannon, R.G., Grow, J.A., Miller, J., and Blank, H.R., Jr., 1993, Seismic stratigraphyand tectonic development of Virgin River depression and associated basins,
15
southeastern Nevada and northwestern Arizona: Geological Society of AmericaBulletin v. 105, p. 501-520.
Carpenter, J.A., and Carpenter, D.G., 1994, Analysis of Basin-Range fold-thruststructure, and reinterpretation of the Mormon Peak detachment and similarfeatures as gravity-slide systems; southern Nevada, southwest Utah, andnorthwest Arizona, in Dobbs, S.W., and Taylor, W.J., eds., Structural andStratigraphic Investigations and Petroleum Potential of Nevada, with specialemphasis south of the Railroad Valley Producing Trend; Nevada PetroleumSociety Conference Volume I, p. 15-52.
Carpenter, J.A., and Carpenter, D.G., 1994, Fold-thrust structure, synorogenic rocks, andstructural analysis of the north Muddy Mountains and Muddy Mountains, ClarkCounty, Nevada, in Dobbs, S.W., and Taylor, W.J., eds., Structural andStratigraphic Investigations and Petroleum Potential of Nevada, with specialemphasis south of the Railroad Valley Producing Trend; Nevada PetroleumSociety Conference Volume I, p. 65-94.
Dettinger, M.D., Harrill, J.R., and Schmidt, D.L., 1995, Distribution of carbonate-rockaquifers and the potential for their development, southern Nevada and adjacentparts of California, Arizona, and Utah: U.S. Geological Survey Water ResourcesInvestigations Report 91-4146, 100 p.
Dohrenwend, J.C., Schell, B.A., Menges, C.M., Moring, B.C., and McKittrick, M.A.,1996, Reconnaissance photogeologic map of young (Quaternary and late Tertiary)faults in Nevada: Nevada Bureau of Mines and Geology Open-File Report 96-2.
Gardner, G.H., Gardner, L.W., and Gregory, A.R., 1974, Formation velocity and density:the diagnostic basis for stratigraphic traps: Geophysics, v. 39, p. 770-780.
Grauch, V.S., Hudson, M.R., and Minor, S.A., 2001, Aeromagnetic expression of faultsthat offset basin fill, Albuquerque basin, New Mexico: Geophysics, v. 66, p. 707-720.
International Union of Geodesy and Geophysics, 1971, Geodetic reference system 1967:International Association of Geodesy Special Publication no. 3, 116 p.
Jachens, R.C., and Moring, B.C., 1990, Maps of the thickness of Cenozoic deposits andthe isostatic residual gravity over basement for Nevada: U.S. Geological SurveyOpen-File Report 90-404, 15 p., 2 plates, scale 1:1,000,000.
Jachens, R.C., Dixon, G.L., Langenheim, V.E., and Morin, R., 1998, Interpretation of anaeromagnetic survey over part of Virgin Valley, Tule Desert, and the valleysurrounding Meadow Valley wash, southeastern Nevada: U.S. Geological SurveyOpen-File Report 98-804 16 p.
Kane, M.F., Healey, D.L., Peterson, D.L., Kaufmann, H.E., and Reidy, D., 1979,Bouguer gravity map of Nevada—Las Vegas sheet: Nevada Bureau of Mines andGeology Map 61, scale 1:250,000.
Langenheim V.E., Davidson, J.G., Anderson, M.L., and Blank, H.R., Jr., 1999, Principalfacts for gravity stations and physical property measurements in the Lake Mead30’ by 60’ quadrangle, Nevada and Arizona: U.S. Geological Survey Open-FileReport 99-435, (http://pubs.usgs.gov/of/1999/of99-435/).
Langenheim, V.E., Grow, J., Miller, J., Davidson, J.G., and Robison, E., 1998, Thicknessof Cenozoic deposits and location and geometry of the Las Vegas Valley shear
16
zone, Nevada, based on gravity, seismic-reflection, and aeromagnetic data: U.S.Geological Survey Open-File Report 98-576, 31 p.
Longwell, C.R., Pampeyan, E.H., Bowyer, Ben, and Roberts, R.J., 1965, Geology andmineral deposits of Clark County, Nevada: Nevada Bureau of Mines andGeology Bulletin 62, 218 p.
Morelli, Carlo, 1974, The International Gravity Standardization Net, 1971: InternationalAssociation of Geodesy Special Publication no. 4, 194 p.
Page, W.R., 1992, Preliminary geologic map of the Paleozoic rocks in the Arrow Canyonquadrangle, Clark County, Nevada: U.S. Geological Survey Open-File Report92-681, 1:24,000-scale.
Page, W.R., and Dixon, G.L., 1992, Northern terminus of the Mesozoic Dry Lake thrustfault, Arrow Canyon Range, southeastern Nevada [abs.]: Geological Society ofAmerica Abstracts with Programs, v. 24, no. 6, p. 56.
Phelps, G.A., Jewel, E.B., Langenheim, V.E., and Jachens, R.C., 2000, Principal facts forgravity stations in the vicinity of Coyote Spring valley, Nevada, with initialgravity modeling results: U.S. Geological Survey Open-File Report 00-420(http://pubs.usgs.gov/of/2000/of00-420/).
Rush, F.E., 1968, Water-resources appraisal of the Lower Moapa-Lake Mead area, ClarkCounty, Nevada: Department of Conservation and Natural Resources, WaterResources-Reconnaissance Series, no.50, 66 pp.
Saltus, R.W., and Ponce, D.A., 1988, Aeromagnetic map of Nevada—Las Vegas sheet:Nevada Bureau of Mines and Geology Map 95, scale 1:250,000.
Simpson, R.W., Jachens, R.C., Blakely, R.J., and Saltus, R.W., 1986, A new isostaticgravity map of the conterminous United States with a discussion on thesignificance of isostatic residual anomalies: Journal of Geophysical Research, v.91, p. 8348-8372.
Stewart, J.H., and Carlson, J.E., 1977, Million-scale geologic map of Nevada: NevadaBureau of Mines and Geology Map 57, scale 1:1,000,000.
Tschanz, C.M., and Pampeyan, E.H., 1970, Geology and Mineral Deposits of LincolnCounty, Nevada: Nevada Bureau of Mines and Geology Bulletin 73, 188 p
Winograd, I.J., and Thordarson, W., 1975, Hydrogeologic and hydrochemical framework,south-central Great Basin, Nevada-California, with special reference to theNevada Test Site: U.S. Geological Survey Professional Paper 712–C, 126 p.
500
700
900
1100
1300
1500
1700
1900
2100
2300
2500
meters
115°15´ 115° 114°45´ 114°30´ 114°15´ 114°
36°
36°15´
36°30´
36°45´
37°
37°15´
37°30´
LakeMead
LASVEGAS
LV-3
LV-1
0 10 KM
LV-1ext AMuddy
Mountains
Cal
iforn
ia W
ashArrow
CanyonRange
VirginRiverValley
MormonMountains
Kane
Spr
ing
Was
h
VirginMountains
Las VegasRange
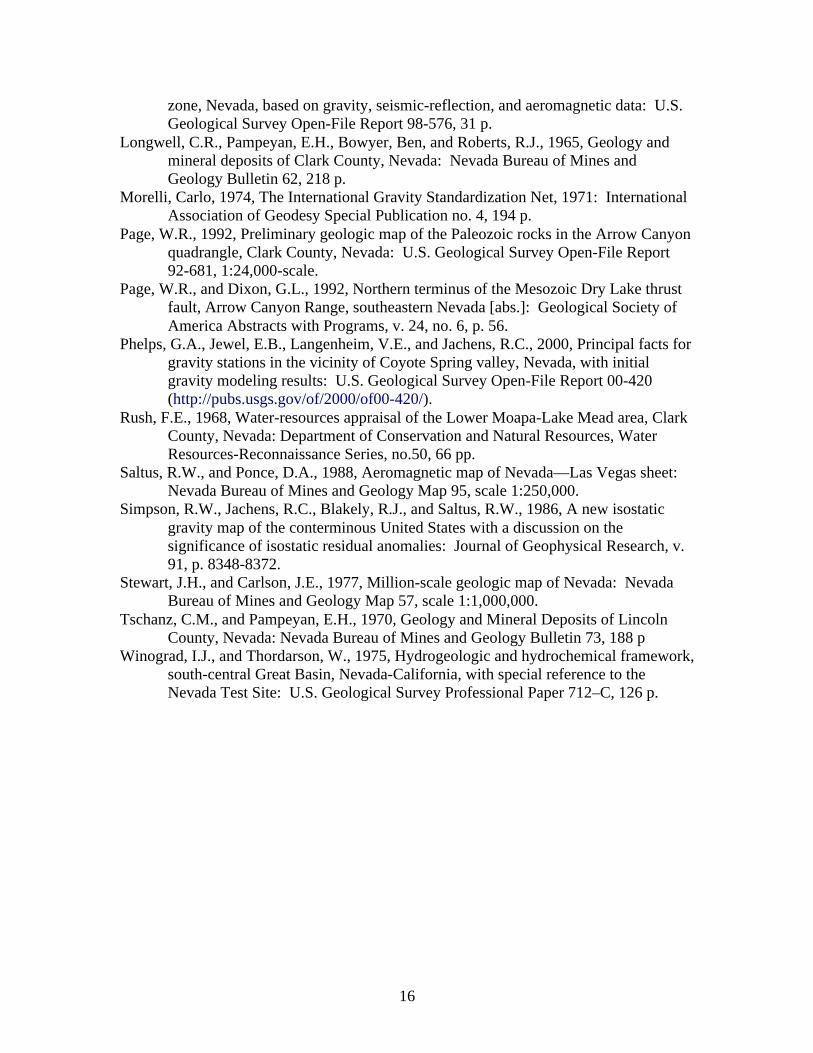
Figure 1. Topographic map of study area (outlined by box) and vicinity. Red lines arethe three seismic profiles discussed in this report. Dashed red lines are parts of the seismic profiles that remain strictly proprietary. BPS, Blue Point Spring; CP, Candy Peak; DLR, Dry Lake Range; FM, Frenchman Mountain; MS, Muddy Springs; RS, Rogers Spring.
Coyote S
pring
Valley
Mea
dow
Val
ley
Mou
ntai
ns
Sh
eep
Ran
ge
VirginMobil
1A well
RSBPS
MS
17
SouthVirgin
Mountains
DL
R
CP
FM
115˚ 114˚52.5´ 114˚45´ 114˚37.5´ 114˚30´
??
?
?
??
36˚15´
36˚22.5´
36˚30´
36˚37.5´
36˚45´
0 2 4 6 8 10 12 14 16 18 20 KM
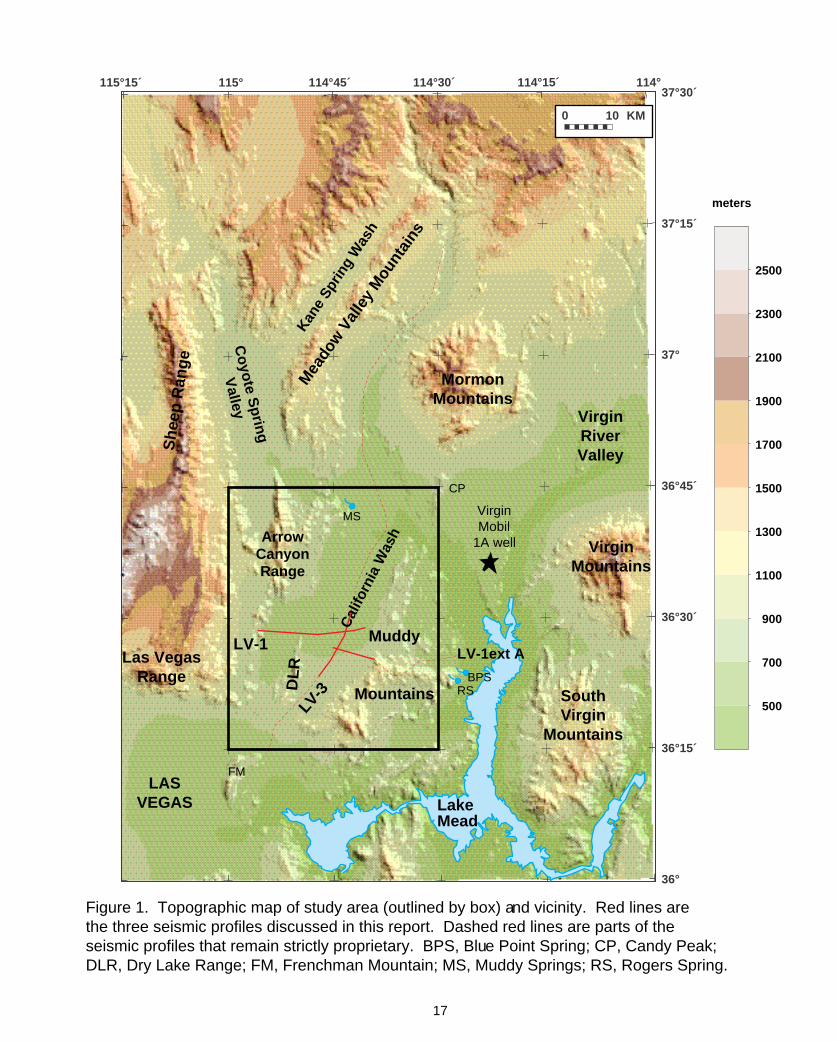
Figure 2. Geologic map of study area. Blue, Paleozoic rocks; green, Mesozoic rocks;yellow, Cenozoic rocks. Brown dots, gravity stations, red lines, faults from Dohrenwend and others(1996). Dark blue lines, seismic-reflection profiles from this study. Thick black lines are thrust faults with barbs on upper plate. Magenta circles, wells; gray circles, picks on basement from seismic-reflection data (Carpenter and Carpenter, 1994; this study). Thick magenta lines, interpreted basin-bounding fault from gravity and seismic data. CP, Candy Peak; DLT, Dry Lake thrust fault; MMT, Muddy Mountain thrust fault.
Grace
DryLake
Range
Muddy
Mountains
ArrowCanyonRange
Dry LakeValley C
alifo
rnia
Was
h
Valleyof Fire
I-15
DLT
MMT
18
CP
115˚ 114˚52.5´ 114˚45´ 114˚37.5´ 114˚30´
36˚15´
36˚22.5´
36˚30´
36˚37.5´
36˚45´
-22
-20
-18
-16
-14
-12
-10
-8
-6
-4
-2
0
2
4
6
8
10
12
14
16
mGal
0 2 4 6 8 10 12 14 16 18 20 KM
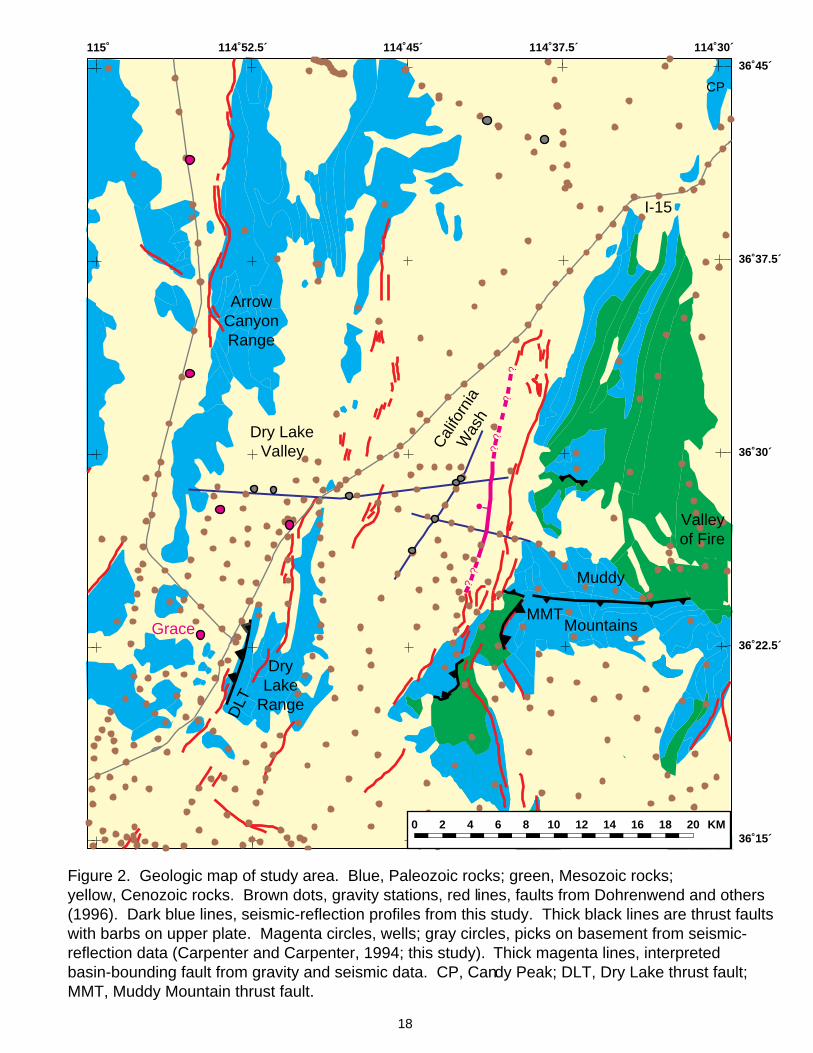
Figure 3. Isostatic gravity map of study area. Green lines are extent of pre-Cenozoic rocks. Brown lines, late Tertiary and Quaternary faults from Dohrenwend and others (1996).See Figure 2 for explanation of other symbols.
19
115˚ 114˚52.5´ 114˚45´ 114˚37.5´ 114˚30´
36˚15´
36˚22.5´
36˚30´
36˚37.5´
36˚45´
-300
-285
-270
-255
-240
-225
-210
-195
-180
-165
-150
-135
-120
-105
-90
-75
-60
-45
-30
-15
nT
0 2 4 6 8 10 12 14 16 18 20 KM
Figure 4. Aeromagnetic map of study area. Green lines are extent of pre-Cenozoic rocks. See Figures 2 and 3 for explanation of symbols.
20
Am
plitu
de
-800.
-400.
0.
400.
800.
-20
-15
-10
-5
0
5
Gra
vity
(m
Gal
s)
-200
-100M
agne
tics
(ga
mm
as)
5 10 15 20
V.E.=1
11
10
9
8
7
6
5
4
3
2
1
0 (S.L.)
Dep
th (
km)
WEST EAST(A)
(B)
(C)OutcropOutcrop FFF
21
0 5 10 15 20Distance (km)
Figure 5. Geophysical data along profile LV-1. (A) Gridded aeromagnetic data (B) Gridded isostaticgravity. (C) Depth section of seismic-reflection data. Outcrop, exposure of pre-Cenozoic rock; F, fault from Dohrenwend and others (1996). See Figure 10 for interpretation.
Am
plitu
de
-800.
-400.
0.
400.
800.
-20
-15
-10
-5
0
Gra
vity
(m
Gal
s)
-120
-100
Mag
netic
s (g
amm
as)
0 4 Distance (km)
V.E.=1
5
0
Dep
th (
km)
LV-3
1 2
2
3
3
4
5 6
6
7
7
8
1
9
WEST EAST
Fig. 6.Magnetic (A),gravity (B), and seismic-reflection(C) data alongLV-1aext. Depth section.
(A)
(B)
(C)OutcropF
22
1000
2000
3000
4000
5000
6000
7000
8000
9000
10000
11000
12000
13000
14000
15000
16000
17000
18000
19000
20000
21000
22000
23000
24000
25000
26000
27000
28000
29000
30000
31000
32000
33000
34000
Am
plitu
de
-800.
-400.
0.
400.
800.
-20
-15
Gra
vity
(m
Gal
s)
-150
-100
Mag
netic
s (g
amm
as)
4 9Distance (km)
V.E.=1
5
Dep
th (
km)
10 11 12 135
6
6
7
7
4
3
3
8
8
9
10
2
2
1
1
0
SL
SOUTHWEST NORTHEAST
(A)
(B)
(C)
gravityfield poorlyconstrained
Figure 7. Gridded magnetic (A), gridded gravity (B), and seismic-reflection (C) data along LV-3.Depth section.
LV-1aext LV-1
23
Observed gravity
Basin gravity
Basement gravity
Basement Iteration 1 ofbasin thickness
Iteration 1of basementgravity
Observed gravity
Basin
Final iterationof basementgravity
Final iteration ofbasin thick-ness
Figure 8. Schematic representation of the gravity separation procedure.
24
115˚ 114˚52.5´ 114˚45´ 114˚37.5´ 114˚30´
36˚15´
36˚22.5´
36˚30´
36˚37.5´
36˚45´
1
2
0 2 4 6 8 10 12 14 16 18 20 KM
Figure 9A. Basin thickness using density-depth function derived from sonic log of theMobil Virgin 1A well. Contour intervals, 250 m, 1 km. Red dots, gravity stations, magenta circles, wells; purple circles, seismic picks on basement.
25
115˚ 114˚52.5´ 114˚45´ 114˚37.5´ 114˚30´
36˚15´
36˚22.5´
36˚30´
36˚37.5´
36˚45´
0 2 4 6 8 10 12 14 16 18 20 KM
Figure 9B. Basin thickness using density-depth function derived from interval velocities from LV-1. Contour intervals, 250 m, 1 km. Red dots, gravity stations, magenta circles, wells; purple circles, seismic picks on basement.
26
19.
-20
-15
-10
-5
0
5
Gra
vity
(m
Gal
s)
-200
-100M
agne
tics
(ga
mm
as)
0 5 10 15 20Distance (km)
10
9
8
7
6
5
4
3
2
1
0
Dep
th (
km)
WEST EAST
D=2.37, S=0
Amplitude
-800.
-400.
0. 400.
800.
V.E.=1
D=2.68, S=0.0015Precambrian
basement
D=2.67, S=0.001crystalline flap?
Dry Lake Thrust?
Cambrian Mississippian
MuddyCreek
D=2.67, S=0Paleozoic
rocks
HorseSpring?
(A)
(B)
0 5 10 15 20Distance (km)
Figure 10. Interpretation of LV-1. (A) Gridded aeromagnetic data (B) Gridded isostatic gravity. (C) Depth section of seismic-reflection data. Green lines on depth section are outlines of density (D in g/cm3) and magnetic (S in 10-3 cgs units) bodies used to calculate curves shown in (A) and (B). Yellow lines outline sedimentary packages interpreted from seismic data. Black lines are interpreted faults from the seismic-reflection data. Dotted magenta lines are alternate fault locations for the faults bounding the eastern margin of California Wash valley. Dotted blue line is basin depth from Model A. Dark blue lines mark bedding in pre-Cenozoic rocks.
D=2.37, S=0
27
F F F
?
??
?
?
?
?
?
?