Embed Size (px)
Citation preview

U.S. DEPARTMENT OF THE INTERIOR GALE A. NORTON, Secretary
U.S. GEOLOGICAL SURVEY
CHARLES G. GROAT, Director
Any use of trade, product, or firm names in this publication is for descriptive purposes only and does not imply endorsement by the U.S. Geological Survey.
For additional information write to:
District ChiefU.S. Geological SurveySuite 3015227 North Bronough StreetTallahassee, FL 32301
Copies of this report can be purchased from:
U.S. Geological Survey Branch of Information Services Box 25286 Federal Center Denver, CO 80225 888-ASK-USGS
Additional information about water resources in Florida is available on the World Wide Web at http://fl.water.usgs.gov
Estimation of Infiltration Rates of Saturated Soils at Selected Sites in the Caloosahatchee River Basin, Southwestern Florida
By Pamela A. Telis
U.S. GEOLOGICAL SURVEY Open-File Report 01-65
Prepared in cooperation with theSouth Florida Water Management District
Tallahassee, Florida 2001
CONTENTS
Abstract................................................................................................................................................................................. 1Introduction .......................................................................................................................................................................... 1
Purpose and Scope ...................................................................................................................................................... 2Soil Characteristics and Landscape Groups ............................................................................................................... 2Acknowledgments ...................................................................................................................................................... 4
Estimating Infiltration Rates of Saturated Soils ................................................................................................................... 5Soil Infiltration Measurements ................................................................................................................................... 5Regression Analysis ................................................................................................................................................... 7
Conclusions .......................................................................................................................................................................... 16References Cited ................................................................................................................................................................... 16
FIGURES
1. Map showing Caloosahatchee River Basin and location of soil infiltration sites in southwestern Florida ............ 32. Diagram showing double-ring infiltrometer setup .................................................................................................. 73. Plots showing soil infiltration rate as a function of time for sites where data could not be fitted to Horton's
equation.................................................................................................................................................................... 84. Plots showing soil infiltration rate as a function of time for sites fitted to Horton's equation ............................... 105. Plots showing estimated saturated soil infiltration rates for sites by landscape group compared with lowest
saturated vertical hydraulic conductivity used in the integrated surface-water and ground-water model .............. 15
TABLES
1. Typical soil profiles and associated hydraulic conductivities used in the integrated surface-water andground-water model for various landscape groups.................................................................................................. 4
2. Description of soil infiltration sites in the Caloosahatchee River Basin.................................................................. 63. Estimates of infiltration rates of saturated soils based on average incremental infiltration rates for time
periods greater than 20 minutes............................................................................................................................... 104. Estimates of infiltration rates of saturated soils based on regression analysis......................................................... 14
Contents III
Estimation of Infiltration Rates of Saturated Soils at Selected Sites in the Caloosahatchee River BasinBy Pamela A. Telis
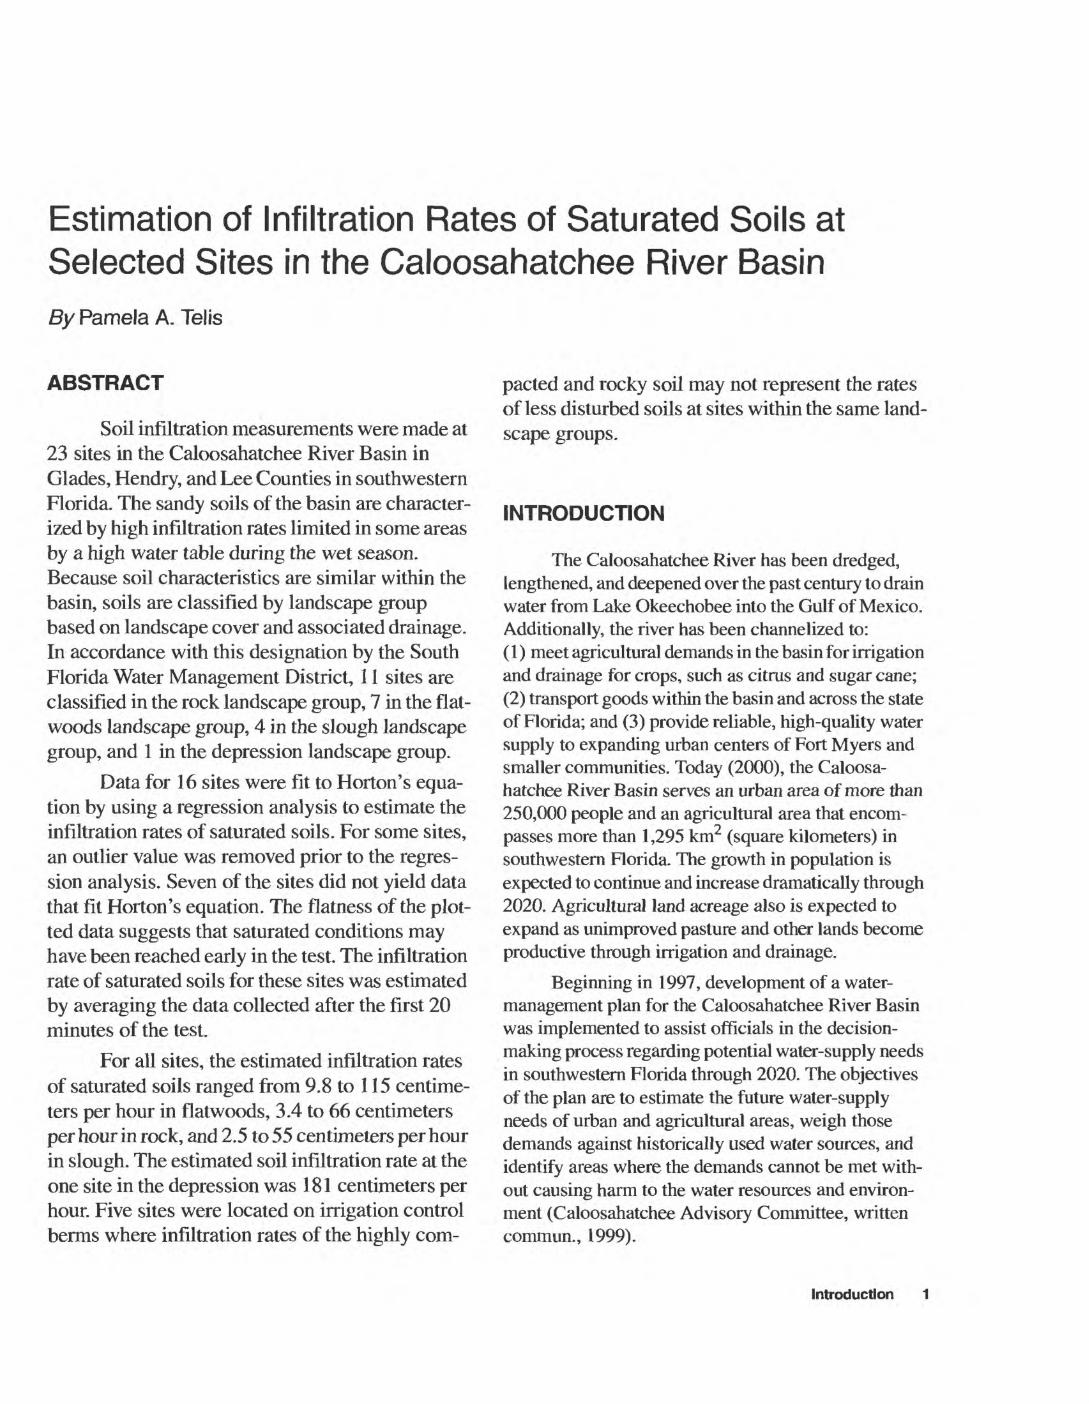
ABSTRACT
Soil infiltration measurements were made at 23 sites in the Caloosahatchee River Basin in Glades, Hendry, and Lee Counties in southwestern Florida. The sandy soils of the basin are character ized by high infiltration rates limited in some areas by a high water table during the wet season. Because soil characteristics are similar within the basin, soils are classified by landscape group based on landscape cover and associated drainage. In accordance with this designation by the South Florida Water Management District, 11 sites are classified in the rock landscape group, 7 in the flat- woods landscape group, 4 in the slough landscape group, and 1 in the depression landscape group.
Data for 16 sites were fit to Horton's equa tion by using a regression analysis to estimate the infiltration rates of saturated soils. For some sites, an outlier value was removed prior to the regres sion analysis. Seven of the sites did not yield data that fit Horton's equation. The flatness of the plot ted data suggests that saturated conditions may have been reached early in the test. The infiltration rate of saturated soils for these sites was estimated by averaging the data collected after the first 20 minutes of the test.
For all sites, the estimated infiltration rates of saturated soils ranged from 9.8 to 115 centime ters per hour hi flatwoods, 3.4 to 66 centimeters per hour in rock, and 2.5 to 55 centimeters per hour in slough. The estimated soil infiltration rate at the one site in the depression was 181 centimeters per hour. Five sites were located on irrigation control berms where infiltration rates of the highly com
pacted and rocky soil may not represent the rates of less disturbed soils at sites within the same land scape groups.
INTRODUCTION
The Caloosahatchee River has been dredged, lengthened, and deepened over the past century to drain water from Lake Okeechobee into the Gulf of Mexico. Additionally, the river has been channelized to:(1) meet agricultural demands in the basin for irrigation and drainage for crops, such as citrus and sugar cane;(2) transport goods within the basin and across the state of Florida; and (3) provide reliable, high-quality water supply to expanding urban centers of Fort Myers and smaller communities. Today (2000), the Caloosa hatchee River Basin serves an urban area of more than 250,000 people and an agricultural area that encom passes more than 1,295 km2 (square kilometers) in southwestern Florida. The growth in population is expected to continue and increase dramatically through 2020. Agricultural land acreage also is expected to expand as unimproved pasture and other lands become productive through irrigation and drainage.
Beginning in 1997, development of a water- management plan for the Caloosahatchee River Basin was implemented to assist officials in the decision- making process regarding potential water-supply needs in southwestern Florida through 2020. The objectives of the plan are to estimate the future water-supply needs of urban and agricultural areas, weigh those demands against historically used water sources, and identify areas where the demands cannot be met with out causing harm to the water resources and environ ment (Caloosahatchee Advisory Committee, written commun., 1999).
Introduction 1

In accordance with this water-management plan, an integrated surface-water and ground-water (ISWGW) model was constructed to examine current and future water usage and sources and to test water- management techniques in the Caloosahatchee River Basin. The ISWGW model, developed by the Danish Hydrologic Institute, uses the MikeSHE model (Jacob- sen, 1999), which simulates surface-water and ground- water interaction within a watershed. Model compo nents used for the simulation include irrigation schemes, seasonal crop evapotranspiration demands, and infiltration through various soil profiles.
In 1998, the U.S. Geological Survey (USGS), in cooperation with the South Florida Water Management District (SFWMD), began a study to support the ISWGW model development effort by collecting and analyzing data to estimate saturated soil infiltration rates at selected sites in the Caloosahatchee River Basin. The vertical hydraulic conductivity of saturated soil, an input parameter to the MikeSHE model, was estimated from these measured infiltration rates under specified field conditions.
Purpose and Scope
The purpose of this report is to present estimates of the infiltration rates of saturated soils at selected sites within the Caloosahatchee River Basin in Lee, Hendry, and Glades Counties in southwestern Florida. The model area covers part of the basin that drains to the freshwater portion of the river between Moore Haven Lock and Franklin Lock (fig. 1).
Saturated soil infiltration rates were estimated at 23 sites in the study area using a double-ring infiltrom- eter. Time-series plots were generated for all of the sites. Horton's equation was used with a regression analysis at 16 sites to estimate the infiltration rates of the saturated soils; outliers were removed from 5 of these sites before the regression analysis was made. Horton's equation could not be used to describe data for the remaining seven sites. The nearly constant infil tration rates measured during the tests at these sites were averaged to estimate the magnitude of the infiltra tion rate of the saturated soils. Test results, presented herein, are arranged by landscape group as classified by the SFWMD.
Soil Characteristics and Landscape Groups
Most of the soils in the Caloosahatchee River Basin are characterized as shallow and sandy and have high infiltration rates that are limited in some areas by a high water table during the wet season. The nearly 70 different soil types in the model area have similar physical characteristics and hydraulic characteristics. Because of these similarities, the landscape cover and associated drainage were the principal attributes for combining soil types into hydrologic response groups. The landscape groups (Eric Flaig, South Florida Water Management District, written commun., 1998) used for this study are described below.
Depression Occurs in flatwoods and marsh and pond landscapes as shallow dips or depressions in the land surface where drainage is limited. Depressions are characterized by high organic matter content in the surface horizon that reduces infiltration and increases runoff.
Flatwoods - Nearly level areas where scattered to numerous pine trees are common and saw pal metto, gallberry, and other woody plants flourish throughout the region. Soils associated with this landscape group include Immokalee, Myakka, and Oldsmar. Typically, this poorly drained soil occurs on broad irregular areas with a slope of less than 2 percent. The water table may be within 254 mm (millimeters) of the soil surface for up to5 months. During the dry season, the water table is at least 1,270 mm below land surface.
Rock - Areas with a soil type dominated by the pres ence of a shallow rock or clay layer. The shallow rock in these areas reduces the water-holding capacity and increases runoff. The magnitude of the effect on runoff depends on the depth of the rock from land surface.
Slough - Open grassland that is nearly level and has broad drainage courses. The plant community is dominated by blue maidencane, chalky bluestem, and bluejoint panicum. Sloughs generally are found between flatwoods and freshwater marsh plant communities. Typical slough soils are Pineda, Riviera, and Holopaw. The water table may be within 254 mm of the soil surface for up to6 months during most years and between depths of 254 and 1,016 mm for much of the remaining time.
Estimation of infiitration Rates of Saturated Soiis at Seiected Sites in the Caloosahatchee River Basin

W LU
. o
- IO
Q.
1 O)0) Q.ro
Rock landsc
jryLUCD
IDZQZ^LU1-00zo1
0.
1O) 0)Q.sW
cm
Flatwoods li
jryLUCD
IDZQZ^LU1-00zoI
0.
1O)0) Q.
5w
Slough land
jorLUCD
IDZQZ^LU1-00zo1
Q.
1O)
landsca
Depression
jorLUCD
IDZQZ^LU1-00zo1
orLUCD
ID Z QZ
LUor31 ^_)IDorrr_jOori-zooorLU
S L? L? L?
=i =;=;=; LULL LL LL LL Oz z z z <=! zJ zd zd L^O O O O IDw w w w w
O O
O OCo
O O O
(C
o
c1_CDto
o w
w i w
o
_c "o
.0^1 «
8
CDc "wCD CO
CD
£CD CD
O 4 "
CD
CD CO
8CDO
D)
Introduction
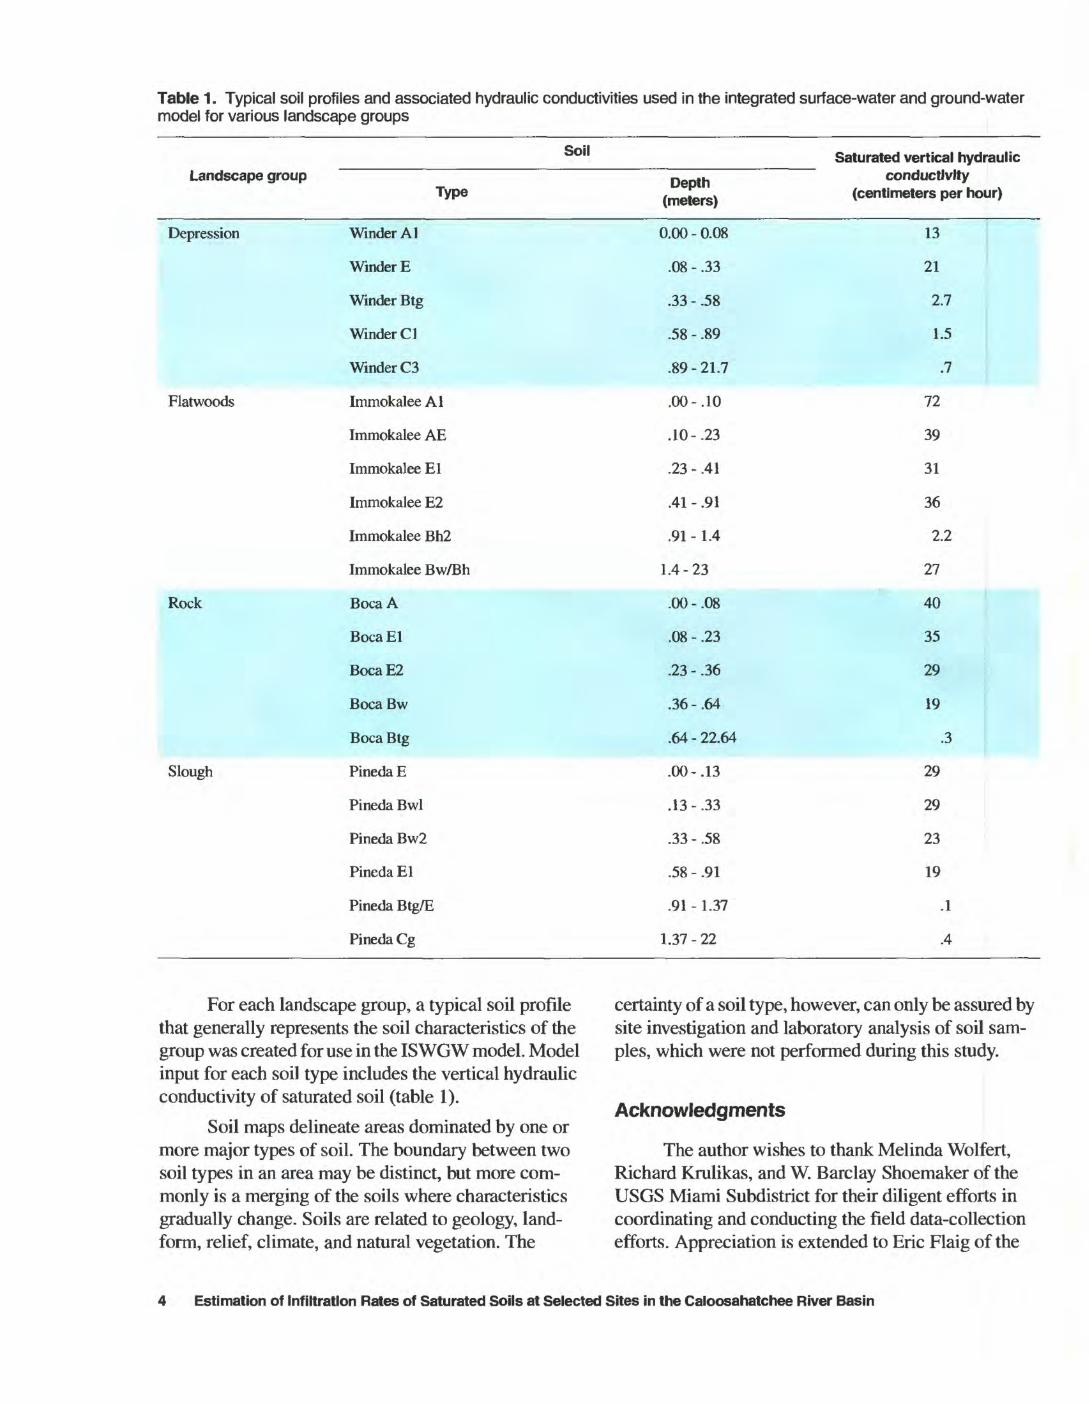
Table 1. Typical soil profiles and associated hydraulic conductivities used in the integrated surface-water and ground-water model for various landscape groups
Landscape group Type
Depression Winder A]
Winder E
Winder Btg
Winder Cl
Winder C3
Flatwoods Immokalee Al
Immokalee AE
Immokalee El
Immokalee E2
Immokalee Bh2
Immokalee Bw/Bh
Rock Boca A
Boca El
Boca E2
Boca Bw
, Boca Btg
Slough Pineda E
Pineda Bwl
Pineda Bw2
Pineda El
Pineda Btg/E
Pineda Cg
Soil
Depth (meters)
0.00 - 0.08
.08 - .33
.33 - .58
.58 - .89
.89 - 21.7
.00 -.10
.10 -.23
.23 - .41
.41 - .91
.91 - 1.4
1.4-23
.00 - .08
.08 - .23
.23 - .36
.36 - .64
.64 - 22.64
.00 -.13
.13 -.33
.33 - .58
.58 - .91
.91 - 1.37
1.37 - 22
Saturated vertical hydraulicconductivity
(centimeters per hour)
13
21
2.7
1.5
.7
72
39
31
36
2.2
27
40 ''
35
29
19
.3
29
29
23
19
.1
.4
For each landscape group, a typical soil profile that generally represents the soil characteristics of the group was created for use in the ISWGW model. Model input for each soil type includes the vertical hydraulic conductivity of saturated soil (table 1).
Soil maps delineate areas dominated by one or more major types of soil. The boundary between two soil types in an area may be distinct, but more com monly is a merging of the soils where characteristics gradually change. Soils are related to geology, land- form, relief, climate, and natural vegetation. The
certainty of a soil type, however, can only be assured by site investigation and laboratory analysis of soil sam ples, which were not performed during this study.
Acknowledgments
The author wishes to thank Melinda Wolfert, Richard Krulikas, and W. Barclay Shoemaker of the USGS Miami Subdistrict for their diligent efforts in coordinating and conducting the field data-collection efforts. Appreciation is extended to Eric Flaig of the
Estimation of Infiltration Rates of Saturated Soils at Selected Sites in the Caloosahatchee River Basin
SFWMD for his assistance during data collection, and to Eric Swain of the USGS Miami Subdistrict for his guidance and advice throughout data collection and analysis.
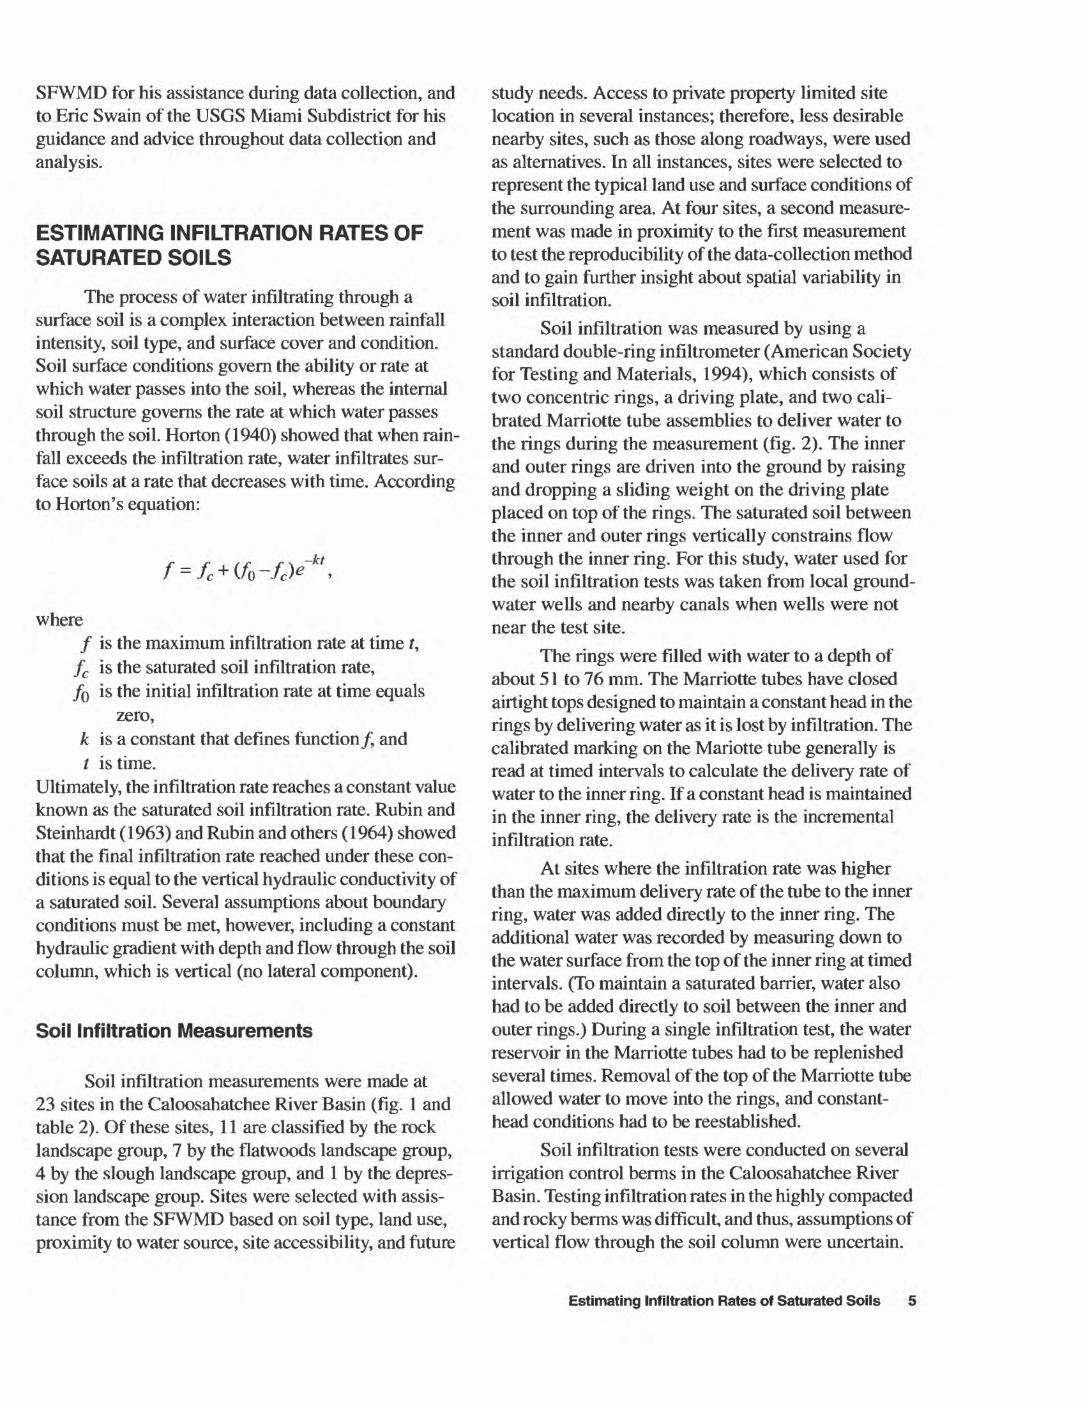
ESTIMATING INFILTRATION RATES OF SATURATED SOILS
The process of water infiltrating through a surface soil is a complex interaction between rainfall intensity, soil type, and surface cover and condition. Soil surface conditions govern the ability or rate at which water passes into the soil, whereas the internal soil structure governs the rate at which water passes through the soil. Horton (1940) showed that when rain fall exceeds the infiltration rate, water infiltrates sur face soils at a rate that decreases with time. According to Horton's equation:
where/ is the maximum infiltration rate at time t, fc is the saturated soil infiltration rate, /0 is the initial infiltration rate at time equals
zero,k is a constant that defines function/, and t is time.
Ultimately, the infiltration rate reaches a constant value known as the saturated soil infiltration rate. Rubin and Steinhardt (1963) and Rubin and others (1964) showed that the final infiltration rate reached under these con ditions is equal to the vertical hydraulic conductivity of a saturated soil. Several assumptions about boundary conditions must be met, however, including a constant hydraulic gradient with depth and flow through the soil column, which is vertical (no lateral component).
Soil Infiltration Measurements
Soil infiltration measurements were made at 23 sites in the Caloosahatchee River Basin (fig. 1 and table 2). Of these sites, 1 1 are classified by the rock landscape group, 7 by the flatwoods landscape group, 4 by the slough landscape group, and 1 by the depres sion landscape group. Sites were selected with assis tance from the SFWMD based on soil type, land use, proximity to water source, site accessibility, and future
study needs. Access to private property limited site location in several instances; therefore, less desirable nearby sites, such as those along roadways, were used as alternatives. In all instances, sites were selected to represent the typical land use and surface conditions of the surrounding area. At four sites, a second measure ment was made in proximity to the first measurement to test the reproducibility of the data-collection method and to gain further insight about spatial variability in soil infiltration.
Soil infiltration was measured by using a standard double-ring infiltrometer (American Society for Testing and Materials, 1994), which consists of two concentric rings, a driving plate, and two cali brated Marriotte tube assemblies to deliver water to the rings during the measurement (fig. 2). The inner and outer rings are driven into the ground by raising and dropping a sliding weight on the driving plate placed on top of the rings. The saturated soil between the inner and outer rings vertically constrains flow through the inner ring. For this study, water used for the soil infiltration tests was taken from local ground- water wells and nearby canals when wells were not near the test site.
The rings were filled with water to a depth of about 51 to 76 mm. The Marriotte tubes have closed airtight tops designed to maintain a constant head in the rings by delivering water as it is lost by infiltration. The calibrated marking on the Mariotte tube generally is read at timed intervals to calculate the delivery rate of water to the inner ring. If a constant head is maintained in the inner ring, the delivery rate is the incremental infiltration rate.
At sites where the infiltration rate was higher than the maximum delivery rate of the tube to the inner ring, water was added directly to the inner ring. The additional water was recorded by measuring down to the water surface from the top of the inner ring at timed intervals. (To maintain a saturated barrier, water also had to be added directly to soil between the inner and outer rings.) During a single infiltration test, the water reservoir in the Marriotte tubes had to be replenished several times. Removal of the top of the Marriotte tube allowed water to move into the rings, and constant- head conditions had to be reestablished.
Soil infiltration tests were conducted on several irrigation control berms in the Caloosahatchee River Basin. Testing infiltration rates in the highly compacted and rocky berms was difficult, and thus, assumptions of vertical flow through the soil column were uncertain.
Estimating Infiltration Rates of Saturated Soils 5
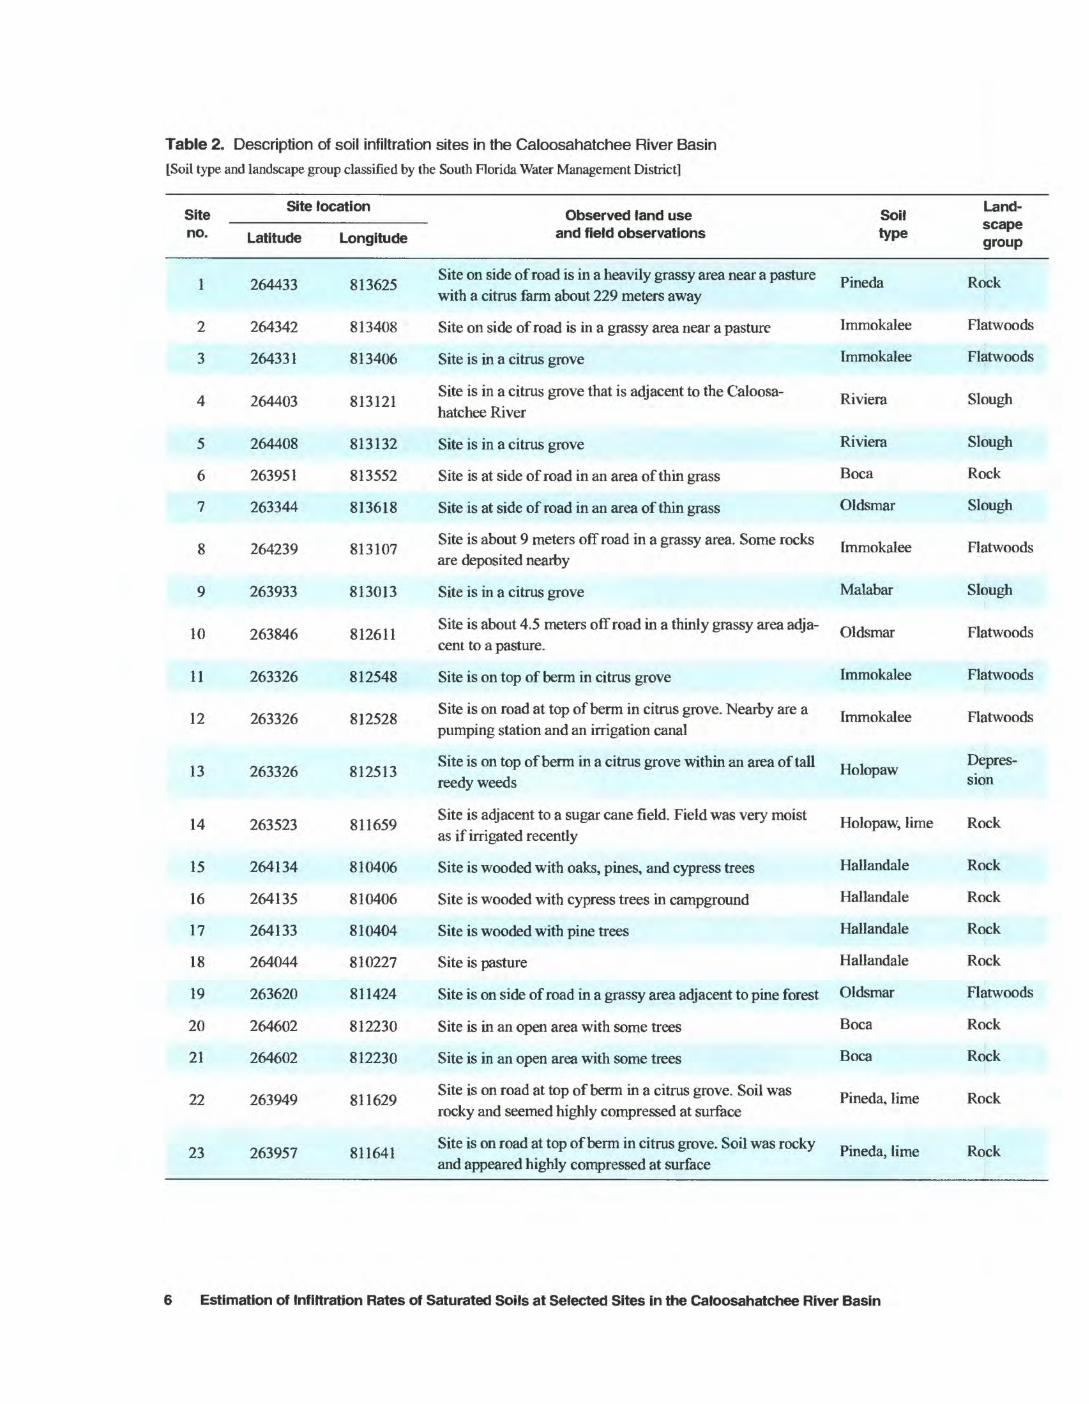
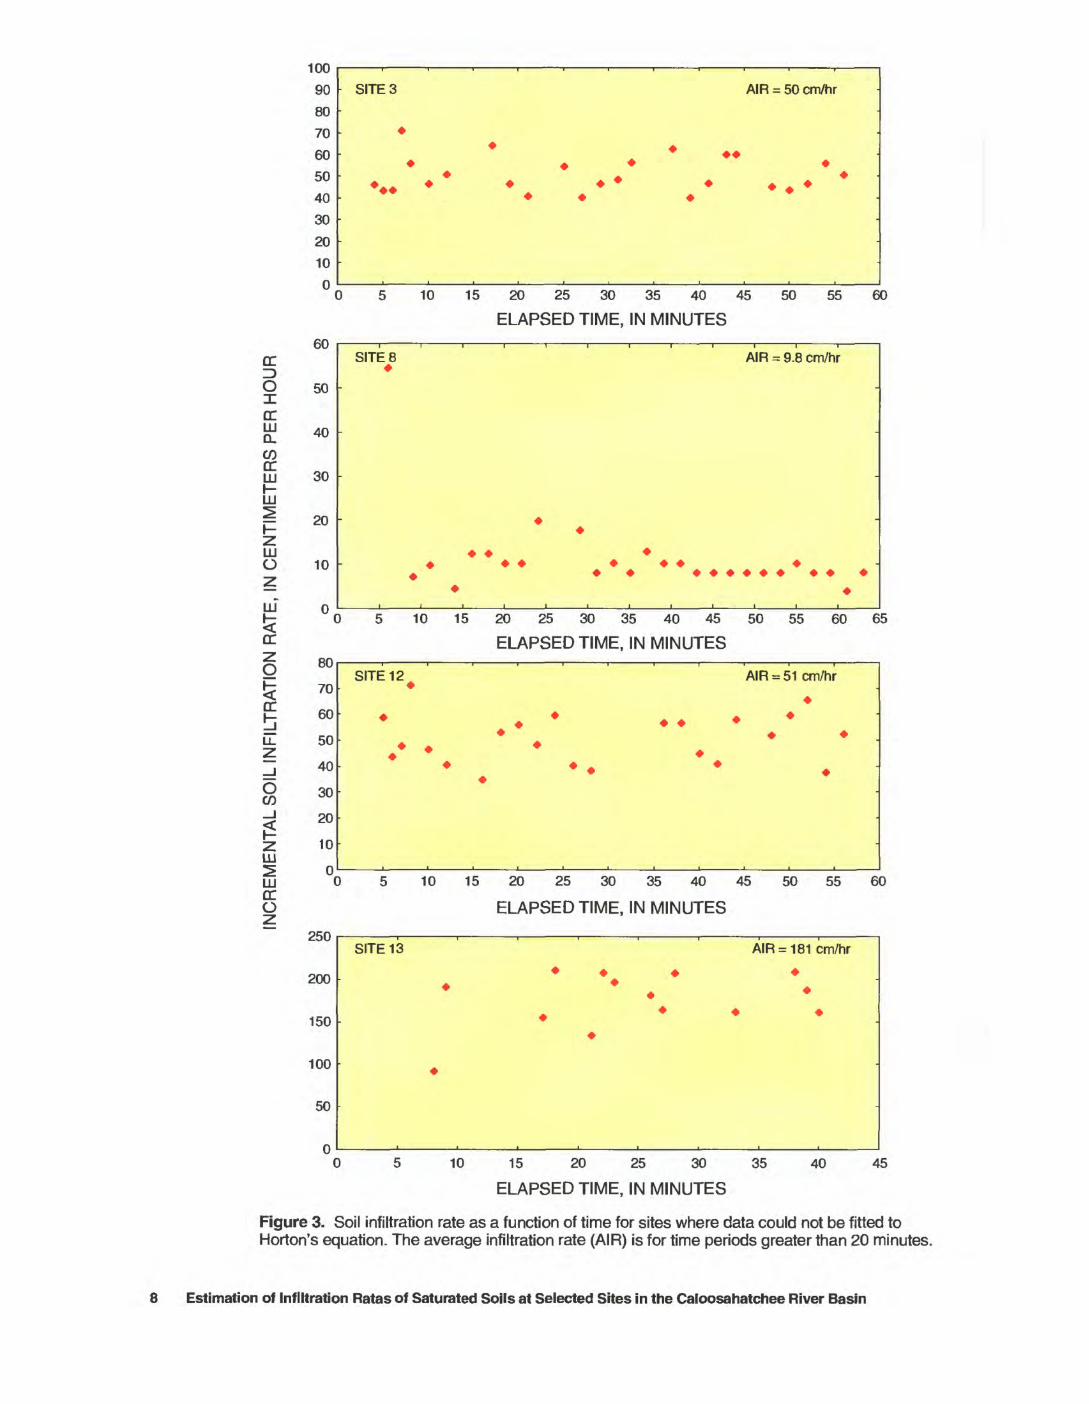
Table 2. Description of soil infiltration sites in the Caloosahatchee River Basin
[Soil type and landscape group classified by the South Florida Water Management District]
Site no.
1
2
3
4
5
6
7
8
9
10
11
12
13
14
15
16
17
18
19
20
21
22
23
Site location
Latitude
264433
264342
264331
264403
264408
263951
263344
264239
263933
263846
263326
263326
263326
263523
264134
264135
264133
264044
263620
264602
264602
263949
263957
Longitude
813625
813408
813406
813121
813132
813552
813618
813107
813013
812611
812548
812528
812513
811659
810406
810406
810404
810227
811424
812230
812230
811629
811641
Observed land use and field observations
Site on side of road is in a heavily grassy area near a pasture with a citrus farm about 229 meters away
Site on side of road is in a grassy area near a pasture
Site is in a citrus grove
Site is in a citrus grove that is adjacent to the Caloosa hatchee River
Site is in a citrus grove
Site is at side of road in an area of thin grass
Site is at side of road in an area of thin grass
Site is about 9 meters off road in a grassy area. Some rocks are deposited nearby
Site is in a citrus grove
Site is about 4.5 meters off road in a thinly grassy area adja cent to a pasture.
Site is on top of berm in citrus grove
Site is on road at top of berm in citrus grove. Nearby are a pumping station and an irrigation canal
Site is on top of berm in a citrus grove within an area of tall reedy weeds
Site is adjacent to a sugar cane field. Field was very moist as if irrigated recently
Site is wooded with oaks, pines, and cypress trees
Site is wooded with cypress trees in campground
Site is wooded with pine trees
Site is pasture
Site is on side of road in a grassy area adjacent to pine forest
Site is in an open area with some trees
Site is in an open area with some trees
Site is on road at top of berm in a citrus grove. Soil was rocky and seemed highly compressed at surface
Site is on road at top of berm in citrus grove. Soil was rocky and appeared highly compressed at surface
Soil type
Pineda
Immokalee
Immokalee
Riviera
Riviera
Boca
Oldsmar
Immokalee
Malabar
Oldsmar
Immokalee
Immokalee
Holopaw
Holopaw, lime
Hallandale
Hallandale
Hallandale
Hallandale
Oldsmar
Boca
Boca
Pineda, lime
Pineda, lime
Land scape group
Rock
Flatwoods
Flatwoods
Slough
Slough
Rock
Slough
Flatwoods
Slough
Flatwoods
Flatwoods
Flatwoods
Depres sion
Rock
Rock
Rock
Rock
Rock
Flatwoods
Rock
Rock
Rock
Rock
6 Estimation of Infiltration Rates of Saturated Soils at Selected Sites in the Caloosahatchee River Basin
A more extensive evaluation of soil infiltration rates in these compacted disturbed soils could validate or clar ify rates reported herein. Additionally, soil characteris tics and landscape groups for these sites may not be appropriate for comparison with less disturbed sites having the same soil characteristics and within the same landscape groups.
Regression Analysis
Incremental soil infiltration rates, as a function of time, were plotted for each test; additionally, Hor- ton's equation was fitted by multiple nonlinear regres sion to estimate fc (the saturated soil infiltration rate). The time-series plots were examined for fit to Horton's equation and for providing reasonable estimates of fc based on the observed data. In all instances, the esti- mated/c is consistent with the data and with/c values in the literature for soils in southern Florida. The final sat urated soil infiltration rate with a 95-percent confi dence interval was computed based on the standard
error of the regression and the number of data points plotted.
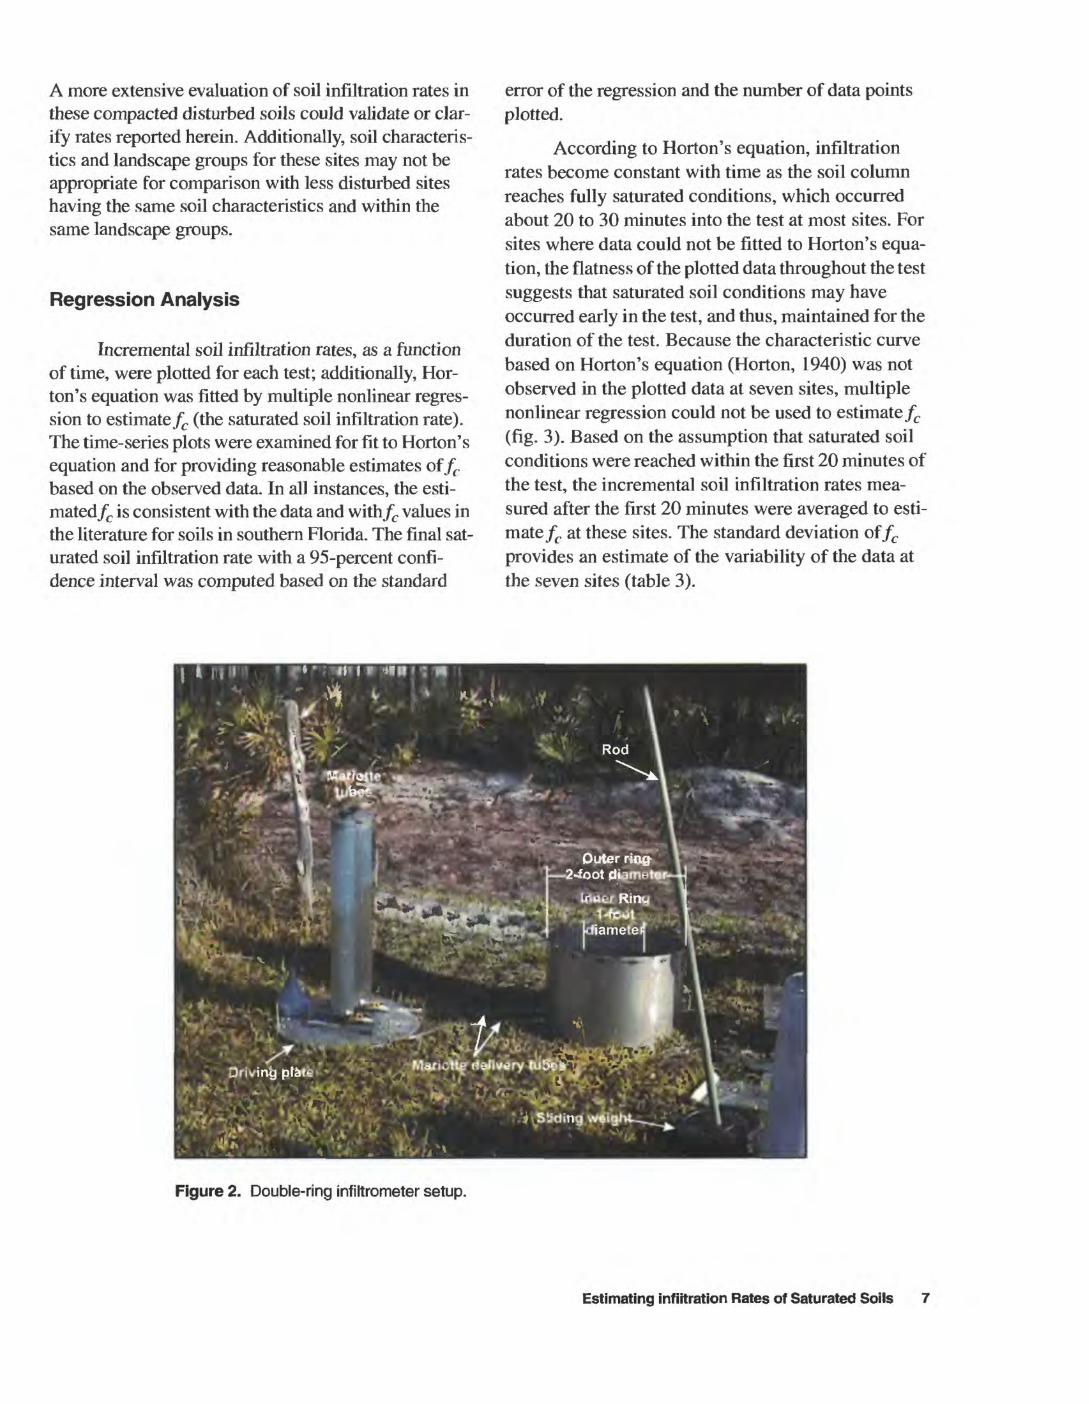
According to Horton's equation, infiltration rates become constant with time as the soil column reaches fully saturated conditions, which occurred about 20 to 30 minutes into the test at most sites. For sites where data could not be fitted to Horton's equa tion, the flatness of the plotted data throughout the test suggests that saturated soil conditions may have occurred early in the test, and thus, maintained for the duration of the test. Because the characteristic curve based on Horton's equation (Horton, 1940) was not observed in the plotted data at seven sites, multiple nonlinear regression could not be used to estimate fc (fig. 3). Based on the assumption that saturated soil conditions were reached within the first 20 minutes of the test, the incremental soil infiltration rates mea sured after the first 20 minutes were averaged to esti mate fc at these sites. The standard deviation of/c provides an estimate of the variability of the data at the seven sites (table 3).
Figure 2. Double-ring infiltrometer setup.
Estimating infiltration Rates of Saturated Soils
CC=30ICCUJ Q.
o:UJ
UJ
PzUJ0zUJ~
CCZ0H:CCtiLLz_lo_l
zUJ
UJCC0
IUU
90
80
70
60
50
40
30
20
10
(
60
50
40
30
20
10
°C
80
70
60
50
40
30
20
10
°C
250
200
150
100
50
n
SITES AIR = 50 cm/hr
* *
9 * * * * *
««« * * * * * * ««**
5 5 10 15 20 25 30 35 40 45 50 55 6(
ELAPSED TIME, IN MINUTES
SITE 8 AIR = 9.8 cm/hr*
.
*
* *
* *i i i i i i i i i i i i
) 5 10 15 20 25 30 35 40 45 50 55 60 6
ELAPSED TIME, IN MINUTES
SITE 12 AIR = 51 cm/hr#
* * * * * * ** * *
* *
^ * * * *
) 5 10 15 20 25 30 35 40 45 50 55 6(
ELAPSED TIME, IN MINUTES
SITE 13 AIR = 181 cm/hr
* * * * . * «
** * .
*
0 5 10 15 20 25 30 35 40 45
ELAPSED TIME, IN MINUTES
Figure 3. Soil infiltration rate as a function of time for sites where data could not be fitted to Norton's equation. The average infiltration rate (AIR) is for time periods greater than 20 minutes.
8 Estimation of Infiltration Ratas of Saturated Soils at Selected Sites in the Caloosahatchee River Basin

cc3§ccUJ Q_WCC
1FLJJ o
UJ
cc
o
cc
_1o w
LJJ
ccz
Figure 3.equation
»u
80
70
60
50
40
30
20
10
°(
i i i i i i i i i i i i i SITE 15 AIR = 48 cm/hr
»
* *
u ** ** ******* .**
r *
) 5 10 15 20 25 30 35 40 45 50 55 60 65 7C
ELAPSED TIME, IN MINUTES
120
100
80
60
40
20
0
SITE 20 » AIR = 64 cm/hr
* * ** *~ * * * *** ***** * * * -
** ** * *
.
*
) 5 10 15 20 25 30 35 40 45 50 55 60 65 70 75 80 8E
ELAPSED TIME, IN MINUTES
100
90
80
70
60
50
40
30
20
10
0
i i i i i i i i i i i
SITE 21 ^ AIR = 66 cm/hr
* *
****** * ** * -
* * *-
-
-
-
i i i i i i i i i i i0 5 10 15 20 25 30 35 40 45 50 55 &
ELAPSED TIME, IN MINUTES
Soil infiltration rate as a function of time for sites where data could not be fitted t< The average infiltration rate (AIR) is for time periods greater than 20 minutes-C
Estimating Infiltration Rates of Saturated Soils 9

Table 3. Estimates of infiltration rates of saturated soils based on average incremental infiltration rates for time periods greater than 20 minutes
[fc, saturated soil infiltration rate. Site 13 is located on berm where soil characteristics probably vary from undisturbed or less disturbed sites within the same landscape group]
StandardSite Landscape (cent|meters deviation
group % hour) (cent.meters ' per hour)
3 Flatwoods 50 7.58 Flatwoods 9.8 3.4
12 Flatwoods 51 8.813 Depression 181 2515 Rock 48 1220 Rock 64 1421 Rock 66 12
201816
o: 14=> 12O 10D: 8HI 60. 4CO PDC n
. , SITE1
"V *f= 9.17+ 14.02 e -°-115f ^S**^B * * *
. * * . <
t
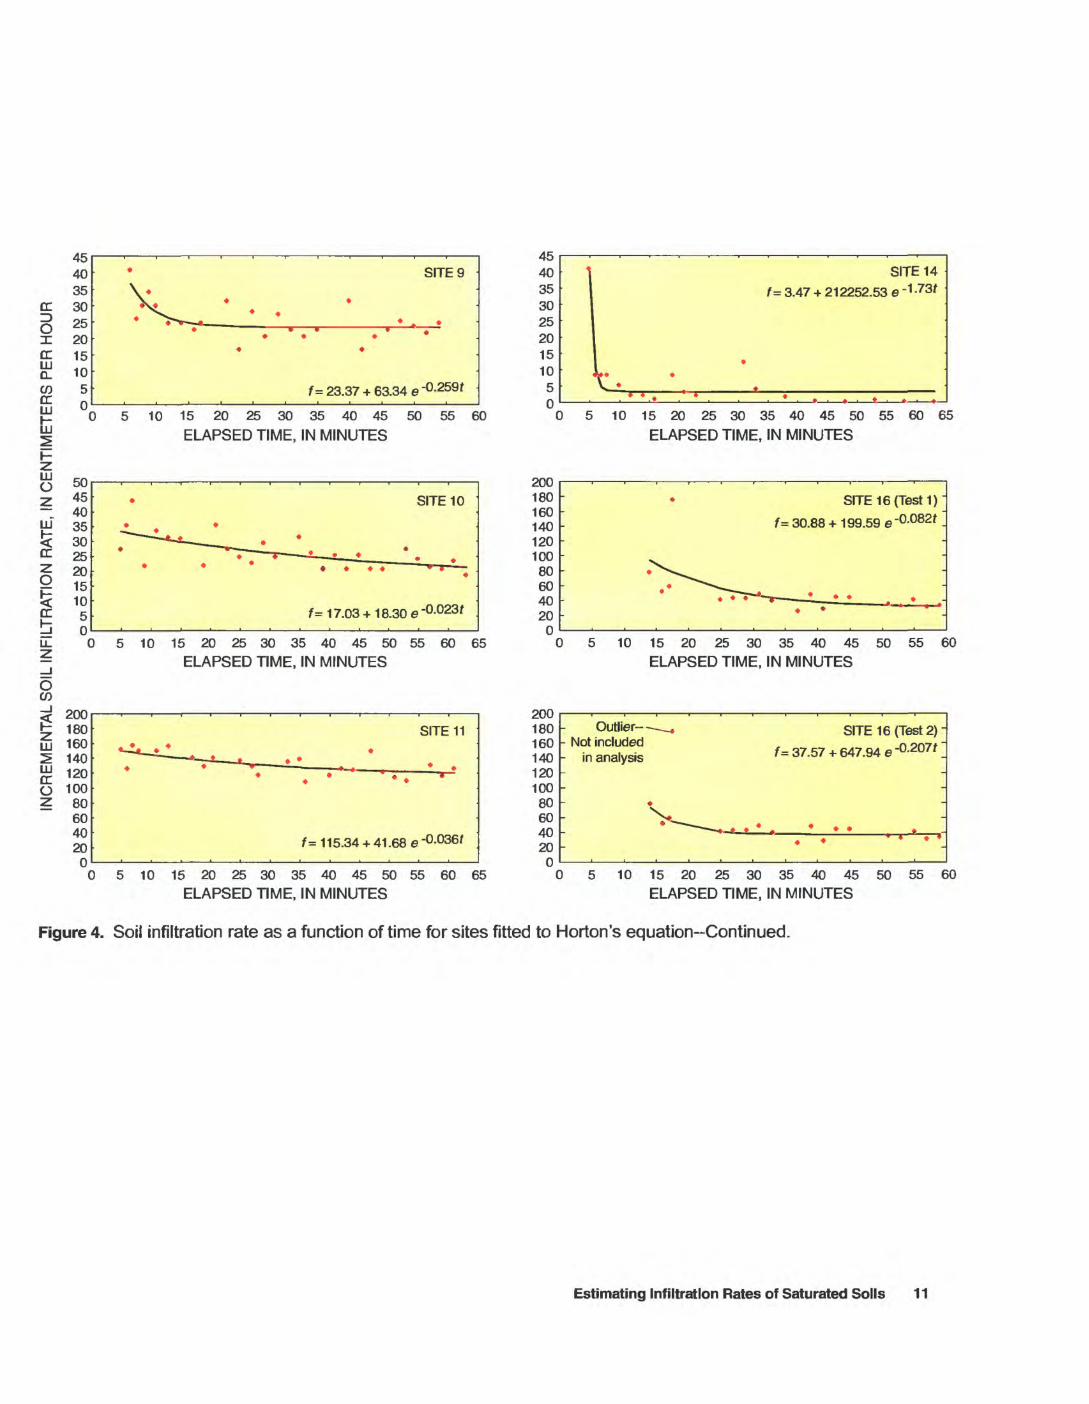
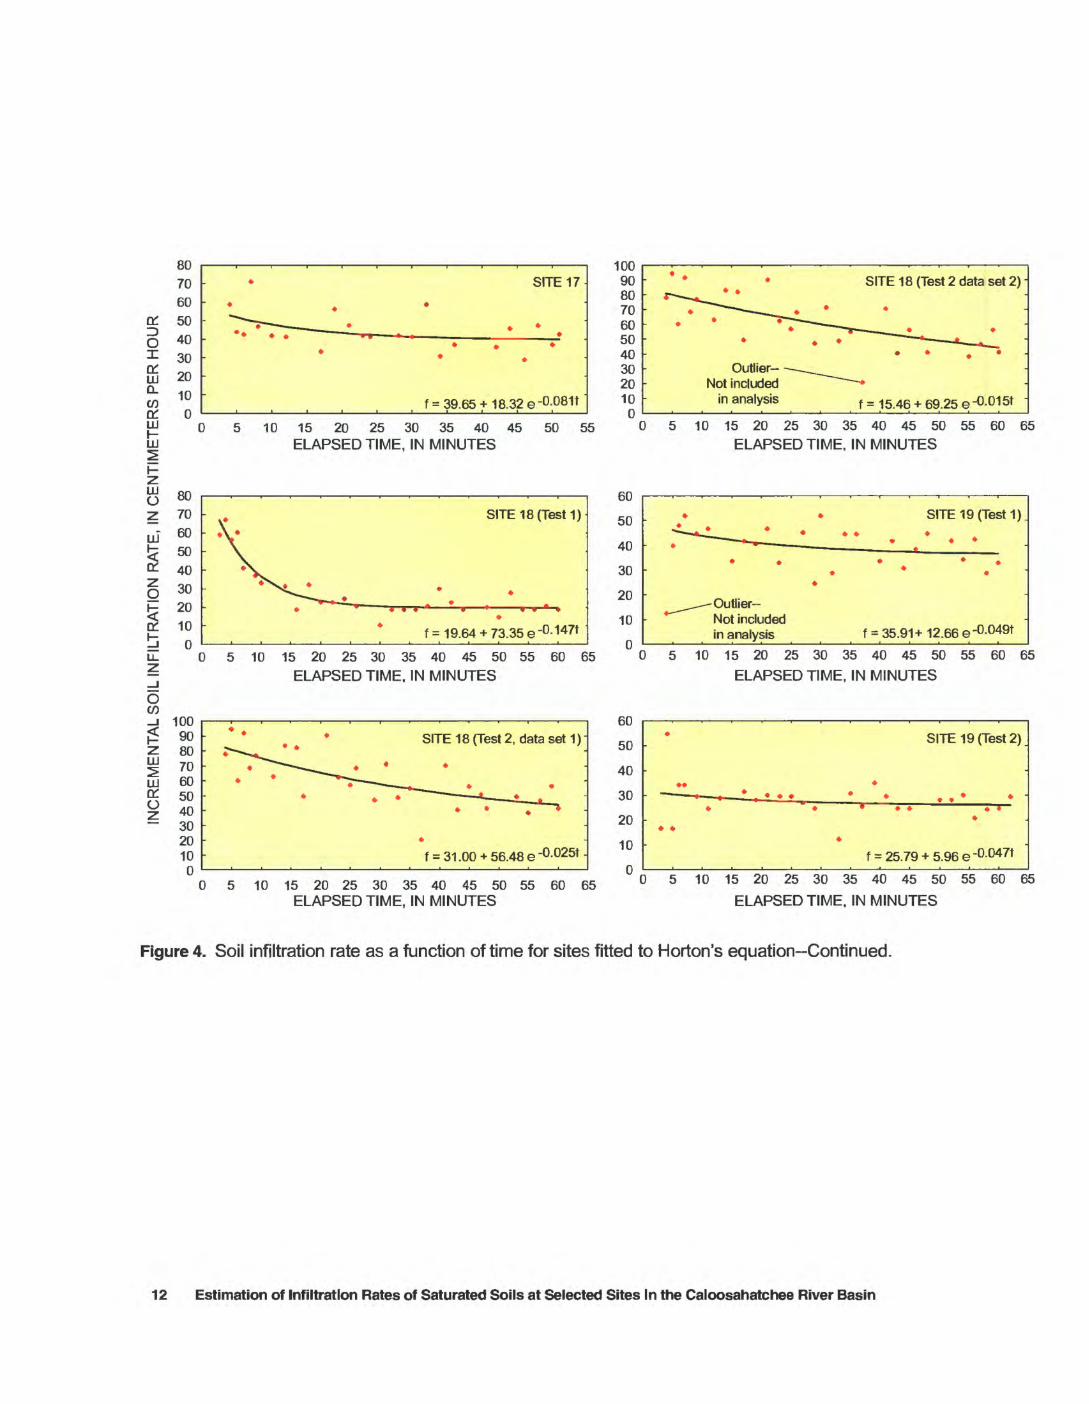
Data for 16 sites were fitted to Horton's equa tion by regression analysis (fig. 4). The difficulty in precisely measuring the water lost to infiltration at incremental times during the test probably resulted in the substantial amount of scatter in the plotted data. For sites 7, 16 (test 2), 19 (test 1), and 23 (test 2), the regression of Horton's equation converged only after removing an outlier value. The data were analyzed with and without outliers for site 18 (test 2); outliers were qualitatively determined. An analysis of the data sug gests that removing these outliers probably is insignif icant in estimating fc. The infiltration capacities based on the regression analysis for the 16 sites and the 95- percent confidence intervals for these estimates are listed in table 4.
5 10 15 20 25 30 35 40 45 50 55 60 65
ELAPSED TIME, IN MINUTES
50454035302520151050
SITE 5
f =2.47 + 57.47 a'0-292'
10 15 20 25 30 35 40 45 50 55 60
ELAPSED TIME, IN MINUTES
.TRATION RATE, IN C 100
80
60
40
20
n
. SITE 2
*
f = 62.34 + 32.09 e -0-1 30f
5 10152025303540455055606570
NCREMENTALSOIL5045 40 35 30 25 20 15 10 5 n
} SITE 4
^t *
* * * * * ** * *
* f= 14.65 + 115.78 e-0-462'
5 10 15 20 25 30 35 40 45 50 55 60 65
ELAPSED TIME, IN MINUTES
100
80
60
40
?0
n
SITE 6
^
>^-L^/ .' . . . .* " .''.
4
f = 49.20 + 46.76 e -0-097f
10152025303540455055606570 ELAPSED TIME, IN MINUTES
120
100
80
60
40
20
n
Outlier- -^__ Not included
in analysis
**>*- * * t «
-« SITE 7
» * . . *
f= 54.67 + 317 57 e -°-415f
5 10 15 20 25 30 35 40 45 50 55 ELAPSED TIME, IN MINUTES
Figure 4. Soil infiltration rate as a function of time for sites fitted to Horton's equation.
10 Estimation of Infiltration Rates of Saturated Soils at Selected Sites in the Caloosahatchee River Basin
LLJ
Z LLJ OZLLJ"
ccz O
50454035302520151050
cc o ccLLJ 0-CO CC LLJ
to 40 35 30
20 15 10
5 0
SITE 9
V. « ^^^^ * *
. " . * . "
f = 23.37 + 63.34 e -0-259f
T K -in -IR on OR *an QR ^n ^R Rn RR c
ELAPSED TIME, IN MINUTES
SITE 10
1 = 1 7.03 + 1 8.30 e -0-023'
5 10 15 20 25 30 35 40 45 50 55 60 65 ELAPSED TIME, IN MINUTES
O CO_l <pLLJ^LLJ CCOZ
200180160140120100806040 20
n
SITE 11«-!»» * ' * *~ *~~ i t » *
A ^ * . * *
f= 115.34 + 41.68 e-°-°36'
5 10 15 20 25 30 35 40 45 50 55 60 65 ELAPSED TIME, IN MINUTES
454035302520151050
200180160140120100806040200
SITE 14
f = 3.47 + 212252.53 e ~ 1 -73t
r.5 10 15 20 25 30 35 40 45 50 55 60 65
ELAPSED TIME, IN MINUTES
SITE 16 (Test 1)
1= 30.88 + 199.59 e'°-082f -
5 10 15 20 25 30 35 40 45 50 55 60
ELAPSED TIME, IN MINUTES
180 160 1401201008060 4020
n
Outlier----^ - Not included - in analysis--
i*- _
-
SITE 16 (Test 2)- 1 = 37.57 + 647.94 e -0-207A
---
-» » *, « ._ ' * * *.
10 15 20 25 30 35 40 45 50 55 60 ELAPSED TIME, IN MINUTES
Figure 4. Soil infiltration rate as a function of time for sites fitted to Horton's equation-Continued.
Estimating Infiltration Rates of Saturated Soils 11
OL
0
OL UJ Q.M rv
70
60
50
40
30
20
10 n
SITE 17
.
* * *
f = 39.65 + 18.32 e-0-081t
UJ10 15 20 25 30 35 40 45
ELAPSED TIME, IN MINUTES50 55
1009080706050403020100
SITE 18 (Test 2 data set 2) -
Outlier- - Not Included
In analysis f = 15.46 +69.25 e-°-015t
10 15 20 25 30 35 40 45 50 55 60 65 ELAPSED TIME, IN MINUTES
UJ 0zUJ
£pct!
O
h
80 7060504030 20 10
n
. SITE 18 (Test 1)X .\
*v
^^^A^- i_^ » » » * > i » ' »
f= 19.64 + 73.35 e-°- 147t
5 10 15 20 25 30 35 40 45 50 55 60 65 ELAPSED TIME, IN MINUTES
60
50
40
30
20
10
0
SITE 19 (Test 1).
Not included in analysis f = 35.91+ 12.66 e-°-049t
5 10 15 20 25 30 35 40 45 50 55 60 65
ELAPSED TIME, IN MINUTES
UJ
1009080706050403020100
SITE 18 (Test 2, data set 1)
f = 31.00 + 56.48e-°-025t -
5 10 15 20 25 30 35 40 45 50 55 60 65 ELAPSED TIME, IN MINUTES
60
50
40
30
20
10
SITE 19 (Test 2).
f = 25.79 +5.96 e-°-047t
5 10 15 20 25 30 35 40 45 50 55 60 65
ELAPSED TIME, IN MINUTES
Figure 4. Soil infiltration rate as a function of time for sites fitted to Norton's equation-Continued.
12 Estimation of Infiltration Rates of Saturated Soils at Selected Sites In the Caloosahatchee River Basin

cc0XccLU0.
M CC
LU
1LUOzLUttCCz ot̂ccbLL
/u
60
50
40
30
20
10
0 C
60
50
40
30
20
10
O
SITE 22
.
.
^^^Lll_^ . * . ' ' '
i 31 .79 + 20.86 G
5 10 15 20 25 30 35 40 45 50 55 60 6ELAPSED TIME, IN MINUTES
SITE 23 (Test 1) .
.""""" J * __________
* » * '
*.
^=29.38 + 7.99 e'0-037'
0 5 10 15 20 25 30 35 40 45 50 55 60 ELAPSED TIME, IN MINUTES
INCREME50
40
30
20
10
n
SITE 23 (Test 2)
IV-.- .. . * * * ' *.
Not included in analysis /= 31 .61 + 1 1 5.01 e -0.456f
5 10 15 20 25 30 35 40 45 50 55 60 ELAPSED TIME, IN MINUTES
Figure 4. Soil infiltration rate as a function of time for sites fitted to Horton's equation-Continued.
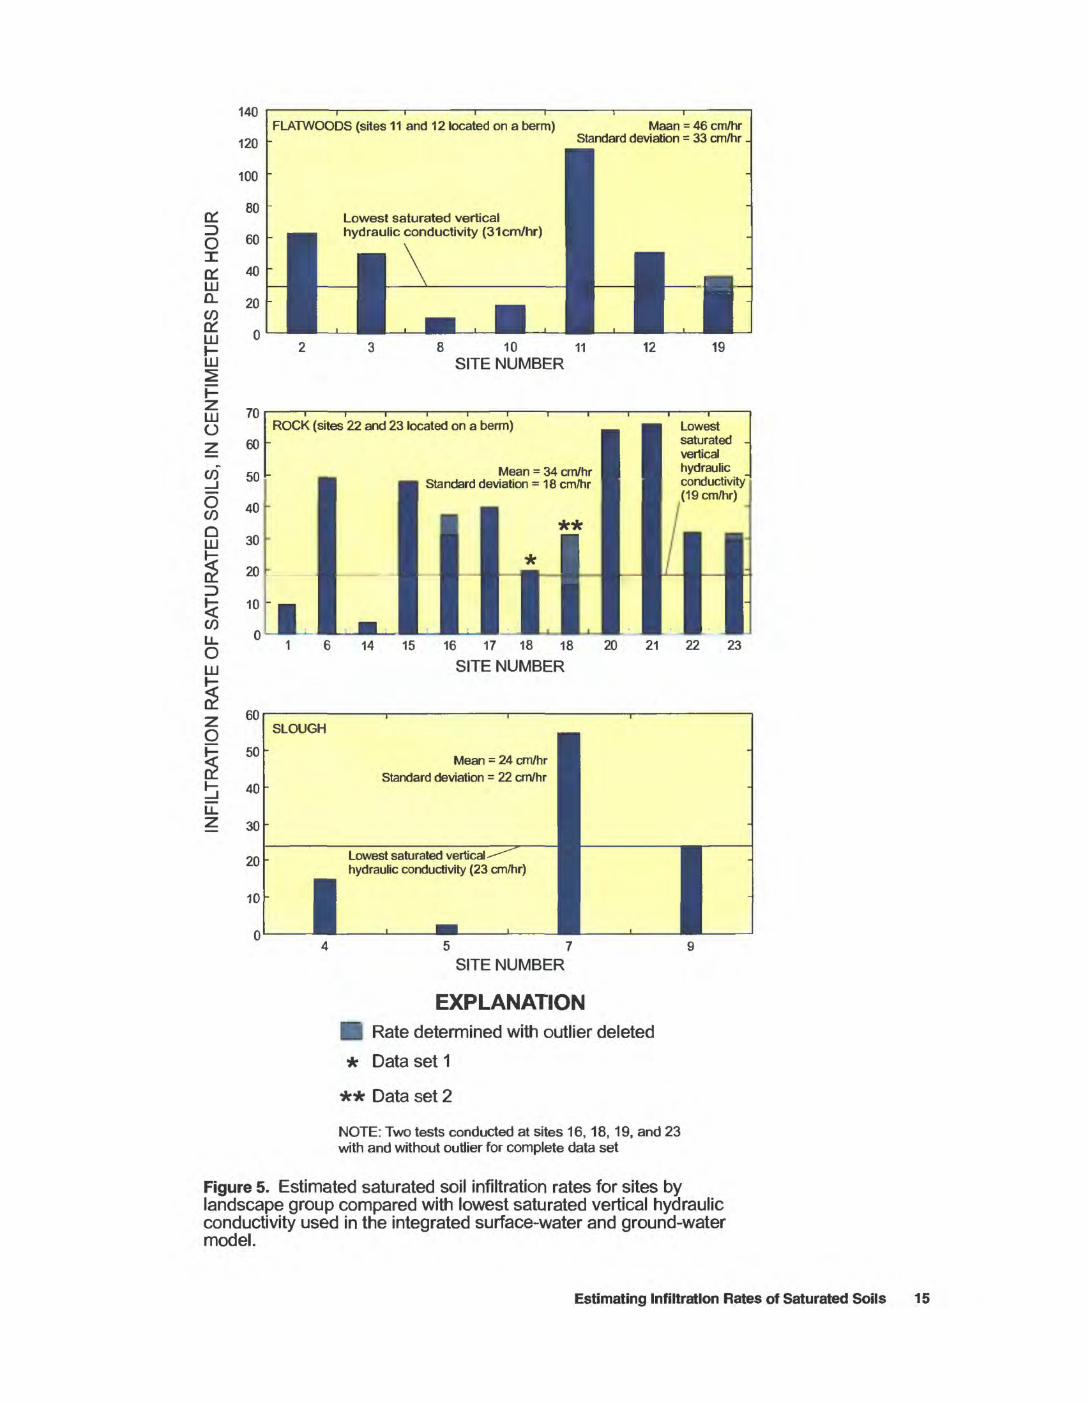
Estimated fc values are plotted for each land scape group and compared to the lowest saturated vertical hydraulic conductivity in the top 0.5 m (meter) of the "typical" model soil profiles used in the ISWGW model (fig. 5). This comparison is based on the assumption that the infiltration test wetted only the top 0.5 m of soil - an assumption that may not have been accurate for all tests. The mean and standard deviation of the estimated fc are computed for the landscape groups having four or more tests.
The estimated infiltration rates of saturated soils ranged from 9.8 to 115 cm/hr (centimeters per hour) in the flatwoods landscape group, 3.4 to 66 cm/hr in the rock landscape group, and 2.5 to 55 cm/hr in the slough landscape group (fig. 5). For the depression landscape group, represented by site 13, the estimated saturated soil infiltration rate was 181 cm/hr and the lowest satu rated vertical hydraulic was 2.7 cm/hr. Five sites (11, 12, 13, 22, and 23) were located on irrigation control berms. Infiltration rates of the highly compacted and rocky soil may not represent the rates of less disturbed soils at sites within the same landscape groups.
Estimating Infiltration Rates of Saturated Soils 13
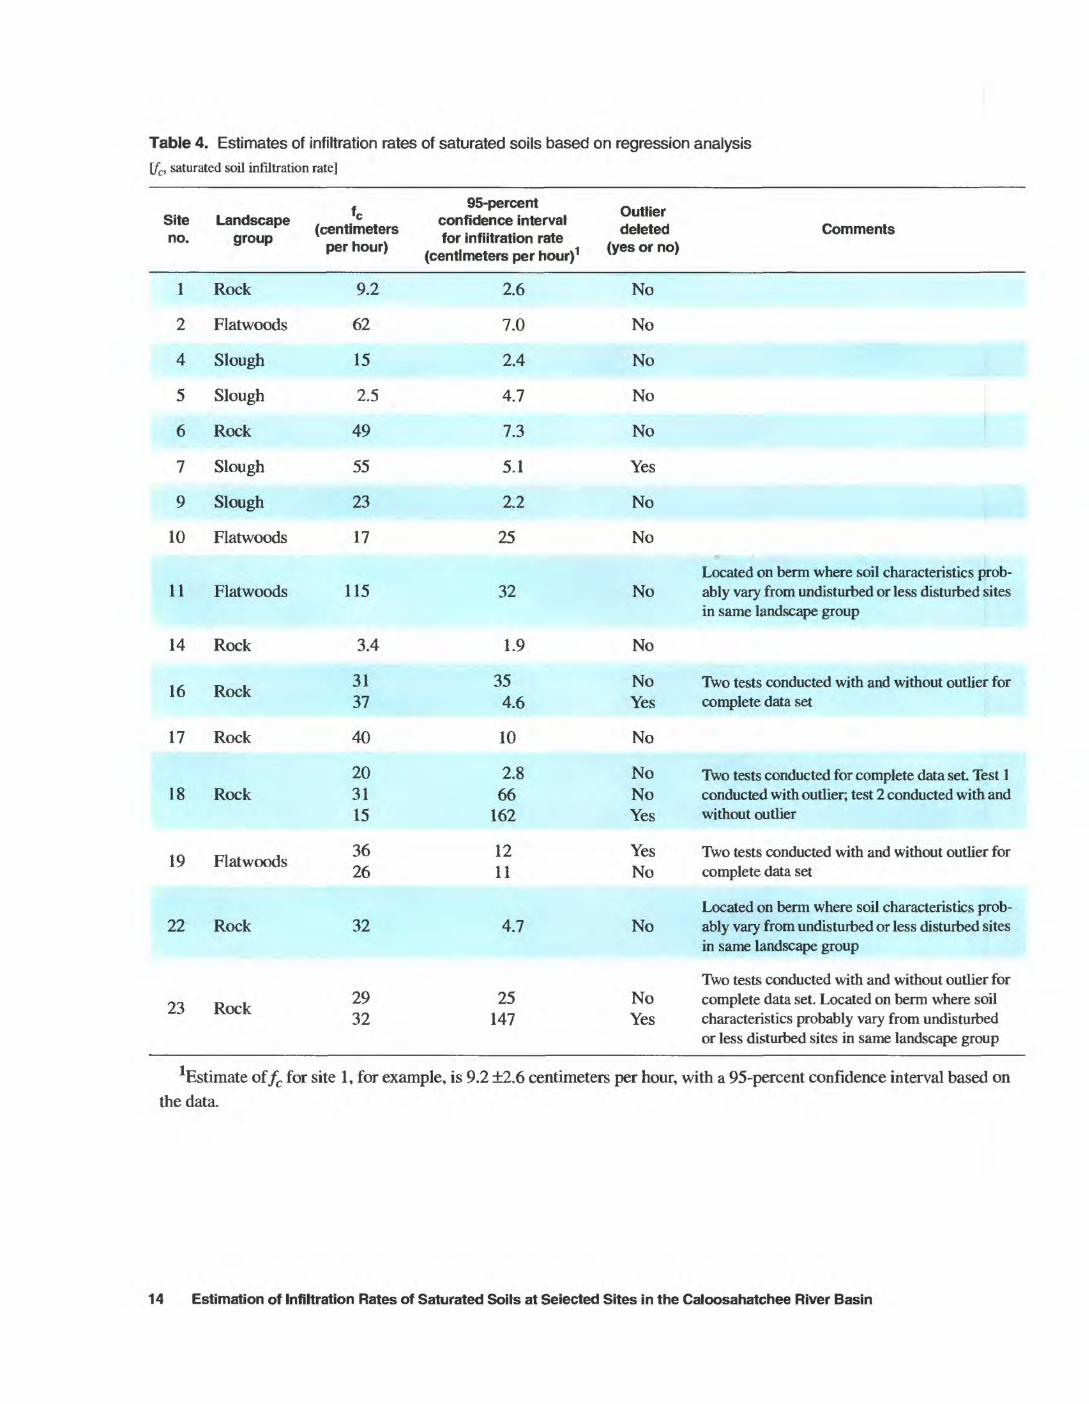
Table 4. Estimates of infiltration rates of saturated soils based on regression analysis[fc, saturated soil infiltration rate]
Site no.
1
2
4
5
6
7
9
10
11
14
16
17
18
19
Landscape group
Rock
Flatwoods
Slough
Slough
Rock
Slough
Slough
Flatwoods
Flatwoods
Rock
Rock
Rock
Rock
Flatwoods
. 95-percent , ..= confidence interval " u, . e' (centimeters for infiitration rate deleted Comments
perhour) (centimeters per hour)1 <yes °'"°>
9.2
62
15
2.5
49
55
23 __ r
17
115
3.4"^ 31
37
40
20 3115
36 26
2.6
7.0
2.4
4.7
7.3
5.1
2.2
25
32
1.9
35 4.6
10
2.8 66
162
12 11
No
No
No
No
No
Yes
No
No
No
No
No Yes
No
No NoYes
YesNo
+ -
__
Located on berm where soil characteristics prob ably vary from undisturbed or less disturbed sites in same landscape group
Two tests conducted with and without outlier for complete data set
Two tests conducted for complete data set. Test 1 conducted with outlier; test 2 conducted with andwithout outlier
Two tests conducted with and without outlier for complete data set
22 Rock
23 Rock
32
2932
4.7
25147
Located on berm where soil characteristics prob- No ably vary from undisturbed or less disturbed sites
in same landscape group
Two tests conducted with and without outlier for No complete data set. Located on berm where soil Yes characteristics probably vary from undisturbed
or less disturbed sites in same landscape group
Estimate of/c for site 1, for example, is 9.2 ±2.6 centimeters per hour, with a 95-percent confidence interval based on the data.
14 Estimation of Infiltration Rates of Saturated Soils at Selected Sites in the Caloosahatchee River Basin
140
120
100
o: 80O 60 ia: 40 LU °- 20
in 0
FLATWOODS (sites 11 and 12 located on a berm) Maan = 46 cm/hr
Lowest saturated vertical hydraulic conductivity (31cm/hr)
8 10SITE NUMBER
11 19
LU O
O W Q LU
LL O LU
70
60
50
40
30
20
10
0
ROCK (sites 22 and 23 located on a berm) Lowest saturated - vertical hydraulic conductivity (19 cm/hr)
Mean = 34 cm/hr Standard deviation = 18 cm/hr
14 15 16 17 18 18
SITE NUMBER
20 21 22 23
Mean = 24 cm/hr Standard deviation = 22 cm/hr
Lowest saturated vertical hydraulic conductivity (23 cm/hr)
5 7 SITE NUMBER
EXPLANATIONH Rate determined with outlier deleted
* Data set 1
** Data set 2
NOTE: Two tests conducted at sites 16, 18, 19, and 23 with and without outlier for complete data set
Figure 5. Estimated saturated soil infiltration rates for sites by landscape group compared with lowest saturated vertical hydraulic conductivity used in the integrated surface-water and ground-water model.
Estimating Infiltration Rates of Saturated Soils 15

CONCLUSIONS
The high infiltration rates of saturated soils in the Caioosahatchee River Basin made collection of accu rate double-ring infiltrometer data difficult. Several factors influenced the tests including the fact that stan dard infiltrometer water-supply reservoirs could not deliver enough water at the needed rates; measuring rapidly changing water levels was difficult, and there fore, subject to inaccuracy; and local site features such as atypical root density, large rocks below land surface, or areas of compaction not visible at the surface may have affected individual test results.
Verification of assumptions used in this study requires more extensive data-collection efforts, such as using augers or backhoes to penetrate below land sur face following an infiltration test to verify vertical flow, homogeneous soil profiles, and actual depth of saturation. Potentiometers could be used to verify the assumption of unit hydraulic gradient with depth. In some places where the water table is shallow, water mounding under the infiltrometer produces a "back pressure" and an equilibrium hydraulic gradient that is less than one. For this study, tests were conducted dur ing a drought period in April 1999, when the water table was expected to be well below the soil layers saturated for this analysis.
REFERENCES CITED
American Society for Testing and Materials, 1994, Standard test method for infiltration rate of soils in field using double-ring infiltrometer: ASTM Publication D-3385-94,7 p.
Horton, R.E., 1940, An approach towards a physical inter pretation of infiltration capacity: Soils Science Society of America Proceedings, v. 5, p. 399-417.
Jacobsen, T.V., 1999, Caioosahatchee Basin Integrated Sur face Water-Ground Water Model: Danish Hydraulic Institute Report, 106 p.
Rubin, J., and Steinhardt, R., 1963, Soils water relations dur ing rain infiltration; Part 1 Theory: Soils Science Soci ety of America Proceedings, v. 27, p. 246-251.
Rubin, J., Steinhardt, R., and Reiniger, P., 1964, Soil water relations during rain infiltration: Part II Moisture con tent profiles during rains of low intensities: Soils Sci ence Society of America Proceedings, v. 28, p. 1-5.
16 Estimation of infiltration Rates of Saturated Soiis at Seiected Sites in the Caioosahatchee River Basin