Embed Size (px)
Citation preview
The U.S. Department of Energy Hydrogen and Fuel Cells
Mark PasterU.S. Department of Energy
Hydrogen, Fuel Cells and Infrastructure Program
January, 2005
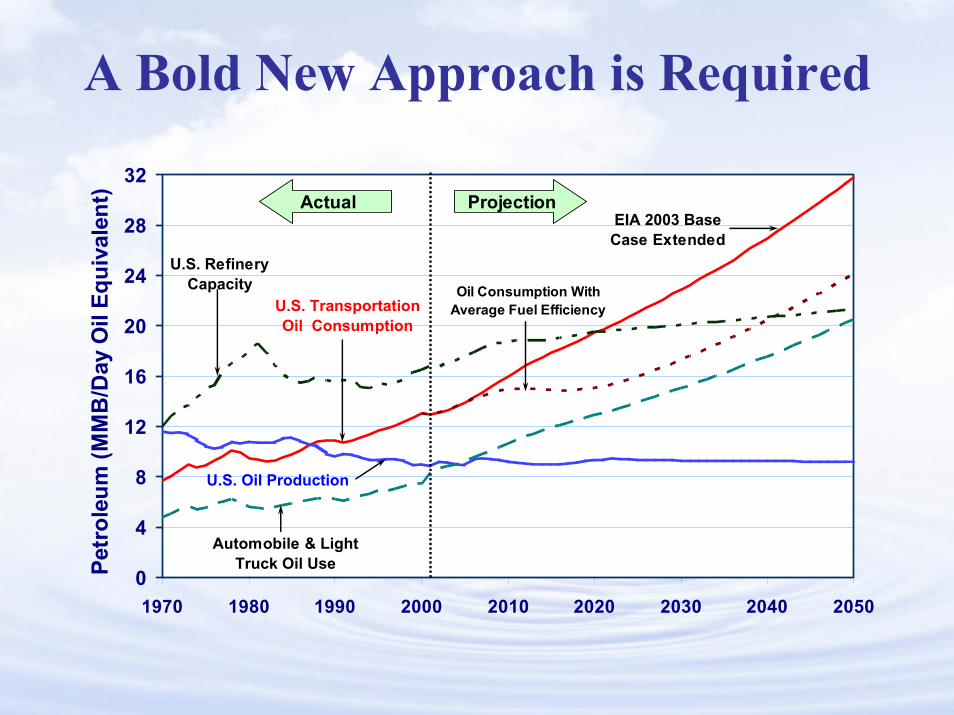
A Bold New Approach is Required
0
4
8
12
16
20
24
28
32
1970 1980 1990 2000 2010 2020 2030 2040 2050
Petr
oleu
m (M
MB
/Day
Oil
Equi
vale
nt) Actual Projection
U.S. Oil Production
EIA 2003 Base Case Extended
Oil Consumption With Average Fuel Efficiency
Automobile & Light Truck Oil Use
U.S. Transportation Oil Consumption
U.S. Refinery Capacity
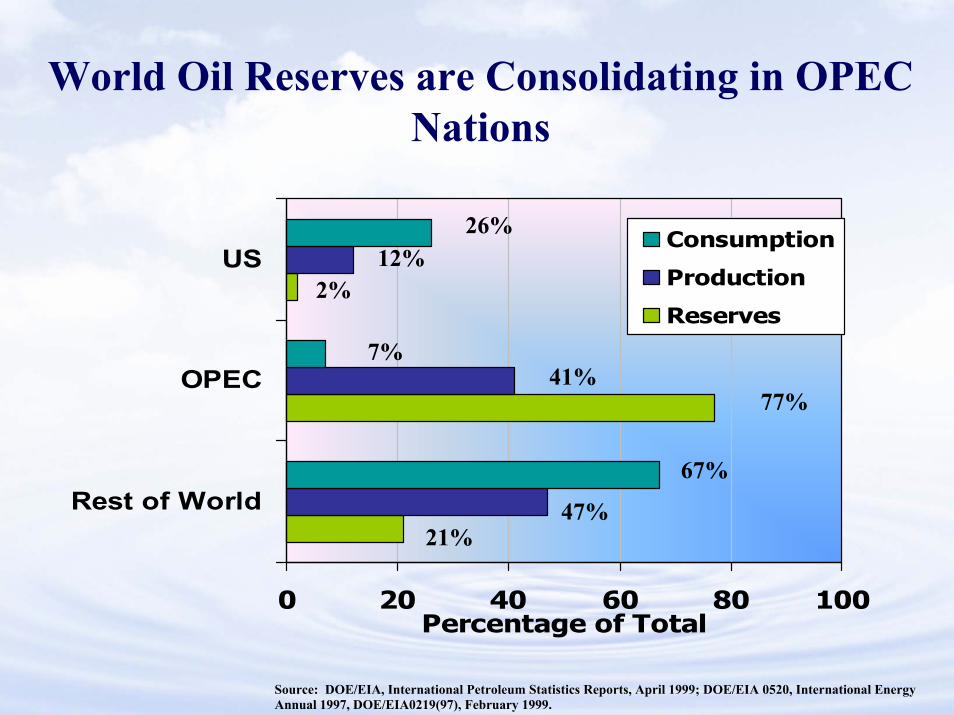
World Oil Reserves are Consolidating in OPEC Nations
0 20 40 60 80 100
Rest of World
OPEC
US
Percentage of Total
Consumption
Production
Reserves2%
12%26%
7%41%
77%
67%
47%21%
Source: DOE/EIA, International Petroleum Statistics Reports, April 1999; DOE/EIA 0520, International Energy Annual 1997, DOE/EIA0219(97), February 1999.

0
10
20
30
40
50
60
70
80
90
100
CO NOx VOC SOx PM10 PM2.5 CO2
ElectricityBuildingsIndustryTransport
U.S. 1998 Energy-Linked Emissions as Percentage of Total Emissions
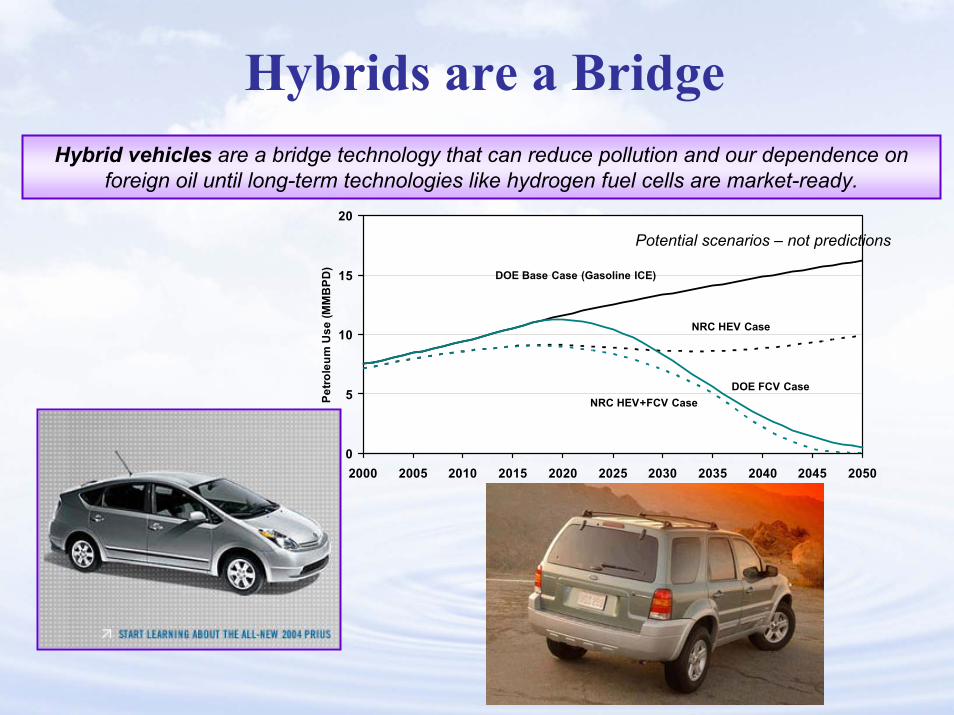
Hybrids are a Bridge
0
5
10
15
20
2000 2005 2010 2015 2020 2025 2030 2035 2040 2045 2050
Petro
leum
Use
(MM
BPD
)
DOE Base Case (Gasoline ICE)
NRC HEV Case
DOE FCV Case NRC HEV+FCV Case
Potential scenarios – not predictions
Hybrid vehicles are a bridge technology that can reduce pollution and our dependence on foreign oil until long-term technologies like hydrogen fuel cells are market-ready.
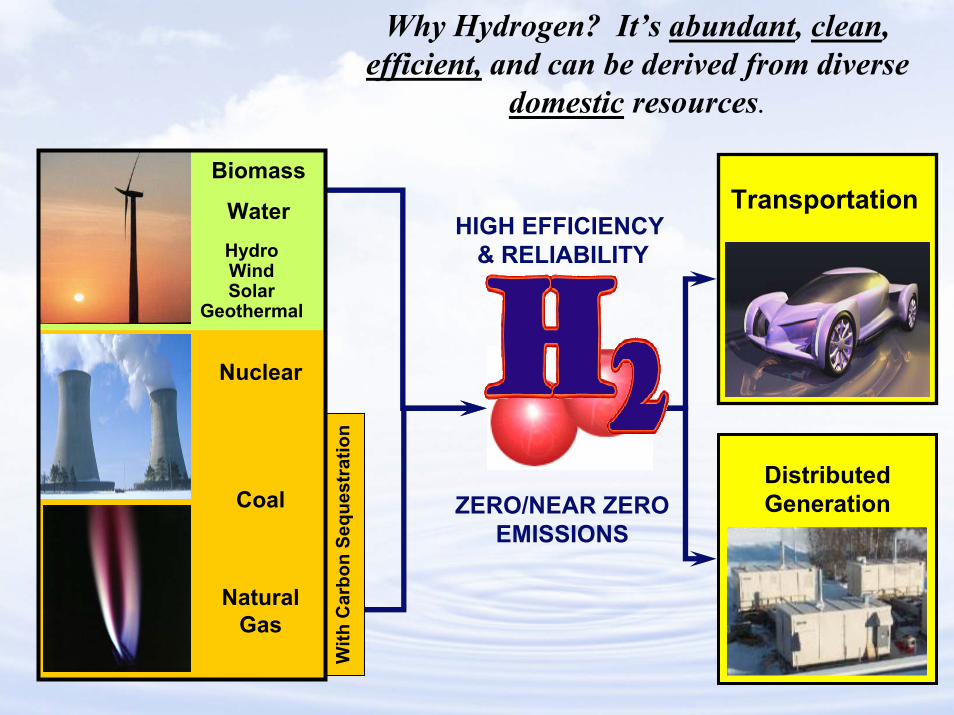
Why Hydrogen? It’s abundant, clean, efficient, and can be derived from diverse
domestic resources.
.
Distributed Generation
TransportationBiomass
WaterHydroWindSolar
Geothermal
Coal
Nuclear
NaturalGas
With
Car
bon
Sequ
estr
atio
n
HIGH EFFICIENCY& RELIABILITY
ZERO/NEAR ZEROEMISSIONS
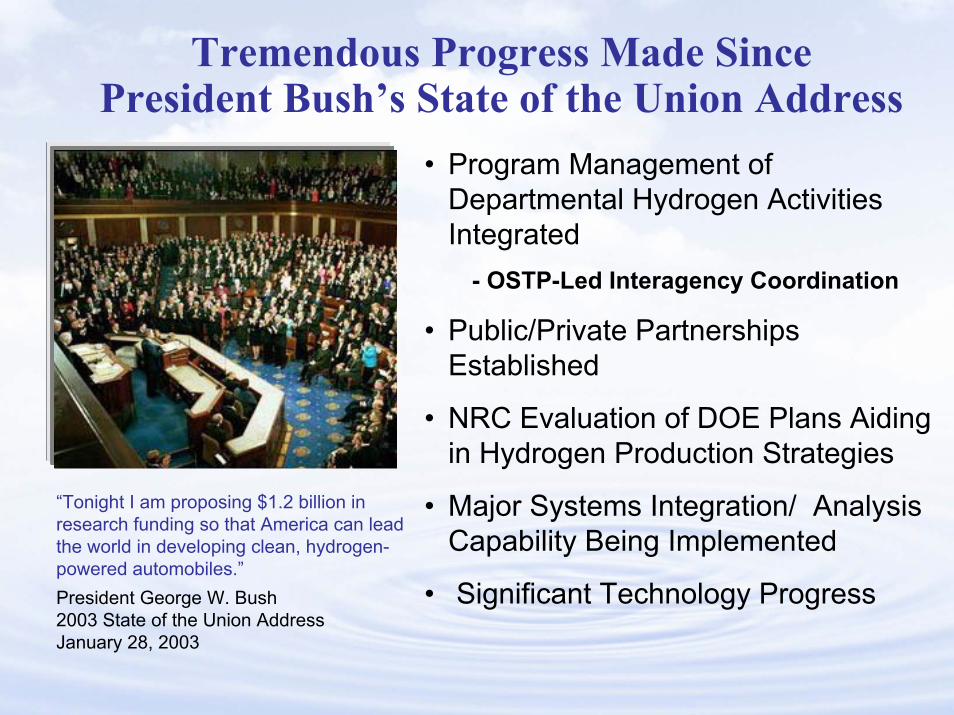
Tremendous Progress Made Since President Bush’s State of the Union Address
President George W. Bush2003 State of the Union AddressJanuary 28, 2003
“Tonight I am proposing $1.2 billion in research funding so that America can lead the world in developing clean, hydrogen-powered automobiles.”
• Program Management of Departmental Hydrogen Activities Integrated
- OSTP-Led Interagency Coordination
• Public/Private Partnerships Established
• NRC Evaluation of DOE Plans Aiding in Hydrogen Production Strategies
• Major Systems Integration/ Analysis Capability Being Implemented
• Significant Technology Progress
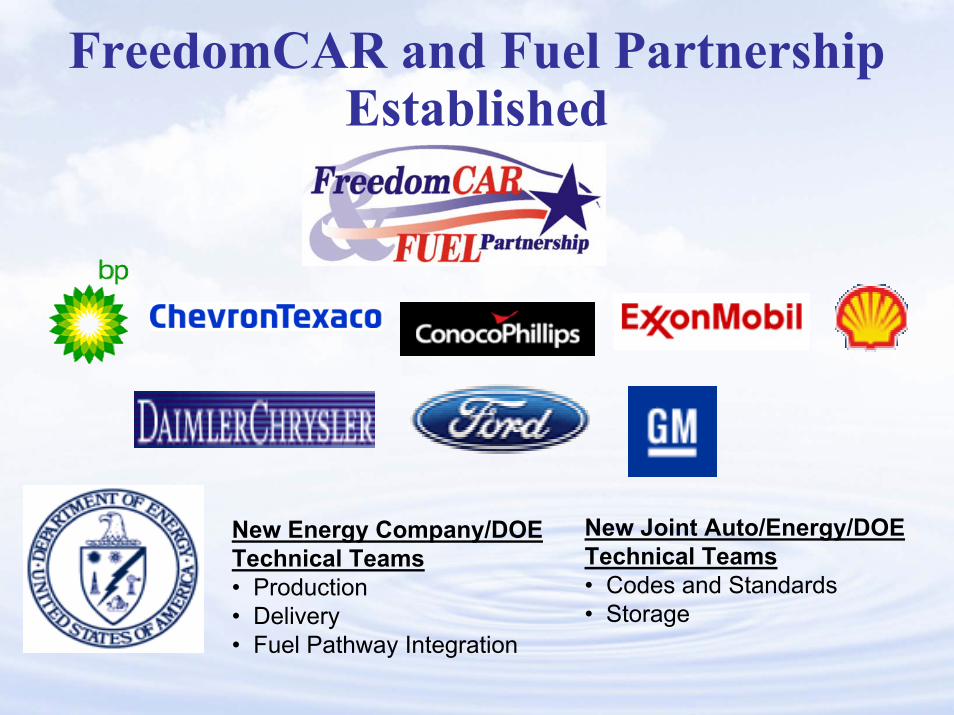
FreedomCAR and Fuel Partnership Established
New Energy Company/DOETechnical Teams• Production• Delivery• Fuel Pathway Integration
New Joint Auto/Energy/DOETechnical Teams• Codes and Standards• Storage
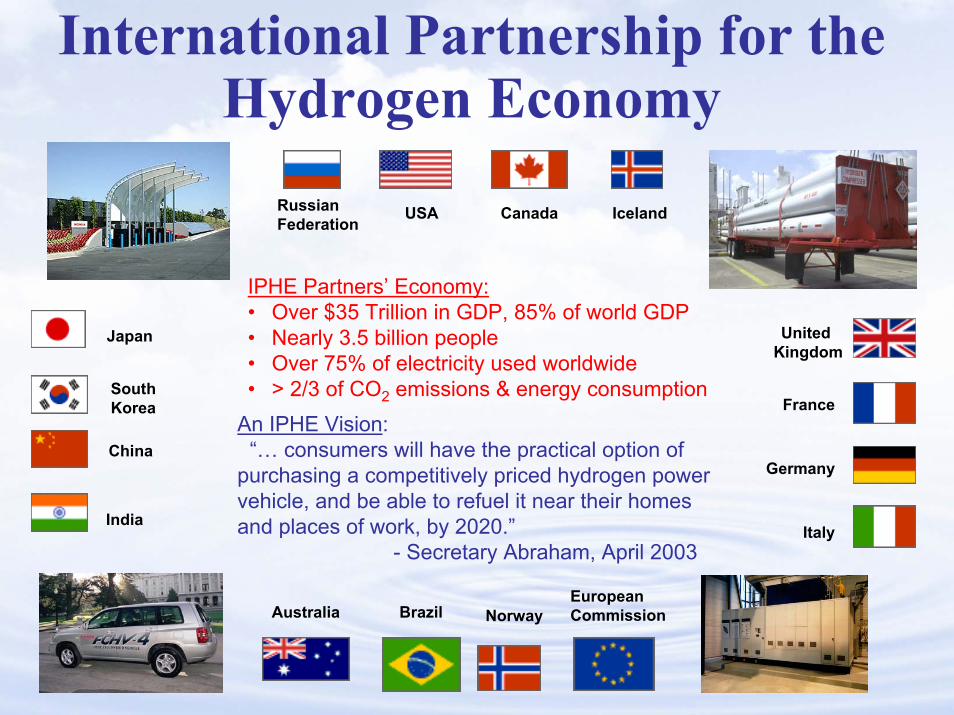
International Partnership for the Hydrogen Economy
Japan
USA IcelandCanadaRussianFederation
South Korea
IPHE Partners’ Economy:• Over $35 Trillion in GDP, 85% of world GDP• Nearly 3.5 billion people• Over 75% of electricity used worldwide • > 2/3 of CO2 emissions & energy consumption
United Kingdom
FranceAn IPHE Vision:
“… consumers will have the practical option of purchasing a competitively priced hydrogen power vehicle, and be able to refuel it near their homes and places of work, by 2020.”
- Secretary Abraham, April 2003
ChinaGermany
IndiaItaly
EuropeanCommissionAustralia Brazil Norway
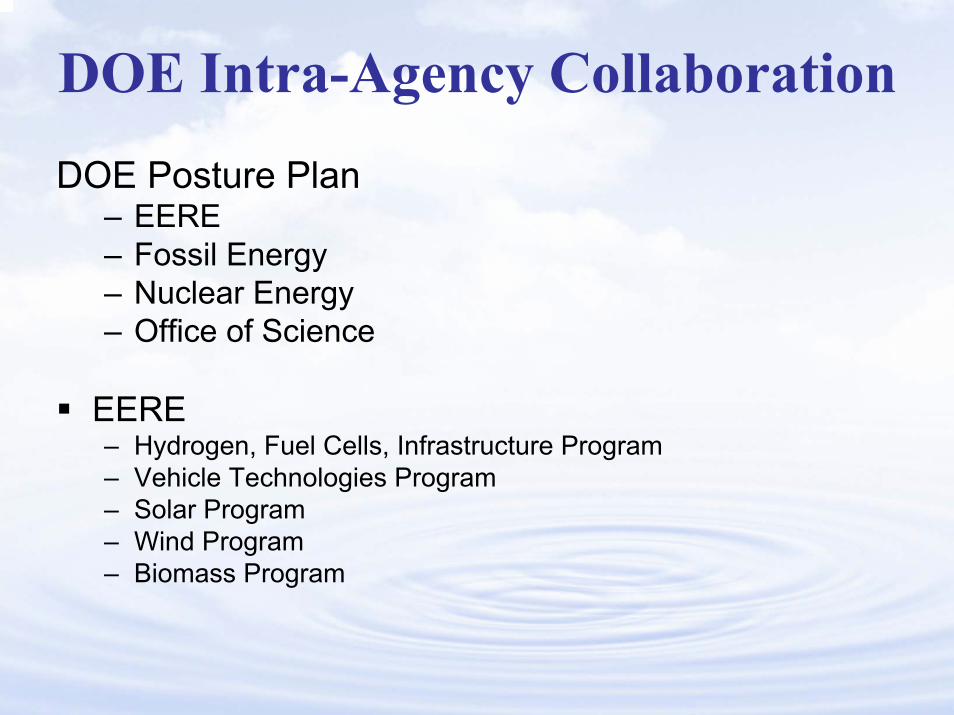
DOE Intra-Agency CollaborationDOE Posture Plan
– EERE – Fossil Energy– Nuclear Energy– Office of Science
EERE– Hydrogen, Fuel Cells, Infrastructure Program– Vehicle Technologies Program– Solar Program– Wind Program– Biomass Program
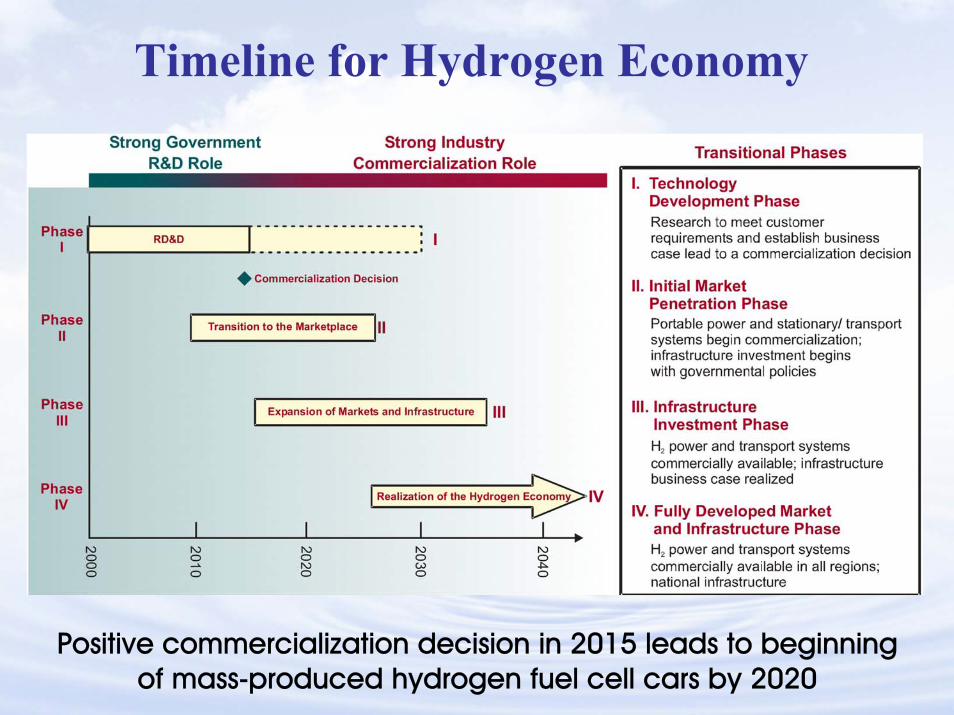
Timeline for Hydrogen Economy
Positive commercialization decision in 2015 leads to beginningof mass-produced hydrogen fuel cell cars by 2020
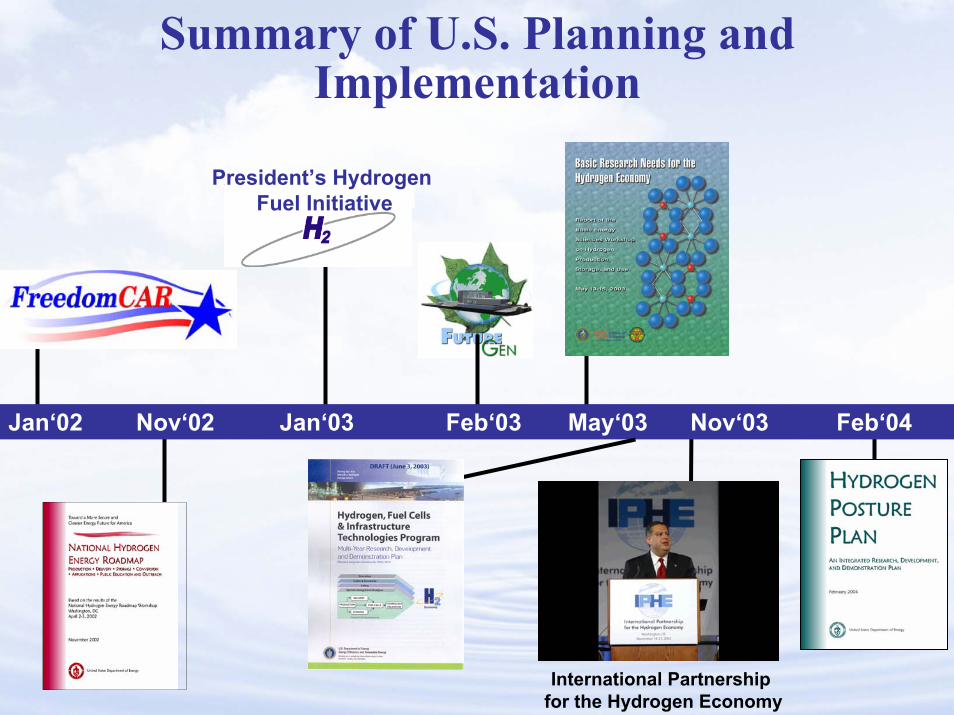
Summary of U.S. Planning and Implementation
Jan‘02 Nov‘02 Jan‘03 Feb‘03 Nov‘03May‘03
President’s Hydrogen Fuel Initiative
Feb‘04
International Partnership for the Hydrogen Economy
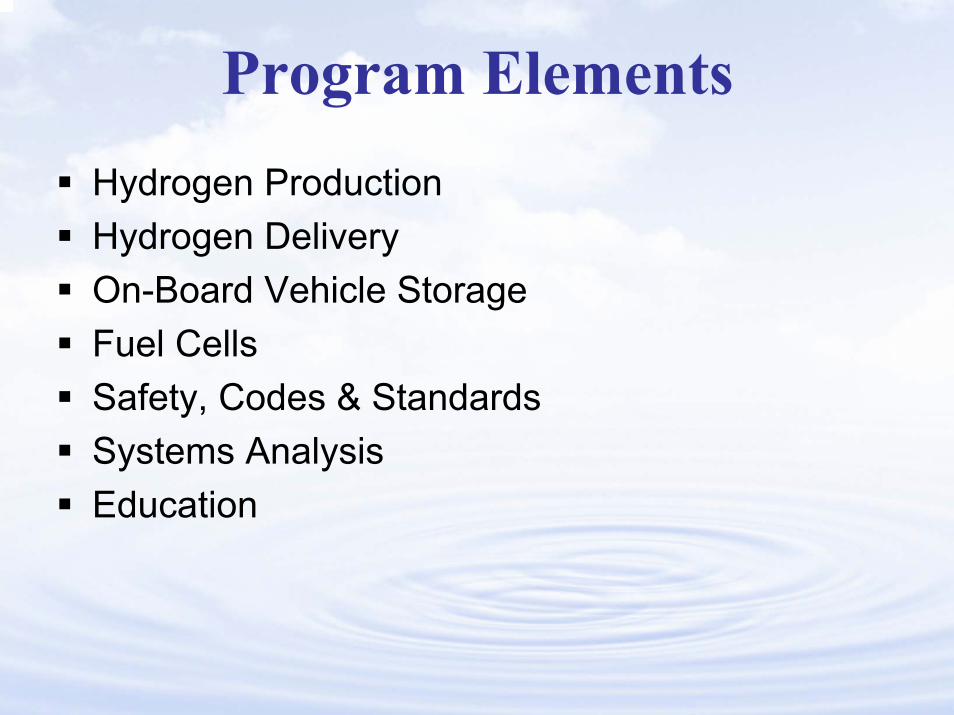
Program ElementsHydrogen ProductionHydrogen DeliveryOn-Board Vehicle StorageFuel CellsSafety, Codes & StandardsSystems AnalysisEducation
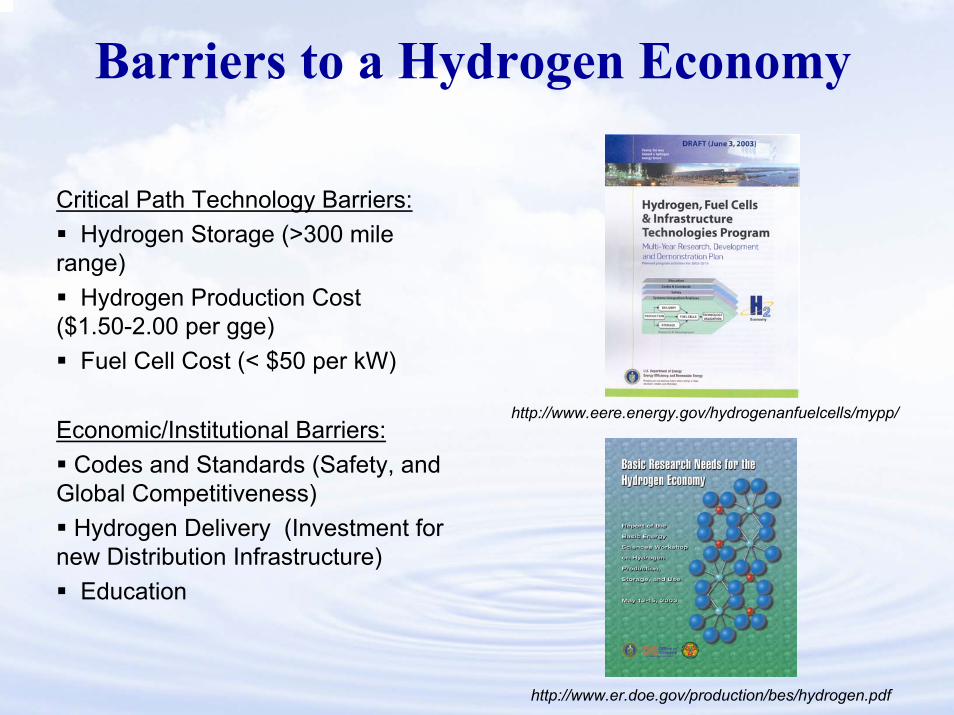
Barriers to a Hydrogen Economy
Critical Path Technology Barriers:Hydrogen Storage (>300 mile
range)Hydrogen Production Cost
($1.50-2.00 per gge)Fuel Cell Cost (< $50 per kW)
Economic/Institutional Barriers:Codes and Standards (Safety, and
Global Competitiveness)Hydrogen Delivery (Investment for
new Distribution Infrastructure) Education
http://www.er.doe.gov/production/bes/hydrogen.pdf
http://www.eere.energy.gov/hydrogenanfuelcells/mypp/

No current H2 storage technology meets the targets
$12
$16
$6
$16
$8
$4
$2
0 5 10 15 20
5000 psi gas
10000 psi gas
Liq. H2
Complexhydride
Chemicalhydride
2010 target
2015 target
$ per kWh
2.1
1.9
2.0
1.6
2.0
3.0
0.8
1.3
1.6
1.4
1.5
2.7
0.80.6
0 1 2 3 4
5000 psi gas
10000 psigas
Liq. H2
Complexhydride
Chemicalhydride
2010 target
2015 target
kWh/lkWh/kg
Volumetric & Gravimetric Energy Density Cost per kWh, $/kWh
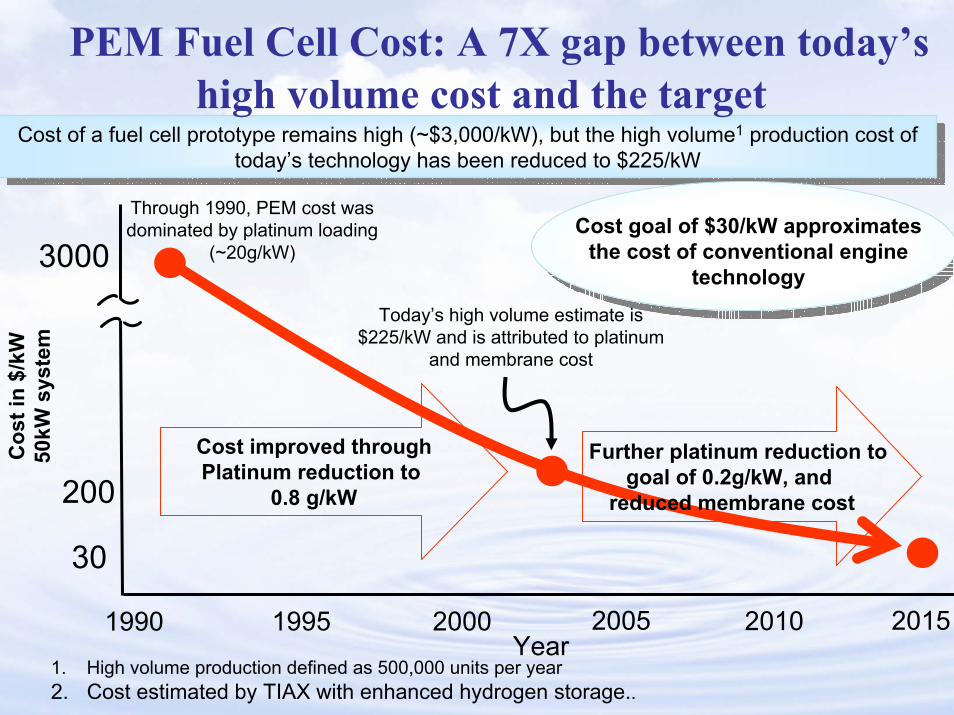
Cost of a fuel cell prototype remains high (~$3,000/kW), but the high volume1 production cost of today’s technology has been reduced to $225/kW
Through 1990, PEM cost was dominated by platinum loading
(~20g/kW)
Today’s high volume estimate is $225/kW and is attributed to platinum
and membrane cost
Cost improved throughPlatinum reduction to
0.8 g/kW
Further platinum reduction to goal of 0.2g/kW, and
reduced membrane cost
Cost goal of $30/kW approximates the cost of conventional engine
technology
Cost of a fuel cell prototype remains high (~$3,000/kW), but the high volume1 production cost of today’s technology has been reduced to $225/kW
PEM Fuel Cell Cost: A 7X gap between today’s high volume cost and the target
3000
Cos
t in
$/kW
50kW
sys
tem
200
30
201520101990 2000Year
200519951. High volume production defined as 500,000 units per year2. Cost estimated by TIAX with enhanced hydrogen storage..

Hydrogen Production Technologies
Distributed natural gas reformingDistributed bio-derived liquids reformingElectrolysisReforming biomass producer gas from gasification/pyrolysisBiological hydrogen productionPhotoelectrochemical hydrogen productionCoal gasification with sequestration(FE)Nuclear driven HT thermochemical cycles (NE)Solar driven HT thermochemical cycles

Analysis is Crucial to Success
NRC Report: Strongly recommends an increased emphasis on analysis including systems integration analysis and all energy systems analysisThe envisioned Hydrogen/Electric Economy and the Transition is complex, highly interactive, and has many dimensions– Technologies– Markets: transportation, power, all hydrogen markets, all energy
markets, and interacts with chemicals, food and feed, etc. through feedstock use
– Time frames: short term (2010-2030), mid term (2030-2050) and long term
– Geography: local, regional, national, global– Costs and Benefits– Policy
Types of Analyses
Resource AnalysisExisting InfrastructureTechnology Characterization (TEA & Enviro)Macro-System ModelsIntegrated Baseline AnalysisMarket AnalysisInfrastructure Transition AnalysisBenefits Analysis

DOE Hydrogen Budget(EWD & Interior Appropriations in thousands of dollars)
$150,525$149,525$93,791Hydrogen Technology Total
$29,200$29,200$0SC – (EWD)
$17,000$16,000$4,900FE Hydrogen Subtotal – (Interior)
$9,000$9,000$6,400NE Hydrogen Subtotal – (EWD)
$95,325**
(Net: $58,635)$95,325$81,991*
(Net: $41,991)EERE Hydrogen Technology
Subtotal– (EWD)
$7,000$5,712Education and Cross-cutting Analysis (EE)
$15,000$18,379Infrastructure Validation (EE)
$18,000$5,904Safety, Codes & Standards, and Utilization (EE)
$30,000$29,432Storage R&D (EE)
$25,325$22,564Production & Delivery R&D (EE)
Omnibus Appropriations
FY 05 RequestFY 04 Appropriations
MAJOR LINE ITEMS
* Includes $40M of Earmarked projects** Includes $36.7M of earmarked projects. Eliminates education.

DOE Hydrogen Budget(EWD & Interior Appropriations in thousands of dollars)
$95,325$95,325EERE Hydrogen Technology Subtotal– (EWD)
$36,700Earmarks
$3,525$7,000Cross-cutting Analysis (EE)
$9,800$15,000Infrastructure Validation (EE)
$5,900$18,000Safety, Codes & Standards, and Utilization (EE)
$24,800$30,000Storage R&D (EE)
$14,600($11,900)($2,700)
$25,325($21,325)($4,000)
Production & Delivery R&D (EE)Production
Delivery
FY05 Plan*FY 05 RequestMAJOR LINE ITEMS
* Tentative Plan

Delivery Budget FY04 Actual $320k
Delivery Analysis $170k
Delivery Pipeline R&D
$150k
FY05 (at Budget Request: $4.0M)Plan: $2.7M plus CTC Earmarks (FY04:$2.9M, FY05:~$2M)
Delivery
Analysis
$1,150k
Delivery
Pipeline R&D
$1,110k
Storage
$270k
Carriers
$600k
Liquefaction
$900k

Back-Up Slides

HT Thermochemical CyclesManganese Sulfate Cycle Example
MnSO4 -> MnO + SO2(g) +.5O2(g) 1150 C
MnO + SO2 + H2O -> MnSO4 + H2(g) 120 C

HT Thermochemical CyclesVolatile Metal Cycle Example
ZnO -> Zn +.5O2 ~2100 KZn + H2O -> ZnO + H2 500 K

HT Thermochemical CyclesSulfuric Acid Based Cycles– Hybrid Sulfur2H2SO4(g) -> 2SO2(g) + 2H2O(g) + O2(g) 950 CSO2(g) + 2H2O(g) -> H2SO4(l) + H2(g) (elec) 77 C
– Sulfur Iodide 2H2SO4(g) -> 2SO2(g) + 2H2O(g) + O2(g) 850 C2HI -> I2(g) + H2(g) 300 CI2 + SO2(a) + 2H2O -> 2HI(a) + H2SO4(a) 100 C