Embed Size (px)
Citation preview

Page 1 of 22
U.S. Department of Education September 2003 2003-2004 No Child Left Behind—Blue Ribbon Schools Program Cover Sheet Name of Principal MRS. KATHLEEN HAWORTH (Specify: Ms., Miss, Mrs., Dr., Mr., Other) (As it should appear in the official records) Official School Name LAUREL HALL SCHOOL
(As it should appear in the official records) School Mailing Address11919 OXNARD STREET (If address is P.O. Box, also include street address)
NORTH HOLLYWOOD CA 91606-3394 City State Zip Code+4 (9 digits total)
Tel. (818) 763-5434 Fax (818) 509-6979
Website/URL www.laurelhall.com E-mail [email protected] I have reviewed the information in this application, including the eligibility requirements on page 2, and certify that to the best of my knowledge all information is accurate. Date____________________________ (Principal’s Signature) Name of Superintendent* PASTOR JAMES SCHOENROCK
(Specify: Ms., Miss, Mrs., Dr., Mr., Other)
District Name N/A Tel. ( 818 ) 763-5434 I have reviewed the information in this application, including the eligibility requirements on page 2, and certify that to the best of my knowledge it is accurate. Date____________________________ (Superintendent’s Signature) Name of School Board President/Chairperson MS. DEBRA GASTLER_____________________________________________
(Specify: Ms., Miss, Mrs., Dr., Mr., Other) I have reviewed the information in this package, including the eligibility requirements on page 2, and certify that to the best of my knowledge it is accurate. Date____________________________ (School Board President’s/Chairperson’s Signature) *Private Schools: If the information requested is not applicable, write N/A in the space.
Page 2 of 22
PART I - ELIGIBILITY CERTIFICATION [Include this page in the school’s application as page 2.] The signatures on the first page of this application certify that each of the statements below concerning the school's eligibility and compliance with U.S. Department of Education, Office of Civil Rights (OCR) requirements is true and correct.
1. The school has some configuration that includes grades K-12. (Schools with one principal, even K-12 schools, must apply as an entire school.)
2. The school has not been in school improvement status or been identified by the state as "persistently dangerous" within the last two years. To meet final eligibility, the school must meet the state’s adequate yearly progress requirement in the 2003-2004 school year.
3. If the school includes grades 7 or higher, it has foreign language as a part of its core curriculum.
4. The school has been in existence for five full years, that is, from at least September 1998.
5. The nominated school or district is not refusing the OCR access to information necessary to investigate a civil rights complaint or to conduct a district-wide compliance review.
6. The OCR has not issued a violation letter of findings to the school district concluding that the nominated school or the district as a whole has violated one or more of the civil rights statutes. A violation letter of findings will not be considered outstanding if the OCR has accepted a corrective action plan from the district to remedy the violation.
7. The U.S. Department of Justice does not have a pending suit alleging that the nominated school, or the school district as a whole, has violated one or more of the civil rights statutes or the Constitution's equal protection clause.
8. There are no findings of violations of the Individuals with Disabilities Education Act in a U.S. Department of Education monitoring report that apply to the school or school district in question; or if there are such findings, the state or district has corrected, or agreed to correct, the findings.

Page 3 of 22
PART II - DEMOGRAPHIC DATA All data are the most recent year available. DISTRICT (Questions 1-2 not applicable to private schools) 1. Number of schools in the district: N/A Elementary schools
N/A Middle schools N/A Junior high schools N/A High schools N/A Other (Briefly explain) N/A TOTAL
2. District Per Pupil Expenditure: N/A Average State Per Pupil Expenditure: N/A SCHOOL (To be completed by all schools) 3. Category that best describes the area where the school is located:
[ ] Urban or large central city [ X] Suburban school with characteristics typical of an urban area [ ] Suburban [ ] Small city or town in a rural area [ ] Rural
4. 7 Number of years the principal has been in her/his position at this school.
N/A If fewer than three years, how long was the previous principal at this school? 5. Number of students enrolled at each grade level or its equivalent in applying school: (2003-2004)
Grade # of Males
# of Females
Grade Total
Grade # of Males
# of Females
Grade Total
K 36 33 69 7 50 32 82 1 34 31 65 8 40 35 75 2 26 18 44 9 N/A N/A N/A 3 27 18 45 10 N/A N/A N/A 4 37 29 66 11 N/A N/A N/A 5 34 22 56 12 N/A N/A N/A 6 39 28 67 Other N/A N/A N/A
TOTAL STUDENTS IN THE APPLYING SCHOOL → 569

Page 4 of 22
6. Racial/ethnic composition of 65% White the students in the school: 12% Black or African American
11% Hispanic or Latino 10% Asian/Pacific Islander 2% American Indian/Alaskan Native 100% Total 7. Student turnover, or mobility rate, during the past year: 2.20%
(This rate includes the total number of students who transferred to or from different schools between October 1 and the end of the school year, divided by the total number of students in the school as of October 1, multiplied by 100.)
(1) Number of students who transferred to the school after October 1 until the end of the year.
7
(2) Number of students who transferred from the school after October 1 until the end of the year.
5
(3) Subtotal of all transferred students [sum of rows (1) and (2)]
12
(4) Total number of students in the school as of October 1
546
(5) Subtotal in row (3) divided by total in row (4)
.02
(6) Amount in row (5) multiplied by 100
2.20
8. Limited English Proficient students in the school: 0% 0 Total Number Limited English Proficient Number of languages represented: 8 Specify languages: Spanish, Armenian, Chinese, Farsi, Korean, Russian, Filipino, Egyptian 9. Students eligible for free/reduced-priced meals: 0 % 0 Total Number Students Who Qualify
If this method does not produce a reasonably accurate estimate of the percentage of students from low-income families or the school does not participate in the federally-supported lunch program, specify a more accurate estimate, tell why the school chose it, and explain how it arrived at this estimate.
10. Students receiving special education services: 0 % 0 Total Number of Students Served

Page 5 of 22
Indicate below the number of students with disabilities according to conditions designated in the Individuals with Disabilities Education Act.
0 Autism 0 Orthopedic Impairment 0 Deafness 0 Other Health Impaired 0 Deaf-Blindness 0 Specific Learning Disability 0 Hearing Impairment 0 Speech or Language Impairment 0 Mental Retardation 0 Traumatic Brain Injury 0 Multiple Disabilities 0 Visual Impairment Including Blindness 11. Indicate number of full-time and part-time staff members in each of the categories below:
Number of Staff
Full-time Part-Time
Administrator(s) 3 0
Classroom teachers 24 1
Special resource teachers/specialists 8 6
Paraprofessionals 6 4
Support staff 4 1
Total number 45 12
12. Average school student-“classroom teacher” ratio: 23:1 13. Show the attendance patterns of teachers and students as a percentage. The student dropout rate is
defined by the state. The student drop-off rate is the difference between the number of entering students and the number of exiting students from the same cohort. (From the same cohort, subtract the number of exiting students from the number of entering students; divide that number by the number of entering students; multiply by 100 to get the percentage drop-off rate.) Briefly explain in 100 words or fewer any major discrepancy between the dropout rate and the drop-off rate. (Only middle and high schools need to supply dropout rates and only high schools need to supply drop-off rates.)
2002-2003 2001-2002 2000-2001 1999-2000 1998-1999
Daily student attendance 97% 97% 96% 97% 96% Daily teacher attendance 97% 97% 95% 96% 96% Teacher turnover rate 14% 11% 11% 12% 6% Student dropout rate N/A N/A N/A N/A N/A Student drop-off rate N/A N/A N/A N/A N/A

Page 6 of 22
14. (High Schools Only) Show what the students who graduated in Spring 2003 are doing as of September 2003.
Graduating class size N/A Enrolled in a 4-year college or university N/A Enrolled in a community college N/A Enrolled in vocational training N/A Found employment N/A Military service N/A Other (travel, staying home, etc.) N/A Unknown N/A Total N/A
PART III - SUMMARY Provide a brief, coherent narrative snapshot of the school in one page (approximately 475 words). Include at least a summary of the school’s mission or vision in the statement. Laurel Hall School opened its doors in 1947 as a mission of Emmanuel Lutheran Church. It is the second largest Evangelical Lutheran School of America in Southern California and has consistently been recognized as a leader in the Lutheran school community. Presently Laurel Hall serves a student population of 570 students in grades kindergarten through eighth grade. Under the supervision of elementary and middle school directors, our effective and creative curriculum is reviewed and updated every three years ensuring a competitive standard of learning. The faculty looks to educate the whole child, spiritually, academically, socially, and emotionally. Laurel Hall is known for its strong fine arts, academic and athletic programs, and provides opportunities for every child to shine. Laurel Hall is proud to hold the Evangelical Lutheran Education Association National Board Full Elementary Accreditation as well as being fully accredited by WASC (Western Association of Schools and Colleges) and is under the direction of the principal Mrs. Kathleen Haworth who was named by the U.S. Department of Education as National Distinguished Principal in 2002. The community surrounding Laurel Hall is multi-ethnic consisting of single family dwellings, apartments and small businesses. For the most part Laurel Hall is not a neighborhood school although there are a significant number of students enrolled in the school from the surrounding neighborhood. Due to its geographic proximity to the freeways, there are many students from various parts of the San Fernando Valley and Los Angeles enrolled at Laurel Hall. It is the mission of Laurel Hall as a ministry of Emmanuel Lutheran Church, to develop lifelong learners who are nurtured in the Christian faith, who value themselves as competent and confident individuals, contribute to their community, and succeed in a changing world. To accomplish our mission, we strive to provide each student with the skills necessary to become effective communicators; collaborative workers who can use leadership effectively; complex thinkers who are capable of utilizing available resources and information to reason and make discussions; community contributors who develop their time, energies, and talents to improving the welfare of others; and quality producers, who create intellectual artistic, practical, and physical products that reflect high standards.

Page 7 of 22
Our curriculum is designed to stimulate intellectual growth. The core academic program focuses on reading comprehension, spelling, mathematics, social studies and science. The enriched academic program and variety of activities encourages students to develop self-confidence and independence. Teachers use the adopted state standards to develop instructional goals and objectives. Standardized test data is utilized to determine areas of strength and improvement. Staff meetings are structured to allow for teachers and administrators to articulate goals and monitor progress. To remain true to our school's mission, we make every effort to address the academic, physical, spiritual and social needs of each child. Activities are provided to nurture the effective domain. Outdoor education provides hands-on-learning experiences for all students in grades 4-8. This includes a trip to Sacramento and Gold Rush Country for the 4th grade, Astro Camp for the 5th grade which focuses on astronomy, Alpine Camp for 6th grade which emphasizes and builds interpersonal skills, Catalina Marine Science Instruction for the 7th grade, and the Historic East Coast Trip for the 8th grade. Student Government provides leadership opportunities for students in grades 6 through 8. Laurel Hall provides an extensive after school athletic program for boys and girls that includes flag football, basketball, soccer, baseball, volleyball and track. The school also offers an outstanding theater arts and instrumental program. PART IV – INDICATORS OF ACADEMIC SUCCESS
1. Describe in one page the meaning of the school’s assessment results in reading (language arts or
English) and mathematics in such a way that someone not intimately familiar with the tests can easily understand them.
To measure student's academic success, Laurel Hall administers the SAT-9. SAT-9 standardized testing clearly indicates that our students are meeting the expectations of standards-based curriculum. Our school uses this test data to review and analyze the curricular program to inform parents and the community of the standards based educational program offered and implemented by the school. This test is administered in the spring of each year. It is the policy of Laurel Hall School to test all students in order to receive a clear picture of student performance. This allows the school to analyze 100% of individual student scores as well as group scores for each grade level. Prior to administering the test, parent forums are scheduled. These meetings communicate the purpose and data gleaned from standardized tests. It also provides the opportunity to in-service parents on the meaning of the scores and how they apply and are used in our school. These meetings are an informal time of question and answer and are open to all parents. We also provide a simplified summary of the SAT-9 scoring units in our newsletter. Assessment data is received during the month of May, giving the teachers an opportunity to review individual student scores. A summary sheet is included with each child's report card in June. If students have demonstrated any difficulty during the school year which is then supported by the test data, teachers are able to meet with parents before the end of the school year to formulate an action plan to insure ongoing student progress and success at the next grade level. Laurel Hall students clearly score in the above average range in all grades and in all areas tested on the SAT-9. We use the testing data to support student success and to identify any areas of weakness or particular trends in the tested areas. We can disaggregate those types of scores to provide student academic support groups and additional teacher training and mentoring. We believe that our scores serve to validate that our students score within the top ten percent of the school nationwide in the areas of reading and mathematics. The curriculum at Laurel Hall builds upon previous levels and that students demonstrate increased academic performance throughout their years at Laurel Hall.

Page 8 of 22
In looking at desegregated test data for ethnic groups, all groups score in the above average range. Again the scores indicate that these students are scoring within the range of the total student population. A small percentage of the Laurel Hall students come from homes where English is the second language. At this time, Laurel Hall does not formally assess these students to identify them as English language learners (ELL); however the school does have an elementary student resource program that provides academic support for students with this need. As we see that this could be a growing trend in our school, we will continue to provide teacher training for the identification of ELL students and ways to desegregate test data to better inform curricular and instructional needs. 2. Show in one-half page (approximately 200 words) how the school uses assessment data to understand
and improve student and school performance. The student performance trends identified through the use of both standardized and teacher assessments are used for immediate and long range planning to shape the curriculum and types of instruction utilized in the classroom. Standardized assessment results are examined each year by the school leadership team, comprised of administrators and curriculum advisors. As the overall achievement of each grade level is studied, special attention is given to areas of high and low performance. In the case of strong performance areas, the curriculum and instruction methods that fostered such results are supported and encouraged. Where lower test scores are exhibited, the leadership team seeks out new curriculum or supplemental resources designed to promote increased performance in those areas. Another important element is staff development. Responding to assessment results, the leadership team works with teachers both individually and through workshops and seminars designed to concentrate staff focus on areas in need of reinforcement. In addition, teachers employ day to day assessments such as observation, class work, quizzes, tests and homework, to evaluate student progress. When such assessments indicate that mastery of particular concepts is not being achieved, teachers engage in re-teaching the desired skills, using different instructional approaches and materials. The teacher’s goals have been met when reassessment confirms that command of such concepts has been achieved. 3. Describe in one-half page how the school communicates student performance, including assessment
data, to parents, students, and the community. Laurel Hall promotes the success of students by communicating with families, the church, and the community at large. Teachers review students’ performance data and report this information to parents each quarter in the form of progress reports and report cards. At the end of the first quarter parent-teacher conferences are held for each student. This gives the teacher the opportunity to review the first quarter report card and the student’s progress in general with the parents on an individual basis. Parent-teacher conferences are also available during the spring. Teachers and parents are encouraged to communicate with one another about students throughout the year via the school voice mail system. Teachers make every effort to respond to calls within 24 hours. Classroom work and assessments are sent home on Monday or Friday in the elementary grades and throughout the term in the middle school grades. Each semester honor roll students are presented with an honor roll certificate at a school chapel. On a monthly basis each homeroom teacher chooses a student that best embodies the character value of the month, i.e., responsibility, compassion, etc. The students are recognized in chapel with a certificate and a free dress pass, the students also have the opportunity to eat lunch with the principal and a small award is given to each student by the principal. School-wide data from standardized testing is shared with parents in the quarterly school newsletter, The Buzz, and is reviewed with the parents at the grade level parent coffees each semester. Teachers receive

Page 9 of 22
class reports as well as individual student reports to review. Parents receive a student report for their child with the last report card of each school year. Testing data is also shared with the school committee and the church council. 4. Describe in one-half page how the school will share its successes with other schools. Laurel Hall School shares its successes with other Lutheran schools through regularly scheduled meetings of the Evangelical Lutheran Education Association (ELEA). Student performance data is shared, as well as curriculum development based on utilizing multiple assessment measures to enhance student learning. Thirty-eight Lutheran schools in southern California re members of ELEA, which oversees the curriculum implementation at member schools through the accreditation process. School assessment data is presented as well as various program highlights from each school Laurel Hall School regularly participates with both private and public school articulation meetings to establish criteria/curriculum, observe current educational trends and to ensure ongoing successful student performance. Laurel Hall School is proud of its accomplishments and continues to strive to increase achievement for all students. Through our work with ELEA, we not only share our successes, but work with other educators to influence policies and procedures that benefit students and support the improvement of teaching and learning. PART V – CURRICULUM AND INSTRUCTION 1. Describe in one page the school’s curriculum. Outline in several sentences the core of each curriculum
area and show how all students are engaged with significant content based on high standards. Include art and foreign languages in the descriptions (foreign language instruction as a part of the regular curriculum is an eligibility requirement for middle, junior high, high schools, and elementary schools in grades seven and higher).
The curriculum at Laurel Hall is based on the four core subjects: language arts, math, social studies, and science. However, many other programs are integrated into these areas. Language arts focuses on literacy with strong emphasis on vocabulary development, reading comprehension, writing, grammar and mechanics, and oral communication. Reading and writing are key and expressed through varieties of experiences. Literature is often cross curricular and multiculturally based. Writing themes are standard based and shared through poetry readings, book discussions, and class displays. Social studies concentrates on expanding the knowledge of the world around us. It builds from our neighborhood, our state, our country and government, to countries of the world both past histories and present. Our social studies curriculum is interactive. We celebrate a Japanese Tea Ceremony, Mexican Fiesta, participate in the reenactment of the Revolutionary and Civil Wars, and we live as if in an ancient culture and civilization. We emphasize the living of history with our students to meet the multiple learning styles. We find that social studies is an excellent avenue for a variety of assessments. Math is taught through our scope and sequence highlighting basic functions, number sense, measurement, geometry, patterns and functions, probability and statistics, algebra, and logic. Relating math to actual life situations is our goal. Our youngest student body members purchase gifts in our annual Kiddie Christmas Boutique, using their knowledge of money, addition and subtraction. This is also evident in a “personal
Page 10 of 22
economics” class in our middle school elective program. Our annual Christmas Market project for 8th graders involves the set up of a company, research and development of a product, marketing and sales, and the final evaluation through a profit and loss statement. Science focuses on inquiry. Our concentrated areas are: physical, earth, life, and space science. Technology and science in a personal perspective, and the history and nature of science are emphasized in our Curriculum Night. Here students and parents work together doing experiments. Our 7th and 8th graders display their experiments using the scientific method in our annual Science Fair. Labs are an integral part of our program, both in our classrooms as well as through visiting teams from local marine museums. Elementary grades’ science kits and middle school microscopic technology give the students practical awareness of the subject matter. Spanish is taught from K-8th grade with grammar and conversational skills at the core. Throughout this experience multicultural respect is emphasized. Students learn Hispanic customs, foods, and holiday celebrations. Family coats of arms are designed and current events in the Hispanic world are used to bring awareness of all Hispanic countries to the students. The Family Heritage Wall of Respect is always a highlight of our Spanish class. Art surfaces in our curriculum in a multitude of experiences. Classroom teachers use it in many ways to support themes and areas of study. Our art teachers also give the students a wide exposure to all media. Famous artists and techniques are taught and followed by visits to the local museums. A few topics of study might include: costuming, architecture, photography, ancient artifacts, landscapes, color design, paper making, basket making and many more. Our annual Art Show brings a gathering of parents, students, and friends to see the artfully arranged display of the year’s works. A different theme is developed each year that sets the tone of the curriculum. The art teachers also draw upon the class curriculum to develop certain projects. Bible, Physical Education and Music are also a major part of Laurel Hall’s curriculum. Bible gives our students a spiritual sense of who they are with the knowledge that Jesus is our Savior. Physical Education strives to keep our students physically fit with a sense of fair play. Our Music program includes music education, band, strings, seasonal performances, and a spring musical of the highest quality. 2. (Elementary Schools) Describe in one-half page the school’s reading curriculum, including a
description of why the school chose this particular approach to reading. Administrators and teachers representing grades K – 3 chose Houghton Mifflin Reading California (HMRC), 2003. The HMRC is a California state adopted curriculum. HMRC is a carefully planned, sequential, comprehensive program of instruction with a specific focus on California content standards. Skills and strategies are taught systematically within a print rich environment. The program ensures beginning reading success and promotes reading fluency and independent readers with a gradual transition from decodable text to trade literature. Our Fourth and Fifth grades use Houghton Mifflin English (2004) for writing and grammar skills. They also utilize a literature book (Scott Foresman 1989), supplemented with as many as four novels within each grade that relate to their English and Social Studies units. These English and Literature programs continue to promote the skills and strategies needed by students to become lifelong readers. HMRC was chosen for a number of reasons. Its scope and sequence is aligned with the California Language Arts Standards, an important priority. Themes are correlated to those presented in grades above and below. Its teacher friendly resource package contains an extensive array of highly usable reading materials, teaching aids and assessments. HMRC has the flexibility to accommodate different learning styles and meet the needs of all students – from basic to advanced readers – from re-teaching activities to

Page 11 of 22
providing challenging opportunities. HMRC also emphasizes the various levels of comprehension while simultaneously engaging children’s imaginations. (Secondary Schools) Describe in one-half page the school’s English language curriculum, including efforts the school makes to improve the reading skills of students who read below grade level. The middle school’s English language curriculum has four key elements: vocabulary development, literature, grammar and mechanics, and writing. The literature is chosen by the department each year and incorporates: multicultural themes, current award winning books, books related to the study of their grade’s curriculum in history, plays including Shakespeare, and short stories. These are read and discussed in class. Quizzes, tests, projects, dramatic interpretations and a response paper are written and all are used as assessment tools. Book reports are also assigned to cover the various genres of literature. Additional books are assigned each month and a book report is due as the assessment. The students are given a choice of 14 different types of reports. Grammar and mechanics are basic skills that we expect students to improve on each year. They are tied into the writing section as a major component. Writing themes are selected according to the state standards. Some of the assignments cover: cause and effect essays, historical essays, scientific reports, research reports, and literature response papers. Paragraph structure is a primary goal, resulting in the ability to produce a well-written five paragraph essay by the time they reach high school. Modeling, prewriting, drafting, revising, editing and publishing is the format that is followed. Voice, sentence fluency, word choice, and sequence are all brought together in their final work. Our writing program covers other options besides the essay. Posters, flyers, advertisements, memoirs, poetry, and letters are a sampling. Oral presentation is incorporated in our program to develop their ability to speak before others. In addressing students who read below grade level, the teacher makes every effort to point out context clues and predictions, assign small group work, and peer study. They will preview a book with the student, suggest re-reading parts, and model a fluent sound to the student. As this is not a major problem with our school community, we do work closely with families to obtain extra help. We suggest testing, the use of educational therapists, tutoring opportunities, and ideas for parents to do with their student. Some of our teachers are available for tutoring and after school help. Our reading lists are broad enough to give suggestions as various reading levels, so as to accommodate the slower readers. 3. Describe in one-half page one other curriculum area of the school’s choice and show how it relates to
essential skills and knowledge based on the school’s mission. Part of the Laurel Hall School mission is to guide our students to become quality producers who create intellectual, artistic, practical, and physical products that reflect originality, high standards, and the use of advanced technologies. It is during their weekly computer class that students learn and master the skills and knowledge essential in our increasingly technologically based environment. Students are taught that electronic equipment and resources are tools designed to accomplish a variety of necessary tasks and we strive to ensure that every student is technologically literate by the time the student finishes the eighth grade. Basic computer literacy is taught and reviewed at all grade levels. Students learn and practice their keyboarding skills while proper technique and posture are emphasized to increase efficiency and to avoid repetitive stress injuries. Standard applications such as word processors, spreadsheets, drawing programs, presentation software, graphics editors, and databases are taught using projects correlating to their current classroom curriculum. Project based learning related to their classroom curriculum serves to reinforce the computer’s use as a tool to accomplish tasks required of the students while enhancing the subjects taught in the classroom. Laurel Hall not only teaches the use of the Internet, but also teaches Internet safety and

Page 12 of 22
provides guidelines for the ethical use of computers. Many technology lessons are taught utilizing Internet based resources and tutorials developed specifically for Laurel Hall School’s intranet. A Laurel Hall Intranet based chat room has been designed to quiz the students on computer terminology in an environment similar to that which students might use at home. In addition to the regular technology curriculum, Laurel Hall offers classes for students to expand their use of technology. We have offered classes on website development, including HTML, coding, Macromedia Flash animation, programmable robotics using Lego Robotics Invention system, and digital photography. We are currently providing students with the opportunity to work on the school newsletter. Published quarterly, students are responsible for formatting articles, editing photos, and providing both design and content ideas. 4. Describe in one-half page the different instructional methods the school uses to improve student
learning. Striving to create challenges that require a student to stretch as well as challenges that guarantee success, Laurel Hall teachers employ a variety of instructional techniques. Familiar with the theory of Multiple Intelligences, teachers are attuned to using visual, auditory and kinesthetic activities to help children learn most effectively. Individual and whole group instruction, lecture, guided practice and reinforcement, cooperative learning and use of technology are the methods commonly seen in the classroom. For example, hands on science experiments throughout the grades promote problem solving and organizational skills. Computer instruction in both lab and classroom settings facilitate contemporary technology skills. 6th –8th grade history simulations (Interact-living the history being taught) provide opportunities for cooperative research, and higher level thinking skills. Visitation by outside groups and organizations, such as the Cabrillo Marine Museum and Walk Through California, as well as educational assemblies, provide students with rich, multi-sensory opportunities. For those students who need further practice and reinforcement of Language Arts skills, and for some grade levels, Math, Laurel Hall provides an Elementary Resource Program. This program provides individual and small group instruction, incorporating the aforementioned teaching methods designed to boost student confidence and improve overall performance. In Middle School, students requiring extra help receive increased individual attention. As well, teachers work closely with the parents in helping the students achieve success. When additional attention is needed, outside tutoring opportunities are recommended through the Director of Middle School. 5. Describe in one-half page the school’s professional development program and its impact on improving
student achievement. The school places a high priority on professional development, which includes providing financial resources for each teacher to attend curriculum directed workshops and conferences. The focus of all our professional development is to improve and insure student learning. The principal meets individually with each teacher during the year to discuss classroom observations, the school’s and teacher's visions and mission for the school. Most importantly, within the last two years we have scheduled time to provide more meaningful faculty meetings, which allow grade levels to interact with each other on teaching methods, examine student work and explore more creative options in utilizing the curriculum. We have found that this has broadened awareness of grade level expectations and created and awareness of school wide strengths and weaknesses. Part of our campus wide professional development also includes classroom observation of the grade level above and below a teacher's assigned grade level. This is also an extremely beneficial resource as it creates a mentor/coach relationship and camaraderie within the faculty.

Page 13 of 22
Technology is also an ongoing part of professional development. It is expected that all teachers demonstrate a knowable skill level on computers which includes integration of curriculum, Internet use, and grade book programs. The school allots time and availability for on-site instruction. At Laurel Hall we recognize that standards based on education and curriculum are at the forefront of education reform. Curriculum coordinators, administrators and teachers are all part of the process of implementing newly adopted programs. Our teachers work within a collaborative community, which allows mentoring by more, experienced to less experience teachers. Laurel Hall makes every effort to create a culture where students and staff support the success of individuals as well as the school. PART VI - PRIVATE SCHOOL ADDENDUM The purpose of this addendum is to obtain additional information from private schools as noted below. Attach the completed addendum to the end of the application, before the assessment data tables. Private school association(s): Evangelical Lutheran Education Association (ELEA) (Give primary religious or independent association only) Does the school have nonprofit, tax exempt (501(c)(3)) status? Yes X No ______ Part II - Demographics 1. What are the 2002-2003 tuition rates, by grade? (Do not include room, board, or fees.)
$ 6,220 $ 6,220 $ 6,220 $ 6,220 $ 6,220 $ 6,220 K 1st 2nd 3rd 4th 5th
$ 6,220 $ 6,220 $ 6,220 $ N/A $ N/A $ N/A 6th 7th 8th 9th 10th 11th
$ N/A $ N/A 12th Other 2. What is the educational cost per student? $ 5,151
(School budget divided by enrollment)
3. What is the average financial aid per student? $ 0 4. What percentage of the annual budget is devoted to 2% scholarship assistance and/or tuition reduction? 5. What percentage of the student body receives scholarship assistance, including tuition reduction? 3%

Page 14 of 22
PART VII - ASSESSMENT RESULTS
ASSESSMENTS REFERENCED AGAINST NATIONAL NORMS
Provide the following information for all tests in reading (language arts or English) and mathematics. Show at least three years of data. Complete a separate form for each test and grade level, and place it on a separate page. Grade 1st Test Stanford Achievement Test Edition/publication year 9/19/96 Publisher Harcourt, Brace & Company What groups were excluded from testing? Why, and how were they assessed? No Groups were excluded Scores are reported here as (check one): NCEs____ Scaled scores Percentiles X
READING SCORES 2002-2003 2001-2002 2000-2001 Testing month March March March SCHOOL SCORES Total Score 77 72 65 Number of students tested 46 44 66 Percent of total students tested 100 100 100 Number of students excluded 0 0 0 Percent of students excluded 0 0 0 SUBGROUP SCORES N/A N/A N/A
MATH SCORES 2002-2003 2001-2002 2000-2001 Testing month March March March SCHOOL SCORES Total Score 65 60 66 Number of students tested 46 44 66 Percent of total students tested 100 100 100 Number of students excluded 0 0 0 Percent of students excluded 0 0 0 SUBGROUP SCORES N/A N/A N/A

Page 15 of 22
ASSESSMENTS REFERENCED AGAINST NATIONAL NORMS Provide the following information for all tests in reading (language arts or English) and mathematics. Show at least three years of data. Complete a separate form for each test and grade level, and place it on a separate page. Grade 2nd Test Stanford Achievement Test Edition/publication year 9/19/96 Publisher Harcourt, Brace & Company What groups were excluded from testing? Why, and how were they assessed? No Groups were excluded Scores are reported here as (check one): NCEs____ Scaled scores Percentiles X
READING SCORES 2002-2003 2001-2002 2000-2001 Testing month March March March SCHOOL SCORES Total Score 73 77 73 Number of students tested 42 62 55 Percent of total students tested 100 100 100 Number of students excluded 0 0 0 Percent of students excluded 0 0 0 SUBGROUP SCORES N/A N/A N/A
MATH SCORES 2002-2003 2001-2002 2000-2001 Testing month March March March SCHOOL SCORES Total Score 66 69 75 Number of students tested 42 62 55 Percent of total students tested 100 100 100 Number of students excluded 0 0 0 Percent of students excluded 0 0 0 SUBGROUP SCORES N/A N/A N/A
Page 16 of 22
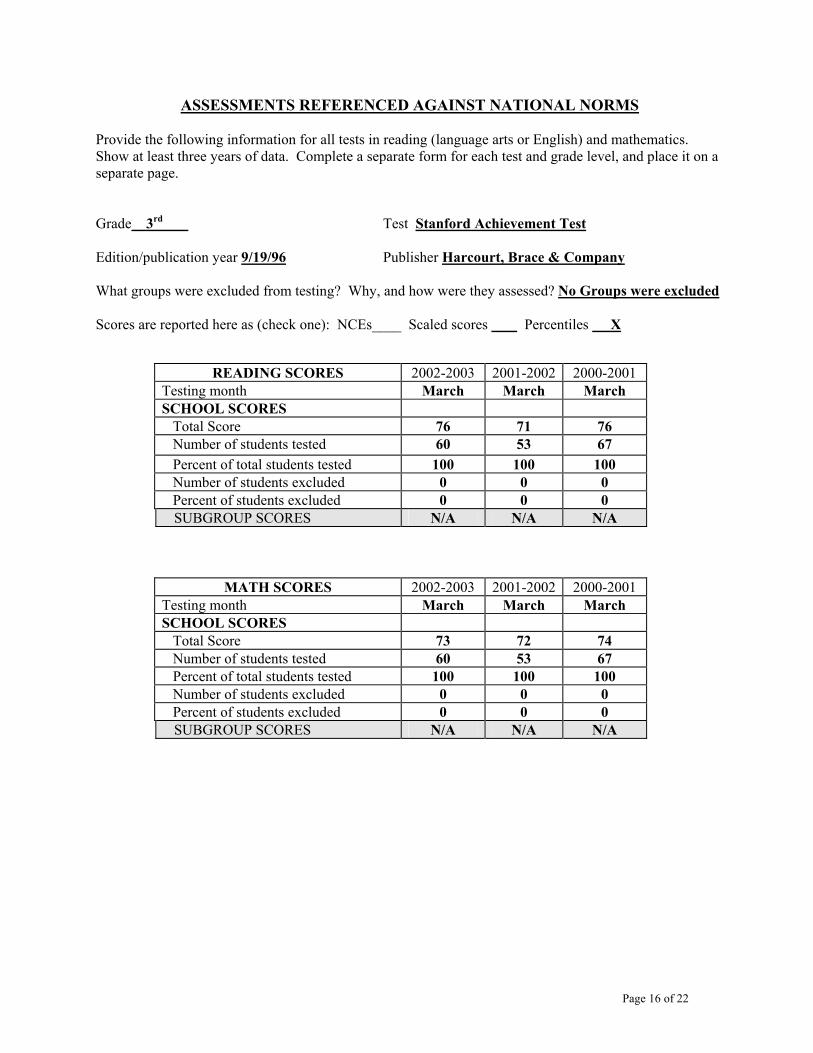
ASSESSMENTS REFERENCED AGAINST NATIONAL NORMS Provide the following information for all tests in reading (language arts or English) and mathematics. Show at least three years of data. Complete a separate form for each test and grade level, and place it on a separate page. Grade 3rd Test Stanford Achievement Test Edition/publication year 9/19/96 Publisher Harcourt, Brace & Company What groups were excluded from testing? Why, and how were they assessed? No Groups were excluded Scores are reported here as (check one): NCEs____ Scaled scores Percentiles X
READING SCORES 2002-2003 2001-2002 2000-2001 Testing month March March March SCHOOL SCORES Total Score 76 71 76 Number of students tested 60 53 67 Percent of total students tested 100 100 100 Number of students excluded 0 0 0 Percent of students excluded 0 0 0 SUBGROUP SCORES N/A N/A N/A
MATH SCORES 2002-2003 2001-2002 2000-2001 Testing month March March March SCHOOL SCORES Total Score 73 72 74 Number of students tested 60 53 67 Percent of total students tested 100 100 100 Number of students excluded 0 0 0 Percent of students excluded 0 0 0 SUBGROUP SCORES N/A N/A N/A

Page 17 of 22
ASSESSMENTS REFERENCED AGAINST NATIONAL NORMS Provide the following information for all tests in reading (language arts or English) and mathematics. Show at least three years of data. Complete a separate form for each test and grade level, and place it on a separate page. Grade 4th Test Stanford Achievement Test Edition/publication year 9/19/96 Publisher Harcourt, Brace & Company What groups were excluded from testing? Why, and how were they assessed? No Groups were excluded Scores are reported here as (check one): NCEs____ Scaled scores Percentiles X
READING SCORES 2002-2003 2001-2002 2000-2001 Testing month March March March SCHOOL SCORES Total Score 75 75 68 Number of students tested 54 60 73 Percent of total students tested 100 100 100 Number of students excluded 0 0 0 Percent of students excluded 0 0 0 SUBGROUP SCORES N/A N/A N/A
MATH SCORES 2002-2003 2001-2002 2000-2001 Testing month March March March SCHOOL SCORES Total Score 76 72 70 Number of students tested 54 60 73 Percent of total students tested 100 100 100 Number of students excluded 0 0 0 Percent of students excluded 0 0 0 SUBGROUP SCORES N/A N/A N/A

Page 18 of 22
ASSESSMENTS REFERENCED AGAINST NATIONAL NORMS Provide the following information for all tests in reading (language arts or English) and mathematics. Show at least three years of data. Complete a separate form for each test and grade level, and place it on a separate page. Grade 5th Test Stanford Achievement Test Edition/publication year 9/19/96 Publisher Harcourt, Brace & Company What groups were excluded from testing? Why, and how were they assessed? No Groups were excluded Scores are reported here as (check one): NCEs____ Scaled scores Percentiles X
READING SCORES 2002-2003 2001-2002 2000-2001 Testing month March March March SCHOOL SCORES Total Score 75 72 76 Number of students tested 59 76 72 Percent of total students tested 100 100 100 Number of students excluded 0 0 0 Percent of students excluded 0 0 0 SUBGROUP SCORES N/A N/A N/A
MATH SCORES 2002-2003 2001-2002 2000-2001 Testing month March March March SCHOOL SCORES Total Score 80 68 71 Number of students tested 59 76 72 Percent of total students tested 100 100 100 Number of students excluded 0 0 0 Percent of students excluded 0 0 0 SUBGROUP SCORES N/A N/A N/A

Page 19 of 22
ASSESSMENTS REFERENCED AGAINST NATIONAL NORMS Provide the following information for all tests in reading (language arts or English) and mathematics. Show at least three years of data. Complete a separate form for each test and grade level, and place it on a separate page. Grade 6th Test Stanford Achievement Test Edition/publication year 9/19/96 Publisher Harcourt, Brace & Company What groups were excluded from testing? Why, and how were they assessed? No Groups were excluded Scores are reported here as (check one): NCEs____ Scaled scores Percentiles X
READING SCORES 2002-2003 2001-2002 2000-2001 Testing month March March March SCHOOL SCORES Total Score 75 74 78 Number of students tested 86 89 52 Percent of total students tested 100 100 100 Number of students excluded 0 0 0 Percent of students excluded 0 0 0 SUBGROUP SCORES N/A N/A N/A
MATH SCORES 2002-2003 2001-2002 2000-2001 Testing month March March March SCHOOL SCORES Total Score 80 82 80 Number of students tested 86 89 52 Percent of total students tested 100 100 100 Number of students excluded 0 0 0 Percent of students excluded 0 0 0 SUBGROUP SCORES N/A N/A N/A

Page 20 of 22
ASSESSMENTS REFERENCED AGAINST NATIONAL NORMS Provide the following information for all tests in reading (language arts or English) and mathematics. Show at least three years of data. Complete a separate form for each test and grade level, and place it on a separate page. Grade 7th Test Stanford Achievement Test Edition/publication year 9/19/96 Publisher Harcourt, Brace & Company What groups were excluded from testing? Why, and how were they assessed? No Groups were excluded Scores are reported here as (check one): NCEs____ Scaled scores Percentiles X
READING SCORES 2002-2003 2001-2002 2000-2001 Testing month March March March SCHOOL SCORES Total Score 77 72 65 Number of students tested 81 55 65 Percent of total students tested 100 100 100 Number of students excluded 0 0 0 Percent of students excluded 0 0 0 SUBGROUP SCORES N/A N/A N/A
MATH SCORES 2002-2003 2001-2002 2000-2001 Testing month March March March SCHOOL SCORES Total Score 84 81 75 Number of students tested 81 55 65 Percent of total students tested 100 100 100 Number of students excluded 0 0 0 Percent of students excluded 0 0 0 SUBGROUP SCORES N/A N/A N/A

Page 21 of 22

Page 22 of 22