Embed Size (px)
Citation preview

U.S. Department of EducationED Pubs8242-B Sandy CourtJessup, MD 20794-1398
Official BusinessPenalty for Private Use, $300
U.S. POSTAGE PAIDU.S. DEPARTMENTOF EDUCATION
PERMIT NO. G-17
Ca
lorie
s In,C
alo
ries O
ut: Fo
od
an
d Exe
rcise
in P
ub
lic Ele
me
nta
ry Sch
oo
ls,20052006
E.D. TAB
Calories In, Calories Out:Food and Exercise inPublic Elementary Schools, 2005
U.S. Department of EducationNCES 2006-057

Calories In, Calories Out: Food and Exercise in Public Elementary Schools, 2005
U.S. Department of Education NCES 2006–057 E.D. TAB
May 2006
Basmat Parsad Laurie Lewis Westat
Bernard Greene Project Officer National Center for Education Statistics

U.S. Department of Education Margaret Spellings Secretary
Institute of Education Sciences Grover J. Whitehurst Director
National Center for Education Statistics Mark Schneider Commissioner The National Center for Education Statistics (NCES) is the primary federal entity for collecting, analyzing, and reporting data related to education in the United States and other nations. It fulfills a congressional mandate to collect, collate, analyze, and report full and complete statistics on the condition of education in the United States; conduct and publish reports and specialized analyses of the meaning and significance of such statistics; assist state and local education agencies in improving their statistical systems; and review and report on education activities in foreign countries.
NCES activities are designed to address high priority education data needs; provide consistent, reliable, complete, and accurate indicators of education status and trends; and report timely, useful, and high quality data to the U.S. Department of Education, the Congress, the states, other education policymakers, practitioners, data users, and the general public.
We strive to make our products available in a variety of formats and in language that is appropriate to a variety of audiences. You, as our customer, are the best judge of our success in communicating information effectively. If you have any comments or suggestions about this or any other NCES product or report, we would like to hear from you. Please direct your comments to:
National Center for Education Statistics Institute of Education Sciences U.S. Department of Education 1990 K Street NW Washington, DC 20006
May 2006 The NCES World Wide Web Home Page is http://nces.ed.gov. The NCES World Wide Web Electronic Catalog is http://nces.ed.gov/pubsearch. Suggested Citation
Parsad, B., and Lewis, L. (2006). Calories In, Calories Out: Food and Exercise in Public Elementary Schools, 2005 (NCES 2006–057). U.S. Department of Education. Washington, DC: National Center for Education Statistics. For ordering information on this report, write to
U.S Department of Education ED Pubs P.O. Box 1398 Jessup, MD 20794-1398
or call toll free 1-877-4ED-PUBS or order online at http://www.edpubs.org. Content Contact Bernard Greene (202) 502-7348 [email protected]

iii
Acknowledgments
The authors wish to thank the many individuals who contributed to the development of the survey and this report. Bernard Greene was the NCES Project Officer. Westat’s Project Director was Laurie Lewis, and the survey manager was Basmat Parsad. Debbie Alexander directed the data collection efforts, assisted by Ratna Basavaraju and Anjali Pandit. Robert Delfierro and Alla Belenky were the programmers, Carol Litman was the editor, and Sylvie Warren was responsible for formatting the report.
The NCES staff who reviewed the report and provided valuable suggestions include Bruce
Taylor, Val Plisko, Kathryn Chandler, and Peter Tice. Reviewers outside of NCES were Joanne Guthrie of the Economic Research Service, U.S. Department of Agriculture, and Monica Woods of the Office of Safe and Drug-Free Schools, U.S. Department of Education. This report was also reviewed by Monica Arntz, Kevin Bromer, Stephen Mistler, Pia Peltola, Mary Mclaughlin, Dan McGrath, Grace Boachie-Ansah, Juliet Diehl, and Greg Kienzl of the Education Statistics Services Institute, American Institutes for Research. In addition, the report was reviewed by Sheryl Lazarus of the Institute of Education Sciences.

iv
This page intentionally left blank.

v
Executive Summary
The rate of obesity among school-age children has become a national concern, with the number of overweight children aged 6 to 11 more than tripling over the past three decades (U.S. Government Accountability Office 2005). One way to address this health issue in schools is to emphasize an “energy balance” approach—calories consumed versus calories expended—to support healthy eating and an active lifestyle. This report is based on a survey conducted by the National Center for Education Statistics (NCES) in the Institute of Education Sciences, U.S. Department of Education. It presents current national information for public elementary schools on the availability of foods outside of full school meals, the opportunities for students to engage in physical activity, and the physical assessment of students.
Availability of Foods Outside of Full School Meals
Most public elementary schools (94 percent) offered foods for sale outside of full school meals, and of these schools, 36 percent reported that foods were sold to generate funds to support food service operations at the school or district (figure 2 and table 2). Schools with any cafeteria or lunchroom food services indicated whether each of 15 foods was offered for sale outside of full school meals. Schools also reported the availability of nine of the listed foods (i.e., nondairy beverages and snack foods) at vending machines and school stores or snack bars, and the times when foods were available.
• Most public elementary schools (88 percent) offered at least one of the listed foods for
sale outside of full school meals at one or more locations in the school, and 84 percent offered at least one of the foods in the cafeteria or lunchroom (figure 3 and table 3). The schools offered both healthy and less nutritious foods for sale outside of full school meals, although a higher proportion of the schools offered nutritious than less nutritious items. For example, schools were more likely to offer 100% juice (53 percent), bottled water (46 percent), and green salad or fruit (40 percent) than less nutritious items such as soft drinks (12 percent), candy (15 percent), and french fried potatoes (17 percent).
• Twenty-two percent of public elementary schools offered at least one of the nine nondairy beverages or snack foods at vending machines (tables 3 and 6), and 31 percent sold at least one of the foods at school stores or snack bars (tables 3 and 7).
• Among the schools with vending machines, 33 percent had vending machine foods available during mealtimes, 46 percent had the foods available at other times during the school day, and 61 percent had the foods available to students outside of the school day (table 8). Among those with school stores or snack bars, 43 percent had foods available at this venue during mealtimes, 33 percent had the foods available at other times during the school day, and 41 percent had foods at school stores or snack bars available to students outside of the school day (table 9).

vi
Opportunities for Students to Engage in Physical Activity
The study examined three indicators of physical activity—scheduled recess, scheduled physical education, and school activities or programs to encourage physical activity. Information on recess and physical education was collected separately for each grade that was considered elementary at the school, typically grades 1 through 5 or 6.
• Most public elementary schools reported scheduled recess for students, with the
proportion of schools ranging from 93 percent for first and second grades to 87 percent for sixth grades that were considered elementary at the school (table 12). Thus, the proportion of schools that had no scheduled recess ranged from 7 to 13 percent across elementary grades (figure 4 and tables 12 and 13).
• Most public elementary schools reported daily recess, with the proportion of schools reporting this schedule ranging from 83 to 88 percent across elementary grades (figure 4 and tables 12 and 13). In addition, the average number of minutes per day of scheduled recess ranged from 27.8 for first grade to 23.8 for sixth grades that were considered elementary (table 15).1
• While almost all public elementary schools (99 percent) reported that they scheduled physical education for elementary grades, the proportion of schools that provided daily physical education ranged from 17 to 22 percent across elementary grades (figure 6 and table 16). The average number of days per week of scheduled physical education was 2.4 times per week for first through fifth grades and 2.6 times per week for sixth grades that were considered elementary (table 17).2
• Information on the length of physical education classes and the number of times per week of physical education was used to calculate the average number of minutes per week for each elementary grade (figure 7 and table 18). The average number of minutes per week of physical education ranged from 85.4 minutes for first grade to 98.0 minutes for sixth grades that were considered elementary. This included the schools with physical education classes that varied by number of days per week and class length.
• When the number of minutes per week for physical education and recess were combined, the average number of minutes per week ranged from 208 to 222 minutes of scheduled recess and physical education across elementary grades (table 19).
• Sixty-four percent of the schools used nontraditional physical education activities, such as dance or kick-boxing, to make physical education enjoyable (table 20) At least one-half of the schools used each of three other broad types of activities or programs to encourage physical activity among elementary grade students. These were opportunities during the school day for organized physical activities outside of physical education (58 percent), the President’s Challenge Physical Activity and Fitness Award program (55 percent), and school-sponsored before- or after-school activities that emphasize physical activity (51 percent).
1 Includes schools with no scheduled recess. 2 Includes schools with no scheduled physical education.

vii
Physical Assessment of Students
• Two-thirds of public elementary schools never calculated the students’ body mass index (BMI) in 2005 (table 21). In addition, 28 percent of the schools never measured students’ height, and 29 percent never measured students’ weight.
• Of the public elementary schools that measured students’ height, 39 percent sent this information to parents (table 22). Similarly, 39 percent of the schools that measured students’ weight sent the information to parents, while 49 percent of the schools that calculated students’ BMI sent the information to parents.

viii
This page intentionally left blank.

ix
Contents
Page Acknowledgments .................................................................................................................... iii Executive Summary ................................................................................................................. v List of Tables ............................................................................................................................ x List of Figures........................................................................................................................... xiv Summary................................................................................................................................... 1
Background................................................................................................................... 1
Methods and Data ............................................................................................ 2
Selected Findings .......................................................................................................... 4
Food Services at the School............................................................................. 4 Types of Food Services ............................................................................ 5 Availability of Foods Outside of Full School Meals ................................ 6
Types of Food Available in the School and in the Cafeteria or
Lunchroom ................................................................................................ 7 Foods Sold at Vending Machines and School Stores or Snack Bars ............... 10
Types of Food........................................................................................... 11 Times When Foods Were Available......................................................... 12
Food Service Operations.................................................................................. 12 Scheduled Recess............................................................................................. 14
Schools With Scheduled Recess............................................................... 14 Days Per Week of Scheduled Recess ....................................................... 14 Times Per Day and Minutes Per Day ....................................................... 16
Scheduled Physical Education ......................................................................... 17
Days Per Week of Scheduled Physical Education.................................... 17 Minutes Per Class and Average Minutes Per Week ................................. 18 Combined Minutes Per Week of Physical Education and Recess ............ 19
Activities to Encourage Physical Activity ....................................................... 20 Physical Assessment of Students ..................................................................... 21
References ................................................................................................................................. 23 Tables of Estimates and Standard Errors ............................................................................. 25 Appendix A: Technical Notes................................................................................................. A-1 Appendix B: Questionnaire.................................................................................................... B-1
x
List of Tables
Table Page
1 Percent of public elementary schools reporting the availability of foods at the school, by type of food services and selected school characteristics: 2005.................. 26
1a Standard errors for the percent of public elementary schools reporting the
availability of foods at the school, by type of food services and selected school characteristics: 2005...................................................................................................... 27
2 Percent of public elementary schools that offered any foods for sale outside of full
school meals, and percentage distribution reporting whether the foods were sold to generate funds to support food service operations, by selected school characteristics: 2005...................................................................................................... 28
2a Standard errors for the percent of public elementary schools that offered any foods
for sale outside of full school meals, and percentage distribution reporting whether the foods were sold to generate funds to support food service operations, by selected school characteristics: 2005 ....................................................................... 29
3 Percent of public elementary schools indicating that various foods were available
for sale at one or more locations in the school, and in the cafeteria or lunchroom, vending machine, and school store or snack bar, by type of food: 2005 ...................... 30
3a Standard errors for the percent of public elementary schools indicating that
various foods were available for sale at one or more locations in the school, and in the cafeteria or lunchroom, vending machine, and school store or snack bar, by type of food: 2005......................................................................................................... 31
4 Percent of public elementary schools indicating that various foods were available
for sale at one or more locations in the school, by selected school characteristics: 2005 .............................................................................................................................. 32
4a Standard errors for the percent of public elementary schools indicating that
various foods were available for sale at one or more locations in the school, by selected school characteristics: 2005 ....................................................................... 34
5 Percent of public elementary schools indicating that various foods were available
for sale in the school cafeteria or lunchroom, by selected school characteristics: 2005 .............................................................................................................................. 36
5a Standard errors for the percent of public elementary schools indicating that
various foods were available for sale in the school cafeteria or lunchroom, by selected school characteristics: 2005 ....................................................................... 38
6 Percent of public elementary schools indicating that various foods were available
for sale at vending machines, by selected school characteristics: 2005........................ 40 6a Standard errors for the percent of public elementary schools indicating that
various foods were available for sale at vending machines, by selected school characteristics: 2005...................................................................................................... 41

xi
7 Percent of public elementary schools indicating that various foods were available
for sale at school stores or snack bars, by selected school characteristics: 2005.......... 42 7a Standard errors for the percent of public elementary schools indicating that
various foods were available for sale at school stores or snack bars, by selected school characteristics: 2005 .......................................................................................... 43
8 Percent of public elementary schools indicating the times when foods were
available for sale at vending machines, and of the schools with vending machines, percent indicating the times when foods were available for sale, by selected school characteristics: 2005...................................................................................................... 44
8a Standard errors for the percent of public elementary schools indicating the times
when foods were available for sale at vending machines, and of the schools with vending machines, percent indicating the times when foods were available for sale, by selected school characteristics: 2005 ............................................................... 45
9 Percent of public elementary schools indicating the times when foods were
available for sale at school stores or snack bars, and of the schools with school stores or snack bars, percent indicating the times when foods were available for sale, by selected school characteristics: 2005 ............................................................... 46
9a Standard errors for the percent of public elementary schools indicating the times
when foods were available for sale at school stores or snack bars, and of the schools with school stores or snack bars, percent indicating the times when foods were available for sale, by selected school characteristics: 2005 ................................. 47
10 Percentage distribution of public elementary schools reporting the entities that
operated food services at the school, by selected school characteristics: 2005 ............ 48 10a Standard errors for the percentage distribution of public elementary schools
reporting the entities that operated food services at the school, by selected school characteristics: 2005...................................................................................................... 49
11 Percent of public elementary schools indicating that companies have contracts to
sell drinks or snack foods at the school, and percentage distribution reporting various agreements with those companies, by selected school characteristics: 2005... 50
11a Standard errors for the percent of public elementary schools indicating that
companies have contracts to sell drinks or snack foods at the school, and percentage distribution reporting various agreements with those companies, by selected school characteristics: 2005 ....................................................................... 51

xii
12 Percent of public elementary schools indicating that recess was scheduled at the school, and percentage distribution reporting the number of days per week, times per day, and minutes per day of scheduled recess, by elementary grade level: 2005 ... 52
12a Standard errors for the percent of public elementary schools indicating that recess
was scheduled at the school, and percentage distribution reporting the number of days per week, times per day, and minutes per day of scheduled recess, by elementary grade level: 2005 ........................................................................................ 53
13 Percentage distribution of public elementary schools reporting the number of days
per week of scheduled recess, by elementary grade level and selected school characteristics: 2005...................................................................................................... 54
13a Standard errors for the percentage distribution of public elementary schools
reporting the number of days per week of scheduled recess, by elementary grade level and selected school characteristics: 2005............................................................. 56
14 Percentage distribution of public elementary schools reporting the number of
times per day of scheduled recess, by elementary grade level and selected school characteristics: 2005...................................................................................................... 58
14a Standard errors for the percentage distribution of public elementary schools
reporting the number of times per day of scheduled recess, by elementary grade level and selected school characteristics: 2005............................................................. 60
15 Mean number of minutes per day of scheduled recess at public elementary
schools, by elementary grade level and selected school characteristics: 2005 ............. 62 15a Standard errors for the mean number of minutes per day of scheduled recess at
public elementary schools, by elementary grade level and selected school characteristics: 2005...................................................................................................... 63
16 Percent of public elementary schools indicating that physical education was
scheduled at the school, and percentage distribution reporting the number of days per week and minutes per class of scheduled physical education, by elementary grade level: 2005........................................................................................................... 64
16a Standard errors for the percent of public elementary schools indicating that
physical education was scheduled at the school, and percent reporting the number of days per week and minutes per class of scheduled physical education, by elementary grade level: 2005 ........................................................................................ 65
17 Mean number of days per week of scheduled physical education at public
elementary schools, by elementary grade level and selected school characteristics: 2005 .............................................................................................................................. 66
17a Standard errors for the mean number of days per week of scheduled physical
education at public elementary schools, by elementary grade level and selected school characteristics: 2005 .......................................................................................... 67
18 Mean number of minutes per week of scheduled physical education at public
elementary schools, by elementary grade level and selected school characteristics: 2005 .............................................................................................................................. 68
xiii
18a Standard errors for the mean number of minutes per week of scheduled physical
education at public elementary schools, by elementary grade level and selected school characteristics: 2005 .......................................................................................... 69
19 Mean number of minutes per week of scheduled recess and physical education,
combined, at public elementary schools, by elementary grade level and selected school characteristics: 2005 .......................................................................................... 70
19a Standard errors for the mean number of minutes per week of scheduled recess and
physical education, combined, at public elementary schools, by elementary grade level and selected school characteristics: 2005............................................................. 71
20 Percent of public elementary schools indicating that the school was involved in
various activities or programs to encourage physical activity among students, by selected school characteristics: 2005 ............................................................................ 72
20a Standard errors for the percent of public elementary schools indicating that the
school was involved in various activities or programs to encourage physical activity among students, by selected school characteristics: 2005 ............................... 73
21 Percentage distribution of public elementary schools reporting the frequency with
which the school calculated the students’ body mass index and measured students’ height and weight, by selected school characteristics: 2005......................................... 74
21a Standard errors for the percentage distribution of public elementary schools
reporting the frequency with which the school calculated the students’ body mass index and measured students’ height and weight, by selected school characteristics: 2005...................................................................................................... 76
22 Percent of public elementary schools that calculated the students’ body mass index
and measured students’ height and weight indicating whether the information was sent to parents, by selected school characteristics: 2005 .............................................. 78
22a Standard errors for the percent of public elementary schools that calculated the
students’ body mass index and measured students’ height and weight indicating whether the information was sent to parents, by selected school characteristics: 2005 .............................................................................................................................. 79
A-1 Number and percent of responding public elementary schools in the study sample,
and estimated number and percent of public schools the sample represents, by school characteristics: 2005 .......................................................................................... A-5
A-2 Number of cases with imputed data in the study sample, and the number of cases
with imputed data the sample represents, by questionnaire item: 2005........................ A-6

xiv
List of Figures
Figure Page
1 Percent of public elementary schools reporting the availability of foods, by type of food services: 2005 ....................................................................................................... 5
2 Percent of public elementary schools that offered any foods for sale outside of full
school meals, and percentage distribution reporting whether the foods were sold to generate funds to support food service operations: 2005.............................................. 7
3 Percent of public elementary schools indicating that various foods were available
at one or more locations in the school and at the school cafeteria or lunchroom: 2005 .............................................................................................................................. 9
4 Percent of public elementary schools reporting the number of days per week of
scheduled recess, by elementary grade level: 2005 ...................................................... 15 5 Percent of public elementary schools reporting the number of minutes per day of
scheduled recess, by elementary grade level: 2005 ...................................................... 16 6 Percentage distribution of public elementary schools reporting the number of days
per week of scheduled physical education, by elementary grade level: 2005............... 17 7 Mean number of minutes per week of scheduled physical education,
by elementary grade level: 2005 ................................................................................... 19

1
Summary
Background
The rate of obesity among school-age children has become a national concern, with the number of overweight children aged 6 to 11 more than tripling over the past three decades (U.S. Government Accountability Office 2005). In 2001, the U.S. Surgeon General issued a Call to Action to Prevent and Decrease Overweight and Obesity, and in 2002, Congress charged the Institute of Medicine (IOM) with developing an action plan to target this health issue. Among the core recommendations of the IOM’s 2004 report was a call for schools to create environments that support healthy eating and an active lifestyle. Federal, state, and local initiatives have also emphasized an “energy balance” approach—calories consumed versus calories expended—as critical to understanding and addressing the factors related to overweight and obesity (Institute of Medicine 2005). For example, the 2005 Dietary Guidelines report included a recommendation for at least 60 minutes of physical activity daily for children 6 to 11 years old, twice the minimum amount recommended for adults.
Research on school nutrition has focused primarily on the nutritional content of federally
subsidized school meals and the extent to which foods are available for sale outside of those meals. Ongoing research from the U.S. Government Accountability Office (GAO), for example, suggests that while schools have made significant strides in offering healthy school meals that meet U.S. Department of Agriculture (USDA) requirements, there is concern about the availability of foods that compete with those school meals. A recent GAO study concluded that foods sold outside of school meals have become more available to middle school students over the past 5 years (U.S. Government Accountability Office 2005). These foods, including both nutritious foods and foods of low nutritional value, are often sold during mealtimes in or around school cafeterias and in vending machines or school stores. In addition, while many schools have introduced healthier food choices for their students, a major constraint for some schools is their reliance on the funds generated through the sale of popular foods such as soda and sweet snacks.
While there is heightened attention on the role that schools can play in addressing concerns
about nutrition and physical activity among young children and youth, the most recent national data on both school nutrition and physical activity opportunities for students come from the 2000 School Health Policies and Programs Study (SHPPS), conducted by the Centers for Disease Control and Prevention (CDC). The study findings concurred with ongoing findings from GAO reports about the availability of foods outside of school meals and the low nutritional value of some of those foods (Burgeson et al. 2001).

2
The study also indicated that some schools may be cutting back on the time available for physical education and recess in order to fit as much classroom time as possible into the school day.
Methods and Data
The Fast Response Survey System (FRSS) questionnaire, Foods and Physical Activity in Public Elementary Schools: 2005, was designed to obtain current national information on the availability of foods and opportunities for physical activity in public elementary schools. The survey covered the following topics:
• food services at the school, including cafeteria services and the availability of foods at
vending machines and school stores or snack bars;
• types of food sold at one or more locations in the school and in the cafeteria or lunchroom;
• types of food sold at vending machines and school stores or snack bars, and times when foods were available at these locations;
• food service operations and contracts with companies to sell foods at the school;
• scheduled recess, including the days per week, times per day, and minutes per day of recess;
• scheduled physical education, including the days per week, class length, and average minutes per week of physical education;
• activities to encourage physical activity among elementary students; and
• physical assessment of students.
The study was conducted by the National Center for Education Statistics (NCES) using the Fast Response Survey System. FRSS is designed to administer short, focused, issue-oriented surveys that place minimal burden on respondents and have a quick turnaround from data collection to reporting. Questionnaires for the survey were mailed in spring 2005 to a representative sample of 1,198 regular public elementary schools in the 50 states and the District of Columbia. Regular public elementary schools were defined as schools with a high grade of 1 to 8 and a low grade of prekindergarten, kindergarten, or grades 1 to 3.
The sample was selected from the 2002–03 NCES Common Core of Data (CCD) Public
School Universe file, which was the most current file available at the time of sample selection. The sampling frame includes approximately 51,000 regular public elementary schools. Data have been

3
weighted to yield national estimates. The unweighted and weighted response rates were both 91 percent. Detailed information about the survey methodology is provided in appendix A, and the questionnaire can be found in appendix B.
The primary purpose of this E.D. TAB is to present national estimates of the availability of
foods and opportunities for physical activity in public elementary schools. In addition, selected survey findings are presented by the following school characteristics, which are defined in more detail in appendix A:
• school enrollment size (enrollment of less than 300, 300 to 499, 500 or more);
• locale (city, urban fringe, town, rural);
• region (Northeast, Southeast, Central, West);
• percent minority enrollment (less than 6 percent, 6 to 20 percent, 21 to 49 percent, 50 percent or more); and
• percent of students eligible for free or reduced-price lunch (less than 35 percent, 35 to 49 percent, 50 to 74 percent, 75 percent or more), which is used as a proxy measure of poverty concentration at the school.
Throughout this report, school enrollment size will be referred to as small, medium, or large schools. The percent of students eligible for free or reduced-priced lunch will be referred to as poverty concentration.
The focus on comparisons by school characteristics is primarily on significant differences by
enrollment size and poverty concentration. Comparisons by other characteristics (e.g., region and locale) are reported only where significant differences were detected and followed meaningful patterns (e.g., when differences by school locale were consistent across the various types of foods available for sale). The E.D. TAB is purely descriptive in nature, and readers are cautioned not to draw causal inferences based solely on the bivariate results presented in this report. It is important to note that many of the variables examined in this report are related to one another, and complex interactions and relationships have not been explored here. The variables examined here also demonstrate the range of information that helped shape the design and now is available from the study. The selected findings are examples of comparisons that can be made using the data and are not designed to emphasize any particular issue. Release of the E.D. TAB is intended to encourage more in-depth analysis of the data, using more sophisticated statistical methods.
All specific statements of comparison presented in this report have been tested for statistical
significance through t tests and are significant at the 95 percent confidence level. Throughout this report,

4
differences that may appear large (particularly those by school characteristics) may not be statistically significant. This may be due to the relatively large standard errors surrounding the estimates. A detailed description of the statistical tests supporting the survey findings can be found in appendix A.
Selected Findings
The findings in this report are organized as follows: • food services at the school (i.e., types of food services – cafeteria or lunchroom, vending
machines, school stores or snack bars – and availability of foods outside of full school meals);
• types of foods available in the school and in the cafeteria or lunchroom;
• foods sold at vending machines and school stores or snack bars;
• food service operations (i.e., the entity that operated food services at the school, and contracts with companies to sell foods at the school);
• scheduled recess;
• scheduled physical education;
• activities to encourage physical activity (e.g., nontraditional physical education activities, such as dance or kick-boxing, to make physical education enjoyable); and
• physical assessment of students (i.e., measurement of students’ height and weight and calculation of body mass index).
Food Services at the School
The survey collected information on whether public elementary schools offered any food services in a cafeteria or lunchroom in 2005, including full school meals, a la carte items (i.e., foods sold separate from school meals), and foods sold at vending machines in the cafeteria or lunchroom. Schools with cafeteria or lunchroom services also reported whether they offered full school meals, including free, reduced-price, and full-price meals under the School Breakfast Program or the National School Lunch Program. In addition, all public schools indicated whether foods were available at vending machines and at school stores or snack bars. Information about the cafeteria food services was combined with information about the availability of foods at vending machines and school stores or snack bars to create a measure of whether there were any food services at the school.3
3 Thus, food service is used in a broad sense to include cafeteria services (i.e., school meals and a la carte items) and foods sold at vending
machines and school stores.

5
Types of Food Services • Almost all public elementary schools (99 percent) offered some type of food service at
the school (figure 1 and table 1). This included foods that were available to students at one or more of the following locations in the school: school cafeteria or lunchroom, vending machine, and school store or snack bar.
• Ninety-eight percent of public elementary schools offered cafeteria or lunchroom food services (figure 1 and table 1). This included school meals, a la carte items, and vending machine foods sold in the cafeteria or lunchroom.
• Ninety-eight percent of public elementary schools provided full school meals to students, including free, reduced-price, and full-price meals under the School Breakfast Program or the National School Lunch Program (figure 1 and table 1).4
• Twenty-three percent of public elementary schools offered vending machine foods for sale, and 35 percent offered foods for sale at school stores or snack bars (figure 1 and table 1).5
Figure 1. Percent of public elementary schools reporting the availability of foods, by type of food services: 2005
35
23
98
98
99
0 20 40 60 80 100
School store or snack bar foods
Vending machine foods
Full school meals
Any food services in the cafeteria or lunchroom
Any food services at the school
Percent
2
3
4
5
1
Type of food services
1Food services at the school include foods and beverages available to students in the school cafeteria or lunchroom (e.g., school meals, a la carte items, and vending machine foods) and foods and beverages sold at vending machines and school stores or snack bars. 2Cafeteria food services include school meals and foods sold outside of school meals as a la carte items or at vending machines in the cafeteria. 3Full school meals include free, reduced-price, and full-price school meals under the School Breakfast Program or the National School Lunch Program. 4Vending machine foods include foods available at vending machines that may or may not be located in the school cafeteria. 5School store or snack bar foods include foods available at school stores or snack bars that may or may not be located in the school cafeteria. SOURCE: U.S. Department of Education, National Center for Education Statistics, Fast Response Survey System (FRSS), “Foods and Physical Activity in Public Elementary Schools: 2005,” FRSS 87, 2005.
4 A small number of cases (six schools in the sample) offered cafeteria services but did not provide full school meals to students in 2005. 5 These measures were derived from question 4 and question 6, which asked about the times when vending machine foods were available to
students and when school store or snack bar foods were available to students. Respondents could either choose “never” (and skip to the next question) or they could check one or more response options—at mealtimes, other times during the school day, outside of the school day, and other times. Thus, a response of “never” was coded as “no” for whether the school had foods available at these locations.

6
• The proportion of public elementary schools that offered any food services at the school, and the proportion that offered three types of food services—cafeteria or lunchroom services, full school meals, and vending machine foods—differed by school characteristics (table 1). For example:
- Large and medium-sized schools were more likely than small schools to offer any food services at the school (100 vs. 96 percent, respectively) (table 1). Differences were also observed for the proportion of schools that offered any food services in the cafeteria or lunchroom and the proportion that offered full school meals.
- City schools were more likely than rural schools to offer cafeteria or lunchroom services and full school meals (table 1). However, a higher proportion of rural schools offered vending machine foods than did schools in other locales.
- Schools with the lowest poverty concentration were less likely than schools with higher poverty concentrations to offer any food services at the school (97 percent vs. 99 and 100 percent, respectively) (table 1). Differences were also observed for the proportion of schools that offered cafeteria or lunchroom services and the percentage that offered full school meals.
Availability of Foods Outside of Full School Meals
The survey collected information on whether foods or beverages were sold separately from full school meals in 2005, and whether foods purchased outside of full school meals were sold to generate funds to support food service operations at the school or district. This variable was derived from question 10 of the survey (i.e., whether the foods that students can buy separately from full school meals were sold to generate funds to support food service operations at the school). A response of “not applicable; no foods or beverages sold separately from full school meals” was coded as “no” for whether students could buy any foods separately from full school meals at the school.6
• Most public elementary schools (94 percent) offered foods for sale outside of full school
meals (figure 2 and table 2). The proportion of public elementary schools that offered foods for sale outside of full school meals differed by school characteristics. For example, large and medium-sized schools were more likely than small schools to offer foods for sale outside of school meals (95 vs. 89 percent, respectively), and schools located in the Southeast were more likely than those in the West and Central regions to offer any foods for sale outside of school meals.
• Of the 94 percent of public elementary schools that offered foods for sale outside of full school meals, 36 percent indicated that the foods were sold to generate funds to support food service operations at the school or district (figure 2 and table 2). Another 54 percent of the schools reported that the foods were not sold to generate funds, while 10 percent indicated that they did not know the answer to this question.
6 See appendix B for a copy of the questionnaire.

7
Figure 2. Percent of public elementary schools that offered any foods for sale outside of full school meals, and percentage distribution reporting whether the foods were sold to generate funds to support food service operations: 2005
No(6%)Yes
(94%)
Percent of schools offering foods Of the schools that offered foods for sale
for sale outside of full school meals1 outside of full school meals, percent distribution that sold foods to generate funds2
1This variable was derived from the response to question 10 of the survey (i.e., whether the foods that students can buy separately from full school meals were sold to generate funds to support food service operations at the school). A response of “not applicable; no foods or beverages sold separately from full school meals” to this question was coded as “no” for whether students could buy any foods separately from full school meals at the school (6 percent). This 6 percent of schools included 10 schools that did not offer any of the listed foods for sale in questions 3, 5, and 7. 2Based on the 94 percent of public elementary schools that offered any of the selected foods for sale outside of full school meals. NOTE: Detail may not sum to totals because of rounding. SOURCE: U.S. Department of Education, National Center for Education Statistics, Fast Response Survey System (FRSS), “Foods and Physical Activity in Public Elementary Schools: 2005,” FRSS 87, 2005.
• The proportion of public elementary schools that sold foods outside of full school meals
to generate funds to support food service operations at the school or district differed by school characteristics (table 2). For example, a higher proportion of rural than city schools sold foods to generate funds to support food service operations at the school or district (41 vs. 31 percent).7 In addition, schools with the lowest poverty concentration were more likely to sell foods to generate funds than did schools with the two highest categories of poverty concentration (i.e., schools with 50 to 74 percent and 75 percent or more students eligible for free or reduced-price lunch) (table 2).8
Types of Food Available in the School and in the Cafeteria or Lunchroom
The survey collected information on selected types of food that were offered for sale at different locations in the school in 2005—the school cafeteria or lunchroom, and vending machines and school stores or snack bars (which may or may not be located in the school cafeteria or lunchroom). Schools with any cafeteria or lunchroom food services were asked whether students can purchase each of 7 Estimates for towns were based on small sample sizes and generally had large standard errors. Thus, throughout the report, differences that
appear large for towns were often not statistically significant. 8 See description of poverty concentration on page 3.
No (54%)Don't know
(10%)
Yes(36%)

8
15 foods separate from full school meals during mealtimes in the school cafeteria or lunchroom. The foods included four broad groups—nondairy beverages, dairy products, lunch sides, and snack foods—and ranged from nutritious items such as 100% juice and green salad or fruit to less nutritious items such as soft drinks and candy (figure 3 and table 3).
• Nondairy beverages: 100% fruit or vegetable juice, sports drinks or fruit drinks that are
not 100% juice, soft drinks, and bottled water.
• Dairy products: low-fat or skim milk, milk that is not low fat or skim, yogurt, and ice cream or frozen yogurt.
• Lunch sides: french fried potatoes and green salad or fruit.
• Snack foods: candy; low-fat salty snacks such as pretzels and baked or other low-fat chips; salty snacks that are not low in fat such as regular potato chips and cheese puffs; low-fat cookies, cakes, pastries, and other baked goods; and cookies, cakes, pastries, and other baked goods that are not low in fat.
Respondents also indicated whether the nine nondairy beverages and snack foods were available for sale at vending machines and school stores or snack bars.
Information about the types of food available in the cafeteria or lunchroom was combined
with information about the types of food available at vending machines and school stores or snack bars to create an overall measure of whether each of the listed foods was available at one or more locations in the school in 2005.9 Eighty-eight percent of public elementary schools had at least 1 of the 15 foods for sale outside of full school meals at one or more locations in the school, and 84 percent had at least one of the foods for sale in the cafeteria or lunchroom (figure 3 and table 3).
• Nondairy beverages. Public elementary schools were more likely to offer healthier
nondairy beverages for sale, such as 100% juice, than less nutritious beverages such as soft drinks (figure 3 and table 3). For example, 53 percent of the schools offered 100% fruit or vegetable juice and 46 percent offered bottled water for sale at one or more locations in the school. In contrast, 31 percent of the schools offered sport drinks or fruit drinks that were not 100% juice and 12 percent offered soft drinks for sale. Differences in the availability of healthy beverages versus less nutritious beverages were also observed for nondairy beverages in the cafeteria or lunchroom. For example, 47 percent of the schools offered 100% fruit or vegetable juice in the cafeteria or lunchroom, while 22 percent offered sport drinks or fruit drinks that were not 100% juice at this location.
9 For example, soft drinks was coded as being available for sale at one or more locations at the school if this item was available at any of the
following locations: school cafeteria or lunchroom, vending machines, or school stores or snack bars.

9
Figure 3. Percent of public elementary schools indicating that various foods were available at one or more locations in the school and at the school cafeteria or lunchroom: 2005
Food
5
40
17
34
26
39
75
2
34
28
25
38
15
40
17
34
26
39
75
46
12
31
53
88
27
21
18
29
36
22
47
84
0 20 40 60 80 100
Percent
One or more locations in schoolCafeteria or lunchroom
At least one of the listed foods
Nondairy beverages100% fruit or vegetable juice
Sports/fruit drinks/not 100% juiceSoft drinks
Bottled water
Dairy products1
Low-fat or skim milk
Milk that is not low in fat or skim
YogurtIce cream or frozen yogurt
Lunch sides1
French fried potatoes
Green salad or fruit
Snack foodsCandy
Low-fat salty snacks
Salty snacks that are not low in fatLow-fat cookies/baked goods
Cookies/baked goods not low in fat
2
1Percentages are the same for foods sold at one or more locations in the school and foods sold at the cafeteria or lunchroom because the survey only asked whether dairy products and lunch sides were available in the cafeteria or lunchroom. Thus, no information was collected on the sale of these foods at other locations in the school. 2This category includes schools that sold at least one of the listed foods in one or more of the indicated locations—cafeteria or lunchroom, vending machine, school store or snack bar. SOURCE: U.S. Department of Education, National Center for Education Statistics, Fast Response Survey System (FRSS), “Foods and Physical Activity in Public Elementary Schools: 2005,” FRSS 87, 2005.
• Dairy products and lunch sides. Schools reported on the availability of dairy products
and lunch sides in the cafeteria or lunchroom (figure 3 and table 3). About three in four public elementary schools offered low-fat or skim milk for sale, while 39 percent offered milk that was not low fat or skim, 34 percent offered ice cream or frozen yogurt, and 26 percent offered yogurt. Furthermore, public elementary schools were more likely to report the availability of green salad or fruit than french fried potatoes as lunch sides in the cafeteria or lunchroom.
• Snack foods. Fifteen percent of public elementary schools offered candy for sale at one or more locations in the school, and 5 percent offered this snack in the cafeteria or lunchroom (figure 3 and table 3). Schools were more likely to offer low-fat salty snacks than those that were not low in fat (38 vs. 25 percent), but they were less likely to offer low-fat cookies or baked goods than those that were not low in fat (28 vs. 34 percent).

10
Differences were also observed for the availability of salty snacks and cookies or baked goods in the cafeteria or lunchroom.
• Differences by school characteristics for foods sold at the school. The proportion of public elementary schools that offered various types of food for sale at one or more locations in the school differed by school characteristics (table 4). For example:
- Large and medium-sized schools were more likely than small schools to offer at least 1 of the 15 listed foods at one or more locations in the school (91 and 90 percent vs. 83 percent, respectively) (table 4). Differences also held for green salad or fruit and all of the dairy foods (except milk that was not low fat or skim). In addition, large schools were more likely than small schools to offer 100% fruit or vegetable juice, bottled water, and low-fat cookies or baked goods for sale. However, the reverse held true for some of the less nutritious items, with small schools being more likely than medium-sized and large schools to offer soft drinks and candy for sale.
- Schools in the Southeast were more likely than those located in the West and Central regions to sell at least one of the listed foods at one or more locations in the school (table 4). Differences were also observed for the sale of 100% juice and bottled water. In addition, schools in the Northeast and Southeast were more likely than those located in the West and Central regions to offer other listed foods—green salad or fruit, all of the dairy products, and all of the snack foods, except candy—at one or more locations in the school.
- Schools with the highest poverty concentration were less likely than those with the lowest poverty concentration to offer at least one of the listed foods at one or more locations in the school (84 vs. 90 percent) (table 4). Differences generally held for green salad or fruit, low-fat salty snacks, and all of the listed dairy products. Differences were also observed for the sale of sports or fruit drinks that were not 100% juice, and cookies or baked goods that were not low in fat.
- Schools were more likely to report the availability of foods if foods were sold to generate funds to support food service operations than if the foods were not sold for this purpose (table 4). This difference was observed for the sale of all of the foods except soft drinks.
Foods Sold at Vending Machines and School Stores or Snack Bars
The survey collected information on the types of food available at vending machines and school stores or snack bars in 2005, and the times when those foods were available. Information on the availability of foods at vending machines and school stores or snack bars was restricted to the following nondairy beverages and snack foods:
• Nondairy beverages: 100% fruit or vegetable juice, sports drinks or fruit drinks that are
not 100% juice, soft drinks, and bottled water; and

11
• Snack foods: candy; low-fat salty snacks such as pretzels and baked or other low-fat chips; salty snacks that are not low in fat such as regular potato chips and cheese puffs; low-fat cookies, cakes, pastries, and other baked goods; and cookies, cakes, pastries, and other baked goods that are not low in fat.
Types of Food
All public elementary schools indicated whether each of the nine foods listed above was available to students at vending machines and at school stores or snack bars in 2005.
• Twenty-two percent of public elementary schools offered at least one of the nine foods
for sale at vending machines (tables 3 and 6), and 31 percent offered at least one of the listed foods at school stores or snack bars (tables 3 and 7).10
• The percentage of public elementary schools that offered nondairy beverages at vending machines ranged from 9 percent for soft drinks to 18 percent for bottled water (tables 3 and 6). In addition, 4 to 6 percent of the schools offered snack foods for sale at vending machines.
• The proportion of public elementary schools that offered the various foods for sale at vending machines differed by school characteristics (table 6). For example, small schools were more likely than medium-sized or large schools to offer each of the listed food items at vending machines, with the exception of 100% fruit or vegetable juice and bottled water (table 6). In addition, rural schools were more likely than schools in other locales to offer at least one of the listed foods and each of the nondairy beverages at vending machines. Rural schools were also more likely than those located in cities and urban fringes to offer each of the listed snack foods at vending machines (table 6).
• The proportion of public elementary schools that offered nondairy beverages for sale at school stores or snack bars ranged from 6 percent for soft drinks to 17 percent for 100% fruit or vegetable juice and bottled water (tables 3 and 7). The proportion of schools that offered snack foods ranged from 11 percent for candy to 19 percent for low-fat salty snacks.
• Schools were more likely to report the availability of foods in the school stores or snack bars if foods were sold to generate funds than if the foods were not sold for this purpose (table 7). This difference was observed for the sale of each of the listed foods except soft drinks and candy.
10 These measures are different from the two measures discussed in table 1, i.e., whether schools sold vending machine foods and school store or
snack bar foods. As indicated in the section on types of food services, the measure of whether schools sold vending machine foods was derived from question 4 of the survey, which asked when vending machine foods were available to students. Schools that checked “never” were coded as not having vending machine foods for sale, while those that checked any of the other responses to the question were coded as having vending machine foods for sale. The measure of whether schools sold foods at school stores or snack bars was derived from question 6 in a similar way. However, the measure of whether schools sold at least one of the nine listed foods at vending machines was derived from question 5, which asked whether each vending machine food was available to students. Similarly, the measure of whether schools sold at least one of the nine listed foods at school stores or snack bars was derived from question 7, which asked whether each food was available to students at this location. See appendix B for a copy of the questionnaire.
12
Times When Foods Were Available
Respondents were asked about the times at which vending machine foods and foods at school stores or snack bars were available to students in 2005—at mealtimes, other times during the school day, outside of the school day (e.g., during school-sponsored before- or after-school activities), and any other time (tables 8 and 9).11
• Vending machine foods were available to students during mealtimes in 8 percent of all
public elementary schools (table 8). In addition, 11 percent of all public elementary schools had foods available at vending machines at other times during the school day, and 14 percent had foods available outside of the school day. Among the 23 percent of public elementary schools with vending machines (table 1), 33 percent had vending machine foods available during mealtimes, 46 percent had the foods available at other times during the school day, and 61 percent had the foods available to students outside of the school day (table 8).12
• Fifteen percent of public elementary schools had school store or snack bar foods available to students during mealtimes (table 9). In addition, 11 percent of all public elementary schools had foods available at school stores or snack bars at other times during the school day, and 14 percent of the schools had foods available at this location outside of the school day. Among the 35 percent of public elementary schools with school stores or snack bars (table 1), 43 percent had foods available at this location during mealtimes, 33 percent had the foods available at other times during the school day, and 41 percent had the foods available to students outside of the school day (table 9).13
• The percentage of all public elementary schools that offered school store or snack bar foods during mealtimes differed by region and whether the foods were sold to generate funds (table 9). Schools in the Northeast were more likely than those in other regions to sell foods at school stores or snack bars at mealtimes. In addition, schools were more likely to report the availability of foods in the school stores or snack bars at mealtimes if foods were sold to generate funds than if the foods were not sold for this purpose.
Food Service Operations
Schools that offered any food services in 2005 indicated whether those services were operated by the school or school district, by a private entity under contract to the school or school district, or by some other entity. Schools that offered any foods for sale outside of full school meals indicated whether any companies had a contract to sell drinks or snack foods at the school. In addition, schools that had contracts with companies to sell drinks or snack foods at the school indicated whether there were
11 The percentage of schools that reported some other time when foods were available at vending machines and at school stores or snack bars is
not shown in tables 8 and 9 because it represents only 2 percent for vending machines and 5 percent for school stores or snack bars. 12 Respondents could report multiple times when vending machine foods were available. 13 Respondents could report multiple times when school store or snack bar foods were available.

13
various agreements with those companies for the school to receive a specific percentage of the sales receipts, sales incentives, or some other agreement.14
• Food services were primarily operated by the school or school district (table 10). Of the
99 percent of public elementary schools that offered any food services, 81 percent indicated that their food services were operated by the school or school district, while 19 percent reported that their food services were operated by a private or other entity.
• The proportion of schools indicating that their food services were operated by the school or school district differed by locale and region (table 10). Schools located in rural areas were more likely than those located in other locales to report that their food services were operated by the school or school district (90 vs. 77 to 81 percent, respectively). Public elementary schools in the Southeast were the most likely to report that their school or school district operated the food services at the school, while schools in the Northeast were the least likely to do so.
• Twenty-three percent of public elementary schools indicated that one or more companies had a contract to sell drinks or snack foods at the school (table 11). The proportion of schools that had contracts with companies to sell drinks or snack foods at the school differed by locale, region, and minority enrollment. Rural schools were more likely than those in other locales to report that companies had a contract to sell drinks or snack foods at the school (31 percent vs. 18 to 21 percent, respectively), and schools in the Southeast were more likely than those in the West and Northeast to report such contracts. In addition, schools with the lowest percent of minority enrollment were more likely than those with the highest percent of minority enrollment to report that companies had a contract to sell drinks or snack foods at the school.
• Among the 23 percent of public elementary schools that indicated that companies had contracts to sell drinks or snack foods at the school, a majority (69 percent) reported that the school or district was contracted to receive a specific percentage of the sales receipts, 24 percent indicated that the school or district was contracted to receive sales incentives for a specified amount of sales receipts, and 2 percent reported some other agreement or incentive (table 11).
• Schools located in the Southeast were more likely than those in the Northeast to report that the school or district was contracted to receive a specific percentage of the sales receipts (78 vs. 55 percent) (table 11). Moreover, a higher proportion of rural than city schools reported that the school or district was contracted to receive sales incentives for a specified amount of sales receipts (32 vs. 12 percent), and schools located in the West and Central regions were more likely than those in the Northeast to report such a contract.
14 These types of agreements were not defined for respondents on the questionnaire; see appendix B for a copy of the questionnaire.

14
Scheduled Recess
The survey collected information on whether schools scheduled any recess for each grade that was considered elementary at the school, typically grades 1 through 5 or 6. Respondents reported the number of days per week of scheduled recess, the number of times per day, and the total minutes per day of scheduled recess for each elementary grade in 2005.
Schools With Scheduled Recess • The proportion of public elementary schools with any scheduled recess ranged from 87
to 93 percent across elementary grades (table 12). For example, 93 percent of the schools had scheduled recess for first and second grades, and 87 percent had scheduled recess for sixth grades that were considered elementary at the school.
• The proportion of public elementary schools with no scheduled recess ranged from 7 to 13 percent across elementary grades (table 12). The proportion of public elementary schools with no scheduled recess for elementary grades differed by school locale, region, poverty concentration, and minority enrollment (table 13).
- City schools were more likely than schools in other locales to have no scheduled recess for first through fifth grades (table 13). In addition, city schools were more likely than those located in urban fringes and rural areas to report no scheduled recess for sixth grades that were considered elementary at the school.
- Schools in the Southeast were more likely than those located in other regions to have no scheduled recess for first through fifth grades (table 13).
- Public elementary schools with the highest poverty concentration were more likely than those with lower concentrations of poverty to have no scheduled recess for elementary grades (table 13). Differences were also observed for differences by minority enrollment, with schools with the highest proportion of minority enrollment being more likely than those with lower minority enrollments to have no scheduled recess.
Days Per Week of Scheduled Recess
• Most public elementary schools reported daily recess for elementary grades (figure 4 and tables 12). The proportion of schools that reported this schedule ranged from 83 to 88 percent across elementary grades, while 4 to 7 percent scheduled recess 1 to 4 days per week (table 13).

15
Figure 4. Percent of public elementary schools reporting the number of days per week of scheduled recess, by elementary grade level: 2005
13
9
9
8
7
7
4
7
6
5
5
5
83
83
85
87
88
88
0% 20% 40% 60% 80% 100%
Grade 6
Grade 5
Grade 4
Grade 3
Grade 2
Grade 1
None 1 to 4 days 5 days
0 20 40 60 80 100
Percent
NOTE: Respondents were asked to provide information for each grade that was considered elementary at the school, typically grades one through five or six. Detail may not sum to totals because of rounding. SOURCE: U.S. Department of Education, National Center for Education Statistics, Fast Response Survey System (FRSS), “Foods and Physical Activity in Public Elementary Schools: 2005,” FRSS 87, 2005.
• The percentage of public elementary schools with daily recess for elementary grades
differed by school characteristics (table 13).
- Large schools were generally less likely than small and medium-sized schools to report daily recess for first through third grades (table 13). For example, daily recess was scheduled for first grade in 84 percent of large schools, 90 percent of small schools, and 91 percent of medium-sized schools.
- City schools were less likely than schools in other locales to report daily recess for first grade (table 13). City schools were also less likely than schools in urban fringes and rural areas to schedule daily recess for second through fifth grades.
- Schools in the Southeast were less likely than those located in other regions to have daily recess for first through fifth grades (table 13). Schools in the Southeast were also less likely than those in the Northeast and West to provide daily recess for sixth grades that were considered elementary at the school.
- Schools with the highest poverty concentration were less likely than those with lower concentrations of poverty to report daily recess for elementary grades (table 13). Differences were also observed by minority enrollment, with schools with the highest proportion of minority enrollment being less likely than those with lower minority enrollments to provide daily recess.

16
Times Per Day and Minutes Per Day • A majority of public elementary schools scheduled recess once a day, and the percentage
of schools reporting this schedule ranged from 55 to 66 percent across elementary grades (tables 12 and 14). Fewer schools (21 to 28 percent) provided recess twice a day, while 4 to 10 percent indicated they had recess more than twice a day (table 12).
• The percentage of public elementary schools that had more than 30 minutes per day of recess ranged from 19 to 27 percent across elementary grades (figure 5 and table 12).
Figure 5. Percent of public elementary schools reporting the number of minutes per day of scheduled recess, by elementary grade level: 2005
13
9
9
8
7
7
17
18
17
15
14
14
21
23
22
20
18
18
28
32
33
33
34
33
21
19
20
25
26
27
0% 20% 40% 60% 80% 100%
Grade 6
Grade 5
Grade 4
Grade 3
Grade 2
Grade 1
None 1 to 15 16 to 20 21 to 30 More than 30 minutes
Percent
0 20 40 60 80 100
NOTE: Respondents were asked to provide information for each grade that was considered elementary at the school, typically grades 1 through 5 or 6. Details may not sum to totals because of rounding. SOURCE: U.S. Department of Education, National Center for Education Statistics, Fast Response Survey System (FRSS), “Foods and Physical Activity in Public Elementary Schools: 2005,” FRSS 87, 2005.
• Information on the total minutes spent per day on scheduled recess at each school was
used to calculate the mean number of minutes of scheduled recess for each grade across all public elementary schools (table 15). The average number of minutes per day of scheduled recess ranged from 27.8 for first grade to 23.8 for sixth grades that were considered elementary.15
• The average number of minutes per day of scheduled recess for elementary grades differed by school characteristics (table 15). For example, large schools reported a lower number of average minutes per day of recess than did small and medium-sized schools, and schools with the highest poverty concentration reported fewer minutes per day of scheduled recess than did schools with lower concentrations of poverty (table 15). This was true for all elementary grades at the schools.
15 Includes schools with no scheduled recess.

17
Scheduled Physical Education
Schools reported the number of days per week of scheduled physical education in 2005, and the minutes per class. If the number of days of scheduled physical education varied by week, respondents specified the schedule in the space provided.
Days Per Week of Scheduled Physical Education • Almost all public elementary schools (99 percent) reported that they scheduled physical
education for elementary grades (table 16).
• The percentage of public elementary schools that provided daily physical education ranged from 17 to 22 percent across elementary grades at the school (figure 6 and table 16). In addition, 11 to 14 percent scheduled physical education 3 or 4 days a week, 28 to 33 percent scheduled physical education 2 days a week, and 22 percent of the schools scheduled physical education 1 day a week across elementary grades. Furthermore, 14 to 16 percent of the schools reported that their physical education schedules varied by week. For example, schools that rotated physical education with other subjects might schedule physical education twice for one week and once for the subsequent week.
Figure 6. Percentage distribution of public elementary schools reporting the number of days per week of scheduled physical education, by elementary grade level: 2005
22
22
22
22
22
22
28
32
33
33
33
33
14
12
11
11
12
11
22
17
17
17
17
18
14
16
16
16
15
15
0% 20% 40% 60% 80% 100%
Grade 6
Grade 5
Grade 4
Grade 3
Grade 2
Grade 1
1 day 2 days 3 to 4 days 5 days Varies by week
Percent
0 20 40 60 80 100
NOTE: Respondents were asked to provide information for each grade that was considered elementary at the school, typically grades 1 through 5 or 6. One percent of public elementary schools did not have scheduled physical education at the school (not shown in figure). Thus, detail may not sum to totals because of rounding and the exclusion of the 1 percent of schools with no scheduled physical education. SOURCE: U.S. Department of Education, National Center for Education Statistics, Fast Response Survey System (FRSS), “Foods and Physical Activity in Public Elementary Schools: 2005,” FRSS 87, 2005.

18
• Information on the number of days of scheduled physical education at each school was used to calculate the average number of days of physical education for each elementary grade across all public elementary schools (table 17). Public elementary schools reported averages of 2.4 to 2.6 days per week of physical education across elementary grades. This included the average number of days for schools with physical education schedules that varied by week.16
Minutes Per Class and Average Minutes Per Week • The percentage of schools with physical education classes of 30 minutes or less ranged
from 43 percent for first grade to 34 percent for fifth and sixth grades (table 16). However, the percentage of schools with physical education classes of more than 40 minutes ranged from 31 percent for first grade to 40 percent for sixth grade.
• Information on the length of physical education classes and the number of days per week of physical education was used to calculate the total minutes per week for each elementary grade at the school, and the average number of minutes per week for each elementary grade across all public elementary schools (figure 7 and table 18).17 The average number of minutes per week of physical education ranged from 85.4 for first grade to 98.0 minutes for sixth grades that were considered elementary. This included the schools with physical education classes that varied by number of days per week and class length.18
• The average minutes per week of scheduled physical education for elementary grades differed by school characteristics (table 18). For example:
- Small schools had a higher number of average minutes per week of scheduled physical education than did medium-sized and large schools, and rural schools had higher averages than did schools located in other locales (table 18). This was true for all elementary grades in the school.
- Schools in the West had a higher number of average minutes per week of scheduled physical education for first through fifth grades than did schools located in other regions (table 18). Schools in the Northeast had the lowest averages for third through fifth grades, compared with schools in other regions (table 18).
16 Information provided by schools with physical education schedules that vary in the number of days from one week to the next was used to
calculate an average number days per week of scheduled physical education for each of those schools. For example, if a school reported 3 days of physical education in one week and 2 days in the next week, the average number of days per week was calculated as 2.5.
17 For each grade at the school, the number of minutes per physical education class was multiplied by the number of days per week of scheduled physical education to provide a total number of minutes of physical education per week. For each grade, this total in minutes per week was summed across all schools and divided by the number of schools to obtain the average minutes per week of physical education across public elementary schools.
18 Information provided by schools with physical education classes that varied in length was used to calculate the average length per class. For example, if a school reported three physical education classes of 20 minutes and one class of 40 minutes, the average class length was calculated as 25 minutes.

19
- Schools with the lowest poverty concentration had a lower number of average minutes per week of scheduled physical education than did schools with the two highest categories of poverty concentration (table 18). This difference held for first through fifth grades.
Figure 7. Mean number of minutes per week of scheduled physical education, by elementary
grade level: 2005
98.0
90.5
88.5
86.4
85.5
85.4
0 20 40 60 80 100
Grade 6
Grade 5
Grade 4
Grade 3
Grade 2
Grade 1
Mean number of minutes per week of physical education SOURCE: U.S. Department of Education, National Center for Education Statistics, Fast Response Survey System (FRSS), “Foods and Physical Activity in Public Elementary Schools: 2005,” FRSS 87, 2005.
Combined Minutes Per Week of Physical Education and Recess
Information on the total minutes per day and the number of days per week was used to calculate the total minutes per week of scheduled recess in 2005. The total minutes per week of physical education were added to the total minutes per week of recess to create an overall measure of combined minutes per week for recess and physical education. This measure reflects the total time per week when students may be provided with opportunities for physical activity.
• When the number of minutes for physical education and recess were combined, the
average number of minutes per week for these activities ranged from 208 to 222 minutes across elementary grades (table 19). The schools also had a lower average for grades 4 and 5 than they did for grades 1 through 3.
• The combined minutes per week for physical education and recess differed by some school characteristics (table 19). For example, large and medium-sized schools reported fewer minutes of combined physical education and recess per week for elementary grades than did small schools. In addition, schools with the highest poverty concentration reported lower averages in combined physical education and recess per

20
week for elementary grades than did schools with lower levels of poverty concentration. Thus, in high poverty schools, having more hours per week of physical education (table 18) did not compensate for having no scheduled recess (table 13).
Activities to Encourage Physical Activity
Respondents were asked whether their schools used each of four sets of activities or programs to encourage physical activity among elementary grade students in 2005. These were nontraditional physical education activities (e.g., dance or kick-boxing) to make physical education enjoyable, opportunities during the school day for organized physical activities (e.g., walking or running laps at recess), excluding physical education, school-sponsored before- or after-school activities that emphasize physical activity (e.g., walking or running, sports, dance, or group games), and participation in the President’s Challenge Physical Activity and Fitness Award program. Respondents also specified any other activity or program that may be used to encourage physical activity among elementary grade students at the school.
• Sixty-four percent of public elementary schools used nontraditional physical education
activities, such as dance or kick-boxing, to make physical education enjoyable (table 20). A higher proportion of large than small schools reported the use of nontraditional physical education activities, and schools in the Northeast were more likely than those in other regions to report the use of these activities. In addition, schools with the highest poverty concentration were less likely than schools with the two lowest categories of poverty concentration to use nontraditional physical education activities to make physical education enjoyable.
• Fifty-eight percent of public elementary schools provided opportunities during the school day for organized physical activities outside of physical education, including walking or running laps at recess (table 20). Schools in the Central region were less likely than those in other regions to provide these opportunities for organized physical activities.
• Fifty-one percent of public elementary schools offered school-sponsored before- or after-school activities that emphasize physical activity, such as walking or running, sports, dance, or group games (table 20). Schools in the Northeast were more likely than those in the Southeast to offer these school-sponsored before- or after-school activities, and schools with the highest minority enrollment were more likely than those with the lowest minority enrollment to offer these activities.
• Fifty-five percent of public elementary schools participated in the President’s Challenge Physical Activity and Fitness Award program (table 20). Schools in the West were less likely than those in other regions to participate in this program, and schools with the highest poverty concentration were less likely than those with the two lowest categories of poverty concentration to participate in the program.
• Thirty percent of schools had some other activity, such as Jump Rope for Heart, fun Friday, family fun night, walking with parents, field day, and little Olympics.

21
Physical Assessment of Students
The survey collected information on how often schools calculated students’ body mass index (BMI) and measured students’ height and weight in 2005. Schools that conducted any of these physical assessments were also asked whether this information was sent to parents.
• Two-thirds (66 percent) of public elementary schools reported that they never calculated
students’ body mass index (BMI) (table 21). In addition, 16 percent calculated the students’ BMI in selected grades only, another 16 percent calculated all students’ BMI yearly, and 3 percent used some other approach to calculate students’ BMI.
• Twenty-eight percent of public elementary schools reported that they never measured students’ height (table 21). Another 30 percent measured students’ height in selected grades only, 38 percent measured students’ height yearly for all students, and 3 percent used some other approach to measuring students’ height.
• Twenty-nine percent of public elementary schools reported that they never measured students’ weight. Another 29 percent measured students’ weight in selected grades only, 38 percent measured students’ weight yearly for all students, and 3 percent used some other approach to measuring students’ weight (table 21).
• Of the public elementary schools that measured students’ height, 39 percent sent this information to parents (table 22). Similarly, 39 percent of the schools that measured students’ weight sent the information to parents, while 49 percent of the schools that calculated students’ BMI sent the information to parents.

22
This page intentionally left blank.

23
References
Burgeson C., Wechsler H., Brener, N., Young, J., and Spain, C. (2001). Physical Education and Activity: Results from the School Health Policies and Programs Study 2000. Journal of School Health, 71(7): 279–293.
Institute of Medicine, Committee on Prevention of Obesity in Children and Youth. (2005). Preventing Childhood Obesity: Health in the Balance. Washington, DC: National Academies Press.
U.S. Department of Health and Human Services. (2005). Dietary Guidelines for Americans 2005. Washington, DC: U.S. Government Printing Office.
U.S. Government Accountability Office. (2005). School Meal Programs: Competitive Foods Are Widely Available and Generate Substantial Revenues for Schools (GAO–05–563). Washington, DC: U.S. Government Accountability Office.

24
This page intentionally left blank.

25
Tables of Estimates and Standard Errors

26
Table 1. Percent of public elementary schools reporting the availability of foods at the school, by type of food services and selected school characteristics: 2005
Availability of foods
School characteristic
Any food services at the
school1
Any food services in the
cafeteria or lunchroom2
Full school meals3
Vending machine
foods4
School store or snack bar
foods5
All public elementary schools .............................. 99 98 98 23 35
Enrollment size
Less than 300.......................................................... 96 95 94 28 36300 to 499............................................................... 100 99 99 20 37500 or more ............................................................ 100 100 99 23 31
School locale
City......................................................................... 100 99 99 18 34Urban fringe ........................................................... 98 98 97 16 35Town ...................................................................... 99 99 99 22 32Rural....................................................................... 98 97 96 38 36
Region
Northeast ................................................................ 98 97 96 16 35Southeast ................................................................ 100 100 99 22 38Central .................................................................... 99 97 97 26 30West ....................................................................... 99 99 98 24 36
Percent minority enrollment
Less than 6 percent ................................................. 98 97 96 30 296 to 20 percent ........................................................ 98 97 97 19 3321 to 49 percent ...................................................... 99 99 97 19 3650 percent or more.................................................. 100 100 99 22 35
Percent of students eligible for free or reduced-price lunch
Less than 35 percent ............................................... 97 96 95 21 3235 to 49 percent ...................................................... 100 100 99 22 3250 to 74 percent ...................................................... 100 99 99 28 3775 percent or more.................................................. 99 99 99 22 37
1Food services at the school include foods and beverages available to students in the school cafeteria or lunchroom (e.g., school meals, a la carte items, and vending machine foods) and foods and beverages sold at vending machines and school stores or snack bars. 2Cafeteria food services include school meals and foods sold outside of school meals as a la carte items or at vending machines in the cafeteria. 3Full school meals include free, reduced-price, and full-price school meals under the School Breakfast Program or the National School Lunch Program. 4Vending machine food includes foods available at vending machines that may or may not be located in the school cafeteria. 5School stores or snack bar foods include foods available at school stores or snack bars that may or may not be located in the school cafeteria. SOURCE: U.S. Department of Education, National Center for Education Statistics, Fast Response Survey System (FRSS), “Foods and Physical Activity in Public Elementary Schools: 2005,” FRSS 87, 2005.

27
Table 1a. Standard errors for the percent of public elementary schools reporting the availability of foods at the school, by type of food services and selected school characteristics: 2005
Availability of foods
School characteristic
Any food services at the
school
Any food services in the
cafeteria or lunchroom
Full school meals
Vending machine
foods
School store or snack bar
foods
All public elementary schools .............................. 0.3 0.4 0.5 1.2 1.6 Enrollment size
Less than 300.......................................................... 1.0 1.3 1.4 2.4 2.2300 to 499............................................................... † 0.5 0.6 2.2 2.6500 or more ............................................................ † † 0.5 2.4 2.3
School locale
City......................................................................... † 0.5 0.6 2.2 3.2Urban fringe ........................................................... 0.7 0.8 0.8 1.5 2.5Town ...................................................................... 1.0 1.0 1.0 4.7 5.4Rural....................................................................... 0.7 1.0 1.1 3.1 2.5
Region
Northeast ................................................................ 1.3 1.4 1.7 2.8 3.5Southeast ................................................................ † † 0.6 2.5 2.9Central .................................................................... 0.6 1.0 1.0 2.7 2.8West ....................................................................... 0.5 0.6 0.7 2.4 3.3
Percent minority enrollment
Less than 6 percent ................................................. 0.9 1.1 1.2 2.7 3.06 to 20 percent ........................................................ 1.0 1.2 1.2 2.9 3.521 to 49 percent ...................................................... 0.5 0.7 1.0 2.4 3.250 percent or more.................................................. † † 0.4 1.9 2.5
Percent of students eligible for free or reduced-price lunch
Less than 35 percent ............................................... 0.9 1.0 1.1 2.2 2.835 to 49 percent ...................................................... † † 0.6 3.7 4.350 to 74 percent ...................................................... † 0.5 0.5 2.9 2.775 percent or more.................................................. 0.5 0.5 0.5 2.1 2.8
†Not applicable. Estimate of standard error is not derived because it is based on a statistic estimated at 100 percent. SOURCE: U.S. Department of Education, National Center for Education Statistics, Fast Response Survey System (FRSS), “Foods and Physical Activity in Public Elementary Schools: 2005,” FRSS 87, 2005.

28
Table 2. Percent of public elementary schools that offered any foods for sale outside of full school meals, and percentage distribution reporting whether the foods were sold to generate funds to support food service operations, by selected school characteristics: 2005
Foods sold to generate funds2
School characteristic
Offered any foods for sale outside of full school meals1 Yes No
Don’t know
All public elementary schools ............. 94 36 54 10
Enrollment size
Less than 300......................................... 89 36 57 7 300 to 499.............................................. 95 34 54 12 500 or more ........................................... 95 38 52 9
School locale
City........................................................ 92 31 59 10 Urban fringe .......................................... 95 36 51 13 Town ..................................................... 92 41 55 4 Rural...................................................... 94 41 53 7
Region
Northeast ............................................... 94 45 39 15 Southeast ............................................... 97 46 45 9 Central ................................................... 93 31 65 5 West ...................................................... 92 30 59 12
Percent minority enrollment
Less than 6 percent ................................ 93 43 52 5 6 to 20 percent ....................................... 93 40 50 10 21 to 49 percent ..................................... 95 36 55 9 50 percent or more................................. 93 28 58 13
Percent of students eligible for free or reduced-price lunch
Less than 35 percent .............................. 94 43 48 9 35 to 49 percent ..................................... 90 38 52 11 50 to 74 percent ..................................... 98 35 55 10 75 percent or more................................. 92 27 63 10
1This variable was derived from the response to question 10 of the survey (i.e., whether the foods that students can buy separately from full school meals were sold to generate funds to support food service operations at the school). A response of “not applicable; no foods or beverages sold separately from full school meals” was coded as “no” for whether students could buy any foods separately from full school meals at the school. See appendix B for a copy of the questionnaire. 2Based on the 94 percent of public elementary schools that offered any of the selected foods for sale outside of full school meals. NOTE: Detail may not sum to totals because of rounding. SOURCE: U.S. Department of Education, National Center for Education Statistics, Fast Response Survey System (FRSS), “Foods and Physical Activity in Public Elementary Schools: 2005,” FRSS 87, 2005.

29
Table 2a. Standard errors for the percent of public elementary schools that offered any foods for sale outside of full school meals, and percentage distribution reporting whether the foods were sold to generate funds to support food service operations, by selected school characteristics: 2005
Foods sold to generate funds
School characteristic
Offered any foods for sale outside of full school meals Yes No
Don’t know
All public elementary schools ............. 0.6 1.5 1.6 0.9
Enrollment size
Less than 300......................................... 1.8 3.1 3.2 1.9 300 to 499.............................................. 1.1 2.7 2.8 1.7 500 or more ........................................... 1.1 2.4 2.4 1.3
School locale
City........................................................ 1.4 2.1 2.7 1.9 Urban fringe .......................................... 1.0 2.3 2.3 2.0 Town ..................................................... 2.6 4.9 5.6 2.2 Rural...................................................... 1.3 3.4 3.2 1.7
Region
Northeast ............................................... 1.7 4.2 4.2 2.7 Southeast ............................................... 1.1 3.1 3.4 2.2 Central ................................................... 1.5 2.7 2.7 1.3 West ...................................................... 1.4 2.3 2.4 1.7
Percent minority enrollment
Less than 6 percent ................................ 1.5 4.0 3.8 1.6 6 to 20 percent ....................................... 1.6 3.4 3.5 2.0 21 to 49 percent ..................................... 1.4 3.5 3.2 1.8 50 percent or more................................. 1.3 2.1 2.8 1.7
Percent of students eligible for free or reduced-price lunch
Less than 35 percent .............................. 1.0 2.6 2.7 1.8 35 to 49 percent ..................................... 2.2 4.6 4.5 2.6 50 to 74 percent ..................................... 0.8 3.2 3.5 1.9 75 percent or more................................. 1.6 2.2 2.8 1.7
SOURCE: U.S. Department of Education, National Center for Education Statistics, Fast Response Survey System (FRSS), “Foods and Physical Activity in Public Elementary Schools: 2005,” FRSS 87, 2005.

30
Table 3. Percent of public elementary schools indicating that various foods were available for sale at one or more locations in the school, and in the cafeteria or lunchroom, vending machine, and school store or snack bar, by type of food: 2005
Locations where food was available for sale
Type of food
One or more locations in the
school1Cafeteria or lunchroom
Vending machine
School store or snack bar
At least one of the listed foods ....................................... 88 84 22 31
Nondairy beverages
100% fruit or vegetable juice.......................................... 53 47 12 17 Sports drinks or fruit drinks that are not 100% juice ...... 31 22 13 12 Soft drinks ...................................................................... 12 2 9 6 Bottled water .................................................................. 46 36 18 17
Dairy products
Low-fat or skim milk...................................................... 75 75 † † Milk that is not low fat or skim ...................................... 39 39 † † Yogurt ............................................................................ 26 26 † † Ice cream or frozen yogurt.............................................. 34 34 † †
Lunch sides
French fried potatoes ...................................................... 17 17 † † Green salad or fruit......................................................... 40 40 † †
Snack foods
Candy ............................................................................. 15 5 6 11 Low-fat salty snacks ....................................................... 38 29 6 19 Salty snacks that are not low in fat ................................. 25 18 6 14 Low-fat cookies/baked goods......................................... 28 21 4 13 Cookies/baked goods not low in fat................................ 34 27 5 15
1This category includes schools that sold at least one of the listed foods in one or more of the indicated locations—cafeteria or lunchroom, vending machine, school store or snack bar. Vending machine foods may include foods available for sale at vending machines in the cafeteria or lunchroom. †Not applicable; the survey only asked whether these foods were available during mealtimes in the cafeteria or lunchroom. SOURCE: U.S. Department of Education, National Center for Education Statistics, Fast Response Survey System (FRSS), “Foods and Physical Activity in Public Elementary Schools: 2005,” FRSS 87, 2005.

31
Table 3a. Standard errors for the percent of public elementary schools indicating that various foods were available for sale at one or more locations in the school, and in the cafeteria or lunchroom, vending machine, and school store or snack bar, by type of food: 2005
Locations where food was available for sale
Type of food
One or more locations in the
schoolCafeteria or lunchroom
Vending machine
School store or snack bar
At least one of the listed foods ....................................... 0.6 1.0 1.3 1.6
Nondairy beverages
100% fruit or vegetable juice.......................................... 1.6 1.6 1.0 1.3 Sports drinks or fruit drinks that are not 100% juice ...... 1.4 1.2 1.2 1.0 Soft drinks ...................................................................... 1.0 0.5 0.8 0.7 Bottled water .................................................................. 1.6 1.5 1.2 1.3
Dairy products
Low-fat or skim milk...................................................... 1.5 1.5 † † Milk that is not low fat or skim ...................................... 1.5 1.5 † † Yogurt ............................................................................ 1.5 1.5 † † Ice cream or frozen yogurt.............................................. 1.4 1.4 † †
Lunch sides
French fried potatoes ...................................................... 1.1 1.1 † † Green salad or fruit......................................................... 1.7 1.7 † †
Snack foods
Candy ............................................................................. 1.2 0.7 0.7 0.9 Low-fat salty snacks ....................................................... 1.6 1.4 0.6 1.3 Salty snacks that are not low in fat ................................. 1.3 1.1 0.7 0.9 Low-fat cookies/baked goods ......................................... 1.5 1.2 0.7 1.0 Cookies/baked goods not low in fat................................ 1.5 1.4 0.6 1.1
†Not applicable; estimate of standard error is not derived because the survey only asked whether these foods were available during mealtimes in the cafeteria or lunchroom. SOURCE: U.S. Department of Education, National Center for Education Statistics, Fast Response Survey System (FRSS), “Foods and Physical Activity in Public Elementary Schools: 2005,” FRSS 87, 2005.

32
Table 4. Percent of public elementary schools indicating that various foods were available for sale at one or more locations in the school, by selected school characteristics: 2005
Type of food available at one or more locations in the school
Nondairy beverage Dairy products
School characteristic
At least one of
the listed foods
100% fruit or
vegetable juice
Sports/ fruit
drinks that are
not 100% juice
Soft drinks
Bottled water
Low-fat or skim
milk
Milk that is not
low fat or skim Yogurt
Ice cream or
frozenyogurt
All public elementary schools ............. 88 53 31 12 46 75 39 26 34
Enrollment size
Less than 300......................................... 83 46 32 24 40 66 39 19 22300 to 499.............................................. 90 54 29 8 45 75 41 31 36500 or more ........................................... 91 57 33 9 50 81 38 26 40
School locale
City........................................................ 85 53 23 7 41 70 32 24 28Urban fringe .......................................... 91 53 32 6 45 80 44 30 38Town ..................................................... 86 45 28 10 34 70 38 21 30Rural...................................................... 90 56 40 27 54 74 40 23 34
Region
Northeast ............................................... 87 58 30 5 52 81 61 41 50Southeast ............................................... 93 65 43 14 60 83 54 32 55Central ................................................... 87 42 24 17 33 70 34 16 15West ...................................................... 88 52 31 11 44 70 23 22 27
Percent minority enrollment
Less than 6 percent ................................ 90 53 33 18 44 79 49 29 336 to 20 percent ....................................... 89 53 33 10 50 78 45 27 3821 to 49 percent ..................................... 89 48 30 9 40 74 32 20 3050 percent or more................................. 86 54 26 11 44 69 31 23 30
Percent of students eligible for free or reduced-price lunch
Less than 35 percent .............................. 90 55 33 10 49 80 43 32 4035 to 49 percent ..................................... 86 51 32 13 38 72 40 25 3550 to 74 percent ..................................... 94 53 34 14 46 79 45 21 3375 percent or more................................. 84 52 26 13 44 65 29 21 25
Foods sold to generate funds
Yes ........................................................ 100 75 44 14 64 91 45 45 60No.......................................................... 80 37 22 12 33 63 34 13 16Don’t know............................................ 99 71 41 8 55 90 49 35 46
See notes at end of table.

33
Table 4. Percent of public elementary schools indicating that various foods were available for sale at one or more locations in the school, by selected school characteristics: 2005—Continued
Type of food available at one or more locations in the school
Lunch sides Snack foods
School characteristic French fried
potatoesGreen salad
or fruit CandyLow-fat
salty snacks
Salty snacks that are not
low in fat
Low-fat cookies/
baked goods
Cookies/baked goods
not low in fat
All public elementary schools ............. 17 40 15 38 25 28 34
Enrollment size
Less than 300......................................... 14 30 22 36 29 24 30300 to 499.............................................. 18 42 14 39 25 26 38500 or more ........................................... 18 45 12 40 23 31 33
School locale
City........................................................ 17 38 13 32 17 28 29Urban fringe .......................................... 17 46 11 42 25 29 39Town ..................................................... 17 29 12 35 25 18 23Rural...................................................... 16 37 25 41 34 29 36
Region
Northeast ............................................... 18 57 13 54 36 33 49Southeast ............................................... 29 52 18 45 31 38 42Central ................................................... 13 29 16 30 23 20 29West ...................................................... 12 32 14 34 18 25 25
Percent minority enrollment
Less than 6 percent ................................ 16 39 15 41 28 25 356 to 20 percent ....................................... 19 45 13 46 27 33 3821 to 49 percent ..................................... 15 33 15 33 20 26 3250 percent or more................................. 15 38 16 34 23 25 30
Percent of students eligible for free or reduced-price lunch
Less than 35 percent .............................. 17 44 11 47 28 32 3935 to 49 percent ..................................... 14 36 15 35 24 24 3750 to 74 percent ..................................... 19 41 21 35 26 26 3275 percent or more................................. 16 36 16 32 22 25 28
Foods sold to generate funds
Yes ........................................................ 27 63 19 59 39 44 55No.......................................................... 10 24 13 24 15 16 20Don’t know............................................ 20 54 12 50 33 37 44
SOURCE: U.S. Department of Education, National Center for Education Statistics, Fast Response Survey System (FRSS), “Foods and Physical Activity in Public Elementary Schools: 2005,” FRSS 87, 2005.

34
Table 4a. Standard errors for the percent of public elementary schools indicating that various foods were available for sale at one or more locations in the school, by selected school characteristics: 2005
Type of food available at one or more locations in the school
Nondairy beverage Dairy products
School characteristic
At least one of
the listed foods
100% fruit or
vegetable juice
Sports drinks or
fruit drinks
that are not 100%
juiceSoft
drinksBottled
water
Low-fat or skim
milk
Milk that is not
low fat or skim Yogurt
Ice cream or
frozen yogurt
All public elementary schools ............. 0.9 1.6 1.3 0.9 1.5 1.5 1.5 1.4 1.4
Enrollment size
Less than 300......................................... 1.9 2.6 2.1 1.9 2.5 2.3 2.5 2.1 2.3300 to 499.............................................. 1.8 2.8 2.9 1.5 2.9 2.7 2.1 2.7 2.6500 or more ........................................... 1.5 2.7 2.5 1.5 2.6 2.1 1.9 2.4 2.7
School locale
City........................................................ 2.2 2.9 2.8 1.7 2.6 2.8 2.8 2.6 2.6Urban fringe .......................................... 1.2 2.5 2.0 1.4 2.3 2.0 2.4 2.7 2.4Town ..................................................... 3.2 4.8 4.7 3.1 4.5 4.4 4.6 4.3 5.1Rural...................................................... 1.6 2.8 2.7 2.0 2.8 2.5 2.7 2.1 2.6
Region
Northeast ............................................... 2.6 3.7 3.5 1.9 3.4 2.8 3.8 3.5 3.7Southeast ............................................... 1.9 2.9 3.6 2.4 3.5 2.7 3.5 3.5 3.0Central ................................................... 2.1 3.2 2.7 1.9 3.1 3.1 2.7 2.3 1.7West ...................................................... 1.7 2.7 2.5 1.5 2.7 2.3 2.4 2.2 2.3
Percent minority enrollment
Less than 6 percent ................................ 2.0 3.2 2.9 2.1 3.0 3.1 3.8 3.3 3.36 to 20 percent ....................................... 1.7 2.7 2.7 2.1 3.6 2.5 2.9 2.9 2.721 to 49 percent ..................................... 1.7 3.5 2.8 1.9 3.6 2.3 2.9 2.6 2.450 percent or more................................. 1.9 2.4 2.1 1.7 2.7 2.7 2.8 2.6 2.6
Percent of students eligible for free or reduced-price lunch
Less than 35 percent .............................. 1.5 2.3 2.0 1.5 2.7 2.2 2.7 2.2 2.635 to 49 percent ..................................... 2.9 3.6 3.9 2.8 3.6 3.4 4.5 3.2 3.950 to 74 percent ..................................... 1.7 3.0 3.3 2.0 3.3 2.7 2.9 2.5 2.575 percent or more................................. 2.3 3.1 2.7 1.9 3.0 3.2 3.3 2.5 2.7
Foods sold to generate funds
Yes ........................................................ † 2.6 2.6 1.7 2.3 1.4 2.5 2.9 2.9No.......................................................... 1.6 1.9 1.6 1.4 2.2 2.3 1.9 1.3 1.3Don’t know............................................ 1.2 4.8 4.9 2.5 5.6 2.9 5.0 5.5 5.1
See notes at end of table.

35
Table 4a. Standard errors for the percent of public elementary schools indicating that various foods were available for sale at one or more locations in the school, by selected school characteristics: 2005—Continued
Type of food available at one or more locations in the school
Lunch sides Snack foods
School characteristic French fried
potatoesGreen salad
or fruit CandyLow-fat
salty snacks
Salty snacks that are not
low in fat
Low-fat cookies/
baked goods
Cookies/baked goods
not low in fat
All public elementary schools ............. 1.1 1.7 1.1 1.6 1.2 1.4 1.5
Enrollment size
Less than 300......................................... 1.8 2.1 2.1 2.8 2.8 2.6 2.4300 to 499.............................................. 2.3 3.1 2.0 2.2 2.3 2.5 3.0500 or more ........................................... 2.1 2.5 1.7 2.4 2.1 2.1 2.2
School locale
City........................................................ 1.9 3.4 2.0 2.8 2.3 2.6 3.2Urban fringe .......................................... 1.8 2.7 1.8 2.4 2.0 1.9 2.4Town ..................................................... 3.9 5.0 3.4 5.5 5.2 4.1 5.4Rural...................................................... 2.2 2.9 2.4 2.9 2.6 2.8 2.7
Region
Northeast ............................................... 2.7 3.4 2.7 3.1 3.4 3.0 4.0Southeast ............................................... 3.3 3.8 2.9 3.8 2.7 3.6 3.2Central ................................................... 1.9 2.4 1.9 2.6 2.4 2.3 2.9West ...................................................... 1.7 2.6 2.1 2.4 2.4 2.1 2.1
Percent minority enrollment
Less than 6 percent ................................ 2.5 3.5 2.1 3.2 2.9 2.5 3.26 to 20 percent ....................................... 2.5 3.4 2.5 2.6 2.9 2.6 2.721 to 49 percent ..................................... 1.9 2.9 2.8 3.6 2.6 3.1 3.550 percent or more................................. 1.8 2.8 2.1 2.5 2.0 2.7 2.8
Percent of students eligible for free or reduced-price lunch
Less than 35 percent .............................. 2.0 2.5 1.9 2.6 2.2 2.4 2.335 to 49 percent ..................................... 2.7 3.4 3.2 3.5 3.5 3.3 4.250 to 74 percent ..................................... 2.5 3.1 2.3 2.5 2.4 2.8 2.875 percent or more................................. 2.5 3.1 2.0 2.8 2.5 3.0 2.7
Foods sold to generate funds
Yes ........................................................ 2.3 2.7 2.2 2.9 2.7 2.7 3.0No.......................................................... 1.3 1.6 1.5 1.7 1.5 1.5 1.5Don’t know............................................ 4.3 5.2 3.5 5.6 4.5 5.5 4.8
†Not applicable. Estimate of standard error is not derived because it is based on a statistic estimated at 100 percent. SOURCE: U.S. Department of Education, National Center for Education Statistics, Fast Response Survey System (FRSS), “Foods and Physical Activity in Public Elementary Schools: 2005,” FRSS 87, 2005.

36
Table 5. Percent of public elementary schools indicating that various foods were available for sale in the school cafeteria or lunchroom, by selected school characteristics: 2005
Type of food available in cafeteria/lunchroom
Nondairy beverage Dairy products
School characteristic
At least one of
the listed foods
100% fruit or
vegetable juice
Sports/ fruit
drinks that are
not 100% juice
Soft drinks
Bottled water
Low-fat or skim
milk
Milk that is not
low fat or skim Yogurt
Ice cream or
frozen yogurt
All public elementary schools ............. 84 47 22 2 36 75 39 26 34
Enrollment size
Less than 300......................................... 78 38 18 5 25 66 39 19 22300 to 499.............................................. 85 48 21 1! 36 75 41 31 36500 or more ........................................... 88 53 26 2 43 81 38 26 40
School locale
City........................................................ 82 49 18 2 34 70 32 24 28Urban fringe .......................................... 87 50 25 1 38 80 44 30 38Town ..................................................... 82 37 20 # 27 70 38 21 30Rural...................................................... 83 46 23 5 37 74 40 23 34
Region
Northeast ............................................... 86 56 25 2! 47 81 61 41 50Southeast ............................................... 90 58 31 2! 50 83 54 32 55Central ................................................... 82 36 15 3 23 70 34 16 15West ...................................................... 81 46 20 2 32 70 23 22 27
Percent minority enrollment
Less than 6 percent ................................ 86 46 23 2 33 79 49 29 336 to 20 percent ....................................... 85 48 25 2 41 78 45 27 3821 to 49 percent ..................................... 84 42 21 2 30 74 32 20 3050 percent or more................................. 81 48 17 3 35 69 31 23 30
Percent of students eligible for free or reduced-price lunch
Less than 35 percent .............................. 86 51 25 1 41 80 43 32 4035 to 49 percent ..................................... 83 46 24 2! 32 72 40 25 3550 to 74 percent ..................................... 89 44 21 3 33 79 45 21 3375 percent or more................................. 78 46 16 3 33 65 29 21 25
Foods sold to generate funds
Yes ........................................................ 98 69 36 2 56 91 45 45 60No.......................................................... 73 32 12 2 21 63 34 13 16Don’t know............................................ 99 66 31 3! 49 90 49 35 46
See notes at end of table.
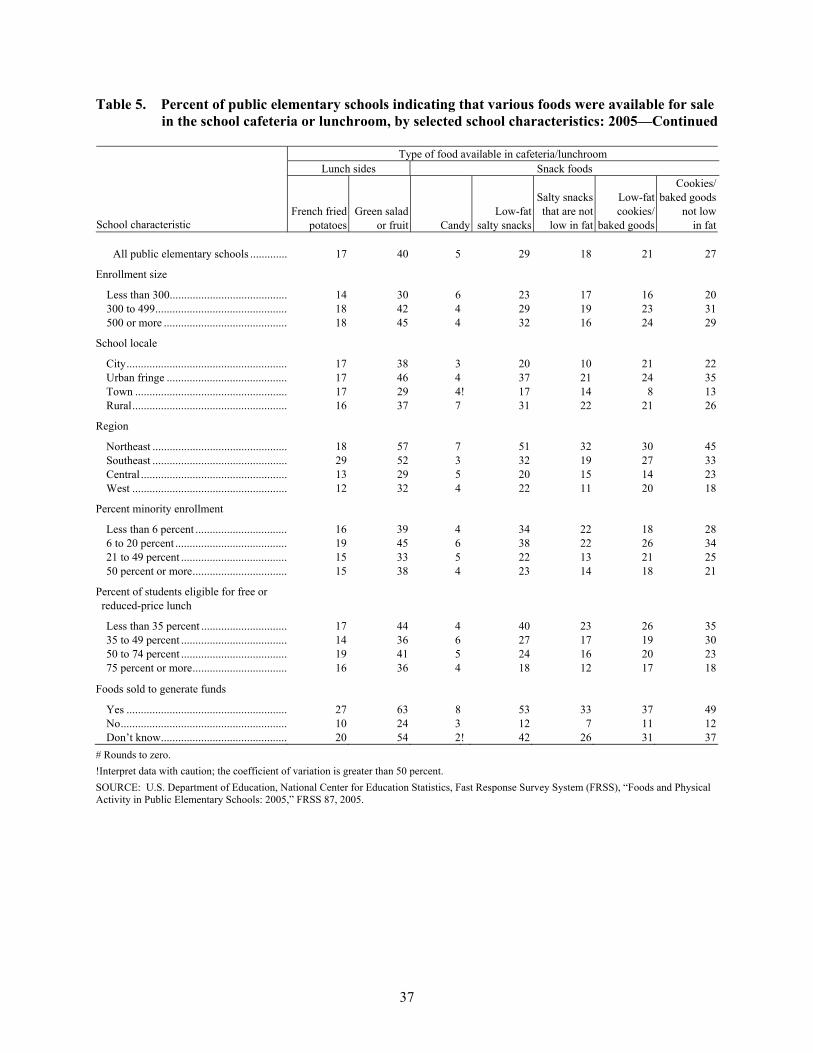
37
Table 5. Percent of public elementary schools indicating that various foods were available for sale in the school cafeteria or lunchroom, by selected school characteristics: 2005—Continued
Type of food available in cafeteria/lunchroom
Lunch sides Snack foods
School characteristic French fried
potatoesGreen salad
or fruit CandyLow-fat
salty snacks
Salty snacks that are not
low in fat
Low-fat cookies/
baked goods
Cookies/baked goods
not low in fat
All public elementary schools ............. 17 40 5 29 18 21 27
Enrollment size
Less than 300......................................... 14 30 6 23 17 16 20300 to 499.............................................. 18 42 4 29 19 23 31500 or more ........................................... 18 45 4 32 16 24 29
School locale
City........................................................ 17 38 3 20 10 21 22Urban fringe .......................................... 17 46 4 37 21 24 35Town ..................................................... 17 29 4! 17 14 8 13Rural...................................................... 16 37 7 31 22 21 26
Region
Northeast ............................................... 18 57 7 51 32 30 45Southeast ............................................... 29 52 3 32 19 27 33Central ................................................... 13 29 5 20 15 14 23West ...................................................... 12 32 4 22 11 20 18
Percent minority enrollment
Less than 6 percent ................................ 16 39 4 34 22 18 286 to 20 percent ....................................... 19 45 6 38 22 26 3421 to 49 percent ..................................... 15 33 5 22 13 21 2550 percent or more................................. 15 38 4 23 14 18 21
Percent of students eligible for free or reduced-price lunch
Less than 35 percent .............................. 17 44 4 40 23 26 3535 to 49 percent ..................................... 14 36 6 27 17 19 3050 to 74 percent ..................................... 19 41 5 24 16 20 2375 percent or more................................. 16 36 4 18 12 17 18
Foods sold to generate funds
Yes ........................................................ 27 63 8 53 33 37 49No.......................................................... 10 24 3 12 7 11 12Don’t know............................................ 20 54 2! 42 26 31 37
# Rounds to zero. !Interpret data with caution; the coefficient of variation is greater than 50 percent. SOURCE: U.S. Department of Education, National Center for Education Statistics, Fast Response Survey System (FRSS), “Foods and Physical Activity in Public Elementary Schools: 2005,” FRSS 87, 2005.

38
Table 5a. Standard errors for the percent of public elementary schools indicating that various foods were available for sale in the school cafeteria or lunchroom, by selected school characteristics: 2005
Type of food available in cafeteria/lunchroom
Nondairy beverage Dairy products
School characteristic
At least one of
the listed foods
100% fruit or
vegetable juice
Sports drinks or
fruit drinks
that are not 100%
juiceSoft
drinksBottled
water
Low-fat or skim
milk
Milk that is not
low fat or skim Yogurt
Ice cream or
frozen yogurt
All public elementary schools ............. 1.1 1.6 1.1 0.5 1.5 1.5 1.5 1.4 1.4
Enrollment size
Less than 300......................................... 2.0 2.7 1.9 1.0 2.0 2.3 2.5 2.1 2.3300 to 499.............................................. 2.0 2.6 2.3 0.6 2.7 2.7 2.1 2.7 2.6500 or more ........................................... 1.5 2.5 2.1 0.7 2.6 2.1 1.9 2.4 2.7
School locale
City........................................................ 2.3 2.9 2.5 0.8 2.7 2.8 2.8 2.6 2.6Urban fringe .......................................... 1.4 2.5 1.8 0.5 2.2 2.0 2.4 2.7 2.4Town ..................................................... 3.8 5.1 4.2 † 4.3 4.4 4.6 4.3 5.1Rural...................................................... 2.0 3.0 2.2 1.2 2.5 2.5 2.7 2.1 2.6
Region
Northeast ............................................... 2.6 3.9 3.7 0.9 3.6 2.8 3.8 3.5 3.7Southeast ............................................... 2.1 3.3 2.9 1.5 4.0 2.7 3.5 3.5 3.0Central ................................................... 2.3 3.1 2.1 0.9 2.3 3.1 2.7 2.3 1.7West ...................................................... 2.1 2.7 2.2 0.7 2.4 2.3 2.4 2.2 2.3
Percent minority enrollment
Less than 6 percent ................................ 2.5 3.5 2.9 0.9 3.1 3.1 3.8 3.3 3.36 to 20 percent ....................................... 2.0 2.8 2.2 0.8 3.0 2.5 2.9 2.9 2.721 to 49 percent ..................................... 1.9 3.3 2.5 1.1 3.0 2.3 2.9 2.6 2.450 percent or more................................. 2.0 2.3 1.8 0.9 2.8 2.7 2.8 2.6 2.6
Percent of students eligible for free or reduced-price lunch
Less than 35 percent .............................. 1.9 2.3 1.8 0.6 2.6 2.2 2.7 2.2 2.635 to 49 percent ..................................... 3.3 4.0 3.4 0.9 3.1 3.4 4.5 3.2 3.950 to 74 percent ..................................... 2.1 3.0 2.5 1.3 3.4 2.7 2.9 2.5 2.575 percent or more................................. 2.6 3.2 2.2 0.9 2.8 3.2 3.3 2.5 2.7
Foods sold to generate funds
Yes ........................................................ 0.7 2.8 2.9 0.7 2.5 1.4 2.5 2.9 2.9No.......................................................... 1.8 1.9 1.0 0.6 1.8 2.3 1.9 1.3 1.3Don’t know............................................ 1.2 4.8 4.9 1.6 5.6 2.9 5.0 5.5 5.1
See notes at end of table.

39
Table 5a. Standard errors for the percent of public elementary schools indicating that various foods were available for sale in the school cafeteria or lunchroom, by selected school characteristics: 2005—Continued
Type of food available in cafeteria/lunch room
Lunch sides Snack foods
School characteristic French fried
potatoesGreen salad
or fruit CandyLow-fat
salty snacks
Salty snacks that are not
low in fat
Low-fat cookies/
baked goods
Cookies/baked goods
not low in fat
All public elementary schools ............. 1.1 1.7 0.7 1.3 1.0 1.2 1.3
Enrollment size
Less than 300......................................... 1.8 2.1 1.5 2.4 2.4 1.8 2.1300 to 499.............................................. 2.3 3.1 1.3 1.9 2.0 2.1 2.7500 or more ........................................... 2.1 2.5 0.9 2.2 1.7 1.8 2.1
School locale
City........................................................ 1.9 3.4 1.0 2.1 1.8 2.3 2.8Urban fringe .......................................... 1.8 2.7 1.0 2.3 1.9 1.9 2.4Town ..................................................... 3.9 5.0 2.1 4.7 4.1 3.3 4.2Rural...................................................... 2.2 2.9 1.6 2.6 2.6 2.4 2.7
Region
Northeast ............................................... 2.7 3.4 2.1 3.1 3.3 3.0 4.3Southeast ............................................... 3.3 3.8 1.2 3.3 2.2 3.0 2.6Central ................................................... 1.9 2.4 1.2 2.3 2.1 1.8 2.4West ...................................................... 1.7 2.6 1.1 1.9 1.9 1.8 1.8
Percent minority enrollment
Less than 6 percent ................................ 2.5 3.5 1.4 3.2 2.7 2.1 2.46 to 20 percent ....................................... 2.5 3.4 1.8 2.4 2.4 2.8 2.621 to 49 percent ..................................... 1.9 2.9 1.5 2.8 2.0 2.5 2.750 percent or more................................. 1.8 2.8 0.9 2.1 1.7 2.2 2.3
Percent of students eligible for free or reduced-price lunch
Less than 35 percent .............................. 2.0 2.5 1.1 2.5 1.9 2.0 2.035 to 49 percent ..................................... 2.7 3.4 2.0 3.3 2.8 3.2 4.150 to 74 percent ..................................... 2.5 3.1 1.5 2.5 2.2 2.5 2.775 percent or more................................. 2.5 3.1 1.1 2.1 1.8 2.5 2.3
Foods sold to generate funds
Yes ........................................................ 2.3 2.7 1.9 3.0 2.6 2.3 2.7No.......................................................... 1.3 1.6 0.7 1.2 0.9 1.2 1.2Don’t know............................................ 4.3 5.2 1.3 5.9 4.4 5.4 4.8
†Not applicable; estimate of standard error is not derived because it is based on an estimate of 0 percent. SOURCE: U.S. Department of Education, National Center for Education Statistics, Fast Response Survey System (FRSS), “Foods and Physical Activity in Public Elementary Schools: 2005,” FRSS 87, 2005.
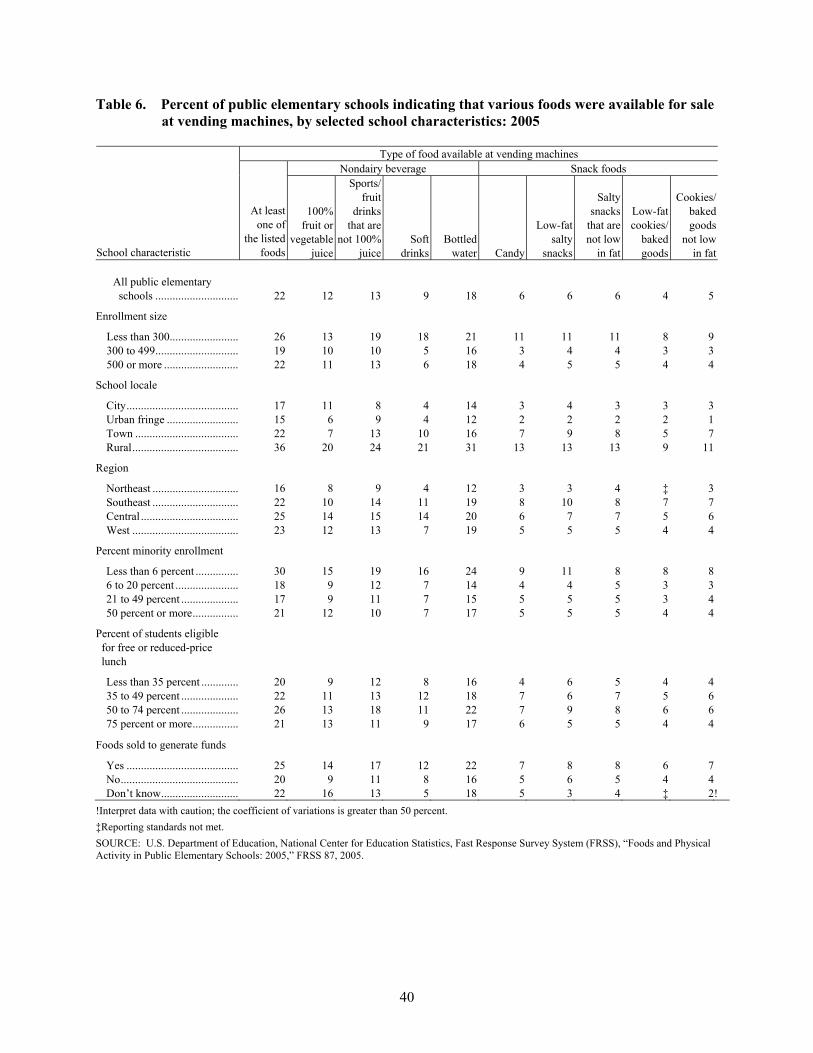
40
Table 6. Percent of public elementary schools indicating that various foods were available for sale at vending machines, by selected school characteristics: 2005
Type of food available at vending machines
Nondairy beverage Snack foods
School characteristic
At least one of
the listed foods
100% fruit or
vegetable juice
Sports/ fruit
drinks that are
not 100% juice
Soft drinks
Bottled water Candy
Low-fat salty
snacks
Salty snacks
that are not low
in fat
Low-fat cookies/
baked goods
Cookies/baked goods
not lowin fat
All public elementary schools .............................. 22 12 13 9 18 6 6 6 4 5
Enrollment size
Less than 300......................... 26 13 19 18 21 11 11 11 8 9 300 to 499.............................. 19 10 10 5 16 3 4 4 3 3 500 or more ........................... 22 11 13 6 18 4 5 5 4 4
School locale
City........................................ 17 11 8 4 14 3 4 3 3 3 Urban fringe .......................... 15 6 9 4 12 2 2 2 2 1 Town ..................................... 22 7 13 10 16 7 9 8 5 7 Rural...................................... 36 20 24 21 31 13 13 13 9 11
Region
Northeast ............................... 16 8 9 4 12 3 3 4 ‡ 3 Southeast ............................... 22 10 14 11 19 8 10 8 7 7 Central ................................... 25 14 15 14 20 6 7 7 5 6 West ...................................... 23 12 13 7 19 5 5 5 4 4
Percent minority enrollment
Less than 6 percent ................ 30 15 19 16 24 9 11 8 8 8 6 to 20 percent ....................... 18 9 12 7 14 4 4 5 3 3 21 to 49 percent ..................... 17 9 11 7 15 5 5 5 3 4 50 percent or more................. 21 12 10 7 17 5 5 5 4 4
Percent of students eligible for free or reduced-price lunch
Less than 35 percent .............. 20 9 12 8 16 4 6 5 4 4 35 to 49 percent ..................... 22 11 13 12 18 7 6 7 5 6 50 to 74 percent ..................... 26 13 18 11 22 7 9 8 6 6 75 percent or more................. 21 13 11 9 17 6 5 5 4 4
Foods sold to generate funds
Yes ........................................ 25 14 17 12 22 7 8 8 6 7 No.......................................... 20 9 11 8 16 5 6 5 4 4 Don’t know............................ 22 16 13 5 18 5 3 4 ‡ 2!
!Interpret data with caution; the coefficient of variations is greater than 50 percent. ‡Reporting standards not met. SOURCE: U.S. Department of Education, National Center for Education Statistics, Fast Response Survey System (FRSS), “Foods and Physical Activity in Public Elementary Schools: 2005,” FRSS 87, 2005.

41
Table 6a. Standard errors for the percent of public elementary schools indicating that various foods were available for sale at vending machines, by selected school characteristics: 2005
Type of food available at vending machines
Nondairy beverage Snack foods
School characteristic
At least one of
the listed foods
100% fruit or
vegetable juice
Sports/fruit
drinks not 100%
juiceSoft
drinksBottled
water Candy
Low-fat salty
snacks
Salty snacks
that are not low
in fat
Low-fat cookies/
baked goods
Cookies/baked goods
not low in fat
All public elementary schools .............................. 1.3 1.0 1.2 0.8 1.2 0.7 0.6 0.7 0.7 0.6
Enrollment size
Less than 300......................... 2.3 1.8 2.2 2.0 2.2 1.8 1.8 1.8 1.5 1.5300 to 499.............................. 2.2 1.3 1.8 1.3 2.0 0.8 1.0 1.2 1.0 0.9500 or more ........................... 2.3 1.7 2.1 1.3 2.0 1.0 1.1 1.2 1.1 1.2
School locale
City........................................ 2.1 1.9 1.7 1.2 1.9 1.0 1.1 1.1 1.1 1.0Urban fringe .......................... 1.4 1.1 1.4 1.0 1.4 0.6 0.8 0.8 0.6 0.6Town ..................................... 4.7 2.8 3.6 3.1 3.8 2.8 3.2 2.9 2.3 2.8Rural...................................... 3.0 2.3 2.7 2.1 3.0 2.0 2.0 2.1 1.9 1.8
Region
Northeast ............................... 2.7 2.1 2.3 1.3 2.5 1.3 1.3 1.3 † 1.2Southeast ............................... 2.4 1.8 2.6 2.0 2.1 1.8 2.0 1.8 1.8 1.8Central ................................... 2.8 2.1 2.2 2.0 2.4 1.1 1.5 1.5 1.3 1.4West ...................................... 2.3 1.6 1.9 1.3 1.9 1.1 1.0 1.5 0.9 0.9
Percent minority enrollment
Less than 6 percent ................ 2.7 2.2 2.5 2.1 2.6 1.7 1.9 1.7 1.6 1.66 to 20 percent ....................... 3.0 1.9 2.2 1.8 2.5 1.4 1.4 2.0 1.1 1.321 to 49 percent ..................... 2.3 2.0 2.1 1.6 2.4 1.2 1.2 1.3 1.2 1.350 percent or more................. 1.9 1.6 1.7 1.2 1.7 1.2 1.0 1.1 0.9 1.1
Percent of students eligible for free or reduced-price lunch
Less than 35 percent .............. 2.2 1.8 2.0 1.3 2.2 1.0 1.3 1.2 1.1 0.935 to 49 percent ..................... 3.6 2.2 2.7 2.4 3.4 2.1 1.8 2.1 1.8 2.050 to 74 percent ..................... 2.9 2.1 2.8 2.0 2.8 1.8 1.8 1.8 1.5 1.675 percent or more................. 2.1 1.9 1.7 1.5 1.8 1.5 1.2 1.2 1.1 1.2
Foods sold to generate funds
Yes ........................................ 2.1 1.9 1.9 1.6 2.0 1.3 1.3 1.3 1.2 1.4No.......................................... 1.7 1.2 1.4 1.2 1.6 0.8 0.9 1.0 0.7 0.7Don’t know............................ 4.9 4.5 3.8 2.1 3.9 2.0 1.5 1.9 ‡ 1.4
†Not applicable. SOURCE: U.S. Department of Education, National Center for Education Statistics, Fast Response Survey System (FRSS), “Foods and Physical Activity in Public Elementary Schools: 2005,” FRSS 87, 2005.

42
Table 7. Percent of public elementary schools indicating that various foods were available for sale at school stores or snack bars, by selected school characteristics: 2005
Type of food available at school stores or snack bars
Nondairy beverage Snack foods
School characteristic
At least one of
the listed foods
100% fruit or
vegetable juice
Sports/ fruit
drinks that are
not 100% juice
Soft drinks
Bottled water Candy
Low-fat salty
snacks
Salty snacks
that are not low
in fat
Low-fat cookies/
baked goods
Cookies/baked goods
not low in fat
All public elementary schools .............................. 31 17 12 6 17 11 19 14 13 15
Enrollment size
Less than 300......................... 32 16 13 12 18 15 21 17 13 15300 to 499.............................. 34 20 12 5 17 11 22 15 13 19500 or more ........................... 28 16 11 3 16 7 16 10 13 12
School locale
City........................................ 31 15 9 4 15 10 18 10 13 14Urban fringe .......................... 32 17 13 3 18 8 20 14 13 18Town ..................................... 29 16 10 5 11 8 21 15 12 12Rural...................................... 32 21 16 12 20 16 19 17 13 15
31 15 9 4 15 10 18 10 13 14Region
Northeast ............................... 33 19 12 3! 21 9 26 20 16 23Southeast ............................... 36 23 16 6 21 12 20 16 16 18Central ................................... 27 15 9 6 12 10 16 12 9 13West ...................................... 31 15 12 7 18 11 18 10 12 12
Percent minority enrollment
Less than 6 percent ................ 26 15 10 7 15 8 17 12 11 146 to 20 percent ....................... 31 20 14 4 19 8 22 14 15 1621 to 49 percent ..................... 30 13 9 5 12 10 17 11 11 1650 percent or more................. 33 18 12 6 18 13 19 14 12 15
Percent of students eligible for free or reduced-price lunch
Less than 35 percent .............. 29 16 11 4 18 6 19 12 13 1535 to 49 percent ..................... 27 14 11 5 8 7 15 13 11 1850 to 74 percent ..................... 34 18 14 8 18 17 21 16 13 1575 percent or more................. 35 20 12 8 20 13 21 14 14 15
Foods sold to generate funds
Yes ........................................ 41 27 17 5 25 12 26 19 20 23No.......................................... 24 11 8 6 12 10 14 10 8 10Don’t know............................ 42 24 17 5 22 10 27 16 17 19
!Interpret data with caution; the coefficient of variations is greater than 50 percent. SOURCE: U.S. Department of Education, National Center for Education Statistics, Fast Response Survey System (FRSS), “Foods and Physical Activity in Public Elementary Schools: 2005,” FRSS 87, 2005.

43
Table 7a. Standard errors for the percent of public elementary schools indicating that various foods were available for sale at school stores or snack bars, by selected school characteristics: 2005
Type of food available at school stores or snack bars
Nondairy beverage Snack foods
School characteristic
At least one of
the listed foods
100% fruit or
vegetable juice
Sports/fruit
drinks not 100%
juiceSoft
drinksBottled
water Candy
Low-fat salty
snacks
Salty snacks
that are not low
in fat
Low-fat cookies/
baked goods
Cookies/baked goods
not low in fat
All public elementary schools .............................. 1.5 1.2 0.9 0.7 1.3 0.9 1.3 0.9 1.0 1.1
Enrollment size
Less than 300......................... 2.2 1.9 1.6 1.7 2.3 1.8 2.1 2.1 1.8 1.6300 to 499.............................. 2.5 2.0 2.0 1.1 2.2 1.7 2.3 2.0 2.0 2.4500 or more ........................... 2.3 1.8 1.8 0.9 1.9 1.2 2.0 1.4 1.7 1.6
School locale
City........................................ 3.0 2.3 1.6 1.4 2.1 1.9 2.6 1.7 2.0 2.1Urban fringe .......................... 2.5 2.2 1.7 1.0 2.4 1.3 1.9 1.6 1.8 1.9Town ..................................... 5.2 3.6 3.1 2.3 3.1 2.8 4.8 4.5 3.5 4.4Rural...................................... 2.6 2.3 1.9 1.9 2.3 2.1 2.4 2.2 2.0 2.1
Region
Northeast ............................... 3.3 2.9 2.2 1.7 3.0 2.3 3.1 2.5 2.8 3.2Southeast ............................... 3.0 2.9 2.3 1.6 2.4 2.3 2.6 1.9 2.4 2.5Central ................................... 2.7 2.3 1.7 1.6 2.1 1.7 2.3 1.9 1.5 2.2West ...................................... 3.0 2.1 2.0 1.4 2.6 1.9 2.5 1.7 1.7 1.7
Percent minority enrollment
Less than 6 percent ................ 2.6 2.5 1.8 1.7 2.5 1.7 2.4 2.0 2.2 2.26 to 20 percent ....................... 3.2 2.6 2.0 1.4 2.7 1.6 2.4 2.3 2.4 2.221 to 49 percent ..................... 3.3 2.3 2.1 1.6 2.3 2.0 3.0 2.0 2.0 2.550 percent or more................. 2.4 2.1 1.7 1.3 2.0 2.0 2.1 1.6 1.9 2.0
Percent of students eligible for free or reduced-price lunch
Less than 35 percent .............. 2.7 2.0 1.6 1.2 2.4 1.4 2.1 1.5 1.9 1.835 to 49 percent ..................... 4.2 2.8 2.3 1.6 2.1 2.0 3.1 3.1 2.6 3.750 to 74 percent ..................... 2.4 2.3 2.4 1.5 2.5 2.0 2.1 1.8 1.8 1.875 percent or more................. 2.9 2.5 2.0 1.6 2.5 1.8 2.8 1.8 2.1 2.3
Foods sold to generate funds
Yes ........................................ 2.7 2.7 2.1 1.4 2.5 1.4 2.2 2.0 2.3 1.9No.......................................... 1.8 1.2 1.1 1.0 1.4 1.2 1.6 1.3 1.1 1.3Don’t know............................ 5.7 4.0 3.3 2.2 4.7 3.5 4.8 3.4 4.4 4.5
SOURCE: U.S. Department of Education, National Center for Education Statistics, Fast Response Survey System (FRSS), “Foods and Physical Activity in Public Elementary Schools: 2005,” FRSS 87, 2005.
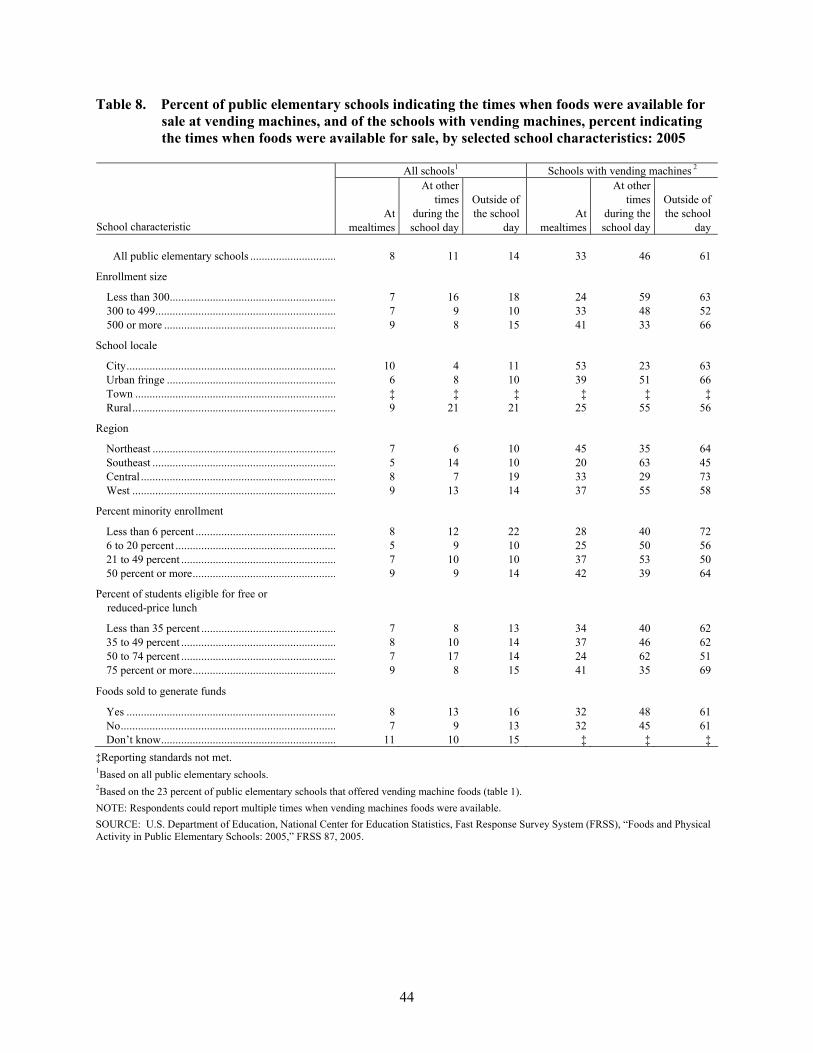
44
Table 8. Percent of public elementary schools indicating the times when foods were available for sale at vending machines, and of the schools with vending machines, percent indicating the times when foods were available for sale, by selected school characteristics: 2005
All schools1 Schools with vending machines 2
School characteristic At
mealtimes
At other times
during the school day
Outside of the school
day At
mealtimes
At other times
during the school day
Outside of the school
day
All public elementary schools .............................. 8 11 14 33 46 61 Enrollment size
Less than 300.......................................................... 7 16 18 24 59 63 300 to 499............................................................... 7 9 10 33 48 52 500 or more ............................................................ 9 8 15 41 33 66
School locale
City......................................................................... 10 4 11 53 23 63 Urban fringe ........................................................... 6 8 10 39 51 66 Town ...................................................................... ‡ ‡ ‡ ‡ ‡ ‡ Rural....................................................................... 9 21 21 25 55 56
Region
Northeast ................................................................ 7 6 10 45 35 64 Southeast ................................................................ 5 14 10 20 63 45 Central .................................................................... 8 7 19 33 29 73 West ....................................................................... 9 13 14 37 55 58
Percent minority enrollment
Less than 6 percent ................................................. 8 12 22 28 40 72 6 to 20 percent ........................................................ 5 9 10 25 50 56 21 to 49 percent ...................................................... 7 10 10 37 53 50 50 percent or more.................................................. 9 9 14 42 39 64
Percent of students eligible for free or reduced-price lunch
Less than 35 percent ............................................... 7 8 13 34 40 62 35 to 49 percent ...................................................... 8 10 14 37 46 62 50 to 74 percent ...................................................... 7 17 14 24 62 51 75 percent or more.................................................. 9 8 15 41 35 69
Foods sold to generate funds
Yes ......................................................................... 8 13 16 32 48 61 No........................................................................... 7 9 13 32 45 61 Don’t know............................................................. 11 10 15 ‡ ‡ ‡
‡Reporting standards not met. 1Based on all public elementary schools. 2Based on the 23 percent of public elementary schools that offered vending machine foods (table 1). NOTE: Respondents could report multiple times when vending machines foods were available. SOURCE: U.S. Department of Education, National Center for Education Statistics, Fast Response Survey System (FRSS), “Foods and Physical Activity in Public Elementary Schools: 2005,” FRSS 87, 2005.
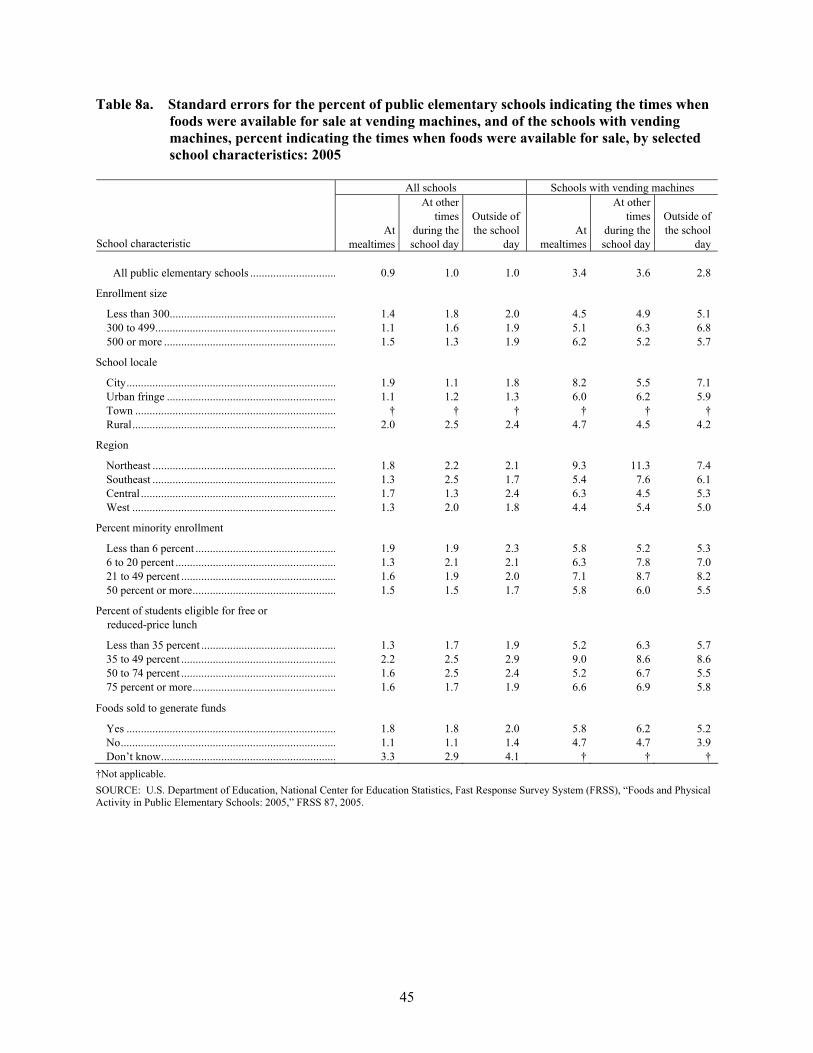
45
Table 8a. Standard errors for the percent of public elementary schools indicating the times when foods were available for sale at vending machines, and of the schools with vending machines, percent indicating the times when foods were available for sale, by selected school characteristics: 2005
All schools Schools with vending machines
School characteristic At
mealtimes
At other times
during the school day
Outside of the school
day At
mealtimes
At other times
during the school day
Outside of the school
day
All public elementary schools .............................. 0.9 1.0 1.0 3.4 3.6 2.8 Enrollment size
Less than 300.......................................................... 1.4 1.8 2.0 4.5 4.9 5.1 300 to 499............................................................... 1.1 1.6 1.9 5.1 6.3 6.8 500 or more ............................................................ 1.5 1.3 1.9 6.2 5.2 5.7
School locale
City......................................................................... 1.9 1.1 1.8 8.2 5.5 7.1 Urban fringe ........................................................... 1.1 1.2 1.3 6.0 6.2 5.9 Town ...................................................................... † † † † † † Rural....................................................................... 2.0 2.5 2.4 4.7 4.5 4.2
Region
Northeast ................................................................ 1.8 2.2 2.1 9.3 11.3 7.4 Southeast ................................................................ 1.3 2.5 1.7 5.4 7.6 6.1 Central .................................................................... 1.7 1.3 2.4 6.3 4.5 5.3 West ....................................................................... 1.3 2.0 1.8 4.4 5.4 5.0
Percent minority enrollment
Less than 6 percent ................................................. 1.9 1.9 2.3 5.8 5.2 5.3 6 to 20 percent ........................................................ 1.3 2.1 2.1 6.3 7.8 7.0 21 to 49 percent ...................................................... 1.6 1.9 2.0 7.1 8.7 8.2 50 percent or more.................................................. 1.5 1.5 1.7 5.8 6.0 5.5
Percent of students eligible for free or reduced-price lunch
Less than 35 percent ............................................... 1.3 1.7 1.9 5.2 6.3 5.7 35 to 49 percent ...................................................... 2.2 2.5 2.9 9.0 8.6 8.6 50 to 74 percent ...................................................... 1.6 2.5 2.4 5.2 6.7 5.5 75 percent or more.................................................. 1.6 1.7 1.9 6.6 6.9 5.8
Foods sold to generate funds
Yes ......................................................................... 1.8 1.8 2.0 5.8 6.2 5.2 No........................................................................... 1.1 1.1 1.4 4.7 4.7 3.9 Don’t know............................................................. 3.3 2.9 4.1 † † †
†Not applicable. SOURCE: U.S. Department of Education, National Center for Education Statistics, Fast Response Survey System (FRSS), “Foods and Physical Activity in Public Elementary Schools: 2005,” FRSS 87, 2005.
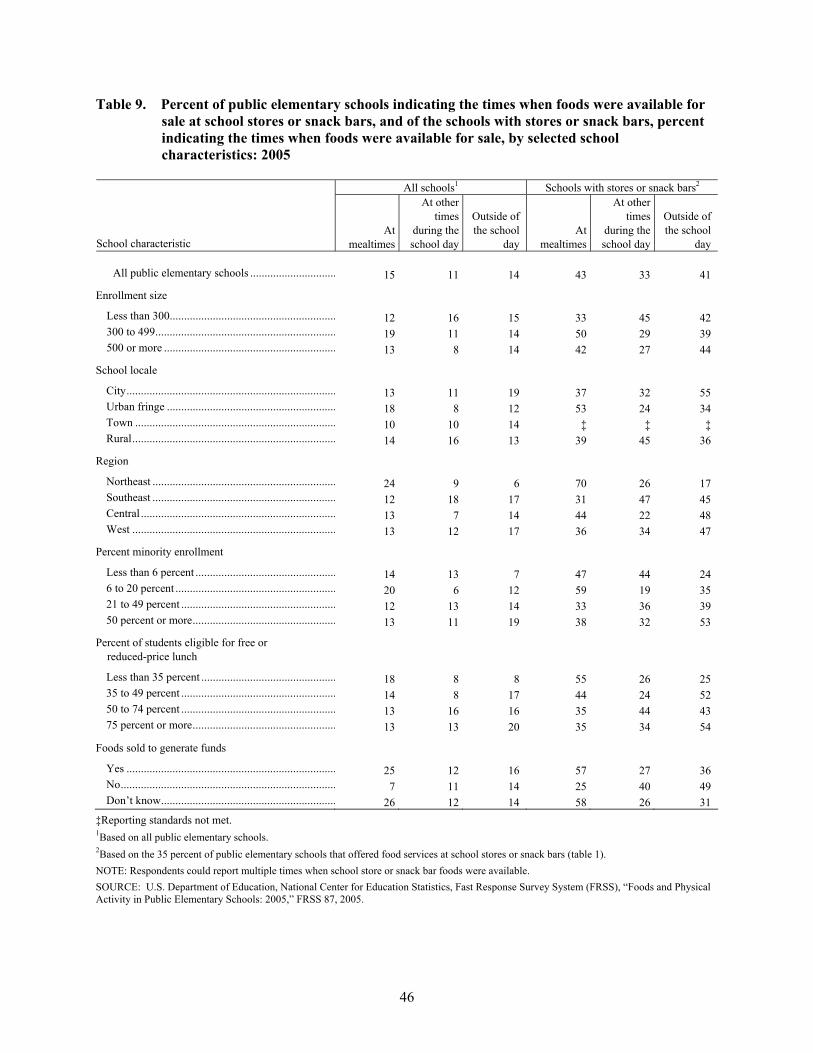
46
Table 9. Percent of public elementary schools indicating the times when foods were available for sale at school stores or snack bars, and of the schools with stores or snack bars, percent indicating the times when foods were available for sale, by selected school characteristics: 2005
All schools1 Schools with stores or snack bars2
School characteristic At
mealtimes
At other times
during the school day
Outside of the school
day At
mealtimes
At other times
during the school day
Outside of the school
day
All public elementary schools .............................. 15 11 14 43 33 41 Enrollment size
Less than 300.......................................................... 12 16 15 33 45 42 300 to 499............................................................... 19 11 14 50 29 39 500 or more ............................................................ 13 8 14 42 27 44
School locale
City......................................................................... 13 11 19 37 32 55 Urban fringe ........................................................... 18 8 12 53 24 34 Town ...................................................................... 10 10 14 ‡ ‡ ‡ Rural....................................................................... 14 16 13 39 45 36
Region
Northeast ................................................................ 24 9 6 70 26 17 Southeast ................................................................ 12 18 17 31 47 45 Central .................................................................... 13 7 14 44 22 48 West ....................................................................... 13 12 17 36 34 47
Percent minority enrollment
Less than 6 percent ................................................. 14 13 7 47 44 24 6 to 20 percent ........................................................ 20 6 12 59 19 35 21 to 49 percent ...................................................... 12 13 14 33 36 39 50 percent or more.................................................. 13 11 19 38 32 53
Percent of students eligible for free or reduced-price lunch
Less than 35 percent ............................................... 18 8 8 55 26 25 35 to 49 percent ...................................................... 14 8 17 44 24 52 50 to 74 percent ...................................................... 13 16 16 35 44 43 75 percent or more.................................................. 13 13 20 35 34 54
Foods sold to generate funds
Yes ......................................................................... 25 12 16 57 27 36 No........................................................................... 7 11 14 25 40 49 Don’t know............................................................. 26 12 14 58 26 31
‡Reporting standards not met. 1Based on all public elementary schools. 2Based on the 35 percent of public elementary schools that offered food services at school stores or snack bars (table 1). NOTE: Respondents could report multiple times when school store or snack bar foods were available. SOURCE: U.S. Department of Education, National Center for Education Statistics, Fast Response Survey System (FRSS), “Foods and Physical Activity in Public Elementary Schools: 2005,” FRSS 87, 2005.

47
Table 9a. Standard errors for the percent of public elementary schools indicating the times when foods were available for sale at school stores or snack bars, and of the schools with stores or snack bars, percent indicating the times when foods were available for sale, by selected school characteristics: 2005
All schools School with stores or snack bars
School characteristic At
mealtimes
At other times
during the school day
Outside of the school
day At
mealtimes
At other times
during the school day
Outside of the school
day
All public elementary schools .............................. 1.1 0.9 1.0 2.5 2.3 2.2 Enrollment size
Less than 300.......................................................... 2.2 1.9 1.9 5.1 4.9 5.0 300 to 499............................................................... 1.9 1.6 1.9 4.5 3.7 4.0 500 or more ............................................................ 1.9 1.4 1.6 4.8 4.2 4.8
School locale
City......................................................................... 2.1 1.9 2.6 5.0 5.2 5.1 Urban fringe ........................................................... 2.0 1.5 1.4 4.5 3.5 3.9 Town ...................................................................... 3.1 3.5 5.1 † † † Rural....................................................................... 2.2 2.3 1.7 5.3 5.3 4.3
Region
Northeast ................................................................ 3.0 2.0 1.7 6.4 4.9 4.5 Southeast ................................................................ 2.1 2.6 2.4 5.2 5.4 4.8 Central .................................................................... 1.9 1.6 1.8 4.8 4.5 4.2 West ....................................................................... 1.8 1.9 1.8 3.8 4.2 3.8
Percent minority enrollment
Less than 6 percent ................................................. 2.2 2.1 1.6 6.3 5.5 5.1 6 to 20 percent ........................................................ 2.9 1.6 2.2 5.5 4.3 5.2 21 to 49 percent ...................................................... 2.2 2.2 2.2 5.6 5.4 6.0 50 percent or more.................................................. 2.0 1.5 2.2 4.8 4.0 5.0
Percent of students eligible for free or reduced-price lunch
Less than 35 percent ............................................... 2.0 1.4 1.6 5.0 3.6 4.0 35 to 49 percent ...................................................... 3.1 2.3 3.0 8.3 6.3 7.4 50 to 74 percent ...................................................... 2.1 2.1 1.9 4.9 5.2 4.6 75 percent or more.................................................. 2.0 1.8 2.8 4.9 5.0 5.1
Foods sold to generate funds
Yes ......................................................................... 2.2 1.6 2.1 3.7 3.4 4.2 No........................................................................... 1.1 1.3 1.4 3.2 3.8 3.5 Don’t know............................................................. 4.9 3.4 4.0 7.8 7.5 7.7
†Not applicable. SOURCE: U.S. Department of Education, National Center for Education Statistics, Fast Response Survey System (FRSS), “Foods and Physical Activity in Public Elementary Schools: 2005,” FRSS 87, 2005.

48
Table 10. Percentage distribution of public elementary schools reporting the entities that operated food services at the school, by selected school characteristics: 2005
School characteristic School or
districtPrivate/other
entity
All public elementary schools ............................................... 81 19 Enrollment size
Less than 300........................................................................... 83 17 300 to 499................................................................................ 79 21 500 or more ............................................................................. 83 17
School locale
City.......................................................................................... 80 20 Urban fringe ............................................................................ 77 23 Town ....................................................................................... 81 19 Rural........................................................................................ 90 10
Region
Northeast ................................................................................. 66 34 Southeast ................................................................................. 94 6 Central ..................................................................................... 76 24 West ........................................................................................ 85 15
Percent minority enrollment
Less than 6 percent .................................................................. 87 13 6 to 20 percent ......................................................................... 75 25 21 to 49 percent ....................................................................... 80 20 50 percent or more................................................................... 82 18
Percent of students eligible for free or reduced-price lunch
Less than 35 percent ................................................................ 77 23 35 to 49 percent ....................................................................... 86 14 50 to 74 percent ....................................................................... 86 14 75 percent or more................................................................... 80 20
NOTE: Data in this table are based on the 99 percent of public elementary schools that offered any food services in the school (table 1). Food services at the school include foods and beverages available to students in the school cafeteria or lunchroom (e.g., school meals, a la carte items, and vending machine foods) and foods and beverages sold at vending machines and school stores or snack bars. Detail may not sum to totals because of rounding. SOURCE: U.S. Department of Education, National Center for Education Statistics, Fast Response Survey System (FRSS), “Foods and Physical Activity in Public Elementary Schools: 2005,” FRSS 87, 2005.

49
Table 10a. Standard errors for the percentage distribution of public elementary schools reporting the entities that operated food services at the school, by selected school characteristics: 2005
School characteristic School or
districtPrivate/other
entity
All public elementary schools ............................................... 1.0 1.0 Enrollment size
Less than 300........................................................................... 2.2 2.2 300 to 499................................................................................ 2.3 2.3 500 or more ............................................................................. 1.7 1.7
School locale
City.......................................................................................... 2.3 2.3 Urban fringe ............................................................................ 2.2 2.2 Town ....................................................................................... 3.7 3.7 Rural........................................................................................ 1.9 1.9
Region
Northeast ................................................................................. 4.0 4.0 Southeast ................................................................................. 1.5 1.5 Central ..................................................................................... 2.4 2.4 West ........................................................................................ 1.8 1.8
Percent minority enrollment
Less than 6 percent .................................................................. 2.3 2.3 6 to 20 percent ......................................................................... 2.5 2.5 21 to 49 percent ....................................................................... 2.9 2.9 50 percent or more................................................................... 2.3 2.3
Percent of students eligible for free or reduced-price lunch
Less than 35 percent ................................................................ 2.2 2.2 35 to 49 percent ....................................................................... 2.5 2.5 50 to 74 percent ....................................................................... 1.9 1.9 75 percent or more................................................................... 2.4 2.4
SOURCE: U.S. Department of Education, National Center for Education Statistics, Fast Response Survey System (FRSS), “Foods and Physical Activity in Public Elementary Schools: 2005,” FRSS 87, 2005.
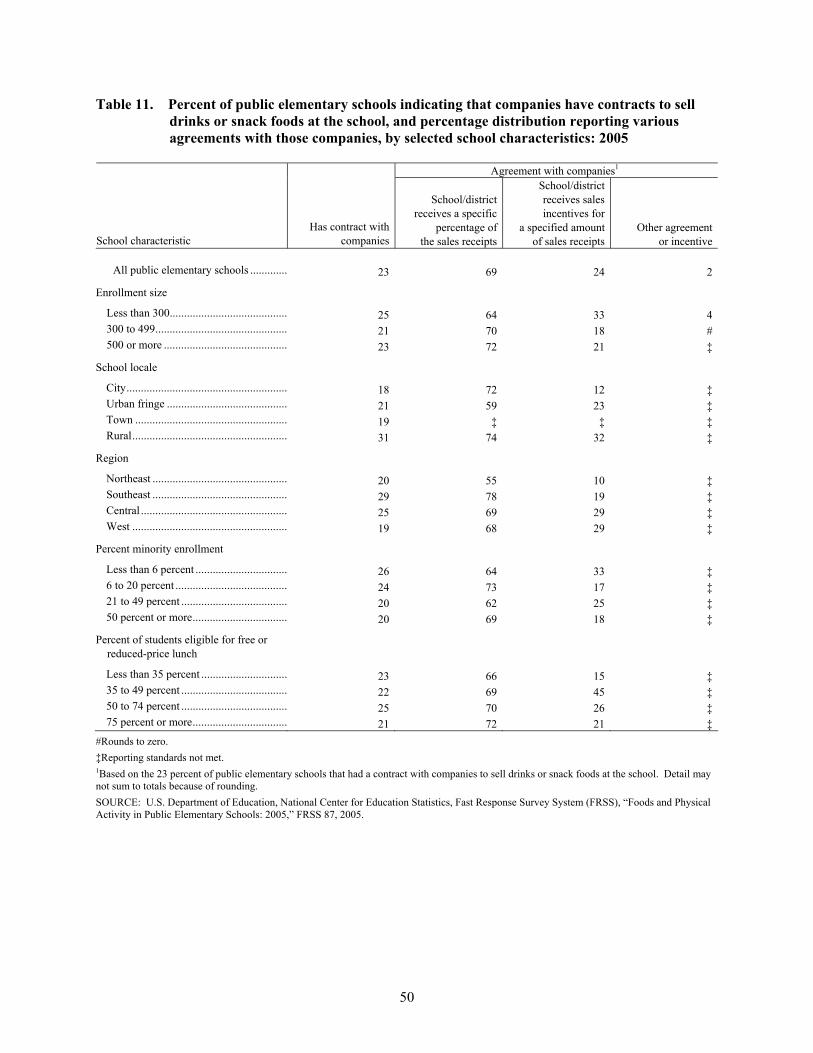
50
Table 11. Percent of public elementary schools indicating that companies have contracts to sell drinks or snack foods at the school, and percentage distribution reporting various agreements with those companies, by selected school characteristics: 2005
Agreement with companies1
School characteristic Has contract with
companies
School/district receives a specific
percentage of the sales receipts
School/district receives sales incentives for
a specified amount of sales receipts
Other agreement or incentive
All public elementary schools ............. 23 69 24 2
Enrollment size
Less than 300......................................... 25 64 33 4 300 to 499.............................................. 21 70 18 # 500 or more ........................................... 23 72 21 ‡
School locale
City........................................................ 18 72 12 ‡ Urban fringe .......................................... 21 59 23 ‡ Town ..................................................... 19 ‡ ‡ ‡ Rural...................................................... 31 74 32 ‡
Region
Northeast ............................................... 20 55 10 ‡ Southeast ............................................... 29 78 19 ‡ Central ................................................... 25 69 29 ‡ West ...................................................... 19 68 29 ‡
Percent minority enrollment
Less than 6 percent ................................ 26 64 33 ‡ 6 to 20 percent ....................................... 24 73 17 ‡ 21 to 49 percent ..................................... 20 62 25 ‡ 50 percent or more................................. 20 69 18 ‡
Percent of students eligible for free or reduced-price lunch
Less than 35 percent .............................. 23 66 15 ‡ 35 to 49 percent ..................................... 22 69 45 ‡ 50 to 74 percent ..................................... 25 70 26 ‡ 75 percent or more................................. 21 72 21 ‡
#Rounds to zero. ‡Reporting standards not met. 1Based on the 23 percent of public elementary schools that had a contract with companies to sell drinks or snack foods at the school. Detail may not sum to totals because of rounding. SOURCE: U.S. Department of Education, National Center for Education Statistics, Fast Response Survey System (FRSS), “Foods and Physical Activity in Public Elementary Schools: 2005,” FRSS 87, 2005.

51
Table 11a. Standard errors for the percent of public elementary schools indicating that companies have contracts to sell drinks or snack foods at the school, and percentage distribution reporting various agreements with those companies, by selected school characteristics: 2005
Agreement with companies
School characteristic Has contract with
companies
School/district receives a specific
percentage of the sales receipts
School/district receives sales incentives for
a specified amount of sales receipts
Other agreement or incentive
All public elementary schools ............. 1.2 2.9 2.7 0.9
Enrollment size
Less than 300......................................... 2.1 5.3 5.0 2.1 300 to 499.............................................. 2.3 5.8 4.6 † 500 or more ........................................... 2.2 5.0 4.4 †
School locale
City........................................................ 2.3 7.6 4.3 † Urban fringe .......................................... 2.0 5.9 4.4 † Town ..................................................... 4.5 † † † Rural...................................................... 2.2 4.3 4.5 †
Region
Northeast ............................................... 3.2 9.8 4.7 † Southeast ............................................... 2.7 5.0 4.5 † Central ................................................... 2.4 4.4 5.3 † West ...................................................... 2.0 6.7 6.3 †
Percent minority enrollment
Less than 6 percent ................................ 2.3 5.9 5.7 † 6 to 20 percent ....................................... 2.9 6.8 5.2 † 21 to 49 percent ..................................... 2.7 7.4 5.5 † 50 percent or more................................. 2.1 6.3 4.6 †
Percent of students eligible for free or reduced-price lunch
Less than 35 percent .............................. 1.9 5.7 3.8 † 35 to 49 percent ..................................... 3.5 7.4 8.5 † 50 to 74 percent ..................................... 2.9 5.5 5.1 † 75 percent or more................................. 2.3 6.5 5.2 †
†Not applicable. SOURCE: U.S. Department of Education, National Center for Education Statistics, Fast Response Survey System (FRSS), “Foods and Physical Activity in Public Elementary Schools: 2005,” FRSS 87, 2005.

52
Table 12. Percent of public elementary schools indicating that recess was scheduled at the school, and percentage distribution reporting the number of days per week, times per day, and minutes per day of scheduled recess, by elementary grade level: 2005
Recess schedule Grade 1 Grade 2 Grade 3 Grade 4 Grade 5 Grade 6
Any scheduled recess .......................... 93 93 92 91 91 87
Days per week
None...................................................... 7 7 8 9 9 13 1 to 4 days ............................................. 5 5 5 6 7 4 5 days .................................................... 88 88 87 85 83 83
Times per day
None...................................................... 7 7 8 9 9 13 Once ...................................................... 55 56 59 64 66 58 Twice..................................................... 28 27 25 22 21 24 Three or more times............................... 10 10 8 5 4 5
Minutes per day
None...................................................... 7 7 8 9 9 13 1 to 15 minutes ...................................... 14 14 15 17 18 17 16 to 20 minutes .................................... 18 18 20 22 23 21 21 to 30 minutes .................................... 33 34 33 33 32 28 More than 30 minutes............................ 27 26 25 20 19 21
NOTE: Respondents were asked to provide information for each grade that was considered elementary at the school, typically grades 1 through 5 or 6. Detail may not sum to totals because of rounding. SOURCE: U.S. Department of Education, National Center for Education Statistics, Fast Response Survey System (FRSS), “Foods and Physical Activity in Public Elementary Schools: 2005,” FRSS 87, 2005.

53
Table 12a. Standard errors for the percent of public elementary schools indicating that recess was scheduled at the school, and percentage distribution reporting the number of days per week, times per day, and minutes per day of scheduled recess, by elementary grade level: 2005
Recess schedule Grade 1 Grade 2 Grade 3 Grade 4 Grade 5 Grade 6
Any scheduled recess .......................... 0.8 0.8 0.8 0.9 1.0 1.9
Days per week
None...................................................... 0.8 0.8 0.8 0.9 1.0 1.9 1 to 4 days ............................................. 0.7 0.8 0.8 0.9 0.9 1.0 5 days .................................................... 1.0 1.0 1.0 1.1 1.2 2.1
Times per day
None...................................................... 0.8 0.8 0.8 0.9 1.0 1.9 Once ...................................................... 1.6 1.6 1.6 1.5 1.6 2.6 Twice..................................................... 1.4 1.3 1.4 1.3 1.3 2.2 Three or more times............................... 1.0 1.0 1.0 0.7 0.7 1.2
Minutes per day
None...................................................... 0.8 0.8 0.8 0.9 1.0 1.9 1 to 15 minutes ...................................... 0.9 0.9 1.0 1.0 1.1 2.1 16 to 20 minutes .................................... 1.1 1.1 1.1 1.3 1.5 2.3 21 to 30 minutes .................................... 1.7 1.7 1.6 1.5 1.6 2.5 More than 30 minutes............................ 1.3 1.3 1.3 1.3 1.3 2.3
SOURCE: U.S. Department of Education, National Center for Education Statistics, Fast Response Survey System (FRSS), “Foods and Physical Activity in Public Elementary Schools: 2005,” FRSS 87, 2005.
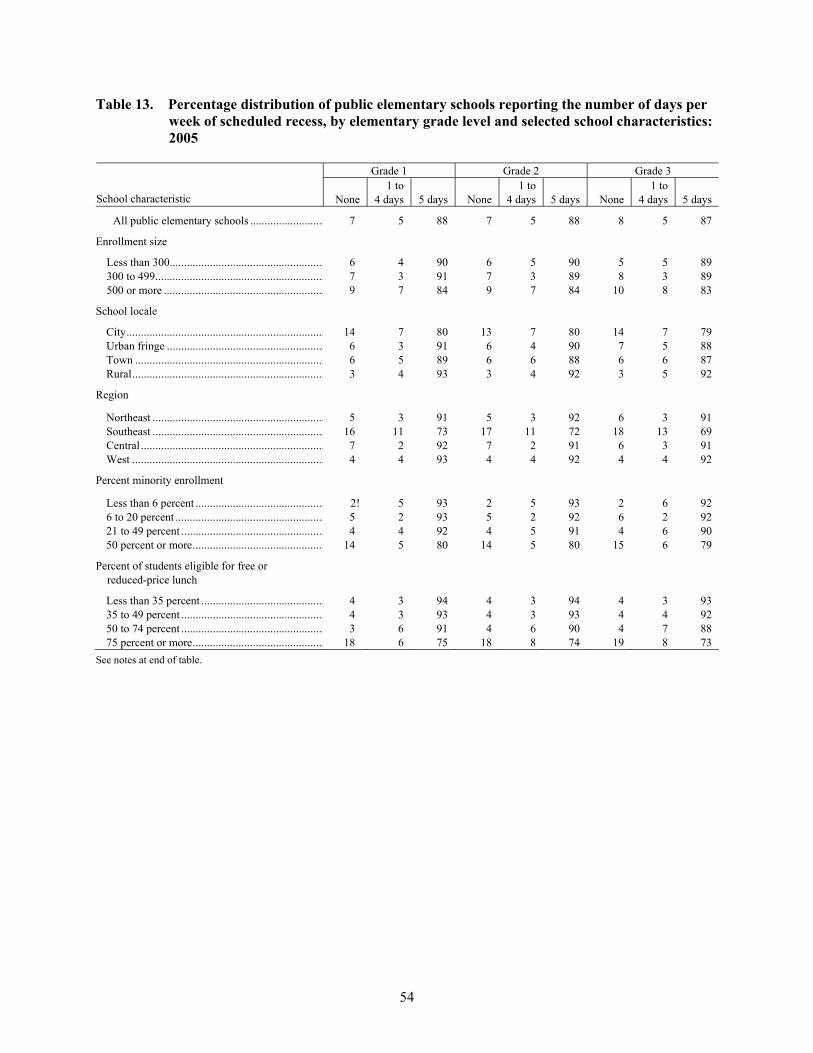
54
Table 13. Percentage distribution of public elementary schools reporting the number of days per week of scheduled recess, by elementary grade level and selected school characteristics: 2005
Grade 1 Grade 2 Grade 3
School characteristic None 1 to
4 days 5 days None 1 to
4 days 5 days None 1 to
4 days 5 days
All public elementary schools .......................... 7 5 88 7 5 88 8 5 87 Enrollment size
Less than 300...................................................... 6 4 90 6 5 90 5 5 89 300 to 499........................................................... 7 3 91 7 3 89 8 3 89 500 or more ........................................................ 9 7 84 9 7 84 10 8 83
School locale
City..................................................................... 14 7 80 13 7 80 14 7 79 Urban fringe ....................................................... 6 3 91 6 4 90 7 5 88 Town .................................................................. 6 5 89 6 6 88 6 6 87 Rural................................................................... 3 4 93 3 4 92 3 5 92
Region
Northeast ............................................................ 5 3 91 5 3 92 6 3 91 Southeast ............................................................ 16 11 73 17 11 72 18 13 69 Central ................................................................ 7 2 92 7 2 91 6 3 91 West ................................................................... 4 4 93 4 4 92 4 4 92
Percent minority enrollment
Less than 6 percent ............................................. 2! 5 93 2 5 93 2 6 92 6 to 20 percent .................................................... 5 2 93 5 2 92 6 2 92 21 to 49 percent .................................................. 4 4 92 4 5 91 4 6 90 50 percent or more.............................................. 14 5 80 14 5 80 15 6 79
Percent of students eligible for free or reduced-price lunch
Less than 35 percent ........................................... 4 3 94 4 3 94 4 3 93 35 to 49 percent .................................................. 4 3 93 4 3 93 4 4 92 50 to 74 percent .................................................. 3 6 91 4 6 90 4 7 88 75 percent or more.............................................. 18 6 75 18 8 74 19 8 73
See notes at end of table.

55
Table 13. Percentage distribution of public elementary schools reporting the number of days per week of scheduled recess, by elementary grade level and selected school characteristics: 2005—Continued
Grade 4 Grade 5 Grade 6
School characteristic None 1 to
4 days 5 days None 1 to
4 days 5 days None 1 to
4 days 5 days
All public elementary schools .......................... 9 6 85 9 7 83 13 4 83 Enrollment size
Less than 300...................................................... 6 7 87 8 8 85 12 7 82 300 to 499........................................................... 9 4 87 9 5 86 9 ‡ 88 500 or more ........................................................ 10 8 82 11 9 81 18 3 80
School locale
City..................................................................... 15 7 79 15 7 78 24 # 76 Urban fringe ....................................................... 7 6 87 7 6 86 7 5 87 Town .................................................................. 5 10 85 7 12 81 ‡ ‡ 81 Rural................................................................... 5 6 90 6 7 86 11 5 84
Region
Northeast ............................................................ 6 3 91 7 4 89 12 ‡ 86 Southeast ............................................................ 18 16 65 20 16 64 ‡ ‡ 62 Central ................................................................ 7 3 90 8 4 88 15 4 82 West ................................................................... 5 5 91 6 6 89 9 4 87
Percent minority enrollment
Less than 6 percent ............................................. 2 6 92 4 8 89 8 5 88 6 to 20 percent .................................................... 7 3 89 7 5 88 8 5 88 21 to 49 percent .................................................. 5 6 89 5 7 88 6 ‡ 93 50 percent or more.............................................. 16 7 77 17 8 76 24 4 72
Percent of students eligible for free or reduced-price lunch
Less than 35 percent ........................................... 4 3 93 5 4 91 5 3 91 35 to 49 percent .................................................. 4 5 90 5 6 90 7 ‡ 91 50 to 74 percent .................................................. 5 10 85 6 11 82 10 4 86 75 percent or more.............................................. 20 8 72 21 9 71 28 6 66
#Rounds to zero. !Interpret data with caution; the coefficient of variation is greater than 50 percent. ‡Reporting standards not met. NOTE: Respondents were asked to provide information for each grade that was considered elementary at the school, typically grades 1 through 5 or 6. Detail may not sum to totals because of rounding. SOURCE: U.S. Department of Education, National Center for Education Statistics, Fast Response Survey System (FRSS), “Foods and Physical Activity in Public Elementary Schools: 2005,” FRSS 87, 2005.

56
Table 13a. Standard errors for the percentage distribution of public elementary schools reporting the number of days per week of scheduled recess, by elementary grade level and selected school characteristics: 2005
Grade 1 Grade 2 Grade 3
School characteristic None 1 to
4 days 5 days None 1 to
4 days 5 days None 1 to
4 days 5 days
All public elementary schools .......................... 0.8 0.7 1.0 0.8 0.8 1.0 0.8 0.8 1.0 Enrollment size
Less than 300...................................................... 1.2 1.2 1.6 1.2 1.3 1.7 1.2 1.4 1.7 300 to 499........................................................... 1.6 0.8 1.6 1.6 0.9 1.6 1.7 0.9 1.7 500 or more ........................................................ 1.3 1.3 1.9 1.3 1.3 1.9 1.3 1.4 2.0
School locale
City..................................................................... 2.0 1.7 2.5 2.0 1.6 2.6 2.0 1.7 2.6 Urban fringe ....................................................... 1.2 1.0 1.6 1.3 1.0 1.5 1.3 1.2 1.7 Town .................................................................. 2.8 2.3 3.5 2.8 2.6 3.6 2.8 2.7 3.6 Rural................................................................... 1.0 1.2 1.4 1.1 1.2 1.5 1.2 1.3 1.6
Region
Northeast ............................................................ 1.9 1.2 2.3 1.8 1.2 2.3 2.0 1.2 2.5 Southeast ............................................................ 2.7 2.3 3.4 2.7 2.3 3.3 2.6 2.6 3.3 Central ................................................................ 1.5 0.8 1.7 1.5 0.9 1.7 1.4 0.9 1.6 West ................................................................... 0.9 1.2 1.3 0.9 1.6 1.6 1.0 1.6 1.6
Percent minority enrollment
Less than 6 percent ............................................. 1.1 1.6 1.7 1.1 1.5 1.7 1.1 1.6 1.7 6 to 20 percent .................................................... 1.5 0.9 1.8 1.6 0.9 1.9 1.7 1.0 2.0 21 to 49 percent .................................................. 1.1 1.4 2.1 1.1 1.6 2.3 1.2 1.7 2.3 50 percent or more.............................................. 1.8 1.2 1.9 1.8 1.2 1.9 1.7 1.4 1.9
Percent of students eligible for free or reduced-price lunch
Less than 35 percent ........................................... 1.0 0.7 1.2 1.0 0.7 1.2 1.1 0.8 1.3 35 to 49 percent .................................................. 1.7 1.3 2.2 1.7 1.3 2.2 1.7 1.4 2.3 50 to 74 percent .................................................. 1.1 1.6 2.1 1.2 1.5 2.0 1.3 1.7 2.1 75 percent or more.............................................. 2.6 1.6 2.5 2.7 1.7 2.6 2.6 2.0 2.6
See notes at end of table.

57
Table 13a. Standard errors for the percentage distribution of public elementary schools reporting the number of days per week of scheduled recess, by elementary grade level and selected school characteristics: 2005—Continued
Grade 4 Grade 5 Grade 6
School characteristic None 1 to
4 days 5 days None 1 to
4 days 5 days None 1 to
4 days 5 days
All public elementary schools .......................... 0.9 0.9 1.1 1.0 0.9 1.2 1.9 1.0 2.1 Enrollment size
Less than 300...................................................... 1.3 1.5 1.9 1.6 1.7 2.1 2.6 2.1 3.5 300 to 499........................................................... 1.8 1.1 2.1 1.9 1.3 2.2 3.3 † 3.6 500 or more ........................................................ 1.4 1.3 2.1 1.7 1.4 2.2 3.6 1.5 3.5
School locale
City..................................................................... 2.2 1.6 2.7 2.3 1.7 2.9 4.9 † 4.9 Urban fringe ....................................................... 1.3 1.3 1.8 1.4 1.4 1.9 2.8 2.4 3.8 Town .................................................................. 2.6 3.3 4.3 3.0 3.9 4.9 † † 10.7 Rural................................................................... 1.4 1.6 1.8 1.9 1.8 2.3 3.5 1.9 3.6
Region
Northeast ............................................................ 2.1 1.3 2.6 2.2 1.6 2.8 5.0 † 5.3 Southeast ............................................................ 2.9 2.7 3.6 3.1 2.9 3.7 † † 9.9 Central ................................................................ 1.5 1.1 1.8 1.5 1.3 2.1 3.7 1.8 4.1 West ................................................................... 1.1 1.3 1.8 1.4 1.4 2.0 2.4 1.4 2.5
Percent minority enrollment
Less than 6 percent ............................................. 1.0 1.7 1.8 1.5 1.9 2.1 3.1 2.3 3.6 6 to 20 percent .................................................... 1.9 1.2 2.2 1.9 1.4 2.3 3.5 2.5 3.9 21 to 49 percent .................................................. 1.4 1.6 2.3 1.6 1.8 2.5 3.0 † 3.3 50 percent or more.............................................. 1.7 1.4 2.1 2.1 1.4 2.4 4.0 1.7 4.2
Percent of students eligible for free or reduced-price lunch
Less than 35 percent ........................................... 1.1 0.9 1.4 1.3 1.1 1.5 2.3 1.7 2.8 35 to 49 percent .................................................. 1.8 1.6 2.5 1.9 1.8 2.5 4.0 † 4.3 50 to 74 percent .................................................. 1.3 2.0 2.4 1.6 2.1 2.7 3.8 2.5 4.2 75 percent or more.............................................. 2.7 2.0 2.6 2.8 2.1 2.8 4.3 2.3 4.5
†Not applicable. SOURCE: U.S. Department of Education, National Center for Education Statistics, Fast Response Survey System (FRSS), “Foods and Physical Activity in Public Elementary Schools: 2005,” FRSS 87, 2005.

58
Table 14. Percentage distribution of public elementary schools reporting the number of times per day of scheduled recess, by elementary grade level and selected school characteristics: 2005
Grade 1 Grade 2 Grade 3
School characteristic None Once
More than once None Once
More than once None Once
More than once
All public elementary schools .......................... 7 55 38 7 56 37 8 59 33
Enrollment size
Less than 300...................................................... 6 48 46 6 49 45 5 54 41 300 to 499........................................................... 7 53 40 7 54 38 8 57 35 500 or more ........................................................ 9 61 30 9 61 30 10 63 27
School locale
City..................................................................... 14 55 32 13 57 30 14 59 27 Urban fringe ....................................................... 6 60 34 6 60 34 7 62 31 Town .................................................................. 6 39 55 6 41 53 6 51 43 Rural................................................................... 3 52 45 3 53 44 3 57 40
Region
Northeast ............................................................ 5 79 16 5 80 15 6 80 14 Southeast ............................................................ 16 77 7 17 76 7 18 77 5 Central ................................................................ 7 44 49 7 46 47 6 52 42 West ................................................................... 4 38 59 4 38 58 4 42 54
Percent minority enrollment
Less than 6 percent ............................................. 2 50 48 2 51 47 2 55 43 6 to 20 percent .................................................... 5 52 43 5 53 41 6 56 38 21 to 49 percent .................................................. 4 55 42 4 55 41 4 60 36 50 percent or more.............................................. 14 58 27 14 59 27 15 60 25
Percent of students eligible for free or reduced-price lunch
Less than 35 percent ........................................... 4 51 45 4 51 45 4 54 42 35 to 49 percent .................................................. 4 49 46 4 51 45 4 56 40 50 to 74 percent .................................................. 3 60 37 4 60 36 4 65 30 75 percent or more.............................................. 18 58 23 18 60 22 19 61 20
See notes at end of table.

59
Table 14. Percentage distribution of public elementary schools reporting the number of times per day of scheduled recess, by elementary grade level and selected school characteristics: 2005—Continued
Grade 4 Grade 5 Grade 6
School characteristic None Once
More than once None Once
More than once None Once
More than once
All public elementary schools .......................... 9 64 27 9 66 25 13 58 29
Enrollment size
Less than 300...................................................... 6 61 32 8 63 29 12 62 26 300 to 499........................................................... 9 63 28 9 65 26 9 61 30 500 or more ........................................................ 10 68 23 11 68 21 18 51 31
School locale
City..................................................................... 15 62 23 15 62 23 24 46 30 Urban fringe ....................................................... 7 68 25 7 68 24 7 63 30 Town .................................................................. 5 62 33 7 66 27 ‡ 50 43 Rural................................................................... 5 62 33 6 66 28 11 64 25
Region
Northeast ............................................................ 6 81 13 7 85 9 12 80 8 Southeast ............................................................ 18 78 4 20 78 3 25 72 ‡ Central ................................................................ 7 62 31 8 67 26 15 66 19 West ................................................................... 5 50 45 6 49 46 9 41 49
Percent minority enrollment
Less than 6 percent ............................................. 2! 63 35 4 68 29 8 65 27 6 to 20 percent .................................................... 7 59 34 7 60 33 8 53 39 21 to 49 percent .................................................. 5 69 26 5 70 25 6 59 35 50 percent or more.............................................. 16 64 20 17 64 19 24 54 22
Percent of students eligible for free or reduced-price lunch
Less than 35 percent ........................................... 4 61 35 5 63 33 5 54 41 35 to 49 percent .................................................. 4 63 33 5 66 29 7! 62 31 50 to 74 percent .................................................. 5 72 23 6 74 20 10 70 20 75 percent or more.............................................. 20 62 17 21 62 17 28 52 20
!Interpret data with caution; the coefficient of variation is greater than 50 percent. ‡Reporting standards not met. NOTE: Respondents were asked to provide information for each grade that was considered elementary at the school, typically grades 1 through 5 or 6. Detail may not sum to totals because of rounding. SOURCE: U.S. Department of Education, National Center for Education Statistics, Fast Response Survey System (FRSS), “Foods and Physical Activity in Public Elementary Schools: 2005,” FRSS 87, 2005.
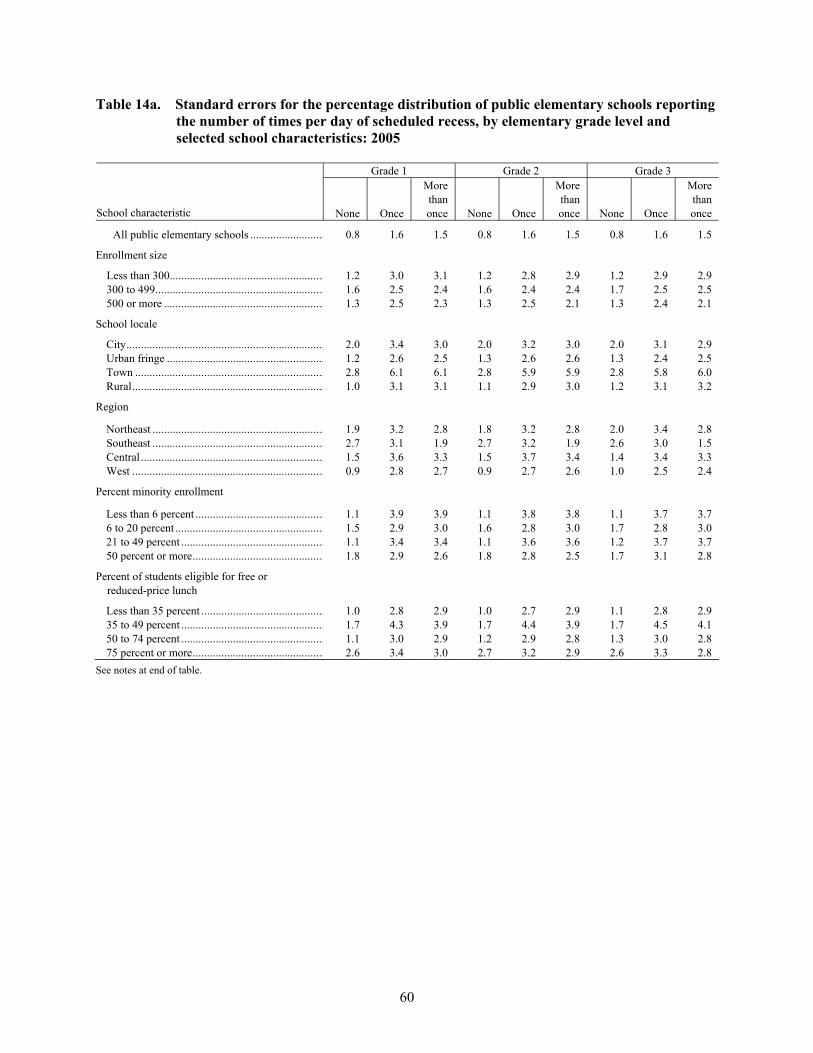
60
Table 14a. Standard errors for the percentage distribution of public elementary schools reporting the number of times per day of scheduled recess, by elementary grade level and selected school characteristics: 2005
Grade 1 Grade 2 Grade 3
School characteristic None Once
More than once None Once
More than once None Once
More than once
All public elementary schools .......................... 0.8 1.6 1.5 0.8 1.6 1.5 0.8 1.6 1.5
Enrollment size
Less than 300...................................................... 1.2 3.0 3.1 1.2 2.8 2.9 1.2 2.9 2.9 300 to 499........................................................... 1.6 2.5 2.4 1.6 2.4 2.4 1.7 2.5 2.5 500 or more ........................................................ 1.3 2.5 2.3 1.3 2.5 2.1 1.3 2.4 2.1
School locale
City..................................................................... 2.0 3.4 3.0 2.0 3.2 3.0 2.0 3.1 2.9 Urban fringe ....................................................... 1.2 2.6 2.5 1.3 2.6 2.6 1.3 2.4 2.5 Town .................................................................. 2.8 6.1 6.1 2.8 5.9 5.9 2.8 5.8 6.0 Rural................................................................... 1.0 3.1 3.1 1.1 2.9 3.0 1.2 3.1 3.2
Region
Northeast ............................................................ 1.9 3.2 2.8 1.8 3.2 2.8 2.0 3.4 2.8 Southeast ............................................................ 2.7 3.1 1.9 2.7 3.2 1.9 2.6 3.0 1.5 Central ................................................................ 1.5 3.6 3.3 1.5 3.7 3.4 1.4 3.4 3.3 West ................................................................... 0.9 2.8 2.7 0.9 2.7 2.6 1.0 2.5 2.4
Percent minority enrollment
Less than 6 percent ............................................. 1.1 3.9 3.9 1.1 3.8 3.8 1.1 3.7 3.7 6 to 20 percent .................................................... 1.5 2.9 3.0 1.6 2.8 3.0 1.7 2.8 3.0 21 to 49 percent .................................................. 1.1 3.4 3.4 1.1 3.6 3.6 1.2 3.7 3.7 50 percent or more.............................................. 1.8 2.9 2.6 1.8 2.8 2.5 1.7 3.1 2.8
Percent of students eligible for free or reduced-price lunch
Less than 35 percent ........................................... 1.0 2.8 2.9 1.0 2.7 2.9 1.1 2.8 2.9 35 to 49 percent .................................................. 1.7 4.3 3.9 1.7 4.4 3.9 1.7 4.5 4.1 50 to 74 percent .................................................. 1.1 3.0 2.9 1.2 2.9 2.8 1.3 3.0 2.8 75 percent or more.............................................. 2.6 3.4 3.0 2.7 3.2 2.9 2.6 3.3 2.8
See notes at end of table.

61
Table 14a. Standard errors for the percentage distribution of public elementary schools reporting the number of times per day of scheduled recess, by elementary grade level and selected school characteristics: 2005—Continued
Grade 4 Grade 5 Grade 6
School characteristic None Once
More than once None Once
More than once None Once
More than once
All public elementary schools .......................... 0.9 1.5 1.4 1.0 1.6 1.4 1.9 2.6 2.5
Enrollment size
Less than 300...................................................... 1.3 2.8 2.8 1.6 2.9 2.8 2.6 3.8 3.5 300 to 499........................................................... 1.8 2.6 2.5 1.9 2.6 2.4 3.3 5.3 5.2 500 or more ........................................................ 1.4 2.4 2.2 1.7 2.7 2.3 3.6 5.2 4.5
School locale
City..................................................................... 2.2 2.8 2.5 2.3 2.9 2.5 4.9 5.3 5.3 Urban fringe ....................................................... 1.3 2.7 2.6 1.4 2.7 2.7 2.8 4.2 4.1 Town .................................................................. 2.6 6.2 6.1 3.0 5.5 5.3 † 11.8 11.7 Rural................................................................... 1.4 3.1 2.9 1.9 3.2 2.8 3.5 4.1 3.3
Region
Northeast ............................................................ 2.1 3.3 2.8 2.2 3.4 2.7 5.0 6.0 3.6 Southeast ............................................................ 2.9 3.0 1.3 3.1 3.2 1.1 7.9 8.2 † Central ................................................................ 1.5 2.9 2.8 1.5 3.1 2.9 3.7 5.2 3.9 West ................................................................... 1.1 2.6 2.5 1.4 2.7 2.7 2.4 3.9 3.9
Percent minority enrollment
Less than 6 percent ............................................. 1.0 3.6 3.6 1.5 3.9 3.7 3.1 5.5 4.6 6 to 20 percent .................................................... 1.9 2.8 3.0 1.9 3.5 3.5 3.5 6.7 6.3 21 to 49 percent .................................................. 1.4 3.7 3.5 1.6 3.7 3.6 3.0 6.6 6.9 50 percent or more.............................................. 1.7 2.9 2.5 2.1 3.0 2.5 4.0 4.4 3.5
Percent of students eligible for free or reduced-price lunch
Less than 35 percent ........................................... 1.1 2.8 2.9 1.3 2.8 3.0 2.3 5.1 5.0 35 to 49 percent .................................................. 1.8 4.7 4.2 1.9 4.7 4.1 4.0 7.2 7.5 50 to 74 percent .................................................. 1.3 3.3 3.0 1.6 2.9 2.7 3.8 5.5 4.7 75 percent or more.............................................. 2.7 3.1 2.2 2.8 3.4 2.3 4.3 4.7 3.9
†Not applicable. SOURCE: U.S. Department of Education, National Center for Education Statistics, Fast Response Survey System (FRSS), “Foods and Physical Activity in Public Elementary Schools: 2005,” FRSS 87, 2005.

62
Table 15. Mean number of minutes per day of scheduled recess at public elementary schools, by elementary grade level and selected school characteristics: 2005
School characteristic Grade 1 Grade 2 Grade 3 Grade 4 Grade 5 Grade 6
All public elementary schools ............. 27.8 27.5 26.7 25.1 24.4 23.8 Enrollment size
Less than 300......................................... 29.8 29.6 28.7 26.5 25.3 24.5 300 to 499.............................................. 28.4 27.8 27.2 25.8 25.2 24.9 500 or more ........................................... 25.8 25.6 24.9 23.6 23.1 22.1
School locale
City........................................................ 23.9 23.6 23.2 21.8 21.9 20.6 Urban fringe .......................................... 28.2 28.0 27.4 26.3 25.7 25.9 Town ..................................................... 29.4 29.0 28.3 26.2 24.9 26.0 Rural...................................................... 30.9 30.4 29.0 27.0 25.5 24.1
Region
Northeast ............................................... 25.1 24.9 24.6 24.3 23.3 22.2 Southeast ............................................... 20.3 20.1 19.4 18.8 18.5 18.1 Central ................................................... 30.2 29.6 28.4 26.1 24.7 21.5 West ...................................................... 31.8 31.6 31.0 28.7 28.3 27.3
Percent minority enrollment
Less than 6 percent ................................ 32.6 32.0 30.9 29.1 27.3 25.8 6 to 20 percent ....................................... 29.5 29.2 28.2 26.9 26.7 27.5 21 to 49 percent ..................................... 28.4 28.1 27.6 25.5 24.9 25.0 50 percent or more................................. 23.4 23.2 22.7 21.4 21.0 19.3
Percent of students eligible for free or reduced-price lunch
Less than 35 percent .............................. 31.8 31.5 30.6 28.8 28.1 28.6 35 to 49 percent ..................................... 30.2 30.0 29.0 27.6 26.7 26.4 50 to 74 percent ..................................... 27.6 26.8 26.1 24.4 23.6 23.0 75 percent or more................................. 21.0 21.0 20.6 19.5 19.2 17.2
NOTE: Respondents were asked to provide information for each grade that was considered elementary at the school, typically grades 1 through 5 or 6. SOURCE: U.S. Department of Education, National Center for Education Statistics, Fast Response Survey System (FRSS), “Foods and Physical Activity in Public Elementary Schools: 2005,” FRSS 87, 2005.

63
Table 15a. Standard errors for the mean number of minutes per day of scheduled recess at public elementary schools, by elementary grade level and selected school characteristics: 2005
School characteristic Grade 1 Grade 2 Grade 3 Grade 4 Grade 5 Grade 6
All public elementary schools ............. 0.4 0.4 0.4 0.4 0.4 0.8 Enrollment size
Less than 300......................................... 0.7 0.7 0.8 0.8 0.9 1.2 300 to 499.............................................. 0.7 0.7 0.7 0.8 0.8 1.6 500 or more ........................................... 0.7 0.6 0.6 0.6 0.6 1.1
School locale
City........................................................ 0.9 0.9 0.9 0.8 0.8 1.8 Urban fringe .......................................... 0.7 0.7 0.7 0.7 0.7 1.2 Town ..................................................... 1.7 1.6 1.8 1.7 1.9 3.7 Rural...................................................... 0.8 0.8 0.8 0.8 0.9 1.4
Region
Northeast ............................................... 0.9 0.8 0.9 0.9 0.8 1.7 Southeast ............................................... 0.8 0.9 0.8 0.8 0.8 2.5 Central ................................................... 0.9 0.8 0.8 0.8 0.7 1.3 West ...................................................... 0.7 0.7 0.7 0.8 0.9 1.3
Percent minority enrollment
Less than 6 percent ................................ 0.9 0.8 0.7 0.7 0.8 1.2 6 to 20 percent ....................................... 0.9 0.9 1.0 1.1 1.2 2.1 21 to 49 percent ..................................... 0.9 0.9 0.9 0.9 0.9 1.5 50 percent or more................................. 0.8 0.7 0.8 0.7 0.8 1.3
Percent of students eligible for free or reduced-price lunch
Less than 35 percent .............................. 0.8 0.8 0.8 0.7 0.8 1.3 35 to 49 percent ..................................... 1.0 1.0 1.0 1.1 1.1 2.1 50 to 74 percent ..................................... 0.7 0.6 0.7 0.7 0.8 1.7 75 percent or more................................. 1.0 1.0 0.9 0.8 0.9 1.4
SOURCE: U.S. Department of Education, National Center for Education Statistics, Fast Response Survey System (FRSS), “Foods and Physical Activity in Public Elementary Schools: 2005,” FRSS 87, 2005.

64
Table 16. Percent of public elementary schools indicating that physical education was scheduled at the school, and percentage distribution reporting the number of days per week and minutes per class of scheduled physical education, by elementary grade level: 2005
Days per week and minutes per class Grade 1 Grade 2 Grade 3 Grade 4 Grade 5 Grade 6
Any scheduled physical education ...... 99 99 99 99 99 99
Days per week
None...................................................... 1 1 1 1 1 1 1 day...................................................... 22 22 22 22 22 22 2 days .................................................... 33 33 33 33 32 28 3 days .................................................... 8 9 8 8 8 10 4 days .................................................... 3 3 3 3 4 4 5 days .................................................... 18 17 17 17 17 22 Varies by week ...................................... 15 15 16 16 16 14
Minutes per class
None...................................................... 1 1 1 1 1 1 1 to 30 minutes ...................................... 43 42 39 35 34 34 31 to 40 minutes .................................... 24 24 25 26 25 24 More than 40 minutes............................ 31 32 34 37 39 40 Varies by class....................................... 1 1 1 1 1 2
NOTE: Respondents were asked to provide information for each grade that was considered elementary at the school, typically grades 1 through 5 or 6. Detail may not sum to totals because of rounding. SOURCE: U.S. Department of Education, National Center for Education Statistics, Fast Response Survey System (FRSS), “Foods and Physical Activity in Public Elementary Schools: 2005,” FRSS 87, 2005.

65
Table 16a. Standard errors for the percent of public elementary schools indicating that physical education was scheduled at the school, and percent reporting the number of days per week and minutes per class of scheduled physical education, by elementary grade level: 2005
Days per week and minutes per class Grade 1 Grade 2 Grade 3 Grade 4 Grade 5 Grade 6
Any scheduled physical education ...... 0.4 0.4 0.4 0.3 0.3 0.6
Days per week
None...................................................... 0.4 0.4 0.4 0.3 0.3 0.6 1 day...................................................... 1.3 1.3 1.3 1.3 1.4 2.6 2 days .................................................... 1.8 1.7 1.7 1.8 1.9 2.6 3 days .................................................... 0.8 0.9 0.9 0.8 0.9 1.7 4 days .................................................... 0.5 0.5 0.5 0.5 0.6 1.1 5 days .................................................... 1.1 1.1 1.1 1.2 1.3 2.5 Varies by week ...................................... 1.1 1.1 1.2 1.3 1.3 2.0
Minutes per class
None...................................................... 0.4 0.4 0.4 0.3 0.3 0.6 1 to 30 minutes ...................................... 1.6 1.7 1.7 1.7 1.8 2.9 31 to 40 minutes .................................... 1.5 1.5 1.5 1.6 1.7 2.6 More than 40 minutes............................ 1.5 1.6 1.8 1.9 2.1 2.4 Varies by class....................................... 0.3 0.3 0.3 0.3 0.4 0.6
SOURCE: U.S. Department of Education, National Center for Education Statistics, Fast Response Survey System (FRSS), “Foods and Physical Activity in Public Elementary Schools: 2005,” FRSS 87, 2005.

66
Table 17. Mean number of days per week of scheduled physical education at public elementary schools, by elementary grade level and selected school characteristics: 2005
School characteristic Grade 1 Grade 2 Grade 3 Grade 4 Grade 5 Grade 6
All public elementary schools ............. 2.4 2.4 2.4 2.4 2.4 2.6 Enrollment size
Less than 300......................................... 2.7 2.7 2.7 2.8 2.8 3.1 300 to 499.............................................. 2.1 2.1 2.1 2.1 2.1 2.1 500 or more ........................................... 2.5 2.5 2.4 2.4 2.4 2.5
School locale
City........................................................ 2.3 2.3 2.3 2.3 2.3 2.2 Urban fringe .......................................... 2.3 2.3 2.3 2.3 2.3 2.4 Town ..................................................... 2.6 2.6 2.5 2.5 2.4 1.8 Rural...................................................... 2.6 2.6 2.6 2.6 2.7 3.2
Region
Northeast ............................................... 1.8 1.8 1.7 1.7 1.8 1.9 Southeast ............................................... 2.4 2.4 2.4 2.4 2.4 2.9 Central ................................................... 2.3 2.3 2.3 2.3 2.2 2.3 West ...................................................... 2.9 2.8 2.9 2.9 2.9 3.1
Percent minority enrollment
Less than 6 percent ................................ 2.2 2.2 2.2 2.2 2.3 2.4 6 to 20 percent ....................................... 2.5 2.5 2.5 2.5 2.6 3.0 21 to 49 percent ..................................... 2.4 2.4 2.4 2.4 2.4 2.7 50 percent or more................................. 2.5 2.5 2.5 2.4 2.5 2.5
Percent of students eligible for free or reduced-price lunch
Less than 35 percent .............................. 2.3 2.3 2.2 2.3 2.3 2.5 35 to 49 percent ..................................... 2.5 2.5 2.4 2.4 2.5 2.7 50 to 74 percent ..................................... 2.6 2.6 2.6 2.6 2.6 3.1 75 percent or more................................. 2.4 2.4 2.4 2.4 2.5 2.4
NOTE: Respondents were asked to provide information for each grade that was considered elementary at the school, typically grades 1 through 5 or 6. SOURCE: U.S. Department of Education, National Center for Education Statistics, Fast Response Survey System (FRSS), “Foods and Physical Activity in Public Elementary Schools: 2005,” FRSS 87, 2005.

67
Table 17a. Standard errors for the mean number of days per week of scheduled physical education at public elementary schools, by elementary grade level and selected school characteristics: 2005
School characteristic Grade 1 Grade 2 Grade 3 Grade 4 Grade 5 Grade 6
All public elementary schools ............. 0.0 0.0 0.0 0.0 0.0 0.1 Enrollment size
Less than 300......................................... 0.1 0.1 0.1 0.1 0.1 0.1 300 to 499.............................................. 0.1 0.1 0.1 0.1 0.1 0.1 500 or more ........................................... 0.1 0.1 0.1 0.1 0.1 0.2
School locale
City........................................................ 0.1 0.1 0.1 0.1 0.1 0.2 Urban fringe .......................................... 0.1 0.1 0.1 0.1 0.1 0.2 Town ..................................................... 0.2 0.2 0.2 0.2 0.2 0.4 Rural...................................................... 0.1 0.1 0.1 0.1 0.1 0.1
Region
Northeast ............................................... 0.1 0.1 0.1 0.1 0.1 0.1 Southeast ............................................... 0.1 0.1 0.1 0.1 0.1 0.3 Central ................................................... 0.1 0.1 0.1 0.1 0.1 0.1 West ...................................................... 0.1 0.1 0.1 0.1 0.1 0.1
Percent minority enrollment
Less than 6 percent ................................ 0.1 0.1 0.1 0.1 0.1 0.1 6 to 20 percent ....................................... 0.1 0.1 0.1 0.1 0.1 0.2 21 to 49 percent ..................................... 0.1 0.1 0.1 0.1 0.1 0.2 50 percent or more................................. 0.1 0.1 0.1 0.1 0.1 0.2
Percent of students eligible for free or reduced-price lunch
Less than 35 percent .............................. 0.0 0.0 0.1 0.1 0.1 0.1 35 to 49 percent ..................................... 0.1 0.1 0.1 0.1 0.1 0.2 50 to 74 percent ..................................... 0.1 0.1 0.1 0.1 0.1 0.2 75 percent or more................................. 0.1 0.1 0.1 0.1 0.1 0.2
SOURCE: U.S. Department of Education, National Center for Education Statistics, Fast Response Survey System (FRSS), “Foods and Physical Activity in Public Elementary Schools: 2005,” FRSS 87, 2005.

68
Table 18. Mean number of minutes per week of scheduled physical education at public elementary schools, by elementary grade level and selected school characteristics: 2005
School characteristic Grade 1 Grade 2 Grade 3 Grade 4 Grade 5 Grade 6
All public elementary schools ............. 85.4 85.5 86.4 88.5 90.5 98.0 Enrollment size
Less than 300......................................... 95.5 94.8 98.1 102.0 108.2 122.8 300 to 499.............................................. 76.5 77.1 77.3 78.6 78.3 76.9 500 or more ........................................... 86.5 86.8 87.1 88.8 89.7 87.5
School locale
City........................................................ 84.9 83.9 85.7 86.9 87.1 83.4 Urban fringe .......................................... 80.8 81.2 81.9 84.4 85.2 86.4 Town ..................................................... 86.0 85.3 84.3 86.7 85.1 54.4 Rural...................................................... 91.8 92.9 93.6 96.2 102.9 123.3
Region
Northeast ............................................... 69.6 70.3 69.4 68.8 70.7 74.5 Southeast ............................................... 89.0 89.3 89.3 90.8 92.0 116.2 Central ................................................... 75.5 75.8 77.4 79.4 79.1 80.5 West ...................................................... 99.6 99.1 100.6 104.4 107.5 116.2
Percent minority enrollment
Less than 6 percent ................................ 75.8 76.9 77.9 82.3 86.1 93.4 6 to 20 percent ....................................... 86.4 86.7 86.7 89.4 91.6 104.0 21 to 49 percent ..................................... 87.9 87.4 88.8 91.0 90.9 105.2 50 percent or more................................. 89.6 89.2 90.5 91.0 92.9 95.2
Percent of students eligible for free or reduced-price lunch
Less than 35 percent .............................. 78.0 79.0 80.0 82.7 83.4 86.1 35 to 49 percent ..................................... 82.6 82.4 81.6 84.9 86.5 99.6 50 to 74 percent ..................................... 94.8 94.6 94.4 96.3 98.1 117.5 75 percent or more................................. 88.6 88.0 90.5 91.4 94.9 96.1
NOTE: Respondents were asked to provide information for each grade that was considered elementary at the school, typically grades 1 through 5 or 6. SOURCE: U.S. Department of Education, National Center for Education Statistics, Fast Response Survey System (FRSS), “Foods and Physical Activity in Public Elementary Schools: 2005,” FRSS 87, 2005.

69
Table 18a. Standard errors for the mean number of minutes per week of scheduled physical education at public elementary schools, by elementary grade level and selected school characteristics: 2005
School characteristic Grade 1 Grade 2 Grade 3 Grade 4 Grade 5 Grade 6
All public elementary schools ............. 1.3 1.3 1.3 1.4 1.6 3.9 Enrollment size
Less than 300......................................... 3.0 3.0 3.2 3.3 3.8 7.6 300 to 499.............................................. 2.2 2.2 2.3 2.4 2.4 4.6 500 or more ........................................... 2.1 2.1 2.2 2.2 2.2 5.4
School locale
City........................................................ 2.9 2.6 2.8 2.7 2.9 6.8 Urban fringe .......................................... 2.1 2.2 2.2 2.3 2.4 5.8 Town ..................................................... 5.5 5.4 5.5 6.0 6.1 8.3 Rural...................................................... 2.8 2.9 3.0 3.1 3.8 6.8
Region
Northeast ............................................... 3.0 3.1 3.1 2.6 2.8 4.6 Southeast ............................................... 3.5 3.5 3.4 3.3 3.3 11.0 Central ................................................... 2.3 2.3 2.5 2.5 2.9 6.0 West ...................................................... 2.7 2.5 2.6 2.7 3.0 6.0
Percent minority enrollment
Less than 6 percent ................................ 2.5 2.5 2.6 2.9 3.5 8.1 6 to 20 percent ....................................... 2.6 2.7 2.9 2.9 2.9 7.5 21 to 49 percent ..................................... 2.8 2.8 2.8 3.1 3.6 8.5 50 percent or more................................. 3.2 3.2 3.3 3.3 3.2 7.5
Percent of students eligible for free or reduced-price lunch
Less than 35 percent .............................. 1.5 1.5 1.7 1.9 2.0 4.6 35 to 49 percent ..................................... 3.2 3.2 3.4 3.2 3.4 7.9 50 to 74 percent ..................................... 4.0 3.9 3.9 3.6 3.9 8.8 75 percent or more................................. 3.6 3.5 3.4 3.3 3.8 9.5
SOURCE: U.S. Department of Education, National Center for Education Statistics, Fast Response Survey System (FRSS), “Foods and Physical Activity in Public Elementary Schools: 2005,” FRSS 87, 2005.

70
Table 19. Mean number of minutes per week of scheduled recess and physical education, combined, at public elementary schools, by elementary grade level and selected school characteristics: 2005
School characteristic Grade 1 Grade 2 Grade 3 Grade 4 Grade 5 Grade 6
All public elementary schools ............. 221.7 220.1 216.9 210.7 208.4 214.1 Enrollment size
Less than 300......................................... 242.1 240.2 238.5 230.4 230.3 240.5 300 to 499.............................................. 217.2 214.7 211.9 205.5 201.6 199.7 500 or more ........................................... 211.4 210.9 207.0 202.3 200.1 196.8
School locale
City........................................................ 200.9 198.3 198.4 193.0 193.2 186.3 Urban fringe .......................................... 219.3 218.8 216.0 212.0 209.7 212.8 Town ..................................................... 230.5 227.3 223.1 212.2 202.9 179.1 Rural...................................................... 244.4 242.8 236.3 228.0 226.1 240.0
Region
Northeast ............................................... 192.7 192.8 190.7 188.2 184.3 184.4 Southeast ............................................... 184.7 183.8 179.4 175.9 175.5 201.2 Central ................................................... 225.6 222.5 218.1 208.4 200.8 186.4 West ...................................................... 256.5 254.6 253.2 245.3 245.6 249.3
Percent minority enrollment
Less than 6 percent ................................ 235.0 233.2 228.7 223.7 217.7 218.9 6 to 20 percent ....................................... 233.1 231.5 226.4 222.3 222.2 237.4 21 to 49 percent ..................................... 227.8 225.7 224.1 215.7 212.2 230.0 50 percent or more................................. 203.8 202.3 200.7 193.9 193.7 190.1
Percent of students eligible for free or reduced-price lunch
Less than 35 percent .............................. 234.8 234.5 230.9 224.5 221.1 227.2 35 to 49 percent ..................................... 232.2 230.7 224.7 220.2 217.2 229.4 50 to 74 percent ..................................... 229.1 225.1 220.9 212.7 209.1 228.9 75 percent or more................................. 190.8 189.3 189.4 184.8 186.9 179.4
NOTE: Respondents were asked to provide information for each grade that was considered elementary at the school, typically grades 1 through 5 or 6. SOURCE: U.S. Department of Education, National Center for Education Statistics, Fast Response Survey System (FRSS), “Foods and Physical Activity in Public Elementary Schools: 2005,” FRSS 87, 2005.
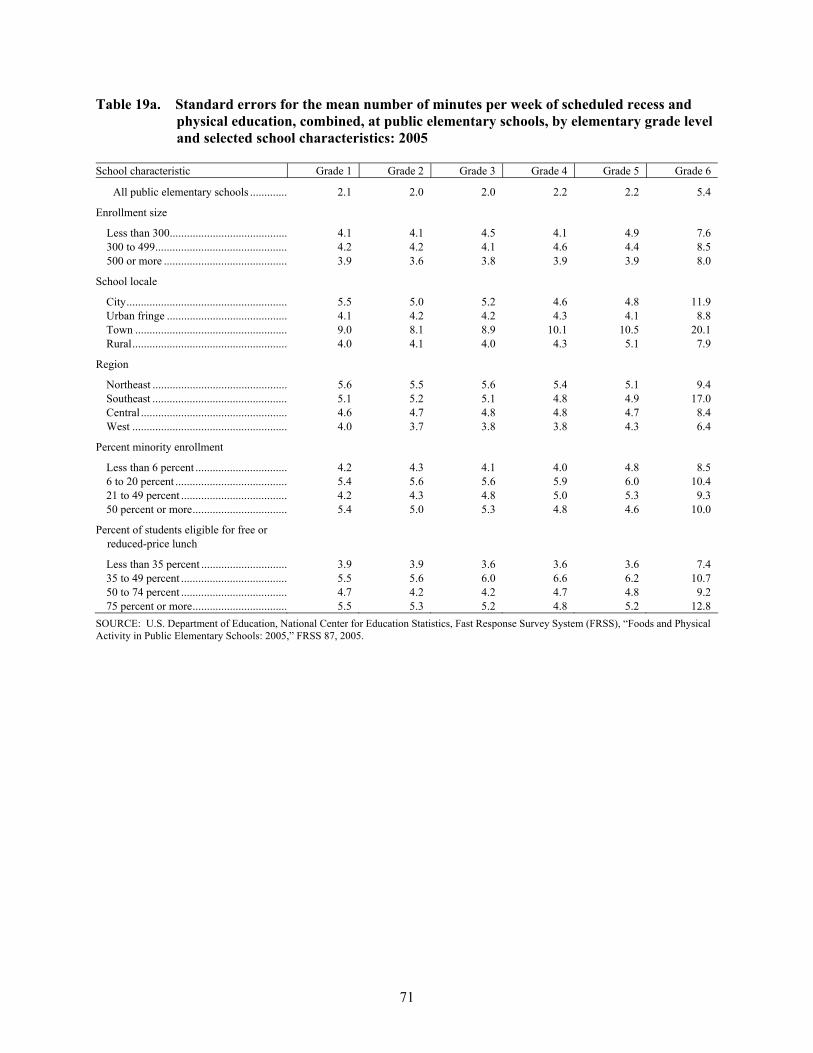
71
Table 19a. Standard errors for the mean number of minutes per week of scheduled recess and physical education, combined, at public elementary schools, by elementary grade level and selected school characteristics: 2005
School characteristic Grade 1 Grade 2 Grade 3 Grade 4 Grade 5 Grade 6
All public elementary schools ............. 2.1 2.0 2.0 2.2 2.2 5.4 Enrollment size
Less than 300......................................... 4.1 4.1 4.5 4.1 4.9 7.6 300 to 499.............................................. 4.2 4.2 4.1 4.6 4.4 8.5 500 or more ........................................... 3.9 3.6 3.8 3.9 3.9 8.0
School locale
City........................................................ 5.5 5.0 5.2 4.6 4.8 11.9 Urban fringe .......................................... 4.1 4.2 4.2 4.3 4.1 8.8 Town ..................................................... 9.0 8.1 8.9 10.1 10.5 20.1 Rural...................................................... 4.0 4.1 4.0 4.3 5.1 7.9
Region
Northeast ............................................... 5.6 5.5 5.6 5.4 5.1 9.4 Southeast ............................................... 5.1 5.2 5.1 4.8 4.9 17.0 Central ................................................... 4.6 4.7 4.8 4.8 4.7 8.4 West ...................................................... 4.0 3.7 3.8 3.8 4.3 6.4
Percent minority enrollment
Less than 6 percent ................................ 4.2 4.3 4.1 4.0 4.8 8.5 6 to 20 percent ....................................... 5.4 5.6 5.6 5.9 6.0 10.4 21 to 49 percent ..................................... 4.2 4.3 4.8 5.0 5.3 9.3 50 percent or more................................. 5.4 5.0 5.3 4.8 4.6 10.0
Percent of students eligible for free or reduced-price lunch
Less than 35 percent .............................. 3.9 3.9 3.6 3.6 3.6 7.4 35 to 49 percent ..................................... 5.5 5.6 6.0 6.6 6.2 10.7 50 to 74 percent ..................................... 4.7 4.2 4.2 4.7 4.8 9.2 75 percent or more................................. 5.5 5.3 5.2 4.8 5.2 12.8
SOURCE: U.S. Department of Education, National Center for Education Statistics, Fast Response Survey System (FRSS), “Foods and Physical Activity in Public Elementary Schools: 2005,” FRSS 87, 2005.
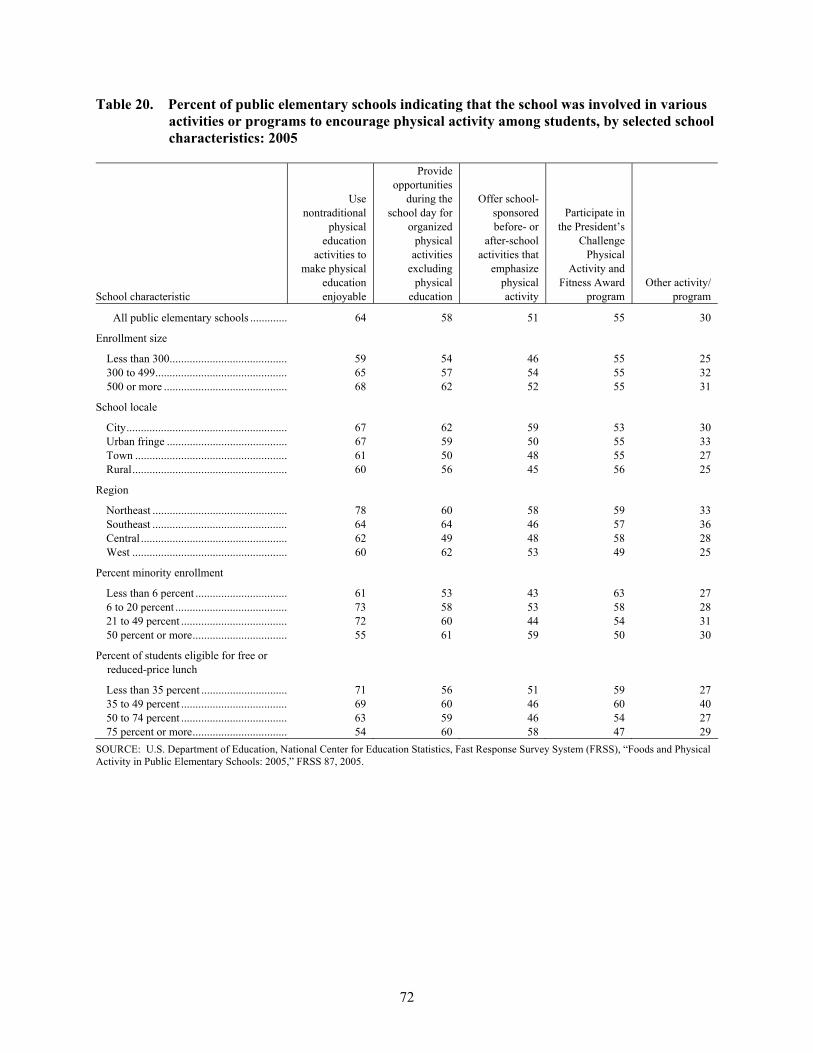
72
Table 20. Percent of public elementary schools indicating that the school was involved in various activities or programs to encourage physical activity among students, by selected school characteristics: 2005
School characteristic
Use nontraditional
physical education
activities to make physical
education enjoyable
Provide opportunities
during the school day for
organized physical
activities excluding
physical education
Offer school-sponsored before- or
after-school activities that
emphasize physical activity
Participate in the President’s
Challenge Physical
Activity and Fitness Award
program Other activity/
program
All public elementary schools ............. 64 58 51 55 30 Enrollment size
Less than 300......................................... 59 54 46 55 25 300 to 499.............................................. 65 57 54 55 32 500 or more ........................................... 68 62 52 55 31
School locale
City........................................................ 67 62 59 53 30 Urban fringe .......................................... 67 59 50 55 33 Town ..................................................... 61 50 48 55 27 Rural...................................................... 60 56 45 56 25
Region
Northeast ............................................... 78 60 58 59 33 Southeast ............................................... 64 64 46 57 36 Central ................................................... 62 49 48 58 28 West ...................................................... 60 62 53 49 25
Percent minority enrollment
Less than 6 percent ................................ 61 53 43 63 27 6 to 20 percent ....................................... 73 58 53 58 28 21 to 49 percent ..................................... 72 60 44 54 31 50 percent or more................................. 55 61 59 50 30
Percent of students eligible for free or reduced-price lunch
Less than 35 percent .............................. 71 56 51 59 27 35 to 49 percent ..................................... 69 60 46 60 40 50 to 74 percent ..................................... 63 59 46 54 27 75 percent or more................................. 54 60 58 47 29
SOURCE: U.S. Department of Education, National Center for Education Statistics, Fast Response Survey System (FRSS), “Foods and Physical Activity in Public Elementary Schools: 2005,” FRSS 87, 2005.

73
Table 20a. Standard errors for the percent of public elementary schools indicating that the school was involved in various activities or programs to encourage physical activity among students, by selected school characteristics: 2005
School characteristic
Use nontraditional
physical education
activities to make physical
education enjoyable
Provide opportunities
during the school day for
organized physical
activities excluding
physical education
Offer school-sponsored before- or
after-school activities that
emphasize physical activity
Participate in the President’s
Challenge Physical
Activity and Fitness Award
program Other activity/
program
All public elementary schools ............. 1.6 1.8 1.5 1.4 1.4 Enrollment size
Less than 300......................................... 2.6 3.1 2.3 2.9 2.5 300 to 499.............................................. 2.6 3.1 2.9 2.3 2.9 500 or more ........................................... 2.5 2.7 2.0 2.5 2.0
School locale
City........................................................ 2.8 3.5 3.0 2.8 2.8 Urban fringe .......................................... 2.9 2.7 2.6 2.7 2.2 Town ..................................................... 5.4 4.6 5.5 4.7 5.2 Rural...................................................... 2.9 2.6 2.3 3.3 2.3
Region
Northeast ............................................... 3.0 3.9 4.4 3.5 3.5 Southeast ............................................... 3.1 3.7 3.3 3.2 3.1 Central ................................................... 2.8 3.3 2.9 2.6 2.7 West ...................................................... 2.9 3.3 2.7 2.8 2.1
Percent minority enrollment
Less than 6 percent ................................ 4.0 3.2 3.3 3.2 3.2 6 to 20 percent ....................................... 2.6 3.9 3.0 3.1 3.3 21 to 49 percent ..................................... 2.3 3.6 2.9 3.1 2.9 50 percent or more................................. 2.8 3.4 2.8 2.5 2.5
Percent of students eligible for free or reduced-price lunch
Less than 35 percent .............................. 2.6 2.8 2.9 2.4 2.2 35 to 49 percent ..................................... 3.8 3.8 3.5 4.2 4.1 50 to 74 percent ..................................... 3.1 3.3 2.9 3.5 2.9 75 percent or more................................. 3.2 3.5 2.7 3.0 3.1
SOURCE: U.S. Department of Education, National Center for Education Statistics, Fast Response Survey System (FRSS), “Foods and Physical Activity in Public Elementary Schools: 2005,” FRSS 87, 2005.

74
Table 21. Percentage distribution of public elementary schools reporting the frequency with which the school calculated the students’ body mass index and measured students’ height and weight, by selected school characteristics: 2005
Body mass index
School characteristic Never
calculated
Calculated in selected
grades only
Calculated yearly for
all students
Other approach to calculate body
mass index
All public elementary schools .............................. 66 16 16 3 Enrollment size
Less than 300.......................................................... 68 13 16 3 300 to 499............................................................... 68 11 19 2 500 or more ............................................................ 62 23 12 3
School locale
City......................................................................... 62 20 15 2 Urban fringe ........................................................... 64 18 15 3 Town ...................................................................... 77 6 15 ‡ Rural....................................................................... 68 12 17 4
Region
Northeast ................................................................ 60 9 26 6 Southeast ................................................................ 57 20 22 ‡ Central .................................................................... 79 9 10 2 West ....................................................................... 63 23 11 3
Percent minority enrollment
Less than 6 percent ................................................. 69 11 17 3!6 to 20 percent ........................................................ 68 16 13 2 21 to 49 percent ...................................................... 63 16 18 4 50 percent or more.................................................. 63 20 14 2
Percent of students eligible for free or reduced-price lunch
Less than 35 percent ............................................... 65 17 15 3 35 to 49 percent ...................................................... 67 15 15 3 50 to 74 percent ...................................................... 68 14 16 2 75 percent or more.................................................. 64 17 16 3
See notes at end of table.

75
Table 21. Percentage distribution of public elementary schools reporting the frequency with which the school calculated the students’ body mass index and measured students’ height and weight, by selected school characteristics: 2005—Continued
Height Weight
School characteristic Never
measured
Measured in
selected grades
only
Measured yearly for all
students
Other approach
to measure
heightNever
measured
Measured in
selected grades
only
Measured yearly for all
students
Other approach
to measure
weight
All public elementary schools ................. 28 30 38 3 29 29 38 3 Enrollment size
Less than 300............................................. 29 25 43 3 30 24 43 3 300 to 499.................................................. 29 25 42 3 30 25 42 3 500 or more ............................................... 26 39 31 4 29 37 30 4
School locale
City............................................................ 31 34 32 4 34 32 31 3 Urban fringe .............................................. 27 32 37 3 28 32 37 3 Town ......................................................... 24 25 47 3! 25 24 47 3!Rural.......................................................... 26 26 44 3 28 25 44 3
Region
Northeast ................................................... 15 17 66 2! 16 17 66 2!Southeast ................................................... 29 31 37 3 30 31 37 3 Central ....................................................... 39 25 32 4 42 22 32 4 West .......................................................... 25 42 30 3 26 41 29 3
Percent minority enrollment
Less than 6 percent .................................... 27 24 45 4 28 24 45 4 6 to 20 percent ........................................... 28 27 42 2 29 26 42 2 21 to 49 percent ......................................... 28 29 39 4 30 28 38 4 50 percent or more..................................... 26 38 33 4 29 36 32 3
Percent of students eligible for free or reduced-price lunch
Less than 35 percent .................................. 25 29 43 3 27 28 42 3 35 to 49 percent ......................................... 32 28 37 4 33 28 36 4 50 to 74 percent ......................................... 30 30 37 3 30 29 37 3 75 percent or more..................................... 27 35 34 4 30 33 34 3
!Interpret data with caution; the coefficient of variation is greater than 50 percent. ‡Reporting standards not met. NOTE: Detail may not sum to totals because of rounding. SOURCE: U.S. Department of Education, National Center for Education Statistics, Fast Response Survey System (FRSS), “Foods and Physical Activity in Public Elementary Schools: 2005,” FRSS 87, 2005.
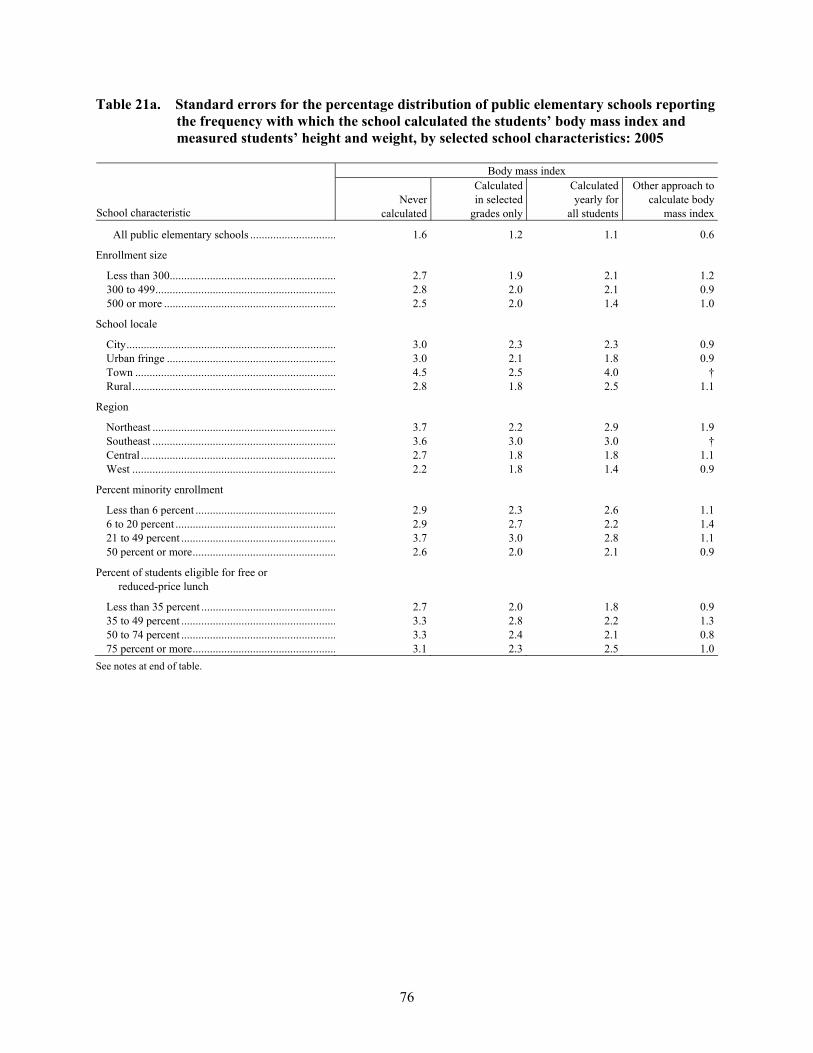
76
Table 21a. Standard errors for the percentage distribution of public elementary schools reporting the frequency with which the school calculated the students’ body mass index and measured students’ height and weight, by selected school characteristics: 2005
Body mass index
School characteristic Never
calculated
Calculated in selected
grades only
Calculated yearly for
all students
Other approach to calculate body
mass index
All public elementary schools .............................. 1.6 1.2 1.1 0.6 Enrollment size
Less than 300.......................................................... 2.7 1.9 2.1 1.2300 to 499............................................................... 2.8 2.0 2.1 0.9500 or more ............................................................ 2.5 2.0 1.4 1.0
School locale
City......................................................................... 3.0 2.3 2.3 0.9Urban fringe ........................................................... 3.0 2.1 1.8 0.9Town ...................................................................... 4.5 2.5 4.0 †Rural....................................................................... 2.8 1.8 2.5 1.1
Region
Northeast ................................................................ 3.7 2.2 2.9 1.9Southeast ................................................................ 3.6 3.0 3.0 †Central .................................................................... 2.7 1.8 1.8 1.1West ....................................................................... 2.2 1.8 1.4 0.9
Percent minority enrollment
Less than 6 percent ................................................. 2.9 2.3 2.6 1.16 to 20 percent ........................................................ 2.9 2.7 2.2 1.421 to 49 percent ...................................................... 3.7 3.0 2.8 1.150 percent or more.................................................. 2.6 2.0 2.1 0.9
Percent of students eligible for free or reduced-price lunch
Less than 35 percent ............................................... 2.7 2.0 1.8 0.935 to 49 percent ...................................................... 3.3 2.8 2.2 1.350 to 74 percent ...................................................... 3.3 2.4 2.1 0.875 percent or more.................................................. 3.1 2.3 2.5 1.0
See notes at end of table.
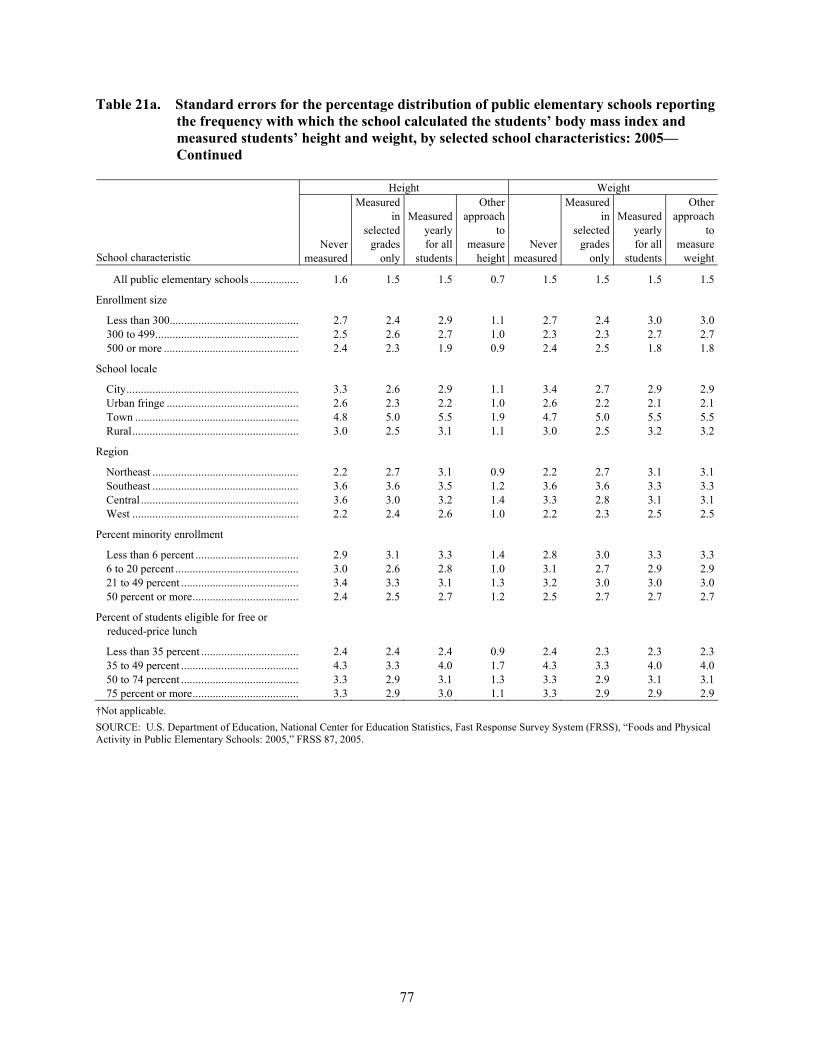
77
Table 21a. Standard errors for the percentage distribution of public elementary schools reporting the frequency with which the school calculated the students’ body mass index and measured students’ height and weight, by selected school characteristics: 2005—Continued
Height Weight
School characteristic Never
measured
Measured in
selected grades
only
Measured yearly for all
students
Other approach
to measure
heightNever
measured
Measured in
selected grades
only
Measured yearly for all
students
Other approach
to measure
weight
All public elementary schools ................. 1.6 1.5 1.5 0.7 1.5 1.5 1.5 1.5 Enrollment size
Less than 300............................................. 2.7 2.4 2.9 1.1 2.7 2.4 3.0 3.0300 to 499.................................................. 2.5 2.6 2.7 1.0 2.3 2.3 2.7 2.7500 or more ............................................... 2.4 2.3 1.9 0.9 2.4 2.5 1.8 1.8
School locale
City............................................................ 3.3 2.6 2.9 1.1 3.4 2.7 2.9 2.9Urban fringe .............................................. 2.6 2.3 2.2 1.0 2.6 2.2 2.1 2.1Town ......................................................... 4.8 5.0 5.5 1.9 4.7 5.0 5.5 5.5Rural.......................................................... 3.0 2.5 3.1 1.1 3.0 2.5 3.2 3.2
Region
Northeast ................................................... 2.2 2.7 3.1 0.9 2.2 2.7 3.1 3.1Southeast ................................................... 3.6 3.6 3.5 1.2 3.6 3.6 3.3 3.3Central ....................................................... 3.6 3.0 3.2 1.4 3.3 2.8 3.1 3.1West .......................................................... 2.2 2.4 2.6 1.0 2.2 2.3 2.5 2.5
Percent minority enrollment
Less than 6 percent .................................... 2.9 3.1 3.3 1.4 2.8 3.0 3.3 3.36 to 20 percent ........................................... 3.0 2.6 2.8 1.0 3.1 2.7 2.9 2.921 to 49 percent ......................................... 3.4 3.3 3.1 1.3 3.2 3.0 3.0 3.050 percent or more..................................... 2.4 2.5 2.7 1.2 2.5 2.7 2.7 2.7
Percent of students eligible for free or reduced-price lunch
Less than 35 percent .................................. 2.4 2.4 2.4 0.9 2.4 2.3 2.3 2.335 to 49 percent ......................................... 4.3 3.3 4.0 1.7 4.3 3.3 4.0 4.050 to 74 percent ......................................... 3.3 2.9 3.1 1.3 3.3 2.9 3.1 3.175 percent or more..................................... 3.3 2.9 3.0 1.1 3.3 2.9 2.9 2.9
†Not applicable. SOURCE: U.S. Department of Education, National Center for Education Statistics, Fast Response Survey System (FRSS), “Foods and Physical Activity in Public Elementary Schools: 2005,” FRSS 87, 2005.

78
Table 22. Percent of public elementary schools that calculated the students’ body mass index and measured students’ height and weight indicating whether the information was sent to parents, by selected school characteristics: 2005
School characteristic Body mass index
information Height
information Weight
information
All public elementary schools .................................. 49 39 39
Enrollment size
Less than 300.............................................................. 54 42 42 300 to 499................................................................... 54 39 40 500 or more ................................................................ 43 36 37
School locale
City............................................................................. 45 39 39 Urban fringe ............................................................... 52 37 38 Town .......................................................................... ‡ 43 45 Rural........................................................................... 47 39 39
Region
Northeast .................................................................... 48 28 29 Southeast .................................................................... 62 43 43 Central ........................................................................ 51 42 43 West ........................................................................... 41 40 41
Percent minority enrollment
Less than 6 percent ..................................................... 56 39 39 6 to 20 percent ............................................................ 54 40 39 21 to 49 percent .......................................................... 49 39 40 50 percent or more...................................................... 45 38 40
Percent of students eligible for free or reduced-price lunch
Less than 35 percent ................................................... 50 37 37 35 to 49 percent .......................................................... 54 43 43 50 to 74 percent .......................................................... 47 41 41 75 percent or more...................................................... 48 37 39
‡Reporting standards not met. NOTE: Data in this table are based on the number of schools that calculated the students’ body mass index and measured the students’ height or weight (table 21). SOURCE: U.S. Department of Education, National Center for Education Statistics, Fast Response Survey System (FRSS), “Foods and Physical Activity in Public Elementary Schools: 2005,” FRSS 87, 2005.
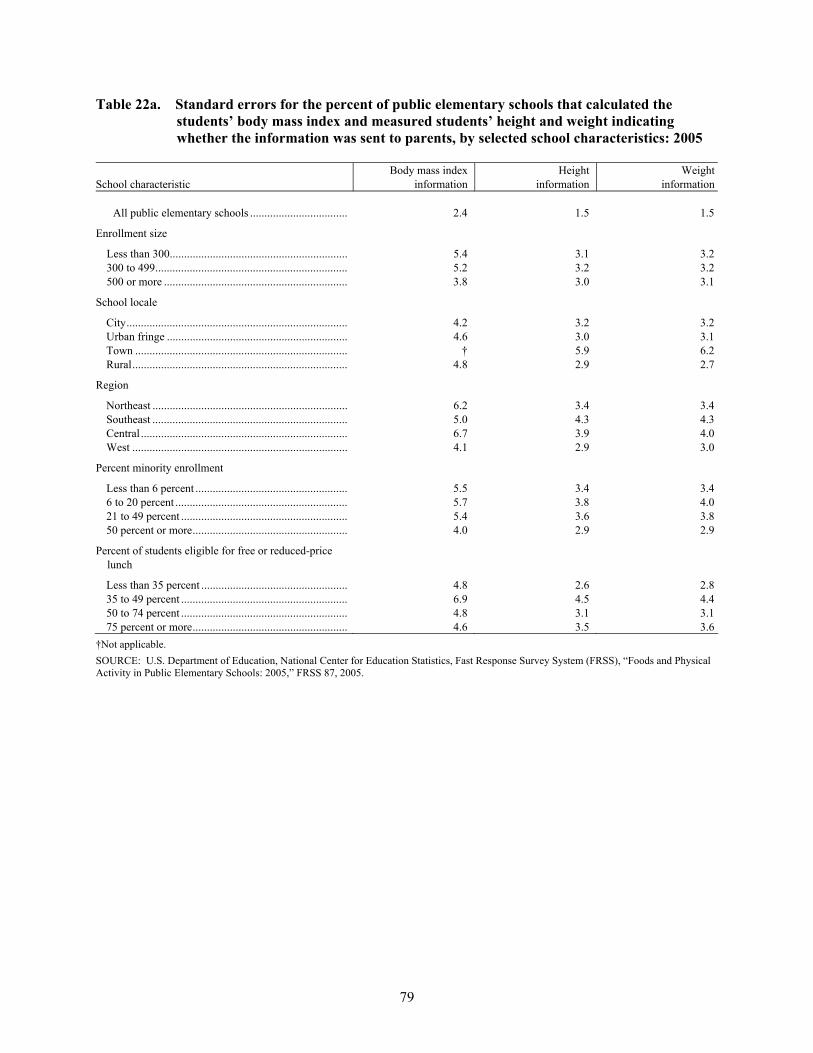
79
Table 22a. Standard errors for the percent of public elementary schools that calculated the students’ body mass index and measured students’ height and weight indicating whether the information was sent to parents, by selected school characteristics: 2005
School characteristic Body mass index
information Height
information Weight
information
All public elementary schools .................................. 2.4 1.5 1.5
Enrollment size
Less than 300.............................................................. 5.4 3.1 3.2300 to 499................................................................... 5.2 3.2 3.2500 or more ................................................................ 3.8 3.0 3.1
School locale
City............................................................................. 4.2 3.2 3.2Urban fringe ............................................................... 4.6 3.0 3.1Town .......................................................................... † 5.9 6.2Rural........................................................................... 4.8 2.9 2.7
Region
Northeast .................................................................... 6.2 3.4 3.4Southeast .................................................................... 5.0 4.3 4.3Central ........................................................................ 6.7 3.9 4.0West ........................................................................... 4.1 2.9 3.0
Percent minority enrollment
Less than 6 percent ..................................................... 5.5 3.4 3.46 to 20 percent ............................................................ 5.7 3.8 4.021 to 49 percent .......................................................... 5.4 3.6 3.850 percent or more...................................................... 4.0 2.9 2.9
Percent of students eligible for free or reduced-price lunch
Less than 35 percent ................................................... 4.8 2.6 2.835 to 49 percent .......................................................... 6.9 4.5 4.450 to 74 percent .......................................................... 4.8 3.1 3.175 percent or more...................................................... 4.6 3.5 3.6
†Not applicable. SOURCE: U.S. Department of Education, National Center for Education Statistics, Fast Response Survey System (FRSS), “Foods and Physical Activity in Public Elementary Schools: 2005,” FRSS 87, 2005.

80
This page intentionally left blank.

A-1
Appendix A
Technical Notes

A-2
This page intentionally left blank.
A-3
Technical Notes
Fast Response Survey System
The Fast Response Survey System (FRSS) was established in 1975 by the National Center for Education Statistics (NCES), U.S. Department of Education. FRSS is designed to collect issue-oriented data within a relatively short time frame. FRSS collects data from state education agencies, local education agencies, public and private elementary and secondary schools, public school teachers, and public libraries. To ensure minimal burden on respondents, the surveys are generally limited to three pages of questions, with a response burden of about 30 minutes per respondent. Sample sizes are relatively small (usually about 1,000 to 1,500 respondents per survey) so that data collection can be completed quickly. Data are weighted to produce national estimates of the sampled education sector. The sample size permits limited breakouts by classification variables. However, as the number of categories within the classification variables increases, the sample size within categories decreases, which results in larger sampling errors for the breakouts by classification variables.
Sample Design
The sample for the FRSS survey on foods and physical activity consisted of 1,198 regular public elementary schools in the 50 states and the District of Columbia. It was selected from the 2002–03 NCES Common Core of Data (CCD) Public School Universe file, which was the most current file available at the time of selection. The sampling frame included 50,980 regular elementary schools. For the purposes of the study, an elementary school was defined as a school with a high grade of 1 to 8 and a low grade of prekindergarten, kindergarten, or grades 1 to 3. Excluded from the sampling frame were schools with a high grade of prekindergarten or kindergarten and ungraded schools, along with special education, vocational, and alternative/other schools, schools outside the 50 states and the District of Columbia, and schools with zero or missing enrollment.
The public school sampling frame was stratified by enrollment size (less than 300, 300 to
499, 500 to 599, 600 to 749, and 750 or more) and percent eligible for free or reduced-price lunch (less than 35 percent, 36 to 49 percent, 50 to 74 percent, and 75 percent or more). Schools in the frame were then sorted by type of locale (city, urban fringe, town, and rural) and region (Northeast, Southeast,

A-4
Central, and West) to induce additional implicit stratification. These variables are defined in more detail in the “Definitions of Analysis Variables” section of these Technical Notes.
Data Collection and Response Rates
Questionnaires and cover letters for the study were mailed to the principal of each sampled school in early March 2005. The letter introduced the study and requested that the questionnaire be completed by the person most knowledgeable about the availability of foods and opportunities for physical activity at the school. Respondents were encouraged to consult with the school’s food service personnel and physical education staff to complete relevant sections of the questionnaire, as necessary. Respondents were also offered the option of completing the survey via the Web. The cover letter for the study included information on how to access the survey on the Web, including the survey Uniform Resource Location (URL) and the user login and password. Telephone follow-up for survey nonresponse and data clarification was initiated in late March 2005 and completed in late June 2005.
Of the 1,198 schools in the sample, 37 were found to be ineligible for the survey because
they were closed or did not meet the grade requirements for inclusion as an elementary school. This left a total of 1,161 eligible schools in the sample. Completed questionnaires were received from 1,055 schools, or 91 percent of the eligible schools (table A-1). Of the schools that completed the survey, 19 percent completed it by Web, 53 percent completed it by mail, 27 percent completed it by fax, and 1 percent completed it by telephone.
The weighted response rate was 91 percent. The weighted number of eligible institutions in
the survey represents the estimated universe of regular elementary schools in the 50 states and the District of Columbia. The estimated number of schools in the survey universe decreased from the 50,980 schools in the CCD sampling frame to an estimated 49,393 because some of the schools were determined to be ineligible for the FRSS survey during data collection.
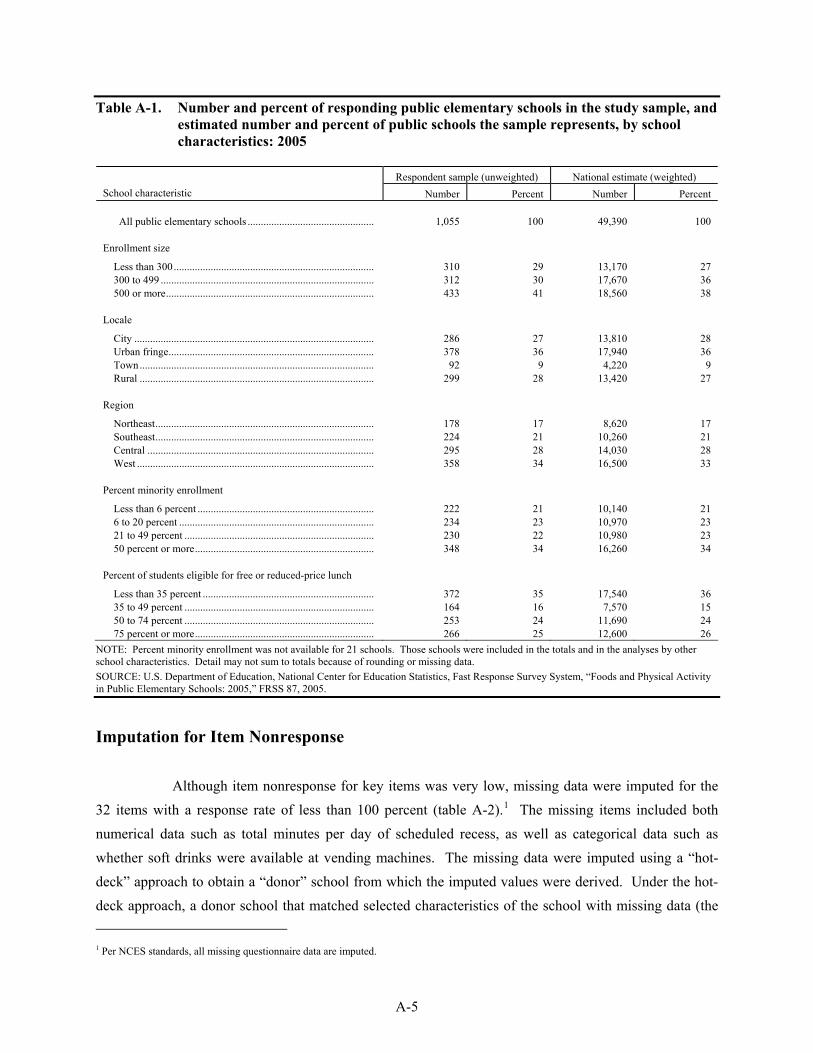
A-5
Table A-1. Number and percent of responding public elementary schools in the study sample, and estimated number and percent of public schools the sample represents, by school characteristics: 2005
Respondent sample (unweighted) National estimate (weighted)
School characteristic Number Percent Number Percent All public elementary schools ................................................ 1,055 100 49,390 100 Enrollment size
Less than 300............................................................................ 310 29 13,170 27 300 to 499 ................................................................................. 312 30 17,670 36 500 or more............................................................................... 433 41 18,560 38 Locale
City ........................................................................................... 286 27 13,810 28 Urban fringe.............................................................................. 378 36 17,940 36 Town......................................................................................... 92 9 4,220 9 Rural ......................................................................................... 299 28 13,420 27 Region
Northeast................................................................................... 178 17 8,620 17 Southeast................................................................................... 224 21 10,260 21 Central ...................................................................................... 295 28 14,030 28 West .......................................................................................... 358 34 16,500 33 Percent minority enrollment
Less than 6 percent ................................................................... 222 21 10,140 21 6 to 20 percent .......................................................................... 234 23 10,970 23 21 to 49 percent ........................................................................ 230 22 10,980 23 50 percent or more.................................................................... 348 34 16,260 34 Percent of students eligible for free or reduced-price lunch
Less than 35 percent ................................................................. 372 35 17,540 36 35 to 49 percent ........................................................................ 164 16 7,570 15 50 to 74 percent ........................................................................ 253 24 11,690 24 75 percent or more.................................................................... 266 25 12,600 26
NOTE: Percent minority enrollment was not available for 21 schools. Those schools were included in the totals and in the analyses by other school characteristics. Detail may not sum to totals because of rounding or missing data. SOURCE: U.S. Department of Education, National Center for Education Statistics, Fast Response Survey System, “Foods and Physical Activity in Public Elementary Schools: 2005,” FRSS 87, 2005.
Imputation for Item Nonresponse
Although item nonresponse for key items was very low, missing data were imputed for the 32 items with a response rate of less than 100 percent (table A-2).1 The missing items included both numerical data such as total minutes per day of scheduled recess, as well as categorical data such as whether soft drinks were available at vending machines. The missing data were imputed using a “hot-deck” approach to obtain a “donor” school from which the imputed values were derived. Under the hot-deck approach, a donor school that matched selected characteristics of the school with missing data (the 1 Per NCES standards, all missing questionnaire data are imputed.

A-6
recipient school) was identified. The matching characteristics included enrollment size, percent of students in the school eligible for free or reduced-price lunch, and type of locale. In addition, relevant questionnaire items were used to form appropriate imputation groupings. Once a donor was found, it was used to obtain the imputed values for the school with missing data. For both categorical and numerical items, the imputed value was simply the corresponding value from the donor school. All missing items for a given school were imputed from the same donor. Table A-2. Number of cases with imputed data in the study sample, and number of cases with
imputed data the sample represents, by questionnaire item: 2005
Questionnaire item
Respondent sample
(unweighted)
National estimate
(weighted) q3a 100% fruit or vegetable juice in cafeteria/lunchroom................................................. 3 134q3b Sports or fruit drinks that are not 100% juice in cafeteria/lunchroom........................ 1 38q3c Soft drinks in cafeteria/lunchroom ............................................................................. 1 45q3d Bottled water in cafeteria/lunchroom ......................................................................... 2 85q3e Low-fat or skim milk in cafeteria/lunchroom............................................................. 1 38q3f Milk that is not low fat or skim in cafeteria/lunchroom ............................................. 1 41q3g Yogurt in cafeteria/lunchroom.................................................................................... 3 137q3i French fried potatoes in cafeteria/lunchroom ............................................................. 3 137q3j Green salad or fruit in cafeteria/lunchroom................................................................ 2 83q3k Candy in cafeteria/lunchroom .................................................................................... 1 51q3m Salty snacks that are not low in fat in cafeteria/lunchroom ........................................ 6 292q3n Low-fat cookies/baked goods in cafeteria/lunchroom................................................ 1 59q3o Cookies/baked goods not low in fat in cafeteria/lunchroom....................................... 1 43q5a 100% fruit or vegetable juice in vending machines.................................................... 1 51q5e Candy in vending machines........................................................................................ 1 41q7e Candy in school store/snack bar ................................................................................. 1 43q7h Low-fat cookies/baked goods in school store/snack bar............................................. 1 34q12ddays Number of days per week of recess scheduled for grade 4......................................... 1 46q12edays Number of days per week of recess scheduled for grade 5......................................... 1 46q12dtime Number of times per day of recess scheduled for grade 4 .......................................... 1 46q12etime Number of times per day of recess scheduled for grade 5 .......................................... 1 46q12amin Total minutes per day for recess for grade 1 .............................................................. 1 41q12bmin Total minutes per day for recess for grade 2 .............................................................. 1 41q12cmin Total minutes per day for recess for grade 3 .............................................................. 1 41q12dmin Total minutes per day for recess for grade 4 .............................................................. 2 86q12emin Total minutes per day for recess for grade 5 .............................................................. 2 86q12fmin Total minutes per day for recess for grade 6 .............................................................. 1 41q14d Participate in President’s Challenge Physical Activity and Fitness Award program.. 4 210q15ccol1 How often students’ body mass index is calculated in elementary grades ................. 1 51q15acol2 Height information is sent to parents.......................................................................... 5 209q15bcol2 Weight information is sent to parents......................................................................... 5 204q15ccol2 Body mass index information is sent to parents ......................................................... 2 89NOTE: Data were imputed using hot-deck imputation procedures.
SOURCE: U.S. Department of Education, National Center for Education Statistics, Fast Response Survey System (FRSS), “Foods and Physical Activity in Public Elementary Schools: 2005,” FRSS 87, 2005.

A-7
Data Reliability
While the Foods and Physical Activity survey was designed to account for sampling error and to minimize nonsampling error, estimates produced from the data collected are subject to both types of error. Sampling error occurs because the data are collected from a sample rather than a census of the population, and nonsampling errors are errors made during the collection and processing of the data.
Sampling Errors
The responses were weighted to produce national estimates (table A-1). The weights were designed to adjust for the variable probabilities of selection and differential nonresponse. The findings in this report are estimates based on the sample selected and, consequently, are subject to sampling variability. General sampling theory was used to estimate the sampling variability of the estimates and to test for statistically significant differences between estimates.
The standard error is a measure of the variability of an estimate due to sampling. It indicates
the variability of a sample estimate that would be obtained from all possible samples of a given design and size. Standard errors are used as a measure of the precision expected from a particular sample. If all possible samples were surveyed under similar conditions, intervals of 1.96 standard errors below to 1.96 standard errors above a particular statistic would include the true population parameter being estimated in about 95 percent of the samples. This is a 95 percent confidence interval. For example, the estimated percentage of public elementary schools that sold foods to generate funds is 36.3 percent, and the standard error is 1.5 percent (tables 2 and 2a). The 95 percent confidence interval for the statistic extends from [36.3 – (1.5 x 1.96)] to [36.3 + (1.5 x 1.96)], or from 33.4 to 39.2 percent. The 1.96 is the critical value for a statistical test at the 0.05 significance level (where 0.05 indicates the 5 percent of all possible samples that would be outside the range of the confidence interval).
Because the data from the FRSS foods and physical activity survey were collected using a
complex sampling design, the variances of the estimates from this survey (e.g., estimates of proportions) are typically different from what would be expected from data collected with a simple random sample. Not taking the complex sample design into account can lead to an underestimation of the standard errors associated with such estimates. To generate accurate standard errors for the estimates in this report, standard errors were computed using a technique known as jackknife replication. As with any replication method, jackknife replication involves constructing a number of subsamples (replicates) from the full sample and computing the statistic of interest for each replicate. The mean square error of the replicate estimates around the full sample estimate provides an estimate of the variance of the statistic. To
A-8
construct the replications, 50 stratified subsamples of the full sample were created and then dropped 1 at a time to define 50 jackknife replicates. A computer program (WesVar) was used to calculate the estimates of standard errors. WesVar is a stand-alone Windows application that computes sampling errors from complex samples for a wide variety of statistics (totals, percents, ratios, log-odds ratios, general functions of estimates in tables, linear regression parameters, and logistic regression parameters).
Nonsampling Errors
Nonsampling error is the term used to describe variations in the estimates that may be caused by population coverage limitations and data collection, processing, and reporting procedures. The sources of nonsampling errors are typically problems like unit and item nonresponse, differences in respondents’ interpretations of the meaning of questions, response differences related to the particular time the survey was conducted, and mistakes made during data preparation. It is difficult to identify and estimate either the amount of nonsampling error or the bias caused by this error. To minimize the potential for nonsampling error, this study used a variety of procedures, including a pretest of the questionnaire with principals of elementary schools. The pretest provided the opportunity to check for consistency of interpretation of questions and definitions and to eliminate ambiguous items. The questionnaire and instructions were also extensively reviewed by NCES. In addition, manual and machine editing of the questionnaire responses were conducted to check the data for accuracy and consistency. Cases with missing or inconsistent items were recontacted by telephone to resolve problems. Data were keyed with 100 percent verification for surveys received by mail, fax, or telephone.
Definitions of Analysis Variables
Many of the school characteristics, described below, may be related to each other. For example, school enrollment size and locale are related, with city schools typically being larger than rural schools. Other relationships between these analysis variables may exist. However, this E.D. TAB report focuses on bivariate relationships between the analysis variables and questionnaire variables rather than more complex analyses. Enrollment Size – This variable indicates the total number of students enrolled in the school based on data from the 2002–03 CCD. The variable was collapsed into the following three categories:
Less than 300 students (small) 300 to 499 students (medium) 500 or more students (large)

A-9
School Locale – This variable indicates the type of community in which the school is located, as defined in the 2002–03 CCD (which uses definitions based on U.S. Census Bureau classifications). This variable was based on the eight-category locale variable from CCD, recoded into a four-category analysis variable for this report. Large and midsize cities were coded as city, the urban fringes of large and midsize cities were coded as urban fringe, large and small towns were coded as town, and rural areas outside and inside Metropolitan Statistical Areas (MSAs) were coded as rural. The categories are described in more detail below.
City – A large or midsize central city of a Consolidated Metropolitan Statistical Area (CMSA) or Metropolitan Statistical Area (MSA). Urban fringe – Any incorporated place, Census-designated place, or non-place territory within a CSMA or MSA of a large or midsize city, and defined as urban by the Census Bureau. Town – Any incorporated place or Census-designated place with a population greater than or equal to 2,500 and located outside a CMSA or MSA. Rural – Any incorporated place, Census-designated place, or non-place territory defined as rural by the Census Bureau.
Region – This variable classifies schools into one of the four geographic regions used by the Bureau of Economic Analysis of the U.S. Department of Commerce, the National Assessment of Educational Progress, and the National Education Association. Data were obtained from the 2002–03 CCD School Universe file. The geographic regions are:
Northeast – Connecticut, Delaware, District of Columbia, Maine, Maryland, Massachusetts, New Hampshire, New Jersey, New York, Pennsylvania, Rhode Island, and Vermont Southeast – Alabama, Arkansas, Florida, Georgia, Kentucky, Louisiana, Mississippi, North Carolina, South Carolina, Tennessee, Virginia, and West Virginia Central – Illinois, Indiana, Iowa, Kansas, Michigan, Minnesota, Missouri, Nebraska, North Dakota, Ohio, South Dakota, and Wisconsin West – Alaska, Arizona, California, Colorado, Hawaii, Idaho, Montana, Nevada, New Mexico, Oklahoma, Oregon, Texas, Utah, Washington, and Wyoming
Percent Minority Enrollment – This variable indicates the percentage of students enrolled in the school whose race or ethnicity is classified as one of the following: American Indian or Alaska Native, Asian or Pacific Islander, non-Hispanic Black, or Hispanic, based on data in the 2002–03 CCD School Universe file. Data on this variable were missing for 21 schools; schools with missing data were excluded from all analyses by percent minority enrollment. The percent minority enrollment variable was collapsed into the following four categories:
Less than 6 percent minority 6 to 20 percent minority 21 to 49 percent minority 50 percent or more minority

A-10
Percent of Students Eligible for Free or Reduced-Price Lunch—This variable was based on responses to question 16 on the survey questionnaire; if it was missing from the questionnaire (3.9 percent of all cases), it was obtained from the 2002–03 CCD School Universe File. This item served as a measurement of the concentration of poverty at the school. The categories are:
Less than 35 percent 35 to 49 percent 50 to 74 percent 75 percent or more
Contact Information For more information about the survey, contact Bernie Greene, Early Childhood, International, and
Crosscutting Studies Division, National Center for Education Statistics, Institute of Education Sciences, U.S. Department of Education, 1990 K Street NW, Washington, DC 20006, e-mail: [email protected]; telephone (202) 502-7348.

B-1
Appendix B
Questionnaire

B-2
This page intentionally left blank.

B-3
U.S. DEPARTMENT OF EDUCATION FORM APPROVED NATIONAL CENTER FOR EDUCATION STATISTICS O.M.B. No.: 1850–0733 WASHINGTON, D.C. 20006-5651 EXPIRATION DATE: 09/2006 Foods and Physical Activity in Public Elementary Schools: 2005 FAST RESPONSE SURVEY SYSTEM This survey is authorized by law (P.L. 103-382). While you are not required to respond, your cooperation is needed to make the results of this survey comprehensive, accurate, and timely.
Focus of Survey This survey focuses on two topics: availability of foods, and opportunities for physical activity for students at your school. Please note that in this survey:
• The term “foods” is used broadly to include both foods and beverages. • Before- and after-school activities refer only to school-sponsored activities. • Questions 12 through 15 ask for information only for elementary grades above kindergarten (typically
grades 1 through 5 or 6), even though your school may have higher or lower grades. • Physical education refers to class time that is spent teaching a physical education curriculum, excluding
regularly scheduled recess and instruction on physical activity topics that are part of health education or any other subject.
LABEL
IF ABOVE INFORMATION IS INCORRECT, PLEASE MAKE CORRECTIONS DIRECTLY ON LABEL. Name of person completing form:______________________________________ Telephone: _______________________________ Title/position:______________________________________________________ E-mail: __________________________________ Best days and times to reach you (in case of questions): ______________________________________________________________
THANK YOU. PLEASE KEEP A COPY OF THE COMPLETED SURVEY FOR YOUR FILES.
PLEASE RETURN COMPLETED FORM TO: IF YOU HAVE ANY QUESTIONS, CONTACT: WESTAT Basmat Parsad Attention: Parsad 8096.03.03 800-937-8281, ext. 8222 1650 Research Boulevard Fax: 800-254-0984 Rockville, Maryland 20850 E-mail: [email protected] According to the Paperwork Reduction Act of 1995, no persons are required to respond to a collection of information unless it displays a valid OMB control number. The valid OMB control number for this information is 1850–0733. The time required to complete this information collection is estimated to average 30 minutes per response, including the time to review instructions, search existing data resources, gather the data needed, and complete and review the information collected. If you have any comments concerning the accuracy of the time estimate(s) or suggestions for improving this form, please write to: U.S. Department of Education, Washington, D.C. 20202–4651. If you have comments or concerns regarding the status of your individual submission of this form, write directly to: National Center for Education Statistics, 1990 K Street, N.W., Washington, D.C. 20006 FRSS Form No. 87, 03/2005

B-4
Questions 1 through 11 ask about the availability of food services or foods at your school. Please note: (a) the term “foods” is used broadly to include both foods and beverages; and (b) before- and after-school activities refer only to school-sponsored activities.
1. Does your school offer any food service (e.g., school meals, a la carte items, or vending machine foods) in a cafeteria or lunchroom? Please include the service of both foods and beverages in the cafeteria or lunchroom.
Yes ................... 1 (Continued with question 2.) No .................... 2 (Skip to question 4.)
2. Does your school offer full school meals (i.e., School Breakfast Program or National School Lunch Program) to any students? Include free, reduced-price, and full-price school meals.
Yes ................... 1 No .................... 2
3. Indicate whether students can purchase the following foods separate from full school meals (e.g., as a la carte foods or from vending machines) during mealtimes in the school cafeteria/lunchroom. (Circle one on each line.)
Yes No a. 100% fruit or vegetable juice .................................................................................... 1 2 b. Sports drinks or fruit drinks that are not 100% juice ................................................ 1 2 c. Soft drinks................................................................................................................. 1 2 d. Bottled water............................................................................................................. 1 2 e. Low-fat or skim milk .................................................................................................. 1 2 f. Milk that is not low fat or skim .................................................................................. 1 2 g. Yogurt ....................................................................................................................... 1 2 h. Ice cream or frozen yogurt........................................................................................ 1 2 i. French fried potatoes................................................................................................ 1 2 j. Green salad or fruit ................................................................................................... 1 2 k. Candy........................................................................................................................ 1 2 l. Low-fat salty snacks (e.g., pretzels and baked or other low-fat chips).................... 1 2 m. Salty snacks that are not low in fat (e.g., regular potato chips and cheese puffs)... 1 2 n. Low-fat cookies, cakes, pastries, and other baked goods........................................ 1 2 o. Cookies, cakes, pastries, and other baked goods that are not low in fat ............... 1 2
4. When are vending machine foods available to students in the school? Consider foods that are available before, during, or after school (including before- and after-school activities and programs). (Circle all that apply.)
Never.................................................................................................................................... 1 (Skip to question 6.) At mealtimes ........................................................................................................................ 2 Other times during the school day ....................................................................................... 3 Outside of the school day (e.g., school-sponsored before- or after-school activities)......... 4 Other times (Please specify.)_______________________________________________ 5
5. Are the following vending machine foods available to students? Consider foods that are available before, during, or after school (including before- and after-school activities and programs). (Circle one on each line.)
Yes No a. 100% fruit or vegetable juice ................................................................................... 1 2 b. Sports drinks or fruit drinks that are not 100% juice ............................................... 1 2 c. Soft drinks................................................................................................................ 1 2 d. Bottled water............................................................................................................ 1 2 e. Candy....................................................................................................................... 1 2 f. Low-fat salty snacks (e.g., pretzels and baked or other low-fat chips)................... 1 2 g. Salty snacks that are not low in fat (e.g., regular potato chips and cheese puffs).. 1 2 h. Low-fat cookies, cakes, pastries, and other baked goods....................................... 1 2 i. Cookies, cakes, pastries, and other baked goods that are not low in fat ............... 1 2
6. When are school store or snack bar foods available to students in the school? Consider foods that are available before, during, or after school (including before- and after-school activities and programs). (Circle all that apply.)
Never.................................................................................................................................... 1 (Skip to question 8.) At mealtimes ........................................................................................................................ 2 Other times during the school day ....................................................................................... 3 Outside of the school day (e.g., school-sponsored before- or after-school activities)......... 4 Other times (Please specify.)_______________________________________________ 5

B-5
7. Are the following school store or snack bar foods available to students? Consider foods that are available before, during, or after school (including before- and after-school activities and programs). (Circle one on each line.)
Yes No a. 100% fruit or vegetable juice ................................................................................... 1 2 b. Sports drinks or fruit drinks that are not 100% juice ............................................... 1 2 c. Soft drinks................................................................................................................ 1 2 d. Bottled water............................................................................................................ 1 2 e. Candy....................................................................................................................... 1 2 f. Low-fat salty snacks (e.g., pretzels and baked or other low-fat chips)................... 1 2 g. Salty snacks that are not low in fat (e.g., regular potato chips and cheese puffs).. 1 2 h. Low-fat cookies, cakes, pastries, and other baked goods....................................... 1 2 i. Cookies, cakes, pastries, and other baked goods that are not low in fat ............... 1 2
8. Do any companies have a contract to sell drinks or snack foods at your school? Consider foods that are available to students before, during, or after school, including before- and after-school activities and programs.
Yes ......................................................................................................................... 1 (Continue with question 9.) No........................................................................................................................... 2 (Skip to question 10.) Don’t know ............................................................................................................. 3 (Skip to question 10.)
9. Are there agreements with those companies for your school or district to receive the following? (Circle one on each line.)
Yes No Don’t know
a. A specific percentage of the sales receipts .............................................................. 1 2 3 b. Sales incentives such as cash awards or donations of equipment or supplies for
a specified amount of sales receipts ........................................................................ 1 2 3 c. Other agreement (Please specify.)_____________________________________ 1 2 3
10. Consider the foods and beverages that students can buy separately from full school meals (e.g., foods sold a la carte in the cafeteria/lunchroom and foods sold at vending machines, school stores, and snack bars). Are any of these foods sold to generate funds to support food service operations at your school or district? (Circle one.)
Yes ....................................................................................................................................... 1 No......................................................................................................................................... 2 Don’t know ........................................................................................................................... 3 Not applicable; no foods or beverages sold separately from full school meals................... 4
11. Which of the following operates the food service operations at your school? (Circle one.)
Not applicable; no food service operations at this school.................................................... 1 Your school or school district ............................................................................................... 2 A private entity under contract to your school or school district .......................................... 3 Other entity (Please specify.)_______________________________________________ 4
For questions 12 through 15, please report only for elementary grades above kindergarten (typically grades 1 through 5 or 6), even though your school may have higher or lower grades.
12. Please provide the following information about scheduled recess during a typical week for elementary grades above kindergarten. If your school does not have any of the listed grades or does not consider a particular grade as elementary, leave that row blank. (See definition of elementary grades in box above.)
Grade How many days per week is
recess scheduled? (If none, enter “0.”)
How many times per day is recess scheduled? (If none, enter “0.”)
What is the total number of minutes per day for recess?
(If none, enter “0.”) a. Grade 1 b. Grade 2 c. Grade 3 d. Grade 4 e. Grade 5 f. Grade 6
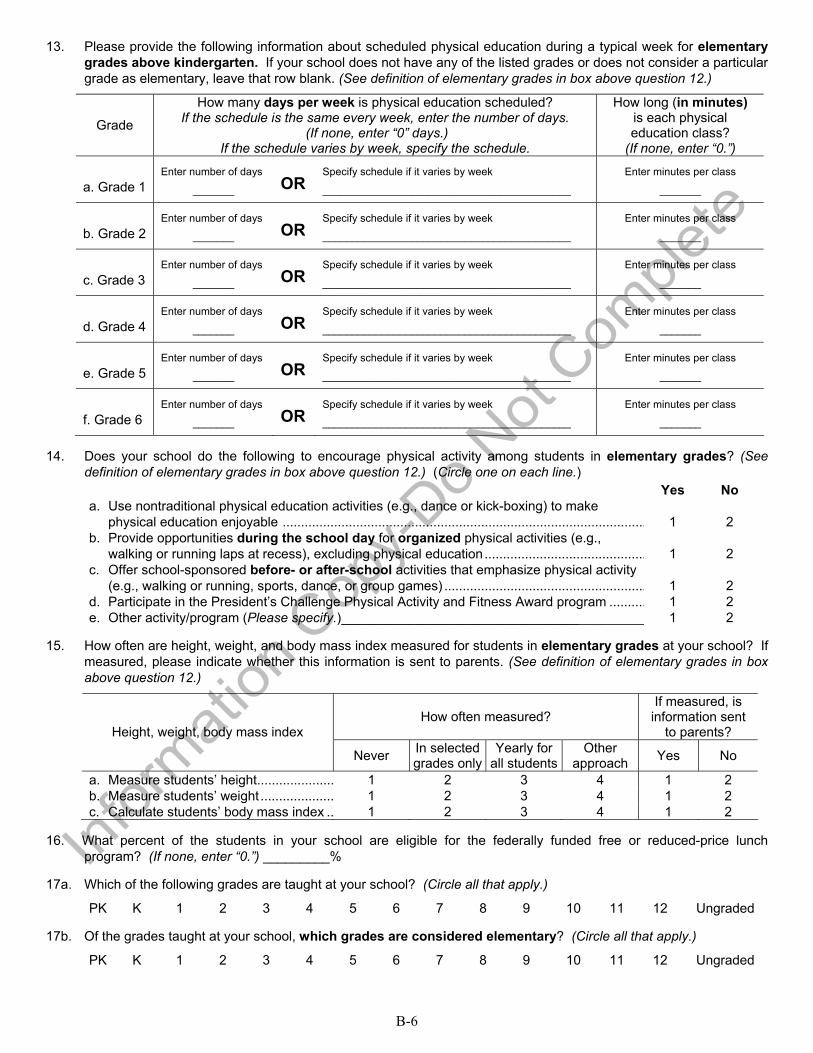
B-6
13. Please provide the following information about scheduled physical education during a typical week for elementary grades above kindergarten. If your school does not have any of the listed grades or does not consider a particular grade as elementary, leave that row blank. (See definition of elementary grades in box above question 12.)
Grade
How many days per week is physical education scheduled? If the schedule is the same every week, enter the number of days.
(If none, enter “0” days.) If the schedule varies by week, specify the schedule.
How long (in minutes) is each physical education class?
(If none, enter “0.”)
a. Grade 1 Enter number of days
_______ OR Specify schedule if it varies by week
__________________________________________
Enter minutes per class
_______
b. Grade 2 Enter number of days
_______ OR Specify schedule if it varies by week
__________________________________________
Enter minutes per class
_______
c. Grade 3 Enter number of days
_______ OR Specify schedule if it varies by week
__________________________________________
Enter minutes per class
_______
d. Grade 4 Enter number of days
_______ OR Specify schedule if it varies by week
__________________________________________
Enter minutes per class
_______
e. Grade 5 Enter number of days
_______ OR Specify schedule if it varies by week
__________________________________________
Enter minutes per class
_______
f. Grade 6 Enter number of days
_______ OR Specify schedule if it varies by week
__________________________________________
Enter minutes per class
_______
14. Does your school do the following to encourage physical activity among students in elementary grades? (See definition of elementary grades in box above question 12.) (Circle one on each line.) Yes No a. Use nontraditional physical education activities (e.g., dance or kick-boxing) to make
physical education enjoyable ................................................................................................... 1 2 b. Provide opportunities during the school day for organized physical activities (e.g.,
walking or running laps at recess), excluding physical education............................................ 1 2 c. Offer school-sponsored before- or after-school activities that emphasize physical activity
(e.g., walking or running, sports, dance, or group games) ....................................................... 1 2 d. Participate in the President’s Challenge Physical Activity and Fitness Award program .......... 1 2 e. Other activity/program (Please specify.)_________________________________________ 1 2
15. How often are height, weight, and body mass index measured for students in elementary grades at your school? If measured, please indicate whether this information is sent to parents. (See definition of elementary grades in box above question 12.)
How often measured? If measured, is information sent
to parents? Height, weight, body mass index
Never In selected grades only
Yearly for all students
Other approach Yes No
a. Measure students’ height..................... 1 2 3 4 1 2 b. Measure students’ weight .................... 1 2 3 4 1 2 c. Calculate students’ body mass index .. 1 2 3 4 1 2
16. What percent of the students in your school are eligible for the federally funded free or reduced-price lunch program? (If none, enter “0.”) _________%
17a. Which of the following grades are taught at your school? (Circle all that apply.)
PK K 1 2 3 4 5 6 7 8 9 10 11 12 Ungraded
17b. Of the grades taught at your school, which grades are considered elementary? (Circle all that apply.)
PK K 1 2 3 4 5 6 7 8 9 10 11 12 Ungraded