Embed Size (px)
Citation preview
U.S Department of Agriculture
Agricultural Outlook Forum 2003
February 20 & 21, 2003
THE CHANGING LANDSCAPE OF WORLD TEXTILE TRADE: CHALLENGES AND OPPORTUNITIES FOR U.S. COTTON
Julia Hughes Vice President
International Trade and Government Relations U.S. Association of Importers of Textiles and Apparel


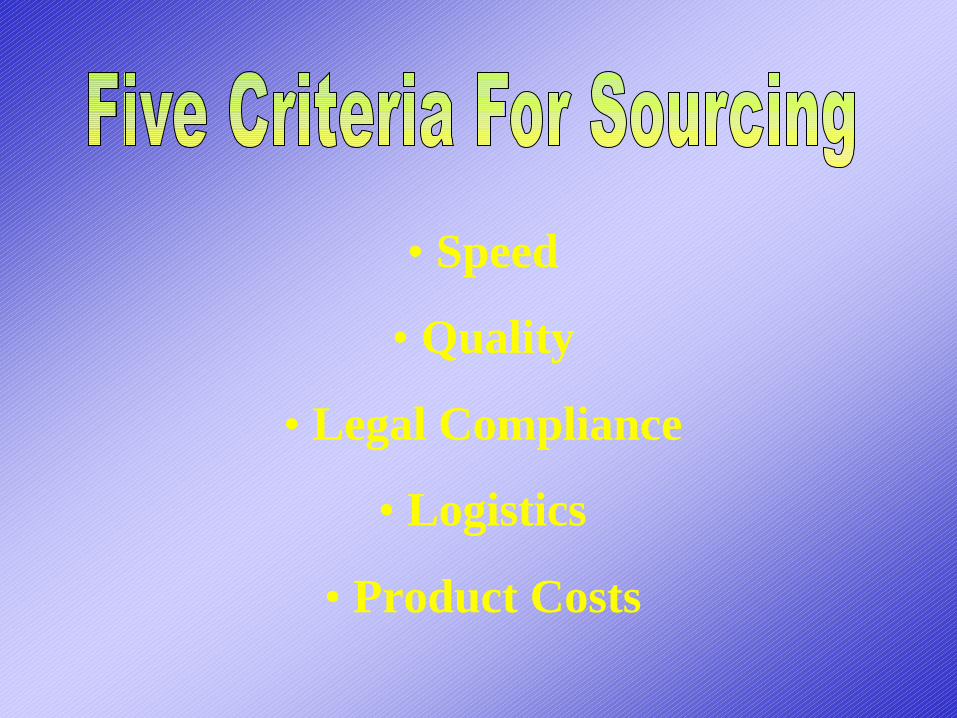
• Speed
• Quality
• Legal Compliance
• Logistics
• Product Costs

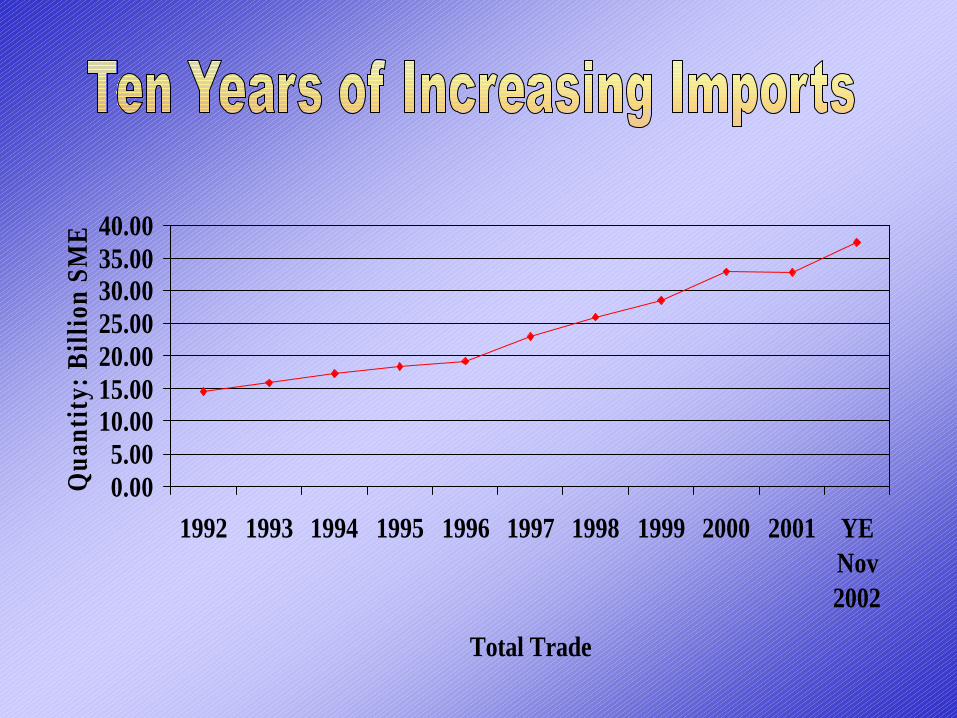
0.005.00
10.0015.0020.0025.0030.0035.0040.00
1992 1993 1994 1995 1996 1997 1998 1999 2000 2001 YENov2002
Total Trade
Qua
ntit
y: B
illio
n SM
E
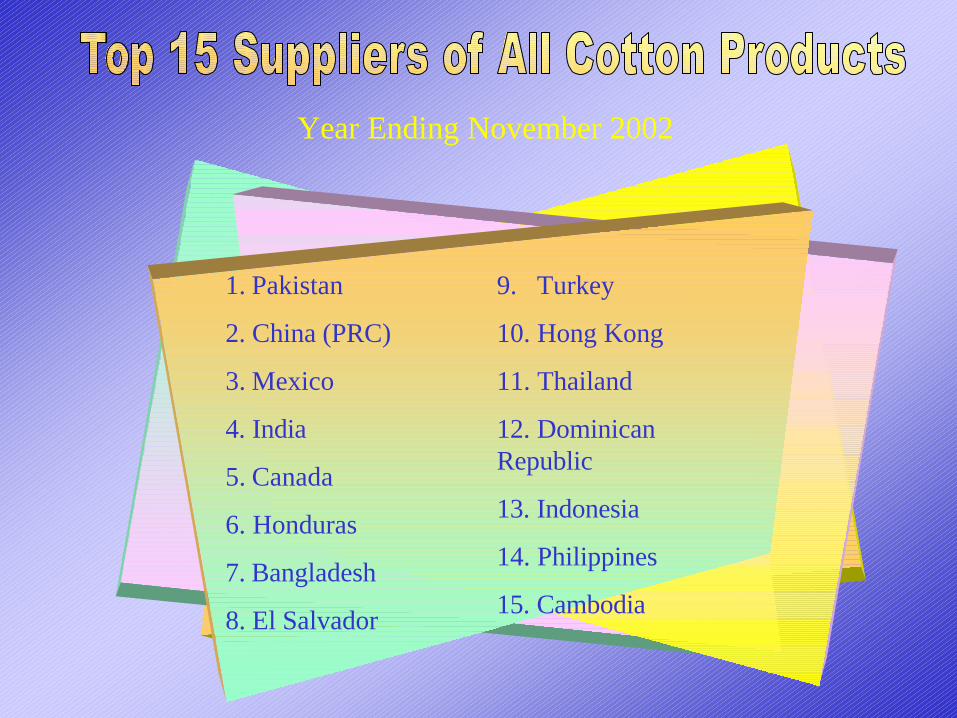
1. Pakistan
2. China (PRC)
3. Mexico
4. India
5. Canada
6. Honduras
7. Bangladesh
8. El Salvador
9. Turkey
10. Hong Kong
11. Thailand
12. Dominican Republic
13. Indonesia
14. Philippines
15. Cambodia
Year Ending November 2002
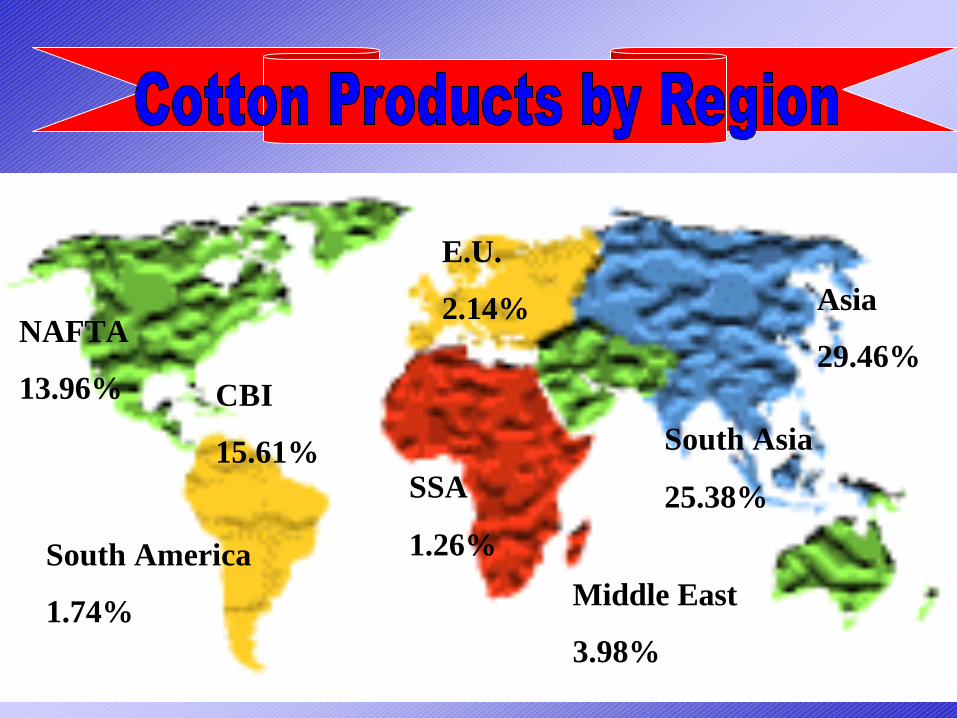
NAFTA
13.96% CBI
15.61%
South America
1.74%
E.U.
2.14%
SSA
1.26%
South Asia
25.38%
Asia
29.46%
Middle East
3.98%
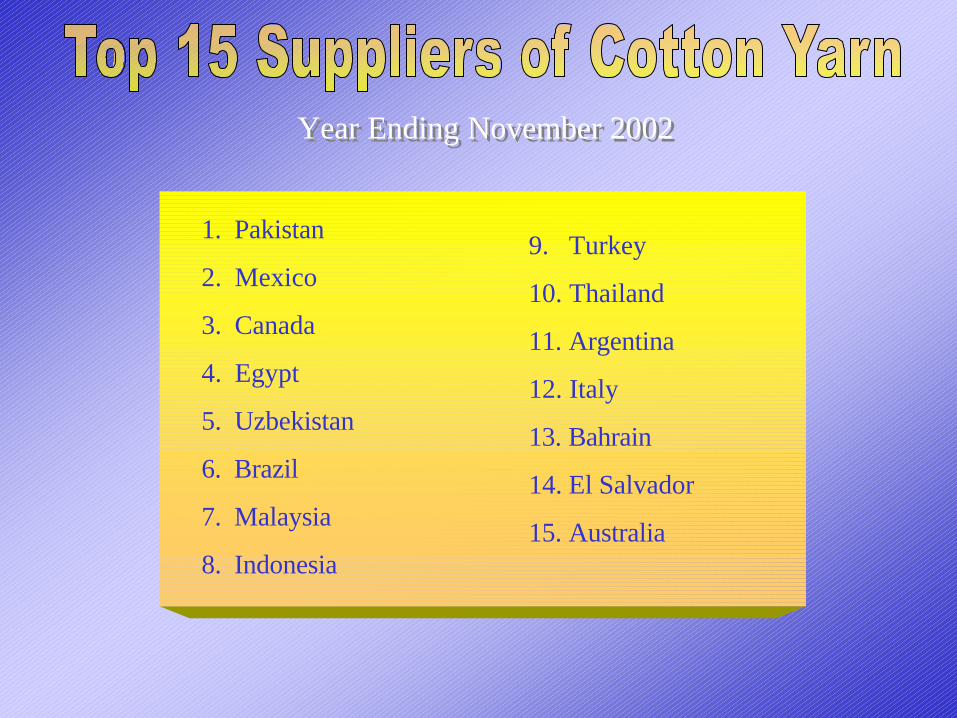
Year Ending November 2002Year Ending November 2002
1. Pakistan
2. Mexico
3. Canada
4. Egypt
5. Uzbekistan
6. Brazil
7. Malaysia
8. Indonesia
9. Turkey
10. Thailand
11. Argentina
12. Italy
13. Bahrain
14. El Salvador
15. Australia
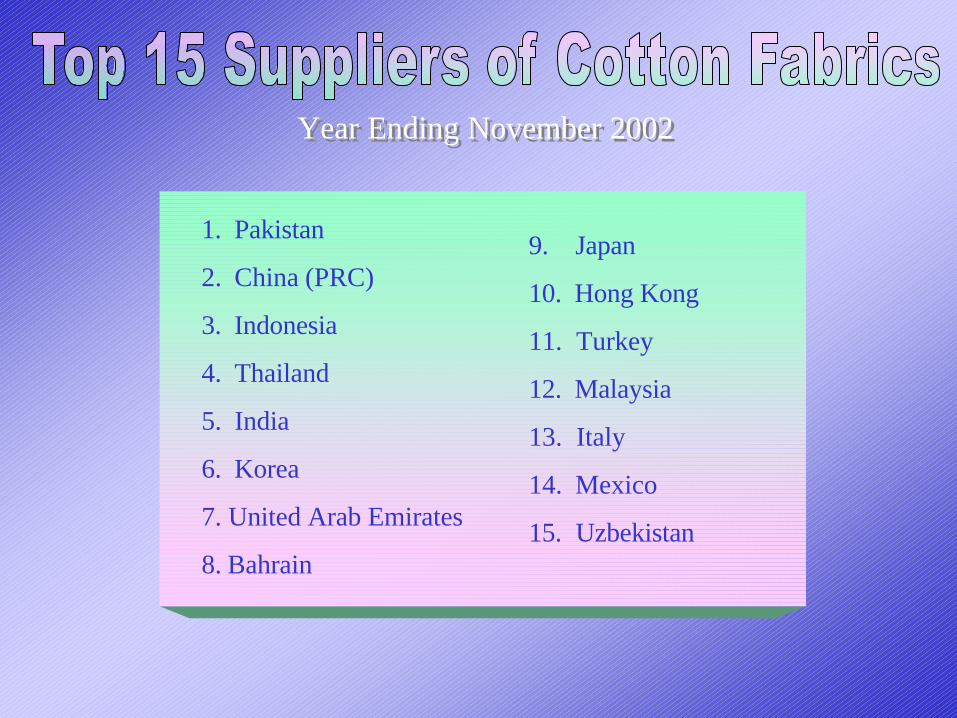
1. Pakistan
2. China (PRC)
3. Indonesia
4. Thailand
5. India
6. Korea
7. United Arab Emirates
8. Bahrain
9. Japan
10. Hong Kong
11. Turkey
12. Malaysia
13. Italy
14. Mexico
15. Uzbekistan
Year Ending November 2002Year Ending November 2002
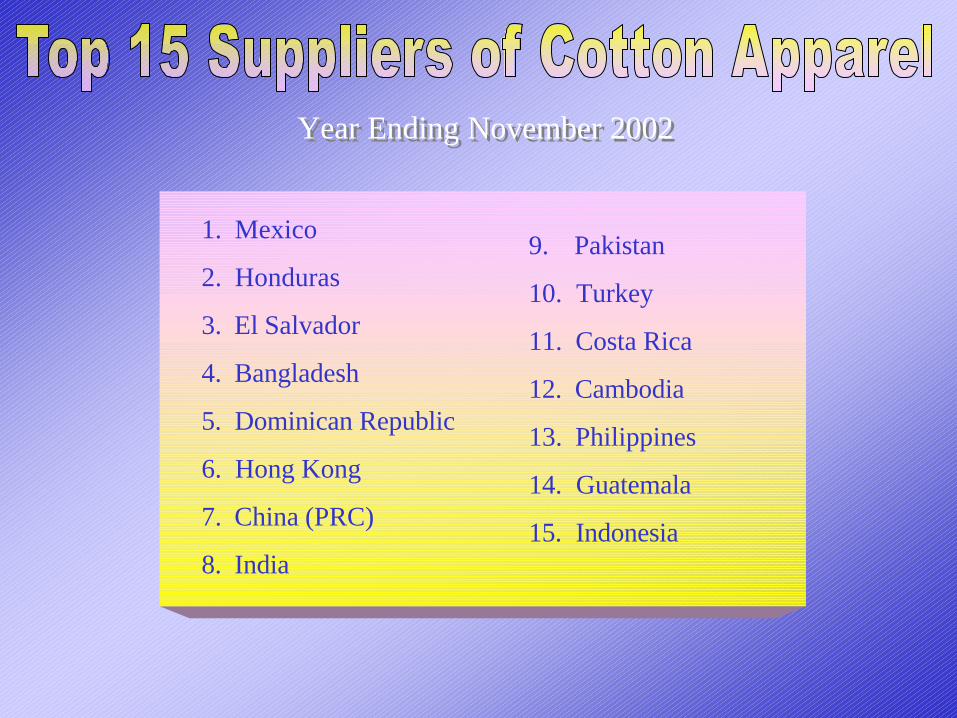
1. Mexico
2. Honduras
3. El Salvador
4. Bangladesh
5. Dominican Republic
6. Hong Kong
7. China (PRC)
8. India
9. Pakistan
10. Turkey
11. Costa Rica
12. Cambodia
13. Philippines
14. Guatemala
15. Indonesia
Year Ending November 2002Year Ending November 2002
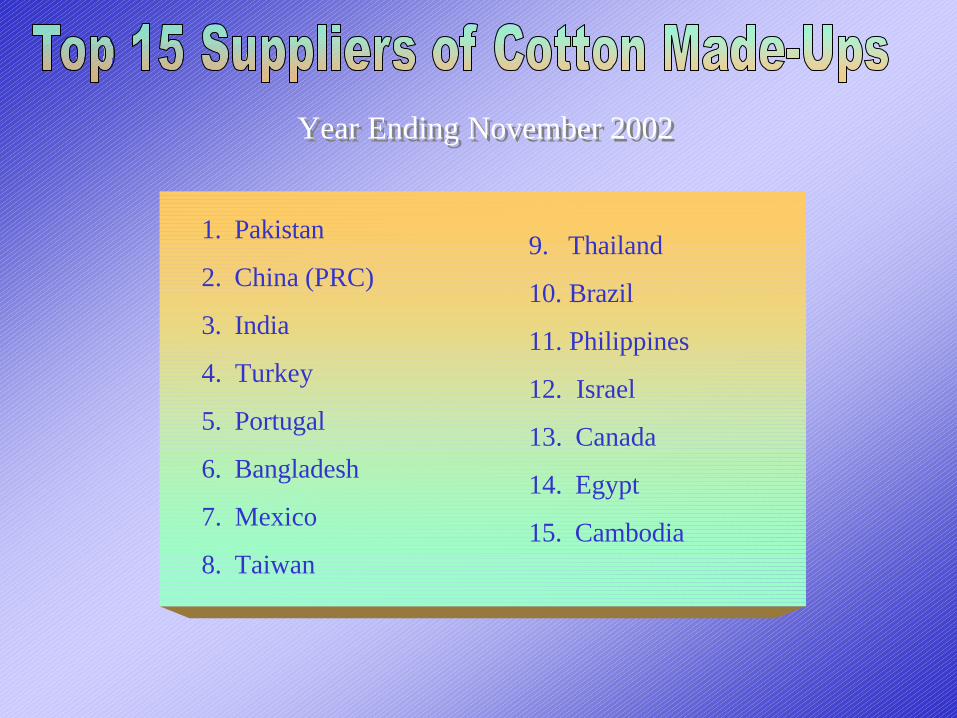
1. Pakistan
2. China (PRC)
3. India
4. Turkey
5. Portugal
6. Bangladesh
7. Mexico
8. Taiwan
9. Thailand
10. Brazil
11. Philippines
12. Israel
13. Canada
14. Egypt
15. Cambodia
Year Ending November 2002Year Ending November 2002
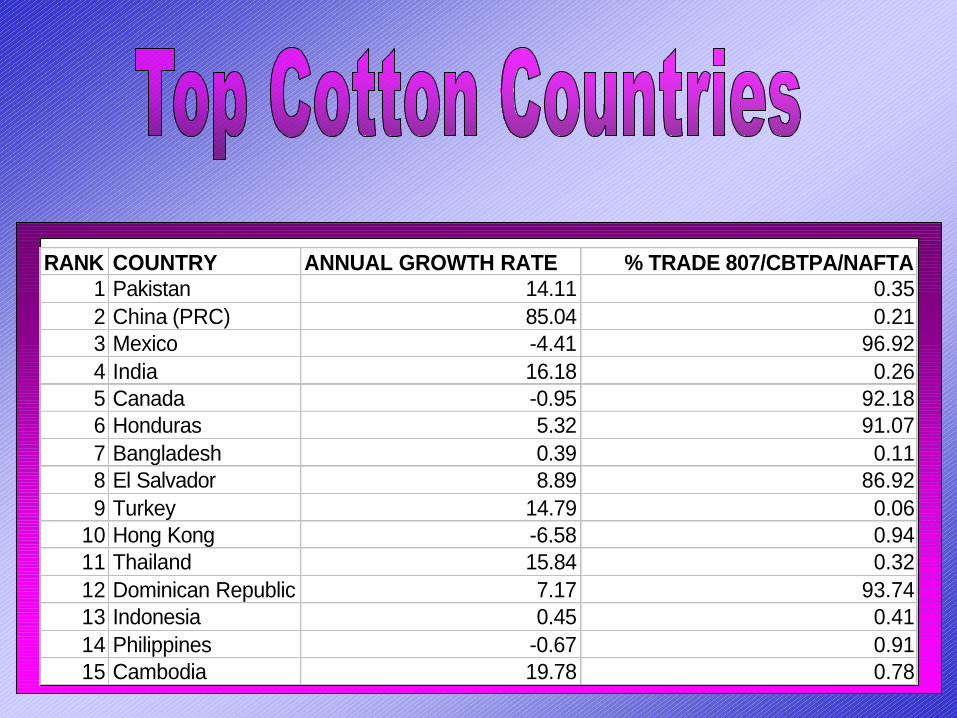
RANK COUNTRY ANNUAL GROWTH RATE % TRADE 807/CBTPA/NAFTA1 Pakistan 14.11 0.352 China (PRC) 85.04 0.213 Mexico -4.41 96.924 India 16.18 0.265 Canada -0.95 92.186 Honduras 5.32 91.077 Bangladesh 0.39 0.118 El Salvador 8.89 86.929 Turkey 14.79 0.06
10 Hong Kong -6.58 0.9411 Thailand 15.84 0.3212 Dominican Republic 7.17 93.7413 Indonesia 0.45 0.4114 Philippines -0.67 0.9115 Cambodia 19.78 0.78
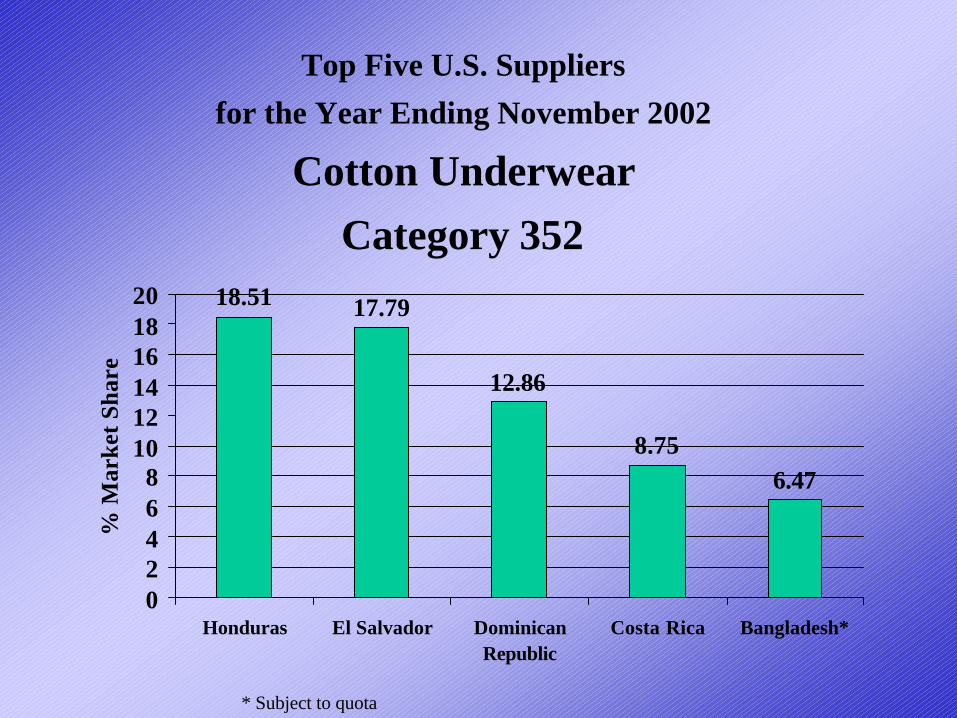
Top Five U.S. Suppliersfor the Year Ending November 2002
Cotton UnderwearCategory 352
18.51 17.79
12.86
8.756.47
02468
101214161820
Honduras El Salvador DominicanRepublic
Costa Rica Bangladesh*
% M
arke
t Sh
are
* Subject to quota
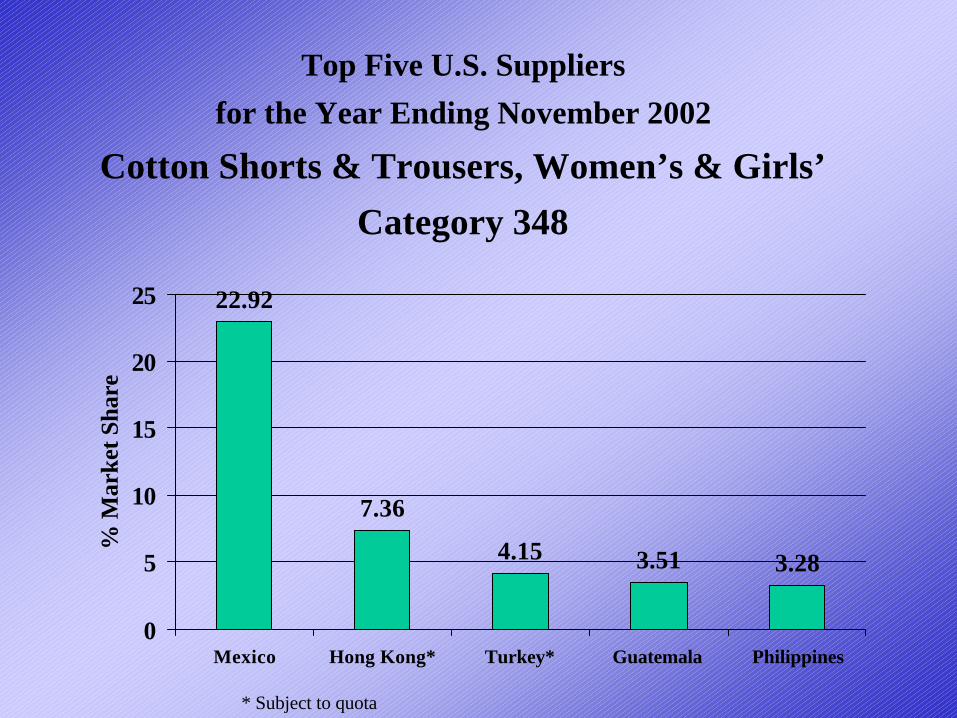
Top Five U.S. Suppliersfor the Year Ending November 2002
Cotton Shorts & Trousers, Women’s & Girls’Category 348
22.92
7.36
4.15 3.51 3.28
0
5
10
15
20
25
Mexico Hong Kong* Turkey* Guatemala Philippines
% M
arke
t Sha
re
* Subject to quota
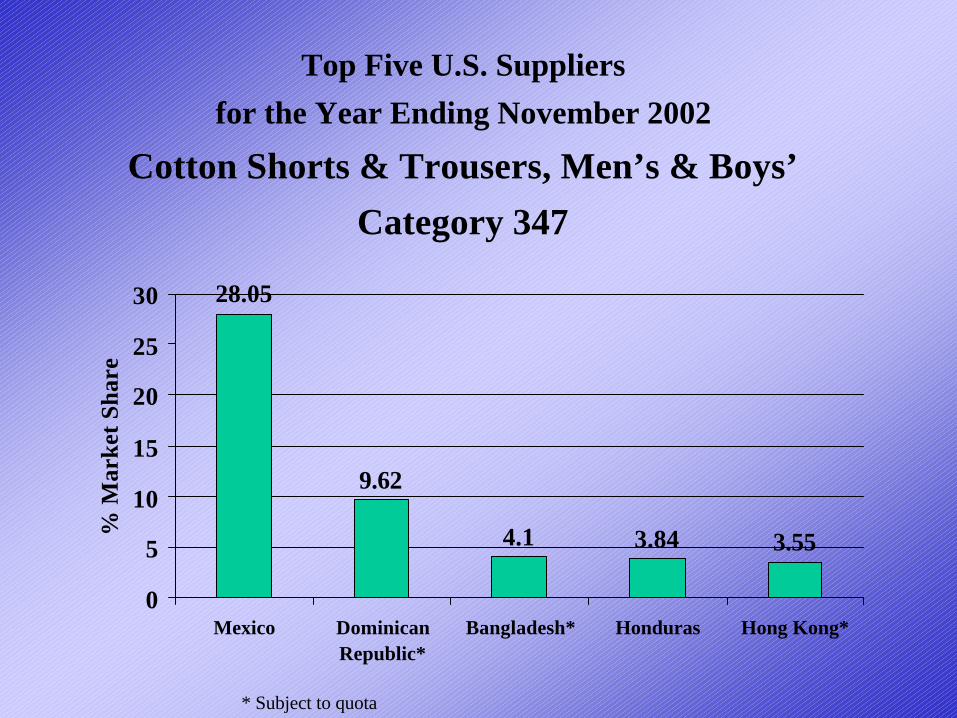
Top Five U.S. Suppliersfor the Year Ending November 2002
Cotton Shorts & Trousers, Men’s & Boys’Category 347
28.05
9.62
4.1 3.84 3.55
0
5
10
15
20
25
30
Mexico DominicanRepublic*
Bangladesh* Honduras Hong Kong*
% M
arke
t Sh
are
* Subject to quota
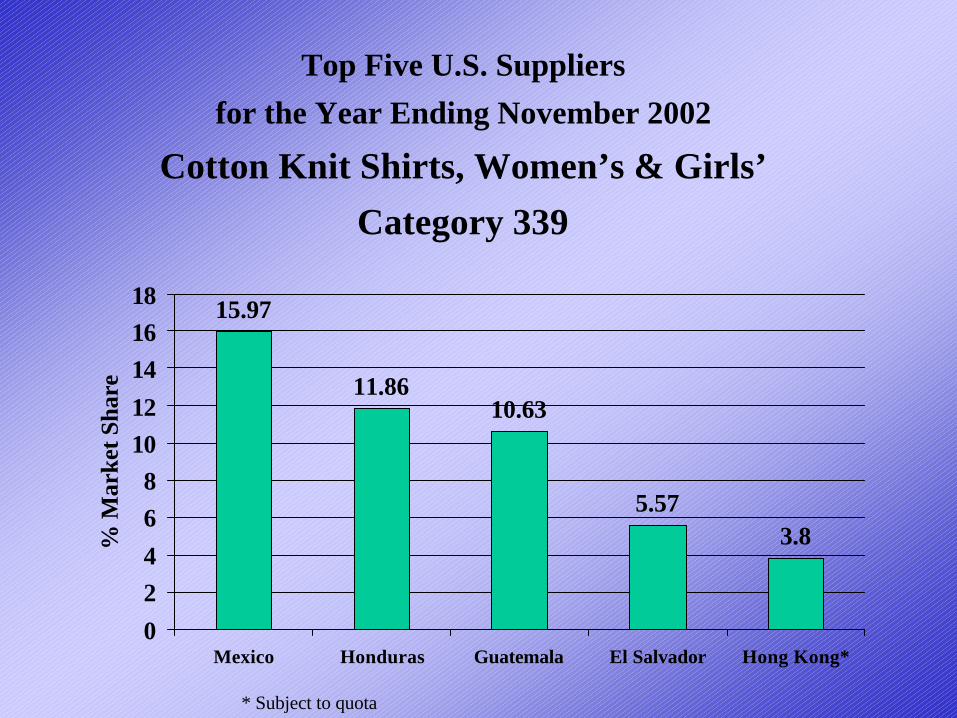
Top Five U.S. Suppliersfor the Year Ending November 2002
Cotton Knit Shirts, Women’s & Girls’Category 339
15.97
11.8610.63
5.573.8
02468
1012141618
Mexico Honduras Guatemala El Salvador Hong Kong*
% M
arke
t Sha
re
* Subject to quota
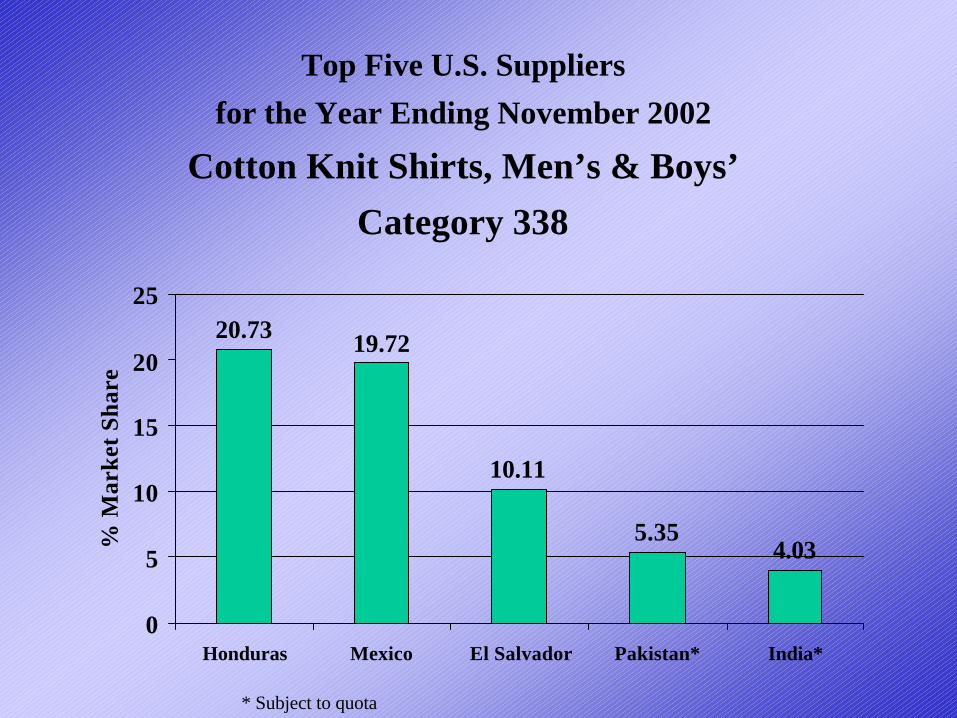
Top Five U.S. Suppliersfor the Year Ending November 2002
Cotton Knit Shirts, Men’s & Boys’Category 338
20.73 19.72
10.11
5.354.03
0
5
10
15
20
25
Honduras Mexico El Salvador Pakistan* India*
% M
arke
t Sh
are
* Subject to quota
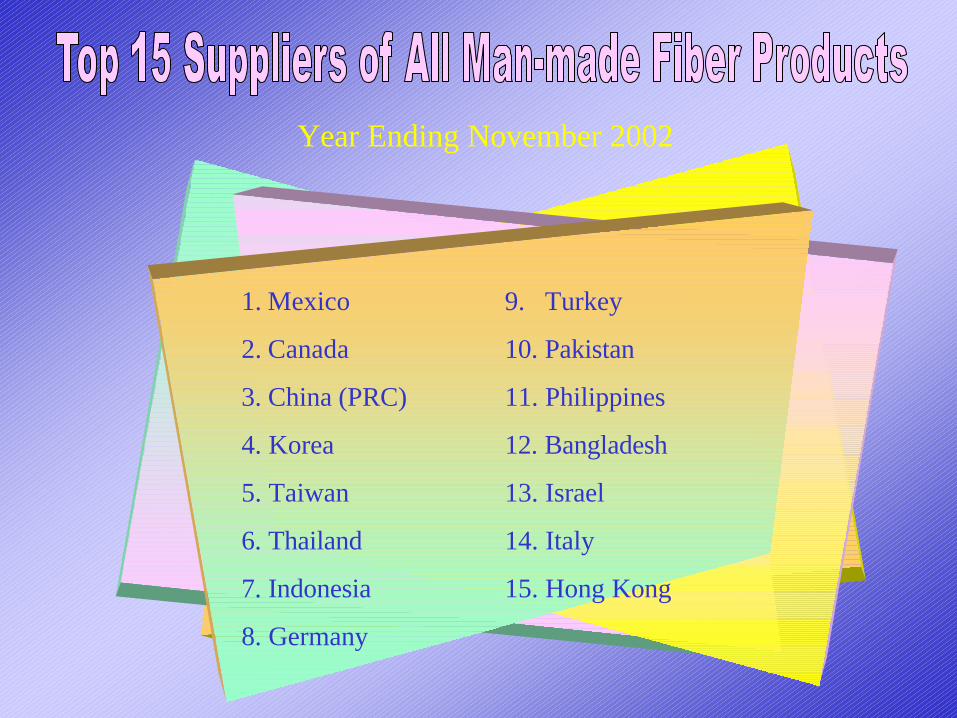
1. Mexico
2. Canada
3. China (PRC)
4. Korea
5. Taiwan
6. Thailand
7. Indonesia
8. Germany
9. Turkey
10. Pakistan
11. Philippines
12. Bangladesh
13. Israel
14. Italy
15. Hong Kong
Year Ending November 2002
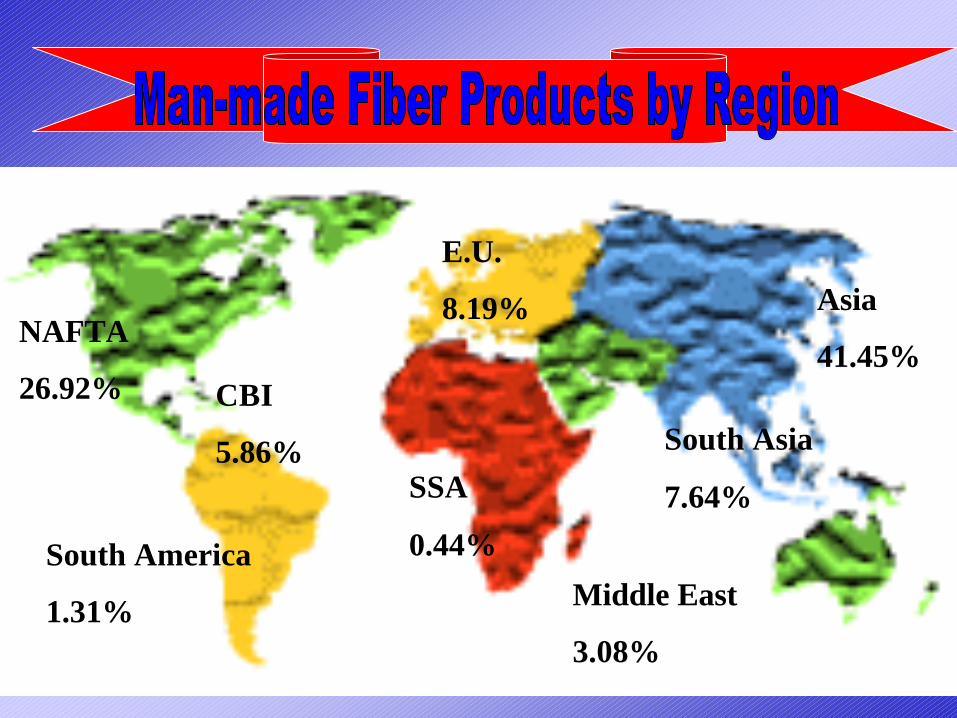
NAFTA
26.92% CBI
5.86%
South America
1.31%
E.U.
8.19%
SSA
0.44%
South Asia
7.64%
Asia
41.45%
Middle East
3.08%

n NAFTA
n CAFTA
n FTAA

n Must Sell U.S. Cotton to New Customers Around the Globe
n Customers Will Expect Quality and Price
n Be Prepared for Challenge from Synthetics