Embed Size (px)
Citation preview
Focused Assessment Program Exhibit 6A
U.S. Customs and Border ProtectionOffice of Strategic Trade
Regulatory Audit Division
Sampling Technical Guide
Introduction and Background
In March 2003, the U.S. Customs Service became part of the U.S. Customs and Border Protection, which will continue to be referenced as Customs in this document.
The high volume of Customs-related transactions makes an examination of all transactions impractical to perform. Sampling transactions allows conclusions to be drawn about an importer’s Customs operations without reviewing all transactions. The goal of sampling in regulatory audits is to be as efficient and effective as possible in reviewing those operations and transactions, determining compliance with Customs laws and regulations, and computing any loss of revenue to Customs.
Sampling may be statistical or nonstatistical (judgmental). Statistical sampling is an objective, defensible, reliable method that is commonly used to draw conclusions about an entire population or universe. As discussed in the Government Auditing Standards (Yellow Book), auditors should use statistical sampling and other aspects of quantitative analysis, when appropriate, to accomplish audit objectives. Statistical sampling requires random selection of sample items and statistical evaluation of sample results.Nonstatistical sampling relies on auditor judgment to select sample items and evaluate sample results.
This Exhibit includes 7 appendices and provides guidance for sampling in FocusedAssessments as well as other audits.
Appendix I, Sampling Steps – a step by step narrative process for sampling invarious Regulatory audits.
Appendix II, Sampling Methodology Diagram – a pictorial quick reference of sampling methodology for sampling in various Regulatory audits.
Appendix III, Focused Assessment (FA) Sampling Methodology Table – a quick reference of sampling methodology for FA audits.
Appendix IV, Sampling Plans – standard sampling plan forms for various types of sampling in various Regulatory audits.
Appendix V, Example Audit Report Tables – examples of tables to be used in any Regulatory audit report to display sampling information.
1October 31, 2004

Focused Assessment Program Exhibit 6A
Appendix VI, Glossary of Sampling Terms – definitions of frequently used sampling terms.
Appendix VII, Reading List for Audit Sampling – references to publications for those wishing to learn more about sampling in audits.
Procedures
Sampling Techniques
1. Nonstatistical (Judgmental) Sampling
Nonstatistical or judgmental sampling may be used in certain circumstances when statistical results are not needed, there is a high degree of certainty that a conclusion can be drawn without further sampling, and:
the purpose is to take a survey in order to determine the necessity for and extent of substantive tests (e.g., FA Pre-Assessment Survey);
there is a desire to concentrate audit effort in a specific problem area revealed by a previous sample or other source of information (e.g., FA Follow-Up);
the universe is very small and it would be quicker and easier to review all or most of the items in the universe; or
the area is very sensitive and there is no room for error (i.e., exact results are required and a 100 percent is review necessary).
Nonstatistical sampling is the appropriate method for reviewing transactions of particular interest or concern to determine whether more extensive testing is needed. For example, selective limited sampling of items in an account may be used to determine or verify the nature of the account.
2. Statistical Sampling
Statistical sampling will be used in all other circumstances where nonstatistical sampling is not appropriate.
Variable sampling will be used in most cases where statistical sampling is appropriate (e.g., most review areas in FA Assessment Compliance Testing).Variable sampling can be physical unit sampling (selecting physical items or transactions) or dollar unit sampling (selecting dollars which are then tied to physical items or transactions for review).
Attribute discovery sampling may be more appropriate for certain unique audit areas, such as tests for transshipment or undeclared ADD/CVD (anti-dumping duties/counter-veiling duties).
2October 31, 2004

Focused Assessment Program Exhibit 6A
Sample Results Evaluation
1. Compliance
Compliance determinations for FAs will generally be based on the value of systemic errors found in the sample. Appendix IV of this document and FA Program Exhibit3F contain specific guidance regarding compliance determinations.
2. Revenue
Loss of revenue estimates will be based on the most accurate information available (actual amounts if known, statistical projections, etc.).
If statistical sampling is used, the desired confidence level for revenue projections will be 95 percent. Precision percentages will be calculated to choose the most accurate projection when multiple point estimates are produced. The point estimate with the lowest precision percentage will be used, if the precision percentage is acceptable. If the precision percentages are poor, additional or alternative procedures may be necessary to estimate the revenue due. Appendices I and IV contain guidance on the projection of revenue loss.
Generally, projections of sample results should be limited to the universe from which the sample was drawn. Items examined in one universe may not be representative of other universes and projecting to other universes would not be statistically defensible. However, auditors may express their opinion and make nonstatistical applications if they believe the results apply to another universe.
3. Enforcement Referrals
Referral estimates for enforcement will be based on the most accurate information available (actual amounts if known, statistical projections, etc.). Appendices I and IV contain guidance on the enforcement referral estimates.
Sample Documentation
Audit documentation will fully and clearly document all aspects of the sampling that was used. For each sample, the audit documentation will include as a minimum:
A sampling plan which documents important elements of the sampling methodology and results. (Standard sampling plans are contained in Appendix IV.)
The sampling frame itself.
The procedures used to validate and analyze the sampling frame.
The sample size determination.
The random numbers/procedure (for statistical samples) or other methodology(for nonstatistical samples) used to select the sample items.
3October 31, 2004

Focused Assessment Program Exhibit 6A
4October 31, 2004
The selected sample items and the review of the sample items.
The evaluation of the sample results (conclusions, projections).
Any other documentation produced during the planning, selection, review, or evaluation of samples.
NOTE: The sampling plans include sections for various phases of the sampling process.The sections of the sampling plans can be separated as necessary and included in audit documentation as each phase of the sampling process is completed. For example one phase might include Sampling Application, Sampling Approach and Universe and Frame Information and Sample Information. The AFD must approve these sample sections before the sample is taken. The sections for Sample Results may be included in another set of documentation. The auditors should develop the various sections of the plan and document sampling phases as they occur but all phases of the sampling process should be documented using all the sections of the sampling plans. This will result in documenting the sampling plans in different sections of the automated documentation. In addition, this will allow supervisors to timely review and approve the planning sections of the sampling plan. As an alternative, the auditor could include the sampling plan in one document and the AFD could sign off on different sections of the sampling plan as he reviews and approves each section.
Appendix I contains guidance for documenting samples.
Reporting Sampling
A table of basic sampling parameters should be included in the audit report for each sample that significantly supports the audit findings. Additional guidance is in Appendix I, Section VII. Example audit report tables are contained in Appendix V.
The audit report will also include the compliance rate, if computed, and the loss of revenue, if applicable.

Focused Assessment Program Exhibit 6A Appendix I
Sampling Steps
I.
A.
a)
b)
c)
2.
a)
b)
3.
a)
PLAN THE SAMPLE
Decide whether or not to sample. (Applies to all circumstances.)
1. Define the audit objective.
The audit objective usually comes directly from the audit program or is a variation that has been modified by the auditor to fit the specific circumstances. If there is no standard audit program, the auditor must define an audit objective appropriate for the unique audit.
Consider all knowledge available to date. All available information about the company and its Customs transactions should be considered in planning the audit and any required sampling. This information may come from prior audits, historical files, profiles, questionnaires, risk assessment, survey results, input from other Customs disciplines, etc. This information will help in refining the audit objective and the audit tests required to achieve that objective.
Once the audit objective is defined, audit testing can be designed to achieve that objective. The appropriate audit testing will vary depending on the audit objective.
Identify the available data, records, and supporting documents.
The available information, its method of storage and retrieval, and its format will directly impact the audit tests that can and should be applied.
For example, if no electronic files are available, this would severely limit the macro analysis that could be performed and would restrict the sampling options as well.
Determine if macro analysis is possible and will achieve the audit objective.
Macro analysis is any high-level analysis not involving the review of individual items or transactions. Macro analysis may include such procedures as considering total value balances or total duty paid, calculating potential value or duty impact, extracting and/or comparing data and totals from Customs and importer systems, analyzing variances, analyzing specific characteristics of extracted data, and analyzing relevant data trends.
1October 31, 2004

Focused Assessment Program Exhibit 6A Appendix I
b)
c)
B.
1.
2.
3.
a)
b)
c)
d)
Macro analysis is a key part of assessing risk exposure but may alsobe used anytime it will help satisfy the audit objectives. It can be more efficient and more precise than sampling and therefore, should be considered first. If macro analysis will achieve the audit objective, then there is no need to perform the remaining sampling steps herein. Thoroughly document all aspects of the macro analysisperformed in compliance with audit documentation policies.
Micro testing, on the other hand, is the review of individual items or transactions (sampling) usually in order to make conclusions about the population or universe from which they are drawn. The remaining steps pertain to such micro testing or sampling.
If macro analysis is not sufficient to achieve the audit objective, decide on nonstatistical (judgmental) or statistical sampling. (Applies to nonstatistical and statistical sampling.)
Define the sampling objective. The specific sampling objective (i.e., the reason to sample, the question you’re trying to answer about the universe, what you’re trying to test/measure, the audit statement you need to make, etc.) will help determine whether nonstatistical or statistical sampling is appropriate.
Nonstatistical sampling relies on auditor judgment to select the sample items and evaluate the sample results (except in the case of 100% review where actual results are known). Statistical sampling is an objective process for randomly selecting the sample items and statistically evaluating the sample results.
There are specific limited circumstances in which nonstatistical sampling is appropriate. Nonstatistical sampling is suitable if statistical results are not needed, there is a high degree of certainty that a conclusion can be drawn without further sampling, and
the purpose is to take a survey in order to determine the necessity for and extent of substantive tests, and/or.
there is a desire to concentrate audit effort in specific problem area revealed by a previous sample or other source of information, and/or
the universe is very small and it would be quicker and easier to review all or most of the items in the universe, and/or
the area is very sensitive and there is no room for error or exact results are needed so all of the items in the universe will be reviewed.
2October 31, 2004

Focused Assessment Program Exhibit 6A Appendix I
4.
5.
6.
C.
1.
2.
3.
D.
1.
It is important to consider the first part of the requirement for nonstatistical sampling (i.e. statistical results are not needed and there is a high degree of certainty that a conclusion can be drawn without further sampling) because it is generally not appropriate to calculate compliance rates or to project dollar impacts (value or revenue) based on results of small nonstatistical samples. Compliance rates and dollar impacts could be based on results of 100% reviews because they represent actual results.
If statistical results are needed or you need more than a nonstatistical sample to make a conclusion (e.g., objective results, projections to the universe with measurable precision, or compliance rates), then nonstatistical sampling is not appropriate (unless 100% review is possible).
If nonstatistical sampling is chosen, skip to sampling step I.D. If statistical sampling is chosen, continue with sampling step I.C. below.
If nonstatistical sampling will not satisfy the sampling objective, decide on which type of statistical sampling (attribute discovery or variablesampling) is appropriate. (Applies to statistical sampling.)
Attribute discovery sampling is a special kind of attribute acceptance sampling where the occurrence of even a single error constitutes a failure of the universe. Variable sampling is a form of substantive testing that is quantitative in nature and can be used to determine varianceamounts or dollar impacts (e.g., materiality-based compliance rates, revenue due, etc.).
Attribute discovery sampling is appropriate when the area of review is sensitive and any systemic error would constitute noncompliance (and potentially fraud). This makes it appropriate for the review of transshipment or undeclared ADD/CVD. Attribute discovery sampling is also appropriate when no error is expected or errors result in penalties rather than revenue due (such as broker or bonded warehouse audits).
Variable sampling should be used in all other circumstances where statistical sampling is appropriate. Variable sampling may be physical unit sampling (where individual items or physical units are selected) or dollar unit sampling (where individual dollars are selected).
Select the sampling frame and unit. (Applies to nonstatistical and statistical sampling.)
Identify available frames, their sampling units, and formats (i.e., electronic, hard copy printout, or physical items).
3October 31, 2004

Focused Assessment Program Exhibit 6A Appendix I
a)
b)
2.
a)
b)
c)
Whether nonstatistical or statistical sampling is used, potential sampling frames and sampling units must be identified. A sampling frame is the physical or electronic representation of the universe from which the sample is selected. The universe is the entire group of items comprising the category or area of interest to the auditor (to be tested). The sampling units are the individual units (e.g., items, transactions, lines, dollars, physical files, etc.) that are selected for review.
The available frames and units must be evaluated to determine which will best satisfy the audit and sampling objectives and the best sampling approach to take. An electronic frame is always superior to an identical physical frame or listing because it provides more flexibility and efficiency in the areas of frame analysis, sample selection, and sample results evaluation.
Consider the level of summarization of the frame and units and identify the available supporting records/documents and their level of summarization.
Frames, units and supporting records and documentation can be at various levels of summarization. They may be at a very high level or a very low level. For example, an entry is made up of many entry/tariff lines, which may be made up of many invoices, which may be made up of many invoice lines, which may be made up of many parts/articles, which may be made up of many styles, which may be made up of many sizes and colors. Importer records and documents may group information similarly or by many other groupings such as by lot, container, purchase order, date received, batch processed, month, supplier, merchandise category, etc.
Often, the higher the level of sampling, the more difficult the review because the more items and supporting documents that have to be reviewed. But this is not always the case. It depends on the sample items (nature, level of summarization and number) and the available supporting records and documentation (physical or electronic, level of summarization, and effort required to trace and verify the sample items).
The ideal situation is one in which the supporting records and documents are summarized at the same level as the sample items or one in which the sample items are easily traced through and verified by the supporting records and documents. Problems occur or significant extra effort may be required when this is not the case (i.e., the sample items and supporting records and documents are at very different levels and/or the sample items are not easily traced/verified).
4October 31, 2004

Focused Assessment Program Exhibit 6A Appendix I
d)
3.
a)
b)
c)
E.
1.
a)
b)
Also keep in mind the audit and sampling objectives - what is being tested. If the entered/reported data is being tested, then it would notbe effective or efficient to sample and verify at a much lower level than that which is reported (e.g., sampling at a level of merchandisecolor when all colors are properly combined on an entry line for reporting classification, quantity, and value).
Based on the available choices, select the best frame and unit to effectively and efficiently accomplish the audit and sampling objectives.
Ask: “If I select this frame and sampling unit, what am I really testingand what procedures will I have to perform? What and how many records and documents will I have to review? What difficulties will I have tracing the sample items through the records and documents?What manual or electronic calculations or summarization will I have to perform in order to trace and verify the sample items? Will this satisfy the audit and sampling objective? Is there a better (more efficient or effective) frame or sampling unit?
An electronic file generally works best with any kind of nonstatistical or statistical sampling. If an electronic file is not available, a printout/listing or a physical item frame can be used for nonstatistical and variable physical unit sampling. A small printout or listing that could easily be typed into EZ-Quant could be used for variable dollar unit sampling.
If nonstatistical sampling is being used, skip to sampling step I.H. If statistical sampling is being used, continue with sampling step I.E. below.
Validate the frame. (Applies to statistical sampling.)
The purpose of frame validation is to determine if it is an adequate representation of the universe intended for testing
Remove credit/negative items and zero balance items from the frame. Proper sampling requires that duplicate items (e.g., credit/negative items with corresponding debit/positive items) and zero value items that have more than one chance or no chance of selection be removed from the frame – either for separate review (separate sample or 100% review) or for no review.
Compare/reconcile the chosen frame with the intended universe or another potential frame to try to verify that it is a complete and accurate listing suitable for the intended objective.
5October 31, 2004

Focused Assessment Program Exhibit 6A Appendix I
For example, if the intended universe is all GSP parts received and a frame extracted from an importer parts database is chosen, this frame could be compared to GSP reported to Customs in ACS. Or if the intended universe is all imported value and classifications and a frame of ACS entries is chosen, this frame could be compared to the inventory receipts (all imports) for the year.
2.
3.
a)
(1)
(2)
(3)
b)
The primary purpose of these types of comparisons is to ensure that you have good data from which to sample. However, as a form of macro analysis, these reconciliations could also reveal additional risk areas or potential problems, such as potential unreported value, misclassified merchandise, over-declarations of GSP, under-declarations of ADD/CVD, etc.
Analyze any variances and adjust the frame, accept the frame, or reject the frame and select another as appropriate.
There are many things that might cause a variance between the frame and universe (or two frames representing the same information). Some common causes of variances are as follows:
Timing or time frame differences. There are various dates inCustoms ACS system (create date, entry date, export date) which are usually different from the dates in the Importer’s system (received date, order date, paid date). Therefore, there could be some timing differences when trying to compare ACS data with importer data.
Excluded items. Due to the complexities of data and data systems and the potential for miscommunication, it is common for wholecategories of data to be excluded from one frame or another. This might be data associated with a particular country, vendor, division,importer ID, or broker. Or it might be data assumed to be unique, dissimilar, or irrelevant such as samples, merchandise purchased for use rather than resale, returns, merchandise in transit, drop shipments, consignments, or informal entries.
Problems with the data source or EDP system. Sometimes data is incomplete because only one partially complete source was accessed when the rest of the data is contained in another file, database, or system.
Various methods can be employed to identify the cause of a variance. Questioning about merchandise receipt timing will help to identify and adjust for timing variances. Computer analyses (such as summing and comparing totals by country, MID and vendor, tariff and merchandise descriptions) may help identify missing categories of data. Grouping queries may show that duplicate records are present.
6October 31, 2004
Focused Assessment Program Exhibit 6A Appendix I
c)
4.
F.
1.
2.
a)
(1)
(2)
b)
(1)
(2)
Once the cause has been determined, a decision must be made if the frame can and should be corrected or adjusted, accepted as is, or rejected and another frame used instead. The key will be the audit and sampling objective (the intended universe and testing) and whether adjustments are actually viable.
If attribute discovery sampling is being used, skip to sampling step I.H. If variable sampling is being used, continue with sampling step I. F. below.
Analyze the frame variability and anticipated/potential errors. (Appliesto statistical variable sampling.)
Frame variability refers to the differences and similarities among sampling units within the frame, in terms of dollar amounts and characteristics.
The degree of frame variability will help determine the required sample size and the best sampling approach.
Determine the skewness by calculating the measures of central tendency.
Calculating the mean, median, and mode (AVERAGE, MEDIAN, and MODE functions in Microsoft Excel) will indicate the skewness of the frame. If the mean is greater than the median, then the frame is right skewed, meaning that there are a few high dollar items and many low dollar items. If the mean is less than the median, then the frame is left skewed, meaning there are a few low dollar items and many large dollar items. The greater the difference between the mean and median, the greater the skewness. Skewness is an indication of dollar variability and may also point to the need for horizontalstratification (by dollar amount).
A highly skewed universe (left or right) would point towards a larger stratified physical unit sampling. A highly left skewed universe would point towards a larger dollar unit sampling.
Determine the dollar variability by calculating the indices of dispersion (standard deviation and coefficient of variation).
Standard deviation is the average distance of individual values or the extent to which individual values depart from the average. In Microsoft Excel, it can be calculated by using the STDEVP function.The larger the standard deviation, the more variation. (Do not use any other STD functions in Microsoft Excel as will result in a different, incorrect result.)
The coefficient of variation (CV) is the standard deviation expressed as a percentage. The formula is Standard Deviation of the frame /
7October 31, 2004

Focused Assessment Program Exhibit 6A Appendix I
Mean of the frame * 100. The higher the CV, the more dollar variation in the frame. Generally, a CV < 50% indicates low variation, a CV between 50% and 100% indicates moderate to high variation, and a CV over 100% indicates very high variation.
(3)
c)
(1)
(2)
d)
(1)
(2)
e)
(1)
(2)
A higher CV ( 50%) would point towards a larger stratified physicalunit sample or a larger dollar unit sample.
Determine if there are obvious dollar breaks or groupings (for horizontal stratification). (Applies if the universe is highly skewed and/or the CV 50%.)
High skewness, standard deviation, and CV indicate high dollarvariation and probably a need to stratify – at least horizontally (on dollars) and possibly vertically (on characteristics). Sorting the frame in Microsoft Excel (by dollar amount) may reveal clear divisions or groupings of similar dollar amounts. (This type of analysis may also be performed by creating various tables and reports in MicrosoftAccess.)
Obvious dollar breaks or groupings would point towards a largermanually stratified physical unit sample. It could also point towards a dollar unit sample with a 100% review high dollar stratum if the obvious dollar break is between high dollars and the rest of theframe.
Analyze the characteristics to determine if logical groupings exist (for vertical stratification).
Analyzing the frame in Microsoft Excel (sorting, subtotaling, creating pivot tables, etc.) by description, part number, HTS or tariff number, account number, product lines, size, quantity or any other relevant characteristic may reveal common characteristics or categories that should be grouped together. (This type of analysis may also be performed by creating various tables and reports in MicrosoftAccess.)
A highly variable frame in terms of characteristics would pointtowards a larger stratified physical unit sample or multiple dollar unit samples.
Identify special, very low risk, or very high risk items and decide whether to leave them in the frame for random sampling or remove them from the frame for no review or 100% review.
These may be, for example, very low dollar items, very high dollaritems, informal entries, consignee entries, etc.
Very low dollar items may be eliminated from the frame IF the team agrees that there are no potential significant issues or errors that
8October 31, 2004

Focused Assessment Program Exhibit 6A Appendix I
could occur. Be cautious about automatically assuming that low dollar items are insignificant. It may not be appropriate to exclude the low dollars if:
(a)
(b)
(c)
(d)
(3)
3.
a)
b)
G.
1.
a)
b)
c)
the frame contains clusters (the apparently low dollar items may not be low in comparison to the individual items making up the clusters),
they are significant in the aggregate,
they represent sensitive special trade areas, or
the value is known or suspected to be significantly understated.
For example, one company had approximately $350,000 in low dollar sample merchandise out of $65 million total reported value. These were left in the frame and some were chosen in the sample. During the attempt to support the sample merchandise value, the importer discovered they were significantly undervalued and submitted a disclosure for approximately $1.5 million with revenue due of about $300,000. If these low dollar items had been deleted from the frame for no review, the errors would not have been discovered and this loss of revenue would not have been recovered.
Define the anticipated or potential errors.
The frequency, types, and amounts of the anticipated or potential errors will help to determine the best sampling methodology for the situation.
Frequent errors, including small errors, would point towards physical unit sampling. Infrequent large errors would point towards dollar unit sampling.
Determine the best variable sampling method (physical unit or dollar unit) based on the results of the frame analysis. (Applies to statistical variable sampling.)
Physical unit sampling generally works best with:
An electronic frame, a printout or listing frame, or a physical item frame.
Any amount of frame variability, including one that is highly variable in terms of dollars and characteristics.
Sampling units that are individual items or sampling units that are clusters of items where reviewing the entire cluster is acceptable
9October 31, 2004

Focused Assessment Program Exhibit 6A Appendix I
(i.e., the clusters consist of a few items and/or reviewing whole clusters would not require significant additional effort to trace through the supporting records and documents).
d)
2.
a)
b)
c)
d)
H.
1.
a)
b)
(1)
(2)
(3)
(4)
The anticipated or potential errors are frequent, including small errors.
Dollar unit sampling generally works best with:
An electronic frame or a small printout or listing frame that could be typed into EZ-Quant.
A frame that is not highly variable or a frame that is highly variable in terms of dollars (especially left skewed) but not in terms of characteristics. (Dollar unit sampling may be used with a frame that is highly variable in terms of characteristics, but it would require multiple dollar unit samples.)
Sampling units that are clusters of items where reviewing the entire cluster is not acceptable (i.e., reviewing entire clusters would require significant additional effort to trace through the supporting records and documents).
The anticipated or potential errors are infrequent large errors.
Establish appropriate sample/strata sizes and sampling parameters.(Applies to nonstatistical and statistical sampling.)
Nonstatistical (judgmental) samples.
Sample sizes for nonstatistical samples will depend on the type of audit, audit objective, and sample objective.
For Focused Assessment (FA) Pre-Assessment Survey (PAS), sample sizes will be 1 to 20 depending on the results of the initial risk exposure and internal control assessment as follows:
Low risk exposure and strong internal controls = low end of 1 to 10 range.
Low risk exposure and adequate internal controls = middle of 1 to 10 range.
Low risk exposure and weak internal controls = high end of 1 to 10 range.
Moderate risk exposure and strong internal controls = low end of 5 to 15 range.
10October 31, 2004

Focused Assessment Program Exhibit 6A Appendix I
(5)
(6)
(7)
(8)
(9)
c)
2.
a)
(1)
(2)
b)
Moderate risk exposure and adequate internal controls = middle of 5 to 15 range.
Moderate risk exposure and weak internal controls = high end of 5 to 15 range.
High risk exposure and strong internal controls = low end of 10 to 20 range.
High risk exposure and adequate internal controls = middle of 10 to 20 range.
High risk exposure and weak internal controls = high end of 10 to 20 range.
For most other audits, nonstatistical sample sizes will generally be 100% of the review area. If the review area is much larger than a normal statistical sample size (60 to 100), then statistical sampling should be considered instead of nonstatistical sampling.
Attribute discovery samples.
Sample sizes for attribute discovery samples are determined by running EZ-Quant ATTDISC (DOS Version 3.10) or Attribute Sample Size Determination Procedure (Windows Version 1.0.1). The procedure will generally result in sample sizes within the range of 59 to 90, depending on the frame size and specified sampling parameters of critical error rate and government risk. The critical error rate is the maximum acceptable error rate in the universe. The government risk is the tolerable level of risk of accepting a faulty universe (one with an actual error rate exceeding the critical error rate).
For circumstances where any systemic error results in noncompliance (e.g. FA Assessment Compliance Testing or Follow-up of transshipment or undeclared ADD/CVD), the appropriateparameters to use are 5% critical error rate and 1% government risk.
For those instances when no errors are anticipated or errors result in penalties rather than revenue due (e.g., broker or bonded warehouse audits), the appropriate parameters to use are 5% critical error rate and 5% government risk.
Although the purpose of an attribute discovery sample is to determine if any error exists rather than estimate dollar impacts, there could be situations in which estimating dollar impacts based on the sample results is appropriate or necessary. A desired precision percentage under 100% and confidence level of 95% (same as for variable sampling) should be established for just such a possibility.
11October 31, 2004

Focused Assessment Program Exhibit 6A Appendix I
The desired precision percentage should be based on auditor judgment of what would be acceptable for the situation. The achieved precision percentage will be compared to the desired precision percentage when determining the acceptability of the projection.
3.
a)
(1)
(a)
(b)
(c)
(2)
(a)
Variable samples.
Variable sample sizes depend on the variability in the sampling frame. The more variability in the frame (dollars and characteristics), the larger the sample size required to achieve acceptable sample results. Minimum sample size guidelines (based on statistical principles) have been established to assist auditors in determining appropriate variable sample sizes.
Physical unit samples.
If the frame is homogenous, then the minimum sample required is 1 sample with 1 stratum of 60 items. A homogenous frame is one with low variability in dollars and characteristics (i.e. similar dollars and characteristics).Indicators of low dollar variability are low skewness, low standard deviation, low CV (< 50%) and no obvious dollar breaks or groupings. Low characteristic variability would be a frame with no obvious groupings by characteristics.
If the frame is nonhomogenous, then the minimum sample required is 1 sample of 3 random strata plus 1 high dollar 100% review stratum. A nonhomogenous frame is one withhigh variability in dollars and characteristics (i.e. dissimilardollars and characteristics). Indicators of high dollar variabilityare high skewness, high standard deviation, high CV ( 50%) and obvious dollar breaks or groupings. High characteristicvariability would be a frame with obvious groupings by characteristics. The total sample size should be at least 100items. Each random stratum should be at least 30 items, except when 30 items would be more than 5% of the items in the entire stratum. In that case, the stratum size can be 5% or15 items, whichever is greater.
Generally, the larger the total sample size and the more strata, the better the achieved precision will be.
Dollar unit samples.
If the frame is homogenous, then the minimum sample required is 1 sample of 100 units. A homogenous frame is onewith low variability in dollars and characteristics (i.e. similar dollars and characteristics). Indicators of low dollar variability
12October 31, 2004

Focused Assessment Program Exhibit 6A Appendix I
are low skewness, low standard deviation, low CV (< 50%) and no obvious dollar breaks or groupings. Low characteristicvariability would be a frame with no obvious groupings by characteristics.
(b)
(c)
(d)
b)
II.
A.
1.
2.
a)
If the frame is nonhomogenous due to high dollar variability, then the minimum sample required is 1 sample of 100 units.Indicators of high dollar variability are high skewness, high standard deviation, high CV ( 50%) and obvious dollar breaksor groupings.
If the frame is nonhomogenous due to high characteristicvariability, then the minimum samples required are multiple samples of 60 units each (one for each characteristicgrouping). High characteristic variability would be a frame with obvious groupings by characteristics. Physical unit samplingis usually better at handling high variability in characteristics.But if clusters are present which would be difficult to review in their entirety and if there only 2 or 3 major characteristic groupings, then dollar unit sampling may still be used.
Generally, the larger the total sample size (or the more samples for characteristic variability), the better the achieved precision will be.
Sampling parameters for variable samples will be 95% confidence level and desired precision percentage < 100%. The desired precision percentage should be based on auditor judgment of what is acceptable for the situation. The achieved precision percentage will be compared to the desired precision percentage when determining the acceptability of the projection.
SELECT THE SAMPLE
Nonstatistical samples.
Since nonstatistical sampling is based on auditor judgment, any selection method appropriate for the circumstances may be used. The auditor should keep in mind the audit and sampling objectives when determiningthe best selection process.
Some common techniques are as follows:
Purposive testing is a method that attempts to select sample items with known or suspected problems. This method would be appropriate for the FA PAS, which is a risk-based survey to find problems if they exist. The auditor would select the highest risk areas/items.
13October 31, 2004

Focused Assessment Program Exhibit 6A Appendix I
b)
c)
d)
e)
B.
1.
2.
a)
Cross-section testing is a method that selects sample items from allparts of the area being tested. A common technique is to designatea fixed percentage to test, such as 2%, and then select every nth item to reach the 2%. If this method employed a random start, it would actually be a statistical systematic interval selection. But often, items are just chosen haphazardly across the area being tested until the desired quantity is obtained. This method would be appropriate for FA PAS if there were no identified higher risk areas or items on which to focus
Large dollar testing is a method that selects the largest dollar items for review. Emphasis is placed on the materiality of the items selected. This could be appropriate for FA PAS if the higher dollar items are determined to be the highest risk items. However, keep in mind that a breakdown of internal controls is often more pronounced in the lower dollar items.
Block testing is a method that selects specific blocks of units. The blocks may be periods of time or consecutive groupings, such as all expense vouchers in June or all invoices with vendor names beginning with the letters M through P. This method would be appropriate for FA PAS only if the selected blocks represent the high risk areas/items.
Convenience testing is a method of selecting the most convenient sample items for review. The most readily available items are selected, without reason or randomness, simply because it is expedient. Records that are in storage, in the bottom or back of filedrawers, not yet filed, or at another location are excluded when this type of testing is used. This method rarely reflects good auditor judgment, may be manipulated by the auditee, and is not recommended for any audit situation.
Attribute discovery and variable physical unit sampling.
The same selection methods may be used for both attribute discoveryand variable physical unit sampling because both statistical sampling types select physical units for review.
The following are sample selection options:
EZ-Quant RANUM (DOS Version 3.10) or Random Numbers Generator (Windows Version 1.0.1) is a procedure that generates random numbers that can then be manually or electronically applied (using macros or mini-programs) to a frame to select the sample items. It is suitable for an electronic frame, a numbered printout or listing, or a numbered physical item frame. It could also be used with
14October 31, 2004

Focused Assessment Program Exhibit 6A Appendix I
a small unnumbered printout/listing or physical items frame, but the frame would have to be manually numbered before the sample items could be selected.
This procedure can be used for manually stratified physical unit samples. If obvious dollar breaks or characteristic breaks were identified during frame analysis, then RANUM may be run for each manually identified stratum to randomly select the sample items.
b)
c)
d)
(1)
EZ-Quant RASEQ (DOS Version 3.10) or Random Number Sets Generator (Windows Version 1.0.1) is a procedure that generates sets of random numbers that can then be applied to a frame to select the sample items. It is suitable for an unnumbered printout/listing or an unnumbered physical item frame with a hierarchical structure.For example, the first number in the set would represent the page or drawer and the second number in the set would represent the line on the page or the file in the drawer. It can be used when stratification is not necessary, the frame is already stratified, or the frame can be stratified prior to sample selection.
EZ-Quant STRAT (DOS Version 3.10) or Physical Unit Sample Selection Procedure (Windows Version 1.0.1) is a procedure that can stratify (on dollars) and randomly select physical units. It is suitable for an electronic frame or a small printout/listing that can be typed into the program.
It can be used for attribute discovery sample selection by specifying 1 random stratum and no high dollar stratum/items.
For variable physical unit samples, the procedure will automatically sort and stratify the frame into equal dollar strata, and then randomly select sample items for each stratum. It works best with a frame that is highly variable in terms of dollars, but not in terms of characteristics. If obvious dollar breaks or characteristic breaks were identified during frame analysis, then EZ-Quant RANUM (Random Numbers Generator), may be used instead to randomly select sample items for each manually identified stratum.
Manual systematic interval selection is a procedure for manually selects every nth item with a random start. It should be considered when the only available frame is an unnumbered physical item frame and selecting every nth item would result in a better cross-section of items or would be easier and quicker than using RASEQ. The process is as follows:
Estimate the frame size (if unknown). It is better to underestimate than overestimate.
15October 31, 2004

Focused Assessment Program Exhibit 6A Appendix I
(2)
(3)
(4)
(5)
(6)
(7)
e)
C.
1.
2.
a)
Compute the interval (frame size / desired sample size). Truncatethe result to a whole number.
Run EZ-Quant RANUM (Random Numbers Generator) to get a random start between 1 and the interval. The random start will be the first sample item.
Add the interval to the random start to get the second sample item.Continue adding the interval to select the rest of the sample items.
Do not automatically stop when the desired sample size is achieved.The process is not complete until the end of the frame is reached. To stop before the end of the universe would invalidate the statisticalsample because every item would not have an equal chance of selection. The actual sample size may be slightly larger than the initial desired sample size.
The sample may be properly expanded by removing the previously selected sample items from the frame and repeating the above steps (calculating a new interval, running EZ-Quant RANUM RandomNumbers Generator to get a new random start, and selecting the additional items from the revised frame).
The sample may be properly decreased by randomly (using EZ-Quant RANUM Random Numbers Generator) selecting items for removal from the entire sample. It would not be proper to merely disregard the last items selected. To do so would invalidate thestatistical sample because every item would not have an equal chance of selection.
Other computer programs, such as Microsoft Access or SAS, may be used if the electronic frame is too large to fit into Microsoft Excel (for analysis, manual stratification, or application of random numbers) or too large to fit into EZ-Quant STRAT Physical Unit Sample Selection Procedure (for stratification and/or sample selection). Auditors should consult with a CAS if they encounter this situation.
Variable dollar unit sampling.
Dollar unit sampling is unique in that it randomly selects dollars instead of physical units. The selected dollars (dollar hits) are then tied to physical units which are reviewed.
The following selection methods may be used for dollar unit sampling:
EZ-Quant DUSSEL (DOS Version 3.10) or Dollar Unit Sample Selection Procedure (Windows Version 1.0.1) is an automated systematic interval selection procedure. It works with an electronicframe or a small printout/listing that can be typed into the program.
16October 31, 2004

Focused Assessment Program Exhibit 6A Appendix I
The procedure will identify the dollar hits, but if the sampling units are clusters, then the physical items associated with each dollar hitmust be identified manually. This is done by calculating cumulative totals for the cluster items and then locating the item within the cluster that contains the dollar hit.
b)
c)
III.
A.
B.
1.
2.
3.
Manual systematic interval selection. This method manually selects every nth dollar with a random start. While it is possible for use with a printout or listing, it is generally not recommended for dollar unit sampling due to the amount of effort required to manually select the dollar hits.
Other computer programs, such as Microsoft Access or SAS, may be used if the electronic frame is too large to fit into Microsoft Excel (for analysis) or too large to fit into EZ-Quant DUSSEL Dollar Unit Sample Selection Procedure (for sample selection). Auditors should consult with a CAS if they encounter this situation.
DOCUMENT ALL ASPECTS OF THE SAMPLE PLANNING AND SELECTION
Audit documentation must fully and clearly document all aspects of the sampling that was used. This documentation must be prepared for each sample (nonstatistical and statistical) and must comply with audit documentation policies.
The following sample planning and selection items should be included for each sample:
A sampling plan that documents the sample planning and selection must be included. Standard sampling plan forms for this purpose are contained in Appendix IV. The sections labeled Sampling Application,Sampling Approach, Universe and Frame Information, and Sample Information pertain to sample planning and selection and should be completed at this point.
The sampling frame itself must be included as part of the audit documentation. Electronic frames can be directly incorporated into the automated working papers. If the frame is hard copy, it can be scanned in or maintained separately if too voluminous for scanning. If it is maintained separately, it should be properly explained and referenced in the automated documentation in accordance with audit documentation policies.
The procedures used to validate the sampling frame must be documented. Any analysis or file comparisons done in an attempt to validate the frame as an adequate representation of the intendeduniverse must be adequately explained.
17October 31, 2004

Focused Assessment Program Exhibit 6A Appendix I
4.
5.
6.
7.
8.
IV.
A.
1.
2.
B.
1.
Analysis of the sampling frame variability must be thoroughly explained and documented. This would include the calculation of measures of central tendency and indices of dispersion (mean, median, mode, standard deviation, and coefficient of variation), the determination of any obvious dollar or characteristic groupings for manual stratification, and identification of special items for separate or no review. These analyses and the related conclusions must be fully and clearly presented.
The sample size and how it was determined must be included. For attribute discovery sampling, this would include the EZ-Quant ATTDISC Attribute Sample Size Determination Procedure output. For variable sampling, this may be a conclusion on the frame analysis documentation explaining the application of the sample size guidelines based on the frame variability.
The random selection methodology must be documented. This includes the random numbers or random procedure applied for statistical samples or the judgmental procedure and reasoning for nonstatistical samples.EZ-Quant output and its application to the frame (if used) must be included and explained.
The selected sample items themselves should be properly documented.This may be accomplished with the sample selection documentation and/or the sample review documentation.
Any other documentation produced during the sample planning and selection should be included as appropriate.
REVIEW THE SAMPLE
Review each sample item.
Perform the review of each sample item based on the established criteria and audit program as required to achieve the audit and sampling objectives.
Use the standard RAMIS worksheet and add any additional columns required to perform and document the review.
Determine the cause of each error and whether it is systemic/ nonsystemic and recurring/nonrecurring.
The cause of the error is critical to understanding the nature of the problem and making appropriate recommendations. The nature of the error is also important for proper computation of compliance rates and projection of dollar impact.
18October 31, 2004

Focused Assessment Program Exhibit 6A Appendix I
2.
a)
b)
c)
d)
Each error will be identified as systemic or nonsystemic AND recurring or nonrecurring for this purpose.
Systemic errors are those caused by a deficiency in the system of internal controls. If the system is corrected or internal controls strengthened, the error should not recur. Clerical or human error (especially if such errors are repetitive) that occurred because there were no internal controls in place to try to prevent or catch such errors (i.e., training, supervision, written instructions, monitoring, checking, etc.) would also be systemic. Systemic errors are also recurring errors, even if only one is found, because they could recur due to the system deficiency. Only systemic errors are included in the determination of compliance.
Nonsystemic errors are those not caused by any apparent weaknessin internal controls. Typically these are occasional clerical or human errors that occurred despite adequate internal controls (i.e., training, supervision, written instructions, monitoring, checking, etc.).Nonsystemic errors may also be recurring if they display a pattern or trend that they are likely to recur. For example, repetitive clerical errors may be indicative of some sort of weakness in the internal controls, such as incompetent personnel, inadequate training, lack of supervision or monitoring, etc. The designation of systemic or nonsystemic is required for the determination of compliance. Only systemic errors are included in the computation of compliance rates.Nonsystemic errors are not used when calculating compliance rates
Recurring errors are those that could recur in the frame from which the sample was taken. Typically these are systemic errors. They may also be nonsystemic errors that display a pattern or trend that they are likely to recur (e.g., repetitive clerical errors are recurring errors). The designation of recurring or nonrecurring is required for revenue projection. Only recurring errors are projected.Nonrecurring errors are not projected. However, nonrecurring errors should be added to the projected revenue loss when calculating total revenue loss.
Nonrecurring errors are those that would not be expected to recur in the frame from which the sample was taken. Typically these are nonsystemic, isolated clerical or human errors that occurred despite adequate internal controls (i.e., training, supervision, written instructions, monitoring, checking, etc.). They could also be errors found outside the sampling frame. The designation of recurring or nonrecurring is required for revenue projection. Only recurring errors are projected. Nonrecurring errors are not projected. However, nonrecurring errors should be added to the projected revenue losswhen calculating total revenue loss.
19October 31, 2004

Focused Assessment Program Exhibit 6A Appendix I
V.
A.
1.
2.
B.
1.
2.
a)
b)
c)
EVALUATE THE SAMPLE RESULTS
Calculate compliance, if applicable.
Compliance, when applicable (i.e. the determination of compliance is an audit/sampling objective), will generally be based on the value of systemic errors found in the sample. See Appendix IV of this document and FA Program Exhibit 3F for more guidance on how to compute compliance rates.
Remember that it is generally not appropriate to compute compliance rates based on the results of small nonstatistical samples.
Calculate the total revenue due.
Loss of revenue estimates should be based on the most accurate information available. Actual amounts, if known (e.g. 100% review was performed), would be the first choice. Otherwise, statistical projections or other reasonable means of estimating revenue due may be used.
Statistical projections.
EZ-Quant SAMPL Physical Unit Sample Evaluation Procedure may be used to project revenue due for attribute discovery and variable physical unit samples. The procedure projects the sample revenue due to the universe and provides reliability measures for evaluating that projection. It provides two point estimates (one for the ratio method and one for the difference method) along with associated precision dollars and confidence intervals based on the confidence level specified. The confidence level used will be 95%. The point estimate with the lowest precision percentage (precision dollars / point estimate) should be selected.
EZ-Quant DUSAM Dollar Unit Sample Evaluation Procedure may be used to project revenue due for variable physical unit samples. The procedure projects the sample revenue due to the universe and provides reliability measures for evaluating that projection. It provides a point estimate along with associated precision dollars and confidence intervals based on the confidence level specified. The confidence level used will be 95%.
Other computer programs, such as Microsoft Access or SAS, may be used to statistically project and evaluate statistical sample results if electronic files are too large for EZ-Quant SAMPL Physical Unit Sample Evaluation Procedure or EZ-Quant DUSAM Dollar Unit Sample Evaluation Procedure. Auditors should consult with a CAS if they encounter this situation.
20October 31, 2004

Focused Assessment Program Exhibit 6A Appendix I
d)
3.
C.
1.
2.
D.
1.
2.
VI.
A.
B.
1.
The achieved precision percentage (precision dollars / point estimate) should be compared to the desired precision percentage from the sampling plan when determining the acceptability of the point estimate. If the achieved precision percentage is the desired precision percentage, then the projection is acceptable. Otherwise, the sample methodology and sample errors must be reevaluated to determine the appropriate course of action. See the Sample Results – Duty Due section of the sampling plans in Appendix IV for various options.
Total revenue due should be compared to thresholds for referral for enforcement and referred as appropriate.
Calculate the total value impact.
The total value impact is needed for comparison to thresholds for referral for enforcement.
The total value impact is a manual ratio calculation projecting the value of the sample errors to the universe. See the Sample Results – Value Impact section of the sampling plans in Appendix IV for detailed calculations.
Determine the impact on other years or areas.
Auditors should consider the impact of their sample results on other universes, such as other years or areas.
Generally, projections of sample results should be limited to the universe from which the sample was drawn. Items examined in one universe may not be representative of other universes and projecting to other universes would not statistically defensible. However, auditors may express their opinion and make nonstatistical applications if they believe the results apply to another universe.
DOCUMENT THE SAMPLE RESULTS EVALUATION
Audit documentation must fully and clearly document all aspects of the sampling that was used. This documentation must be prepared for each sample (nonstatistical and statistical) and must comply with audit documentation policies.
The following sample results evaluation items should be included for each sample:
A sampling plan that documents the sample results evaluation must be included. Standard sampling plan forms for this purpose are contained in Appendix IV. The sections labeled Sample Results – Errors, Sample
21October 31, 2004

Focused Assessment Program Exhibit 6A Appendix I
22October 31, 2004
2.
3.
4.
5.
6.
7.
VII.
A.
B.
C.
Results – Compliance, Sample Results – Duty Due, Sample Results – Value Impact, and Sample Results – Other Years/Areas pertain to sample results evaluation. These sections should be completed at this point.
The determination of compliance and how calculated.
The total revenue due and its method of calculation. This would include the EZ-Quant input and output if statistical projections are used.
The calculation and analysis of the resulting precision percentage and any actions taken for unacceptable precision must be included.
The total value impact, how calculated, comparison with thresholds for referral for enforcement, and referral for enforcement if applicable.
The impact on other years/areas and how determined.
Any other documentation produced during the sample results evaluation should be included as appropriate.
REPORT THE SAMPLE RESULTS
A table of sampling information will be included in the audit report for each sample (nonstatistical and statistical) if the sample significantly supports the audit findings. The table will show the sample review area, frame description, sampling approach, why the sampling was chosen, frame size/value/duty, and sample size/value/duty. A table will be used for each statistical sample.
The tables will be used for all samples in the Assessment Compliance Testing phase of the Focused Assessment (FA). The tables will be used for the Pre-Assessment Survey (PAS) phase of the FA only if the sample in the PAS included the entire universe because the universe was small. Although sampling tables will not normally be included in PAS reports, the sampling plans in Appendix IV will be developed for all samples, including judgmental samples such as those taken in the PAS audit process and will be included in audit documentation. See Appendix IV for sampling plans and see Appendix V for examples of the tables for audit reports.
In addition, the audit reports should include any computed compliance rates and total revenue loss computed.

Focused Assessment Program Exhibit 6A Appendix II
Sampling Methodology Diagrams
Audit Testing Methods
DollarUnit
Sampling
PhysicalUnit
Sampling
Variable
Sampling
StatisticalSampling
(ProbabilitySampling)
AttributeDiscovery
Sampling
NonstatisticalSampling
(JudgmentalSampling)
Micro Testing
(Review of individualitems or transactions.)
Macro Analysis
(High-level analysis of totals, trends, file
comparisons, etc.)
1October 31, 2004

Focused Assessment Program Exhibit 6A Appendix II
Macro Analysis Appropriate Uses
Risk (PAR)
Determination to quickly quantify co
testing).
t to verify CIP implementation or
Other
Can use macro analysis during any other audit when it will
achieve the audit objectives without detailed transaction
testing.
Follow Up
May be able to use macro analysis during follow up audits
quantify compliance and/or revenue due (without detailed
transaction testing).
FA ACT
May be able to use macro analysis during the ACT phase o quantify compliance and/orrevenue due (without further
transaction testing).
FA PAS – Risk & Assessment Compliance Testing (ACT)
Determinations
May be able to use macro analysis during the Risk/ACT
mpliance and/or revenue due(without further transaction
Focused Assessment (FA) Pre-Assessment Survey (PAS) – Preliminary Assessment of
An essential element of assessing risk See the FA PAS audit
program for examples of macro risk analyses that can be applied using the Preliminary Assessment
of Risk form.
Macro Analysis
Any high level analysis or testing not involving the review of individual items or
transactions. This could include analysis of totals, trends, file comparisons, etc.
2October 31, 2004

Focused Assessment Program Exhibit 6A Appendix II
Nonstatistical Sampling Appropriate Uses
without further sampling, AND WHEN:
for and extent of substantive testing
the universe. ireviewed.
dit
re exact results
are needed.
Very Sensitive Area
The area is very sensitive and there is no room for error or exact
results are needed so all of the tems in the universe must be
Fraud
Any other very sensitive auwhere there is no room for error or whe
Very Small Universe
The universe is very small and it would be quicker and easier to
review all or most of the items in
FA ACT
Follow up
Any other audit where the universe is very small.
Known Problem Area
There is a desire to concentrate audit effort in a specific limited
problem area revealed by a previous sample or other source of
information.
FA ACT
Follow up
Any other audit where there is a specific limited problemarea.
Survey
The purpose is to survey the area in order to determine the necessity
(further transaction testing).
FA PAS
Follow up
Any other audit where a survey is appropriate to
achieve the audit objectives.
Nonstatistical Sampling (Judgmental Sampling)
Judgmental sampling is appropriate when statistical results are not needed and/or there is a high degree
of certainty that a conclusion can be reached
3October 31, 2004

Focused Assessment Program Exhibit 6A Appendix II
Nonstatistical Sampling Sample Sizes
and internal control assessment.
ddle of 5 to 15 range.
ernal 5 to 15 range.
l
ernal
10 to 20 range.
the review area.
All Other Audits
Sample sizes will generally be 100% of
Judgmental sample sizes generallyshould not significantly exceed a normal
statistical sample of 60 to 100. If the area is much larger than that, then statistical sampling should be considered
instead.
FA PAS
Sample sizes will be 1 to 20, depending on the results of the initial risk exposure
Low risk exposure and strong internal controls = low end of 1 to 10 range.
Low risk exposure and adequate internalcontrols = middle of 1 to 10 range.
Low risk exposure and weak internalcontrols = high end of 1 to 10 range.
Moderate risk exposure and strong internal controls = low end of 5 to 15range.
Moderate risk exposure and adequate internal controls = mi
Moderate risk exposure and weak intcontrols = high end of
High risk exposure and strong internacontrols = low end of 10 to 20 range.
High risk exposure and adequate intcontrols = middle of 10 to 20 range.
High risk exposure and weak internal controls = high end of
Nonstatistical Sampling (Judgmental Sampling)
Nonstatistical sample sizes are generally small and will vary depending on the application and area being
reviewed.
4October 31, 2004

Focused Assessment Program Exhibit 6A Appendix II
Nonstatistical Sampling Common Selection Methods
desirable to ntation. blocks.
em g
th .recommended.
smaller dollar area.
Large Dollar Test
The largest dollar items are selected(e.g., all items over $100,000). Caution must be exercised when attempting to apply conclusions to untested smaller items. Breakdowns in internal controls
are often more pronounced in the
Convenience Test
The easiest or most readily available items are selected (e.g., the items in theoffice file drawer). This method rarely reflects good audit judgment, can be
manipulated by the auditee, and is not
Purposive Test
Known or suspected problem items are selected (e.g., all items in the
tooling account). This method fficiently focuses resources. Cautionust be exercised to avoid overstatin
the problem when attempting to apply e results to untested areas
Block Test
A specific section or “block” of items is selected for review (e.g., one month of transactions). This method has limitedapplicability and may not give a clearpicture of the entire area. The results
may not be applicable to untested
Cross Section Test
Items from all parts of an area are selected (e.g., 5% sampled by selecting every 10th item or by
haphazardly selecting items). This is a good method when there is no
knowledge of the area or when it is get broad represe
Nonstatistical Sampling (Judgmental Sampling)
Judgmental sampling is a process in which sample items are selected subjectively rather than statistically (i.e.
randomly). It relies solely on auditor judgment to appropriately select sample items to accomplish the
particular audit and sample objectives.
5October 31, 2004

Focused Assessment Program Exhibit 6A Appendix II
Nonstatistical Sampling Evaluation Methods
represents 100% of the review area,
actual results for the review area.
th r
review area can be expressed.
< 100% Reviews
When the judgmental sample does not represent 100% of the review area,
then the sample results must be evaluated by the auditor to determine if the audit and sample objectives have
been achieved and if an opinion on the
It is generally not appropriate to compute compliance rates or project
dollar impacts (revenue or value) based on the results of small nonstatistical
samples.
100% Reviews
When the judgmental sample
then the sample results represent
If the review area represents only part of the entire area being
evaluated/reported on, then the review area results must be analyzed within
e context of the entire area undeevaluation.
Nonstatistical Sampling (Judgmental Sampling)
Judgmental sampling, by definition, relies solely on auditor judgment to evaluate sample results. That is, statistical analysis is not used to evaluate judgmental
sample results.
6October 31, 2004

Focused Assessment Program Exhibit 6A Appendix II
Statistical Sampling Basic Categories
lar to
the rate of occurrence, and may result in system changes. Sample items are
Attribute Sampling
Attribute sampling is a form of compliance testing that is qualitative in nature, can be used to determine
evaluated for compliance or attributes. Attribute sampling answers the
question “how many?”
Variable Sampling
Variable sampling is a form of substantive testing of dollars that is quantitative in nature and results in
better estimates of amounts. Sampleitems are evaluated for error amounts
or variables. Variable sampling answers the question “how much?”
Statistical Sampling (Probability Sampling)
Statistical sampling is an objective process for testing a limited number of transactions in order to draw a conclusion about a
larger universe. It uses a sampling plan in such a way that the laws of probability can be used to make statements or
generalizations about the universe.
Statistical sampling is appropriate when the universe is too ge to review 100% and statistical results are needed (i.e.
statistically project the sample results to the universe).
7October 31, 2004

Focused Assessment Program Exhibit 6A Appendix II
Variable SamplingTypes
in dollar impacts.
variable sampling in which the sampling
(items, transactions, etc.) that are examined.
Dollar Unit
Dollar unit sampling is a type of
unit is defined as an individual dollar, with each dollar having an equal chance of selection. Dollar unit
sampling selects individual dollars, which are then tied to physical units
Physical Unit
Physical unit sampling is a type of variable sampling in which the sampling
unit is defined as a physical item or transaction, with each physical item or transaction having an equal chance of selection (or determinable non-zerochance of selection in the case of
stratification). Physical unit sampling directly selects physical units (items, transactions, etc.) for examination.
Variable Sampling
Variable sampling is a form of substantive testing that is quantitative in nature, can be used to
determine the amount of variance, and may result
There are 2 basic types of variable sampling based
on the sampling unit selected.
8October 31, 2004

Focused Assessment Program Exhibit 6A Appendix II
Variable Sampling Appropriate Uses
Amac ng
will meet the audit objectives.)
too large, the errors are too varied, a
Other
Variable sampling would be appropriate for any other audit where the objective is substantive testing to
determine variance amounts and calculate dollar impacts.
Drawback
Variable sampling is appropriate for drawback audits because the
purpose is to determine the amount of noncompliant duty drawback (not
payable to the claimant or due to Customs if already refunded to the importer in accelerated payments).
Follow Up
Variable sampling is appropriate for follow up audits when macro tests or
judgmental sampling will not meet the audit objectives (e.g., the area is
compliance rate is needed, etc.).
FA ACT
Variable sampling is appropriate for the FA ACT phase because the
purpose of proceeding to ACT is to determine the extent of compliance in terms of dollar materiality and/or
to calculate revenue due.(Exceptions: transshipment;
undeclared Anti-Dumping Duties/Counterveiling Duties -DD/CVD; and those cases where
ro tests or judgmental sampli
Variable Sampling
Variable sampling is appropriate for substantive testing when the objective is to determine the
amount of variance and/or calculate dollar impacts(materiality compliance rates, revenue due, etc.).
9October 31, 2004

Focused Assessment Program Exhibit 6A Appendix II
Physical Unit Sampling Appropriate Uses
comp tc.).
Anticipated Errors
Frequent errors, andSmall errors.
Frame Variability
Widely variable in terms of dollars (need to stratifyhorizontally) and/or Widely variable in terms of characteristics (need to stratify vertically).
Sampling Units
No clusters, or Clusters and reviewing allitems in a cluster is acceptable (i.e., it wouldnot require significantadditional effort).
Frame Format
An electronic file, or A printout or listing, orPhysical items.
Physical Unit Sampling
As a type of variable sampling, physical unit sampling is appropriate for substantive testing when the objective is to determine the amount of variance
and calculate dollar impacts (materiality liance rates, revenue due, e
It is appropriate in the same situations and audits where variable sampling is appropriate. Physical
unit sampling works best WHEN:
10October 31, 2004

Focused Assessment Program Exhibit 6A Appendix II
Physical Unit Sampling Minimum Sample Sizes
assist the auditors.
minimum:
1 sample with 1 random stratum of 60 items.
items, whichever is greater.
Nonhomogenous Frame
A nonhomogenous sampling frame (dissimilar dollars and/or
characteristics) with a coefficient of variation 50% (standard deviation
of frame / frame mean * 100) requires as a minimum:
1 sample with 3 random strata plus a 100% (e.g., high dollar) stratum.
The total sample size should be at least 100 items. Each random
stratum should be at least 30 items except when 30 items would be more than 5% of the items in the entire stratum. In that case, the stratum size can be 5% or 15
Homogenous Frame
A homogenous sampling frame (similar dollars and characteristics) with a coefficient of variation < 50%
(standard deviation of frame / frame mean * 100) requires as a
Physical Unit Sampling
Physical unit sample sizes depend on the variability of the sampling frame. The more variability in the
sampling frame, the larger the sample size required to achieve acceptable sample results.
Minimum sample size guidelines (based on statistical principles) have been established to
11October 31, 2004

Focused Assessment Program Exhibit 6A Appendix II
Physical Unit Sampling Selection Methods
s
wan unnumbered physical frame.
that c ram.
p
and e EQ.
R t
selection).
Other Computer Programs
Other programs, such as Microsoft Access or SAS, may be used if the
electronic frame is too large to fit intoMicrosoft Excel (for analysis, manual
stratification, or application of EZ-QuantANUM) or too large to fit into EZ-Quan
STRAT (for stratification and/or sample
Manual Systematic Interval
A manual selection method that selectsevery nth item by means of a fixed
interval with a random start. It should only be used with an unnumbered
hysical frame when it would produce abetter cross-section or would be quicker
asier than using RAS
EZ-Quant STRAT (Physical Unit Sample Selection Procedure)
A computer procedure that automatically stratifies a universe into equal dollar
strata and randomly selects samplingunits in each stratum. It requires an
electronic frame or small printout/listing an be typed into the prog
EZ-Quant RASEQ(Random Number Sets Generator)
A computer procedure that generates ets of random numbers which can then
be used to select sample items. It worksith an unnumbered printout or listing, or
EZ-Quant RANUM (Random Numbers Generator)
A computer procedure that generates random numbers which can then be used to select sample items. It works with an electronic frame, a numbered printout or
listing frame, or a numbered physical frame.
Physical Unit Sampling
Valid statistical methods require that each physical sampling unit (item or transaction) has an equal or determinable nonzero chance of selection and that
each sampling unit is randomly selected.
12October 31, 2004

Focused Assessment Program Exhibit 6A Appendix II
Physical Unit Sampling Evaluation Methods
of the sample results.
acceptability of the point estimate.
Other Computer Programs
Other computer programs, such as Microsoft Access or SAS, may be necessary to
statistically project and evaluate the sample results if the electronic file is too large for EZ-
Quant SAMPL.
Sampling parameters should be 95% confidence level and < 100% precision
percentage.
EZ-Quant SAMPL(Physical Unit Sample Evaluation Procedure)
A computer procedure that projects the physical unit sample results to the universe
and provides reliability measures for evaluating that projection.
The procedure provides two point estimates (one for the ratio method and one for the difference method) along with associatedprecision dollars and confidence intervals
based on the confidence level specified. The point estimate with the lowest precision
percentage (precision dollars / point estimate) should be selected and its
precision percentage compared to the desired precision percentage from the sampling plan when determining the
Sampling parameters should be 95% confidence level and < 100% precision
percentage.
Physical Unit Sampling
An essential phase of statistical sampling, including physical unit sampling, is the statistical evaluation
13October 31, 2004

Focused Assessment Program Exhibit 6A Appendix II
Dollar Unit Sampling Appropriate Uses
comp tc.).
s).
Anticipated Errors
Infrequent errors, andLarge errors.
Frame Variability
Not widely variable, or Widely variable in terms of dollars but not in terms of characteristics (especially if left skewed with many high dollar items and fewlow dollar item
Sampling Units
Clusters and reviewing allitems in a cluster is not acceptable (i.e., it wouldrequire significantadditional effort).
Frame Format
An electronic file, or A small printout or listingthat can be typed into EZ-Quant.
Dollar Unit Sampling
As a type of variable sampling, dollar unit sampling is appropriate for substantive testing when the
objective is to determine the amount of variance and calculate dollar impacts (materiality
liance rates, revenue due, e
It is appropriate in the same situations and audits where variable sampling is appropriate. Dollar unit
sampling works best WHEN:
14October 31, 2004

Focused Assessment Program Exhibit 6A Appendix II
Dollar Unit Sampling Minimum Sample Sizes
assist the auditors.
Nonhomogenous Frame (High Characteristic Variability)
A nonhomogenous sampling frame (dissimilar characteristics) with a
coefficient of variation >= 50% (standard deviation of frame / frame mean * 100)
requires as a minimum:
Multiple samples of 60 items each (one sample for each characteristic group).
Nonhomogenous Frame (High Dollar Variability)
A nonhomogenous sampling frame (dissimilar dollars) with a coefficient of variation 50% (standard deviation of
frame / frame mean * 100) requires as a minimum:
1 sample of 100 items.
Homogenous Frame
A homogenous sampling frame (similar dollars and characteristics) with a
coefficient of variation < 50% (standard deviation of frame / frame mean * 100)
requires as a minimum:
1 sample of 60 items.
Dollar Unit Sampling
Dollar unit sample sizes depend on the variability of the sampling frame. The more variability in the
sampling frame, the larger the sample size or the more samples required to achieve acceptable
sample results.
Minimum sample size guidelines (based on statistical principles) have been established to
15October 31, 2004

Focused Assessment Program Exhibit 6A Appendix II
Dollar Unit Sampling Selection Methods
Other Computer Programs
Other programs, such as Microsoft Access or SAS, may be used if the electronic frame too large to fit into
Microsoft Excel (for analysis) or too large to fit into EZ-Quant DUSSEL (for sample
selection).
Manual Systematic Interval
A manual selection method that selects every nth dollar by means of a fixed interval with a random start. While
possible to use with a printout/listing frame, it is generally not recommended due to the amount of effort required to
manually select the dollar hits.
Dollar Unit Sampling
Valid statistical methods require that each sampling unit (i.e. dollar) has an equal chance of selection and that each sampling unit is randomly selected.
EZ-Quant DUSSEL (Dollar Unit Sample Selection Procedure)
A computer procedure that automatically selects dollar units using a systematic
interval method. It requires an electronic frame or small printout/listing that can be
typed into the program.
16October 31, 2004

Focused Assessment Program Exhibit 6A Appendix II
Dollar Unit Sampling Evaluation Methods
and confidence intervals based on the
DUS
confidence level and < 100% precision percentage.
Other Computer Programs
Other computer programs, such as Microsoft Access or SAS, may be
necessary to statistically project and evaluate the sample results if the
electronic file is too large for EZ-Quant AM.
Sampling parameters should be 95%
EZ-Quant DUSAM (Dollar Unit Sample Evaluation Procedure)
A computer procedure that projects the dollar unit sample results to the universe
and provides reliability measures for evaluating that projection.
The procedure provides a point estimate along with associated precision dollars
confidence level specified. The achieved precision percentage (precision dollars /
point estimate) should be compared to the desired precision percentage from the sampling plan when determining the acceptability of the point estimate.
Sampling parameters should be 95% confidence level and < 100% precision
percentage.
Dollar Unit Sampling
An essential phase of statistical sampling, including dollar unit sampling, is the statistical evaluation of
the sample results.
17October 31, 2004

Focused Assessment Program Exhibit 6A Appendix II
Attribute Discovery Sampling Appropriate Uses
failure of the universe.
ADD/CVD.
No Anticipated Errors and/or Errors Result in Penalties Rather then Revenue Due
No error is expected in the universe (a low risk universe).
Broker.
Bonded Warehouse.
Any Systemic Error = Noncompliance
The area is sensitive and any systemic error would constitute noncompliance
and/or potential fraud.
FA ACT Unacceptable Risk Areasof Transshipment and Undeclared
Follow Up of Transshipment and Undeclared ADD/CVD.
Attribute Discovery Sampling
Attribute discovery sampling is a special kind of attribute acceptance sampling where the
occurrence of even a single error constitutes a
Attribute discovery sampling is appropriate when the risk of erroneous rejection of a universe is
immaterial, AND:
18October 31, 2004

Focused Assessment Program Exhibit 6A Appendix II
Attribute Discovery Sampling Sample Sizes
Attribute Discovery Sampling
Attribute discovery sample sizes will vary depending n the universe size and sampling parameters.
The larger the universe and the tighter the sampling parameters (the higher the confidence level, the lower
the critical error rate, and the lower the government risk), the larger the required sample size.
o
ar .
EZ-Quant ATTDISC (Attribute Sample Size Determination Procedure)
A computer procedure that calculates the sample size required to achieve the attribute sample objective based on the universe size and specified sampling
parameters.
Sample sizes computed will generally be in the range of 59 to 90.
Sampling parameters when any systemic error results in noncompliance are 5% critical error rate and 1%
government risk.
Sampling parameters when no errors are anticipated or errors result in penalties rather than revenue due
e 5% critical error rate and 5% government risk
19October 31, 2004

Focused Assessment Program Exhibit 6A Appendix II
Attribute Discovery Sampling Selection Methods
to
frame.
ua
I i
E
Quant STRAT (for sample selection).
Other Computer Programs
Other programs, such as Microsoft Access or SAS, may be used if the
electronic frame is too large to fit intoMicrosoft Excel (for application of EZ-
Quant RANUM) or too large to fit into EZ-
Manual Systematic Interval
A manual selection method that selectsevery nth item by means of a fixed interval with a random start. It should only be used with an unnumbered physical frame when t would produce a better cross-section orwould be quicker and easier than using
Z-Quant RASEQ.
EZ-Quant STRAT (Physical Unit Sample Selection Procedure)
A physical unit sample selection computerprocedure that may be used for attribute
discovery sample selection by specifying 1 stratum and no high dollar stratum items.
t requires an electronic frame or smallprintout/listing that can be typed into the
program.
EZ-Quant RASEQ(Random Number Sets Generator)
A computer procedure that generates sets of random numbers which can then be
sed to select sample items. It works withn unnumbered printout or listing, or an
unnumbered physical frame.
EZ-Quant RANUM (Random Numbers Generator)
A computer procedure that generates random numbers which can then be used
select sample items. It works with anelectronic frame, a numbered printout or
listing frame, or a numbered physical
Attribute Discovery Sampling
Valid statistical methods require that each sampling unit has anequal or determinable nonzero chance of selection and each
sampling unit is randomly selected.
20October 31, 2004

Focused Assessment Program Exhibit 6A Appendix II
21October 31, 2004
Attribute Discovery Sampling Evaluation Methods
esEZ-Quant SAMPL Physical Unit Sample Evaluation Procedure may be used to project dollar impacts (e.g., value or
revenue) when applicable.
Sampling parameters should be 95% confidence level and < 100% precision
percentage.
evaluate the sample results if the electronic file is too large for EZ-Quant SAMPL.
Other Computer Programs
Other computer programs, such as Microsoft Access or SAS, may be
necessary to statistically project and
Sampling parameters should be 95% confidence level and < 100% precision
percentage.
EZ-Quant ATTEVAL1 (Attribute Discovery Acceptance Sample
Evaluation Procedure)
If it is necessary to estimate the total error rate in the universe, the EZ-Quant
ATTEVAL1 attribute discovery acceptance sample evaluation procedure may be used
for this purpose.
The confidence level when any systemicerror results in noncompliance is 99%.
The confidence level when no errors are anticipated or errors result in penalties
rather than revenue due is 95%.
EZ-Quant SAMPL(Physical Unit Sample Evaluation
Procedure)
Since attribute discovery samples are lected using physical unit procedures, the
Attribute Discovery Sampling
The purpose of attribute discovery sampling is to determine if any error (usually systemic) exists in the
universe. Any such sample error would result in a failed universe or determination of noncompliance.

Focused Assessment (FA) Sampling Methodology Table Exhibit 6A
Appendix III
Audit Action Sampling Objective Audit Area Sampling Frame Sampling UnitsAnticipated
ErrorsType of Sampling Minimum Sample Size Sampling Parameters Sample Selection Methods
Sample
Evaluation
Methods
FA PAS (Pre-
Assessment
Survey)
To take a survey in order to help
determine: (1 ) the adequacy of
internal controls, (2) whether the
risk to Customs is acceptable or
unacceptable, and (3) if additional
testing (FA ACT) is necessary to
ascertain the extent of
compliance and/or to compute
revenue loss.
Any review area. Any.Physical units (e.g., items,
transactions, files, etc.).Any.
Nonstatistical
(Judgmental)
1 to 20, depending on the initial
risk exposure and internal control
assessment. Low risk exposure =
1 to 10 items (depending on if
internal controls are strong,
adequate or weak). Moderate
risk exposure = 5 to 15 items
(depending on if internal controls
are strong, adequate or weak).
High risk exposure = 10 to 20
items (depending on if internal
controls are strong, adequate or
weak).
N/A
Any method appropriate for the
circumstances. Purposive selection
recommended if possible.
Auditor judgment.
1 October 31, 2004

Focused Assessment (FA) Sampling Methodology Table Exhibit 6A
Appendix III
Audit Action Sampling Objective Audit Area Sampling Frame Sampling UnitsAnticipated
ErrorsType of Sampling Minimum Sample Size Sampling Parameters Sample Selection Methods
Sample
Evaluation
Methods
FA ACT
(Assessment
Compliance
Testing)
To review an identified
unacceptable risk area (from FA
PAS) in order to ascertain the
extent of compliance and/or to
compute revenue loss.
Any identified
unacceptable
risk area that is
small enough to
review in its
entirety.
Any.Physical units (e.g., items,
transactions, files, etc.).Any.
Nonstatistical
(Judgmental)
100% of the identified
unacceptable-risk area (generally
not more than a typical statistical
sample of 60 to 100).
N/A All items are selected.
Actual results
from 100%
review.
2 October 31, 2004

Focused Assessment (FA) Sampling Methodology Table Exhibit 6A
Appendix III
Audit Action Sampling Objective Audit Area Sampling Frame Sampling UnitsAnticipated
ErrorsType of Sampling Minimum Sample Size Sampling Parameters Sample Selection Methods
Sample
Evaluation
Methods
EZ-Quant STRAT - Physical Unit Sample
Selection Procedure. Provides
automatic equal horizontal strata (dollar).
Suitable for an electronic frame or a
small printout/listing that can be typed in.
EZ-Quant RANUM - Random Numbers
Generator. Generates random
numbers. Suitable for an electronic
frame, a numbered printout/listing, or a
numbered physical item frame. Allows
control of strata (horizontal/dollars or
vertical/characteristics) .
EZ-Quant RASEQ - Sets of Random
Numbers Generator. Generates sets of
random numbers. Suitable for
unnumbered printout/listing,
unnumbered physical item frame with a
hierarchical structure. Okay when
stratification is not necessary, the frame
is already stratified, or the frame can be
stratified prior to sample selection.
Manual Systematic Interval Selection.
Suitable for an unnumbered physical
item frame where selecting every nth
item would result in a better cross-
section of items or would be easier and
quicker than using RASEQ.
Other computer programs (e.g.,
Microsoft Access or SAS) may be used if
the electronic frame too large to fit into
Microsoft Excel (for analysis, manual
stratification, or application of EZ-Quant
RANUM) or too large fit into STRAT (for
stratification and/or sample selection).
Homogenous frame (similar
dollars and characteristics) with
coefficient of variation < 50%
(standard deviation of the frame /
frame mean * 100) = 1 sample of
60 items.
EZ-Quant DUSSEL - Dollar Unit Sample
Selection Procedure. Suitable for an
electronic frame. (Manual systematic
interval selection procedures are used to
identify the dollar hit items within
clusters.)
EZ-Quant
DUSAM Dollar
Unit Sample
Evaluation
Procedure.
Nonhomogenous frame
(dissimilar dollars) with coefficient
of variation >= 50% (standard
deviation of the frame / frame
mean * 100) = 1 sample of 100
items. Nonhomogenous frame
(characteristics) with coefficient of
variation >= 50% (standard
deviation of the frame / frame
mean * 100) = multiple samples
of 60 items each.
Other computer programs (e.g.,
Microsoft Access or SAS) may be used if
the electronic frame too large to fit into
Microsoft Excel (for analysis) or too large
to fit into DUSSEL (for sample selection).
Other computer
programs (e.g.,
Microsoft Access
or SAS) may be
used if the
electronic file is
too large for
DUSAM.
FA ACT
To review an identified
unacceptable risk area (from FA
PAS) in order to ascertain the
extent of compliance and/or to
compute revenue loss.
Any identified
unacceptable
risk area that is
too large to
review 100%
(except
transshipment
and undeclared
ADD/CVD).
Homogenous frame (similar
dollars and characteristics) with
coefficient of variation < 50%
(standard deviation of the frame /
frame mean * 100) = 1 sample
with 1 random stratum of 60
items.
Confidence Level =
95%. Desired
Precision < 100%.
Nonhomogenous frame
(dissimilar dollars and/or
characteristics) with coefficient of
variation >= 50% (standard
deviation of the frame / frame
mean * 100) = 1 sample with 3
random strata of 30 items each
plus 1 100% review stratum (e.g.,
high dollar items).
EZ-Quant
SAMPL Physical
Unit Sample
Evaluation
Procedure.
Other computer
programs (e.g.,
Microsoft Access
or SAS) may be
used if the
electronic file is
too large for
SAMPL.
Confidence Level =
95%. Desired
Precision < 100%.
Many errors,
including small
errors.
Statistical Variable
Physical Unit
Few, primarily
large errors.
Statistical Variable
Dollar Unit
Electronic file or small
printout or listing. Frame
is not highly variable in
terms of characteristics
but may be highly
variable in terms of
dollars.
Electronic file, printout or
listing, physical items.
Frame may be highly
variable in terms of
dollars and/or
characteristics.
Individual physical units.
Clusters of physical units and
reviewing entire clusters is
acceptable (e.g., clusters
consist of small number of
items or reviewing whole
clusters does not require
significant additional effort).
Dollars representing clusters
of physical units and
reviewing entire clusters is not
acceptable (e.g., clusters
consist of many items and
reviewing all would require
significant additional effort).
3 October 31, 2004

Focused Assessment (FA) Sampling Methodology Table Exhibit 6A
Appendix III
Audit Action Sampling Objective Audit Area Sampling Frame Sampling UnitsAnticipated
ErrorsType of Sampling Minimum Sample Size Sampling Parameters Sample Selection Methods
Sample
Evaluation
Methods
EZ-Quant STRAT - Physical Unit Sample
Selection Procedure. May be used for
attribute discovery sampling by
designating one stratum and no high
dollar items.
EZ-Quant RANUM - Random Numbers
Generator. Suitable for an electronic
frame, a numbered printout/listing, or a
numbered physical item frame.
EZ-Quant RASEQ - Sets of Random
Numbers Generator. Suitable for
unnumbered printout/listing,
unnumbered physical item frame with a
hierarchical structure.
Manual Systematic Interval Selection.
Suitable for an unnumbered physical
item frame where selecting every nth
item would result in a better cross-
section of items or would be easier and
quicker than using RASEQ.
Other computer programs (e.g.,
Microsoft Access or SAS) may be used if
the electronic frame too large to fit into
Microsoft Excel (for application of EZ-
Quant RANUM) or too large fit into
STRAT (for sample selection).
FA ACT
EZ-Quant
SAMPL Physical
Unit Sample
Evaluation
Procedure (if
possible, for
revenue
estimation).
Other computer
programs (e.g.,
Microsoft Access
or SAS) may be
used if the
electronic file is
too large for
SAMPL.
Confidence Level =
99%. Critical Error
Rate = 5%.
Government Risk =
1%.
Identified
sensitive
unacceptable
risk areas of
transshipment
and undeclared
ADD/CVD.
To review an identified sensitive
unacceptable risk area (from FA
PAS) in order to verify compliance
(i.e., to determine if any systemic
error exists) and to compute
revenue loss if applicable/
appropriate.
Statistical Attribute
DiscoveryNone.
Generally 59 to 90, depending on
the frame size. Determined by
EZ-Quant ATTDISC - Discovery
Acceptance Sample Size
Procedure.
Any.Physical units (e.g., items,
transactions, files, etc.).
4 October 31, 2004

Focused Assessment (FA) Sampling Methodology Table Exhibit 6A
Appendix III
Audit Action Sampling Objective Audit Area Sampling Frame Sampling UnitsAnticipated
ErrorsType of Sampling Minimum Sample Size Sampling Parameters Sample Selection Methods
Sample
Evaluation
Methods
Follow-Up
Any identified
unacceptable
risk area or
noncompliant
area that is
limited in scope
and number.
Any.Physical units (e.g., items,
transactions, files, etc.).Any.
Nonstatistical
(Judgmental)
100% of the identified
unacceptable risk or
noncompliant area (generally not
more than a typical statistical
sample of 60 to 100) or a sample
sufficient to verify internal control
adequacy, compliance, and/or
revenue due.
N/A
All items are selected or any selection
method appropriate for the
circumstances.
Actual results
from 100%
review or auditor
judgment from
judgmental
sample.
To review an identified
unacceptable risk area (from FA
PAS), noncompliant area (from
FA ACT), and/or importer
quantification of
compliance/revenue (from FA
PAS or FA ACT) in order to: (1)
determine if the implemented CIP
corrected the internal control
deficiencies, (2) ascertain the
extent of compliance and/or to
compute revenue loss, (3)
determine whether the risk to
Customs is acceptable or
unacceptable, and/or (4) verify
any importer quantification of
compliance/revenue.
5 October 31, 2004

Focused Assessment (FA) Sampling Methodology Table Exhibit 6A
Appendix III
Audit Action Sampling Objective Audit Area Sampling Frame Sampling UnitsAnticipated
ErrorsType of Sampling Minimum Sample Size Sampling Parameters Sample Selection Methods
Sample
Evaluation
Methods
EZ-Quant STRAT - Physical Unit Sample
Selection Procedure. Provides
automatic equal horizontal strata (dollar).
Suitable for an electronic frame or a
small printout/listing that can be typed in.
EZ-Quant RANUM - Random Numbers
Generator. Suitable for an electronic
frame, a numbered printout/listing, or a
numbered physical item frame. Allows
control of strata (horizontal/dollars or
vertical/characteristics) .
EZ-Quant RASEQ - Sets of Random
Numbers Generator. Suitable for
unnumbered printout/listing,
unnumbered physical item frame with a
hierarchical structure. Okay when
stratification is not necessary, the frame
is already stratified, or the frame can be
stratified prior to sample selection.
Manual Systematic Interval Selection.
Suitable for an unnumbered physical
item frame where selecting every nth
item would result in a better cross-
section of items or would be easier and
quicker than using RASEQ.
Other computer programs (e.g.,
Microsoft Access or SAS) may be used if
the electronic frame too large to fit into
Microsoft Excel (for analysis, manual
stratification, or application of EZ-Quant
RANUM) or too large fit into STRAT (for
stratification and/or sample selection).
Homogenous frame (dollars and
characteristics) with coefficient of
variation < 50% (standard
deviation of the frame / frame
mean * 100) = 1 sample of 60
items.
EZ-Quant DUSSEL - Dollar Unit Sample
Selection Procedure. Suitable for an
electronic frame.
Nonhomogenous frame (dollars)
with coefficient of variation >=
50% (standard deviation of the
frame / frame mean * 100) = 1
sample of 100 items.
Nonhomogenous frame
(characteristics) with coefficient of
variation >= 50% (standard
deviation of the frame / frame
mean * 100) = multiple samples
of 60 items each.
Other computer programs (e.g.,
Microsoft Access or SAS) may be used if
the electronic frame too large to fit into
Microsoft Excel (for analysis) or too large
to fit into DUSSEL (for sample selection).
To review an identified
unacceptable risk area (from FA
PAS), noncompliant area (from
FA ACT), and/or importer
quantification of
compliance/revenue (from FA
PAS or FA ACT) in order to: (1)
determine if the implemented CIP
corrected the internal control
deficiencies, (2) ascertain the
extent of compliance and/or to
compute revenue loss, (3)
determine whether the risk to
Customs is acceptable or
unacceptable, and/or (4) verify
any importer quantification of
compliance/ revenue.
Follow-Up
Individual physical units.
Clusters of physical units and
reviewing entire clusters is
acceptable (e.g., clusters
consist of small number of
items or reviewing whole
clusters does not require
significant additional effort).
Statistical Variable
Physical Unit
Many errors,
including small
errors.
Confidence Level =
95%. Desired
Precision < 100%.
Other computer
programs (e.g.,
Microsoft Access
or SAS) may be
used if the
electronic file is
too large for
SAMPL.
EZ-Quant
SAMPL Physical
Unit Sample
Evaluation
Procedure.
Electronic file, printout or
listing, physical items.
Frame may be highly
variable in terms of
dollars and/or
characteristics.
Confidence Level =
95%. Desired
Precision < 100%.
EZ-Quant
DUSAM Dollar
Unit Sample
Evaluation
Procedure.
Any identified
unacceptable
risk area or
noncompliant
area that is
broad in scope
and/or number
(except
transshipment
and undeclared
ADD/CVD).
Electronic file or small
printout or listing. Frame
is not highly variable in
terms of characteristics
but may be highly
variable in terms of
dollars.
Homogenous frame (dollars and
characteristics) with coefficient of
variation < 50% (standard
deviation of the frame / frame
mean * 100) = 1 sample with 1
random stratum of 60 items.
Statistical Variable
Dollar Unit
Dollars representing clusters
of physical units and
reviewing entire clusters is not
acceptable (e.g., clusters
consist of many items and
reviewing all would require
significant additional effort).
Few, primarily
large errors.
Nonhomogenous frame (dollars
and/or characteristics) with
coefficient of variation >= 50%
(standard deviation of the frame /
frame mean * 100) = 1 sample
with 3 random strata of 30 items
each plus 1 100% review stratum
(e.g., high dollar items).
6 October 31, 2004

Focused Assessment (FA) Sampling Methodology Table Exhibit 6A
Appendix III
Audit Action Sampling Objective Audit Area Sampling Frame Sampling UnitsAnticipated
ErrorsType of Sampling Minimum Sample Size Sampling Parameters Sample Selection Methods
Sample
Evaluation
Methods
EZ-Quant STRAT - Physical Unit Sample
Selection Procedure. May be used for
attribute discovery sampling by
designating one stratum and no high
dollar items.
EZ-Quant RANUM - Random Numbers
Generator. Suitable for an electronic
frame, a numbered printout/listing, or a
numbered physical item frame.
EZ-Quant RASEQ - Sets of Random
Numbers Generator. Suitable for
unnumbered printout/listing,
unnumbered physical item frame with a
hierarchical structure.
Manual Systematic Interval Selection.
Suitable for an unnumbered physical
item frame where selecting every nth
item would result in a better cross-
section of items or would be easier and
quicker than using RASEQ.
Other programs (e.g., Microsoft Access
or SAS) may be used if the electronic
frame too large to fit into Microsoft Excel
(for application of EZ-Quant RANUM) or
too large fit into STRAT (for sample
selection).
Follow-Up
To review an identified
unacceptable risk area (from FA
PAS), noncompliant area (from
FA ACT), and/or importer
quantification of
compliance/revenue (from FA
PAS or FA ACT) in order to: (1)
determine if the implemented CIP
corrected the internal control
deficiencies, (2) ascertain the
extent of compliance and/or to
compute revenue loss, (3)
determine whether the risk to
Customs is acceptable or
unacceptable, and/or (4) verify
any importer quantification of
compliance/revenue.
Statistical Attribute
DiscoveryNone.
Identified
sensitive
unacceptable
risk areas or
noncompliant
areas of
transshipment
or undeclared
ADD/CVD that
are broad in
scope and
number.
Other computer
programs (e.g.,
Microsoft Access
or SAS) may be
used if the
electronic file is
too large for
SAMPL.
EZ-Quant
SAMPL Physical
Unit Sample
Evaluation
Procedure (if
possible, for
revenue
estimation).
Generally 59 to 90, depending on
the frame size. Determined by
EZ-Quant ATTDISC - Discovery
Acceptance Sample Size
Procedure.
Confidence Level =
99%. Critical Error
Rate = 5%.
Government Risk =
1%.
Physical units (e.g., items,
transactions, files, etc.).Any.
7 October 31, 2004

Sampling Plans Exhibit 6AAppendix IV
AUDIT TYPE:
REVIEW AREA:
SAMPLING OBJECTIVE:
Type of Sampling:
Other (explain):
Confidence Level:
Desired Precision (< 100%):
Universe Description:
Frame Description:
Frame Size:
Frame Value:
Frame Duty:
No (explain):
Median:
Standard
Deviation
(STDEVP):
Mean (Average):
Skewed Left (Mean <
Median) or Right (Mean >
Median)?
Dollar Variability of Frame High (High Skewness, High STDEVP, High CV >=50%) or Low (Low Skewness, Low
STDEVP, Low CV < 50%?
Frame Variability Analysis
Mode:
Are there evident categories of sampling units (characteristic groups) which would be expected to have similar types &
frequency of errors? (Yes or No)
If yes, how many such characteristic groups are identified?
Dollar Variability:
Characteristic Variability:
Coefficient of Variation (CV =
STDEVP / Mean * 100):
Frame Validated?Yes
95%
Universe and Frame Information
Sampling Approach
Variable Physical Unit Sampling (A type of variable sampling in which the sampling unit is an item or transaction. Variable sampling is
a form of substantive testing that is quantitative in nature, can be used to determine the amount of variance, and may result in dollar
impacts.)
Why Used ? Check All That Apply:
Stratification is desired (for accuracy and/or targeting).
Clusters are present, but reviewing all items in a cluster or performing multi-stage sampling is acceptable.
An electronic universe is not available.
Many errors are expected (including small errors).
Sampling Plan - Variable Physical Unit Sample
Sampling Application
1 October 31, 2004

Sampling Plans Exhibit 6AAppendix IV
Sampling Unit Description:
Sample Size:
Sample Size Method/Basis:
Strata Details: Frame Size Frame Value Frame Duty Sample Size Sample Value Sample Duty
100% Review Stratum:
Random Stratum 1:
Random Stratum 2:
Random Stratum 3:
Random Stratum 4:
Random Stratum 5:
Random Stratum 6:
Random Stratum 7:
Random Stratum 8:
Totals: 0 $0 $0.00 0 $0 $0.00
Random Seed:
Random Seed:
Random Seed:
Other:
Total Number Total ValueSystemic
NumberSystemic Value
Recurring
NumberRecurring Value
Errors:
Sample Results - Errors
Sample Selection Method:
EZ-Quant RANUM - Random Numbers Generator
EZ-Quant RASEQ - Random Number Sets Generator
EZ-Quant STRAT - Physical Unit Sample Selection Procedure
Description
Sample Information
2 October 31, 2004

Sampling Plans Exhibit 6AAppendix IV
A1
A2
B
C
D
E
F
Noncompliant
Amount
Total
Noncompliant
Amount for the
Trade Area
Noncompliant
Factor Compliance Rate Compliant? Y/N
N/A N/A N/A N/A
N/A N/A N/A
N/A N/A
N/A N/A
Area and Rule/Formula:
Total Trade Area Dollars:
Total Sample Dollars:
Sample Results - Compliance
Actual Compliance Rate If Known:
Compliance Based on Sample Results
Absolute Value of All Systemic Errors on Randomly Selected
Sample Items (Material Systemic Errors for Classification):
Absolute Value of All Systemic Errors on Judgmentally Selected or
100% Review Sample Items (Material Systemic Errors for
Classification):
Other Areas. If C < D (i.e., the frame does not represent the entire trade area) then
(A1 / B * C) + A2 = Noncompliant Amount for this sample only. Noncompliant
Amount for this sample must be added to Noncompliant Amounts for all other
samples to get Total Noncompliant Amount for the Trade Area. Total Noncompliant
Amount for the Trade Area / D = Noncompliant Factor. 1 - Noncompliant Factor * 100
= Compliance Rate. If Compliance Rate >= 99%, then Compliant. If Compliance
Rate < 99%, then Not Compliant.
Other Areas. If C = D (i.e., the frame represents the entire trade area) then (A1 +
A2) / B = Noncompliant Factor. 1 - Noncompliant Factor * 100 = Compliance Rate. If
Compliance Rate >= 99%, then Compliant. If Compliance Rate < 99%, then Not
Compliant.
Total Frame Dollars:
1% of Entered Value (for Value Only):
Value. If C = D (i.e., the frame represents the entire trade area) then (A1/B *C) + A2
= Noncompliant Amount. If Noncompliant Amount <= F, then Compliant. If
Noncompliant Amount > F, then Not Compliant.
Value. If C < D (i.e., the frame does not represent the entire trade area) then (A1 / B
*C) + A2 = Noncompliant Amount for this sample only. Noncompliant Amount for this
sample must be added to the Noncompliant Amounts for all other value samples to
get the Total Noncompliant Amount for the Trade Area. If Total Noncompliant
Amount for the Trade Area <= F, then Compliant. If Total Noncompliant Amount for
the Trade Area > F, then Not Compliant.
Transshipment or Undeclared ADD/CVD. Any Systemic Error = Noncompliant.
Lessor of 1% of Entered Value or $10,000,000 (for Value Only):
3 October 31, 2004
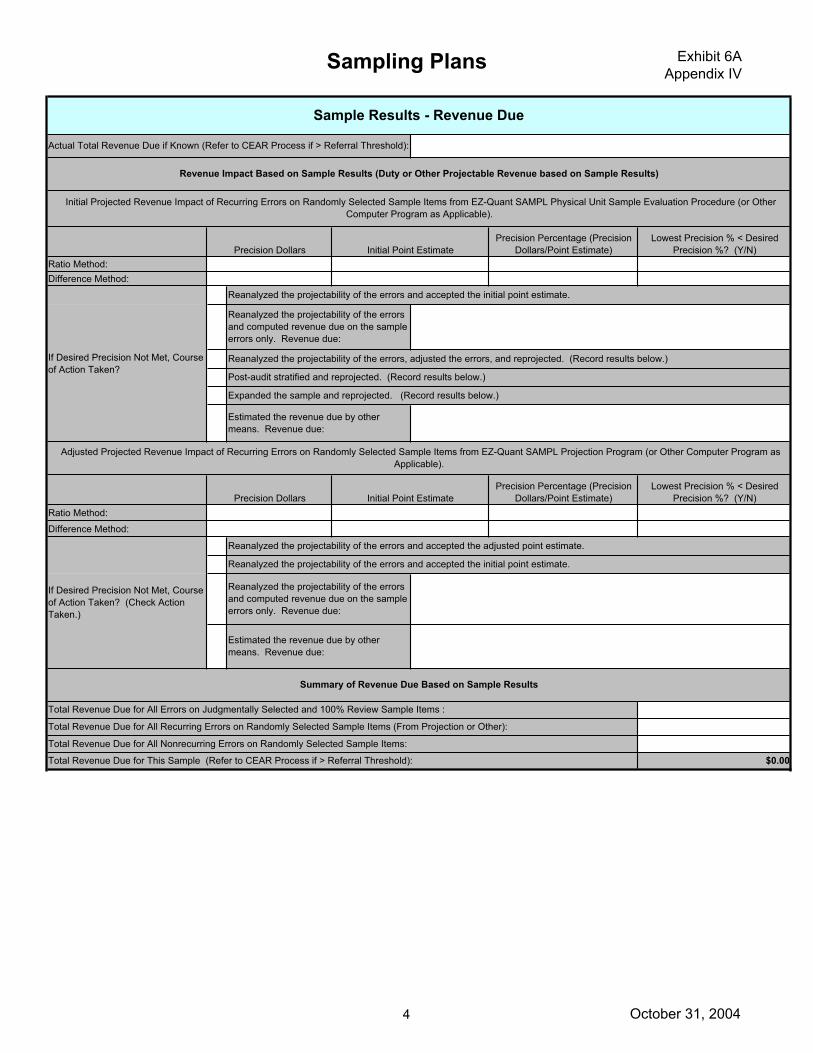
Sampling Plans Exhibit 6AAppendix IV
Ratio Method:
Difference Method:
Ratio Method:
Difference Method:
Precision Percentage (Precision
Dollars/Point Estimate)
Lowest Precision % < Desired
Precision %? (Y/N)Precision Dollars
Total Revenue Due for All Errors on Judgmentally Selected and 100% Review Sample Items :
Total Revenue Due for All Recurring Errors on Randomly Selected Sample Items (From Projection or Other):
If Desired Precision Not Met, Course
of Action Taken? (Check Action
Taken.)
Reanalyzed the projectability of the errors and accepted the adjusted point estimate.
Reanalyzed the projectability of the errors and accepted the initial point estimate.
Reanalyzed the projectability of the errors
and computed revenue due on the sample
errors only. Revenue due:
Estimated the revenue due by other
means. Revenue due:
Initial Point Estimate
If Desired Precision Not Met, Course
of Action Taken?
Precision Percentage (Precision
Dollars/Point Estimate)Initial Point Estimate
Reanalyzed the projectability of the errors and accepted the initial point estimate.
Reanalyzed the projectability of the errors
and computed revenue due on the sample
errors only. Revenue due:
Reanalyzed the projectability of the errors, adjusted the errors, and reprojected. (Record results below.)
Post-audit stratified and reprojected. (Record results below.)
Expanded the sample and reprojected. (Record results below.)
Estimated the revenue due by other
means. Revenue due:
Initial Projected Revenue Impact of Recurring Errors on Randomly Selected Sample Items from EZ-Quant SAMPL Physical Unit Sample Evaluation Procedure (or Other
Computer Program as Applicable).
Precision Dollars
Lowest Precision % < Desired
Precision %? (Y/N)
Sample Results - Revenue Due
Revenue Impact Based on Sample Results (Duty or Other Projectable Revenue based on Sample Results)
Actual Total Revenue Due if Known (Refer to CEAR Process if > Referral Threshold):
$0.00Total Revenue Due for This Sample (Refer to CEAR Process if > Referral Threshold):
Adjusted Projected Revenue Impact of Recurring Errors on Randomly Selected Sample Items from EZ-Quant SAMPL Projection Program (or Other Computer Program as
Applicable).
Summary of Revenue Due Based on Sample Results
Total Revenue Due for All Nonrecurring Errors on Randomly Selected Sample Items:
4 October 31, 2004

Sampling Plans Exhibit 6AAppendix IV
A1
A2
B
C
D
Value Impact for
Sample
Total Value
Impact for Trade
Area
N/A
Total Value Impact for Trade Area
> CEAR Process Referral
Threshold? (Y/N. If Y, then
Refer)
Total Frame Dollars:
Total Trade Area Dollars:
Sample Results - Other Years/Areas
Are Other Years or Areas Outside
the Sampling Frame Affected? Do
the Sample Results Apply to Other
Years or Areas Outside the Sampling
Frame?
Yes (Determine how to calculate the revenue due and value impact for the other years/areas.)
No
If C = D (i.e., the frame represents the entire trade area) then (A1 / B * C) + A2 = Total Value Impact.
If C < D (i.e., the frame does not represent the entire trade area) then (A1 / B * C) + A2 = Value Impact
for this sample only. Value Impact for this sample must be added to the Value Impact for all other
samples to get the Total Value Impact for the Trade Area.
Rule/Formula:
Absolute Value of All Nonrecurring Errors on Randomly Selected
Sample Items and All Recurring Errors on Judgmentally Selected
or 100% Review Sample Items:
Total Sample Dollars:
Sample Results - Value Impact
Value Impact Based on Sample Results
Actual Total Value Impact If Known (Refer to CEAR Process if > Referral Threshold):
Absolute Value of All Recurring Errors on Randomly Selected
Sample Items:
5 October 31, 2004

Sampling Plans Exhibit 6AAppendix IV
AUDIT TYPE:
REVIEW AREA:
SAMPLING OBJECTIVE:
Type of Sampling:
Other (explain):
Confidence Level:
Desired Precision (< 100%):
Universe Description:
Frame Description:
Frame Size:
Frame Value:
Frame Duty:
No (explain):
Median:
Standard
Deviation
(STDEVP):
Frame Variability Analysis
Dollar Variability:
Mean (Average): Mode:
Skewed Left (Mean <
Median) or Right (Mean >
Median)?
Coefficient of Variation (CV =
STDEVP / Mean * 100):
Dollar Variability of Frame High (High Skewness, High STDEVP, High CV >=50%) or Low (Low Skewness, Low
STDEVP, Low CV < 50%?
Frame Validated?Yes
95%
Universe and Frame Information
Sampling Approach
Variable Dollar Unit Sampling (A type of variable sampling in which the sampling unit is a dollar. Variable sampling is a form of
substantive testing that is quantitative in nature, can be used to determine the amount of variance, and may result in dollar impacts.)
Why Used ? Check All That Apply:
Desire to emphasize higher dollars and stratification for any other purpose is not needed/desired.
Clusters are present, and reviewing all items in a cluster or performing multi-stage sampling is not acceptable.
An electronic universe is available.
Few errors are expected (primarily large errors).
Sampling Plan - Variable Dollar Unit Sample
Sampling Application
Characteristic Variability:
Are there evident categories of sampling units (characteristic groups) which would be expected to have similar types &
frequency of errors? (Yes or No)
If yes, how many such characteristic groups are identified?
1 October 31, 2004

Sampling Plans Exhibit 6AAppendix IV
Sampling Unit Description:
Sample Size:
Sample Size Method/Basis:
Strata Details: Frame Size Frame Value Frame Duty Sample Size Sample Value Sample Duty
100% Review Stratum:
Random Stratum:
Totals: 0 $0 $0.00 0 $0 $0.00
Random Seed:
Other:
Total Number Total ValueSystemic
NumberSystemic Value
Recurring
NumberRecurring Value
Sample Selection Method:
Sample Information
A Dollar
Description
Errors:
Sample Results - Errors
EZ-Quant DUSSEL - Dollar Unit Sample Selection Procedure
2 October 31, 2004

Sampling Plans Exhibit 6AAppendix IV
A1
A2
BCDEF
Noncompliant
Amount
Total
Noncompliant
Amount for the
Trade Area
Noncompliant
Factor Compliance Rate Compliant? Y/N
N/A N/A N/A N/A
N/A N/A N/A
N/A N/A
N/A N/A
Absolute Value of All Systemic Errors on Judgmentally Selected or
100% Review Sample Items (Material Systemic Errors for
Classification):
Total Sample Dollars:
1% of Entered Value (for Value Only):
Total Frame Dollars:
Total Trade Area Dollars:
Transshipment or Undeclared ADD/CVD. Any Systemic Error = Noncompliant.
Value. If C = D (i.e., the frame represents the entire trade area) then (A1/B *C) + A2 =
Noncompliant Amount. If Noncompliant Amount <= F, then Compliant. If
Noncompliant Amount > F, then Not Compliant.
Value. If C < D (i.e., the frame does not represent the entire trade area) then (A1 / B
*C) + A2 = Noncompliant Amount for this sample only. Noncompliant Amount for this
sample must be added to the Noncompliant Amounts for all other value samples to get
the Total Noncompliant Amount for the Trade Area. If Total Noncompliant Amount for
the Trade Area <= F, then Compliant. If Total Noncompliant Amount for the Trade
Area > F, then Not Compliant.
Other Areas. If C = D (i.e., the frame represents the entire trade area) then (A1 + A2)
/ B = Noncompliant Factor. 1 - Noncompliant Factor * 100 = Compliance Rate. If
Compliance Rate >= 99%, then Compliant. If Compliance Rate < 99%, then Not
Compliant.
Lessor of 1% of Entered Value or $10,000,000 (for Value Only):
Other Areas. If C < D (i.e., the frame does not represent the entire trade area) then
(A1 / B * C) + A2 = Noncompliant Amount for this sample only. Noncompliant Amount
for this sample must be added to Noncompliant Amounts for all other samples to get
Total Noncompliant Amount for the Trade Area. Total Noncompliant Amount for the
Trade Area / D = Noncompliant Factor. 1 - Noncompliant Factor * 100 = Compliance
Rate. If Compliance Rate >= 99%, then Compliant. If Compliance Rate < 99%, then
Not Compliant.
Area and Rule/Formula:
Sample Results - Compliance
Actual Compliance Rate If Known:
Compliance Based on Sample Results
Absolute Value of All Systemic Errors on Randomly Selected
Sample Items (Material Systemic Errors for Classification):
3 October 31, 2004

Sampling Plans Exhibit 6AAppendix IV
Precision Analysis:
Precision Analysis:
Initial Projected Revenue Impact of Recurring Errors on Randomly Selected Sample Items from EZ-Quant DUSAM Dollar Unit Sample Evaluation Procedure (or Other Computer
Program as Applicable).
Sample Results - Revenue Due
Summary of Revenue Due Based on Sample Results
$0.00
If Desired Precision Not Met, Course
of Action Taken?
Reanalyzed the projectability of the errors and accepted the adjusted point estimate.
Reanalyzed the projectability of the errors and accepted the initial point estimate.
Reanalyzed the projectability of the errors
and computed revenue due on the sample
errors only. Revenue due:
Estimated the revenue due by other
means. Revenue due:
Reanalyzed the projectability of the errors, adjusted the errors, and reprojected. (Record results below.)
Precision Dollars
Adjusted Projected Revenue Impact of Recurring Errors on Randomly Selected Sample Items from EZ-Quant DUSAM Projection Program (or Other Computer Program as
Applicable).
Estimated the revenue due by other
means. Revenue due:
If Desired Precision Not Met, Course
of Action Taken? (Check Action
Taken.)
Initial Point Estimate
Precision Percentage (Precision
Dollars/Point Estimate)
Lowest Precision % < Desired
Precision %? (Y/N)
Expanded the sample and reprojected. (Record results below.)
Reanalyzed the projectability of the errors and accepted the initial point estimate.
Reanalyzed the projectability of the errors
and computed revenue due on the sample
errors only. Revenue due:
Lowest Precision % < Desired
Precision %? (Y/N)Precision Dollars Initial Point Estimate
Precision Percentage (Precision
Dollars/Point Estimate)
Revenue Impact Based on Sample Results (Duty or Other Projectable Revenue based on Sample Results)
Actual Total Revenue Due if Known (Refer to CEAR Process if > Referral Threshold):
Total Revenue Due for All Errors on Judgmentally Selected and 100% Review Sample Items :
Total Revenue Due for All Recurring Errors on Randomly Selected Sample Items (From Projection or Other):
Total Revenue Due for All Nonrecurring Errors on Randomly Selected Sample Items:
Total Revenue Due for This Sample (Refer to CEAR Process if > Referral Threshold):
4 October 31, 2004

Sampling Plans Exhibit 6AAppendix IV
A1
A2
B
C
D
Value Impact for
Sample
Total Value
Impact for Trade
Area
N/A
Sample Results - Other Years/Areas
Are Other Years or Areas Outside the
Sampling Frame Affected? Do the
Sample Results Apply to Other Years
or Areas Outside the Sampling
Frame?
Yes (Determine how to calculate the revenue due and value impact for the other years/areas.)
No
Total Trade Area Dollars:
If C < D (i.e., the frame does not represent the entire trade area) then (A1 / B * C) + A2 = Value Impact
for this sample only. Value Impact for this sample must be added to the Value Impact for all other
samples to get the Total Value Impact for the Trade Area.
Rule/Formula:
Total Value Impact for Trade Area
> CEAR Process Referral
Threshold? (Y/N. If Y, then
Refer)
If C = D (i.e., the frame represents the entire trade area) then (A1 / B * C) + A2 = Total Value Impact.
Total Frame Dollars:
Absolute Value of All Recurring Errors on Randomly Selected
Sample Items:
Absolute Value of All Nonrecurring Errors on Randomly Selected
Sample Items and All Recurring Errors on Judgmentally Selected or
100% Review Sample Items:
Total Sample Dollars:
Sample Results - Value Impact
Value Impact Based on Sample Results
Actual Total Value Impact If Known (Refer to CEAR Process if > Referral Threshold):
5 October 31, 2004

Sampling Plans Exhibit 6A
Appendix IV
AUDIT TYPE:
REVIEW AREA:
SAMPLING OBJECTIVE:
Type of Sampling:
Other (explain):
Set 1:
Set 2:
Confidence Level:
Desired Precision (< 100%):
Universe Description:
Frame Description:
Frame Size:
Frame Value:
Frame Duty:
No (explain):Frame Validated?
Yes
Sampling Plan - Attribute Discovery Sample
Sampling Application
Sampling Approach
Attribute Discovery Sampling (A special case of attribute acceptance sampling where the occurrence of even a
single error constitutes a failure of the universe. Attribute sampling is a form of compliance testing that is qualitative is
nature, can be used to determine the rate of occurrence, and may result in system changes.)
Why Used ?The area is sensitive and any systemic error would constitute noncompliance (e.g. ADD/CVD, transshipment). [Use
Set 1 Parameters below.]
No error is expected in the universe. [May use Set 2 Parameters below if only this reason applies.]
The risk of erroneous rejection of a universe is irrelevant, the purpose is not to determine dollar compliance rates or
project revenue, and (check those that apply):
Universe and Frame Information
Sampling Parameters for Sample Size and Error Estimation if Applicable (Select the Set that Applies):
Confidence Level = 99% Critical Error Rate = 5% Government Risk = 1%
Confidence Level = 99% Critical Error Rate = 5% Government Risk = 1%
Sampling Parameters for Dollar Estimation if Applicable:
95%
1 October 31, 2004

Sampling Plans Exhibit 6A
Appendix IV
Sampling Unit Description:
Sample Size:
Sample Value:
Sample Duty:
Sample Size Method/Basis:
Random Seed:
Random Seed:
Other:
Total Number Total ValueSystemic
NumberSystemic Value
Recurring
NumberRecurring Value
Yes. (Rate &
Calculation):
No. (Rate &
Calculation):
N/A (Explain):
EZ-Quant RANUM - Random Numbers Generator
EZ-Quant RASEQ - Random Number Sets Generator
Sample Information
EZ-Quant ATTDISC - Discovery Acceptance Sample Size Procedure
Errors:
Sample Results - Compliance
Transshipment or Undeclared
ADD/CVD (Any Systemic Error =
Noncompliant):
Compliant?
Sample Selection Method:
Yes
No
Sample Results - Errors
Other Area:
2 October 31, 2004

Sampling Plans Exhibit 6A
Appendix IV
Initial Point
Estimate
Ratio Method:
Difference Method:
Adjusted Point
Estimate
Ratio Method:
Difference Method:
Precision Dollars
Precision Percentage (Precision
Dollars/Point Estimate)
Lowest Precision % < Desired
Precision %? (Y/N)
Revenue Impact Based on Sample Results (Duty or Other Projectable Revenue based on Sample Results)
Initial Projected Revenue Impact of Recurring Errors on Randomly Selected Sample Items from EZ-Quant SAMPL Physical Unit Sample Evaluation Procedure
(or Other Computer Program as Applicable).
Sample Results - Revenue Due (If Applicable)
Actual Total Revenue Due if Known (Refer to CEAR Process if > Referral Threshold):
If Desired Precision Not Met, Course
of Action Taken?
Reanalyzed the projectability of the errors and accepted the initial point estimate.
Reanalyzed the projectability of the errors
and computed revenue due on the sample
errors only. Revenue due:
Reanalyzed the projectability of the errors, adjusted the errors, and reprojected. (Record results below.)
Post-audit stratified and reprojected. (Record results below.)
Expanded the sample and reprojected. (Record results below.)
Estimated the revenue due by other
means. Revenue due:
Adjusted Projected Revenue Impact of Recurring Errors on Randomly Selected Sample Items from EZ-Quant SAMPL Projection Program (or Other Computer
Program as Applicable).
Precision Dollars
Precision Percentage (Precision
Dollars/Point Estimate)
Lowest Precision % < Desired
Precision %? (Y/N)
If Desired Precision Not Met, Course
of Action Taken? (Check Action
Taken.)
Reanalyzed the projectability of the errors and accepted the adjusted point estimate.
Reanalyzed the projectability of the errors and accepted the initial point estimate.
Reanalyzed the projectability of the errors
and computed revenue due on the sample
errors only. Revenue due:
Estimated the revenue due by other
means. Revenue due:
Summary of Revenue Due Based on Sample Results
Total Revenue Due for All Errors on Judgmentally Selected and 100% Review Sample Items :
Total Revenue Due for All Recurring Errors on Randomly Selected Sample Items (From Projection or Other):
Total Revenue Due for All Nonrecurring Errors on Randomly Selected Sample Items:
Total Revenue Due for This Sample (Refer to CEAR Process if > Referral Threshold): $0.00
3 October 31, 2004

Sampling Plans Exhibit 6A
Appendix IV
A1
A2
B
C
D
Value Impact for
Sample
Total Value
Impact for Trade
Area
N/A
Average Error Rate for the Frame (Number of Errors / Sample Size OR Point Estimate or Sample Occurrence Rate from EZ-Quant
ATTEVAL1 Attribute Discovery Acceptance Sample Evaluation Procedure):
Maximum Error Rate for the Frame (Upper Limit or Upper Precision Limit from EZ-Quant ATTEVAL1 Attribute Discovery Acceptance
Sample Evaluation Procedure):
Total Sample Dollars:
Sample Results - Error Rate (If Applicable)
Are Other Years or Areas Outside
the Sampling Frame Affected? Do
the Sample Results Apply to Other
Years or Areas Outside the Sampling
Frame?
Yes (Determine how to calculate the revenue due and value impact for the other years/areas.)
No
Sample Results - Other Years/Areas
Total Trade Area Dollars:
Absolute Value of All Recurring Errors on Randomly Selected
Sample Items:
Absolute Value of All Nonrecurring Errors on Randomly Selected
Sample Items and All Recurring Errors on Judgmentally Selected
or 100% Review Sample Items:
Sample Results - Value Impact
Actual Total Value Impact If Known (Refer to CEAR Process if > Referral Threshold):
Value Impact Based on Sample Results
Total Frame Dollars:
If C < D (i.e., the frame does not represent the entire trade area) then (A1 / B * C) +
A2 = Value Impact for this sample only. Value Impact for this sample must be added
to the Value Impact for all other samples to get the Total Value Impact for the Trade
Area.
Total Value Impact for Trade Area
> CEAR Process Referral
Threshold? (Y/N. If Y, then Refer)
If C = D (i.e., the frame represents the entire trade area) then (A1 / B * C) + A2 =
Total Value Impact.
4 October 31, 2004

Sampling Plans Exhibit 6A
Appendix IV
AUDIT TYPE:
REVIEW AREA:
SAMPLING OBJECTIVE:
Type of Sampling:
Universe Description:
Frame Description:
Frame Size:
Frame Value:
Frame Duty:
Sampling Plan - Nonstatistical (Judgmental) Sample
Sampling Application
Sampling Approach
Nonstatistical (Judgmental) Sampling (Any selection procedure in which the test items are determined by judgment
or other than random methods.)
Why Used ? Check All That Apply:
The purpose is to take a survey in order to determine the necessity for and extent of substantive tests.
There is a desire to concentrate audit effort in specific problem area revealed by a previous sample or other source
of information.
The universe is very small and it would be quicker and easier to review all or most of the items in the universe.
Statistical results are not needed, there is a high degree of certainty that a conclusion can be drawn without further
sampling, and (check those that apply):
The area is very sensitive and there is no room for error or exact results are needed so all of the items in the
universe will be reviewed.
Universe and Frame Information
1 October 31, 2004

Sampling Plans Exhibit 6A
Appendix IV
Sampling Unit Description:
Sample Size:
Sample Value:
Sample Duty:
Sample Selection Method & Reason:
Total Number Total DollarsSystemic
NumberSystemic Dollars
Recurring
NumberRecurring Dollars
Purposive test - units are selected based on known or suspected problems (e.g. units from accounts with suspect
names are selected). Exercise caution to avoid overstating the problem by applying results to untested areas.
Example Sample Selection Methods:
Sample Information
Cross-section test - units from all parts of an area are selected (e.g. 5% to be sampled by selecting approximately
every 10th item or by haphazardly selecting items here and there).
Large dollar test - the largest dollar units are selected (e.g. the top 10 dollar value transactions). Exercise caution
when attempting to apply conclusions to smaller dollar units. Also, keep in mind that the smaller dollar items are often a
better indicator of weaknesses in controls and procedures.
Block test - a specific section or block of units is selected for review (e.g. all transactions in a particular month).
Exercise caution when applying conclusions to untested blocks.
Convenience test - the most readily available units are selected (e.g. units in the auditee's office file drawers, rather
than units in off-site storage). This method rarely reflects good auditor judgment, may be manipulated by the auditee,
and is not recommended.
Sample Results - Errors
Errors:
2 October 31, 2004
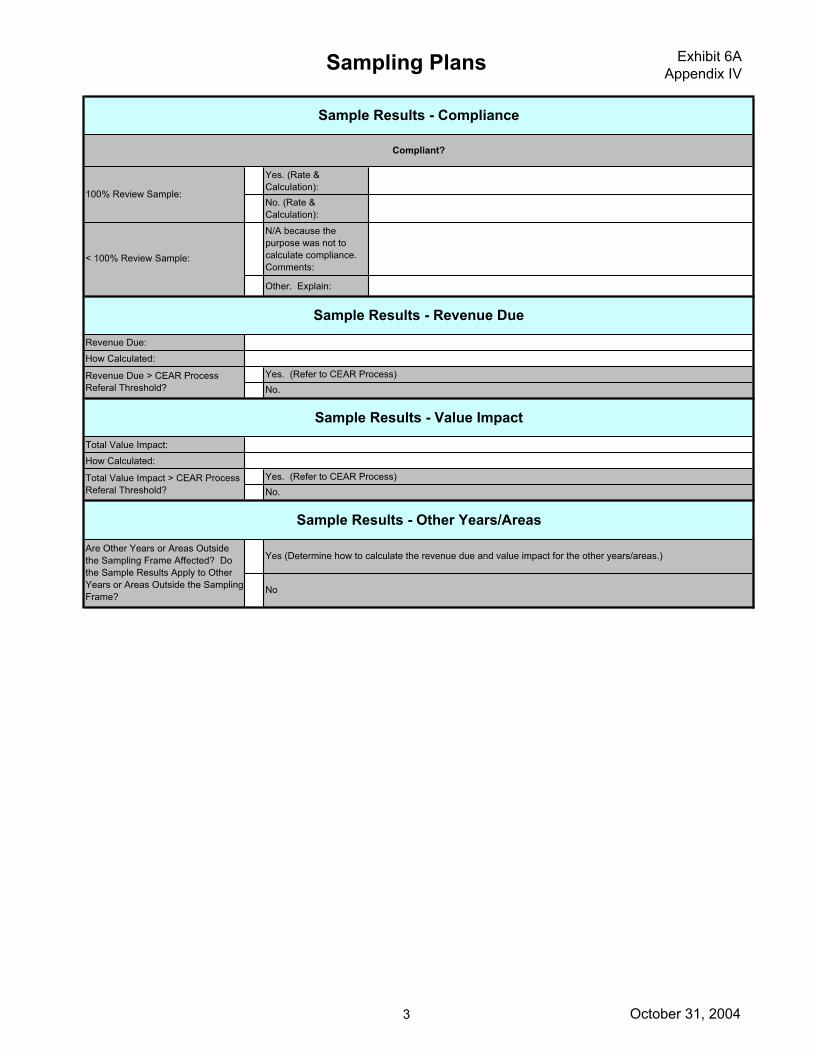
Sampling Plans Exhibit 6A
Appendix IV
Yes. (Rate &
Calculation):
No. (Rate &
Calculation):
N/A because the
purpose was not to
calculate compliance.
Comments:
Other. Explain:
Revenue Due:
How Calculated:
Total Value Impact:
How Calculated:
Sample Results - Compliance
Compliant?
100% Review Sample:
Sample Results - Revenue Due
< 100% Review Sample:
Yes. (Refer to CEAR Process)
No.
Revenue Due > CEAR Process
Referal Threshold?
Yes. (Refer to CEAR Process)
No.
Sample Results - Other Years/Areas
Are Other Years or Areas Outside
the Sampling Frame Affected? Do
the Sample Results Apply to Other
Years or Areas Outside the Sampling
Frame?
Yes (Determine how to calculate the revenue due and value impact for the other years/areas.)
No
Sample Results - Value Impact
Total Value Impact > CEAR Process
Referal Threshold?
3 October 31, 2004

Focused Assessment Program Exhibit 6A Appendix V
Example Audit Report Tables
NOTE: These examples are designed to illustrate sample tables for Focused Assessment audits. These sample tables should be adjusted as appropriate and used in all audit reports when substantive testing is done.
Example for ACT:
Sample Design
Area Classification
Approach: Judgmental Sampling
Why Chosen:
There is a desire to concentrate audit effort in a specific problem area revealed by a previous sample or other source of information. In addition, the sampling frame is very small and therefore, it is possible to review most of the frame value without statistical sampling. The sample results can be used to determine the level of compliance and amount of revenue loss.
Frame:All ACS Entry Lines with High Risk Classifications for Fiscal Year Ended December 31, 2003
Frame Size: 132
Frame Value: $11,895,002
Frame Duty: $375,447
Sample Size: 101
Sample Value: $10,755,954
Sample Duty: $353,112
1October 31, 2004

Focused Assessment Program Exhibit 6A Appendix V
Example for Follow-up:
Sample Design
Area Classification
Approach: Judgmental Sampling
Why Chosen:
There is a desire to concentrate audit effort in a specific problem area revealed by a previous sample or other source of information. In addition, the sampling frame is very small and therefore, it is possible to review the entire frame. The sample results can be used to determine the level of compliance and amount of revenue loss.
Frame:All ACS Entry Lines with High Risk Classifications for the 6 Months Ended February 29, 2004 (the Period after CIPImplementation)
Frame Size: 63
Frame Value: $5,852,334
Frame Duty: $190,225
Sample Size: 63
Sample Value: $5,852,334
Sample Duty: $190,225
Example for ACT or Follow-up:
Sample Design
Area 9802.00.80
Approach: Variable Dollar Unit Sampling
Why Chosen: The testing is substantive in nature and the sample results can be used to compute the level of compliance and project revenue loss.
Frame:9802.00.80 ACS Entry Lines for Fiscal Year Ended December31, 2003
Frame Size: 2,295
Frame Value: $23,876,544
Frame Duty: $0
Sample Size: 65
Sample Value: $689,742
Sample Duty: $0
2October 31, 2004

Focused Assessment Program Exhibit 6A Appendix V
Example for ACT or Follow-up:
Sample Designing Parameters
Area Classification
Approach: Variable Physical Unit Sampling Stratified by Value (4 Strata)
Why Chosen: The testing is substantive in nature and the sample results can be used to compute the level of compliance and project revenue loss.
Frame: ACS Entry Lines for the Fiscal Year Ended December 31, 2003
Frame Size: 12,988
Frame Value: $163,931,095
Frame Duty: $7,165,083
Sample Size: 104
Sample Value: $1,455,194
Sample Duty: $64,721
Example for ACT or Follow-up:
Sample Design
Area ADD/CVD
Approach: Attribute Discovery Sampling
Why Chosen:
The area is very sensitive and any error would constitute a failure of the universe. In addition, if errors exist, the sample results can be used to compute the level of compliance and project revenue loss.
Frame:ACS Entry Lines With Merchandise Potentially Subject to ADD/CVD for the Fiscal Year Ended December 31, 2003
Frame Size: 3,794
Frame Value: $48,982,005
Frame Duty: $2,502,980
Sample Size: 89
Sample Value: $1,182,721
Sample Duty: $58,308
3October 31, 2004

Focused Assessment Program Exhibit 6A Appendix V
4October 31, 2004
Example for ACT or Follow-up:
Sample Design
Area: Value
Approach: Variable Physical Unit Sampling Stratified by Expense Account
Why Chosen: The testing is substantive in nature and the sample results can be used to compute the level of compliance and project revenue loss.
Frame: Selected General Ledger Expense Accounts
Stratum 1: Design Samples Expense Account 92500
Stratum 1 Size: 1588
Stratum 1 Value: $584,662
Sample 1 Size: 30
Sample 1 Value: $13,405
Stratum 2: Art Design Expense Account 92700
Stratum 2 Size: 1,390
Stratum 2 Value: $3,087,712
Sample 2 Size: 45
Sample 2 Value: $95,823
Stratum 3: Tool Parts Expense Account 93100
Stratum 3 Size: 637
Stratum 3 Value: $2,874,144
Sample 3 Size: 35
Sample 3 Value: $162,426
Stratum 4: Miscellaneous Expense Account 95500
Stratum 4 Size: 264
Stratum 4 Value: $653,009
Sample 4 Size: 15
Sample 4 Value: $37,591

Focused Assessment Program Exhibit 6A Appendix VI
Glossary of Sampling Terms
100% Review Stratum. A stratum of sample items that is selected based on auditor judgment rather than by random means. The purpose of this stratum is to ensure adequate coverage of high dollar and/or sensitive items. Unlike random strata, this stratum is not a subset of a portion of the frame and the audit results for this stratum are not projected.
Attribute Sampling. A type of statistical sampling used for compliance testing whereby sample items are evaluated for compliance or attributes. Items either are or are not (yes or no) in compliance. This type of sampling reaches a conclusion on the frequency of occurrence of a particular attribute in a universe.
Attribute Discovery Sampling. A special case of attribute sampling in which the occurrence of a single error constitutes a failure of the universe. This feature, which produces a sample size that is minimal in general, is achieved by ignoring any risk of erroneously rejecting an acceptable universe. This type of statistical sampling provides an objective method of indicating the risk or probability of locating at least one irregularity or characteristic in question.
Block Test. A nonstatistical method of selecting sample items (usually a judgmental or non-statistical sample) in which specific blocks of units are selected. The blocks may be periods of time or consecutive groupings, such as all expense vouchers in June or all invoices with vendor names beginning with the letters M through P.
Clerical Error. Human processing errors (e.g., transpositions, typo’s, etc.). Internal controls should be designed to minimize and catch these (through training, supervision, monitoring, checking, etc.). Isolated clerical errors that slip through despite adequate internal controls designed to prevent and catch them would be nonsystemic, nonrecurring errors. Repetitive clerical errors would be considered to be recurring errors and may be indicative of internal control weaknesses (lack of controls or controls not being followed); in which case they would also be systemic errors.
Clusters. Sample items or units that are made up of clusters or groups of smaller items or units. For example, an ACS (Automated Commercial System) tariff line that is made up several invoice lines, or an invoice line that is made up of several part numbers.
Coefficient of Variation (CV). A measure of dollar dispersion or variability in a frame. It is standard deviation expressed as a percentage (i.e., standard deviation divided by the frame mean multiplied by 100). The higher the CV, the more variation in the frame.General rules of thumb: a CV < 50% indicates low variation and a CV 50% indicatesmoderate to high variation.
1October 31, 2004

Focused Assessment Program Exhibit 6A Appendix VI
Confidence Interval (Precision Interval). The range within which the actual error/value in the frame should fall at a given confidence level or assurance. It is also known as tolerance.
Confidence Level. The probability that the true or actual value will be within thecorresponding confidence interval. It is sometimes called reliability, assurance, or probability.
Convenience Test. A nonstatistical method of selecting sample items in which convenience is the prime consideration. The most readily available items are selected, without reason or randomness, simply because it is expedient. Records that are in storage, in the bottom of file drawers, not filed or at another location are excluded when this type of testing is used. This method rarely reflects good auditor judgment, can be manipulated by the auditee, and is not recommended.
Critical Error Rate. The maximum universe error rate considered acceptable by the auditor.
Cross-Section Test. A method of selecting sample items in which the auditor attempts to choose items from all parts of the area being tested. It is common under this type of testing to designate a fixed percentage, such as 5%, of items to be selected. Many times the selection is made using a fixed or uniform interval, such as every 10th item, for selection. If this method were used with a random start, the sample generally would meet the selection requirements of a statistical sample. However, it is not uncommon for the auditor, using the cross-section approach, to go through the records and haphazardly select items until the desired quantity is obtained.
Desired Precision (Desired Sampling Error). The amount of sampling error that can be tolerated and still permit the results to be useful.
Dollar Unit Sampling. A type of variable sampling in which the sampling unit is defined as an individual dollar, with each dollar given an equal chance of selection. The selected dollars are then tied to physical units (items or transactions) that are examined.
Error. A sample item in noncompliance with applicable testing criteria (i.e., laws and regulations).
EZ-Quant. A computer program containing statistical analysis audit tools with modules for statistical sampling, regression, and improvement curves. Auditors may use DOS-based Version 3.10 (which combines all modules) or Windows-basedVersion 1.0.1 (which separates the modules). The two versions do the same analyses, but have different user interfaces and menus for the same procedures.
2October 31, 2004

Focused Assessment Program Exhibit 6A Appendix VI
EZ-Quant ATTDISC Attribute Discovery Sample Size Procedure. A computer procedure that determines sample sizes for attribute discovery samples. In EZ-Quant DOS Version 3.10, it is call ATTDISC. In EZ-Quant Windows Version 1.0.1, the procedure is selected by choosing Discovery Acceptance in the Attribute Sample Size Development window.
EZ-Quant ATTEVAL1 Attribute Discovery Acceptance Sample Evaluation Procedure. A computer procedure that evaluates the results of an attribute discovery sample by estimating the total error rate in the universe. In EZ-Quant DOS Version 3.10, it is called ATTEVAL1. In EZ-Quant Windows Version 1.0.1, the procedure is selected by choosing Discovery Acceptance, One Step Acceptance, or Rate Estimation in the Attribute Sample Evaluation window.
EZ-Quant DUSAM Dollar Unit Sample Evaluation Procedure. A computer procedure that evaluates the results of a dollar unit sample (i.e., projects the sample results to theframe and provides reliability measures for evaluating that projection). In EZ-Quant DOS Version 3.10, the procedure is called DUSAM. In EZ-Quant Windows Version 1.0.1, the procedure is selected by choosing Variable Sampling and Dollar Unit Sample Evaluation in the initial EZ-Quant window.
EZ-Quant DUSSEL Dollar Unit Sample Selection. A computer procedure that statistically selects dollar unit samples. In EZ-Quant DOS Version 3.10, the procedure is call DUSSEL. In EZ-Quant Windows Version 1.0.1, the procedure is selected by choosing Variable Sampling and Dollar Unit Sample Selection in the initial EZ-Quant window.
EZ-Quant RANUM Random Numbers Generator. A computer procedure that generates random numbers that can then be used to randomly select sample items. In EZ-Quant DOS Version 3.10, the procedure is called RANUM. In EZ-Quant Windows Version 1.0.1, the procedure is selected by choosing Variable Sampling and Generate Random Number/Sets in the initial EZ-Quant window.
EZ-Quant RASEQ Random Number Sets Generator. A computer that generates sets of random numbers that can then be used to randomly select sample items. In EZ-Quant DOS Version 3.10, the procedure is called RASEQ. In EZ-Quant Windows Version 1.0.1, the procedure is selected by choosing Variable Sampling and Generate Random Number/Sets in the initial EZ-Quant window.
EZ-Quant SAMPL Physical Unit Sample Evaluation Procedure. A computer procedure that evaluates the results of a physical unit sample (i.e., projects the sample results to the frame and provides reliability measures for evaluating that projection). In EZ-Quant DOS Version 3.10, the procedure is called SAMPL. In EZ-Quant Windows Version 1.0.1, the procedure is selected by choosing Variable Sampling and Physical Unit Sample Evaluation in the initial EZ-Quant window.
3October 31, 2004

Focused Assessment Program Exhibit 6A Appendix VI
EZ-Quant STRAT Physical Unit Sample Selection Procedure. A computer procedure that statistically selects physical unit samples and can automatically stratify a frame into equal dollar strata (the number of strata is specified by the auditor). In EZ-Quant DOS Version 3.10, the procedure is called STRAT. In EZ-Quant Windows Version 1.0.1, the procedure is selected by choosing Variable Sampling and Physical Unit Sample Selection in the initial EZ-Quant window.
Frame (Sampling Frame). A physical or electronic representation of the universe from which a sample will be taken. The sampling frame excludes sample items that are separated or stratified for 100% examination.
Frame Validation. The process of verifying that the chosen sampling frame is an adequate representation of that universe it is intended to represent. This typically involves reconciling the frame to the universe, analyzing any differences, and correcting, adjusting, or accepting those differences.
Frame Variability (Homogeneity). Refers to the degree of differences or similarities of items in a frame in terms of dollar amounts and characteristics. Dollar variability can be measured with indices of dispersion (e.g., standard deviation and coefficient of variation). The degree of variability in the frame will directly impact the sample size and need for stratification. The higher the variability, the larger the sample size should be and the greater the need for stratification.
Government Risk (Risk). The tolerable level of risk of accepting a faulty universe (a universe with an actual error rate exceeding the critical error rate). The government bears this risk of a failure to detect flawed conditions. Risk is the complement of confidence level (probability or assurance).
Horizontal Stratification. Stratifying or separating a frame into subgroups according to dollar values or amounts. The idea is that similar size items will have similar size errors.Horizontal stratification improves sample results (i.e. precision).
Judgmental (Non-statistical) Sampling. See Nonstatistical (Judgmental) Sampling.
Large Dollar Test. A nonstatistical method of selecting sample items in which the largest dollar items are selected. Emphasis is placed on the materiality of the items selected. No examination is made of lesser dollar value items. Conclusions based on the review of the high dollar items may not be applicable to the lesser dollar items.Also, a breakdown of internal controls is generally more pronounced in the lower dollar items.
Macro Analysis. Any high level analysis not involving the review of individual items or transactions (not sampling). Typically this could include analysis of totals, trends, file comparisons, etc. Macro analysis is a key part of assessing risk exposure but may also be used anytime it will satisfy the audit objectives. It is often more efficient and may be more precise than sampling (micro testing) and therefore should be considered first.
4October 31, 2004

Focused Assessment Program Exhibit 6A Appendix VI
Manual Systematic Interval. The manual application of a statistical sample selection procedure using a random start and a fixed interval to select every nth item.
Micro Testing. Review of individual items or transactions (sampling), usually in order to make conclusions about the population from which they are drawn.
Multistage Sampling. A sampling process involving several stages, in which units at each subsequent stage are subsampled from previously selected larger units. For example: in the first stage, 100 ACS tariff lines are selected, and in the second stage, up to 5 invoice lines are selected for each ACS tariff line. This type of sampling is considerably more complex (in selection and evaluation) than simple or single stage sampling and therefore, is recommended only as a last resort.
Nonrecurring Error. An error that would not be expected to recur in the frame from which the sample was taken. Typically these are nonsystemic, isolated clerical or human errors that occurred despite adequate internal controls (monitoring, checking, training, supervision, etc.). They may also be errors found outside the sampling frame.The designation of recurring or nonrecurring is required for revenue projection. Only recurring errors are projected. Nonrecurring errors are not projected. However, nonrecurring errors should be added to the projected revenue loss when calculating total revenue loss.
Nonstatistical Projection. A nonstatistical extrapolation of the sample results to the universe, which cannot be evaluated statistically. Evaluating a sample for the purpose of reaching a conclusion about the universe without using the laws of probability.
Nonstatistical (Judgmental) Sampling. Any sampling process in which the sample items are selected subjectively rather than by a random process.
Nonsystemic Error. An error that is not caused by any apparent weakness in internal controls. Typically these are occasional clerical or human errors that happen despite adequate internal controls (monitoring, checking, training, supervision, etc.). Repetitive clerical errors may be indicative of some sort of weakness in the internal controls, such as incompetent personnel, inadequate training, lack of supervision or monitoring, etc.The designation of systemic or nonsystemic is required for the determination of compliance. Only systemic errors are included in the computation of compliance rates.Nonsystemic errors are not used when calculating compliance rates.
Physical Unit Sampling. A type of variable sampling in which the sampling unit is defined as a physical unit (item or transaction), with each physical unit having an equal chance of selection (or determinable nonzero chance in the case of stratification).
Point Estimate. A single, specific estimate for a universe characteristic or value.
Population (Universe). See Universe (Population).
5October 31, 2004

Focused Assessment Program Exhibit 6A Appendix VI
Post Audit Stratification. Stratifying the sample and frame after the review is complete and projecting “like to like” in order to produce more accurate projections.
Precision (Sampling Error). A measurement of the accuracy of the sample estimate compared to the universe value. It is the magnitude of error or variation in an estimate derived from a random sample. Because the units included in the sample are there by chance, the estimate is subject to chance variation or sampling error. It is a measure of the accuracy of the point estimate determined by how close it is likely to be to the true error or value in the universe. The point estimate plus and minus the precision provides the confidence interval.
Precision Dollars. Precision (sampling error) expressed in dollars (as in a variable sample).
Precision Percentage. Precision expressed as a percentage. For attribute samples, it is the difference between the upper or lower limit and the point estimate. For variable samples, it is the precision divided by the point estimate.
Projection. See Statistical Projection or Nonstatistical Projection.
Purposive Test. A nonstatistical method of selecting sample items in which items with known or suspected problems are selected. This method is not designed to give a cross section of the entire audit area.
Random Seed. An arbitrarily assigned number that activates the random number selection process in a program that generates random numbers or selects random sample items. Using the identical random seed with the same frame allows one to recreate the random numbers or random sample selection. It prevents duplicationswhen additional sample items are needed from the same frame.
Random Stratum. A stratum of sample items that are selected randomly. This stratum is a subset of a portion of the frame and the audit results for this stratum are projected.
Recurring Error. An error that could recur in the frame from which the sample was taken. Typically these are systemic errors. They may also be nonsystemic errors that display a pattern or trend that they are likely to recur (e.g., repetitive clerical errors are recurring errors). The designation of recurring or nonrecurring is required for revenue projection. Only recurring errors are projected. Nonrecurring errors are not projected.However, nonrecurring errors should be added to the projected revenue loss when calculating total revenue loss.
Sample Frame or Sampling Frame. See Frame.
Sample Universe or Sampling Universe. See Universe (Population).
6October 31, 2004

Focused Assessment Program Exhibit 6A Appendix VI
Sampling Error. See Precision (Sampling Error).
Sampling Parameters. Commonly, refers to the basic sampling methodology facts (i.e., sampling approach, frame size, frame value, frame duty, sample size, sample value, and sample duty). Statistically, refers to the mathematical variables used to statistically calculate sample size and evaluate sample results (i.e., confidence level, desiredprecision percentage, critical error rate, government risk, precision dollars, achieved precision percentage).
Sampling Plan. A document that outlines the detailed sampling methodology to be used and results obtained. It typically contains elements of the sampling approach, universe and frame, sample size and selection, and projection results.
Sampling Unit. The elementary unit in the frame, which is sampled or selected for detailed examination. Valid statistical sampling requires that each sampling unit have an equal chance of selection (or determinable nonzero chance in the case of stratification) and be selected randomly.
Standard Deviation. A measure of the dollar dispersion or variability in a frame. It is the average distance of individual values or the extent to which the individual values depart from the average. In Microsoft Excel, it is the function STDEVP.
Statistical Projection. A statistical extrapolation of the sample results to the frame. It uses the laws of probability to evaluate a sample for the purpose of reaching a conclusion about the universe. A statistical projection gives a point estimate along with the confidence level (reliability, assurance, probability), precision (sampling error), and confidence interval (tolerance, precision interval).
Statistical Sampling (Probability Sampling). Sampling that uses the laws of probability for selecting and evaluating a sample for the purpose of reaching a conclusion about the universe. In statistical sampling each sampling unit is randomly selected and has an equal or known nonzero probability of selection.
Strata. Two or more mutually exclusive subgroups of a frame. The plural of stratum.
Stratum. One of the two or more mutually exclusive subgroups of a frame. The singular of strata.
Stratification. Separating a frame into different subgroups for separate selection, review, and projection of sample items. The goal is to group like items together (e.g. by dollar value, size, category, characteristic, or type), in order to improve sample results (precision).
7October 31, 2004

Focused Assessment Program Exhibit 6A Appendix VI
8October 31, 2004
Stratified Sampling. A statistical sampling technique in which the frame is divided into distinct subgroups of similar items, called strata. Within each stratum, a separate sample is selected from all the sampling units in that stratum. From the sample obtained in each stratum, a separate stratum mean (or other statistic) is computed.These stratum values are properly weighted to form a combined estimate for the entire frame. The standard deviations are also computed separately within each stratum and then properly weighted and added into a combined estimate for the frame. In this way, sampling precision is improved.
Substantive Testing. Quantitative testing such as verifying account balances or cost elements and noting any differences. Variable sampling is appropriate for this type of testing whereby sample items are evaluated for error amounts or variables.
Survey (Probe) Sample. A limited preliminary sample of an area for the purpose of gaining additional information about the area in order to determine whether more extensive testing is needed.
Systematic Interval. A statistical sample selection procedure that uses a random start and a fixed interval to select every nth item.
Systemic Error. An error that could recur due to a system deficiency or a weakness in internal controls. If the system is corrected or internal controls strengthened, the error should not recur. Clerical or human error (especially if such errors are repetitive) that occurred because there were no internal controls in place to prevent or catch such errors (i.e., no monitoring or checking, no supervision, no training, etc.) would also be systemic. The designation of systemic or nonsystemic is required for the determination of compliance. Only systemic errors are included in the computation of compliance rates. Nonsystemic errors are not used when calculating compliance rates.
Universe (Population). An entire group of items/transactions/records to be tested. The items comprising the category or area of interest to the auditor.
Variable Sampling. A type of statistical sampling used for substantive testing whereby sample items are evaluated for error amounts or variables. This type of sampling reaches a conclusion on dollar amounts in a universe and answers the question – how much?
Variable Dollar Unit Sampling. See Dollar Unit Sampling.
Variable Physical Unit Sampling. See Physical Unit Sampling.
Vertical Stratification. Stratifying or separating a frame into subgroups according to category, type, or characteristics of the sampling units. The idea is that similar items will have similar types and frequency of errors. The purpose is to improve sample results (i.e. precision).

Focused Assessment Program Exhibit 6A Appendix VII
Reading List for Audit Sampling
"Statistical Auditing" by Donald Roberts
"Handbook of Sampling for Auditing and Accounting” by Herbert Arkin
”Practical Statistical Sampling for Auditors" by Arthur J. Wilburn
"Sampling Methods for the Auditor, An Advanced Treatment” by Herbert Arkin
”Using Statistical Sampling”, General Accounting Office/Program Evaluation & Methodology Division (GAO/PEMD-10.1.6)
“Statistical Methods” by George W. Snedecor and William G. Cochran
1October 31, 2004


![Bureau of Customs and Border Protection · Bureau of Customs and Border Protection General Notices [CBP Decision 03–19] Customs Accreditation of BSI Inspectorate America Corporation](https://img.pdfslide.us/doc/110x75/5b5065d17f8b9a396e8e6216/bureau-of-customs-and-border-protection-bureau-of-customs-and-border-protection.jpg)