Embed Size (px)
Citation preview
U.S. Census BureauSurvey of Business Owners
American Indian- and Alaska Native-Owned Businesses: 2007Native-Owned Businesses: 2007
Census Bureau Economic DataMarch 15, 2011
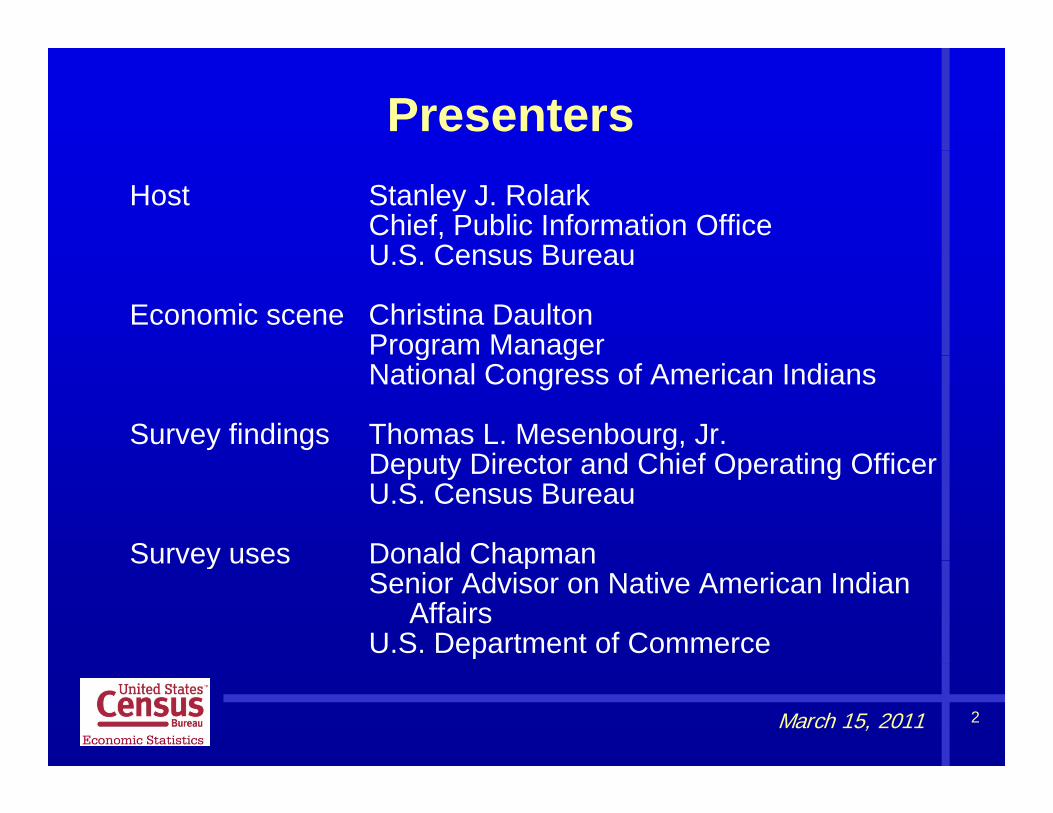
PresentersHost Stanley J. Rolark
Chief, Public Information OfficeU S Census BureauU.S. Census Bureau
Economic scene Christina DaultonProgram Managerg gNational Congress of American Indians
Survey findings Thomas L. Mesenbourg, Jr.D t Di t d Chi f O ti OffiDeputy Director and Chief Operating OfficerU.S. Census Bureau
Survey uses Donald ChapmanSurvey uses Donald ChapmanSenior Advisor on Native American Indian
AffairsU.S. Department of Commerce
2March 15, 2011
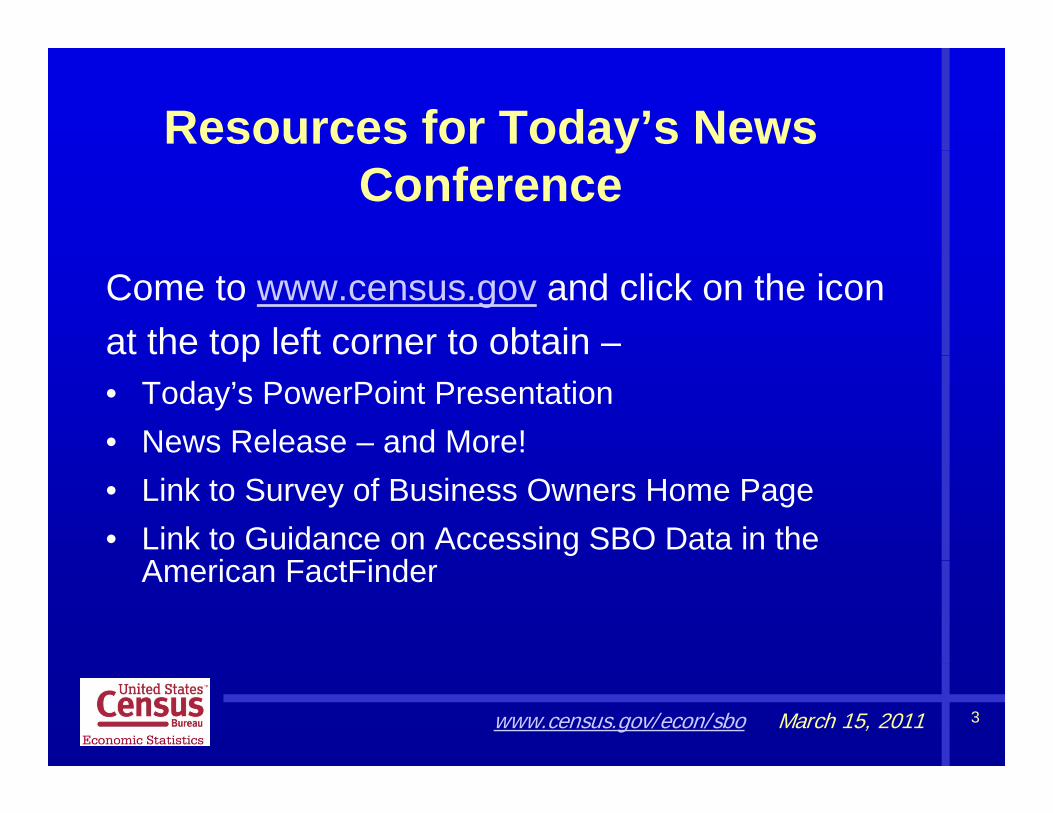
Resources for Today’s News yConference
Come to www.census.gov and click on the icon at the top left corner to obtain –p• Today’s PowerPoint Presentation• News Release – and More!• Link to Survey of Business Owners Home Page• Link to Guidance on Accessing SBO Data in the
A i F tFi dAmerican FactFinder
3www.census.gov/econ/sbo March 15, 2011
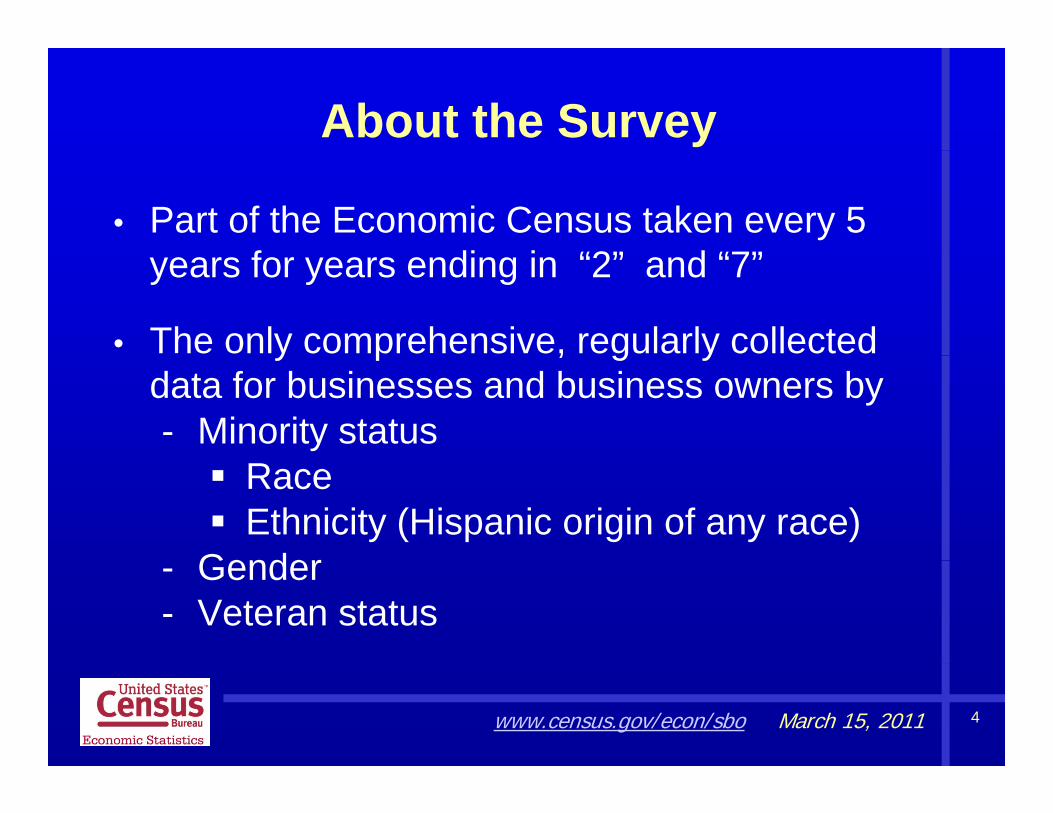
About the Survey
• Part of the Economic Census taken every 5 f di i “2” d “7”years for years ending in “2” and “7”
• The only comprehensive, regularly collected y p , g ydata for businesses and business owners by - Minority status
Race Ethnicity (Hispanic origin of any race)
Gender- Gender- Veteran status
4www.census.gov/econ/sbo March 15, 2011
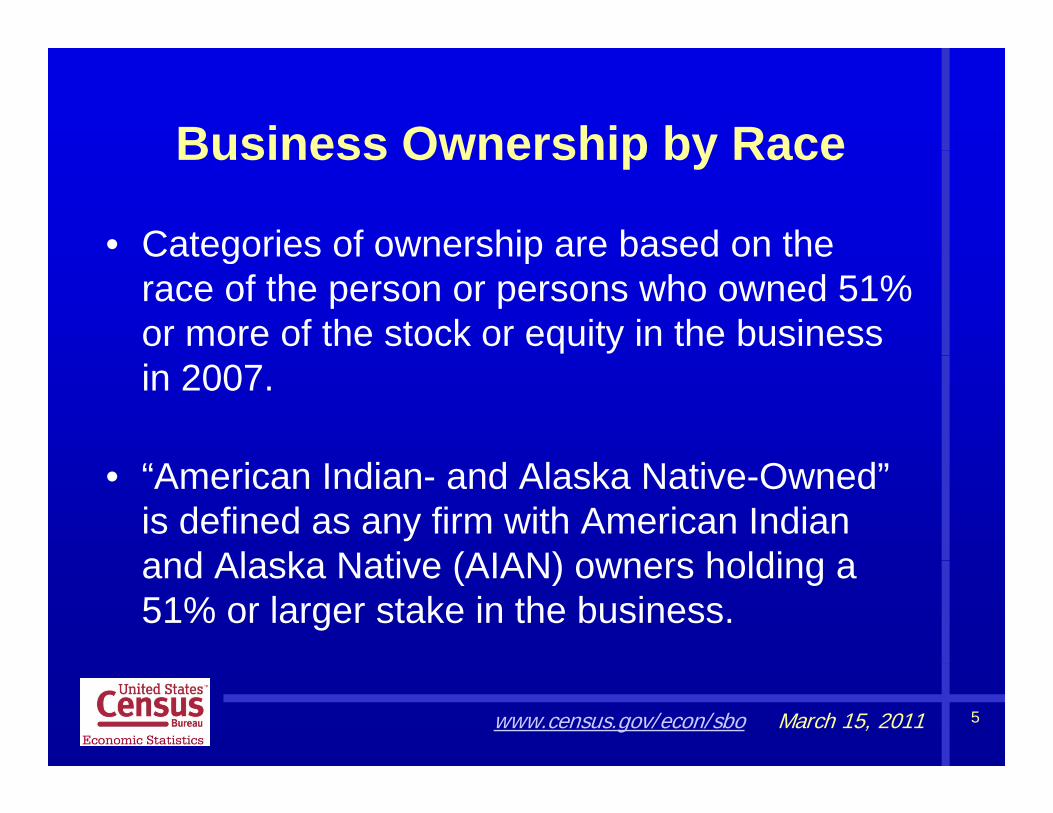
Business Ownership by RaceBusiness Ownership by Race
• Categories of ownership are based on theCategories of ownership are based on the race of the person or persons who owned 51% or more of the stock or equity in the business in 2007.
• “American Indian- and Alaska Native-Owned” is defined as any firm with American Indian and Alaska Native (AIAN) owners holding aand Alaska Native (AIAN) owners holding a 51% or larger stake in the business.
5www.census.gov/econ/sbo March 15, 2011
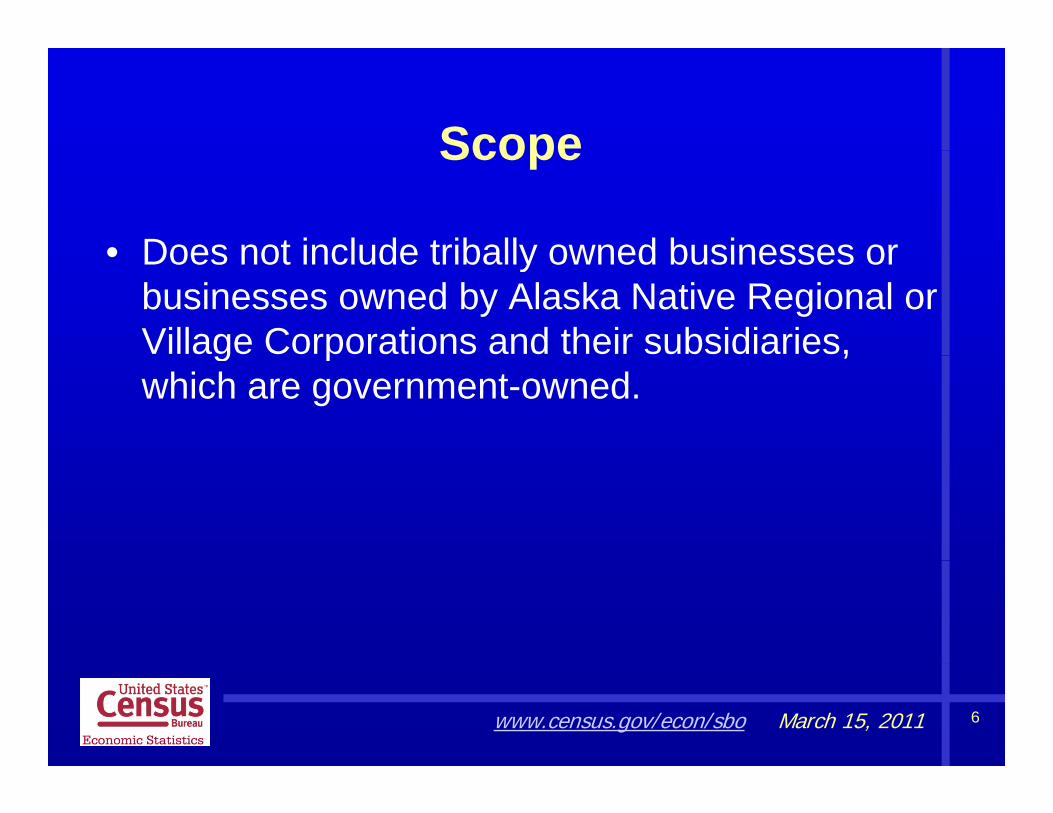
ScopeScope
• Does not include tribally owned businesses or• Does not include tribally owned businesses or businesses owned by Alaska Native Regional or Village Corporations and their subsidiaries, g p ,which are government-owned.
6www.census.gov/econ/sbo March 15, 2011
A Unified Voice For Indian Country
• Presenter: Christina Daulton, Program Manager, NCAI
Policy Research Center
• National Congress of American Indians (ncai.org)
Founded in 1944, the National Congress of American Indians serves the broad interests of tribal governments and communities. As a representative congress of American Indian and Alaska Native tribes, we are united to protect and enhance treaty and sovereign rights while securing our traditional laws cultures and ways of life for ourand enhance treaty and sovereign rights while securing our traditional laws, cultures, and ways of life for our descendents. We advance a common understanding of the rightful place of tribes in the family of American governments.
• NCAI Policy Research Center & Data (ncaiprc.org)
A national tribal research center focused on issues facing tribal communities and providing the tools necessary to inform public policy debates with meaningful information.
• Indian Country Counts – 2010 Census
Census Data in Indian Country
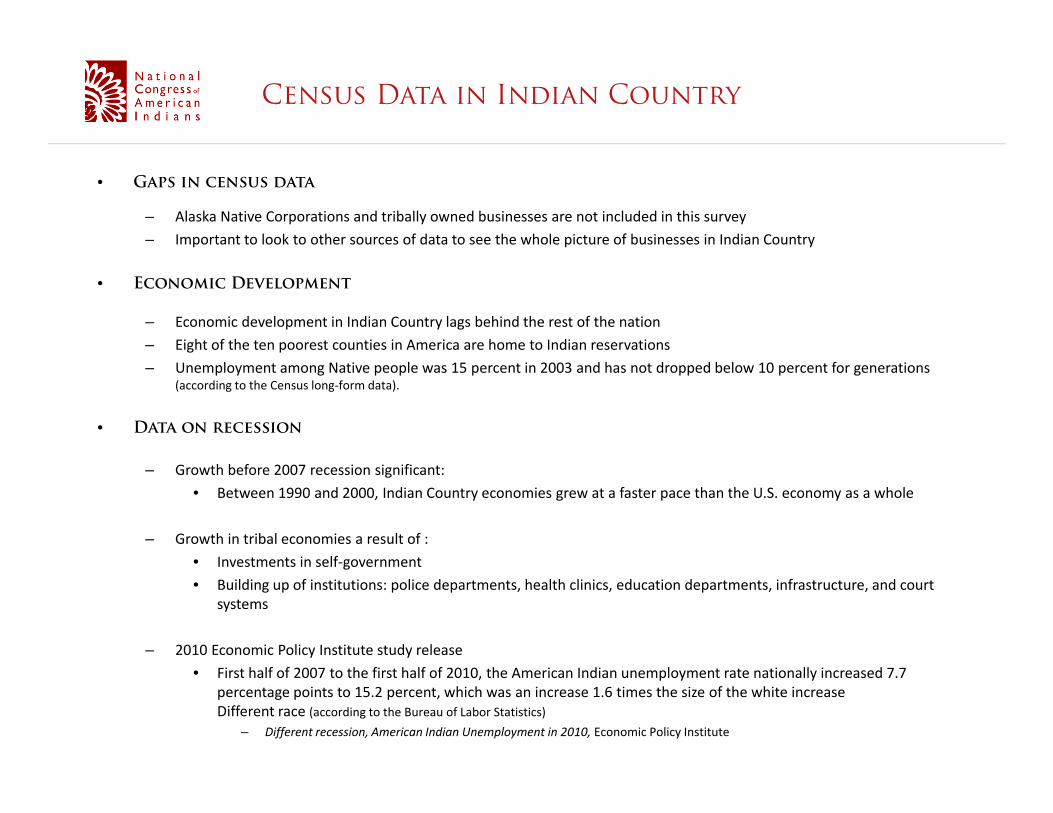
• Gaps in census data
– Alaska Native Corporations and tribally owned businesses are not included in this survey
– Important to look to other sources of data to see the whole picture of businesses in Indian Country
• Economic Development
– Economic development in Indian Country lags behind the rest of the nation
– Eight of the ten poorest counties in America are home to Indian reservations
– Unemployment among Native people was 15 percent in 2003 and has not dropped below 10 percent for generations (according to the Census long‐form data).
• Data on recession
– Growth before 2007 recession significant:
• Between 1990 and 2000, Indian Country economies grew at a faster pace than the U.S. economy as a whole
– Growth in tribal economies a result of :
• Investments in self government• Investments in self‐government
• Building up of institutions: police departments, health clinics, education departments, infrastructure, and court systems
– 2010 Economic Policy Institute study release
• First half of 2007 to the first half of 2010, the American Indian unemployment rate nationally increased 7.7 percentage points to 15.2 percent, which was an increase 1.6 times the size of the white increaseDifferent race (according to the Bureau of Labor Statistics)
– Different recession, American Indian Unemployment in 2010, Economic Policy Institute
A Look at the 2007 StatisticsA Look at the 2007 Statisticsfor American Indian- and Alaska
Native-Owned Businessesin the United States
9www.census.gov/econ/sbo March 15, 2011
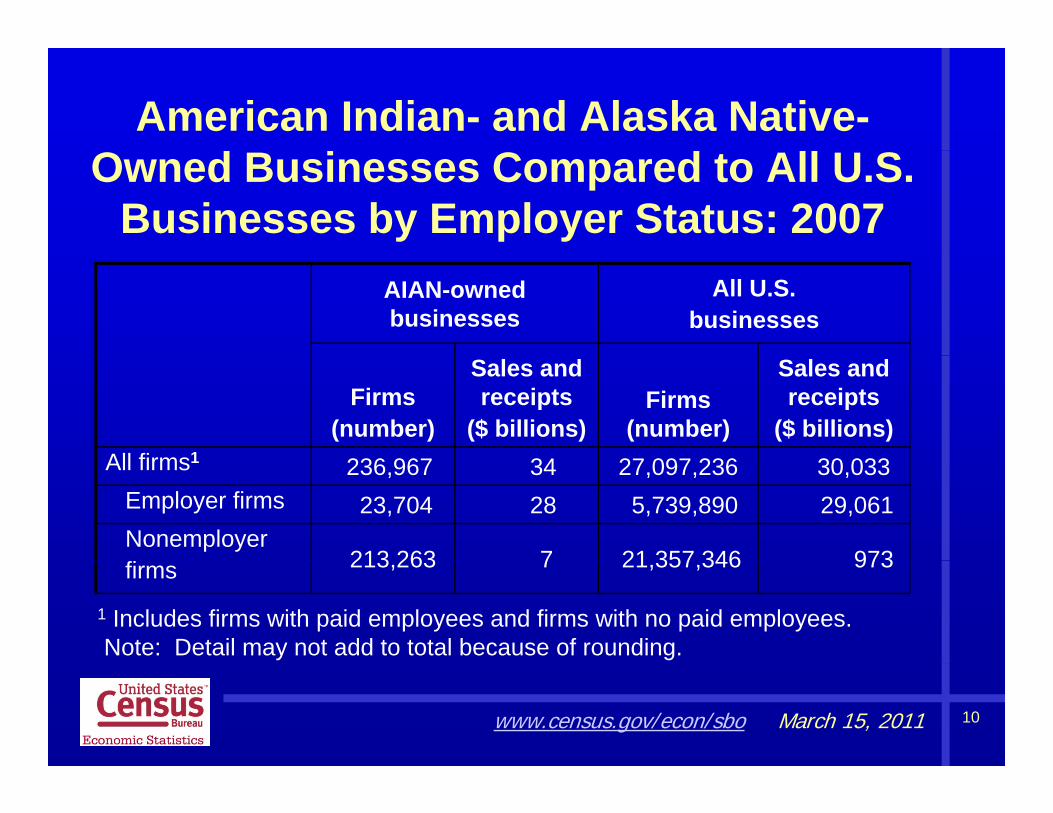
American Indian- and Alaska Native-Owned Businesses Compared to All U.S.
Businesses by Employer Status: 2007AIAN-owned businesses
All U.S. businesses
Firms(number)
Sales and receipts
($ billions)Firms
(number)
Sales and receipts
($ billions)All firms1 236 96 34 2 09 236 30 033All firms1 236,967 34 27,097,236 30,033
Employer firms 23,704 28 5,739,890 29,061Nonemployer
213 263 7 21 357 346 973firms 213,263 7 21,357,346 973
1 Includes firms with paid employees and firms with no paid employees.Note: Detail may not add to total because of rounding.
10www.census.gov/econ/sbo March 15, 2011
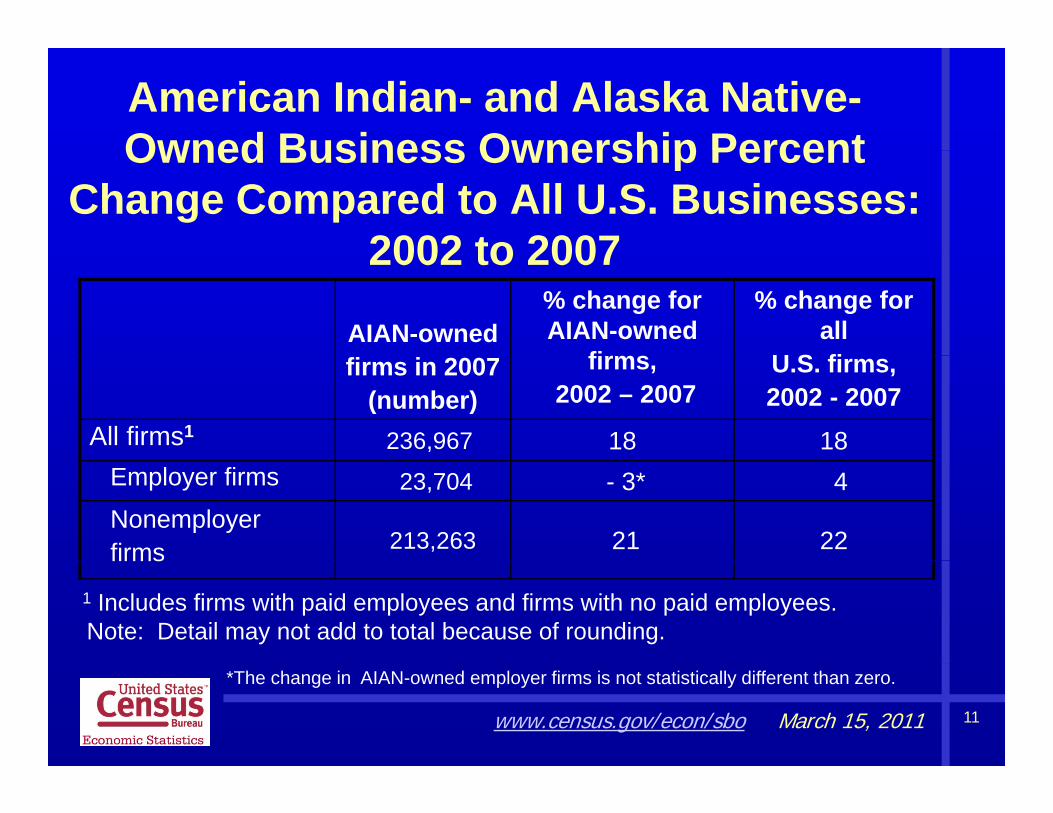
American Indian- and Alaska Native-Owned Business Ownership PercentOwned Business Ownership Percent
Change Compared to All U.S. Businesses: 2002 to 20072002 to 2007
AIAN-owned% change for AIAN-owned
fi
% change for all
U S fifirms in 2007(number)
firms,2002 – 2007
U.S. firms,2002 - 2007
All firms1 236,967 18 18Employer firms 23,704 - 3* 4Nonemployerfirms 213,263 21 22firms
1 Includes firms with paid employees and firms with no paid employees.Note: Detail may not add to total because of rounding.
11www.census.gov/econ/sbo March 15, 2011
*The change in AIAN-owned employer firms is not statistically different than zero.
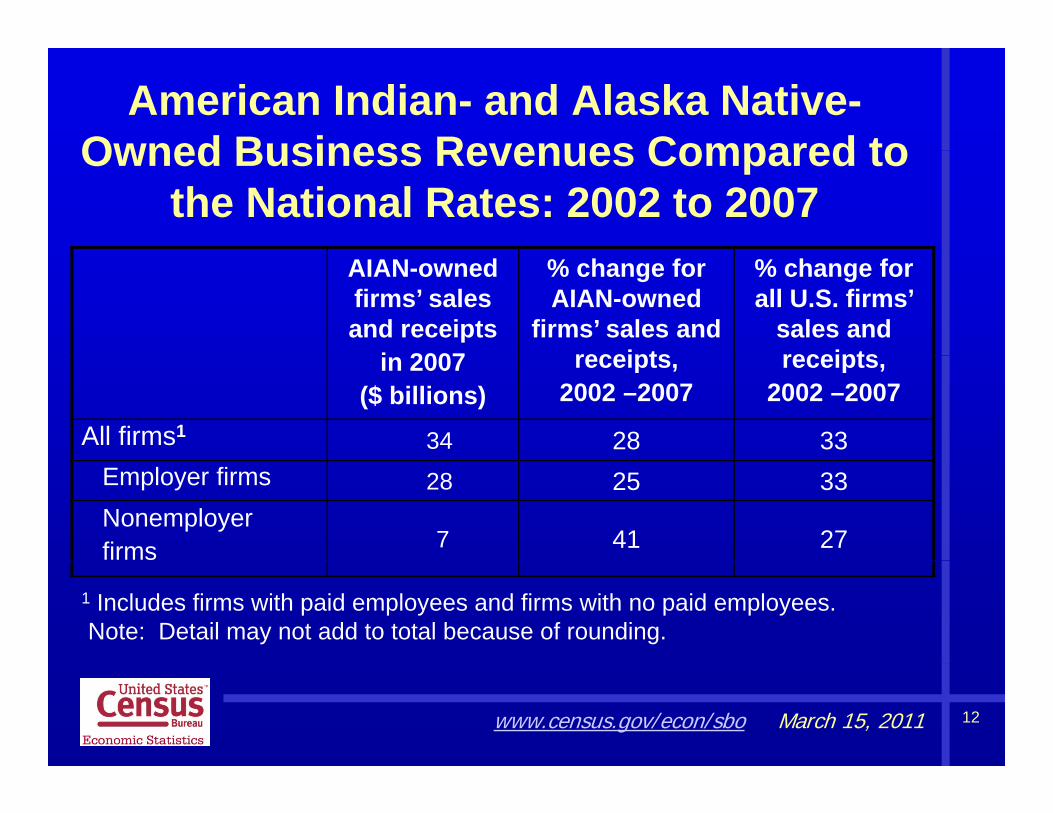
American Indian- and Alaska Native-Owned Business Revenues Compared toOwned Business Revenues Compared to
the National Rates: 2002 to 2007AIAN-owned firms’ sales and receipts
i 2007
% change for AIAN-owned
firms’ sales and receipts
% change for all U.S. firms’
sales and receiptsin 2007
($ billions)receipts,
2002 –2007receipts,
2002 –2007
All firms1 34 28 33Employer firms 28 25 33Nonemployerfirms 7 41 27
1 Includes firms with paid employees and firms with no paid employees.Note: Detail may not add to total because of rounding.
12www.census.gov/econ/sbo March 15, 2011
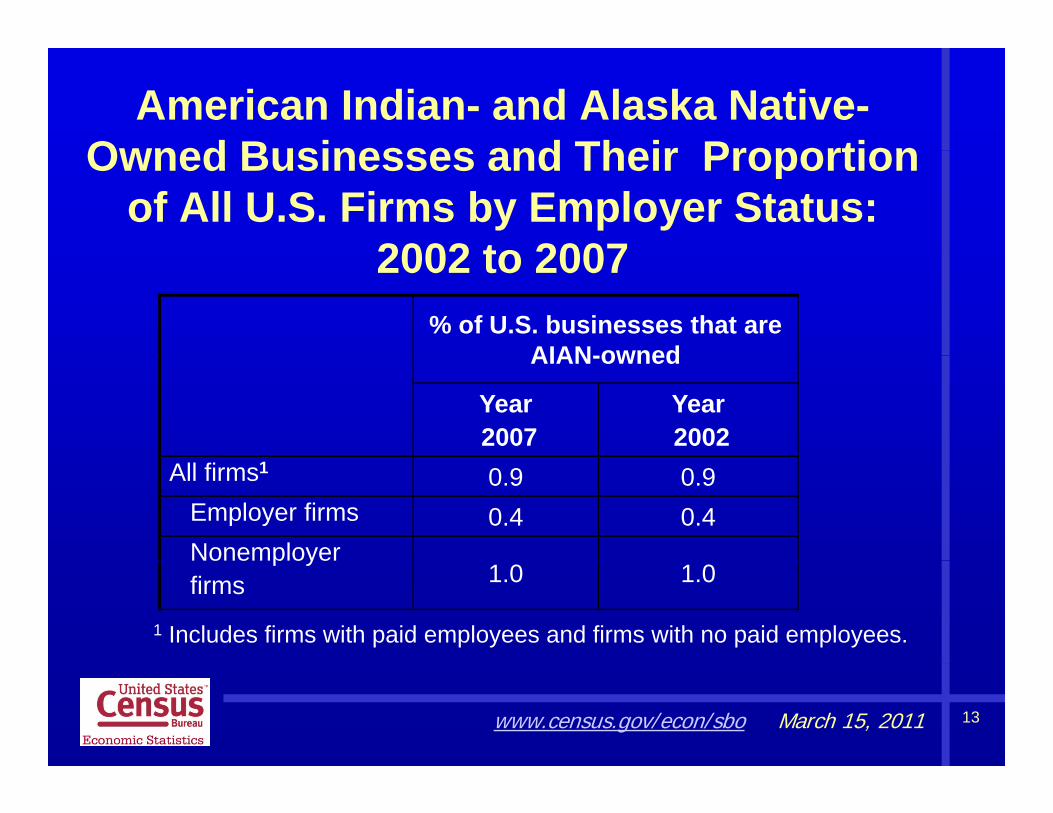
American Indian- and Alaska Native-Owned Businesses and Their ProportionOwned Businesses and Their Proportion
of All U.S. Firms by Employer Status:2002 to 20072002 to 2007
% of U.S. businesses that are AIAN-ownedAIAN-owned
Year2007
Year2002
All firms1 0.9 0.9Employer firms 0.4 0.4NonemployerNonemployer firms 1.0 1.0
1 Includes firms with paid employees and firms with no paid employees.
13www.census.gov/econ/sbo March 15, 2011
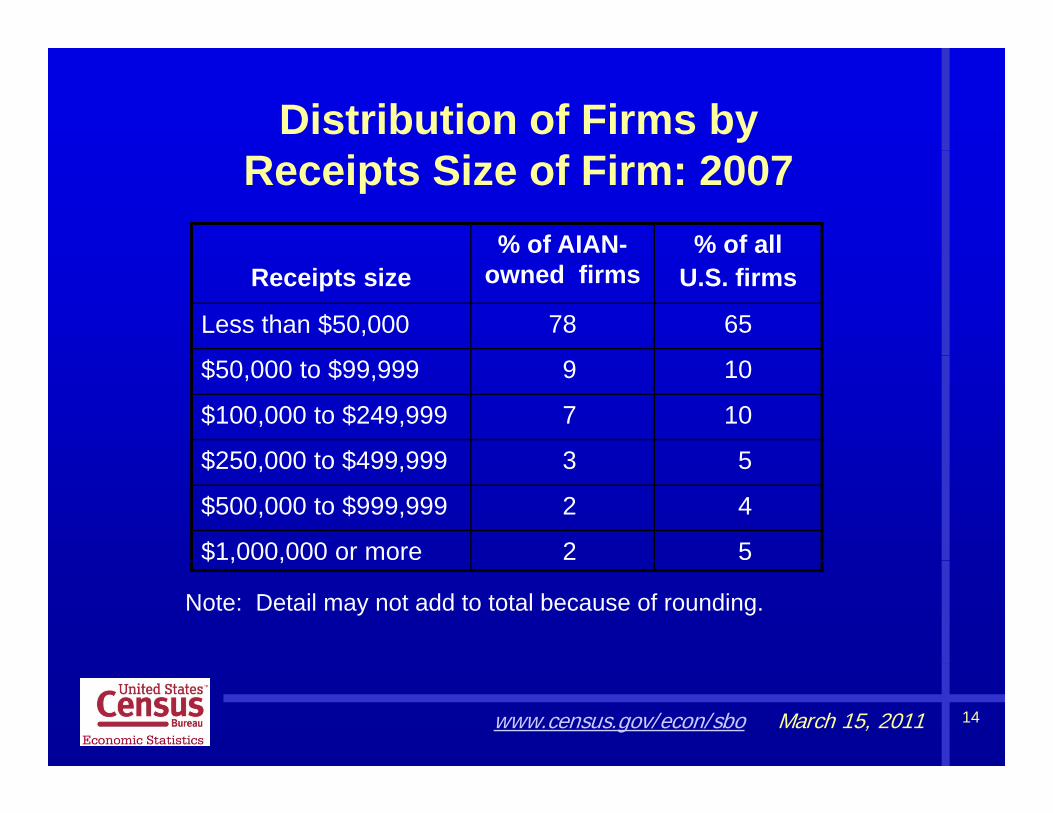
Distribution of Firms byReceipts Size of Firm: 2007
% of AIAN- % of all Receipts size
% oowned firms
% o aU.S. firms
Less than $50,000 78 65
$50,000 to $99,999 9 10
$100,000 to $249,999 7 10
$250 000 to $499 999 3 5$250,000 to $499,999 3 5
$500,000 to $999,999 2 4
$1,000,000 or more 2 5$ , ,
Note: Detail may not add to total because of rounding.
14www.census.gov/econ/sbo March 15, 2011

Distribution of Employer Firmsyby Employment Size of Firm: 2007
% of AIAN % of allEmployment size % of AIAN-owned firms
% of allU.S. firms
0 to 4 employees1 66 61
5 to 9 employees 18 18
10 to 19 employees 9 11
20 to 49 employees 5 720 to 49 employees 5 7
50 employees or more 2 4
1 Includes firms with payroll at any time during 2007 Employment reflects1 Includes firms with payroll at any time during 2007. Employment reflectsthe number of paid employees during the March 12 pay period.
Note: Detail may not add to total because of rounding.
15www.census.gov/econ/sbo March 15, 2011
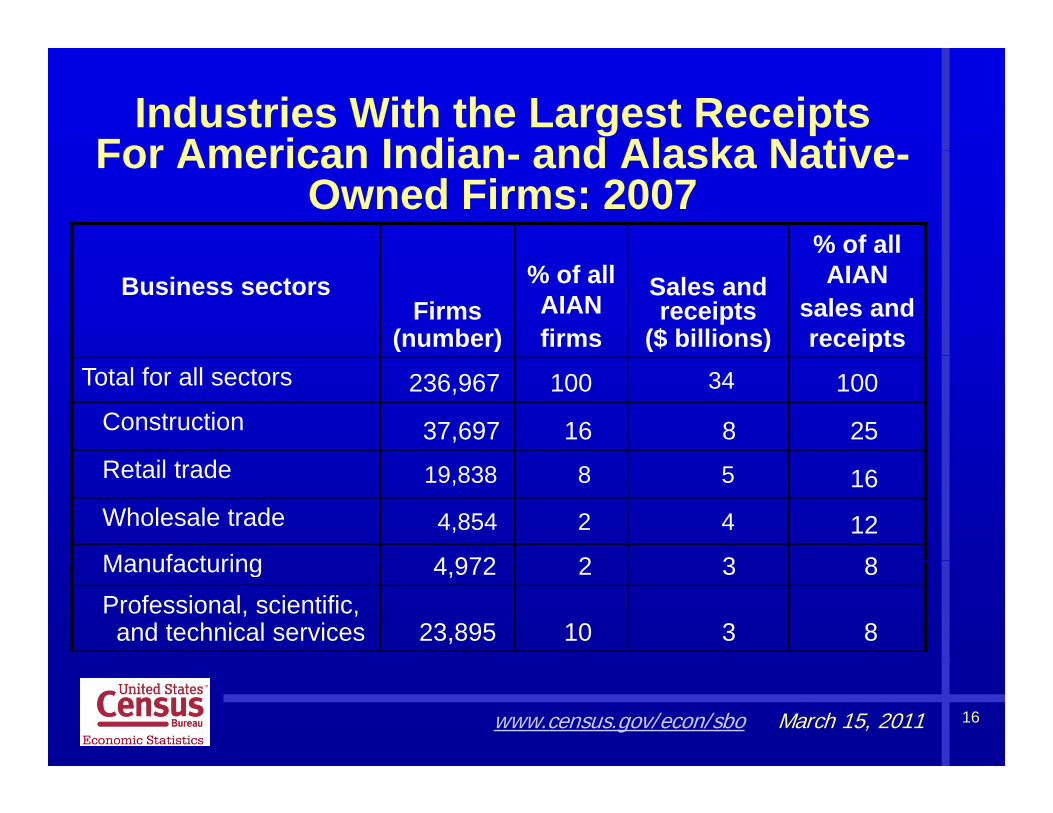
Industries With the Largest ReceiptsFor American Indian and Alaska NativeFor American Indian- and Alaska Native-
Owned Firms: 2007% of all
Business sectorsFirms
(number)
% of all AIANfirms
Sales and receipts
($ billions)
% o aAIAN
sales and receipts
Total for all sectors 236,967 100 34 100Construction 37,697 16 8 25Retail trade 19,838 8 5 16Wholesale trade 4,854 2 4 12Manufacturing 4 972 2 3 8Manufacturing 4,972 2 3 8Professional, scientific,and technical services 23,895 10 3 8
16www.census.gov/econ/sbo March 15, 2011
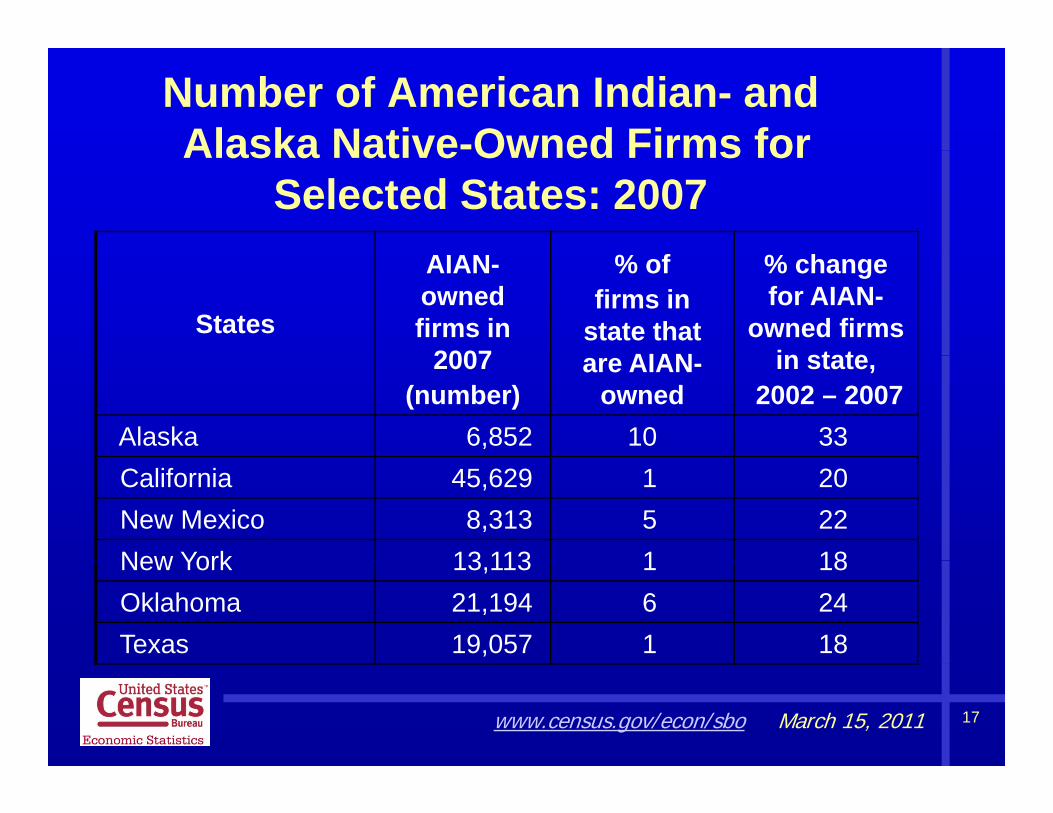
Number of American Indian- andAlaska Native-Owned Firms forAlaska Native Owned Firms for
Selected States: 2007
States
AIAN-owned firms in
2007
% offirms in
state that AIAN
% change for AIAN-
owned firms in state2007
(number)are AIAN-
ownedin state,
2002 – 2007Alaska 6,852 10 33California 45,629 1 20New Mexico 8,313 5 22New York 13 113 1 18New York 13,113 1 18Oklahoma 21,194 6 24 Texas 19,057 1 18
17www.census.gov/econ/sbo March 15, 2011
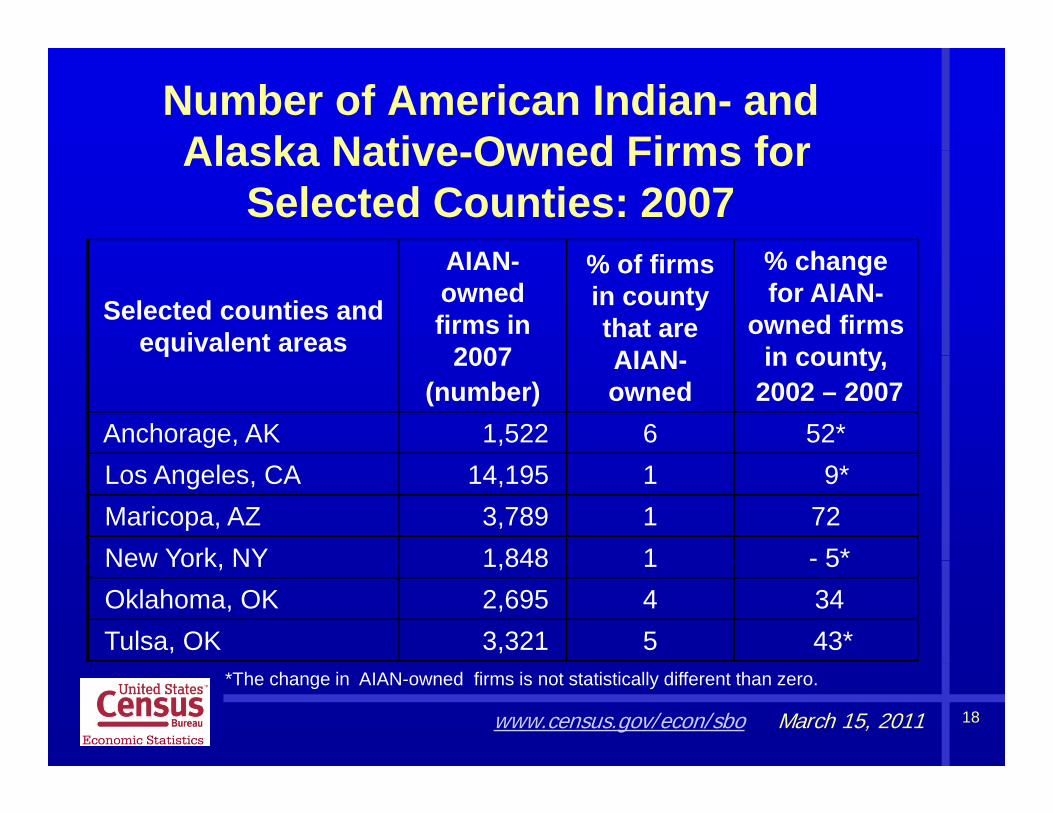
Number of American Indian- andAlaska Native Owned Firms forAlaska Native-Owned Firms for
Selected Counties: 2007 AIAN % h
Selected counties and equivalent areas
AIAN-owned firms in
2007
% of firms in county that are AIAN
% change for AIAN-
owned firms in countyq 2007
(number)AIAN-owned
in county,2002 – 2007
Anchorage, AK 1,522 6 52*Los Angeles, CA 14,195 1 9*Maricopa, AZ 3,789 1 72 New York NY 1 848 1 - 5*New York, NY 1,848 1 - 5Oklahoma, OK 2,695 4 34Tulsa, OK 3,321 5 43*
18www.census.gov/econ/sbo March 15, 2011
*The change in AIAN-owned firms is not statistically different than zero.
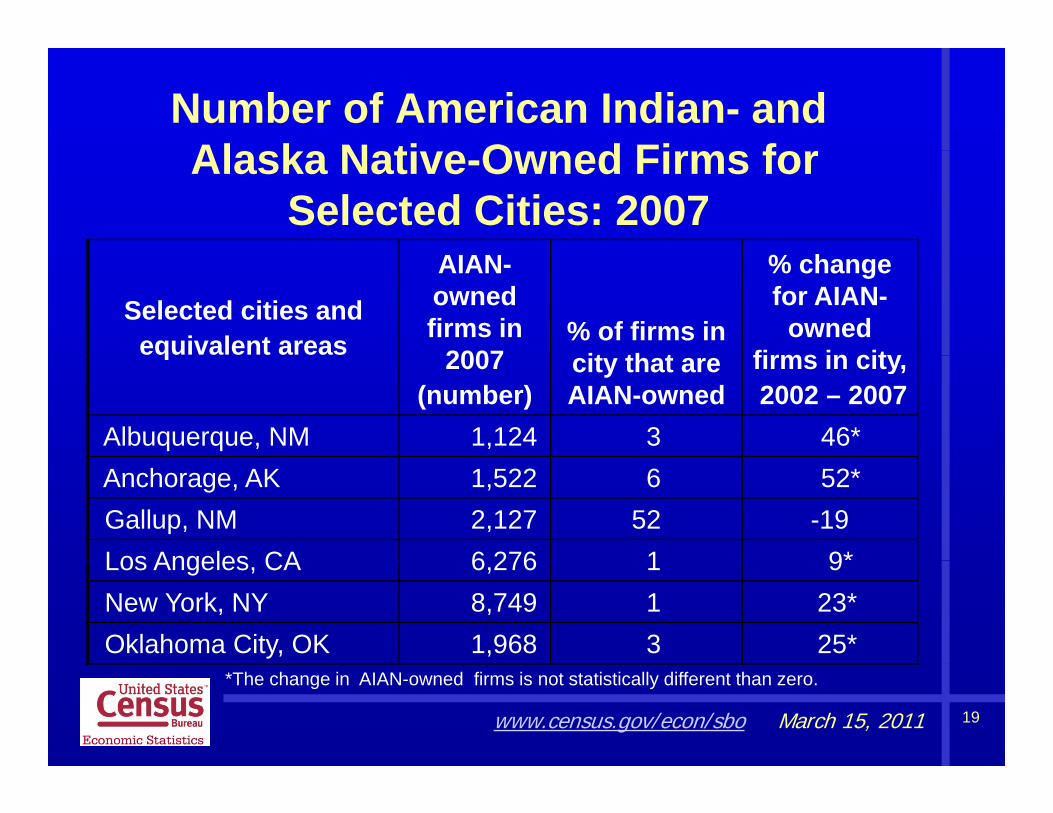
Number of American Indian- andAl k N ti O d Fi fAlaska Native-Owned Firms for
Selected Cities: 2007
Selected cities andequivalent areas
AIAN-owned firms in
2007% of firms in
it th t
% change for AIAN-
owned firms in cityq 2007
(number)city that are AIAN-owned
firms in city,2002 – 2007
Albuquerque, NM 1,124 3 46*Anchorage, AK 1,522 6 52*Gallup, NM 2,127 52 -19 Los Angeles CA 6 276 1 9*Los Angeles, CA 6,276 1 9 New York, NY 8,749 1 23*Oklahoma City, OK 1,968 3 25*
19www.census.gov/econ/sbo March 15, 2011
*The change in AIAN-owned firms is not statistically different than zero.
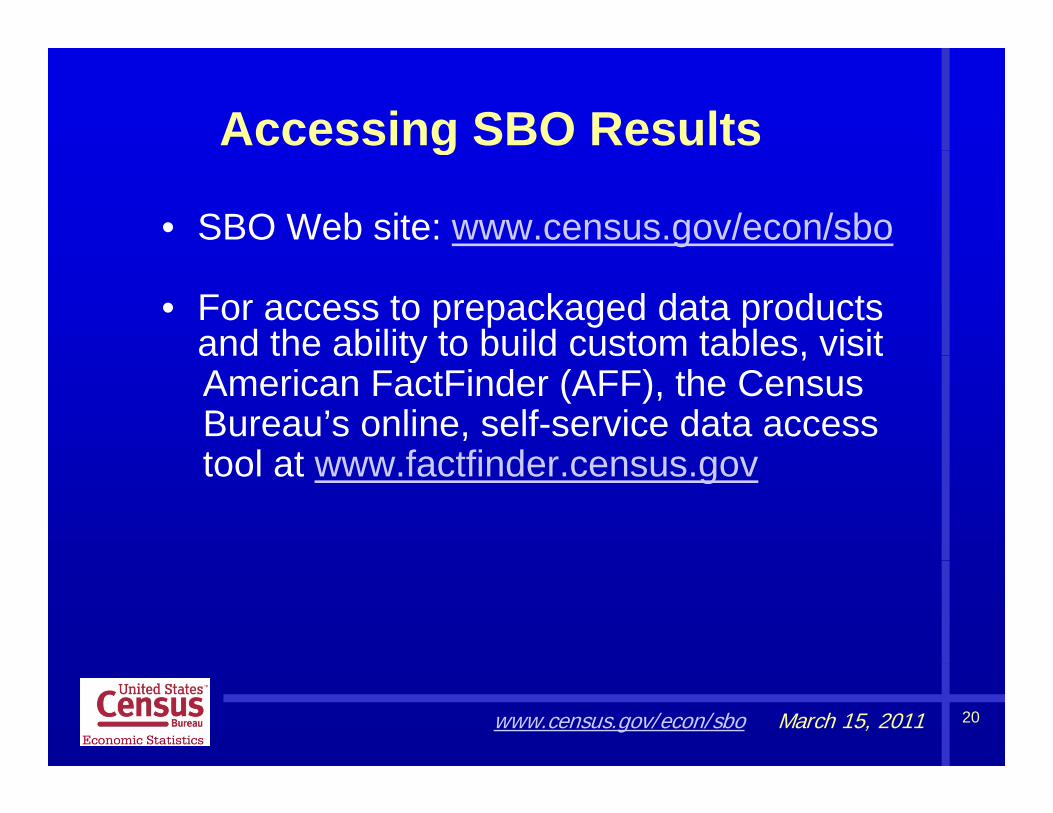
Accessing SBO Resultsg
• SBO Web site: www.census.gov/econ/sbo
• For access to prepackaged data products and the ability to build custom tables, visitand the ability to build custom tables, visitAmerican FactFinder (AFF), the CensusBureau’s online, self-service data accesstool at www factfinder census govtool at www.factfinder.census.gov
20www.census.gov/econ/sbo March 15, 2011
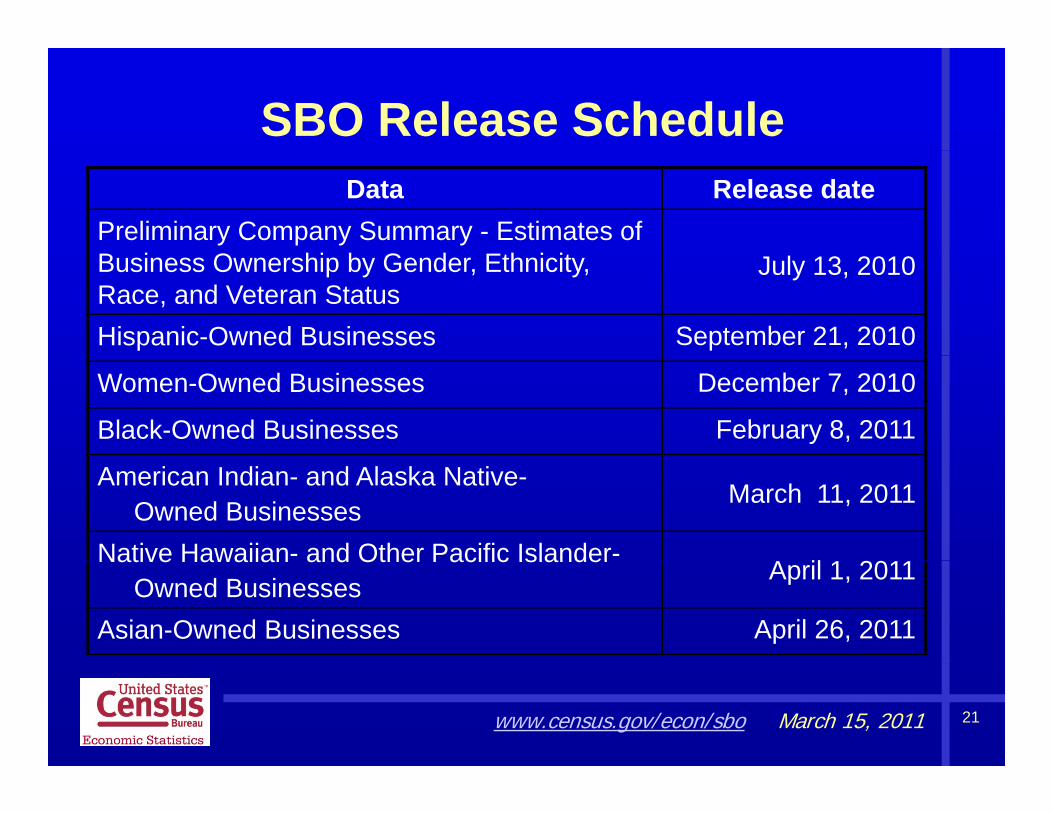
SBO Release ScheduleData Release date
Preliminary Company Summary - Estimates of B i O hi b G d E h i iBusiness Ownership by Gender, Ethnicity, Race, and Veteran Status
July 13, 2010
Hispanic-Owned Businesses September 21, 2010
Women-Owned Businesses December 7, 2010
Black-Owned Businesses February 8, 2011
American Indian- and Alaska Native-Owned Businesses
March 11, 2011
Native Hawaiian- and Other Pacific Islander- A il 1 2011Native Hawaiian and Other Pacific IslanderOwned Businesses
April 1, 2011
Asian-Owned Businesses April 26, 2011
21www.census.gov/econ/sbo March 15, 2011
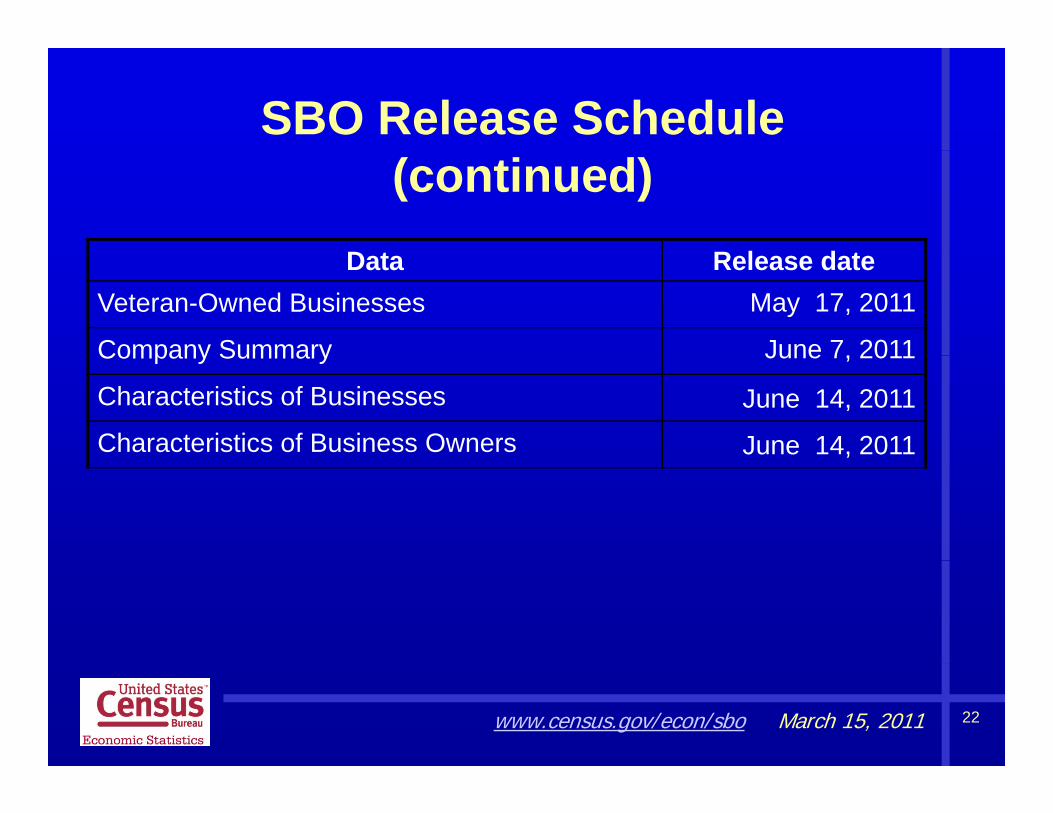
SBO Release Schedule
D t R l d t
(continued)Data Release date
Veteran-Owned Businesses May 17, 2011
Company Summary June 7 2011Company Summary June 7, 2011
Characteristics of Businesses June 14, 2011
Characteristics of Business Owners June 14, 2011,
22www.census.gov/econ/sbo March 15, 2011
U.S. Department of Commerce Minority Business Development Agency
Number of Firms Owned by American Indians and Native Alaskans on the Riselas a s o t e ise
But Job and Wealth Creation Fail to Materialize
Donald Chapman, Senior Advisor on Native American Affairs
The Big PictureThe American Indian and Alaskan Native business community shows some growth yet theirThe American Indian and Alaskan Native business community shows some growth, yet their true economic potential is still unrealized.
In 2007, there were about 237,000 firms generating $34.4 billion in gross receipts and employing 184,000 paid workers.
Between 2002 and 2007, American Indian and Alaskan Native -owned firms outpaced the growth of non-minority firms by 28 percent in gross receipts and by 18 percent in number of firms.
American Indian and Alaskan Native firms are found in all 50 states and the District ofAmerican Indian and Alaskan Native firms are found in all 50 states and the District of Columbia.
The fast growing American Indian and Alaskan Native population increased by 9% during this period, compared to only 1 percent growth for non-minorities.
The American Indian population had an estimated buying power of $64.7 billion in 2009, larger than the purchasing power of countries such as Kenya ($63.7 B), Burma ($57.5 B), Slovenia ($55.8 B), and Costa Rica ($48.5 B).
It is important to note that the Survey of Business Owners data includes businesses owned
24
It is important to note that the Survey of Business Owners data includes businesses owned by Native Americans but not tribally-owned businesses, which is a sizable share of the economic output of Indian Country.
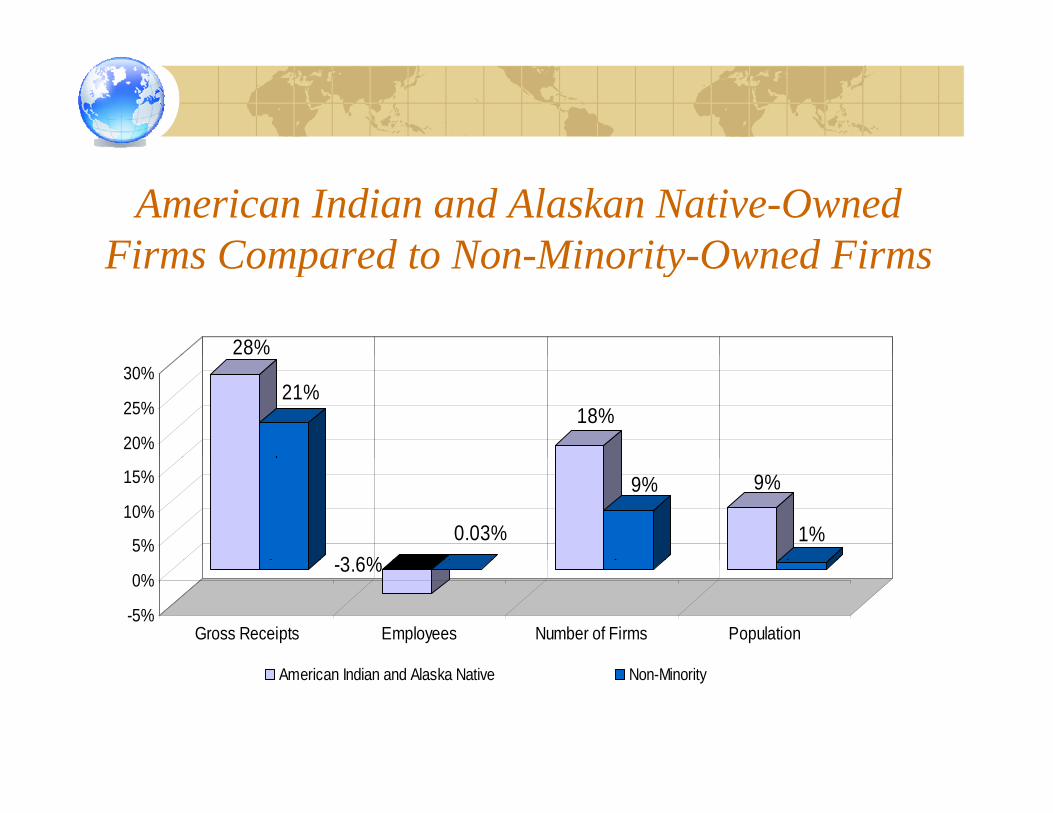
American Indian and Alaskan Native-Owned Firms Compared to Non Minority Owned FirmsFirms Compared to Non-Minority-Owned Firms
28%
21%18%
20%
25%
30%
3 6%0.03%
9% 9%
1%5%
10%
15%
-3.6%
-5%
0%
Gross Receipts Employees Number of Firms Population
25
American Indian and Alaska Native Non-Minority
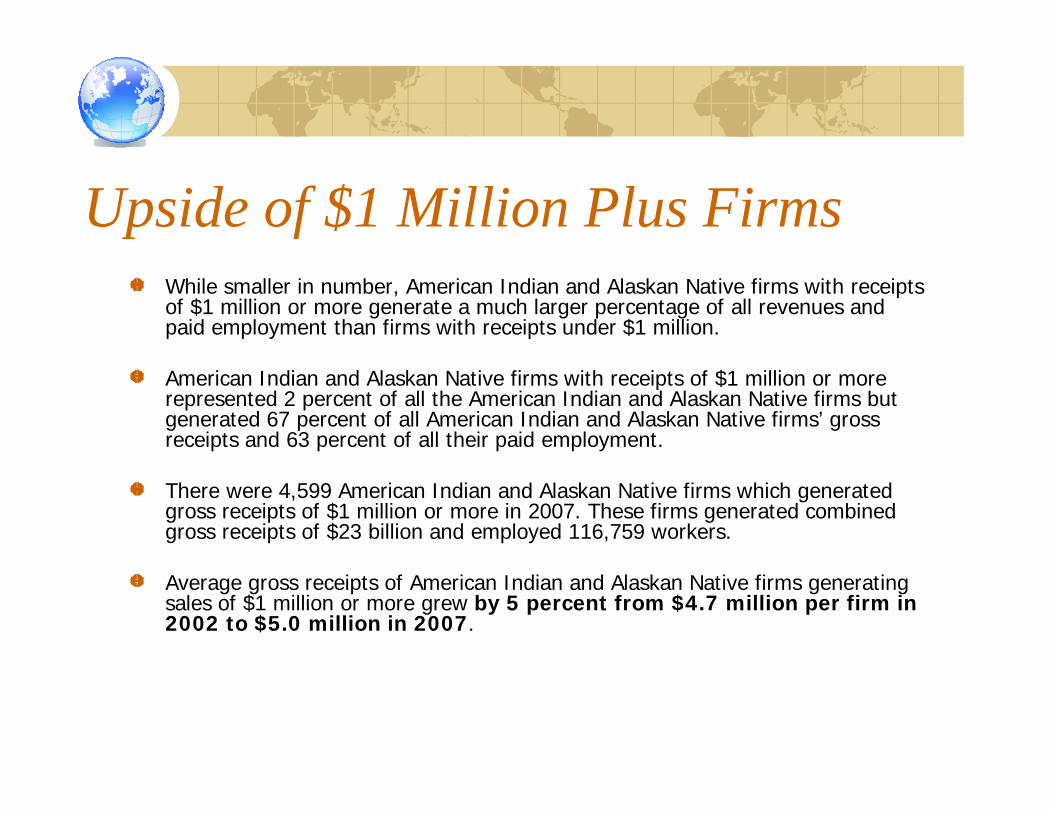
Upside of $1 Million Plus FirmsWhile smaller in number, American Indian and Alaskan Native firms with receipts of $1 million or more generate a much larger percentage of all revenues and paid employment than firms with receipts under $1 million.
American Indian and Alaskan Native firms with receipts of $1 million or more represented 2 percent of all the American Indian and Alaskan Native firms but generated 67 percent of all American Indian and Alaskan Native firms’ gross receipts and 63 percent of all their paid employment.
There were 4,599 American Indian and Alaskan Native firms which generated gross receipts of $1 million or more in 2007. These firms generated combined gross receipts of $23 billion and employed 116,759 workers.
Average gross receipts of American Indian and Alaskan Native firms generating sales of $1 million or more grew by 5 percent from $4.7 million per firm in 2002 to $5.0 million in 2007.
26
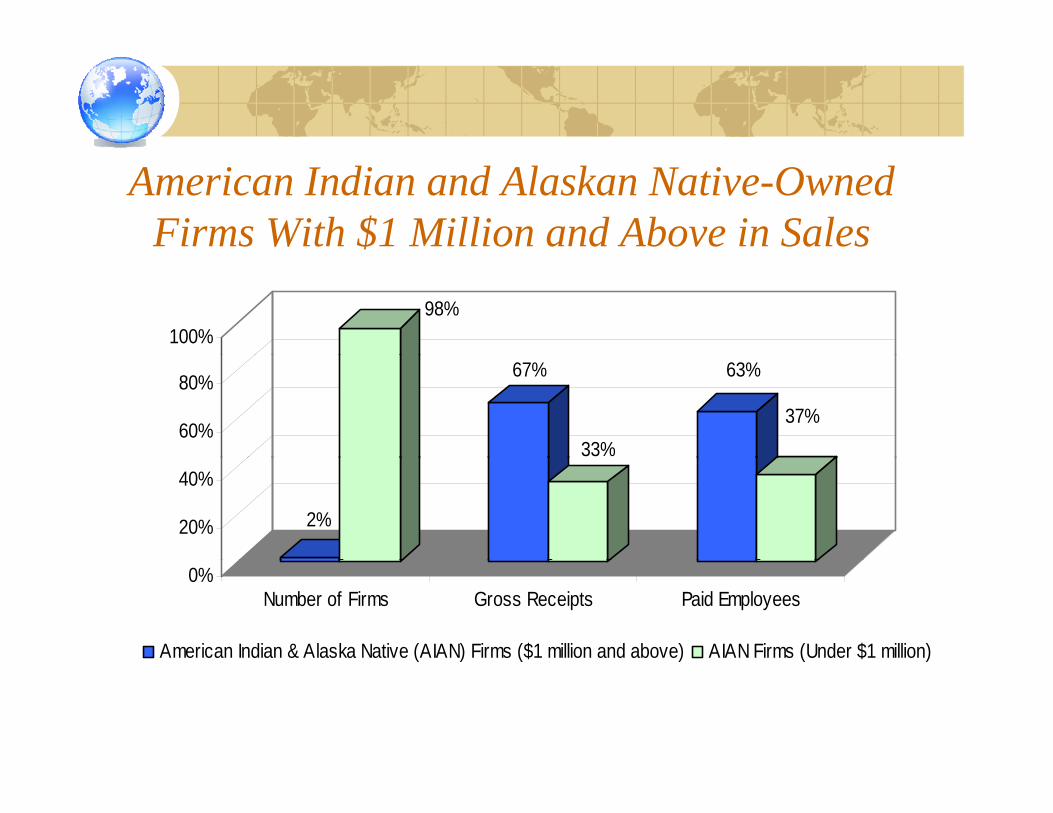
American Indian and Alaskan Native-Owned Firms With $1 Million and Above in Sales
98%100%
67%
33%
63%
37%60%
80%
2%20%
40%
0%Number of Firms Gross Receipts Paid Employees
American Indian & Alaska Native (AIAN) Firms ($1 million and above) AIAN Firms (Under $1 million)
27
Entrepreneurial ParityAt MBDA, we measure entrepreneurial parity of minority-owned firms. Unfortunately, there is still an entrepreneurial parity gap between American Indian and Alaskan Native firms, (which represent 0.9% of classifiable U.S. firms) and the share of the American Indian and Alaskan Native adult population, which is 1.5 percent of the U.S. adult population.
If American Indian & Alaska Native firms’ gross receipts reflected the 2007 adult American Indian & Alaska Native population share, receipts would have amounted to more than $160 billion—about $126 billion more than the actual figure.
P id l t ld h t t l d l 829 000 b t 4 5 ti th t lPaid employment would have totaled nearly 829,000—about 4.5 times the actual employment.
The number of American Indian & Alaska Native firms would have been over 383,000 firms-- nearly 147,000 additional firms.
More effort should be dedicated to grow and expand American Indian & Alaska Native firms in size and scale.
28
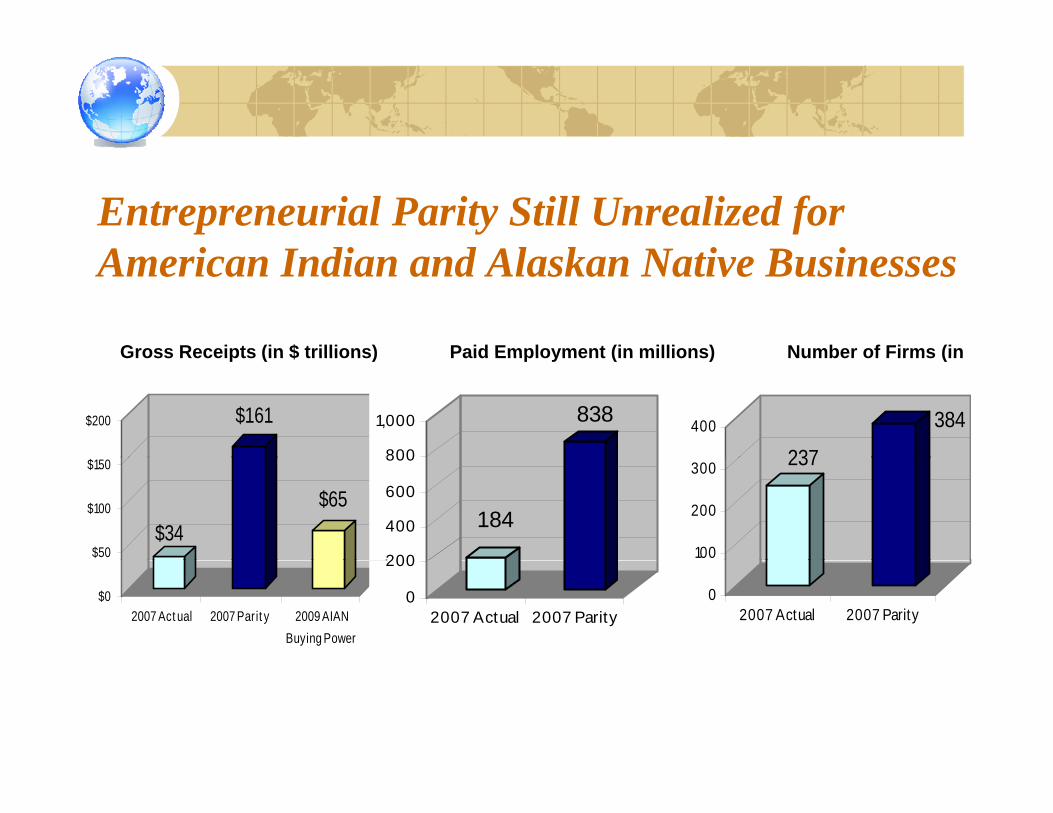
Entrepreneurial Parity Still Unrealized for A i I di d Al k N ti B iAmerican Indian and Alaskan Native Businesses
Gross Receipts (in $ trillions) Paid Employment (in millions) Number of Firms (in
$161$200 838
800
1,000
237
384400
Gross Receipts (in $ trillions) Paid Employment (in millions) Number of Firms (in millions)
$34$65
$50
$100
$150
184
200
400
600
800 237
100
200
300
$02007 Act ual 2007 Parit y 2009 AIAN
Buying Power
0
200
2007 Actual 2007 Parity0
2007 Actual 2007 Parity
29
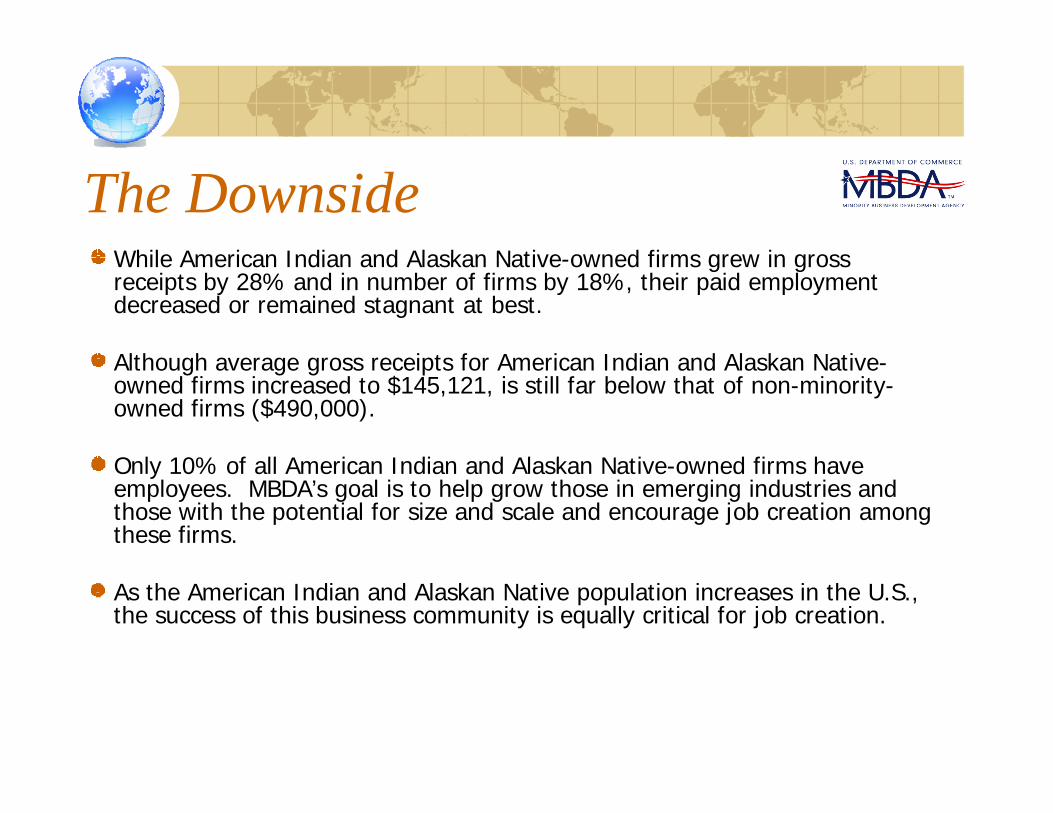
The DownsideWhil A i I di d Al k N ti d fi iWhile American Indian and Alaskan Native-owned firms grew in gross receipts by 28% and in number of firms by 18%, their paid employment decreased or remained stagnant at best.
Alth h i t f A i I di d Al k N tiAlthough average gross receipts for American Indian and Alaskan Native-owned firms increased to $145,121, is still far below that of non-minority-owned firms ($490,000).
O l 10% f ll A i I di d Al k N ti d fi hOnly 10% of all American Indian and Alaskan Native-owned firms have employees. MBDA’s goal is to help grow those in emerging industries and those with the potential for size and scale and encourage job creation among these firms.
As the American Indian and Alaskan Native population increases in the U.S., the success of this business community is equally critical for job creation.
30
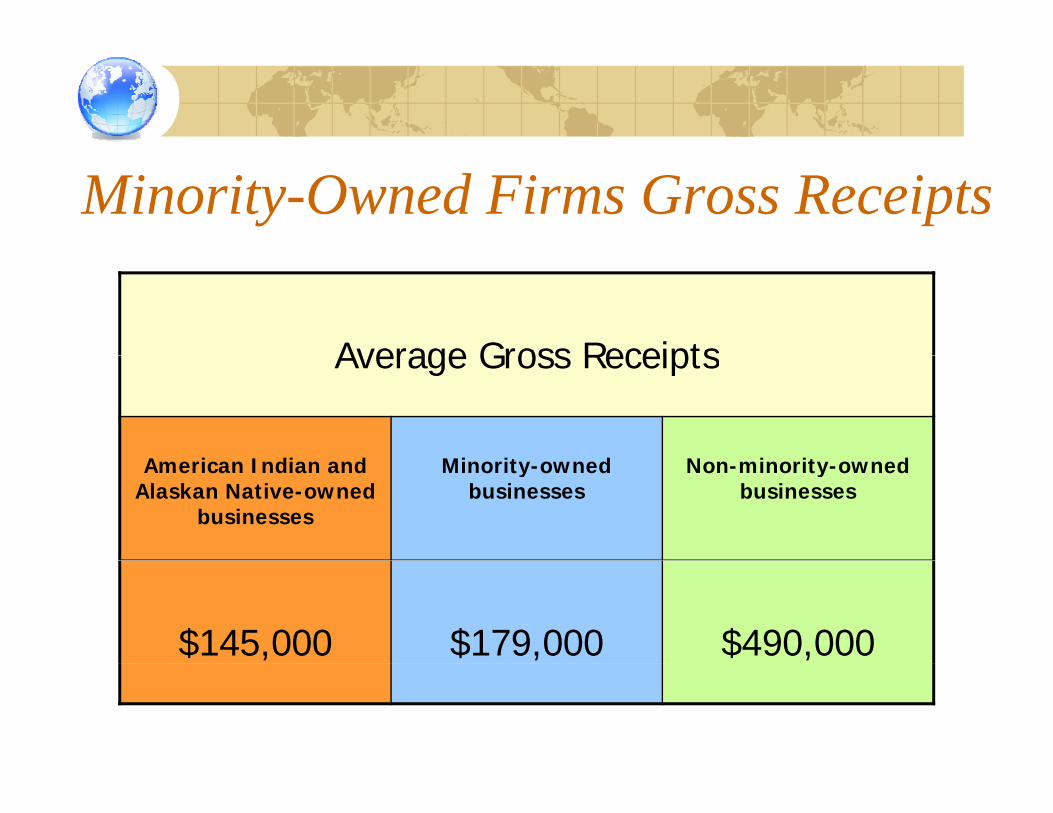
Minority-Owned Firms Gross Receipts
Average Gross ReceiptsAverage Gross Receipts
A i I di d Mi it d N i it dAmerican Indian and Alaskan Native-owned
businesses
Minority-owned businesses
Non-minority-owned businesses
$145,000 $179,000 $490,000
31
The FutureMBDA is committed to making sure the growth andMBDA is committed to making sure the growth and competitiveness of the minority business community continues to be a national priority.
MBDA i ti th f d ti f th t ti f $100MBDA is creating the foundation for the next generation of $100 million minority-owned firms capable of employing the growing minority population, expanding our tax base and securing our position as a global leader.
Last year, MBDA assisted minority owned firms in accessing more than $3 billion in contracts and financings, creating more than 3,000 jobs.than 3,000 jobs.
To grow more minority-owned firms to size and capacity, MBDA encourages minority businesses to consider growth by mergers and acq isition joint ent es and st ategic pa tne ships
32
and acquisition, joint ventures and strategic partnerships.
Contacting MBDA Public AffairsFor more information, please contact:
E il bli ff i @ bdEmail: [email protected]: 202.482.6272
33
Questions?Questions?
34www.census.gov/econ/sbo March 15, 2011
Key Upcoming Press Events fromKey Upcoming Press Events from the U.S. Census Bureau
• March 22 Technical Webinar on 2010 Census Data Products
• March 24 2010 Census Operational PressMarch 24 2010 Census Operational Press Briefing
• April 5 Webinar on 2007 Business Ownership Data for Native Hawaiian-Ownership Data for Native Hawaiian-and Other Pacific Islander-Owned Businesses
A il 26 W bi 2007 B i• April 26 Webinar on 2007 Business Ownership Data for Asian-Owned Businesses
35www.census.gov/econ/sbo March 15, 2011
Contact InformationContact Information• U.S. Census Bureau
Public Information OfficePublic Information OfficePhone: 301.763.3030
• National Congress of American IndiansgPhone: 202.466.7767
• Minority Business Development AgencyP bli Aff i OffiPublic Affairs OfficePhone: 202.482.6272
36www.census.gov/econ/sbo March 15, 2011