Embed Size (px)
Citation preview
U.S. Capital Advisors LLC
Investor Presentation
November 2009
Confidential
The USCA Shield Fund
“SHLDX”
A process driven strategy designed to help reduce risk and boost income
October 2017
Investment Principles
• Our guiding philosophy is to take every step practical to
increase the probability of earning a positive return.
• Reversion to the mean is historically consistent.
• We know that we don’t know the future.
• Without risk there is no return.
• We are always personally invested alongside our investors.
2
• Provide a reasonable rate of return comparable to the S&P 500 Index1 over
a full market cycle with substantially less risk (as measured by the standard
deviation of returns).
• Outperform the CBOE BuyWrite Index (BXM)2.
• Seek cash flow from dividends and option premium that is substantially
higher than the dividend yield of the S&P 500.
3
Investment Goals
1 S&P 500 Index: The S&P 500 Index is weighted by market value, and its performance is thought to be representative of the stock market as a
whole. The S&P 500 Index was created in 1957, although it has been extrapolated backwards to several decades earlier for performance
comparison purposes. This index provides a broad snapshot of the overall U.S. equity market; in fact, over 70% of all U.S. equity is tracked by
the S&P 500 Index. The index selects its companies based upon their market size, liquidity, and sector. The S&P 500 Index is a market-
weighted index. It is not possible to invest directly in this index.2 The BXM is a passive total return index based on (1) buying an S&P 500 stock index portfolio, and (2) "writing" (or selling) the near-term S&P
500 Index (SPXSM) "covered" call option, generally on the third Friday of each month. The SPX call written will have about one month
remaining to expiration, with an exercise price just above the prevailing index level (i.e., slightly out of the money). The SPX call is held until
expiration and cash settled, at which time a new one-month, near-the-money call is written. It is not possible to invest directly in this index.
Note: There is no assurance that the strategy will achieve its investment objectives. The use of covered call strategies does not ensure profits or guarantee
against losses.
4
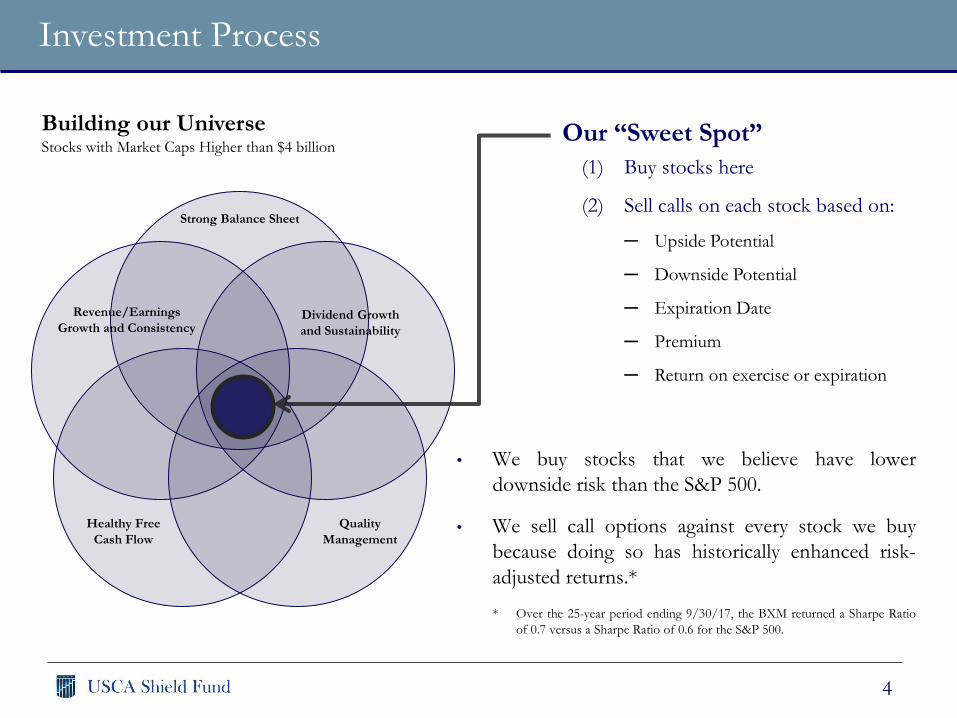
Building our UniverseStocks with Market Caps Higher than $4 billion
(1) Buy stocks here
(2) Sell calls on each stock based on:
─ Upside Potential
─ Downside Potential
─ Expiration Date
─ Premium
─ Return on exercise or expiration
Revenue/Earnings
Growth and ConsistencyDividend Growth
and Sustainability
Strong Balance Sheet
Quality
Management
Healthy Free
Cash Flow
Our “Sweet Spot”
Investment Process
• We buy stocks that we believe have lower
downside risk than the S&P 500.
• We sell call options against every stock we buy
because doing so has historically enhanced risk-
adjusted returns.*
* Over the 25-year period ending 9/30/17, the BXM returned a Sharpe Ratio
of 0.7 versus a Sharpe Ratio of 0.6 for the S&P 500.
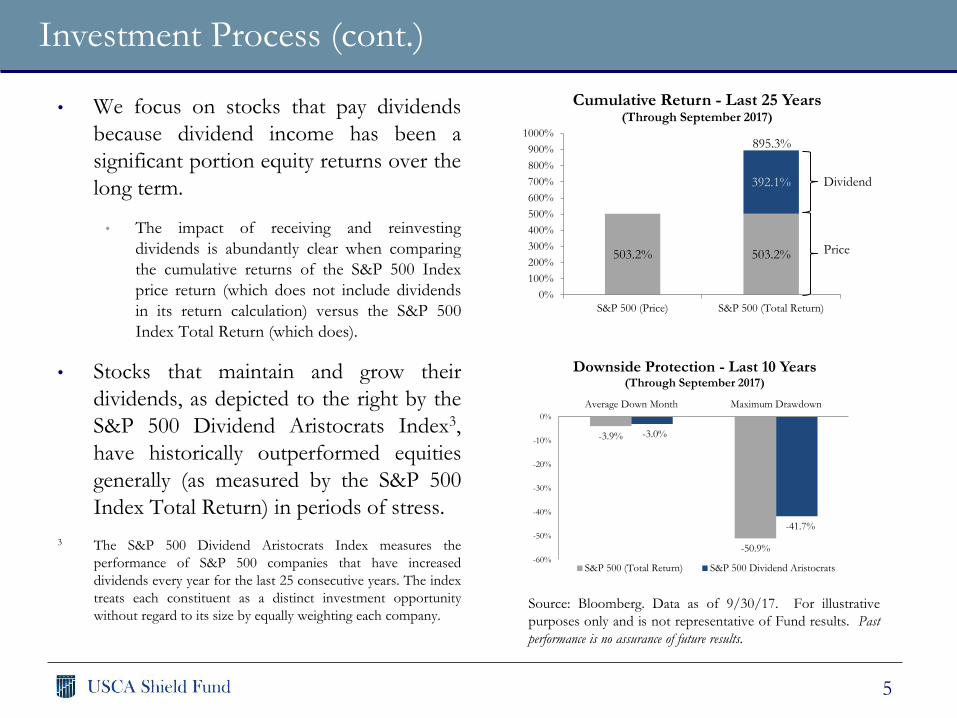
503.2% 503.2%
392.1%
0%
100%
200%
300%
400%
500%
600%
700%
800%
900%
1000%
S&P 500 (Price) S&P 500 (Total Return)
Cumulative Return - Last 25 Years(Through September 2017)
5
• We focus on stocks that pay dividends
because dividend income has been a
significant portion equity returns over the
long term.
• The impact of receiving and reinvesting
dividends is abundantly clear when comparing
the cumulative returns of the S&P 500 Index
price return (which does not include dividends
in its return calculation) versus the S&P 500
Index Total Return (which does).
• Stocks that maintain and grow their
dividends, as depicted to the right by the
S&P 500 Dividend Aristocrats Index3,
have historically outperformed equities
generally (as measured by the S&P 500
Index Total Return) in periods of stress.
3 The S&P 500 Dividend Aristocrats Index measures the
performance of S&P 500 companies that have increased
dividends every year for the last 25 consecutive years. The index
treats each constituent as a distinct investment opportunity
without regard to its size by equally weighting each company.Source: Bloomberg. Data as of 9/30/17. For illustrative
purposes only and is not representative of Fund results. Past
performance is no assurance of future results.
Investment Process (cont.)
Price
Dividend
895.3%
-3.9%
-50.9%
-3.0%
-41.7%
-60%
-50%
-40%
-30%
-20%
-10%
0%
Average Down Month Maximum Drawdown
Downside Protection - Last 10 Years(Through September 2017)
S&P 500 (Total Return) S&P 500 Dividend Aristocrats
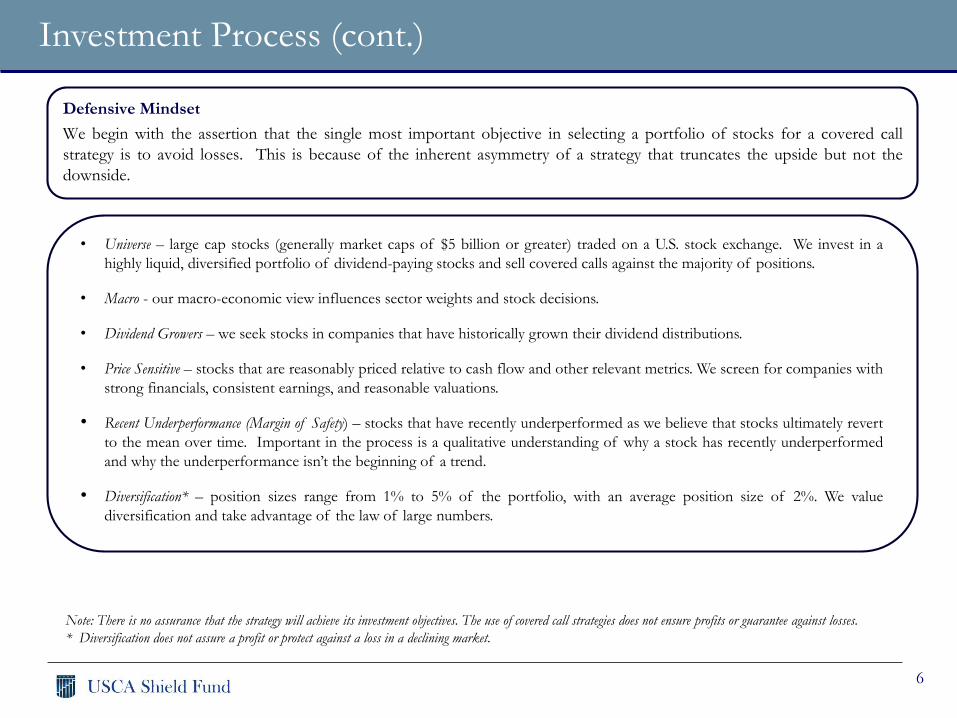
• Universe – large cap stocks (generally market caps of $5 billion or greater) traded on a U.S. stock exchange. We invest in a
highly liquid, diversified portfolio of dividend-paying stocks and sell covered calls against the majority of positions.
• Macro - our macro-economic view influences sector weights and stock decisions.
• Dividend Growers – we seek stocks in companies that have historically grown their dividend distributions.
• Price Sensitive – stocks that are reasonably priced relative to cash flow and other relevant metrics. We screen for companies with
strong financials, consistent earnings, and reasonable valuations.
• Recent Underperformance (Margin of Safety) – stocks that have recently underperformed as we believe that stocks ultimately revert
to the mean over time. Important in the process is a qualitative understanding of why a stock has recently underperformed
and why the underperformance isn’t the beginning of a trend.
• Diversification* – position sizes range from 1% to 5% of the portfolio, with an average position size of 2%. We value
diversification and take advantage of the law of large numbers.
Defensive Mindset
We begin with the assertion that the single most important objective in selecting a portfolio of stocks for a covered call
strategy is to avoid losses. This is because of the inherent asymmetry of a strategy that truncates the upside but not the
downside.
6
Investment Process (cont.)
Note: There is no assurance that the strategy will achieve its investment objectives. The use of covered call strategies does not ensure profits or guarantee against losses.
* Diversification does not assure a profit or protect against a loss in a declining market.
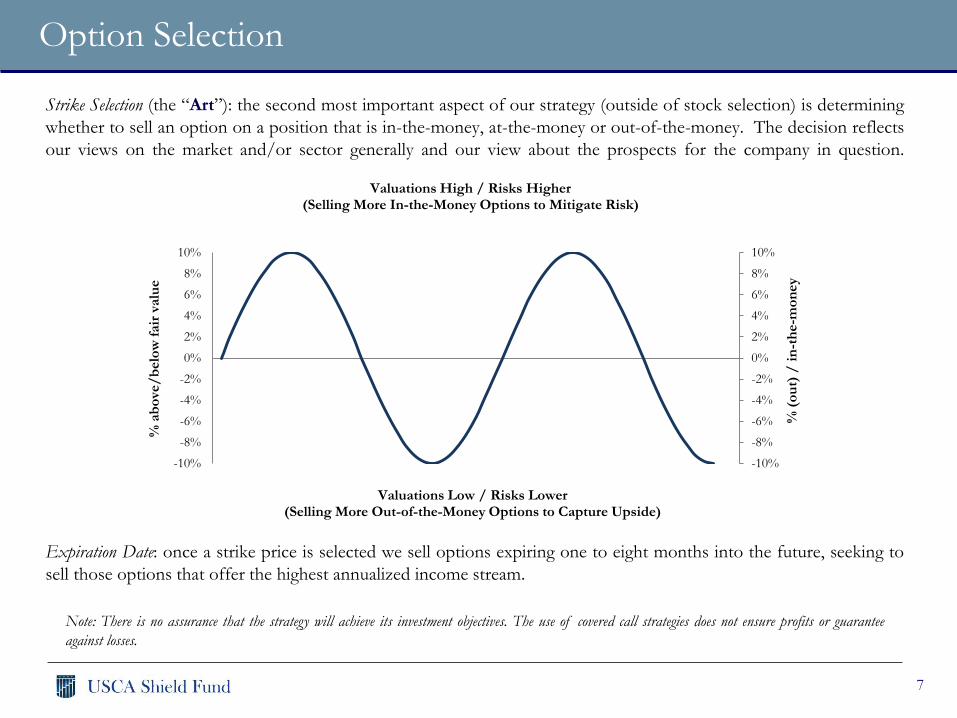
Strike Selection (the “Art”): the second most important aspect of our strategy (outside of stock selection) is determining
whether to sell an option on a position that is in-the-money, at-the-money or out-of-the-money. The decision reflects
our views on the market and/or sector generally and our view about the prospects for the company in question.
Expiration Date: once a strike price is selected we sell options expiring one to eight months into the future, seeking to
sell those options that offer the highest annualized income stream.
7
Option Selection
Note: There is no assurance that the strategy will achieve its investment objectives. The use of covered call strategies does not ensure profits or guarantee
against losses.
-10%
-8%
-6%
-4%
-2%
0%
2%
4%
6%
8%
10%
-10%
-8%
-6%
-4%
-2%
0%
2%
4%
6%
8%
10%
Valuations High / Risks Higher(Selling More In-the-Money Options to Mitigate Risk)
Valuations Low / Risks Lower(Selling More Out-of-the-Money Options to Capture Upside)
% a
bo
ve/
belo
w f
air
valu
e
% (
ou
t)/
in
-th
e-m
on
ey
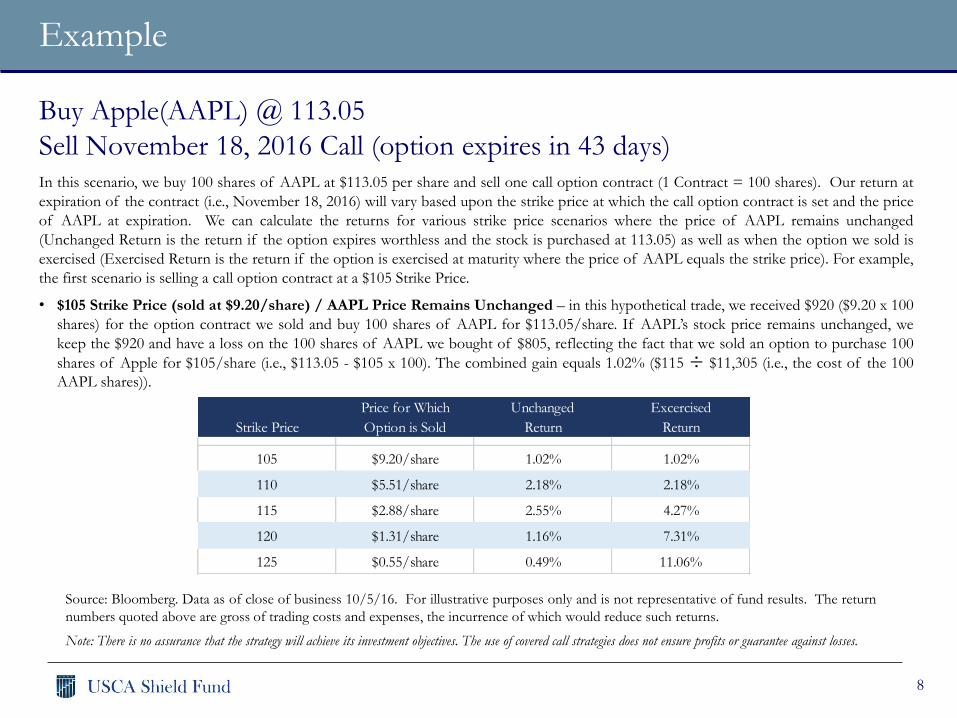
Buy Apple(AAPL) @ 113.05
Sell November 18, 2016 Call (option expires in 43 days)
Source: Bloomberg. Data as of close of business 10/5/16. For illustrative purposes only and is not representative of fund results. The return
numbers quoted above are gross of trading costs and expenses, the incurrence of which would reduce such returns.
8
Example
Note: There is no assurance that the strategy will achieve its investment objectives. The use of covered call strategies does not ensure profits or guarantee against losses.
In this scenario, we buy 100 shares of AAPL at $113.05 per share and sell one call option contract (1 Contract = 100 shares). Our return at
expiration of the contract (i.e., November 18, 2016) will vary based upon the strike price at which the call option contract is set and the price
of AAPL at expiration. We can calculate the returns for various strike price scenarios where the price of AAPL remains unchanged
(Unchanged Return is the return if the option expires worthless and the stock is purchased at 113.05) as well as when the option we sold is
exercised (Exercised Return is the return if the option is exercised at maturity where the price of AAPL equals the strike price). For example,
the first scenario is selling a call option contract at a $105 Strike Price.
• $105 Strike Price (sold at $9.20/share) / AAPL Price Remains Unchanged – in this hypothetical trade, we received $920 ($9.20 x 100
shares) for the option contract we sold and buy 100 shares of AAPL for $113.05/share. If AAPL’s stock price remains unchanged, we
keep the $920 and have a loss on the 100 shares of AAPL we bought of $805, reflecting the fact that we sold an option to purchase 100
shares of Apple for $105/share (i.e., $113.05 - $105 x 100). The combined gain equals 1.02% ($115 ÷ $11,305 (i.e., the cost of the 100
AAPL shares)).
Price for Which Unchanged Excercised
Strike Price Option is Sold Return Return
105 $9.20/share 1.02% 1.02%
110 $5.51/share 2.18% 2.18%
115 $2.88/share 2.55% 4.27%
120 $1.31/share 1.16% 7.31%
125 $0.55/share 0.49% 11.06%
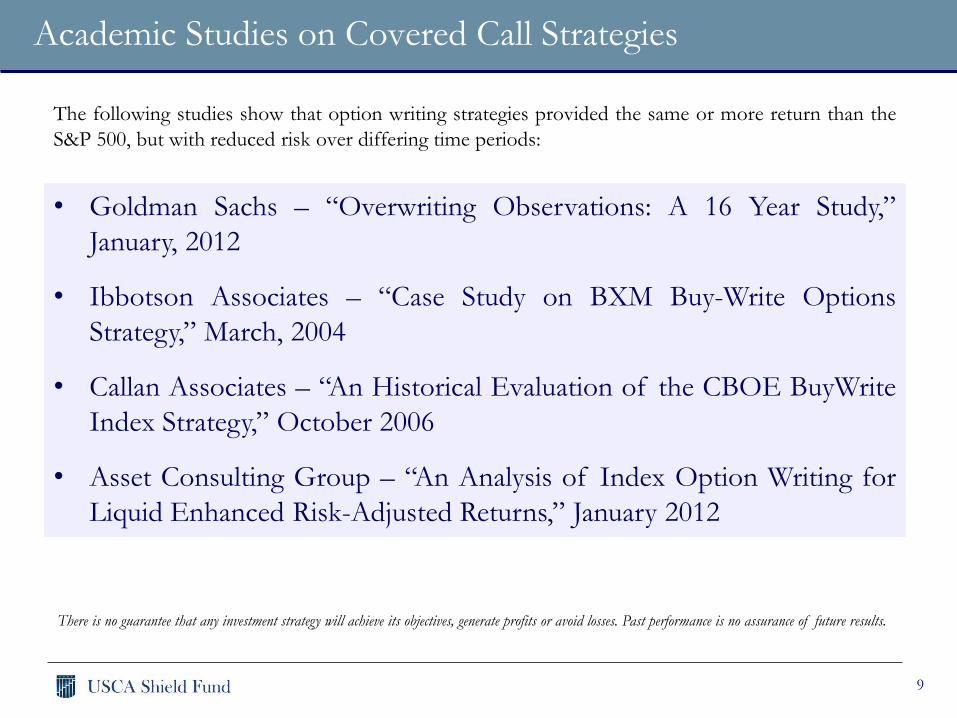
Academic Studies on Covered Call Strategies
• Goldman Sachs – “Overwriting Observations: A 16 Year Study,”
January, 2012
• Ibbotson Associates – “Case Study on BXM Buy-Write Options
Strategy,” March, 2004
• Callan Associates – “An Historical Evaluation of the CBOE BuyWrite
Index Strategy,” October 2006
• Asset Consulting Group – “An Analysis of Index Option Writing for
Liquid Enhanced Risk-Adjusted Returns,” January 2012
9
There is no guarantee that any investment strategy will achieve its objectives, generate profits or avoid losses. Past performance is no assurance of future results.
The following studies show that option writing strategies provided the same or more return than the
S&P 500, but with reduced risk over differing time periods:
Portfolio Managers
10
Kelly Rushing has served as a Managing Director of U.S. Capital Advisors (USCA), the
parent company of the advisor to the Fund, since 2015. Prior to joining USCA, from 2006 to
2015, Mr. Rushing served as a financial advisor and portfolio manager at UBS Financial
Services. Prior to UBS, Mr. Rushing worked in similar capacities at JC Bradford, Solomon
Smith Barney, and Shearson Lehman Bros., among other firms. He received his
undergraduate degree and Masters of Business Administration from The University of
Texas. Mr. Rushing's experience with the covered call strategy dates back to his days at the
University of Texas where he authored a paper on the subject as part of his graduate work.
He serves on the board of the Texas Historical Foundation and the Open Door Mission and
has been married for over 40 years.
Davis Rushing has served as a Managing Director of USCA since 2015. Prior to joining
USCA, from 2006 to 2015, Mr. Rushing served as a financial advisor and portfolio manager
at UBS Financial Services. He received his undergraduate degree from The University of
Texas and his Masters of Business Administration from Rice University. Davis assists Kelly
in security selection and portfolio management; and manages all trading activity. He is
married with three young children and produces theater with his wife in his free time.
Definitions
11
At-the-Money Call Option: An at-the-money call option is a call option for which the exercise or “strike” price is equal to the current
market price of the underlying asset.
Free Cash Flow: A measure of a company's financial performance, calculated as operating cash flow minus capital expenditures. Free cash
flow represents the cash that a company is able to generate after spending the money required to maintain or expand its asset base.
Call Option: An agreement that gives an investor the right (but not the obligation) to buy a security at a specified price, known as the
exercise or “strike” price, within a specific time period.
Covered Call: An options strategy whereby an investor holds a long position in an asset and writes (sells) call options on that same asset in
an attempt to generate increased income from the asset.
In-the-Money Call Option: An in-the-money call option is a call option for which the exercise or “strike” price is below the current
market price of the underlying asset.
Maximum Drawdown: A drawdown is any losing period during an investment record. It is defined as the percent retrenchment from an
equity peak to an equity valley. A drawdown is in effect from the time an equity retrenchment begins until a new equity high is reached (i.e.,
in terms of time, a drawdown encompasses both the period from equity peak to equity valley and the time from the equity valley to a new
equity high. Maximum drawdown is simply the largest percentage drawdown that has occurred in any investment data record.
Out-of-the-Money Call Option: An out-of-the-money call option is a call option for which the exercise or “strike” price is above the
current market price of the underlying asset.
Return on Investment: The rate of return annualized over a given period, expressed on an annual basis or as a return per year.
Sharpe Ratio: A return/risk measure developed by William Sharpe. The Sharpe Ratio is calculated by taking the investment returns
generated above the risk free rate (in this case, defined as 1.0% annually) and dividing it by the standard deviation of those returns.
Volatility: A statistical measure of the dispersion of returns for a given security or market index. Volatility is often measured by standard
deviation. Typically, the higher the volatility, the riskier the security.
Standard Deviation: A measure of volatility of returns over a given time period. Typically, the higher the volatility, the riskier the security.
Important Disclosures
12
Investors should carefully consider the investment objectives, risks, charges and expenses of the USCA Shield Fund. This and
other important information about the Fund is contained in the prospectus, which can be obtained at www.uscashield.com or by
calling 1-844-US-SHLDX. The prospectus should be read carefully before investing.
The USCA Shield Fund is distributed by Quasar Distributors, LLC. USCA Asset Management LLC is not affiliated with Quasar
Distributors, LLC.
Mutual fund investing involves risk. Principal loss is possible. There is no assurance that the fund will achieve its investmentobjectives. Selling covered call or stock index options will limit the Fund's gain, if any, on its underlying securities and the fundcontinues to bear the risk of a decline in the value of its underlying stocks.
Fund holdings and allocations are subject to change at any time and should not be considered a recommendation to buy or sellany security.