Embed Size (px)
Citation preview
XA h< ^TiC
U.S. ARMY RESEARCH INSTITUTE OF
ENVIRONMENTAL MEDICINE
TECHNICAL REPORT NO. T00-3 DATE November 1999 AD
A COMPARISON OF 2 CURRENT-ISSUE ARMY BOOTS, 5 PROTOTYPE MILITARY BOOTS
AND 5 COMMERCIAL HIKING BOOTS: PERFORMANCE, EFFICIENCY, BIOMECHANICS COMFORT AND INJURY
20000215 040 APPROVED FOR PUBLIC RELEASE; DISTRIBUTION |S UNLIM ITED
U.S. ARMY MEDICAL RESEARCH AND MATERIEL COMMAND
DTIC QUALITY DJS?IX3TEB 1
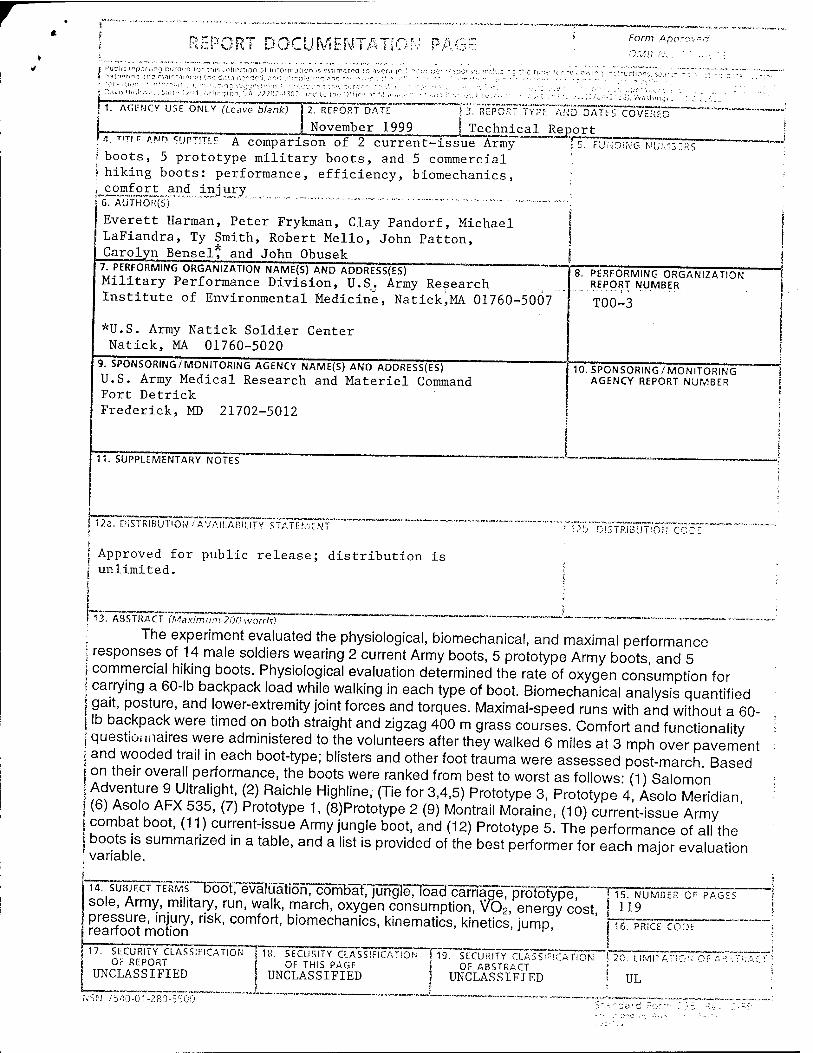
REPORT DOCUMENTA i V Form Ana
Munic: r(?pof,.riQ ourcH/n TO 03!h(vinq ice r~,.1 r--1in! nn
■; collection of inform-.Tti-; CJJ',.1 n™d?:i. ,"T;^ ::"™nl
/<•• ;J2C,--I30."
1. AGENCY USE ONLY (Leave blank) 2. REPORT DATE
November 1999 a. T!TIF AND SUBTITLE A comparison of 2 current-issue^rmy
? boots, 5 prototype military boots, and 5 commercial ? hiking boots: performance, efficiency, biomechanics, ^_comfor^t and injury j 6. Ä™lTfHÖT(s'j """ ~"" * .-.--—. - - „... ... .........
I Everett Harman, Peter Frykman, Clay Pandorf, Michael LaFiandra, Ty Smith, Robert Mello, John Patton, Carolyn Bensel? and John Obusek
{ 3. REPORT TY ..
[ Technical Report AND DATES COVERED
jiMG MUMPERS
7. PERFORMING ORGANIZATION NAME(S) AND ADDRESS(ES) "
Military Performance Division, U.S. Army Research Institute of Environmental Medicine, Natick,MA 01760-5007
*U.S. Army Natick Soldier Center Natick, MA 01760-5020
8. PERFORMING ORGANIZATION REPORT NUMBER
T00-3
9. SPONSORING/MONITORING AGENCY NAME(S) AND ADDRESS(ES)
U.S. Army Medical Research and Materiel Command Fort Detrick Frederick, MD 21702-5012
10. SPONSORING/MONITORING AGENCY REPORT NUMBER
11. SUPPLEMENTARY NOTES
12a. DISTRIBUTION/AVAILABILITY "STATEMENT™ """ ~ "~"
| Approved for public release; distribution is ! unlimited.
DISTRIBUTION' COD:
i 13. AaSJRACj'"(Maximum~20G words)
■ The experiment evaluated the physiological, biomechanical, and maximal performance ; responses of 14 male soldiers wearing 2 current Army boots, 5 prototype Army boots and 5 j commercial hiking boots. Physiological evaluation determined the rate of oxygen consumption for \ carrying a 60-lb backpack load while walking in each type of boot. Biomechanical analysis quantified | gait, posture, and lower-extremity joint forces and torques. Maximal-speed runs with and without a 60- | lb backpack were timed on both straight and zigzag 400 m grass courses. Comfort and functionality j questionnaires were administered to the volunteers after they walked 6 miles at 3 mph over pavement j and wooded trail in each boot-type; blisters and other foot trauma were assessed post-march Based | on their overall performance, the boots were ranked from best to worst as follows- (1) Salomon
l ^TKTL^f^\ (2) RaiChle Highline' (Tie for 3'4'5> Prototype 3, Prototype 4, Asolo Meridian, j (6) Asolo AFX 535, (7) Prototype 1, (8)Prototype 2 (9) Montrail Moraine, (10) current-issue Army \ combat boot, (11) current-issue Army jungle boot, and (12) Prototype 5. The performance of all the j boots is summarized in a table, and a list is provided of the best performer for each major evaluation ; variable.
u. SUBJECT TERMS~boot, evaluation, comb^ungleTlöäacäireipn^^ NUMBER CE PAGES | sole, Army, military, run, walk, march, oxygen consumption, V02, energy cost I 119 ! pressure, injury, risk, comfort, biomechanics, kinematics, kinetics jump : rearfoot motion '' Hl 16. PRICE CODE
17' n^Dr^^551^1^^3-!^ SECURITY CLASSIFICATiofTTTg. SICÜTÜTTOÄ^SIRCÄITÖ^ 0|- REPOR! OF THIS PAGE OF ABSTRACT j" ">-■■■■ UNCLASSIFIED UNCLASSIFIED UNCLASSIFIED UL
I WJ 7540-01-280-5500
r
A comparison of 2 current-issue Army boots, 5 prototype military boots, and 5 commercial hiking boots: performance, efficiency, biomechanics, comfort and injury
A comparison of 2 current-issue Army boots, 5 prototype military boots and 5 commercial hiking boots: performance, efficiency, biomechanics, comfort and iniurv injury
Everett Harman*, Peter Frykman*, Clay Pandorf * Michael LaFiandra* Ty Smith* Robert Mello°, John Patton*, Carolyn Bensel*. and John Obusek*
$ Military Performance Division U.S. Army Research Institute of Environmental Medicine Natick, MA 01760-5007
* U.S. Army Natick Soldier Center Natick, MA 01760-5020
TABLE OF CONTENTS
Figures Tables "~'i"^""""Z!ZZZZZZ""""" V
Background -■ List of symbols, abbreviations and acronyms '.". jx Disclaimer • • • , jy Distribution statement jy Executive summary 1
Introduction Methods
Boots Z\\\\\\\\ZZZZZZZZ.'ZZ." 4 The 5 Prototype Boots (Boots 1-5) i"8
Last ""■'' Upper Z.'.'ZZ.'." 18 Removable insert 18
The sole of prototype 1 1g
The sole of prototype 2 1g
The sole of prototype 3 -jg The sole of prototype 4 1g
The sole of prototype 5 2n The Current-Issue Army Combat Boot (Boot 6) 20 The Current-Issue Army Jungle Boot (Boot 7) 20 The Montrail Moraine (Boot 8) ........'... 21 The Raichle Highline (Boot 9) ....".. 21 The Asolo AFX 535 (Boot 10) ......."..........'......... 21 The Asolo Meridian (Boot 11) ..."...... 21 The Salomon Adventure 9 Ultralight (Boot 12) .....'.. 22
Research Volunteers 24
The Test Battery '."'...... 26 Physical Performance 26
Timed 400 m Grass Runs "... 26 Physiology ""'".^"""!"!!"!!!"""]!"".'26
Rate of Oxygen Consumption " 26 Biomechanics ?7
Foot Contact Pressure 27 Kinematics and Kinetics " 28
Comfort and Injury Risk Assessment 2g
Experimental Design and Analysis ..."........ 30 Environmental Impact on
Results .".'.'".".'.'.'.'.'.'."!.".'.".'.".'.'."!." 3-j Physical Performance .Z..Z 31
Timed 400 m Grass Runs 31
Physiology "'.'.'.''.'.'".'.'.'.'.'".'.'.'.'.".'".".'.'.'.".'.'.'.'.'.' 34 Rate of Oxygen Consumption .".'""." 34
Biomechanics _^ 06
In-Shoe Pressure Sensing During Walking With and Without a Load ^ Motion Analysis of Backpack Walking Z?
Kinematics Forces and Torques f? Rear-foot Angular Motion V,
Kinematics and Kinetics of Jump Landing „ Kinetics of Running at 6.5 mph jS Comfort and Injury Prevention ?Z
A System for Overall Boot Evaluation no Discussion yc5
Conclusions 97
Recommendations...! "".'".'".'.'"""" ^•^••-.^.LW.^... 98 References 10°
Appendix A: Boot Questionnaire and FooHnjury^Recording Form""^""""""""""^o4
IV
FIGURES
1. 2. 3. 4. 5.
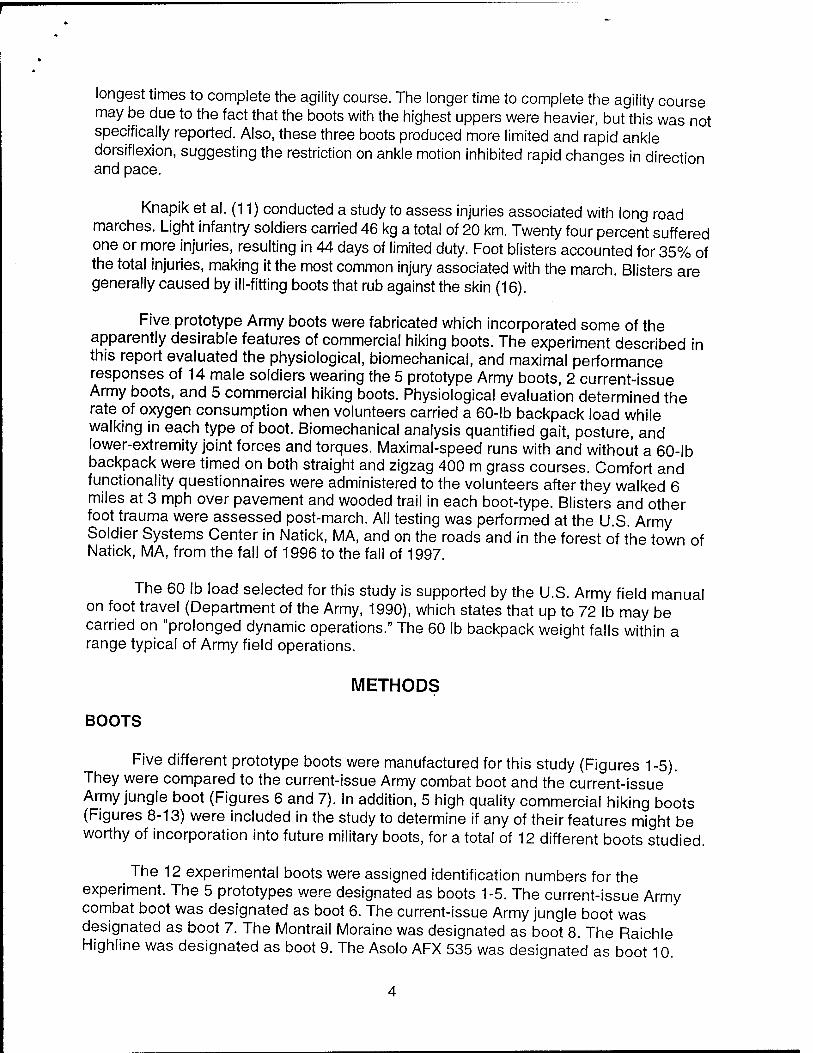
Boot 1 - Prototype 1 5
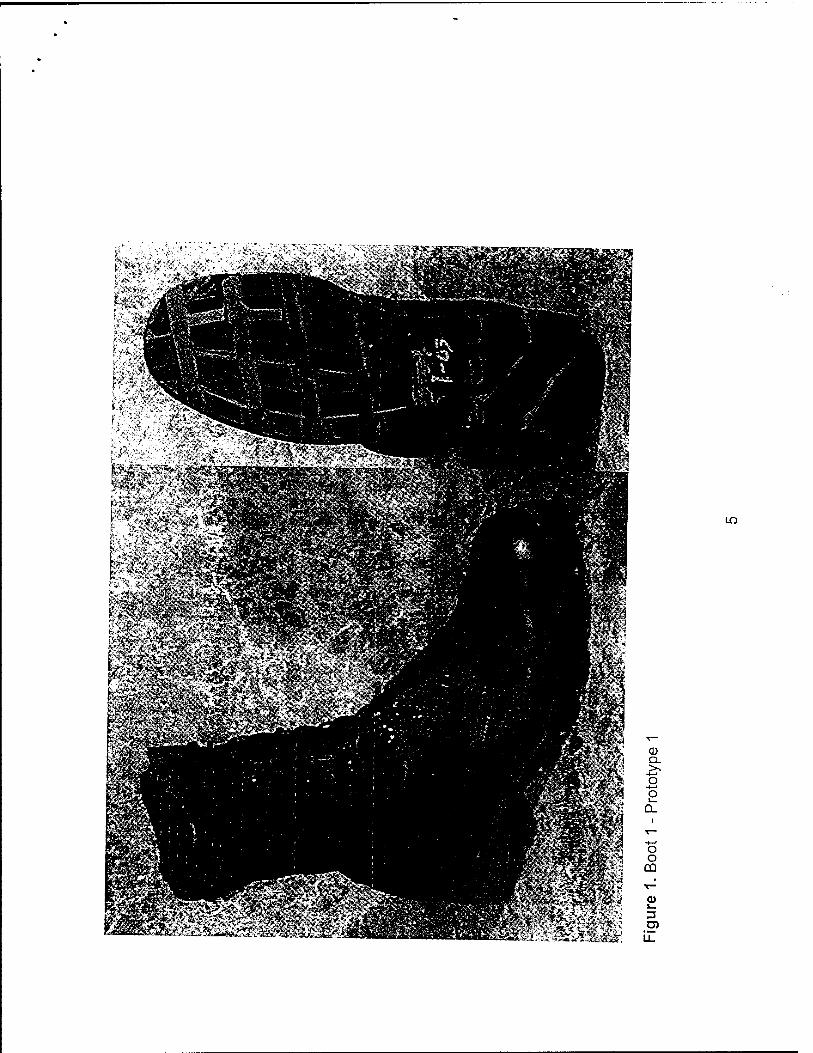
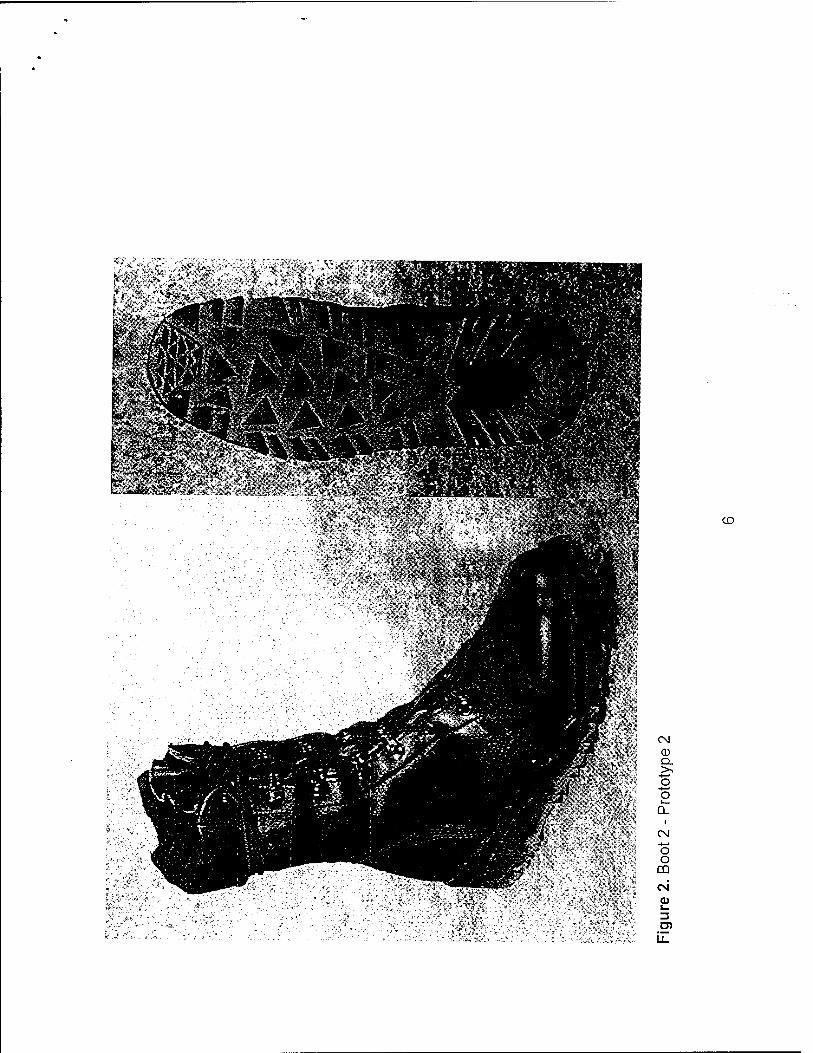
Boot 2 - Prototype 2 "!!!]"!"!!^]]!!".".'.'."".'.""!!.'.' 6 Boot 3 - Prototype 3 ' "" 7
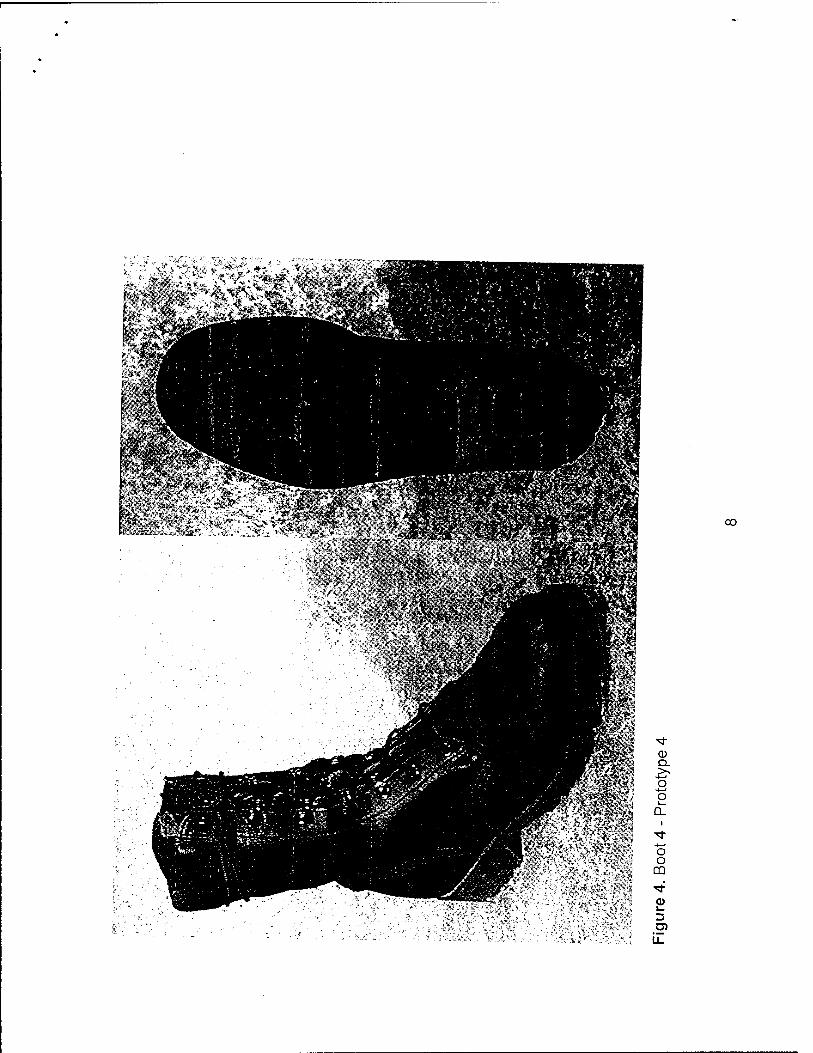
Boot 4 - Prototype 4 ][[[[ 8
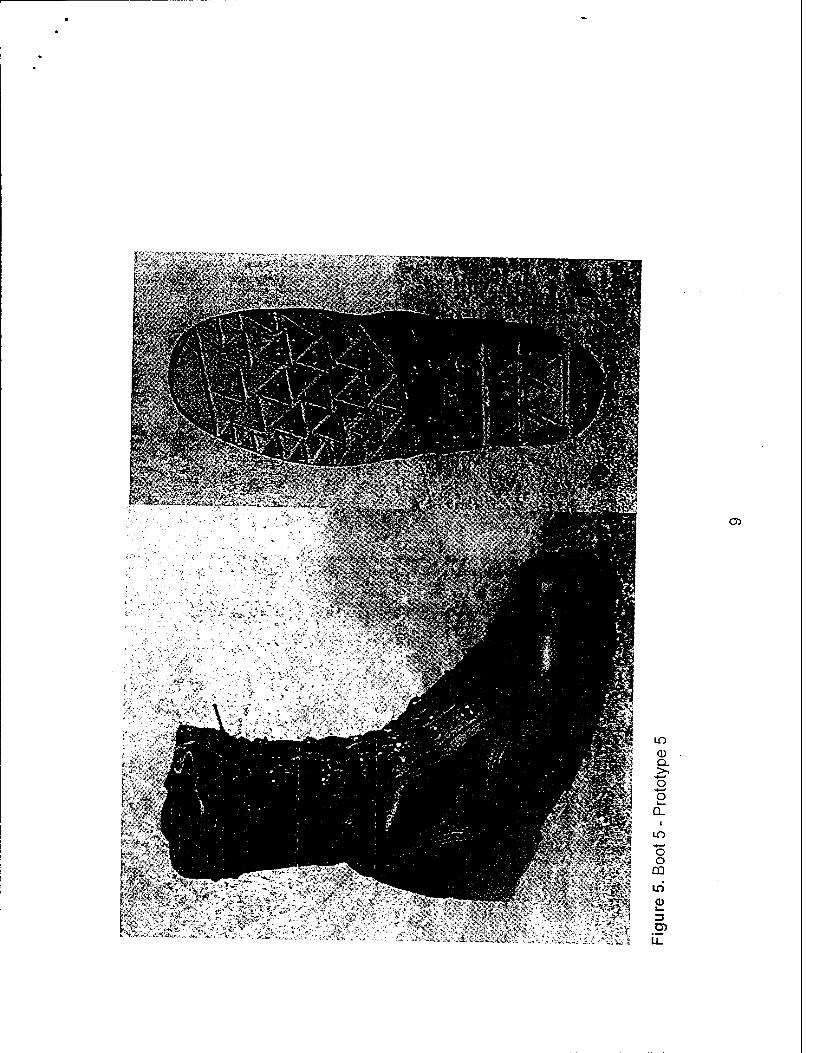
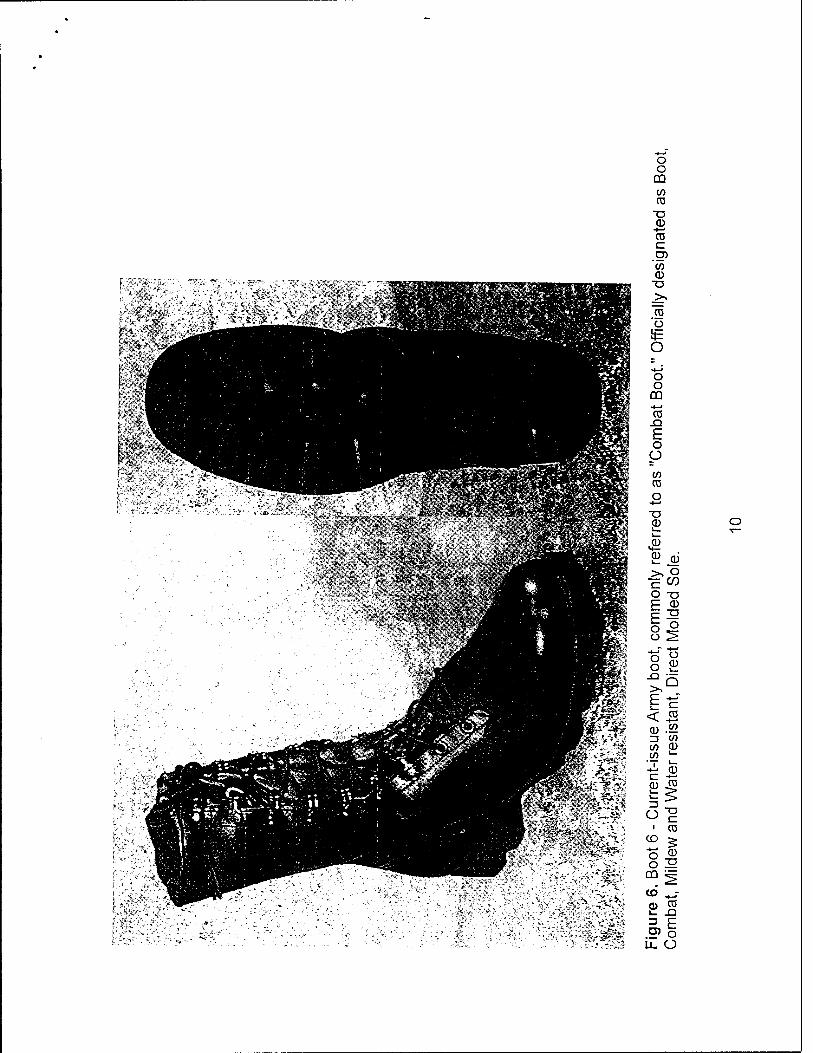
Boot 5 - Prototype 5 _"_"_" g 6. Boot 6 - Current-issue Army boot, commonly referred to as "Combat Boot."
Officially designated as Boot, Combat, Mildew and Water resistant, Direct Molded Sole 10
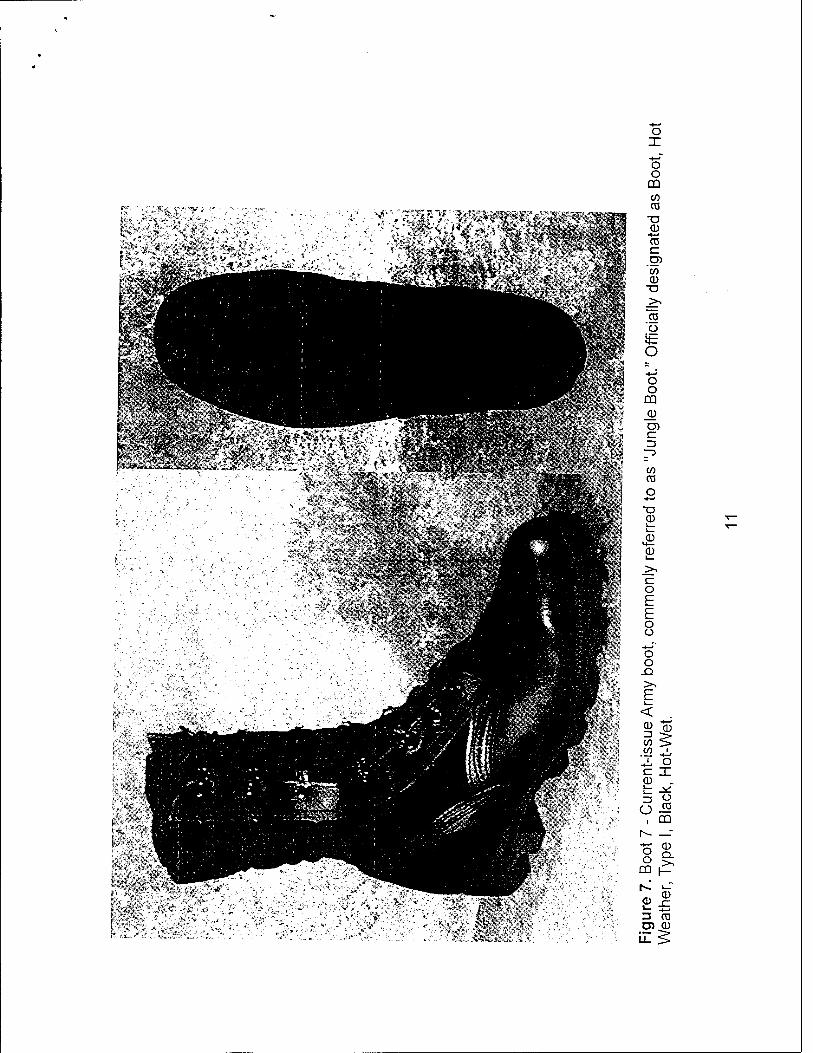
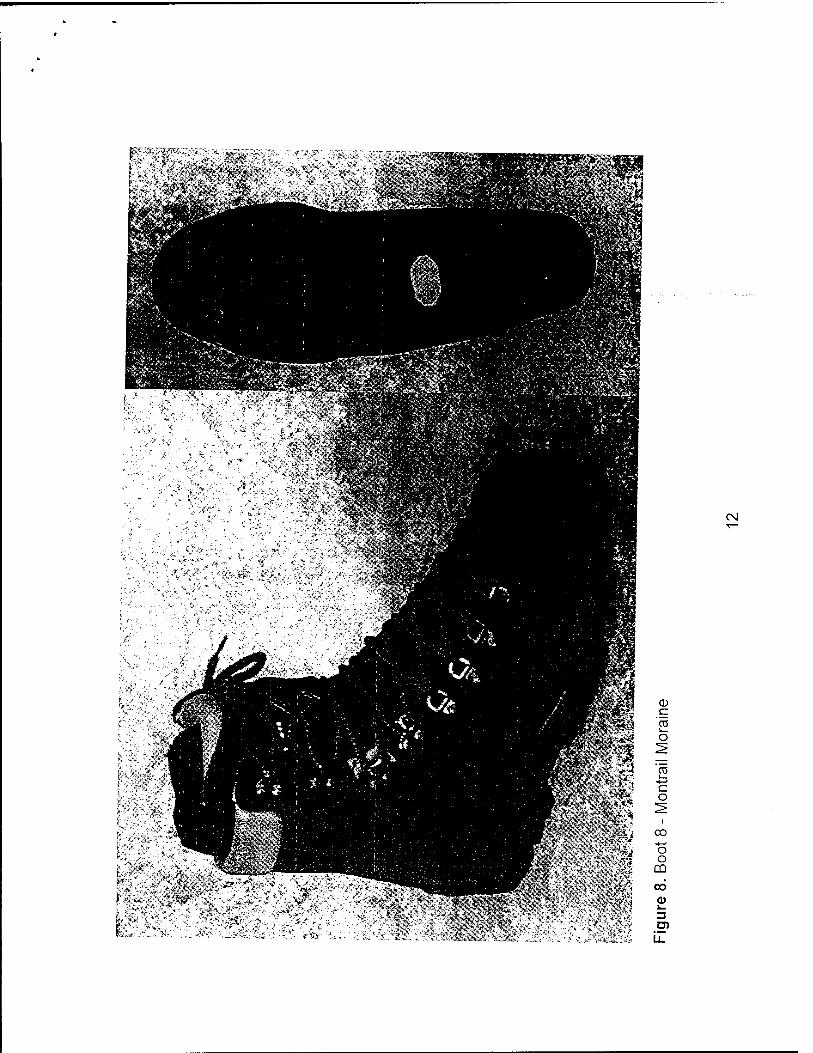
7. Boot 7 - Current -issue Army boot, commonly referred to as "Jungle Boot." Officially designated as Boot, Hot Weather, Type I, Black, Hot-Wet 11 Boot 8 - Montrail Moraine 12
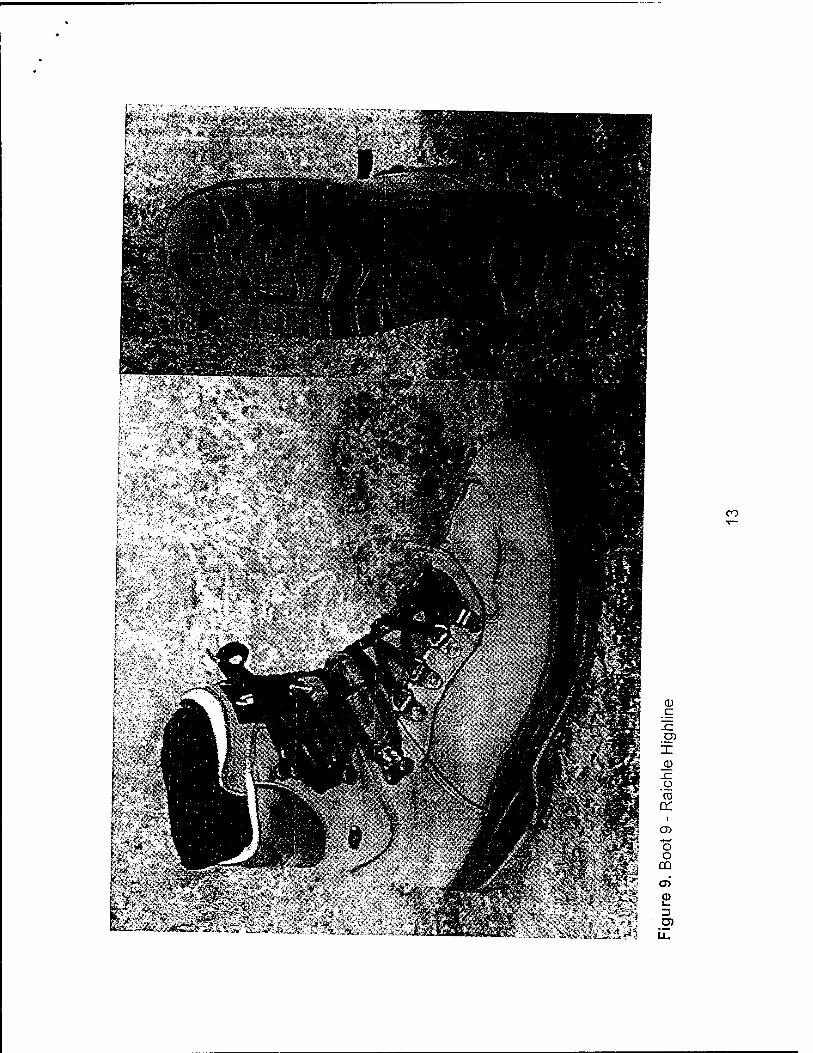
9. Boot 9 - Raichle Highline .""..." 13 10. 11. 12.
8
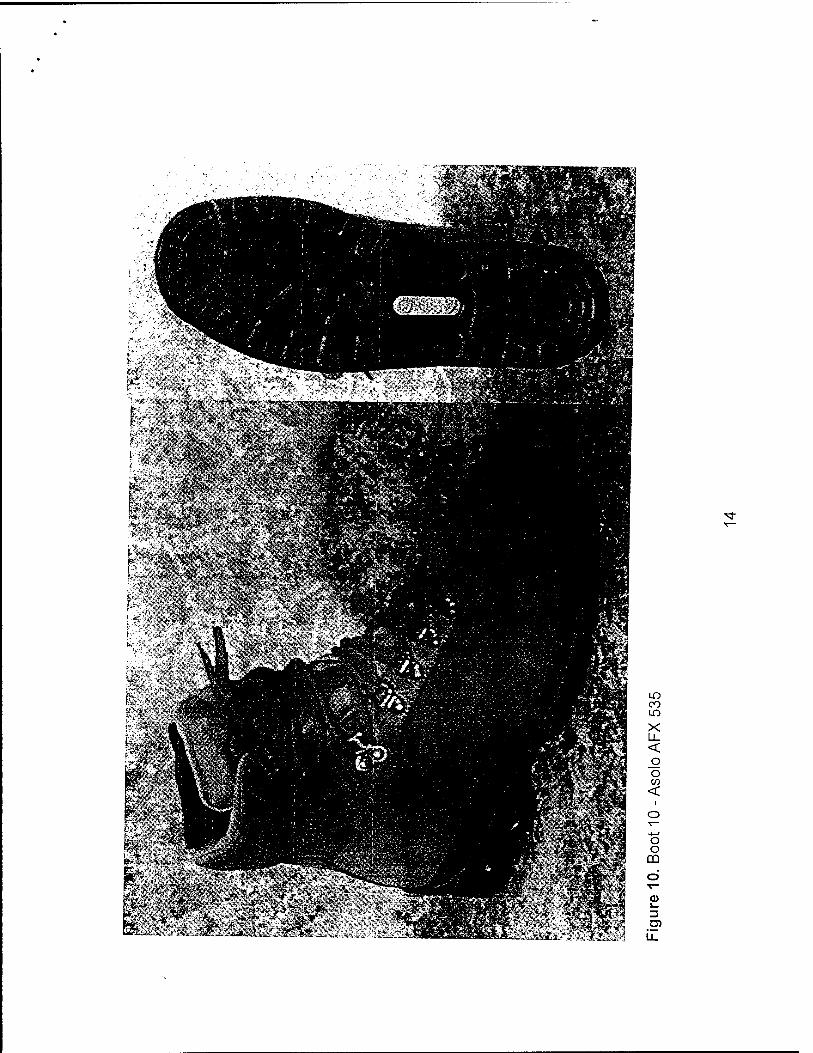
Boot 10-AsoloAFX535 14
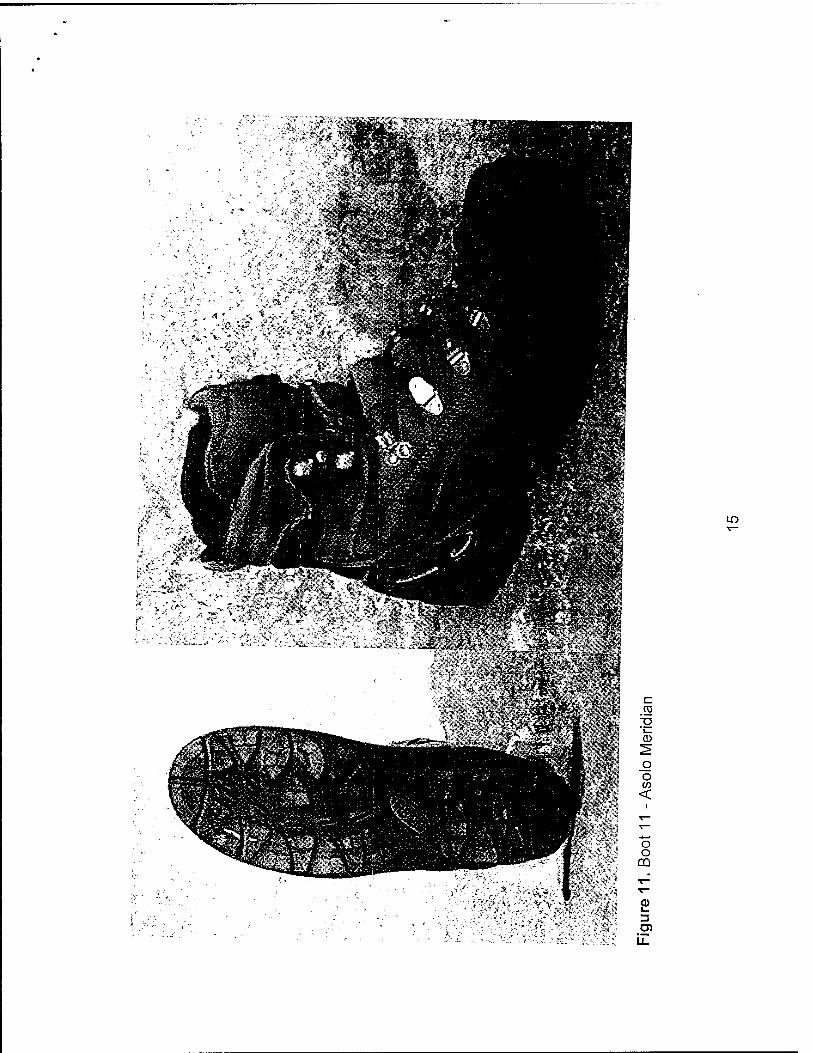
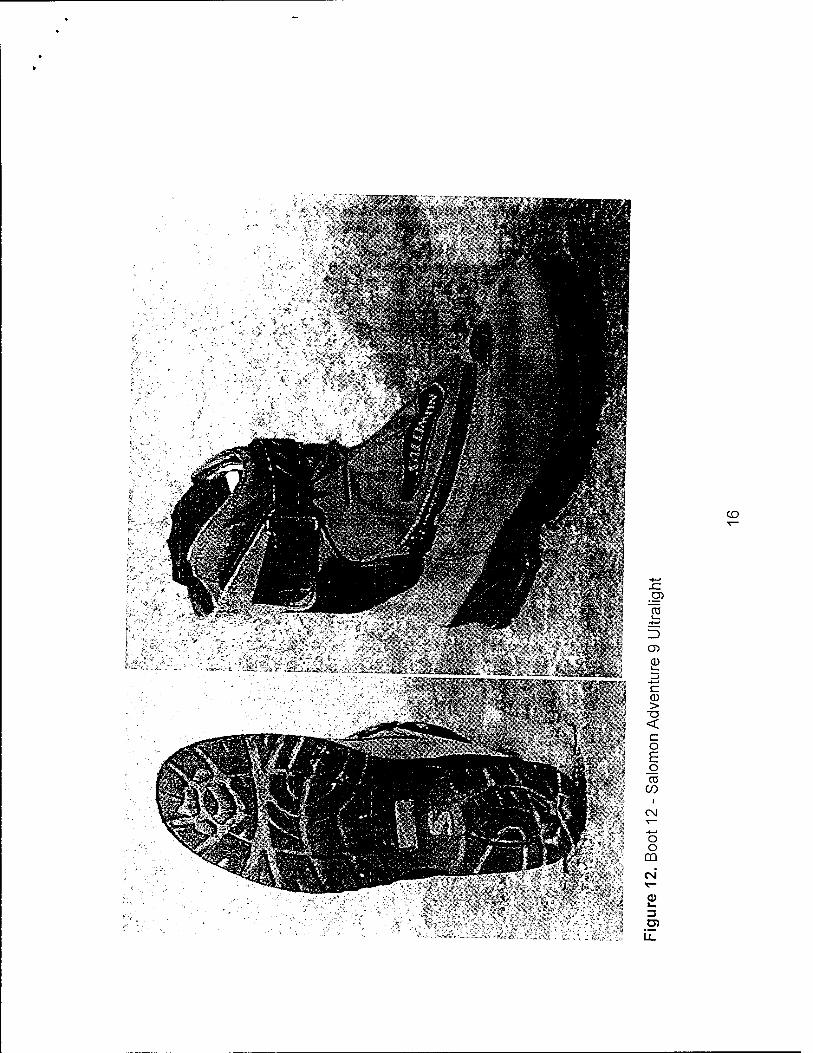
Boot 11 - Asolo Meridian ....15 Boot 12 - Salomon Adventure 9 Ultralight [[-\Q
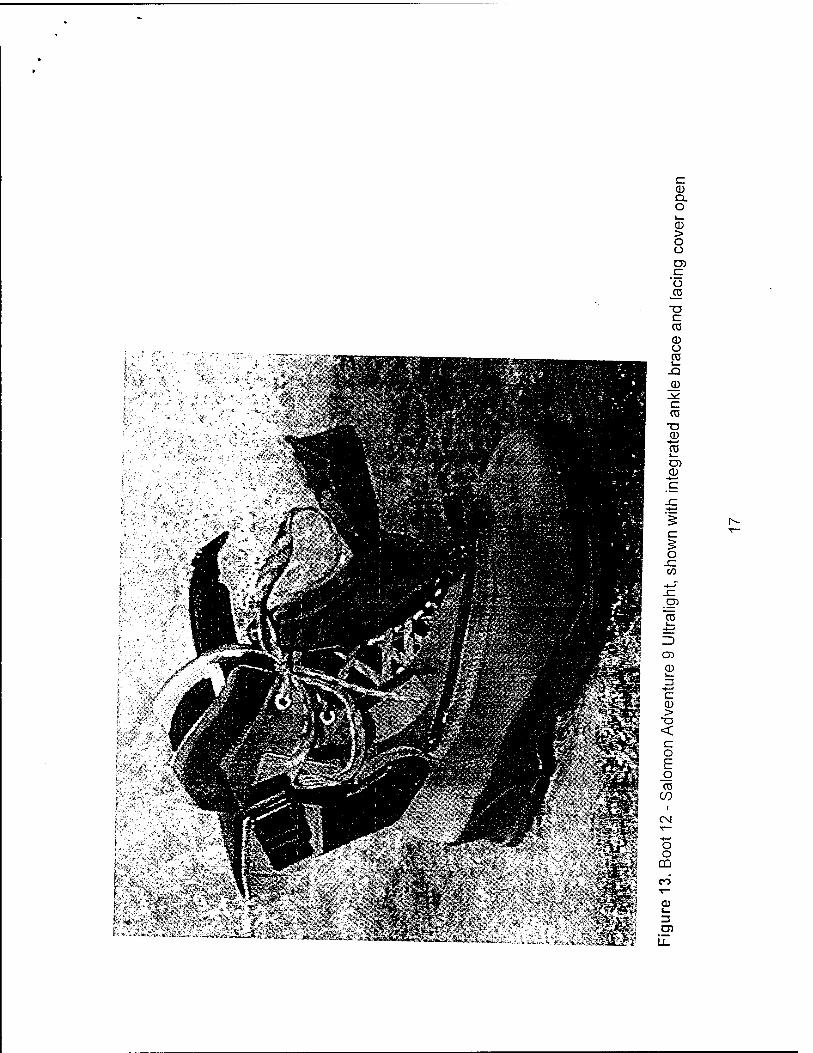
13. Boot 12 - Salomon Adventure 9 Ultralight, shown with integrated ankle brace and lacing cover open -|7
v
TABLES 1. Descriptive information on the boots tested (all size 9 regular) 23 2. Subject characteristics _" 25 3. The tests administered 26 4. Runtimes (s) for 400 m straight grass course !.'.'.'.'.'.'.'.'.'.'.'.'.32 5. Run times (s) for 400 m zigzag grass course 33 6. Rate of oxygen consumption relative to body mass ^34 7. Rate of oxygen consumption relative to body-plus-load mass .....35 8. Maximum pressure (psi) on rear medial foot during a full stride (psi), and its time of
occurrence (% of stride) while walking at 3.5 mph 36 9. Maximum pressure (psi) on the rear lateral foot during a full stride (psi), and its time
of occurrence (% of stride) while walking at 3.5 mph 37 10. Maximum pressure (psi) on the mid medial foot during a full stride (psi), and its time
of occurrence (% of stride) while walking at 3.5 mph 38 11.Maximum pressure (psi) on the mid lateral foot during a full stride (psi), and its time
of occurrence (% of stride) while walking at 3.5 mph 39 12. Maximum pressure (psi) on the medial fore-foot during a full stride (psi), and its time
of occurrence (% of stride) while walking at 3.5 mph 40 13. Maximum pressure (psi) on the lateral fore-foot during a full stride (psi), and its time
of occurrence (% of stride) while walking at 3.5 mph 41 14. Maximum sum-of-pressure (psi) and time to maximum sum-of-pressure (% of stride)
at the heel while walking at 3.5 mph 42 15. Maximum sum-of-pressure (psi) and time to maximum sum-of-pressure (% of stride)
at the toe while walking at 3.5 mph 43 16. Peak velocity (m/s) of foot center of pressure while walking at 3.5 mph 44 17. Maximum vertical and front-back acceleration (m/s2) of the body center-of-mass
while walking at 3.5 mph 45 18.Stride length (m) while walking at 3.5 mph ^."...."'..."^.".".."46 19. Double support duration (% of stride) while walking at 3.5 mph ""48 20.Knee angle (deg) while walking at 3.5 mph [[.....49 21. Ankle angle (deg) while walking at 3.5 mph "^""'""50 22. Maximum force (N) on the ankle, knee and hip while walking at 3.5 mph 51 23. Maximum heel-strike force (N) while walking at 3.5 mph ^."52 24.Maximum push-off force (N) while walking at 3.5 mph ""[[[['.'.''.'.'.53 25.Minimum rear-foot angle (deg) while walking at 3.5 mph [[[[['.[[[[['.54 26. Maximum rear-foot angle (deg) while walking at 3.5 mph ['.[[[[[[[['.['.'.55 27. Average rear-foot angle (deg) while walking at 3.5 mph [[[[[[[[['.56 28. Within trial standard deviation of rear-foot angle while walking at 3.5 mph "57 29. Range of rear-foot motion (deg) while walking at 3.5 mph 58 30. Peak landing power and force values when jumping off a 24 inch high platform 59 31. Average landing power (W) and force (N) after jumping off a 24 inch high platform60 32. Peak landing acceleration (m/s2) and velocity (m/s) after jumping off a 24 inch high
platform 61
33. Variables relating to first force peak while running at 6.5 mph '.""."..62 34. Variables relating to force low point between the heel-strike and push-off peak '"'
forces when running at 6.5 mph 63
VI
35. Variables relating to the second force peak when running at 6 5 mph 64
36. Number of volunteers that cited various aspects of the toe box . .-..„„. w. .u,u.,iee.a u,m uiBu various aspects or tne toe box as amonq the best boot features
66
37 Number of volunteers that cited various aspects of the'sole as among the best' tool5
features uul
38. Number of volunteers that cited various aspects of the uppers as amonq 'the best boot features • • ■ f\7
39.Number of volunteers that cited miscellaneous aspects as amönq'the best boot"" features
• ■ t fiP
40.Total number of positive comments for each boot 70
41 Number of volunteers that cited various aspects of the töe box as among the "worst boot features
42 Number of volunteers that cited various aspects'of'the'sole as among the worst boot features jv
43. Number of volunteers that cited various aspect's'of'the uppers as among 'the worst boot features
44. Number of volunteers that cited various aspect's'Of the heel area asI amonq'the worst boot features
45. Number of volunteers that cited miscellaneous factors' as among the worst boot features
46.Total number of negative comments for each boot 77
47. Number of injuries to different regions of the foot subseque'nt'to "a"6-m'ile hike with 60-lb backpack
48. Number of volunteers reporting foot or ankle pain, soreness"ir discomfort subsequent to the march 7q
49. Number of volunteers reporting the boots either too long or too short 80
50.The number of volunteers reporting too little or too much width in various seq'm'e'nts of the boot a
51.Numberofvolunteers reporting inadequate toe box height. 82 52. Number of volunteers reporting pain or soreness in various parts of the'leq "d'urina
the 6-mile 60-lb backpack hike aQ3
53. Number of volunteers reporting they slipped or fell on either'rocky surface's or branches/roots
54. Number of volunteers reporting inadequate traction on dirty or wet surfaces 85 55. Number of volunteers reporting collection of dirt, mud or stones in the boot tread "s6 56. Number of volunteers reporting they felt rocks and stones through the boot heel or
sole while hiking
57. Number of volunteers reporting the boots veiy'üncömförtabie during the march 88 58. Number of volunteers reporting the boot soles inflexible 8g 59. Number of volunteers reporting the boot uppers inflexible 90
60. Number of volunteers that, based only on comfort and function, would not recommend the boots for use by the Army as field boots 91
61 .The number of volunteers reporting chafing by the boot lining at various parts of'the go
62. Points assigned to each boot in the overall evaluation (lower is be'tter)'""^""'!'"^95
VII
BACKGROUND
Hamill and Bensel (6, 7, 8) conducted biomechanical studies of militarv fontw^r m order to identify means of enhancing iocomotor capabilities and redudng lower extremity mjury rates. Their goal was to develop recommendations for future mltarv footwear with regard to materials, design, construction, fabrication techniques and anv other aspects that would benefit the performance and lower extremity health of m^NtanT personnel. The biomechanical analyses carried out by Hamill and Bensef consiT ina of materials testing and human subject experimentation performed on^lSV^arfd
Z":he°aT and b00tS> 9enerated r—ons for the desigToffu"
In the first phase of the biomechanical analysis of military boots, Hamill and Bensel (6) focused on materials testing. They found that the Army jungle and coX boots ' compared unfavorably to commercial footwear (basketball shoe, cross traTne Wk£q boot
££M f to.,m5f ab,S°rpti0n- 'n thG SeC°nd Phase of lheir «'- Hamill and Bense (7, 8 determined how Army and commercial boots compared when worn bv human
o ott'dThL h9 ? f 6T SpeedS" During the Walks>the ™le and combaTboots" produced the highest peak .rnpact forces. Further, the magnitudes of the propulsive peak were relat.vely large as compared to commercially available footwear. P
As a follow-up to the work of Hamill and Bensel (6, 9), an applied research nmnmm .ni biomechanics was established to generate concepts for improved m^ aTboots The program was approved as a Department of Army Science and Technology ObiecL to be conducted jo.ntly by the U.S. Army Natick Soldier Center and the U S Army Research Institute of Environmental Medicine. The goals of the program were to identify concepts for military footwear that would improve the Iocomotor effic encv of th* wearer and result in a reduction of stress-related injuries of the \Jw£toS compared with the standard-issue black leather combat boots. Requ remote for improved boots were generated that addressed functional characterises such L durab,l,ty under military field conditions, and biomechanical character sties sue as impact properties. These requirements formed the basis of a requesTo proposals for
S«T tl0n °!,Pr°t0tyPe b00tS" A 9r0Up that included\ree LtwPar was RoaTe^ShTnSoaWarded ^ T™* '° Pr°dUCe Pr°t0typeS" The lead ~tor was Ro-Search, Inc., a major producer of military footwear. The other footwear manufacturers were Hyde Athletic Industries, Inc. and Rocky Shoes and Boo^s, Inc.
Five prototype boots were designed and produced by these companies The experiment described in this report was designed to assess the phyTologlcal biomechanical, and maximal performance responses of men wearing Sve
o mlyrS IK °rder t0 dGtermine Which' if an^ of the PrototyPe boots showed promise of meeting the program goals of improving the wearer's Iocomotor efficiency and reducing the hkelihood of lower extremity injuries. To provide a basis ocomparLn two current-issue Army boots, the combat and jungle boots, were includeSTn the experiment, as were five commercial hiking boots 'nc.uaea in the
VIII
r
LIST OF SYMBOLS, ABBREVIATIONS AND ACRONYMS
mPn miles per hour Psi Pounds per square inch
MCACDE^ M5- Army Research lnstitute of Environmental Medicine 110 A ooS Army Soldier' Bi0l09ical' and Chemical Command UbAbSC U.S. Army Soldier Systems Center in Natick, MA
DISCLAIMER
The conclusions, recommendations, and any other opinions expressWinlhi^ report are those of the authors alone and do not reflect the opinion, po". cy o'posit on of the Department of the Army or the United States Government. ■■ — °
DISTRIBUTION STATEMENT
Approved for public release; distribution is unlimited.
IX
EXECUTIVE SUMMARY
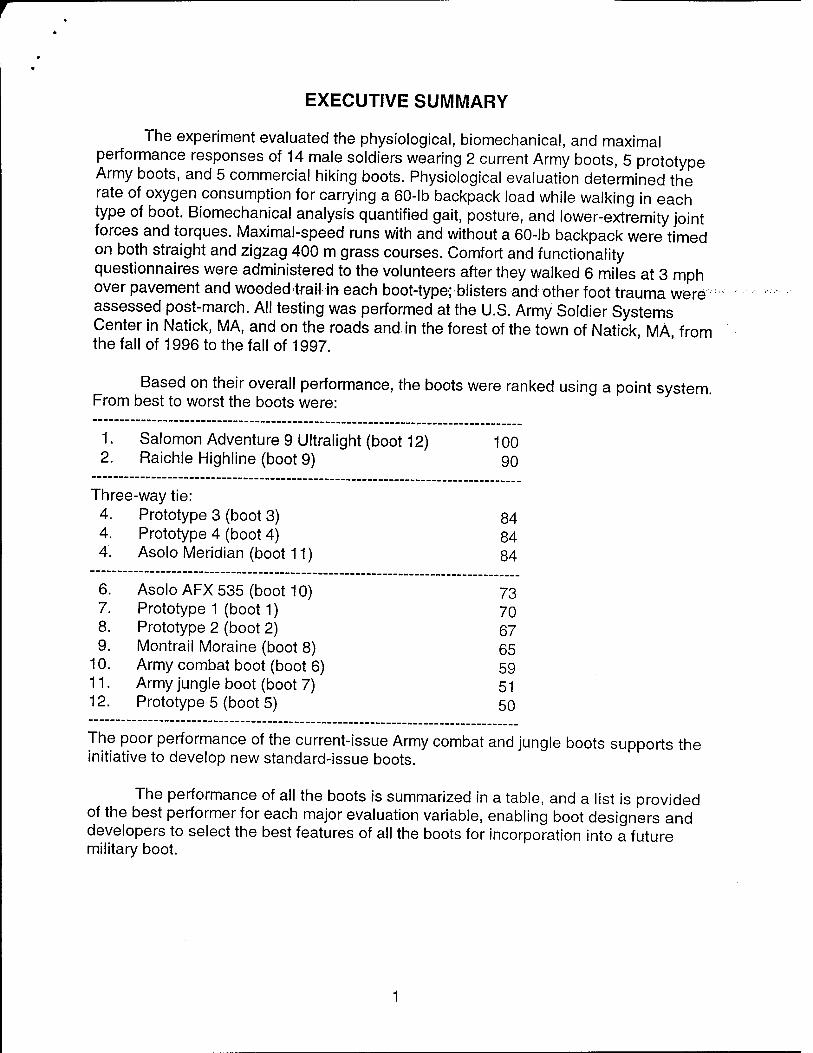
The experiment evaluated the physiological, biomechanical, and maximal performance responses of 14 male soldiers wearing 2 current Army boots, 5 prototype Army boots, and 5 commercial hiking boots. Physiological evaluation determined the rate of oxygen consumption for carrying a 60-lb backpack load while walking in each type of boot. Biomechanical analysis quantified gait, posture, and lower-extremity joint forces and torques. Maximal-speed runs with and without a 60-lb backpack were timed on both straight and zigzag 400 m grass courses. Comfort and functionality questionnaires were administered to the volunteers after they walked 6 miles at 3 mph over pavement and wooded trail in each boot-type; blisters and other foot trauma were assessed post-march. All testing was performed at the U.S. Army Soldier Systems Center in Natick, MA, and on the roads and in the forest of the town of Natick MA from the fall of 1996 to the fall of 1997.
Based on their overall performance, the boots were ranked using a point system. From best to worst the boots were:
1. Salomon Adventure 9 Ultralight (boot 12) 100 2. Raichle Highline (boot 9) 90
Three-way tie: 4. Prototype 3 (boot 3) 84 4. Prototype 4 (boot 4) 84 4. Asolo Meridian (boot 11) 84
6. Asolo AFX 535 (boot 10) 73 7. Prototype 1 (boot 1) 70 8. Prototype 2 (boot 2) 67 9. Montrail Moraine (boot 8) 65
10. Army combat boot (boot 6) 59 11. Army jungle boot (boot 7) 51 12. Prototype 5 (boot 5) 50
The poor performance of the current-issue Army combat and jungle boots supports the initiative to develop new standard-issue boots.
The performance of all the boots is summarized in a table, and a list is provided of the best performer for each major evaluation variable, enabling boot designers and developers to select the best features of all the boots for incorporation into a future military boot.
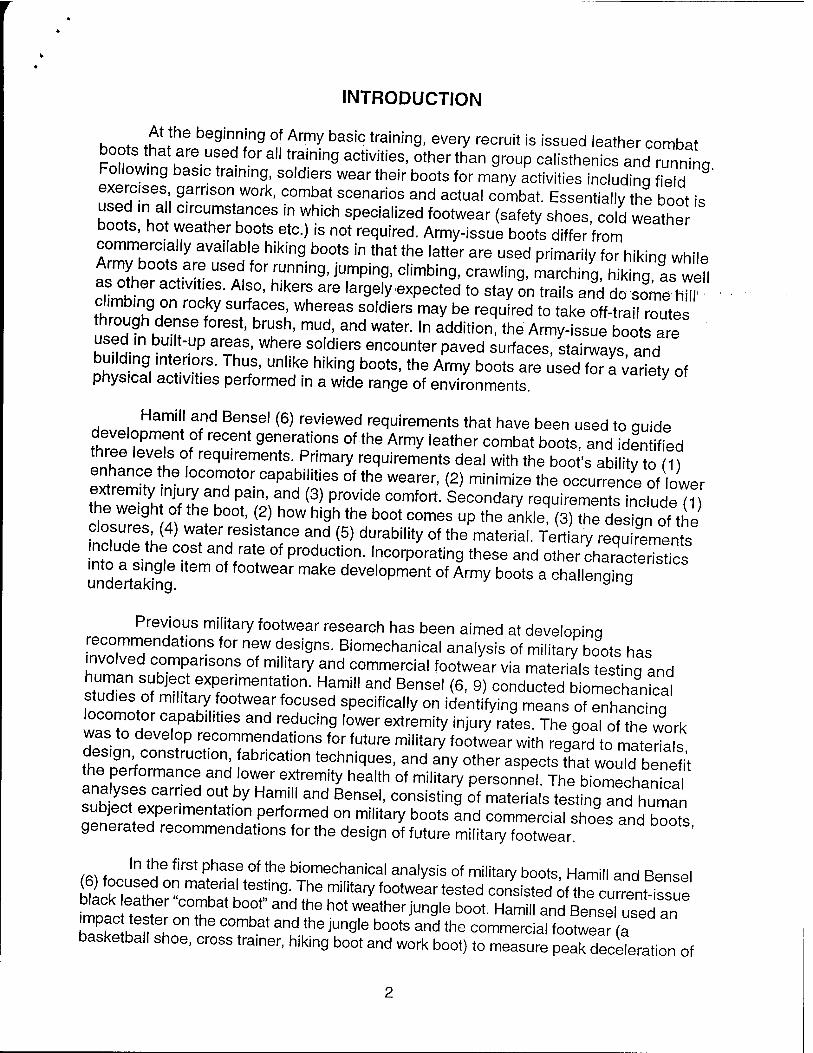
INTRODUCTION
honte thlt beg,"n!n9 ° Army basic train|ng. every recruit is issued leather combat boots that are used for all traming activities, other than group calisthenics and runnhq Following bas.c tra.n.ng, soldiers wear their boots for many activities including field exercises garrison work, combat scenarios and actual combat. Essentially the boot is used mal circumstances in which specialized footwear (safety shoes, cold weather boots, hot weather boots etc.) is not required. Army-issue boots differ from
AZZntf rVail^f hikin9 b°0tS in that the latter are used PrimarilVfor "iking while Army boots are used for running, jumping, climbing, crawling, marching, hiking as weN
SÄ T Alf'hikers are largely expected t0 staV on trails a"d äJ^m cl.mbmg on rocky surfaces, whereas soldiers may be required to take off-trail routes through dense forest, brush, mud, and water. In addition, the Army-issue boots are used in bu.lt-up areas, where soldiers encounter paved surfaces, stairways and building interiors. Thus, unlike hiking boots, the Army boots are used for a variety of physical activities performed in a wide range of environments.
Hamill and Bensel (6) reviewed requirements that have been used to quide development of recent generations of the Army leather combat boots, and identified three levels of requ.rements. Primary requirements deal with the boot's ability to 1) enhance the locomotor capabilities of the wearer, (2) minimize the occurrence of lower extremity injury and pain, and (3) provide comfort. Secondary requirements inckidem the weight of the boot, (2) how high the boot comes up the ankle" (3) A3the closures (4) water resistance and (5) durability of the material. Tertiary req3ments jnclude the cost and rate of production. Incorporating these and other chaSS
undeartaWnge '^ ^^ ^ deVe'°Pment °f ^rmy boots a challenging
Previous military footwear research has been aimed at developinq recommendations for new designs. Biomechanical analysis of military boots has involved comparisons of military and commercial footwear via materials testing and human subject experimentation. Hamill and Bensel (6, 9) conducted biomechanical studies of m.l.tary footwear focused specifica.ly on identifying means of Chancing locomotor capab.Ht.es and reducing lower extremity injury rates. The goal of the work was to develop recommendations for future military footwear with regard m eSs design construction, fabrication techniques, and any other aspects that wouTd benem the performance and lower extremity health of military personnel. The b omechan"ca
Ä68 Ca T by Hami" and Bensel' Consistin9 of materia's testing^human npnlr teHPenmentatl^n Perf°rmed on ^'^ boots and commercial shoes and boots generated recommendations for the design of future military footwear.
In the first phase of the biomechanical analysis of military boots, Hamill and Bensel (6) focused on matenal testing. The military footwear tested consisted of the current issue black eather "combat boot» and the hot weather jungle boot. Hamill and Benselused an ECf;on the combat and the jungle boots and the commercial footwear a basketball shoe, cross trainer, hiking boot and work boot) to measure peak deceleration of
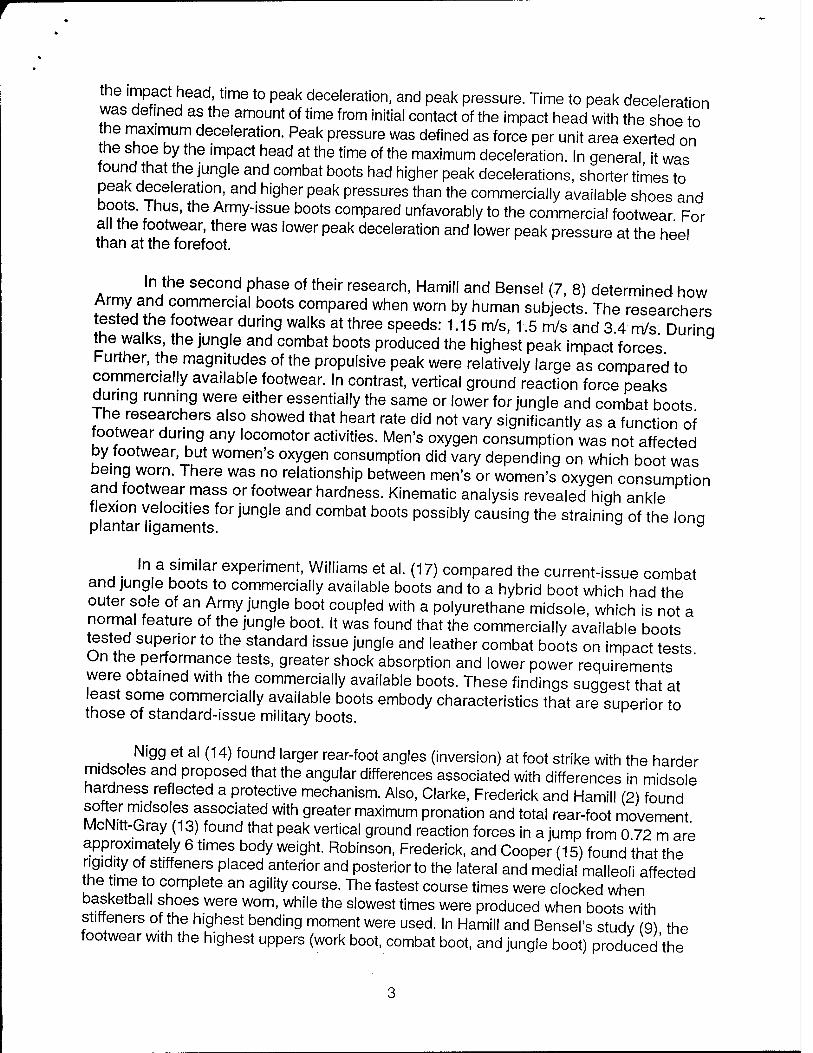
the impact head, time to peak deceleration, and peak pressure. Time to peak deceleration was defined as the amount of time from initial contact of the impact head with the shoe to the maximum deceleration. Peak pressure was defined as force per unit area exerted on the shoe by the impact head at the time of the maximum deceleration. In general it was found that the jungle and combat boots had higher peak decelerations, shorter times to peak deceleration, and higher peak pressures than the commercially available shoes and boots. Thus, the Army-issue boots compared unfavorably to the commercial footwear For all the footwear, there was lower peak deceleration and lower peak pressure at the heel than at the forefoot.
In the second phase of their research, Hamill and Bensel (7, 8) determined how Army and commercial boots compared when worn by human subjects. The researchers tested the footwear during walks at three speeds: 1.15 m/s, 1.5 m/s and 3.4 m/s Durinq the walks, the jungle and combat boots produced the highest peak impact forces Further, the magnitudes of the propulsive peak were relatively large as compared to commercially available footwear. In contrast, vertical ground reaction force peaks during running were either essentially the same or lower for jungle and combat boots The researchers also showed that heart rate did not vary significantly as a function of footwear during any locomotor activities. Men's oxygen consumption was not affected by footwear, but women's oxygen consumption did vary depending on which boot was being worn. There was no relationship between men's or women's oxygen consumption and footwear mass or footwear hardness. Kinematic analysis revealed high ankle flexion velocities for jungle and combat boots possibly causing the straininq of the lona plantar ligaments. y
In a similar experiment, Williams et al. (17) compared the current-issue combat and jungle boots to commercially available boots and to a hybrid boot which had the outer sole of an Army jungle boot coupled with a polyurethane midsole, which is not a normal feature of the jungle boot. It was found that the commercially available boots tested superior to the standard issue jungle and leather combat boots on impact tests On the performance tests, greater shock absorption and lower power requirements were obtained with the commercially available boots. These findings suggest that at least some commercially available boots embody characteristics that are superior to those of standard-issue military boots.
Nigg et al (14) found larger rear-foot angles (inversion) at foot strike with the harder midsoles and proposed that the angular differences associated with differences in midsole hardness reflected a protective mechanism. Also, Clarke, Frederick and Hamill (2) found f? K? ™dsoles associated with greater maximum pronation and total rear-foot movement McNitt-Gray (13) found that peak vertical ground reaction forces in a jump from 0 72 m are approximately 6 times body weight. Robinson, Frederick, and Cooper (15) found that the rigidity of stiffeners placed anterior and posterior to the lateral and medial malleoli affected the time to complete an agility course. The fastest course times were clocked when basketball shoes were worn, while the slowest times were produced when boots with stiffeners of the highest bending moment were used. In Hamill and Bensel's studv (9) the footwear with the highest uppers (work boot, combat boot, and jungle boot) produced the
longest times to complete the agility course. The longer time to complete the agility course may be due to the fact that the boots with the highest uppers were heavier, but this was not specifically reported. Also, these three boots produced more limited and rapid ankle dorsiflexion, suggesting the restriction on ankle motion inhibited rapid changes in direction and pace.
Knapik et al. (11) conducted a study to assess injuries associated with long road marches. Light infantry soldiers carried 46 kg a total of 20 km. Twenty four percent suffered one or more injuries, resulting in 44 days of limited duty. Foot blisters accounted for 35% of the total injuries, making it the most common injury associated with the march. Blisters are generally caused by ill-fitting boots that rub against the skin (16).
Five prototype Army boots were fabricated which incorporated some of the apparently desirable features of commercial hiking boots. The experiment described in this report evaluated the physiological, biomechanical, and maximal performance responses of 14 male soldiers wearing the 5 prototype Army boots, 2 current-issue Army boots, and 5 commercial hiking boots. Physiological evaluation determined the rate of oxygen consumption when volunteers carried a 60-lb backpack load while walking in each type of boot. Biomechanical analysis quantified gait, posture, and lower-extremity joint forces and torques. Maximal-speed runs with and without a 60-lb backpack were timed on both straight and zigzag 400 m grass courses. Comfort and functionality questionnaires were administered to the volunteers after they walked 6 miles at 3 mph over pavement and wooded trail in each boot-type. Blisters and other foot trauma were assessed post-march. All testing was performed at the U.S. Army Soldier Systems Center in Natick, MA, and on the roads and in the forest of the town of Natick, MA, from the fall of 1996 to the fall of 1997.
The 60 lb load selected for this study is supported by the U.S. Army field manual on foot travel (Department of the Army, 1990), which states that up to 72 lb may be carried on "prolonged dynamic operations." The 60 lb backpack weight falls within a range typical of Army field operations.
METHODS
BOOTS
Five different prototype boots were manufactured for this study (Figures 1-5). They were compared to the current-issue Army combat boot and the current-issue Army jungle boot (Figures 6 and 7). In addition, 5 high quality commercial hiking boots (Figures 8-13) were included in the study to determine if any of their features might be worthy of incorporation into future military boots, for a total of 12 different boots studied.
The 12 experimental boots were assigned identification numbers for the experiment. The 5 prototypes were designated as boots 1-5. The current-issue Army combat boot was designated as boot 6. The current-issue Army jungle boot was designated as boot 7. The Montrail Moraine was designated as boot 8. The Raichle Highline was designated as boot 9. The Asolo AFX 535 was designated as boot 10
Li*•2&Sif*-« * it %&& - - -' 'v. ."' - -:»-" >i l&Xfflm
0) Q.
o •4—» o ÜL
O O
o
D5 iZ
LO
CM (D Q. >>
■4—» o o I—
Q_ I
C\J •4—' O O
CQ
cJ Q) i_ 3 U)
U_
CD
h-
<U Q_ >> O
•4—»
o Q.
O o
Cü
i_ 3
CO
a> a. >,
•4—»
O o
Q_
m «4—'
O o QQ
in o i_
CD
CD
o o
CO CO 03
£ 03 C D) CO <D
TO "o St O
o o
CQ *4—»
03 .Q E o p CO 03
O -I—«
T3 0)
O T3
I15 o o o 2E
CD
«•St»
X! h >. E •4—«
C < 03
•4—"
<i) CO -i CO (0 (1) co - — u-
•♦—» <!) r~
s 1
o 1 03
CD 5 n Q) o O
CO ^ to -+-*" <1> 03 1_ JJ 3 F D) o
U_ O
I 1M..& .?'■>. ^' ?
fel*'»"#"#<¥«»*»»-.ASKS..» V SJ s
o X
o o
CO. </) 03
T3 0 4—' 03 C en CO 0)
■a _>> "ro o it O
o o
ca JD CD
JO
CO 03
T3 0)
CD 1—
_>> c o E E o o
o o
-Q >. E
13 ^
-Xl -4—» +L O e X CD . b: -^ ü ^
, CD r r •s a> o
00
CL
8l 3 03 en CD
«**.•*.
TO i O
03
o
CO .+—1
o o
CD
00 o l_
iZ
C\J
EÄi^&^iHs;..
0)
•isrS cz m&if -C
CD «HKV-
X J|| <D x: o
"wrfte, co er co •♦—' &h: o
1 *'•&*•■ o
tlflÄ CD
IIIK O)
-•-c/i (1) •SjSjp^ 1_
3 cn
#4-3"* LL.
co
CO LO
X u_ <
o C/3
<
o o CO
0) 1_ 3
iT
in
~m i_
■♦—*
CD
CO i—
•4—'
(D > < o E
JD cc
CO i
CNJ
o o
DÜ
<N
Q) L. 3
CD
■■
i i
c 0 Q. O
CD > O Ü
CO C O
.CO
TJ C TO 0) O CO
X! _0> -M
CO T3 Q)
TO CD CD C
w
CO
"TO
ID CO CD
13
0) > T3 < o E CO
CO I
CN
H—' O O
CD
CO
CD i_
CO LL.
h-
The Asolo Meridian was designated as boot 11, and the Salomon Adventure 9 Ultralight was designated as boot 12. The boots are referred to by their numbers throughout this report.
It is extremely expensive to start production of any new boot. In a large production run, the initial costs are spread over the entire run, so that the cost per boot is relatively low. Because a prototype run is very limited in number, the per-boot cost is extremely high. Making boots of different sizes multiplies a good part of the cost To avoid prohibitive materiel costs for this study, the prototypes were made in only one size. A men's size 9 in regular width was selected because it is a common shoe size in the United States. . ._. ^
The 5 Prototype Boots (Boots 1-5)
The uppers of the 5 prototype boots were basically the same. Their common features include the following:
Last, All prototypes were made over MIL-5 lasts, the same last system used for fabrication of standard Army combat boots. However, the depth of the last was increased by 5/32 in, to allow for the thickness of a removable insert placed in the boots.
Ufiper. All prototypes have an identical upper, which is similar in design to the upper on the standard black leather combat boot. However, the foam in the padded collar on the prototypes is thicker than that on the standard boot and the collar cover on the prototypes is a soft glove leather. The finished height on a size 9R prototype is 10 in, about 1/2 in shorter than the height of the standard leather boot in the same size A softer temper leather is used for the upper of the prototypes, which is more flexible than the leather used in the standard boot. The interior of the vamp of the prototypes is lined with an absorbent material, Aero-Spacer Dri-Lex®. The standard leather combat boot does not have an interior lining. The prototypes have a two-piece backstay and counter pocket. On the standard boot, there is a combined backstay and counter pocket made out of one piece of leather.
Removable Insert. There is a molded, contoured, polyurethane insert with a Cambrelle® cover in all prototypes except #4. The insert is a polyurethane polyether molded directly to a Cambrelle® top cloth. This is the same insert used in the standard leather boot.
18
The soles of the 5 prototype boots were all different. The following are descriptions of the soles of each of the 5 prototype boots:
The Sole of Prototype 1 This prototype is flat-lasted with a direct-molded sole construction. The sole design is a modified version of the present Army standard hot weather boot sole. The sole incorporates a polyurethane polyether insert as a "mid- heel. The properties of the insert are:
Thickness: 5/16 in Density: .35 g/cm3
Hardness: 30 Shore A ± 3
The insole is made of a 3/16 in layer of 25 Shore A polyurethane foam, cemented to a four-iron cellulose fiber insole that incorporates a scrim cloth on the bottom.
I+ u The Sole of Prototype ?. This prototype is flat-lasted with a cemented-on sole It has a unit sole constructed by cementing a pre-molded polyurethane midsole to a rubber, pre-molded cup outsole. The midsole has the following characteristics:
Thickness: 1 in at back of heel, tapering off to a point halfway toward the front of the sole, where the thickness is 7/16 in
Density: .41 g/cm3
Hardness: 65-68 Shore C
The insole is a four-iron leather insole.
The Sole of Prototype 3. This prototype is flat-lasted with a direct-injected polyurethane mid-sole and a pre-molded high wall rubber cup tread outsole The midsole is polyurethane with the following characteristics:
Thickness: From 1/4 inch at center of foot to 3/8 inch at edqe of foot Density: .60 g/cm3
Hardness: 50 Shore A ± 5
The insole is a four-iron leather insole.
The Sole of Prototype 4. This prototype is constructed using the Process 82 Comfort Welt® construction. The key feature of this construction is the use of a previously attached welt to accomplish the lasting of the upper without the need for a structural insole. The "welt lasting" is performed on the mold last itself and once the upper has been formed over the mold last, the sole is molded and vulcanized directly to the welt and to the lasting edge of the upper. In the process of construction, a cavity is
19
port,on w,.h a sock lining cover. The insert has the follewing c£nSS? "
SeetienTunCdeTheeMn00 ineC,i0n °' ^ °'48 '" ^ C8nter SeCti°n ,0 e^ °** "> Density: .40 g/cm3
Hardness: 26 Shore A
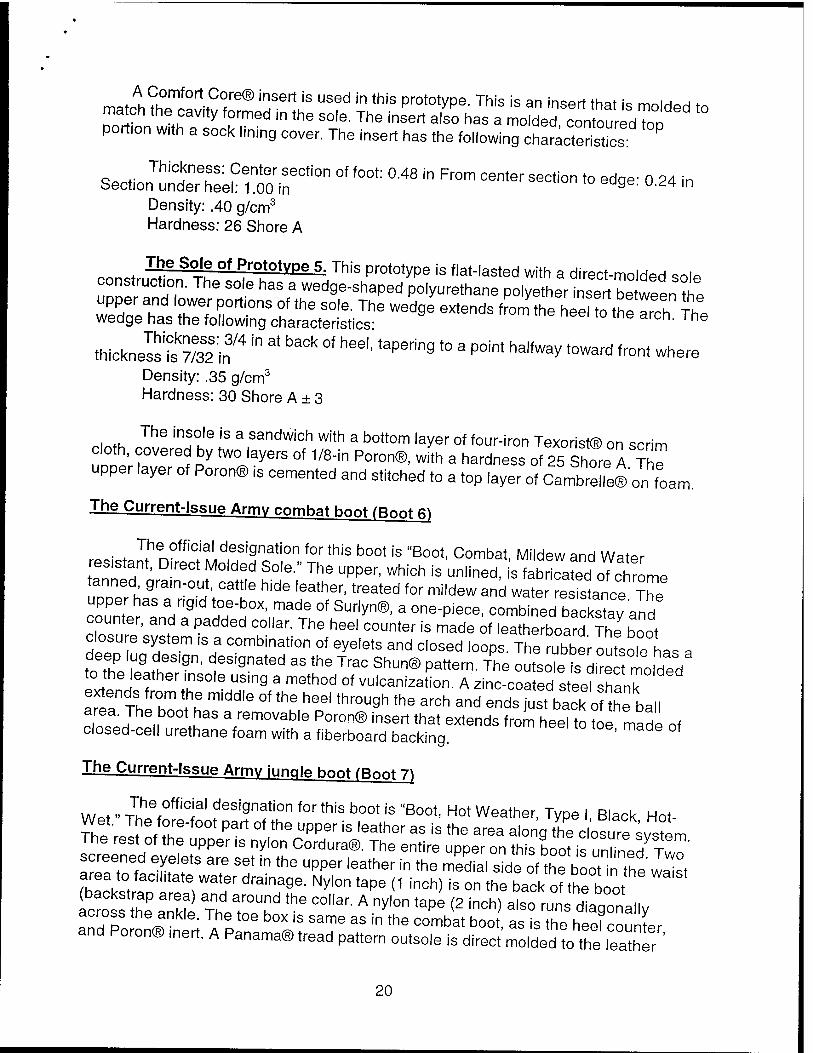
The Sole of Prototype 5 This prototype is flat-lasted with a direct-molded Q«IP
construction. The sole has a wedge-shaped polyurethane polyether insert between ?hP
upper and lower portions of the sole. The wedge extends fL the heel to the arch The wedge has the following characteristics- rch" The
thicknelsis^slm374 '" * ^ °f ^taPering * 3 P°int ha,fwaV toward front where Density: .35 g/cm3
Hardness: 30 Shore A ± 3
Hnth ThG in!°Je iS a ,sandwich with a b°ttom layer of four-iron Texorist® on scrim cloth, covered by two layers of 1/8-in Poron®, with a hardness of 25 Shore AT™ upper layer of Poron® is cemented and stitched to a top layer of CambreNe® on foam.
The Current-Issue Army combat hoot (Boot 6)
The official designation for this boot is "Boot, Combat, Mildew and Water resistant, D.rect Molded Sole.» The upper, which is un.ined, s fabled oTchrome tanned grain-out, cattle hide leather, treated for mildew and water resfstanee ThT upper has a ng.d toe-box, made of Surlyn®, a one-piece, combined baSand counter, and a padded collar. The hee. counter is made of leatherboa^ The boot closure system ,s a combination of eyelets and closed loops. The rubber ou'sole has a
to the ^theS,9n' fS,9nated 3S the TraC Shun@ Pattern- The outsole is direct molded to the leather insole using a method of vulcanization. A zinc-coated steel shank extends from the middle of the heel through the arch and end™ *bacohe ball area The boot has a removable Poron® insert that extends from heel to toe made of closed-cell urethane foam with a fiberboard backing. '
The Current-Issue Army jungle boot (Boot 7)
Wpt „ Jhhe
foffic;al designation for this boot is "Boot, Hot Weather, Type I Black Hot-
Wet. The fore-foot part of the upper is leather as is the area along theClosure system The rest of the upper is nylon Cordura®. The entire upper on this boot is unNne^Two' screened eyelets are set in the upper leather in the medial side of the boott the waist area to fac,l,tate water drainage. Nylon tape (1 inch) is on the back of the boot
icrossSttheP aTkfi TheTT ^ ""^ A "*m ^ (2 inCh> also ™s Cnally across the ankle. The toe box is same as in the combat boot, as is the heel counter and Poron® inert. A Panama® tread pattern outsole is direct molded to the leather
20
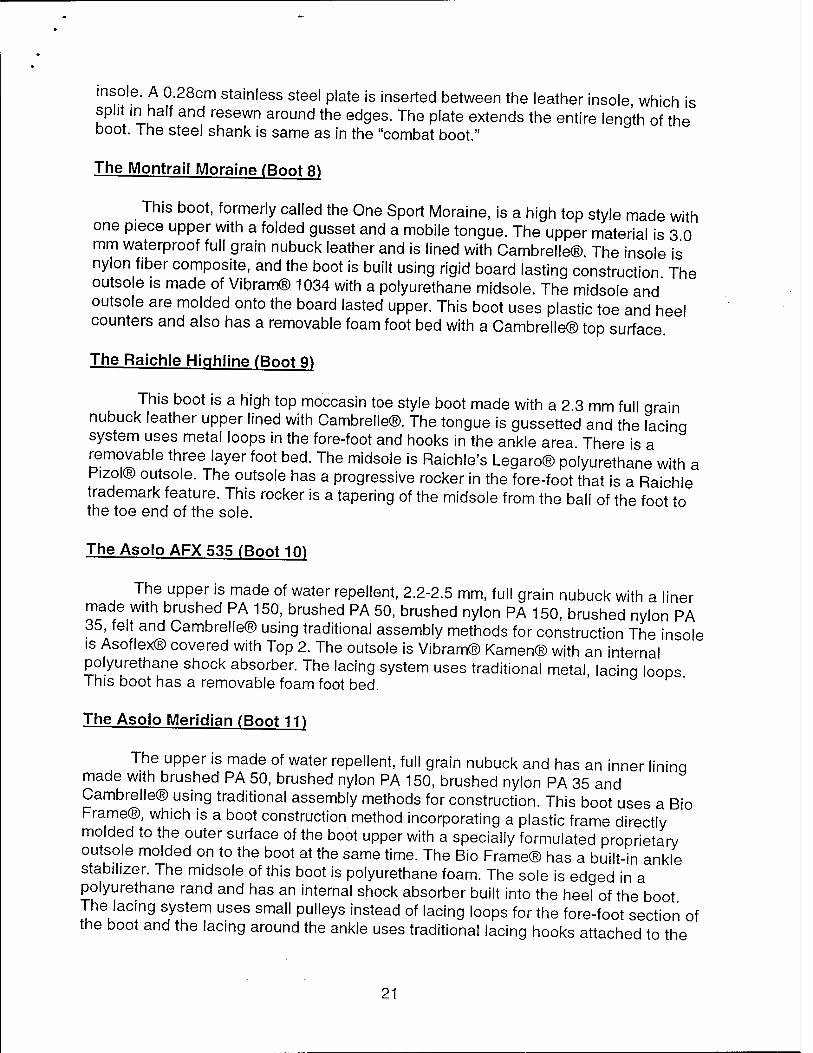
insole. A 0.28cm stainless steel plate is inserted between the leather insole which is split in half and resewn around the edges. The plate extends the entire length of the boot. The steel shank is same as in the "combat boot."
The Montrail Moraine (Boot 8)
This boot, formerly called the One Sport Moraine, is a high top style made with one piece upper with a folded gusset and a mobile tongue. The upper material is 3 0 mm waterproof full grain nubuck leather and is lined with Cambrelle®. The insole is nylon fiber composite, and the boot is built using rigid board lasting construction The outsole is made of Vibram® 1034 with a polyurethane midsole. The midsole and outsole are molded onto the board lasted upper. This boot uses plastic toe and heel counters and also has a removable foam foot bed with a Cambrelle® top surface.
The Raichle Hiahline (Boot 9)
This boot is a high top moccasin toe style boot made with a 2.3 mm full grain nubuck leather upper lined with Cambrelle®. The tongue is gussetted and the lacinq system uses metal loops in the fore-foot and hooks in the ankle area. There is a removable three layer foot bed. The midsole is Raichle's Legaro® polyurethane with a Pizol® outsole. The outsole has a progressive rocker in the fore-foot that is a Raichle trademark feature. This rocker is a tapering of the midsole from the ball of the foot to the toe end of the sole.
The Asolo AFX 535 (Boot 10)
The upper is made of water repellent, 2.2-2.5 mm, full grain nubuck with a liner made with brushed PA 150, brushed PA 50, brushed nylon PA 150, brushed nylon PA 35, felt and Cambrelle® using traditional assembly methods for construction The insole is Asoflex® covered with Top 2. The outsole is Vibram® Kamen® with an internal polyurethane shock absorber. The lacing system uses traditional metal, lacing loops This boot has a removable foam foot bed.
The Asolo Meridian (Boot 11)
The upper is made of water repellent, full grain nubuck and has an inner lininq made with brushed PA 50, brushed nylon PA 150, brushed nylon PA 35 and Cambrelle® using traditional assembly methods for construction. This boot uses a Bio Frame®, which is a boot construction method incorporating a plastic frame directly molded to the outer surface of the boot upper with a specially formulated proprietary outsole molded on to the boot at the same time. The Bio Frame® has a built-in ankle stabilizer. The midsole of this boot is polyurethane foam. The sole is edged in a polyurethane rand and has an internal shock absorber built into the heel of the boot The lacing system uses small pulleys instead of lacing loops for the fore-foot section of the boot and the lacing around the ankle uses traditional lacing hooks attached to the
21
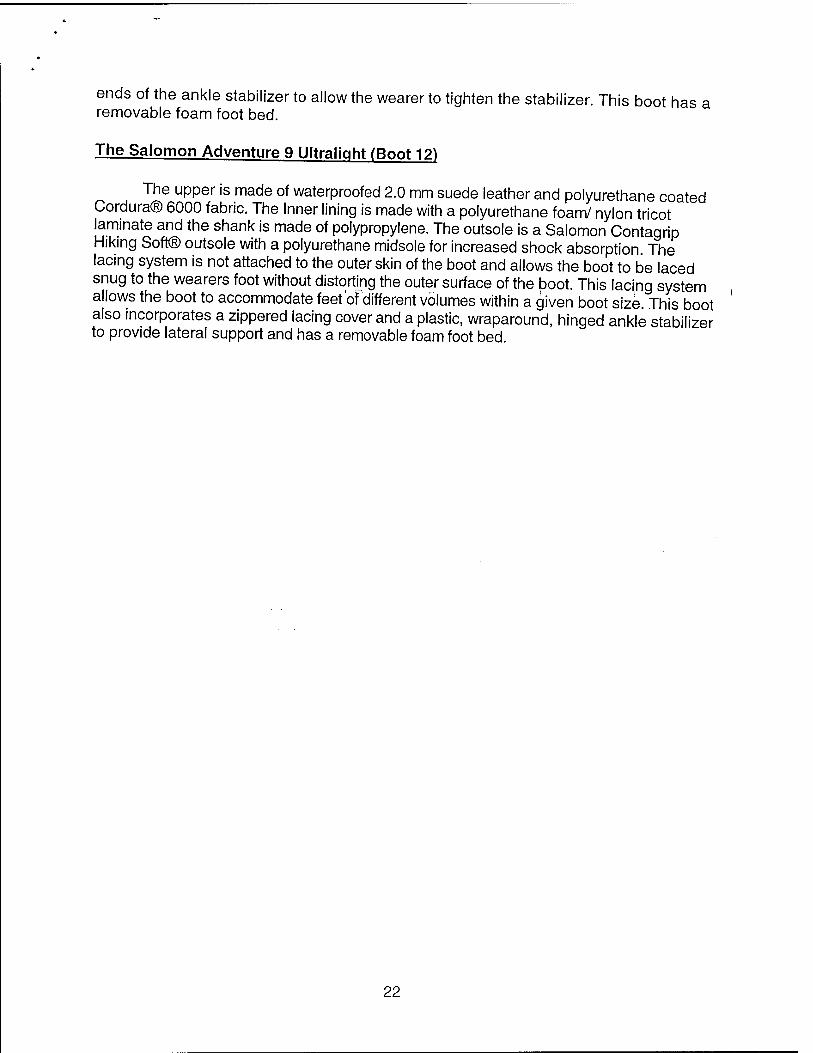
ends of the ankle stabilizer to allow the wearer to tighten the stabilizer. This boot has a removable foam foot bed.
The Salomon Adventure 9 Ultralight (Boot 12)
The upper is made of waterproofed 2.0 mm suede leather and polyurethane coated Cordura® 6000 fabric. The Inner lining is made with a polyurethane foam/ nylon tricot laminate and the shank is made of polypropylene. The outsole is a Salomon Contagrip Hiking Soft® outsole with a polyurethane midsole for increased shock absorption The lacing system is not attached to the outer skin of the boot and allows the boot to be laced snug to the wearers foot without distorting the outer surface of the boot. This lacing system allows the boot to accommodate feet of different volumes within a given boot size This boot also incorporates a zippered lacing cover and a plastic, wraparound, hinged ankle stabilizer to provide lateral support and has a removable foam foot bed.
22
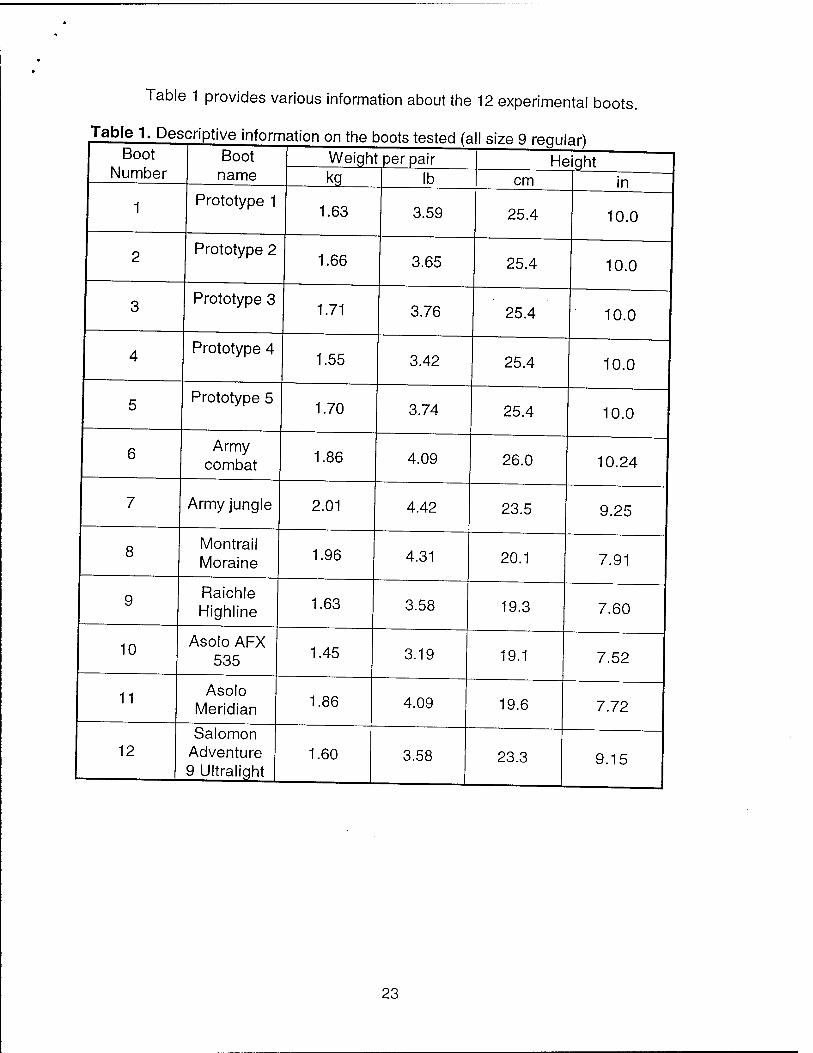
Table 1 provides various information about the 12 experimental boots.
Table 1. Descriptive information on the boots tested (a I size 9 requl ar) Boot
Number Boot name
Weight per pair Height kg lb cm in
1 Prototype 1 1.63 3.59 25.4 10.0
2 Prototype 2 1.66 3.65 25.4 10.0
3 Prototype 3 1.71 3.76 25.4 10.0
4 Prototype 4 1.55 3.42 25.4 10.0
5 Prototype 5 1.70 3.74 25.4 10.0
6 Army combat 1.86 4.09 26.0 10.24
7 Army jungle 2.01 4.42 23.5 9.25
8 Montrail Moraine 1.96 4.31 20.1 7.91
9 Raichie Highline 1.63 3.58 19.3 7.60
10 Asolo AFX 535 1.45 3.19 19.1 7.52
11 Asolo Meridian 1.86 4.09 19.6 7.72
12 Salomon
Adventure 9 Ultralight
1.60 3.58 23.3 9.15
23
RESEARCH VOLUNTEERS
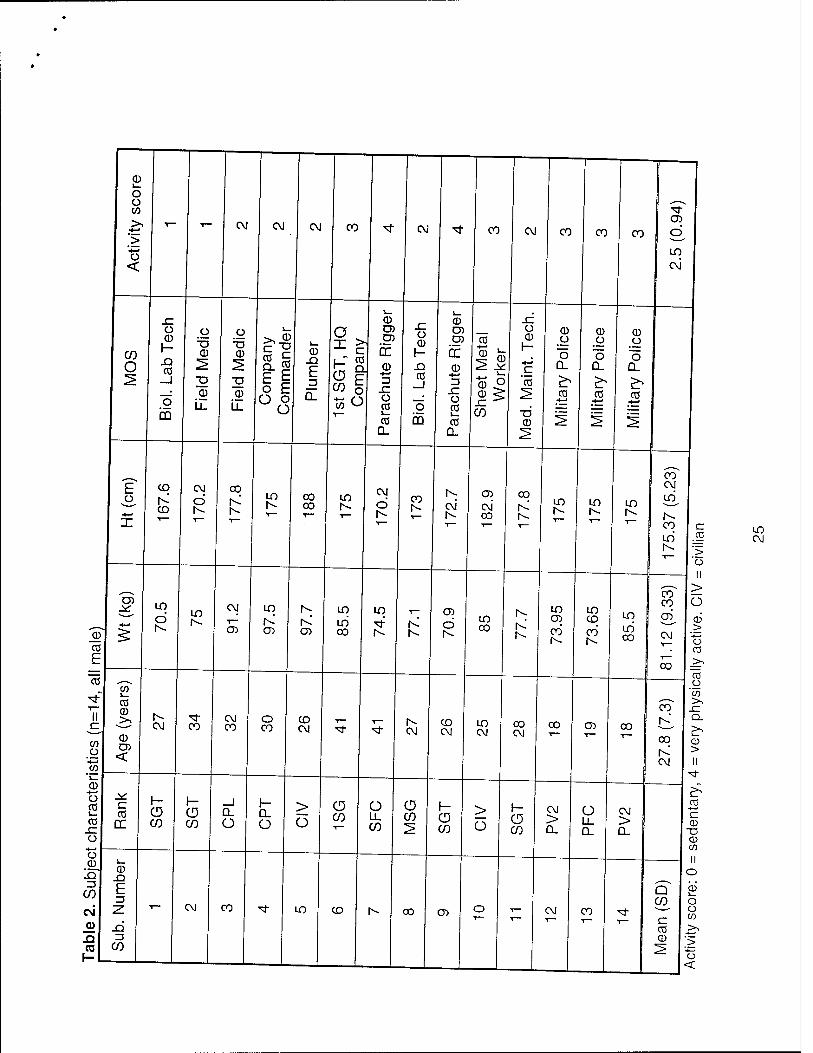
phys.caly demanding jobs were represented as well. Table 2 shows some Lsb mformat,on about the vo.unteers including their habitual physical Z™™eve™
,ooQ lhe Printcipal investigator or an assisting investigator briefed all Potential '
research volunteers. Informed consent was obtained from those who chose to volunteer. Because several of the tests, such as the 6-mile backpack hie were admims ered to each volunteer only once per week, the testing of a'l12tool took each volunteer at least 12 weeks of actual testing. There were 3-5 test sesstns oer week. Typ.cally, each test session took 1-3 hours which includedI test nTw^a for other volunteers to be tested, and resting between trials 9' 9 "
24
o I i_
o o ^ ^, to "* >« T- 1— CM CM CM CO "5J- CM •<fr CO CM CO CO
1 ^ co | d >
•4—»
o I in- < CM
1— i_
JC CD CD xi
CO O
Ü CD
!- X2 CO
_J
"5 CD
o
CD
Ü
CD
2 §i
0
1 Q_
cr CD
x: ü
CD
!- X!
CD
ir 0
"co
| w
o CD
h- *-= c
0 o
"Ö Q_
0 o o
D_
0 o
"5
2 ■D
CD
■o
CD
L. CO § JO
13 JZ O CO 1—
CO
CO _J
"5 CQ
3 x: o CO
CO CO
'cö
0
CO •*—»
1 CO
■4—' CO
a. D_ 2
^^^ CO
E ■4—»
I
CD
Is-- CD
CM
CD Is-
CO
Is-' Is-
LO 00 00
LD Is-
CM
d Is-
CO Is-
Is-
CM Is-
CD
CM CO
00
Is-' Is-
LO LO Is-
LO Is-
CM
if! Is- co LO Is-
C .eg
>
LO CM
II
> .«—■N co
0
CO
ID
O Is-
ID Is-
CM
T—
CD
Is-
CD
LO
LO 00
LO
Is- l< Is-
CD
d Is-
LO CO
Is-
Is-' Is-
LD CD
CO r-
LO CD
CO Is-
LD
LO CO
CO
CM
Ü
CD >
03
b CO
_>« "03 Ü 03 „ N
-* CO 1—
CO j „ _ 'CO
T— CD I ^ ^r 1!
co o
CD CD
<
CM CO CM CO
o CO
CD CM 5 5 Is-
CM CD CM
LO CM
00 CM
00 CD CO ti "^ 1 °°
Q. >^ i_ CD >
■4—» I CVJ II to
«3-
0 o CO
CO x:
c 03
DC
h- CD CO
!— CD CO
_l
Ü
1— a. ü
> Ü
CD CO
Ü Li. CO
CD CO CD
CO
> O
h- CD CO
CM
> Q.
Ü Li. Q_
CM I 05
C CD
o ■♦—< —
CD W
II ü
CD i_
!Q CD o
O
3 CD E
3 Q CO
CD
O
CM
n
z: xi =3
CM co ^ ID CD Is- CO CD o CM CO ■«* a CO . CD
Ü to
> en CO ^ - I-I 1 —L 1 1 1 • a:
THE TEST BATTERY
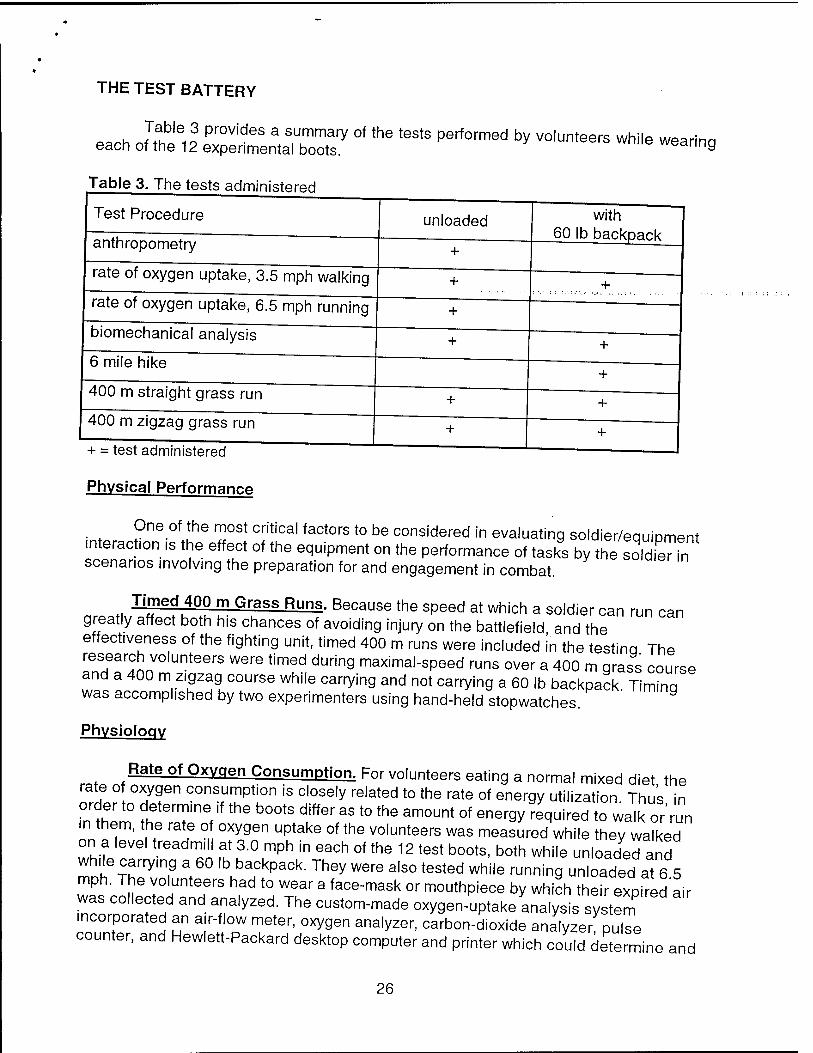
each o,Ttaheei2 eTe~bZ7 * ** *"* "^'^ b" ^""^ White weari"9
Table 3. The tests administered
Test Procedure
anthropometry
unloaded
rate of oxygen uptake, 3.5 mph walking
rate of oxygen uptake, 6.5 mph running
biomechanical analysis
6 mile hike
+
with 60 lb backpack
+
+
+
400 m straight grass run
400 m zigzag grass run
+
+
+
+
+
+ + = test administered
Physical Performance
One of the most critical factors to be considered in evaluating soldier/equipment interaction is the effect of the equipment on the performance of tasks by the sTdierTn scenarios involving the preparation for and engagement in combat.
Timed 400 m Grass Runs. Because the speed at which a soldier can run can greatly affect both his chances of avoiding injury on the battlefield, and the effectiveness of the fighting unit, timed 400 m runs were included in the testina The research volunteers were timed during maximal-speed runs over a 400 m grass course and a 400 m zigzag course while carrying and not carrying a 60 lb backpack Timina was accomplished by two experimenters using hand-held stopwatches.
Physiology
+ Rate of Oxygen Consumption. For volunteers eating a normal mixed diet the
rate o oxygen consumption is closely related to the rate of energy utilization Thus in order to determine if the boots differ as to the amount of energy required to walk or'run m them, the rate of oxygen uptake of the volunteers was measured while they walked on a level treadmill at 3.0 mph in each of the 12 test boots, both while unloaded and while carrying a 60 lb backpack. They were also tested while running unloaded ale 5 mph. The volunteers had to wear a face-mask or mouthpiece by which their expired air was collected and analyzed. The custom-made oxygen uptake analysis system incorporated an a.r-flow meter, oxygen analyzer, carbon-dioxide analyzer pulse counter, and Hewlett-Packard desktop computer and printer which could determine and
26
print out every 30 seconds the rate of oxygen consumption and ventilation per minute expressed both in absolute terms and relative to the individual's body mass The walking or running duration per test speed was about five minutes to allow the volunteer to reach a steady-state oxygen uptake.
Biomechanics
Foot Contact Pressure. The pressure on different segments of the feet associated with each boot was measured by placing Tekscan in-shoe pressure sensor insoles (Tekscan, Boston, MA) into each boot between the boot insole and the plantar surface of the wearer's socked foot. The sensors weramade of thin, flexible, Mylar, on the opposite ■■ ■ sides of which lines of electro-conductive ink were printed at right angles to each other Because the lines were spaced 1 cm apart, there was an intersection of two crossing ink lines at the center of each square centimeter on each insole. The pattern of electro- conductive ink on the sensor pads was such that the sensors could be cut to fit a variety of shoe sizes without disconnecting any of the individual sensors. Foot pressure on the pad squeezed the ink lines on the opposite sides of the Mylar closer together, reducing the electrical resistance between them. Sixty times per second the computer monitored the electrical resistance at each square centimeter on the pad. Software converted the electrical resistances to actual pressures based on initial calibration of the system.
The computerized Tekscan analysis system was used to determine the skin contact pressures on different segments of the foot as the volunteers walked with each of the different boots at 3.5 mph. The video and force plate data collection was synchronized wi'h the Tekscan data collection through the use of a common triggering switch Foot contact pressures were expressed as both the array average (the mean of all individual sensor values including those which recorded zero pressure for each pad over the entire stride) and as the array maximum (the maximum individual sensor value recorded for each pad over the entire stride). A custom-written computer program determined the time of heel- strike and toe-off from the Tekscan in-shoe sensor data. The data from each stance was extracted from the rest of the trial, and stance time was taken as the difference in time between heel strike and toe off.
For the purpose of analysis, the Tekscan® data was partitioned into 6 separate foot sections: (1) rear medial foot, (2) rear lateral foot, (3) mid medial foot, (4) mid lateral foot (5) medial fore-foot, and (6) lateral fore-foot. The border between the medial and lateral foot segments was taken as the midline of the foot. The rear-foot was defined as the rear 33% of foot length. The mid-foot was defined as the next 22% of foot length. Fore-foot was defined as the remaining 45% of the foot including the toes. For each percentage of stance the maximum pressure, average pressure and standard deviation of the pressure within each section of the foot was calculated. In addition, the peak pressure for each section over the entire stride and the percent of stance at which the peak pressure occurred was calculated.
27
Kinematics and Kinetics. Both without a load and while carrying a 60 lb backpack, the volunteers walked at 3.5 mph across a force platform, within the field of view of six Qualisys (Glastonbury, CT) cameras while walking in each of the 12 different boots. They were also monitored while running without a load at 6.5 mph in each of the boots. Biomechanical analysis of the camera data was performed using both Qualisys and custom software.
During the biomechanical testing, volunteers wore the standard Army physical training uniform, consisting of gray T-shirt and shorts with combat boots. Spherical reflective markers approximately one inch in diameter were affixed to the skin (or boot) using double sided tape. Markers were placed on the right side of the body at the base of the 5th metatarsal, lateral malleolus of the ankle, lateral femoral condyle of the knee, greater trochanter of the hip, acromion process of the shoulder, zygomatic arch of the head, lateral epicondyle of the elbow, and the radial styloid process of the wrist. In order to detect rear-foot motion, two markers were placed on the dorsal surface of the calf in line with the Achilles tendon, and two other markers were placed on the rear of the shoe, vertically bisecting the heel area from a rear view.
Volunteers walked along a level, 15-foot walkway at 3.5 mph paced by a custom- built system that cued the volunteer to the appropriate walking speed with a striped cord moving at 3.5 miles/hr located next to the walkway. Neither a rifle nor other weapon was carried. An electronic timing device (Brower Timing Systems, Salt Lake City, UT) insured that volunteers walked across the force plate at 3.5 miles/hr+5%. Trials during which the walking speed was not between 2.85 miles/hr and 3.15 miles/hr were discarded, and the trial was repeated. The same system was used to ensure precision of +5% in running speed during the 6.5 mph run trials. A video motion analysis system (Qualisys, Glastonbury, CT) using six cameras recorded the body movements of the volunteers in three dimensions as they crossed a force plate (AMTI, Newton, MA) embedded flush with the floor. The sampling frequency of the cameras was 60 Hz. The force plate recorded the ground reaction forces as the volunteers stepped on the plate. The sampling frequency of the force plate was 1,000 Hz. Three trials were conducted for each experimental condition. The unloaded and loaded walking, and unloaded running conditions for each boot were all tested in a single session, with the volunteers resting between trials as needed and having a 15-min rest break after each block of trials.
Under the assumption of bilateral symmetry, segmental movement data for the left side of the body was generated by phase shifting the right side data by 180°. A 12- segment model of the human body was constructed (two feet, two shanks, two thighs, two forearms, two upper-arms, a trunk and a head), and the mass inertial properties of the segments were taken from estimates given by Dempster (4). A custom-written software program performed a standard link segment analysis frame-by-frame for a single stride. The single stride selected for analysis was centered on the point when the right foot struck the force plate. The stride was defined as that portion of the gait cycle from the point in time at which the right foot crossed in front of the left leg to the point in time at which the right foot next crossed in front of the left leg. The custom program
28
calculated the location of the body center of mass as described by Winter (18) and
a" riI' e o* °srS:f ** ^ "^ °' Vid6° *** The P-g-m'also dete'rm ned stride length, stride frequency, and body segment displacements, velocities and
SSÄ Ä0'ion forces at ,he ankle'knee'and hip **"* ™° "* The trunk angle was defined as the acute angle between the trunk segment and
the vert.cal axis. For a subject facing towards the right, the trunk angle is positive
ZZ . ?f T6 fTthe Vertical and negative measured counter-clockwise from be1w^CttTh h
,P anQle ^ d6fined aS the ang,e °n the ventral sjde of the body .pithf ■♦! .'9, Se?ment 3nd the Plane defined bVthe se9ment connecting right and - It Tth K t5eImnk Segment The knee an9'e was defined as the angle on the dorsal dlt pd * V be"he thi9h and Shank se9ments> and the ank.e9angle was defined as the angle on the ventral side of the body between the shank and foot segments. UIUUI
Rear-foot angle was defined as the rear-view deviation in degrees between the line formed by the 2 markers in line with the subject's Achilles tendon and the 2 markers vertically bisecting the shoe heel area, with a negative angle indicating supination, and a positive angle pronation. '»u.oaung
Because the duration of a single stride varied across subjects, it was necessarv to normalize the d.ffering time scales to allow for the direct comparison ^tL timing ^ events within the gait cycle across subjects. This was accomplished by expressTnqlhe time course of all the biomechanical variables as a percentage of the stride cycle.9
Jump landing tests were conducted with the volunteer wearing the same set of markers as used during the walking and running biomechanical tests A 24^ high wooden box was placed adjacent to the force platform. The unencumbered volunteer stood atop the box m an upright position. Upon signal from an experimenter le volunteer stepped straight out over the force platform and dropped to its surface Volunteers were specifically instructed to neither jump upwards nor downwards when leaving the box but rather to step straight out and drop, allowing the Jees tflex during the shock absorption phase of landing, and achieving an upright positton on the platform without bouncing up and down. position on the
Comfort and Iniurv Risk Assessment
tho „mThf COmf° n aend inJUry production of each of ^e boots was assessed by having
he volunteers walk 6 miles in each pair of boots while carrying a 60-lb backpack Injuries were defined as blisters, hot spots, and any other L'trauma r^ from the 6-m.e backpack hike. The volunteers walked in a group and were paced at 3 mph The
Thl ih \Wa*\°n,PaVed r°ad' after Which the vo,unteers rested for 10 minutes' They then entered a forest and walked 3 miles on a moderately hilly wooded"ran After another 10-m,nute rest, they walked 1.5 miles back to the starttag point. Follow" g each
29
!Snthe ™[TTrS'f6et Were examined for blisters and chafing of the skin The volunteers filled out a questionnaire concerning boot comfort (Appendix A).
EXPERIMENTAL DESIGN AND ANALYSIS
A balanced-order experimental design was used to ensure that none of the boots was more likely than any of the others to be tested earlier or later in the subjects' mulft-week testing period, thereby avoiding order effects due to learning physical
2C01VANO9ÄH ' b?T^ GtC- ThG StatiStiCa' analySiS f0r each variable^ ved a 2-way ANOVA that looked at the main effects of boot (12 levels) and load (2 levels) as we as boot- oad interaction. When an ANOVA identified a boo! main effe£, a DScan post-hoc test was performed to identify significant differences between boots.
ENVIRONMENTAL IMPACT
USARIEMStuqA^rain? iorJhlS,StUdV W6re conducted indoors and outdoors at USARIEM, USASSC and on Natick public streets, roads, and recreational land after securing perm.ss.on from town authorities. The study involved little or no airborne em.ss.on, waterbome effluent, external radiation, outdoor noise, or solid bulk waste
(AR?nnon1V COm^in? witn existin9 federal> state, and local laws and regulations (AR 200-2 Categorical Exclusion A-11). y
The field tests and road marches were conducted with 14 military and civilian volunteers from USARIEM and USASBCC. All lived at the existing barracks a? USASSC or ,n their hab.tual residences in and around the town of Natick, MA Neither the ivina arrangements nor the experimental activities had a significant impact on the environment (AR 200-2 Categorical Exclusion A-19).
30
RESULTS
In all the tables in this section, statistically significant differences between the boots are indicated by superscripted letters. Variable means for boots not superscripted with the same letter are significantly different. This notation does not apply to differences across conditions, as in walking in the loaded vs. unloaded condition.
PHYSICAL PERFORMANCE
Timed 400 m Grass Runs
Table 4 shows that, on the straight grass 400 m course, there was no significant difference among the boots as to run time without a load. While means differed by as much as 5%, the standard deviations were too large for the differences to be significant. However, there were significant differences in run time when the 60 lb backpack was carried. Boot 3 produced the fastest mean time, while boots 5, 7, 8, 11, and 12 produced the slowest times.
31
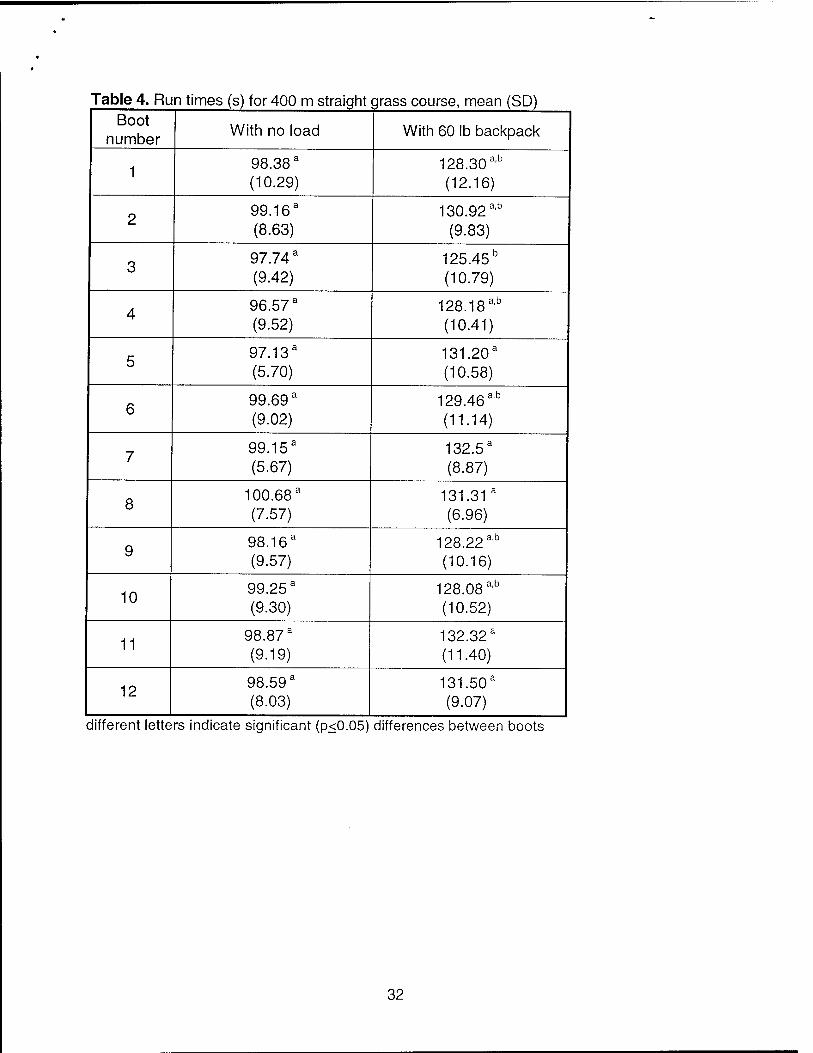
Table 4. Run times (s) for 400 m straight grass course, mean (SD) Boot
number With no load With 60 lb backpack
1 98.38a
(10.29) 128.30 a'b
(12.16)
2 99.16a
(8.63) 130.92ab
(9.83)
3 97.74 a
(9.42) 125.45b
(10.79)
4 96.57a
(9.52) 128.18ab
(10.41)
5 97.13a
(5.70) 131.20a
(10.58)
6 99.69a
(9.02) 129.46ab
(11.14)
7 99.15a
(5.67) 132.5a
(8.87)
8 100.68a
(7.57) 131.31a
(6.96)
9 98.16a
(9.57) 128.22ab
(10.16)
10 99.25 a
(9.30) 128.08 ab
(10.52)
11 98.87 a
(9.19) 132.32a
(11.40)
12 98.59a
(8.03) 131.50a
(9.07)
different letters indicate significant (p<0.05) differences between boots
32
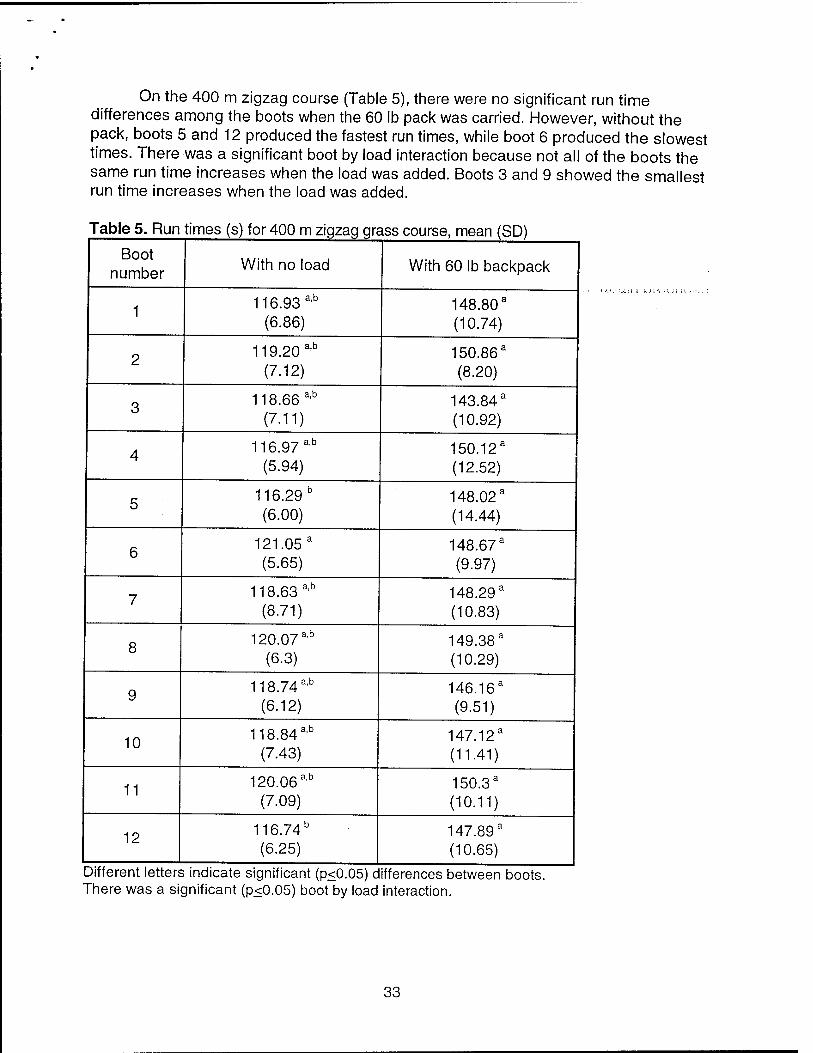
On the 400 m zigzag course (Table 5), there were no significant run time differences among the boots when the 60 lb pack was carried. However, without the pack, boots 5 and 12 produced the fastest run times, while boot 6 produced the slowest times. There was a significant boot by load interaction because not all of the boots the same run time increases when the load was added. Boots 3 and 9 showed the smallest run time increases when the load was added.
Table 5. Run times (s) for 400 m zigzag grass course, mean (SD)
Boot number
With no load With 60 lb backpack
1 116.93a,b
(6.86) 148.80 a
(10.74)
2 119.20 a'b
(7.12) 150.86a
(8.20)
3 118.66 a,b
(7.11) 143.84a
(10.92)
4 116.97ab
(5.94) 150.12a
(12.52)
5 116.29 b
(6.00) 148.02a
(14.44)
6 121.05 a
(5.65) 148.67a
(9.97)
7 118.63 ab
(8.71) 148.29a
(10.83)
8 120.07 a'b
(6.3) 149.38a
(10.29)
9 118.74a'b
(6.12) 146.16a
(9.51)
10 118.84a'b
(7.43) 147.12a
(11.41)
11 120.06 a'b
(7.09) 150.3a
(10.11)
12 116.74b
(6.25) 147.89 s
(10.65)
Different letters ; indicate significant (p<0.05) d ifferences between boots. There was a significant (p<0.05) boot by load interaction.
33
PHYSIOLOGY
Rate of Oxygen Consumption
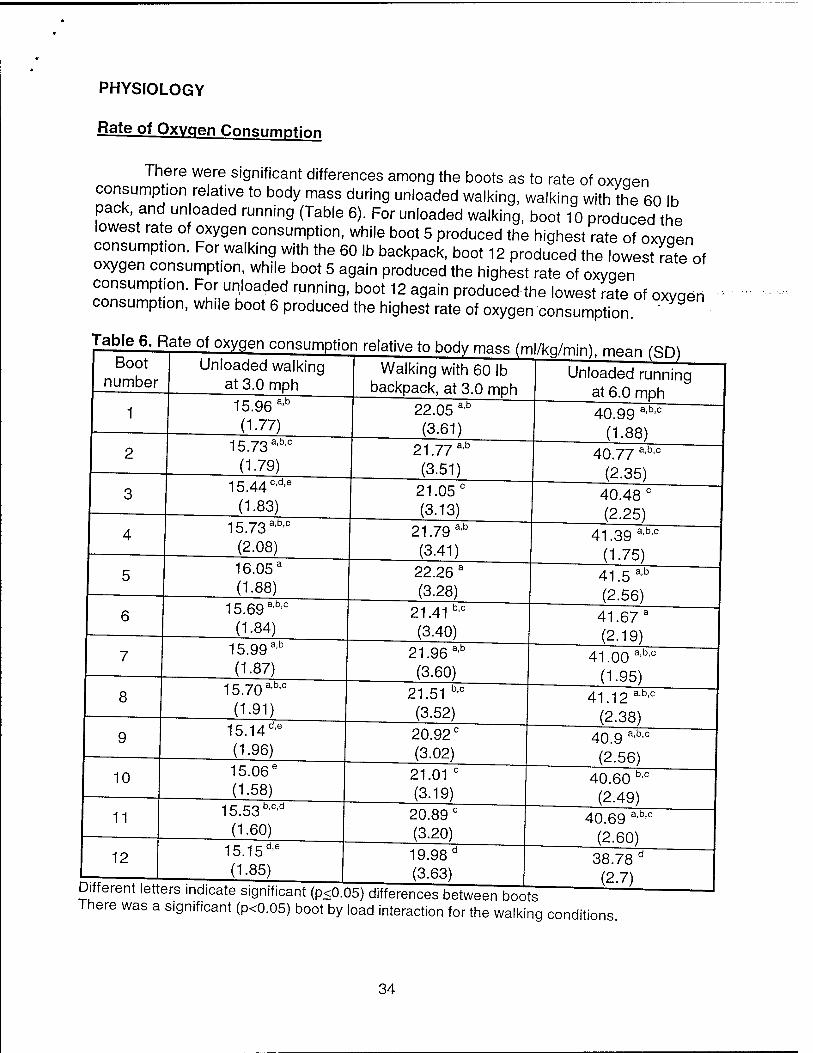
There were significant differences among the boots as to rate of oxyqen consumption relative to body mass during unloaded walking, walking with the 60 lb pack and unloaded running (Table 6). For unloaded walking, boot 10 produced the lowest rate of oxygen consumption, while boot 5 produced the highest rate of oxvaen consumption. For walking with the 60 lb backpack, boot 12 produced the lowest rate of oxygen consumption, while boot 5 again produced the highest rate of oxyqen consumptjon. For unloaded running, boot 12 again produced the lowest rate of oxyqen consumption, while boot 6 produced the highest rate of oxygen consumption '
Table 6. Rate of oxyqen consumption relative to body mass (m Boot
number
1
8
10
11
12
Unloaded walking at 3.0 mph
15.96 a'b
(1.77)
Walking with 60 lb backpack, at 3.0 mph
/kg/min), mean (SD)
15.73 (1.79)
a.b.c
15.44 (1.83)
c,d,e
22.05 ab
(3.61) 21.77 ab
(3.51)
15.73a'b'c
(2.08)
16.053
(1.88)
15.69ab'c
(1.84)
21.05° (3-13)
21.79 (3.41
a,b
22.26 a
(3.28)
15.99 (1.87)
a,b
15.70 (1.91)
a,b,c
21.41 (3.40)
b,c
21.96 a'b
(3.60)
15.14d'e
(1.96)
15.06e
(1.58)
15.53 (1.60)
b,c,d
15.15 (1.85)
d,e
21.51 (3.52)
b,c
20.92c
(3.02)
21.01 c
(3-19) 20.89 c
(3.20) 19.98 (3.63)
Unloaded running at 6.0 mph
40.99 a'b'c
(1.88)
40.77 ab'c
(2.35)
40.48 c
(2.25)
41.39 a'b'c
(1.75)
41.5 a'b
(2.56)
41.67 a
(2.19)
41.00a-b,c
(1.95)
41.12 a'b'c
(2.38)
40.9 a,b'° (2.56)
40.60 (2.49)
b.c
Different letters indicate significant (p<0.05) differences between boots There was a significant (p<0.05) boot by load interaction for the walking conditions.
40.69 a'b'c
(2.60)
38.78 d
(2.7)
34

Table 7 shows the rate of oxygen consumption relative to body-plus-load mass during unloaded walking, backpack load carriage, and unloaded running. The similarity in the means between the unloaded and loaded walking conditions show that the increase in oxygen consumption during load carriage is in direct proportion to the increase in load above body weight. In the previous table, rate of oxygen consumption was divided by body mass of the volunteer with shorts and T-shirt but no shoes In this table, rate of oxygen consumption is divided by mass of the body-plus-load includinq clothing and footwear. That is why the values for unloaded walking and running in this table are slightly less than in the previous table. For unloaded walking, boot 10 produced the lowest rate of oxygen consumption relative to body-plus-load mass while boot 5 produced the highest rate of oxygen consumption. For walking with a 60 lb backpack, boot 12 produced the lowest rate of oxygen consumption relative to body- plus-load mass, while boot 5 produced the highest rate of oxygen consumption For unloaded running, boot 12 produced the lowest rate of oxygen consumption relative to body-plus-load mass, while boot 6 produced the highest rate of oxygen consumption.
Table 7. Rate of oxygen consumption relative to body-plus-load mass (ml/kq/min) mean (SD) ''
Boot number
1
Unloaded walking at 3.0 mph
15.63 a
(1-73) 15.41 (1-73)
a,b
6
7
15.14 (1-77)
b,c
Walking with 60 lb backpack at 3.0 mph
15.74 a'b
(2.43)
15.55 (2.35)
äF
15.44
(2-01)
a,b
15.71 a
(1-83)
15.36 (1.75)
,a,b
8
10
11
12
15.69 a
(1-82)
15.36 (1-84)
a,b
15.04c
(2-07)
Unloaded running at 6.0 mph
40.14 (1-80)
a.b
39.94 D
(2.28)
15.57 (2.24)
a,b
15.89a
(2.18)
15.28 (2.24)
b,c
15.70 (2.46)
~ss~
39.70 (2.20)
40.64 ab
(1-63) 40.63
(2-46)
a,b
40.89 a
(2-12)
14.84 c
(1.90) 14.79° (1-53)
15.15 (1.55)
b,c
14.86c
(1.79)
15.34 (2.40)
b,c
14.98 c
(2.04) 15.03c
(2-16)
14.87c'd
(2.05) 14.41 (2-37)
40.21 (1-86)
a,b
40.24 (2.26)
a,b
40.09a,b
(2.49) 39.86 b
(2.39) 39.77 b
(2.48)
Different letters indicate significant (p<0.05) differences between boots
38.37 c
(1-94)
35
BIOMECHANICS
In-Shoe Pressure Sensing Purina Walking With and Without a Loarl
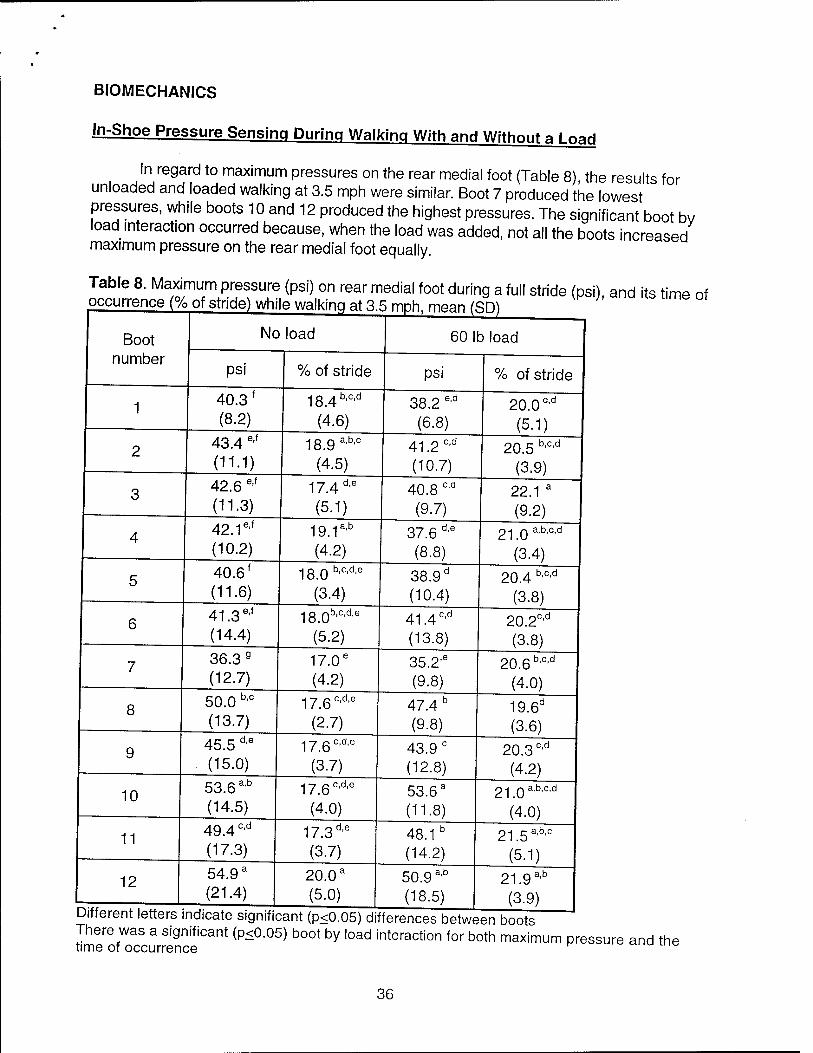
in regard to maximum pressures on the rear medial foot (Table 8) the results for unloaded and loaded walking at 3.5 mph were similar. Boot 7 produced the lowest pressures, while boots 10 and 12 produced the highest pressures. The significant boot bv load interaction occurred because, when the load was added, not all the boots increased maximum pressure on the rear medial foot equally.
Table 8. Maximum pressure (psi) on rear medial foot during a full stride (psi) and its time of
Boot number
No load
~ ...r.., ...w^.. v^,
60 lb load
psi % of stride psi % of stride
1 40.3 f
(8.2)
184b,c,d
(4.6) 38.2 e,d
(6.8) 20.0 c'd
(5.1)
2 43.4 e'f
(11.1)
18ga,b,c
(4-5) 41.2 c'd
(10.7) 20.5 b'c'd
(3.9)
3 42.6 e,f
(11.3) 17.4 d'e
(5.1) 40.8 c'd
(9.7) 22.1 a
(9.2)
4 42.1e'f
(10.2) 19.1a'b
(4.2) 37.6 d'e
(8.8)
OH r\ a,b,c,d
(3-4)
5 40.6f
(11.6) 18.0b,c,d,e
(3-4) 38.9 d
(10.4) 20.4 b,c'd
(3.8)
6 41.3e,f
(14.4)
18_0b,c,d,e
(5.2) 41.4c'd
(13.8) 20.2c,d
(3-8)
7 36.3 9
(12.7) 17.0e
(4.2) 35.2'e
(9.8) 20.6b,c,d
(4.0)
8 50.0 b'c
(13.7) 17.6c,d,e
(2.7) 47.4 b
(9.8) 19.6d
(3.6)
9 45.5 d'e
(15.0)
176c,d,e
(3.7) 43.9 c
(12.8) 20.3 c'd
(4.2)
10 53.6 a'b
(14.5)
176c,d,e
(4-0) 53.6a
(11.8)
OH r\ a,b,c,d
(4.0)
11 49.4 c'd
(17.3) 17.3d'e
(3.7) 48.1 b
(14.2)
21 5a,b,c
(5.1)
12 54.9 a
(21.4) 20.0 a
(5.0) 50.9 a'b
(18.5) 21.9a,b
(3.9)
There was a significant (p<0.05) boot by load interaction for both maximum pressure and the time of occurrence p IB
36
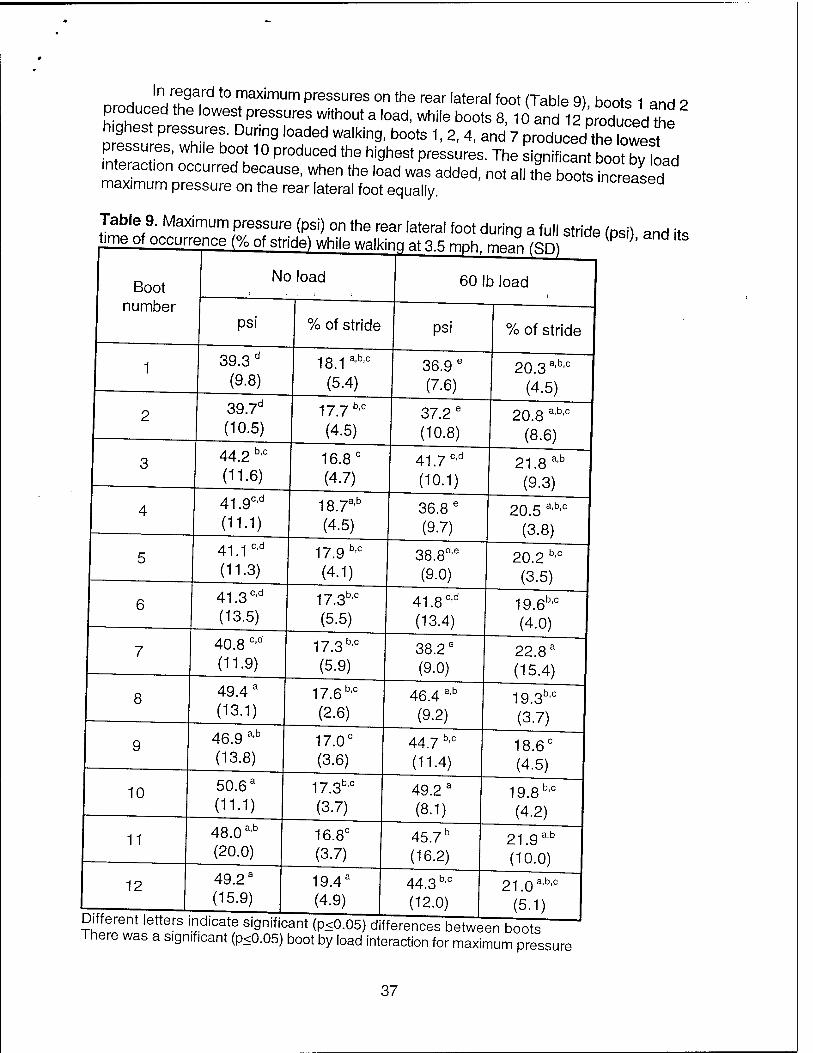
In regard to maximum pressures on the rear lateral foot (Table 9) boots 1 anH o produced the lowest pressures without a load, while boots 8, 10 and112 produced'he h.ghest pressures. During loaded walking, boots 1, 2, 4, and 7 produced thllowest pressures, wh.le boot 10 produced the highest pressures. The significant boo^bv load interaction occurred because, when the load was added, not all the boots increased maximum pressure on the rear lateral foot equally. increased
Table 9. Maximum pressure (psi) on the rear lateral foot during a full stride (psi) and its time of occurrence (°L nf <?triHo\ >A,h;iQ ,,,iu * o,- ,. ... a , " Uö ^Sl'' ana lts
Boot number
No load
IIH "i >J.O iiifjii, mean (oU)
60 lb load
psi % of stride psi % of stride
1 39.3 d
(9.8) 18.1abc
(5.4) 36.9 e
(7.6)
203a,b,c
(4.5)
2 39.7d
(10.5) 17.7 b'c
(4.5) 37.2 e
(10.8) 20.8 a'b'c
(8.6)
3 44.2 b'c
(11.6) 16.8 c
(4.7) 41.7 c'd
(10.1) 21.8 a'b
(9.3)
4 41.9c'd
(11.1) 18.7ab
(4.5) 36.8 e
(9.7) 20.5 a'b,c
(3.8)
5 41.1 c'd
(11.3) 17.9 blC
(4-1) 38.8d,e
(9.0) 20.2 b'c
(3.5)
6 41.3c'd
(13.5) 17.3b'c
(5.5) 41.8c,d
(13.4) 19.6b'c
(4.0)
7 40.8 c'd
01.9) 17.3bc
(5.9) 38.2 e
(9.0) 22.8 a
(15.4)
8 49.4 a
(13.1) 17.6b'c
(2.6) 46.4 a'b
(9.2) 19.3b'c
(3.7)
9 46.9 a'b
(13.8) 17.0C
(3.6) 44.7 b'c
(11-4) 18.6C
(4.5)
10 50.6 a
(11.1) 17.3b'c
(3.7) 49.2 a
(8.1) 19.8b'c
(4.2)
11 48.0 a'b
(20.0) 16.8C
(3.7) 45.7b
(16.2) 21.9 ab
(10.0)
12 Diffpmnt lottarc- i
49.2 a
(15.9) 19.4a
(4.9)
443 b.c
(12.0) 21.0a'b,c
(5.1)
-r-„ . .'. " "'a ^°"i VK^^.UO; umerences oetween boots There was a significant (p<0.05) boot by load interaction for maximum pressure
37
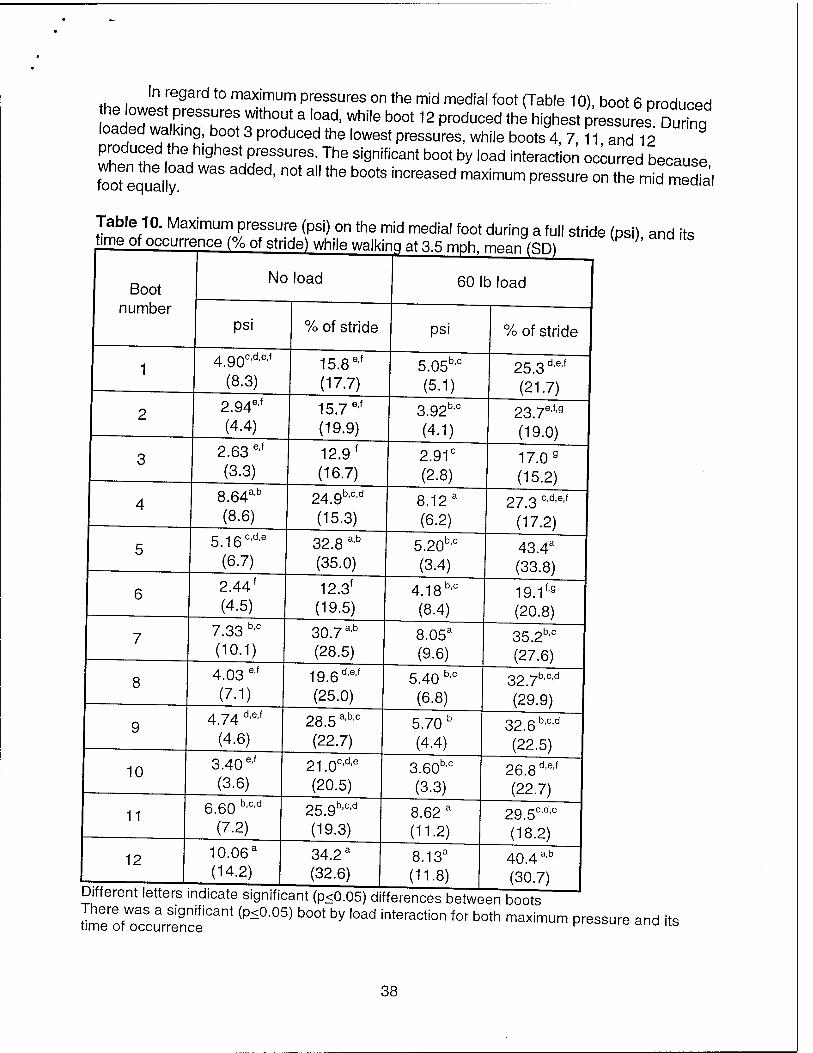
tho . 'n [e9ard t0 maximum Pressures on the mid medial foot (Table 10), boot 6 produced he lowest pressures without a load, while boot 12 produced the highest pmssures Dunng
loaded walking, boot 3 produced the lowest pressures, while boots 4 7 11 and 12 produced the highest pressures. The significant boot by load interaction occurred because
foot equally ™* ""*' "" a" *" ^ inCrBMed maXimUm preSSUre on the "*! medTa,
Table 10. Maximum pressure (psi) on the mid medial foot during a full stride (psi) and its Tim<=> nf nrri irronno to/ nt ^irlrJ^s ,..u:i_ n.: -* „ - . ^ \r"V< "'|,J '<-o
Boot number
No load 60 lb load
psi % of stride psi % of stride
1 4goc,d,e,f
(8.3) 15.8e'f
(17.7) 5.05b'c
(5.1) 25.3d'e'f
(21.7)
2 2.94e'f
(4.4) 15.7 e'f
(19.9) 3.92bc
(4.1) 23je,f,g
(19.0)
3 2.63 e,f
(3.3) 12.9 f
(16.7) 2.91° (2.8)
17.0 9
(15.2)
4 8.64a'b
(8.6) 24.9b'c'd
(15.3) 8.12 a
(6.2) 27.3 c,d'e'f
(17.2)
5 5.16cd'e
(6.7) 32.8 a'b
(35.0) 5.20b'c
(3.4) 43.4a
(33.8)
6 2.44* (4.5)
12.3f
(19.5) 4.18bc
(8.4) 19.1f'9
(20.8)
7 7.33 b'c
(10.1) 30.7 a'b
(28.5) 8.05a
(9.6) 35.2b'c
(27.6)
8 4.03 e'f
(7.1) 19.6d'e'f
(25.0) 5.40 b'c
(6.8)
327b,c,d
(29.9)
9 4.74 d'e'f
(4.6) 28.5a'b,c
(22.7) 5.70 b
(4.4)
326b,c,d
(22.5)
10 3.40 e'f
(3.6) 21.0c'd'e
(20.5) 3.60b'c
(3.3)
26_gd,e,f
(22.7)
11 6.60 b'c'd
(7.2)
259b,c,d
(19.3) 8.62 a
(11.2) 29.5c'd'e
(18.2)
12 10.06a
(14.2) 34.2 a
(32.6) I 8.13a
(11.8) 40.4 a'b
(30.7) "^ uia ««ii VHiu.uo; uinerences Detween boots
There was a significant (p<0.05) boot by load interaction for both maximum pressure and its time of occurrence i^anuiu>
38
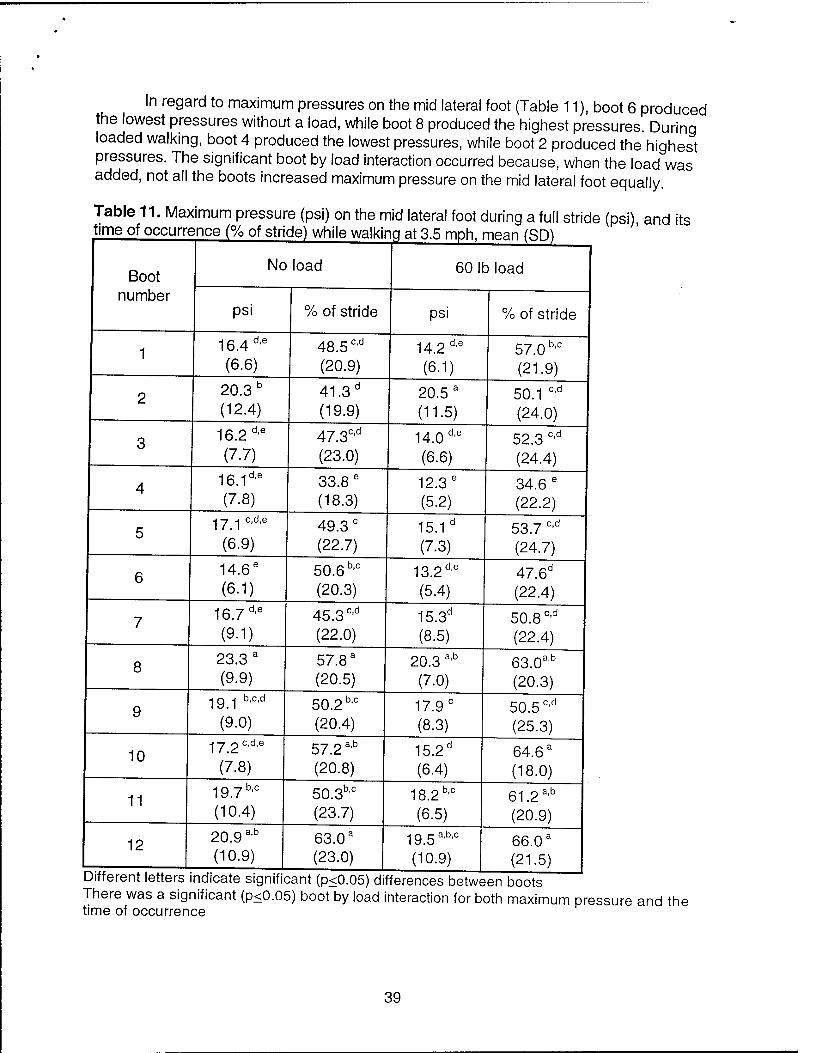
In regard to maximum pressures on the mid lateral foot (Table 11), boot 6 produced the lowest pressures without a load, while boot 8 produced the highest pressures. During loaded walking, boot 4 produced the lowest pressures, while boot 2 produced the highest pressures. The significant boot by load interaction occurred because, when the load was added, not all the boots increased maximum pressure on the mid lateral foot equally.
Table 11. Maximum pressure (psi) on the mid lateral foot during a full stride (psi) and its
Boot number
No load
■a— rw \^^i
60 lb load
psi % of stride psi % of stride
1 16.4 d'e
(6.6) 48.5 c'd
(20.9) 14.2 d'e
(6.1) 57.0 b'c
(21.9)
2 20.3 b
(12.4) 41.3 d
(19.9) 20.5 a
(11.5) 50.1 c'd
(24.0)
3 16.2 d'e
(7.7) 47.3c'd
(23.0) 14.0 d'e
(6.6) 52.3 c'd
(24.4)
4 16.1d'e
(7.8) 33.8 e
(18.3) 12.3 e
(5.2) 34.6 e
(22.2)
5 17.1 cde
(6.9) 49.3° (22.7)
15.1 d
(7.3) 53.7 c'd
(24.7)
6 14.6e
(6.1) 50.6 b'° (20.3)
132d,e
(5.4) 47.6d
(22.4)
7 16.7d'e
(9.1) 45.3 c'd
(22.0) 15.3d
(8.5) 50.8 c'd
(22.4)
8 23.3 a
(9.9) 57.8a
(20.5) 20.3 a'b
(7.0) 63.0ab
(20.3)
9 19.1 b'c'd
(9.0) 50.2 b'c
(20.4) 17.9 c
(8.3) 50.5 c'd
(25.3)
10 -\~7 O c,d,e
(7.8) 57.2 a'b
(20.8) 15.2d
(6.4) 64.6 a
(18.0)
11 19.7b'c
(10.4) 50.3b'c
(23.7) 18.2b'c
(6.5) 61.2 a'b
(20.9)
12 20.9 a'b
(10.9) 63.0a
(23.0) 19.5abc
(10.9) 66.0 a
(21.5) Different letters ndicate sianific lant (r><0X)F>\ di Fffirp>nr-p>Q hotuic
There was a significant (p<0.05) boot by load interaction for both maximum pressure and the time of occurrence
39
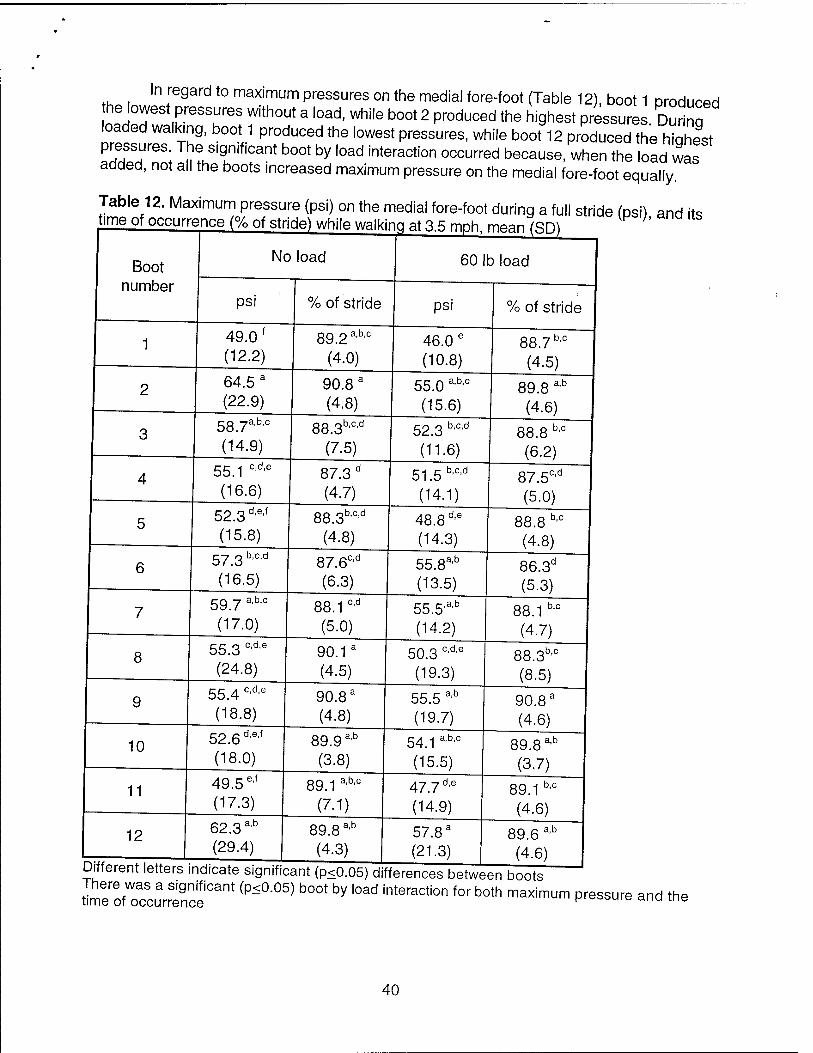
In regard to maximum pressures on the medial fore-foot (Table 12), boot 1 produced he lowest pressures without a load, while boot 2 produced the highest pressures. During
loaded walking, boot 1 produced the lowest pressures, while boot 12 produced the hiahest pressures The significant boot by load interaction occurred because, when the load was added, not all the boots increased maximum pressure on the medial fore-foot equally.
Table 12. Maximum pressure (psi) on the medial fore-foot during a full stride (psi) and its
Boot number
No load 60 lb load
psi % of stride psi % of stride
1 49.0 f
(12.2) 89.2a,b'c
(4.0) 46.0 e
(10.8) 88.7 b'° (4.5)
2 64.5 a
(22.9) 90.8 a
(4.8) 55.0 aAc
(15.6) 89.8 a'b
(4.6)
3 58.7a'b'° (14.9)
88.3b'c'd
(7.5) 52.3 b'c'd
(11.6) 88.8 b'c
(6.2)
4 55.1 CÄe
(16.6) 87.3 d
(4.7) 51.5b'c'd
(14.1) 87.5c'd
(5.0)
5 52.3d'e'f
(15.8) 88.3b'c'd
(4.8) 48.8 d'e
(14.3) 88.8 b,c
(4.8)
6 57.3 b'c'd
(16.5) 87.6c'd
(6.3) 55.8a'b
(13.5) 86.3d
(5.3)
7 59.7 a,b'c
(17.0) 88.1c'd
(5.0) 55.5'a'b
(14.2) 88.1 b'c
(4.7)
8 55.3 c'd'e
(24.8) 90.1a
(4.5) 50.3 CÄe
(19.3) 88.3b,c
(8.5)
9 55.4 CÄe
(18.8) 90.8a
(4.8) 55.5 a'b
(19.7) 90.8a
(4.6)
10 52.6d'e'f
(18.0) 89.9a,b
(3-8) 54.1 a'b'c
(15.5) 89.8 a,b
(3.7)
11 49.5 e'f
(17.3) 89.1 a'b'c
(7.1) 47.7 d'e
(14.9) 89.1 b'c
(4.6)
12 62.3 a'b
(29.4) 89.8 a'b
(4.3) 57.8a
(21.3) 89.6 a'b
(4.6)
There was a Significant (p<0.05) boot by load interaction for both maximum pressure and the time of occurrence K oou.c auu m«
40
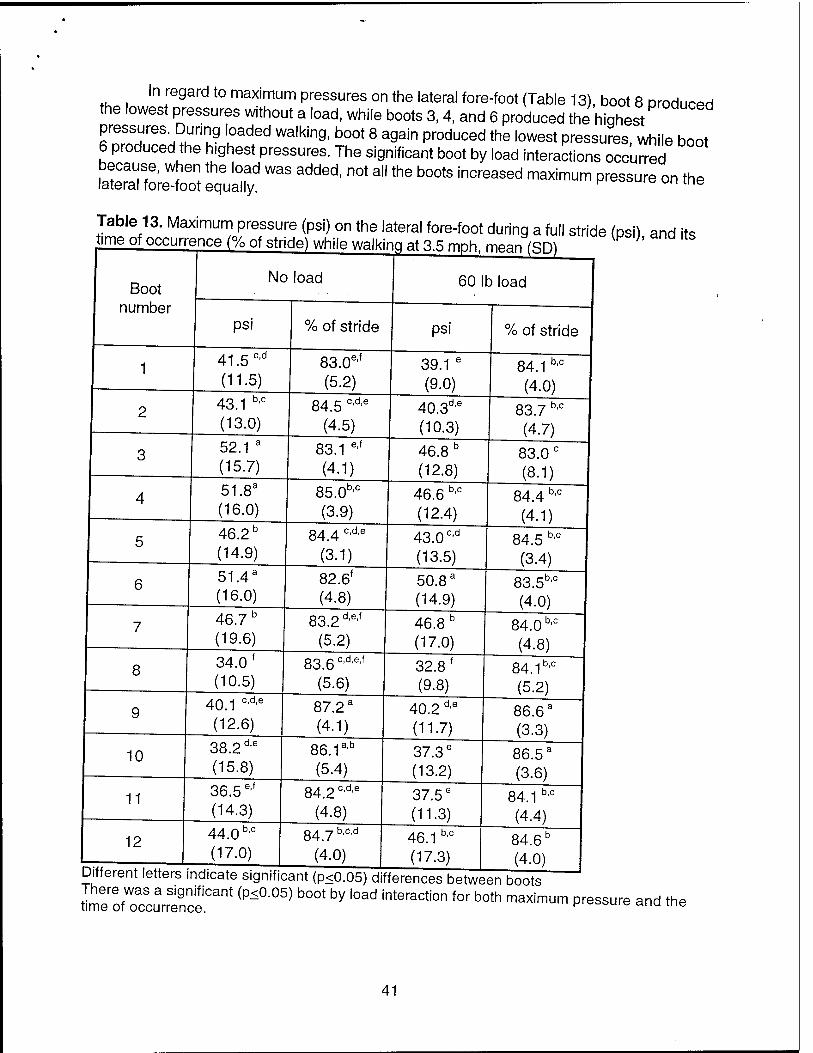
In regard to maximum pressures on the lateral fore-foot (Table 13), boot 8 produced the lowest pressures without a load, while boots 3, 4, and 6 produced the highest pressures. During loaded walking, boot 8 again produced the lowest pressures, while boot 6 produced the highest pressures. The significant boot by load interactions occurred
!Ä££ " ^ added' n0t a"thG b°0tS inCreaSSd ™m ~" on the
Table 13. Maximum pressure (psi) on the lateral fore-foot during a full stride (psi) and its time of occurrence (% of stride) while walking at 3.5 mph, mean (SD)
Boot number
7
8
10
11
12
No load
psi
cd 41.5 (11.5)
43.1 b'° (13.0)
52.1 a
(15.7)
51.8a
(16.0)
46.2b
(14.9)
51.4a
(16.0)
46.7 b
(19.6)
34.0 f
(10.5)
40.1 c'd'e
(12.6) d,e 38.2
(15.8) e,f 36.5
(14.3) b,c 44.0
(17.0)
% of stride
83.0 (5.2)
,e.f
84.5 c'd'e
(4.5)
83.1 (4.1)
e,f
85.0 (3.9)
b,c
84.4 (3.1)
c,d,e
82.6f
(4.8)
83.2 (5.2)
d,e,f
836c,d,e,f
(5.6)
87.2 a
(4.1)
86.1 (5.4)
a.b
84.2 (4-8)
84.7 (4.0)
c,d,e
b,e,d
60 lb load
psi
39.1 e
(9.0) .d,e 40.3
(10.3)
46.8 D
(12.8) b,c 46.6
(12.4)
43.0c,d
(13.5)
50.8 a
(14.9)
46.8 b
(17.0)
32.8 f
(9.8)
40.2 d'e
(11.7)
37.3 e
(13.2)
37.5 e
(11.3) b,c 46.1
(17.3)
% of stride
84.1 b'c
(4.0)
83.7 (4.7)
b,c
83.0 c
(8.1)
84.4 b'c
(4.1)
84.5 (3.4)
b,c
83.5 (4.0)
b,c
84.0 (4.8)
b,c
84.1 (5.2)
b,c
86.6a
(3.3)
86.5 a
(3-6)
84.1 (4.4)
b,o
84.6b
(4.0) Different letters indicate significant (p<0.05) differences between boots
ZTo^une^!Cant (P-°"05) b°0t ^ ,0ad interaCti°n f°r b°th maXimUm Pressure and the
41
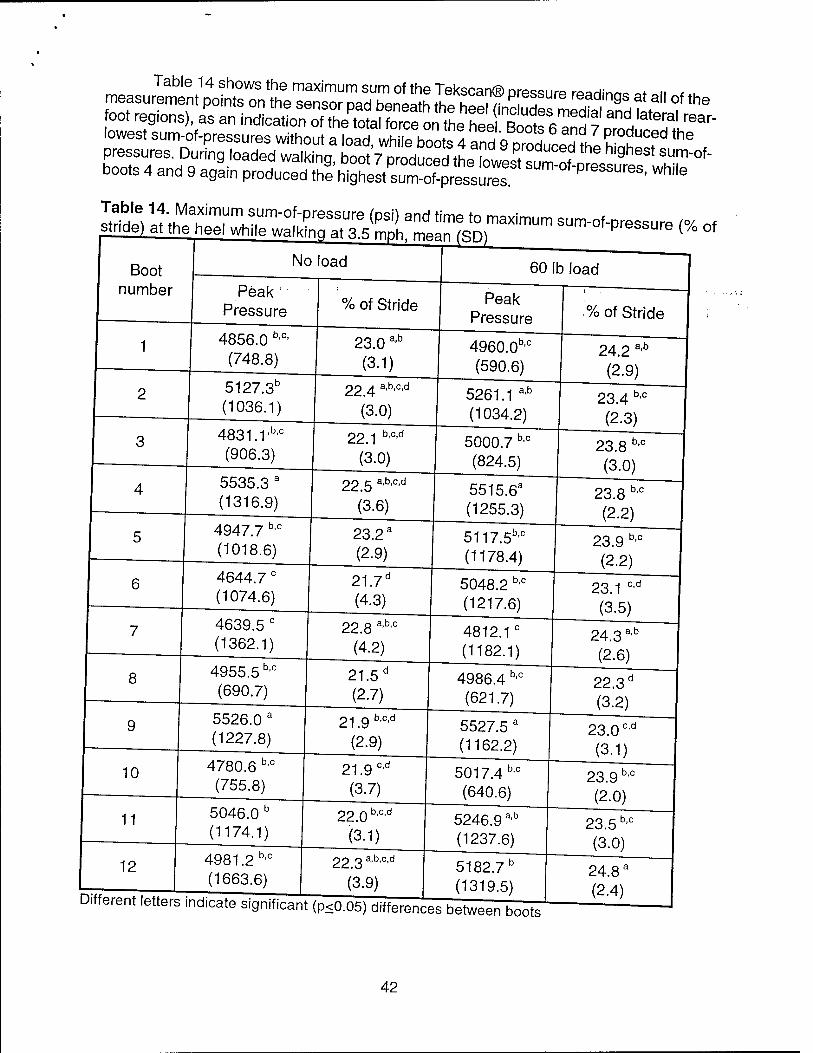
üirirfS 1?;hMa
hxim^m
ks
ium-°f-P'-essure (psi) and time to maximum sum-of-pressure <»/ of
stride) at the heel while walking at 3.5 mph. mean rem " Pressure (/c of
Boot number
7
8
10
11
12
No load
Peak Pressure
4856.0 bc' (748.8)
5127.3b
(1036.1)
4831.1,b,c
(906.3)
5535.3 a
(1316.9)
4947.7 b'c
(1018.6)
4644.7 c
(1074.6)
4639.5 c
(1362.1)
4955.5 b'c
(690.7)
5526.0 a
(1227.8) b.c 4780.6
(755.8)
5046.0 b
(1174.1)
4981.2 b'c
(1663.6)
% of Stride
23.0 (3.1)
a,b
op A a,b,c,d
(3.0)
22.1 (3.0)
b,c,d
22.5 a'b'c'd
(3.6)
23.2a
(2.9)
21.7d
(4.3)
22.8 (4.2)
a,b,c
21.5d
(2.7) 2i>9b,c,d
(2.9)
21.9 (3.7)
c.d
22.0 (3.1)
b,c,d
22.3 (3.9)
a.b.c.d
60 lb load
Peak Pressure
4960.0bc
(590.6)
5261.1 ab
(1034.2)
5000.7 b'c
(824.5)
5515.6a
(1255.3) b,c 5117.5
(1178.4)
5048.2 b'c
(1217.6)
4812.1° (1182.1)
4986.4 b,c
(621.7)
5527.5 a
(1162.2)
5017.4 b'c
(640.6)
5246.9 a'b
(1237.6)
5182.7 (1319.5)
Different letters indicate significant (p<0.05) differences between boots
% of Stride
24.2 a,b
(2-9)
23.4 b,c
(2.3)
23.8 b'c
(3-0)
23.8 bc
(2.2)
23.9 b'c
(2.2)
23.1 °'d
(3.5)
24.3 (2.6)
a.b
22.3 d
(3.2)
23.0 c'd
(3-1)
23.9 b'° (2-0)
23.5 b'c
(3-0)
24.8 a
(2.4)
42
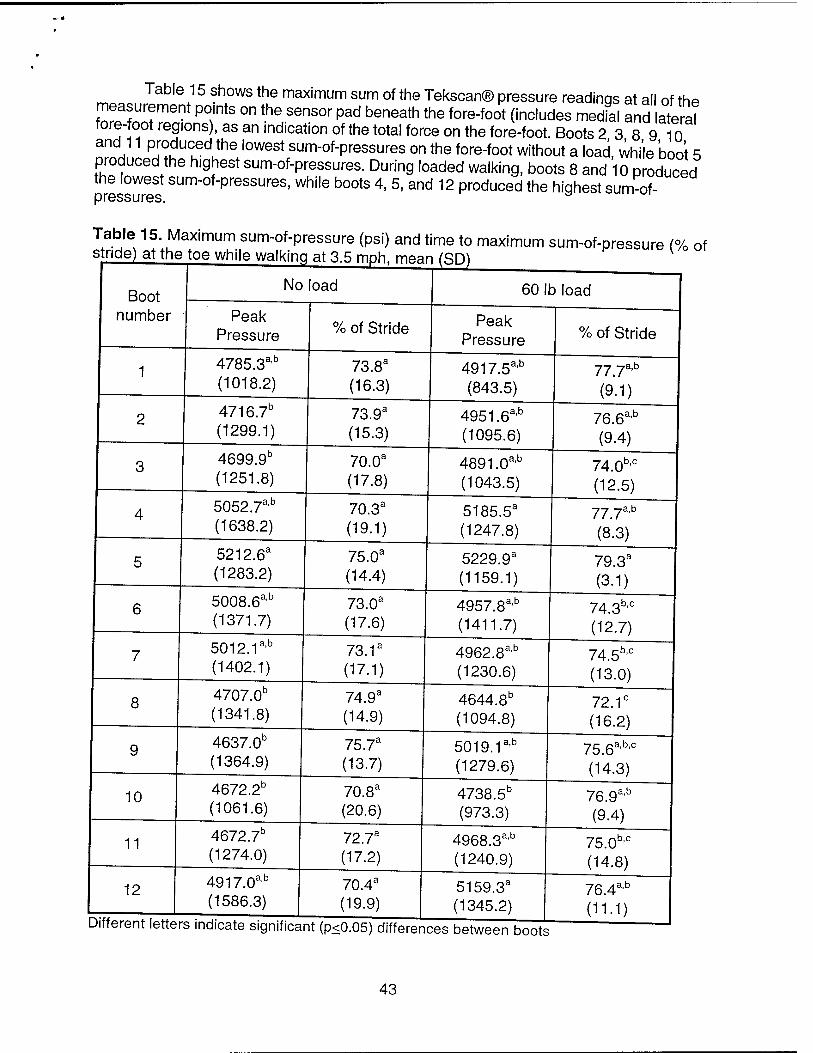
Table 15 shows the maximum sum of the Tekscan® pressure readinqs at all of the* measurement pants on the sensor pad beneath the fore-foot (includes medial and lateral fore-foot regions), as an indication of the total force on the fore-foot. Boots 2 3 8 9 10 and 11 produced the lowest sum-of-pressures on the fore-foot without a load, while boot 5 produced the highest sum-of-pressures. During loaded walking, boots 8 and 10 produced the lowest sum-of-pressures, while boots 4, 5, and 12 produced the highest sum-of- P iGSS UI0S.
Table 15. Maximum sum-of-pressure (psi) and time to maximum sum-of-pressure (% of
Boot number
No load 60 lb load
Peak Pressure % of Stride Peak
Pressure % of Stride
1 4785.3ab
(1018.2) 73.8a
(16.3) 4917.5ab
(843.5) 77.7a'b
(9.1)
2 4716.7b
(1299.1) 73.9a
(15.3) 4951.6a'b
(1095.6) 76.6a'b
(9.4)
3 4699.9b
(1251.8) 70.0a
(17.8) 4891.0a'b
(1043.5) 74.0b'c
(12.5)
4 5052.7ab
(1638.2) 70.3a
(19.1) 5185.5a
(1247.8) 77.7a'b
(8.3)
5 5212.6a
(1283.2) 75.0a
(14.4) 5229.9a
(1159.1) 79.3a
(3.1)
6 5008.6a'b
(1371.7) 73.0a
(17.6) 4957.8a'b
(1411.7) 74.3b'c
(12.7)
7 5012.1a'b
(1402.1) 73.1a
(17.1) 4962.8a'b
(1230.6) 74.5b'c
(13.0)
8 4707.0b
(1341.8) 74.9a
(14.9) 4644.8b
(1094.8) 72.1° (16.2)
9 4637.0b
(1364.9) 75.7a
(13.7) 5019.1a'b
(1279.6) 75.6aÄC
(14.3)
10 4672.2b
(1061.6) 70.8a
(20.6) 4738.5b
(973.3) 76.9a'b
(9.4)
11 4672.7b
(1274.0) 72.7a
(17.2) 4968.3ab
(1240.9) 75.0b'c
(14.8)
12 4917.0ab
(1586.3) 70.4a
(19.9) 5159.3a
(1345.2) 76.4a'b
(11.1)
43
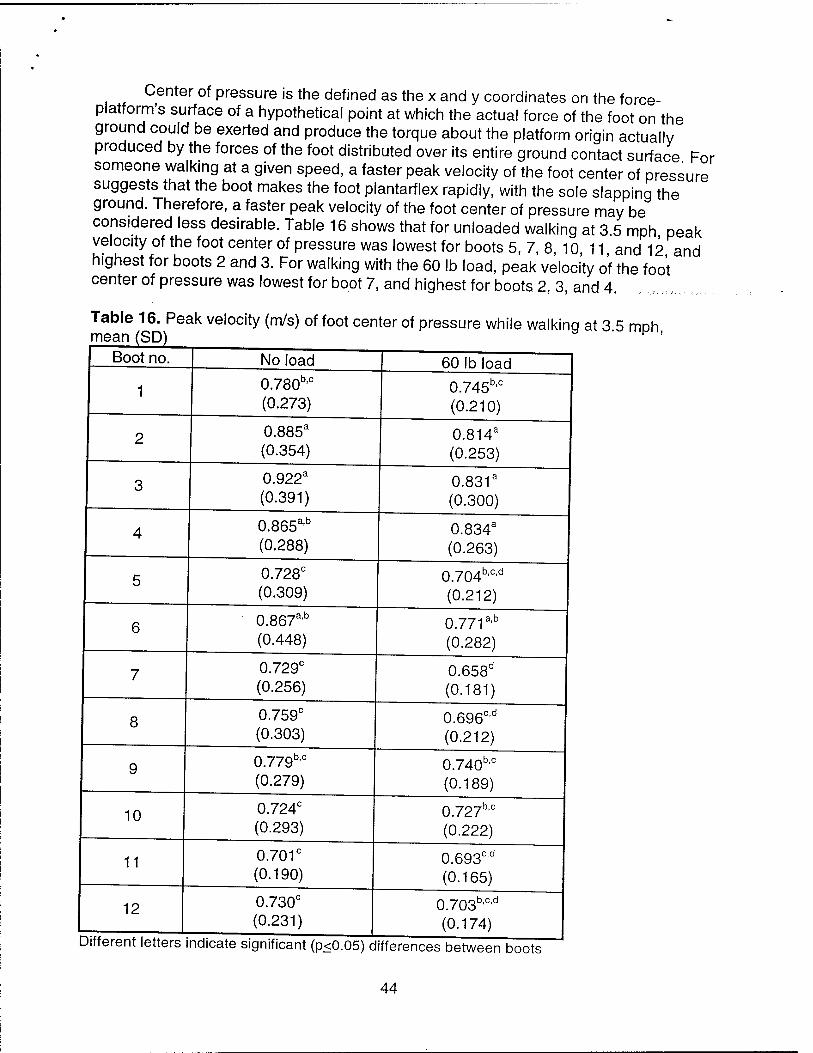
Center of pressure is the defined as the x and y coordinates on the force- platform's surface of a hypothetical point at which the actual force of the foot on the ground could be exerted and produce the torque about the platform origin actually produced by the forces of the foot distributed over its entire ground contact surface For someone walking at a given speed, a faster peak velocity of the foot center of pressure suggests that the boot makes the foot plantarflex rapidly, with the sole slapping the ground. Therefore, a faster peak velocity of the foot center of pressure may be considered less desirable. Table 16 shows that for unloaded walking at 3 5 mph peak velocity of the foot center of pressure was lowest for boots 5, 7, 8, 10, 11 and 12 and highest for boots 2 and 3. For walking with the 60 lb load, peak velocity of the foot center of pressure was lowest for boot 7, and highest for boots 2, 3, and 4.
Table 16. Peak velocity (m/s) of foot center of pressure while walkinq at 3 5 moh mean (SD) • r >
Boot no. No load 60 lb load
1 0.780b'c
(0.273) 0.745b'c
(0.210)
2 0.885a
(0.354) 0.814a
(0.253)
3 0.922a
(0.391) 0.831a
(0.300)
4 0.865a'b
(0.288) 0.834a
(0.263)
5 0.728c
(0.309) 0.704b'c'd
(0.212)
6 0.867a'b
(0.448) 0.771 a'b
(0.282)
7 0.729c
(0.256) 0.658d
(0.181)
8 0.759c
(0.303) 0.696c'd
(0.212)
9 0.779b'c
(0.279) 0.740b'c
(0.189)
10 0.724c
(0.293) 0.727b'c
(0.222)
11 0.701c
(0.190) 0.693cd
(0.165)
12 0.730c
(0.231) 0.703bcd
(0.174)
44
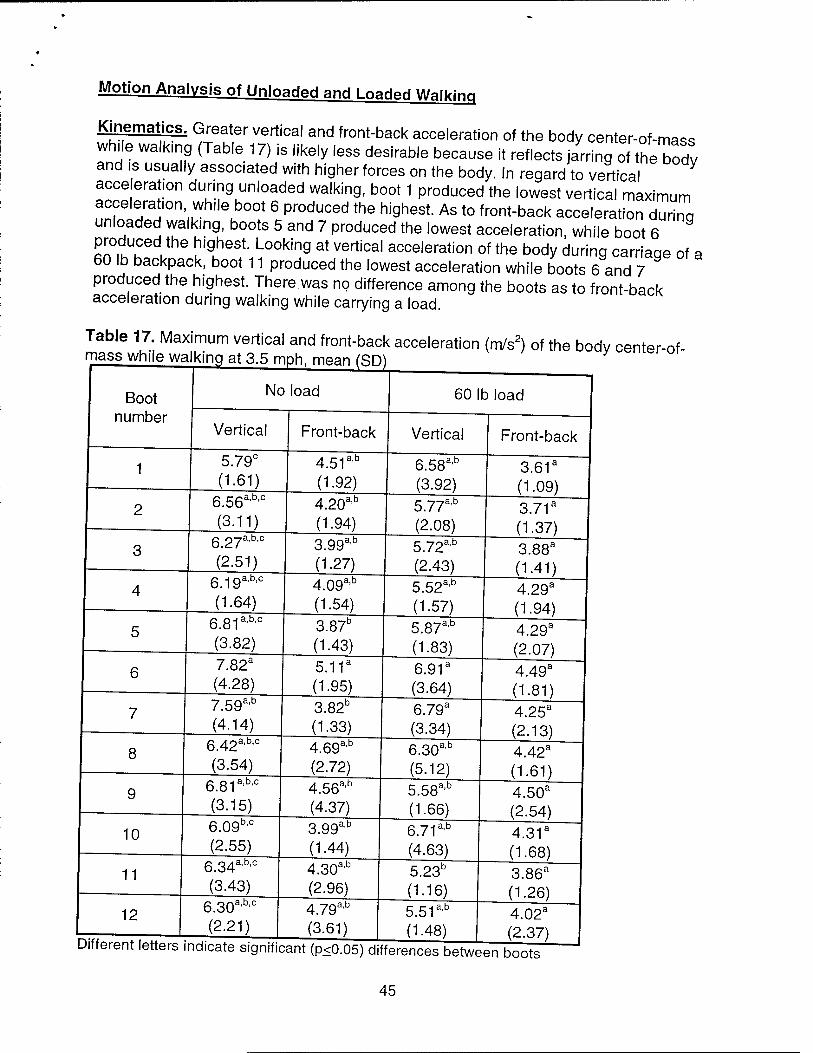
Motion Analysis of Unloaded and Loaded Walking
Kinematics. Greater vertical and front-back acceleration of the body center-of-mass while walking (Table 17) is likely less desirable because it reflects jarring of thetodv and is usually associated with higher forces on the body. In regard to vertical acce eration during unloaded walking, boot 1 produced the lowest vertical maximum acceleration while boot 6 produced the highest. As to front-back acceleration durinq unloaded walking, boots 5 and 7 produced the lowest acceleration, while boot 6
E?,u u .the hlgheSt Looking at vertical acceleration of the body during carriaoe of a 60 lb backpack, boot 11 produced the lowest acceleration while boots 6 and 7 produced the highest. There was no difference among the boots as to front-back acceleration during walking while carrying a load.
Table 17. Maximum vertical and front-back acceleration (m/s2) of the body center-of- mass while walking at 3.5 mph, mean (SD) '
Boot number
No load
Vertical
5.79° (1.61)
6.56a'b'c
(3.11)
60 lb load
Front-back
a,b 4.51 (1.92)
,a,b
•a,b,c 6.27 (2.51)
a,b,c
7
6.19 (1.64)
681 a,b,c
(3.82)
4.20 (1.94)
Vertical
a,b 6.58 (3.92)
Front-back
,a.b 3.99 (1-27)
5.77ab
(2.08)
a,b 4.09 (1.54)
7.82a
(4.28) a,b
8
7.59 (4.14)
g42a,b,c
(3-54)
3.87b
(1-43)
5.11a
(1-95)
5.72ab
(2.43)
3.61a
(1.09)
3.71a
(1-37)
,a,b 5.52 (1.57)
3.88a
(1-41)
5.87ab
(1.83)
3.82° (1-33)
,a,b
10
11
12
a,b,c 6.81 (3.15)
b,c 6.09 (2.55)
a,b,c 6.34 (3-43)
,a,b,c 6.30 (2.21)
4.69 (2.72)
.a,b 4.56 (4-37)
6.91a
(3-64)
6.79a
(3-34) a,b 6.30
(5.12)
4.29a
(1.94)
4.29a
(2.07)
4.49a
(1.81)
4.25a
(2.13)
,a,b 3.99 (1.44)
,a,b 4.30 (2.96) 4.79ab
(3.61]
5.58a'b
(1.66) a,b 6.71
(4.63)
5.23b
(1.16) 5.51 a'b
(1.48)
4.42a
(1.61)
4.50a
(2-54) 4.31a
(1-68)
3.86a
(1-26)
4.02a
(2.37) Different letters indicate significant (p<0.05) differences between boots
45
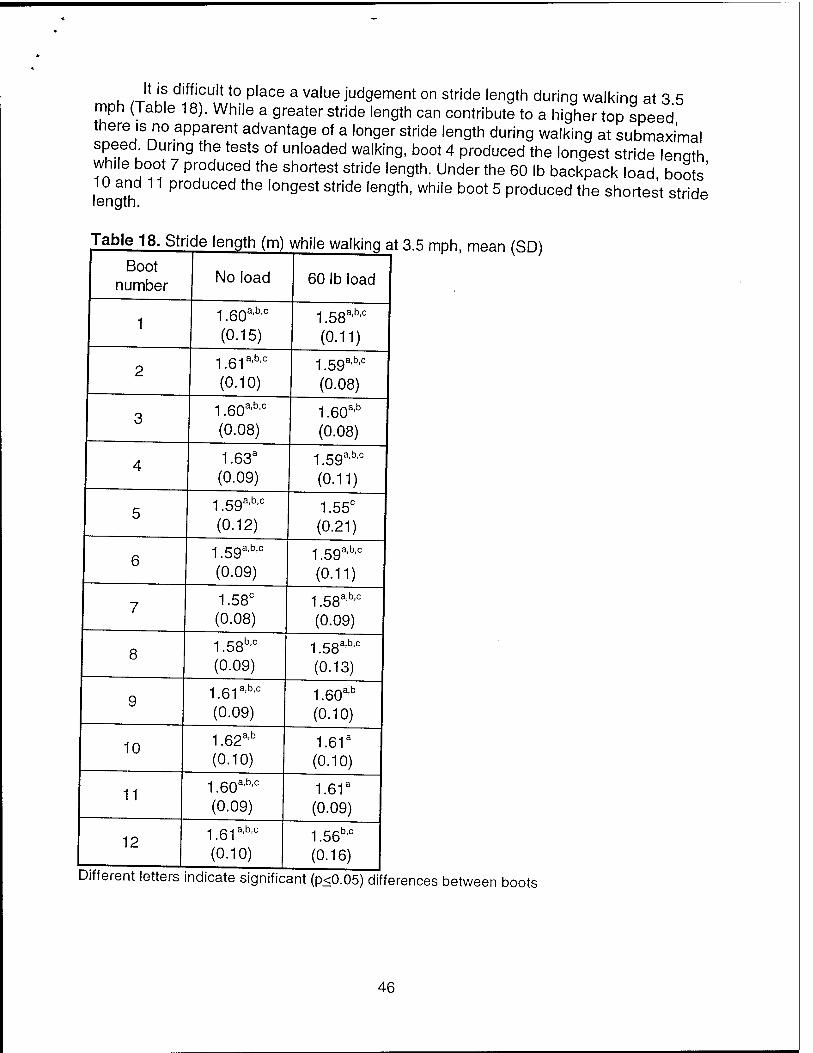
It is difficult to place a value judgement on stride length during walking at 3 5 mph (Table 18). While a greater stride length can contribute to a higher top speed there is no apparent advantage of a longer stride length during walking at submaximal speed. During the tests of unloaded walking, boot 4 produced the longest stride lenath while boot 7 produced the shortest stride length. Under the 60 lb backpack load boots' 10 and 11 produced the longest stride length, while boot 5 produced the shortest stride length. e
Table 18. Stride length (m) while walking at 3.5 mph, mean (SD)
Boot number No load 60 lb load
1 1.60aÄC
(0.15) 1.58a'b'c
(0.11)
2 1.61aÄC
(0.10) 1.59a'b'c
(0.08)
3 1.60aÄC
(0.08) 1.60ab
(0.08)
4 1.63a
(0.09) 1.59a'b'° (0.11)
5 1.59a'b'° (0.12)
1.55c
(0.21)
6 1.59a'b'c
(0.09) 1.59a'b'c
(0.11)
7 1.58c
(0.08) 1.58a'b'c
(0.09)
8 1.58b'c
(0.09) 1.58a'b'c
(0.13)
9 -, 61a,b,c
(0.09) 1.60a'b
(0.10)
10 1.62a'b
(0.10) 1.61a
(0.10)
11 1.60a,b'c
(0.09) 1.61a
(0.09)
12 161a,b,c
(0.10) 1.56b'c
(0.16)
Different letters indicate significant (p<0.05) differences between boots
46
Generally, the percentage of the stride under double support (Table 19) usually increases with the amount of weight carried (Martin and Nelson, 1986). This means that both feet are concurrently on the ground a greater percentage of the time The adjustment is considered desirable because double support spreads the load over two feet, thereby improving balance and reducing the forces and torques experienced bv each leg individually. On the other hand, increased time in double support generally means a shorter stride and greater energy cost. These linked phenomena are evidenced by the fact that boots 1 and 7, which produced the greatest time in double support without a load, also produced high rates of oxygen consumption (Table 6) while boot 10, which produced the lowest double support percentage, evidenced the lowest rate of oxygen consumption.
A similar pattern emerged for walking with the 60 lb backpack. Boot 5 which produced the greatest time in double support, evidenced both the shortest stride length (Table 18) and the highest rate of oxygen consumption. Boot 9, which produced the least time in double support, also evidenced a relatively long stride length and low rate of oxygen consumption.
47
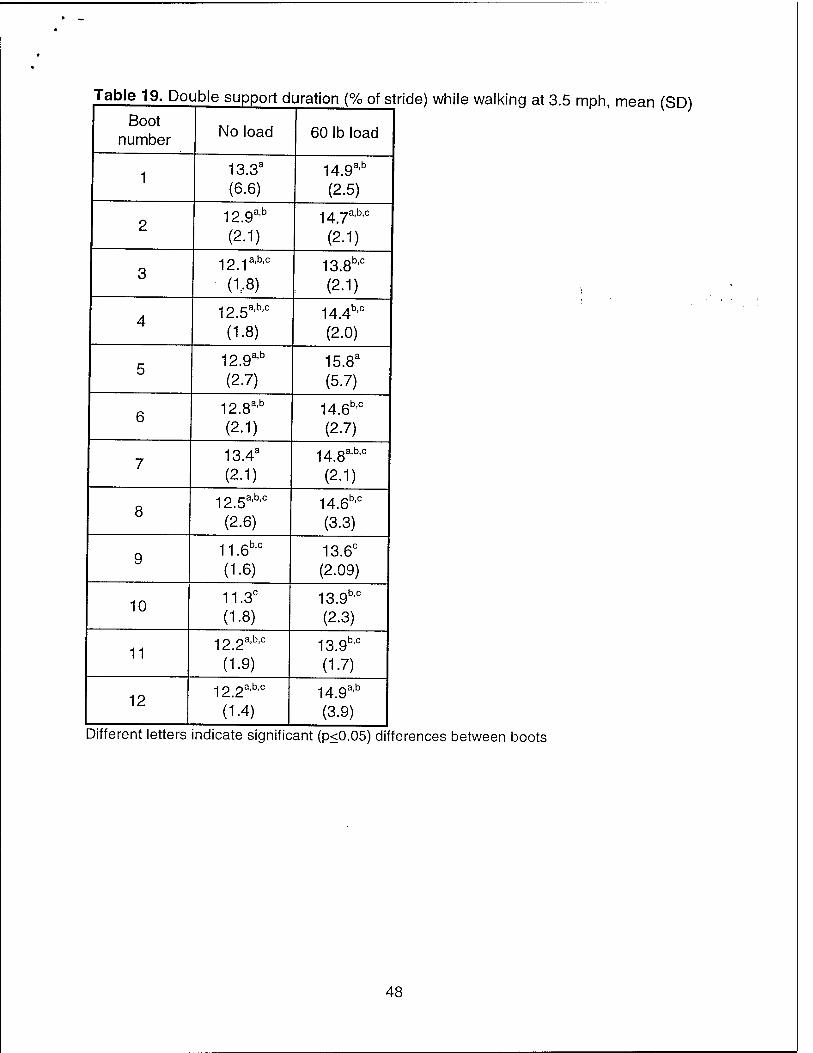
Table 19. Double support duration (% of s
Boot number
1
7
8
10
11
12
No load
13.3a
(6.6) a,b 12.9
(2.1) ■i o J a,b,c
(l'-8) a,b,c 12.5
(1.8) 12ga,b
(2.7)
12.8 (2.1)
a,b
13.4a
(2.1) a,b,c 12.5
(2.6)
11.6 (1.6)
b,c
11.3C
(1.8) a,b,c 12.2
(1.9) a.b.c 12.2
(1.4)
ride) while walking at 3.5 mph, mean (SD)
60 lb load
a,b 14.9 (2.5)
147a,b,c
(2.1) b,c 13.8
(2.1)
14.4b'c
(2.0)
15.8a
(5.7)
14.6 (2.7)
b,c
14.8 (2.1;
a.b.c
14.6b'c
(3.3)
13.6C
(2.09)
13.9 (2.3)
b,c
13.9 (1.7)
b,c
14.9 (3.9)
a,b
Different letters indicate significant (p<0.05) differences between boots
48
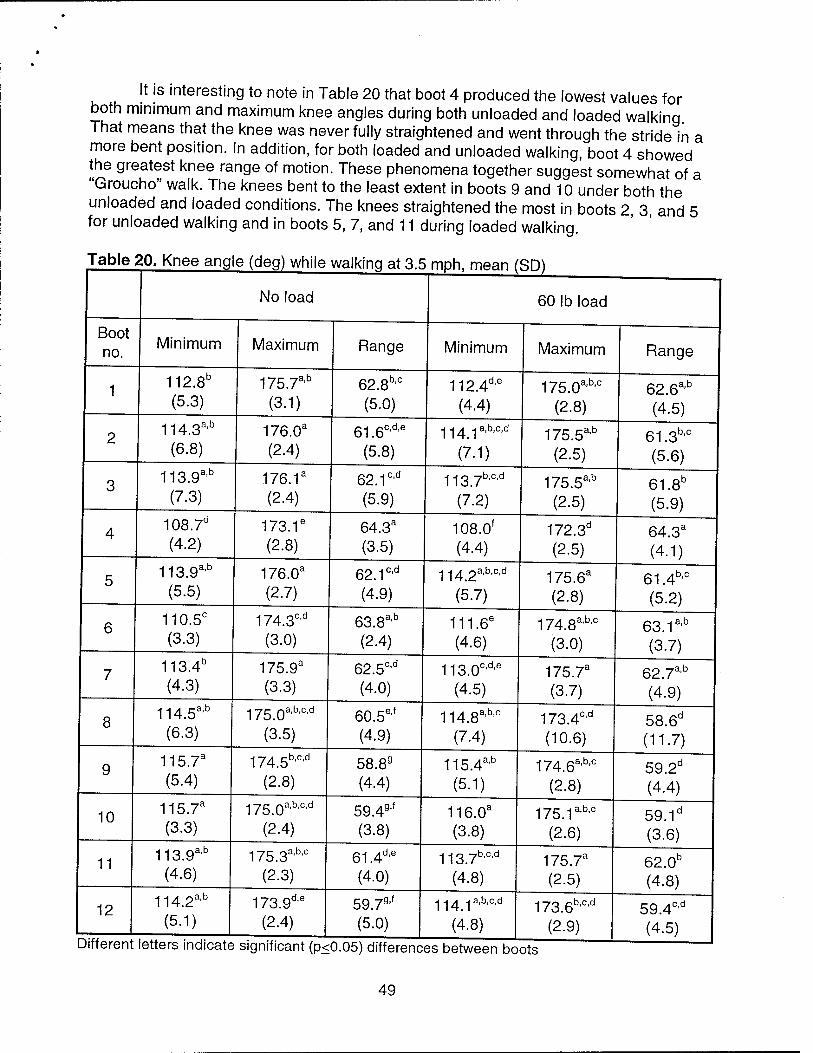
It is interesting to note in Table 20 that boot 4 produced the lowest values for both minimum and maximum knee angles during both unloaded and loaded walking That means that the knee was never fully straightened and went through the stride in a more bent position. In addition, for both loaded and unloaded walking, boot 4 showed the greatest knee range of motion. These phenomena together suggest somewhat of a "Groucho" walk. The knees bent to the least extent in boots 9 and 10 under both the unloaded and loaded conditions. The knees straightened the most in boots 2, 3 and 5 for unloaded walking and in boots 5, 7, and 11 during loaded walking.
Table 20. Knee ang e (deg) while walkinq at 3.E i mph, mean (SD)
No load 60 lb load
Boot no.
Minimum Maximum Range Minimum Maximum Range
1 112.8b
(5.3) 175.7a'b
(3.1) 62.8b|C
(5.0) 112.4de
(4.4) 175.0ab'c
(2.8) 62.6a'b
(4.5)
2 114.3ab
(6.8) 176.0a
(2.4) 61.6CÄe
(5.8) 114.1a'b'c'd
(7.1) 175.5a'b
(2.5) 61.3b'c
(5.6)
3 113.9ab
(7.3) 176.1a
(2.4) 62.1cd
(5.9)
1137b,c,d
(7.2) 175.5a'b
(2.5) 61.8b
(5.9)
4 108.7d
(4.2) 173.1e
(2.8) 64.3a
(3.5) 108.0f
(4.4) 172.3d
(2.5) 64.3a
(4.1)
5 113.9ab
(5.5) 176.0a
(2.7)
621cd
(4.9) 114.2a,b,c,d
(5.7) 175.6a
(2.8) 61.4blC
(5.2)
6 110.5C
(3.3) 174.3c'd
(3.0) 63.8a,b
(2.4) 111.6e
(4.6) 174.8a'b'c
(3.0) 63.1a'b
(3.7)
7 113.4b
(4.3) 175.9a
(3.3) 62.5c'd
(4.0) 113.0CÄe
(4.5) 175.7a
(3.7) 62.7a'b
(4.9)
8 114.5a'b
(6.3) 175.0a,b,c,d
(3.5) 60.5e'f
(4.9) 114.8a'b'c
(7.4) 173.4c'd
(10.6) 58.6d
(11.7)
9 115.7a
(5.4) 174.5b,c,d
(2.8) 58.89
(4.4) 115.4a'b
(5.1)
1746a,b,c
(2.8) 59.2d
(4.4)
10 115.7a
(3.3) 175.0a,b,c,d
(2.4) 59.49'f
(3.8) 116.0a
(3.8) 175.1a'b'c
(2.6) 59.1d
(3.6)
11 113.9a'b
(4.6) 175.3a'b'c
(2.3) 61.4d'e
(4.0)
1137b,c,d
(4.8) 175.7a
(2.5) 62.0b
(4.8)
12 1142a,b
(5.1) 173.9d'e
(2.4) 59.79'f
(5.0)
1141a,b,c,d
(4.8) 173.6b'c'd
(2.9) 59.4c'd
(4.5) Different letters indicate significant (p< 0.05) differenc es between bo ots
49
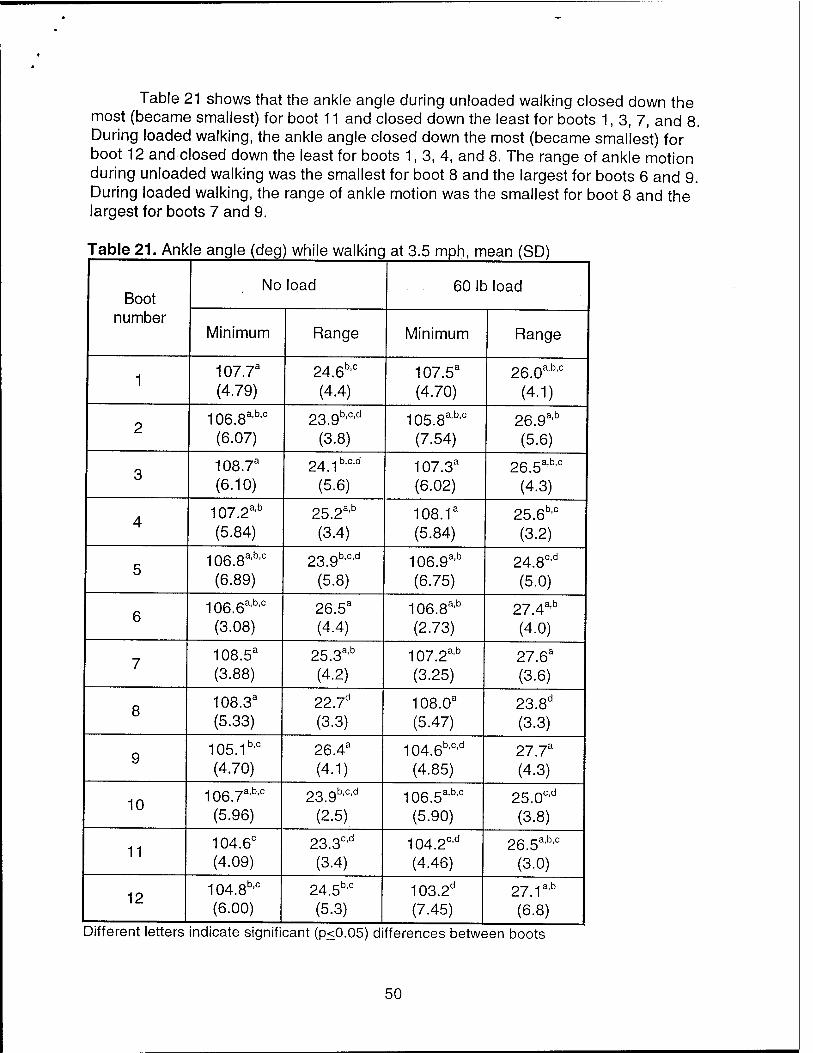
Table 21 shows that the ankle angle during unloaded walking closed down the most (became smallest) for boot 11 and closed down the least for boots 1, 3, 7, and 8. During loaded walking, the ankle angle closed down the most (became smallest) for boot 12 and closed down the least for boots 1, 3, 4, and 8. The range of ankle motion during unloaded walking was the smallest for boot 8 and the largest for boots 6 and 9. During loaded walking, the range of ankle motion was the smallest for boot 8 and the largest for boots 7 and 9.
Table 21. Ank e angle (deg) while walking at 3.5 mph, mean (SD)
Boot number
No load 60 lb load
Minimum Range Minimum Range
1 107.7a
(4.79) 24.6b'c
(4.4) 107.5a
(4.70)
260a,b,c
(4.1)
2 106.8a'bc
(6.07)
23gb,c,d
(3.8) 105.8a'b'c
(7.54) 26.9a'b
(5.6)
3 108.7a
(6.10) 24.1b,c,d
(5.6) 107.3a
(6.02) 26.5a'b'c
(4.3)
4 107.2a'b
(5.84) 25.2a'b
(3-4) 108.1a
(5.84) 25.6b'c
(3.2)
5 106.8abc
(6.89) 23.9b,c,d
(5.8) 106.9a'b
(6.75) 24.8c'd
(5.0)
6 106.6a'b'c
(3.08) 26.5a
(4.4) 106.8a'b
(2.73) 27.4a'b
(4.0)
7 108.5a
(3.88) 25.3a'b
(4.2) 107.2a'b
(3.25) 27.6a
(3.6)
8 108.3a
(5.33) 22.7d
(3.3) 108.0a
(5.47) 23.8d
(3.3)
9 105.1b'c
(4.70) 26.4a
(4.1) 104.6b'c'd
(4.85) 27.7a
(4.3)
10 106.7a'b'c
(5.96)
23gb,c,d
(2.5) 106.5a'b'c
(5.90) 25.0c'd
(3.8)
11 104.6C
(4.09) 23.3c'd
(3.4) 104.2c'd
(4.46) 26.5a'b'c
(3.0)
12 104.8b'c
(6.00) 24.5b'c
(5.3) 103.2d
(7.45) 27.1a'b
(6.8) Different letters indicate signifi cant (p<0.05) di fferences betwe sen boots
50
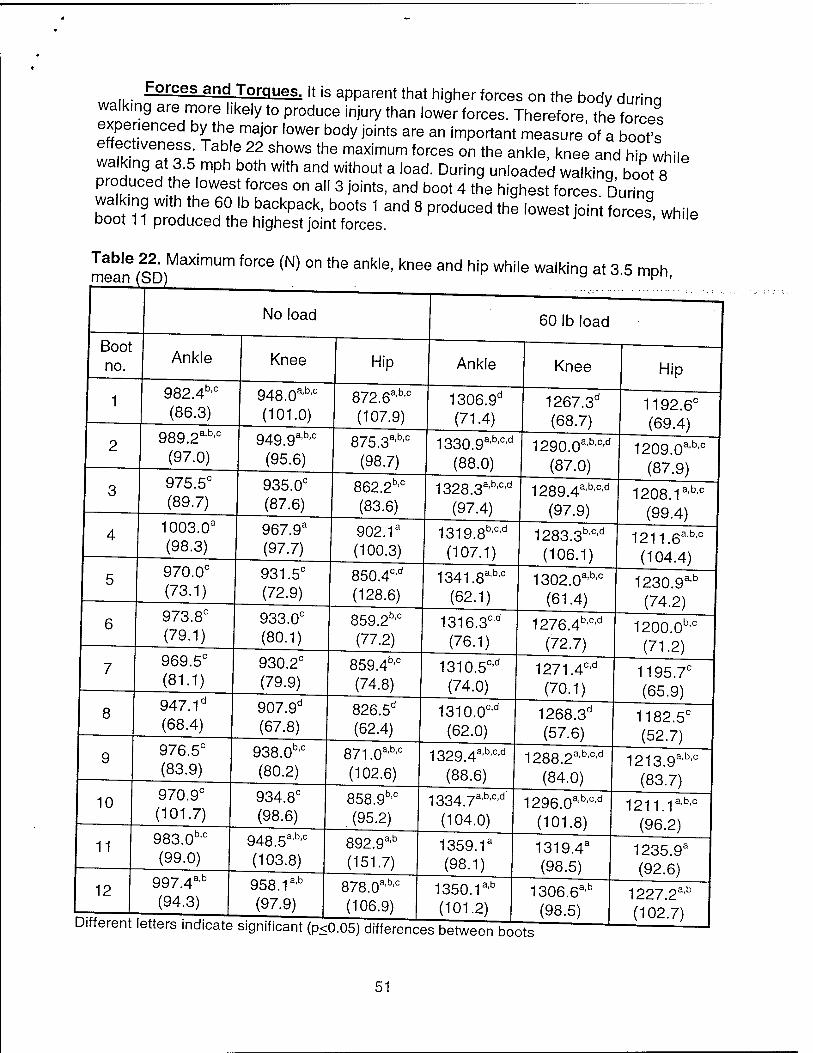
Forces and Torqi IPs It is apparent that higher forces on the body durinq walking are more likely to produce injury than lower forces. Therefore the forces experienced by the major lower body joints are an important measure of a boof s effectiveness. Table 22 shows the maximum forces on the ankle, knee and hip while walk.ng at 3.5 mph both with and without a load. During unloaded walking boot 8 produced the lowest forces on all 3 joints, and boot 4 the highest forces Durinq walking with the 60 lb backpack, boots 1 and 8 produced the lowest joint forces while boot 11 produced the highest joint forces. '
Table 2^2 Maximum force (N) on the ankle, knee and hip while walking at 3.5 mph,
Boot no.
1
6
7
10
11
12
Ankle
982.4b'c
(86.3)
989.2 (97.0)
,a,b,c
975.5C
(89.7)
1003.03
(98.3)
970.0° (73.1)
973.8C
(79.1)
969.5C
(81.1)
947.1d
(68.4)
976.5° (83.9)
970.9° (101.7)
983.0 (99.0)
,b,c
997.4 (94.3)
a,b
No load
Knee
948.0a'b'° (101.0)
949ga,b,c
(95.6)
935.0° (87.6)
967.9a
(97.7)
931.5° (72.9)
933.0° (80.1)
930.2° (79.9)
907.9d
(67.8)
938.0b'° (80.2)
934.8° (98.6)
g485a,b,c
(103.8)
958.1 (97.9)
a,b
Hip
8726a,b,c
(107.9)
875.3 (98.7)
a,b,c
862.2 (83.6)
b,c
902.1a
(100.3)
850.4°'d
(128.6)
859.2b'° (77.2)
859.4b'° (74.8)
826.5d
(62.4)
871.0ab'° (102.6)
858.9b'° (95.2)
,a,b 892.9 (151.7)
8780a,b,c
(106.9)
60 lb load
Ankle
1306.9C
(71.4)
Knee
1330.9 (88.0)
,a,b,c,d
13283a,b,c,d
(97.4)
1267.3d
(68.7)
Hip
1290.0a'b'°'d
(87.0)
1319.8b'°'d
(107.1)
1341.8a'b'° (62.1)
1289.4a'b'°'d
(97.9)
1283.3b'°'d
(106.1)
1192.6° (69.4)
^og.o3-^ (87.9)
1208.1^'° (99.4)
1316.3°'d
(76.1)
1302.0a'b'° (61.4)
1310.5°'d
(74.0)
1310.0°'d
(62.0)
1276.4 (72.7)
b,c,d
1211.6 (104.4)
a.b.c
1230.9^ (74.2)
1271.4 (70.1)
c,d
1329.4 (88.6)
a,b,c,d
1334.7a'b'°'d
(104.0)
1359.1a
(98.1)
1268.3d
(57.6)
1288.2a'b'°'d
(84.0)
1200.0 (71.2)
b,c
1195.7° (65.9)
1182.5° (52.7)
1296.0 (101.8)
a,b,c,d
1350.1 (101.2)
a,b
1319.4a
(98.5)
Different letters indicate significant (p<0.05) differences between boots
1306.6 (98.5)
a,b
1213.9 (83.7)
a,b,c
1211.1abc
(96.2)
1235.9a
(92.6)
1227.2ab
(102.7)
51
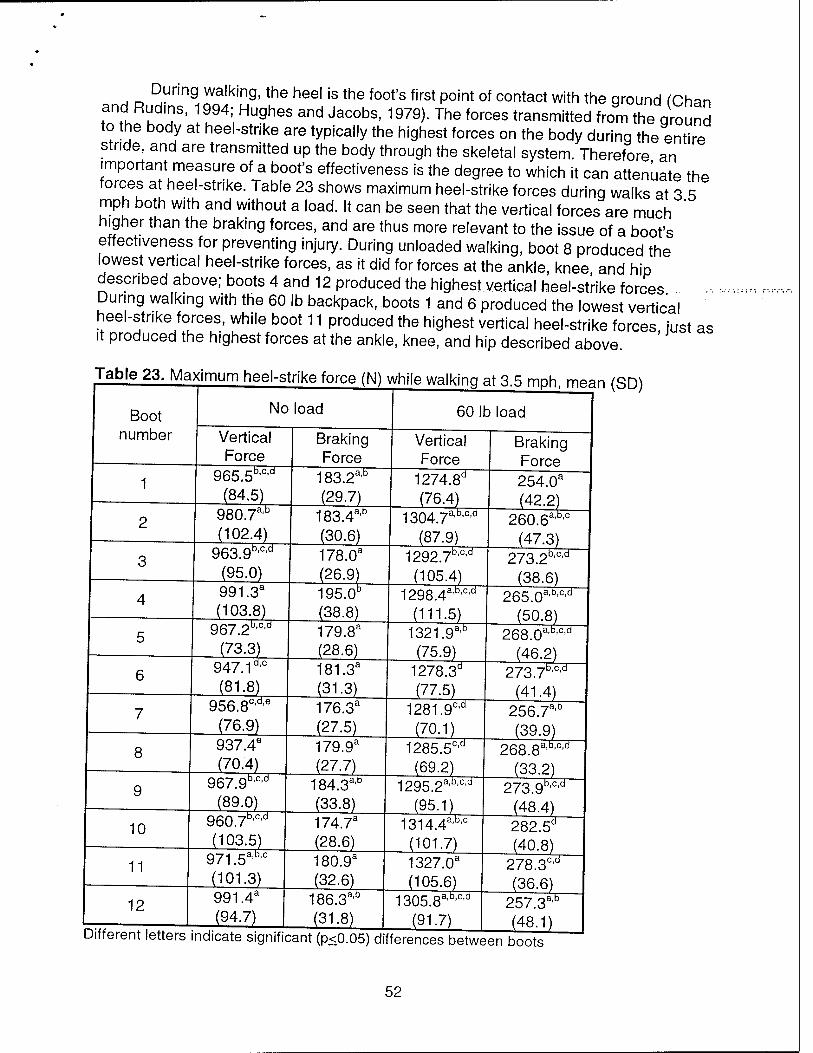
During walking, the heel is the foot's first point of contact with the ground (Chan
tTth K7' f 4iHUghGS and JaCObs' 1979>' The forces transmitted from the ground to the body at heel-strike are typically the highest forces on the body during the entire stride, and are transmitted up the body through the skeletal system Therefore an important measure of a boot's effectiveness is the degree to which it can attenuate the forces at heel-strike. Table 23 shows maximum heel-strike forces during walks at 3 5 mph both with and without a load. It can be seen that the vertical forces are much ' higher than the braking forces, and are thus more relevant to the issue of a boot's effectiveness for preventing injury. During unloaded walking, boot 8 produced the lowest vertical heel-strike forces, as it did for forces at the ankle, knee and hip described above; boots 4 and 12 produced the highest vertical heel-strike forces During walking with the 60 lb backpack, boots 1 and 6 produced the lowest vertical heel-strike forces, while boot 11 produced the highest vertical heel-strike forces just as it produced the highest forces at the ankle, knee, and hip described above.
Table 23. Maximum heel-strike force (N) while walking at 3.5 mph, mean (SD)
Boot number
No load
Vertical Force
965.5b'c'd
(84.5) 980.7 (1024)
££"
Braking Force
183.2 (29-7)
a$~
60 lb load
Vertical Force
963.9b'°'d
(95.0) 991.3a
(103 8) 967.2 E^d~
183.4 (30.6)
aF
178.0a
(26.9) 195.0b
(38.8)
1274.8C
(76.4) 1304.7
(87.9)
<a,b,c,d
1292.7 (105.4)
tta~
Braking Force 254.0a
(42.2)
7
8
947.1 (81-8)
oe"
956.8c'd'e
(76.9) 937.4e
(70-4)
10
11
12
967.9 (89.0)
ttd~
179.8a
(28.6) 181.3a
(31.3) 176.3a
(27.5) 179.9a
(27.7)
1298.4
011-5)
a,b,c,d
1321.9 (75-9)
iF"
1278.3 (77-5)
1281.9
(70-1)
Ad~
260.6a'b,c
{47^ 273.2b'c'd
(38.6) 265.0a'b'c'd
(50.8) .a.b.c.d
Fc^" 960.7 (103-5)
971.5a'b'° (101.3) 991.4a
(94-7)
184.3 (33.8)
AE~
174.7a
(28.6) 180.9a
(32.6) 186.3a'b
(31-8)
1285.5 cT
1295.2 (95-1)
a,b,c,d
268.0 (46-2)
273.7b'c'd
J414) 256.7 (39.9)
^F"
1314.4^ (101-7) 1327.0a
(105.6) 1305.8a'b'c'd
268 8a,b,o,d
(33.2) 273.9b,c'd
(48.4) 282.5d
(40.8) 278.3° (36.6)
257.3aX
(48.1) Different letters indicate significant (p<0.05) differences between boots
52
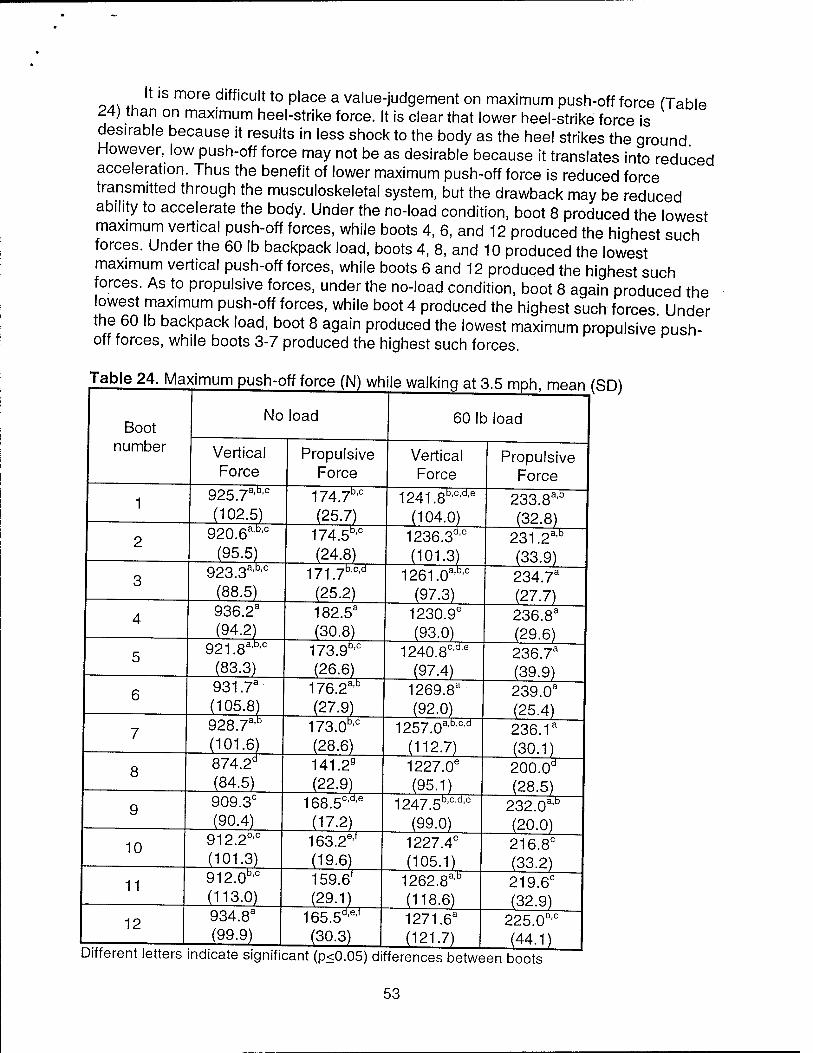
It is more difficult to place a value-judgement on maximum push-off force (Table 24) than on maximum heel-strike force. It is clear that lower heel-strike force is desirable because it results in less shock to the body as the heel strikes the ground However, low push-off force may not be as desirable because it translates into reduced acceleration. Thus the benefit of lower maximum push-off force is reduced force transmitted through the musculoskeletal system, but the drawback may be reduced ability to accelerate the body. Under the no-load condition, boot 8 produced the lowest maximum vertical push-off forces, while boots 4, 6, and 12 produced the highest such forces. Under the 60 lb backpack load, boots 4, 8, and 10 produced the lowest maximum vertical push-off forces, while boots 6 and 12 produced the highest such forces. As to propulsive forces, under the no-load condition, boot 8 again produced the lowest maximum push-off forces, while boot 4 produced the highest such forces Under the 60 lb backpack load, boot 8 again produced the lowest maximum propulsive push- off forces, while boots 3-7 produced the highest such forces.
Table 24. Maximum push-off force (N) while walking at 3.5 mph, mean (SD)
Boot number
No load
Vertical Force
925.7a,b'c
(102.5) 920.6aAc
(95.5) 923.3
(88.5)
,a,b,c
Propulsive Force
174.7b'° (25.7)
Bx" 174.5 (24.8)
60 lb load
Vertical Force
1241.8b,c,d,e
(104.0)
936.2E
(94.2) 921.8a,b,c
(83.3) 931. T (105.8)
iTF
8
10
11
12
928.7 (101.6) 874.2C
(84.5)
171.7b'c'd
(25.2) 182.5a
(30.8) 173.9b'c
(26.6) 176.2 (27.9)
~ä$~
1236.3 (101.3)
^i"
1261.0a,bc
(97-3)
Propulsive Force
233.8a'b
(32.8)
1230.96
(93.0) 12408cd,e
(97-4)
173.0b'c
(28.6)
909.3C
(90.4) Äc" 912.2
(101.3) 912.0b'c
(113.0) 934.8a
(99.9)
141.29
(22.9) 168.5
(17-2)
c'd.e
163.2 (19-6)
eT
159.6* {29/0
165.5d:e'f
(30.3)
1269.8£
(92.0) 1257.0a'b'c'd
1227.06
(95-1)
231.2 (33.9)
tr
234.7a
(27.7) 236.8a
(29.6) 236.7a
(39.9) 239.0a
(25.4) 236.1a
(30-1)
12475b,c,d,e
(99.0) 1227.46
(105.1) 1262.8
(118-6)
a5~
1271.63
(121.7)
200.0° (28-5)
232.0 (20.0)
TF
216.8C
(33.2) 219.6C
(32.9) 225.0b'c
(44-1) Different letters indicate significant (p<0.05) differences between boots
53
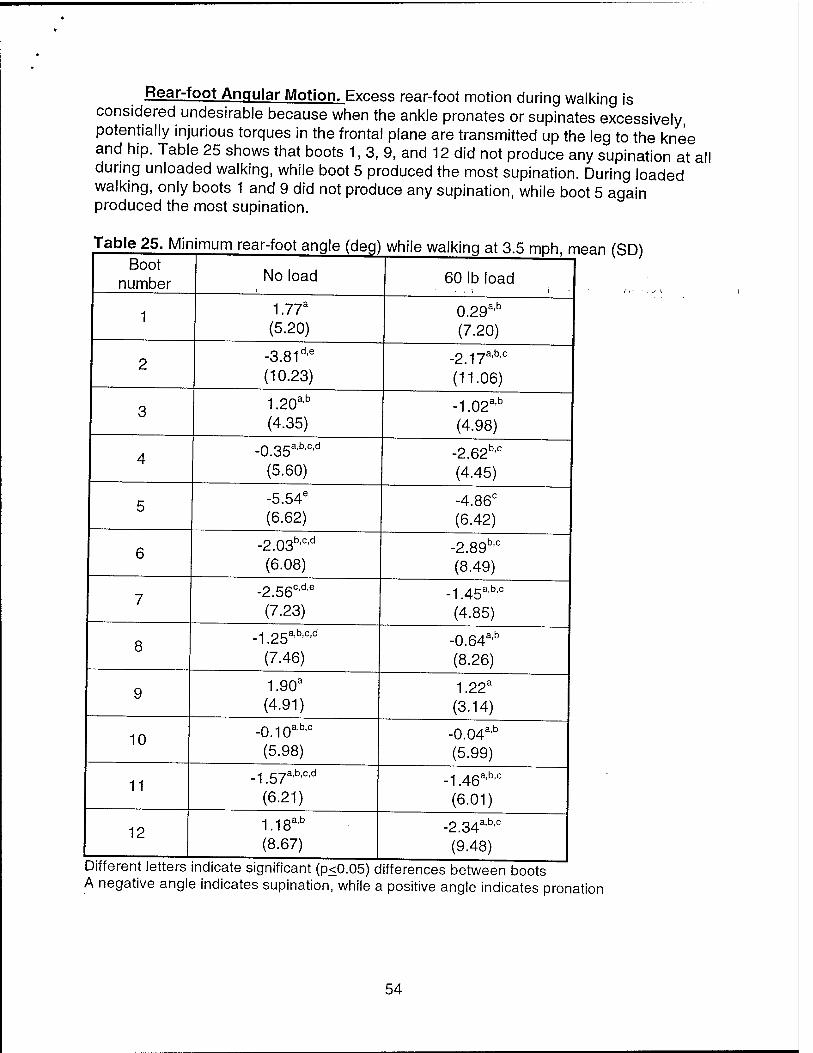
Rear-foot Angular Motion. Fxnfiss rear-foot motion during walking is considered undesirable because when the ankle pronates or supinates excessively, potentially injurious torques in the frontal plane are transmitted up the leg to the knee and hip. Table 25 shows that boots 1, 3, 9, and 12 did not produce any supination at all during unloaded walking, while boot 5 produced the most supination. During loaded walking, only boots 1 and 9 did not produce any supination, while boot 5 again produced the most supination.
Boot number No load 60 lb load
1 1.77a
(5.20) 0.29a'b
(7.20)
2 -3.81de
(10.23) (11.06)
3 1.20a'b
(4.35) -1.02a'b
(4.98)
4 _035a,b,c,d
(5.60) -2.62b'c
(4.45)
5 -5.54e
(6.62) -4.86c
(6.42)
6 -2.03b'c'd
(6.08) -2.89b'c
(8.49)
7 -2.56c'd'e
(7.23)
.145a,b,c
(4.85)
8 -1.25a'b'c'd
(7.46) -0.64a'b
(8.26)
9 1.90a
(4.91) 1.22a
(3.14)
10 _010a,b,c
(5.98) -0.04ab
(5.99)
11 -1.57a'b'c'd
(6.21) -1.46a'b'c
(6.01)
12 1.18ab
(8.67)
_234a,b,c
(9.48) Different letters indicate significant (p<0.05) differences between boots A negative angle indicates supination, while a positive angle indicates pronation
54
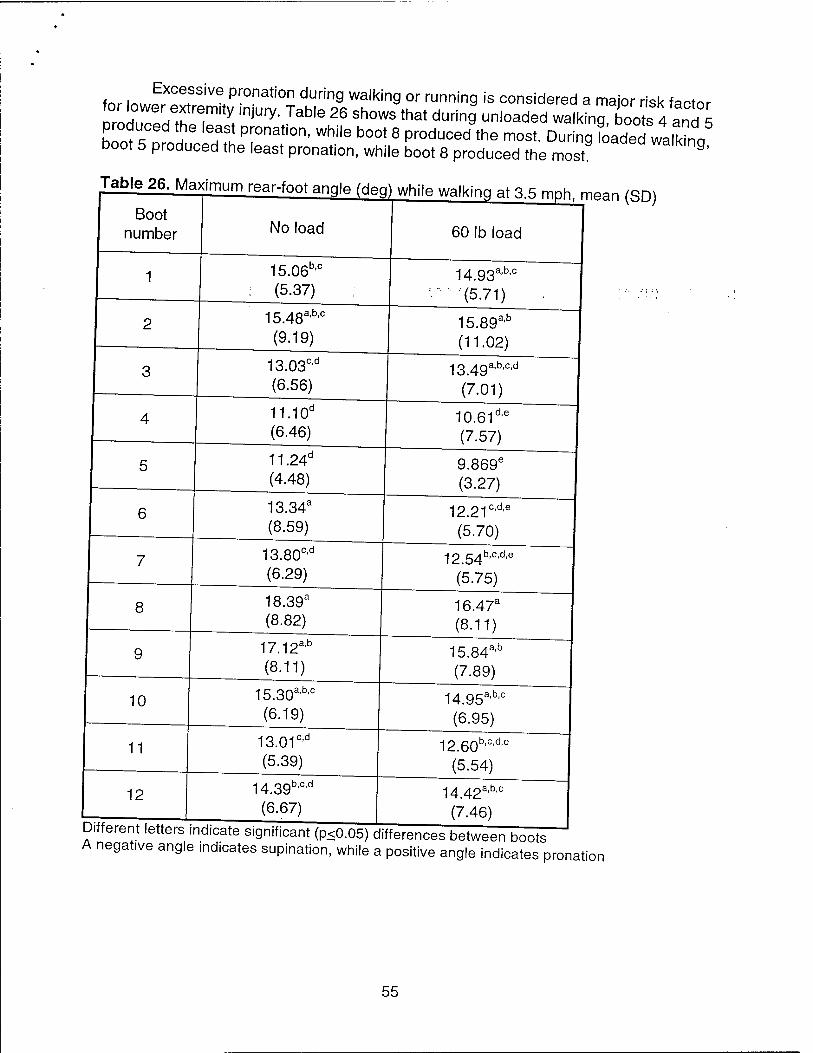
fnr. Excefsive Pr°nation during walking or running is considered a major risk fartnr
»IZ17ZT\ mJUry- Tab,e 26 Sh°WS that durin9 un,oaded walkinX s 4 and 5 produced the least pronat.on, while boot 8 produced the most. During loaded walkho boot 5 produced the least pronation, while boot 8 produced the most 9'
Boot number No load
a Wime waiMiiy cti o.o mpn
60 lb load
r
1 15.06b'c
: (5.37) 14.93a'b'c
v- '(5.71)
2 15.48a'b'c
(9.19) 15.89a'b
(11.02)
3 I 13.03c'd
(6.56) 1349a,b,c,d
(7.01)
4 11.10d
(6.46) 10.61d'e
(7.57)
5 11.24d
(4.48) 9.869e
(3.27)
6 13.34a
(8.59) 12.21c'd'e
(5.70)
7 13.80c'd
(6.29) 1254b,c,d,e
(5.75)
8 18.39a
(8.82) 16.47a
(8.11)
9 17.12a'b
(8.11) 15.84a,b
(7.89)
10 15.30aÄC
(6.19) 14.95a'b'c
(6.95)
11 13.01c'd
(5.39) 12.60b'c'd'e
(5.54)
12
Different letter« i
143gb,c,d
(6.67) 1442a,b,c
(7.46)
mean (SD)
A„ ,. , . ,. a \r-i"-«*-v uiiiciciiocö ueiween Doors A negative angle indicates supination, while a positive angle indicates pronation
55
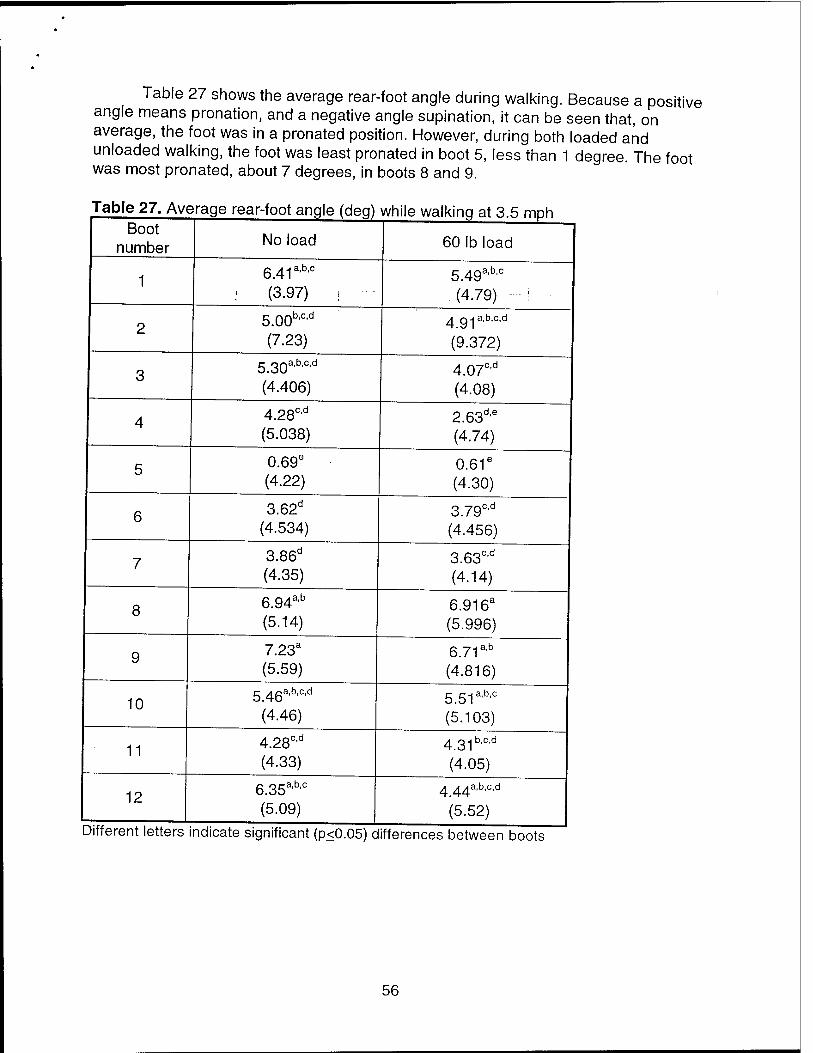
*
*
Table 27 shows the average rear-foot angle during walking. Because a positive angle means pronation, and a negative angle supination, it can be seen that, on average, the foot was in a pronated position. However, during both loaded and unloaded walking, the foot was least pronated in boot 5, less than 1 degree. The foot was most pronated, about 7 degrees, in boots 8 and 9.
Table 27. Average rear-foot angle (deg) while walking at 3.5 moh Boot
number No load 60 lb load
1 641a,b,c
(3.97) •. 5.49a'b'c
(4.79) ;
2 5.00b'c'd
(7.23)
491a,b,c,d
(9.372)
3 530a,b,c,d
(4.406) 4.07c'd
(4.08)
4 4.28c'd
(5.038) 2.63d'e
(4.74)
5 0.69e
(4.22) 0.61e
(4.30)
6 3.62d
(4.534) 3.79cd
(4.456)
7 3.86d
(4.35) 3.63c'd
(4.14)
8 6.94a'b
(5.14) 6.916a
(5.996)
9 7.23a
(5.59) 6.71 a'b
(4.816)
10 5_46a,b,c,d
(4.46) 5.51aÄC
(5.103)
11 428c,d
(4.33)
431b,c,d
(4.05)
12 ...
6.35a'b'c
(5.09)
4 ^a.b.c.d
(5.52)
Different letters indicate significant (p<0.05) differences between boots
56
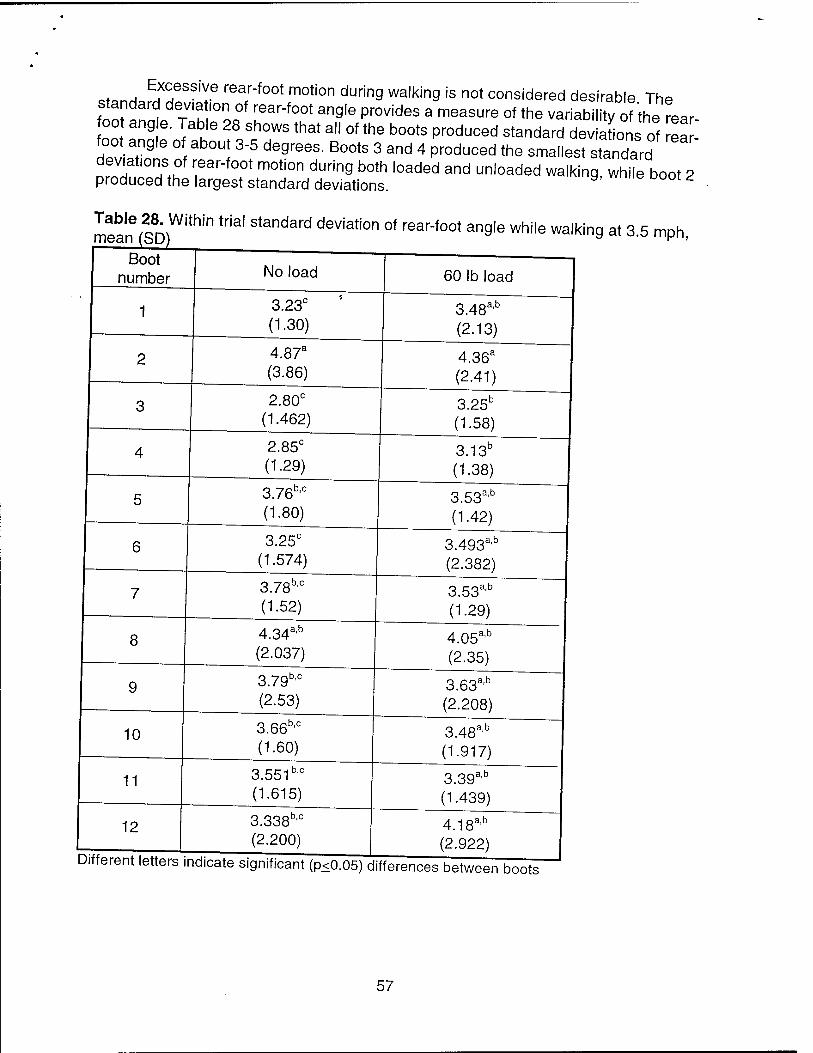
oto ri Ej"fssive rear-^ot motion during walking is not considered desirable The standard deviation of rear-foot angle provides a measure of the variability of the rear foot ange. Table 28 shows that all of the boots produced standard deviations cS ear-" foo tangle o about 3-5 degrees. Boots 3 and 4 produced the smallest standard
n^HSth T T m°ti0n duHng b°th l0aded and Unloaded walkin9. while boot 2 produced the largest standard deviations.
meane(SD)With'n ^ ^"^ ^^^ °f rear"f°0t angle WhNe Walkin9 at 3-5 mph. Boot
number No load 60 lb load
1 3.23c
(1.30) 3.48a'b
(2.13)
2 4.87a
(3.86) 4.36a
(2.41)
3 2.80c
(1.462) 3.25b
(1.58)
4 2.85c
(1.29) 3.13b
(1.38)
5 3.76b'c
(1.80) 3.53a'b
(1.42)
6 3.25c
(1.574) 3.493a'b
(2.382)
7 3.78b'c
(1.52) 3.53a'b
(1.29)
8 4.34a'b
(2.037) 4.05a'b
(2.35)
9 3.79bc
(2.53) 3.63a'b
(2.208)
10 3.66b'c
(1.60) 3.48a'b
(1.917)
11 3.551b'c
(1.615) 3.39a'b
(1.439)
12 3.338b'c
(2.200) 4 18a,b
(2.922)
57
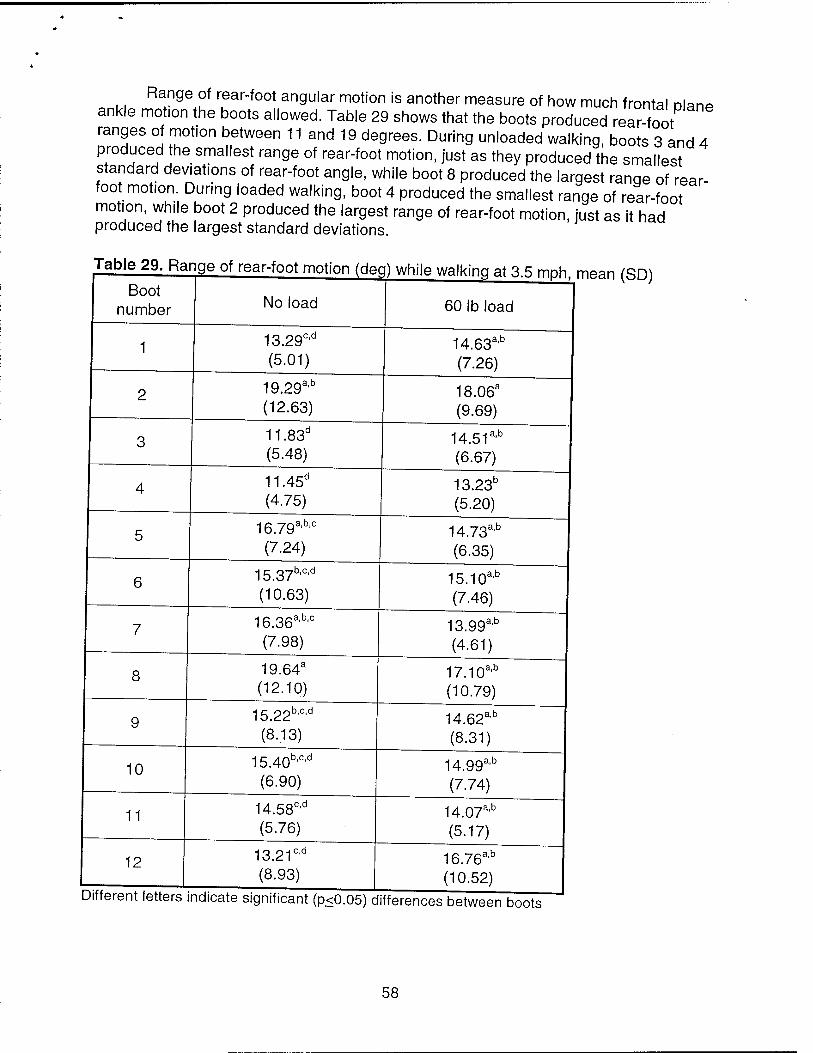
Range of rear-foot angular motion is another measure of how much frontal plane ankle motion the boots allowed. Table 29 shows that the boots produced rear-foot ranges of motion between 11 and 19 degrees. During unloaded walking, boots 3 and 4 produced the smallest range of rear-foot motion, just as they produced the smallest standard deviations of rear-foot angle, while boot 8 produced the largest ranqe of rear foot motion. During loaded walking, boot 4 produced the smallest range of rear-foot motion, while boot 2 produced the largest range of rear-foot motion, just as it had produced the largest standard deviations
Table 29. Range of rear-foot motion (deq
Boot number
1
7
8
10
11
12
No load
13.29c'd
(5.01) a,b 19.29
(12.63)
11.83d
(5.48)
11.45d
(4.75) a,b,c 16.79
(7.24)
15.37b'°'d
(10.63) a,b,c 16.36
(7.98)
19.64a
(12.10)
15.22b'c'd
(8.13)
15.40 (6.90)
b,c,d
14.58c'd
(5.76)
13.21 (8.93)
cd
while walking at 3.5 mph mean (SD)
60 lb load
14.63 (7.26)
a.b
18.06a
(9.69) a,b 14.51
(6.67)
13.23b
(5.20)
14.73a'b
(6.35) ,a,b 15.10
(7.46)
13.99ab
(4.61)
17.10a'b
(10.79) ,a,b 14.62
(8.31) ,a,b 14.99
(7.74)
14.07a'b
(5.17) a,b 16.76
(10.52) Different letters indicate significant (p<0.05) differences between boots
58
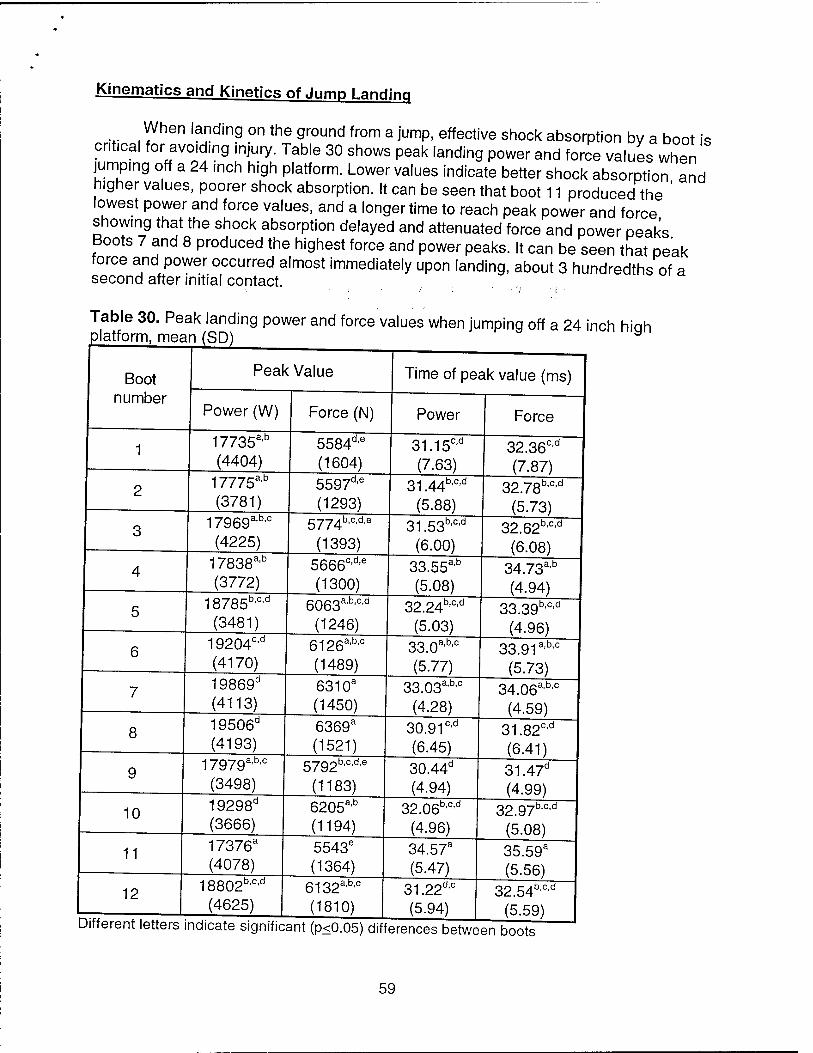
Kinematics and Kinetics of Jump Landina
When landing on the ground from a jump, effective shock absorption bv a boot is critical for avoiding injury. Table 30 shows peak landing power and force values when jumping off a 24 inch high platform. Lower values indicate better shock absorption and higher values, poorer shock absorption. It can be seen that boot 11 produced the ' lowest power and force values, and a longer time to reach peak power and force showing that the shock absorption delayed and attenuated force and power peaks Boots 7 and 8 produced the highest force and power peaks. It can be seen that peak force and power occurred almost immediately upon landing, about 3 hundredths of a second after initial contact.
Table 30. Peak landing power and force values when jumping off a 24 inch hioh platform, mean (SD) ^^____
Boot number
7
8
10
11
12
Peak Value
Power (W)
17735a'b
(4404)
17775 (3781)
a,b
17969a'b'c
(4225)
17838a'b
(3772)
18785b'c'd
(3481)
19204c'd
(4170)
19869° (4113)
19506° (4193)
17979 (3498)
a,b,c
19298d
(3666) 17376a
(4078) 18802b,c,d
(4625)
Force (N)
5584d'e
(1604) 5597d'e
(1293) b.c.d.e 5774
(1393) 5666°'d'e
(1300) 6063a,b,c,d
(1246) g126a,b,c
(1489)
6310a
(1450)
6369a
(1521) b,c,d,e 5792
(1183)
6205a'b
(1194)
5543e
(1364) 6132a,b,c
(1810)
Time of peak value (ms)
Power
31.15c'd
(7.63)
31.44b'c'd
(5.88)
31.53b'c'd
(6.00)
33.55a'b
(5.08)
32.24b'c'd
(5.03)
33.0a'b'c
(5.77)
33.03 (4.28)
a,b,c
30.91 (6.45)
cd
30.44d
(4.94)
32.06b,c'd
(4.96)
34.57a
(5.47) 31.22 (5.94)
,d.c
Force
32.36c,d
(7.87) 3278b,c,d
(5.73) 3262b,c,d
(6.08)
34.73 (4.94)
a,b
33.39 (4.96)
b,c,d
33.91 a,b'c
(5.73)
34.06a'b'c
(4.59)
31.82cd
(6.41)
31.47d
(4.99)
32.97 (5.08)
'b.c.d
35.59a
(5.56) 32.54b'c'd
(5.59) Different letters indicate significant (p<0.05) differences between boots
59
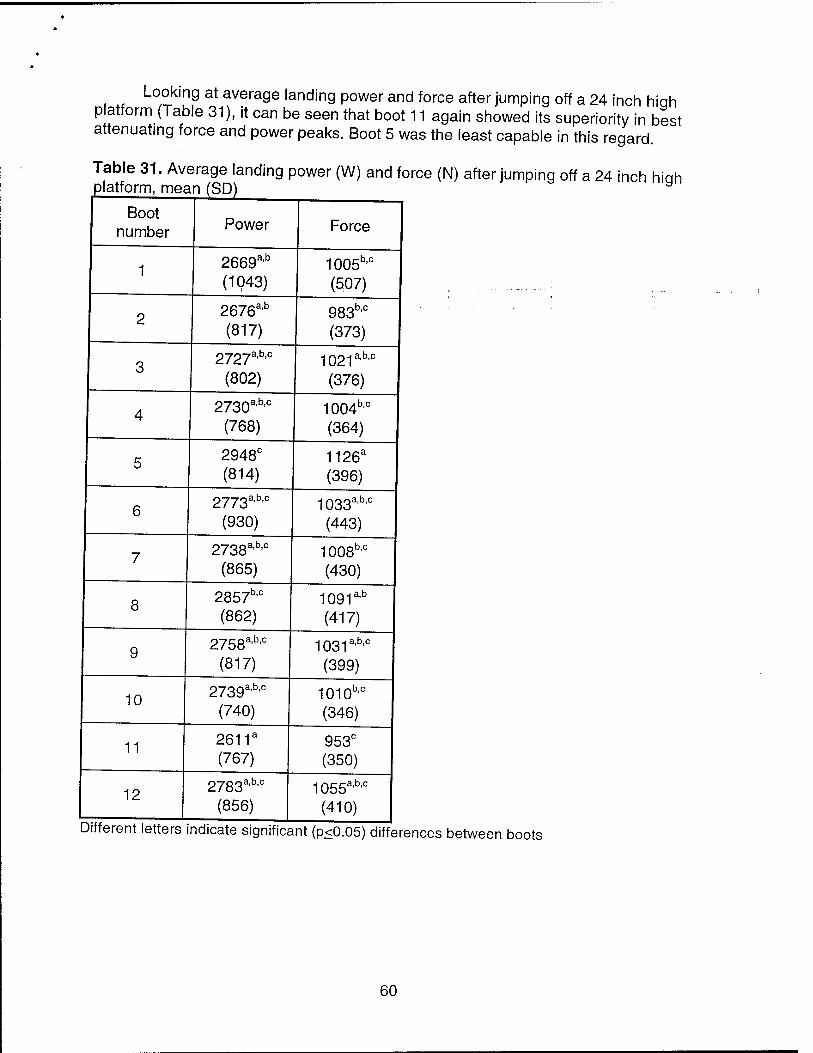
Looking at average landing power and force after jumping off a 24 inch high platform (Table 31), it can be seen that boot 11 again showed its superiority in best attenuating force and power peaks. Boot 5 was the least capable in this regard.
Table 31. Average landing power (W) and force (N) after jumping off a 24 inch hiah platform, mean (SD) a
Boot number Power Force
1 2669a'b
(1043) 1005b'c
(507)
2 2676a'b
(817) 983b'c
(373)
3 2727a,b,c
(802)
1021a,b,c
(376)
4 2730a,b,c
(768) 1004b,c
(364)
5 2948c
(814) 1126a
(396)
6 2773a,b,c
(930) 1033ab'c
(443)
7 2738a,b,c
(865) 1008bc
(430)
8 2857b'c
(862) 1091a'b
(417)
9 275ga,b,c
(817)
1031a,b,c
(399)
10 273ga,b,c
(740) 1010b'c
(346)
11 2611a
(767) 953° (350)
12 2783a,b,c
(856) 1055abc
(410)
Different letters indicate significant (p<0.05) differences between boots
60
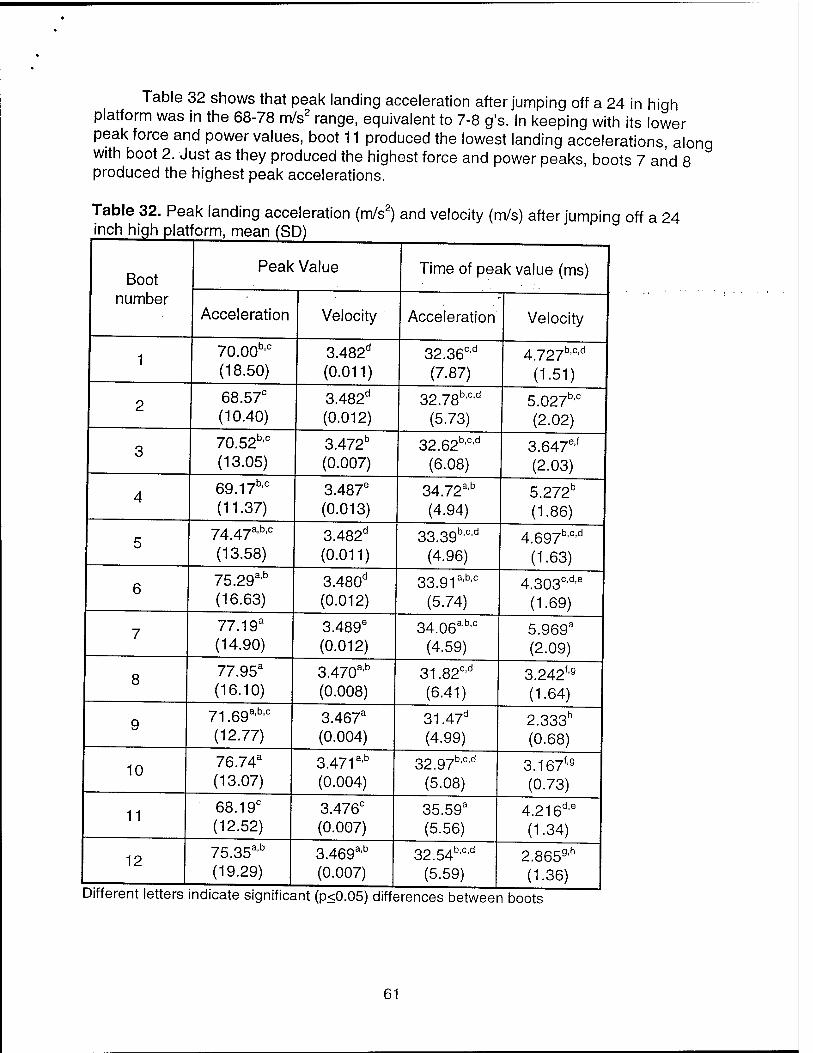
Table 32 shows that peak landing acceleration after jumping off a 24 in high platform was in the 68-78 m/s2 range, equivalent to 7-8 g's. In keeping with its lower peak force and power values, boot 11 produced the lowest landing accelerations, along with boot 2. Just as they produced the highest force and power peaks, boots 7 and 8 produced the highest peak accelerations.
Table 32. Peak landing acceleration (m/s2) and velocity (m/s) after jumping off a 24 inch high platform, mean (SD)
Boot number
Peak Value Time of peak value (ms)
Acceleration Velocity Acceleration Velocity
1 70.00bc
(18.50) 3.482d
(0.011) 32.36c'd
(7.87)
4727b,c,d
(1.51)
2 68.57c
(10.40) 3.482d
(0.012)
3278b,c,d
(5.73) 5.027b'° (2.02)
3 70.52b'c
(13.05) 3.472b
(0.007)
3262b,c,d
(6.08) 3.647e'f
(2.03)
4 69.17bc
(11.37) 3.487e
(0.013) 34.72a'b
(4.94) 5.272b
(1.86)
5 7447a,b,c
(13.58) 3.482d
(0.011) 33.39b'c,d
(4.96) 4.697b'c'd
(1.63)
6 75.29a'b
(16.63) 3.480d
(0.012) 33.91 a'b,c
(5.74)
4303cd,e
(1.69)
7 77.19a
(14.90) 3.489e
(0.012)
3406a,b,c
(4.59) 5.969a
(2.09)
8 77.95a
(16.10) 3.470a'b
(0.008) 31.82c'd
(6.41) 3.242f'9
(1.64)
9 71.69ab'c
(12.77) 3.467a
(0.004) 31.47d
(4.99) 2.333h
(0.68)
10 76.74a
(13.07) 3.471 a'b
(0.004)
32g7b,c,d
(5.08) 3.167f'9
(0.73)
11 68.19c
(12.52) 3.476c
(0.007) 35.59a
(5.56) 4.216d'e
(1.34)
12 75.35ab
(19.29) 3.469a'b
(0.007) 32.54b'c'd
(5.59) 2.8659'h
(1.36) Different letters indicate significant (p<0.05) differences between boots
61
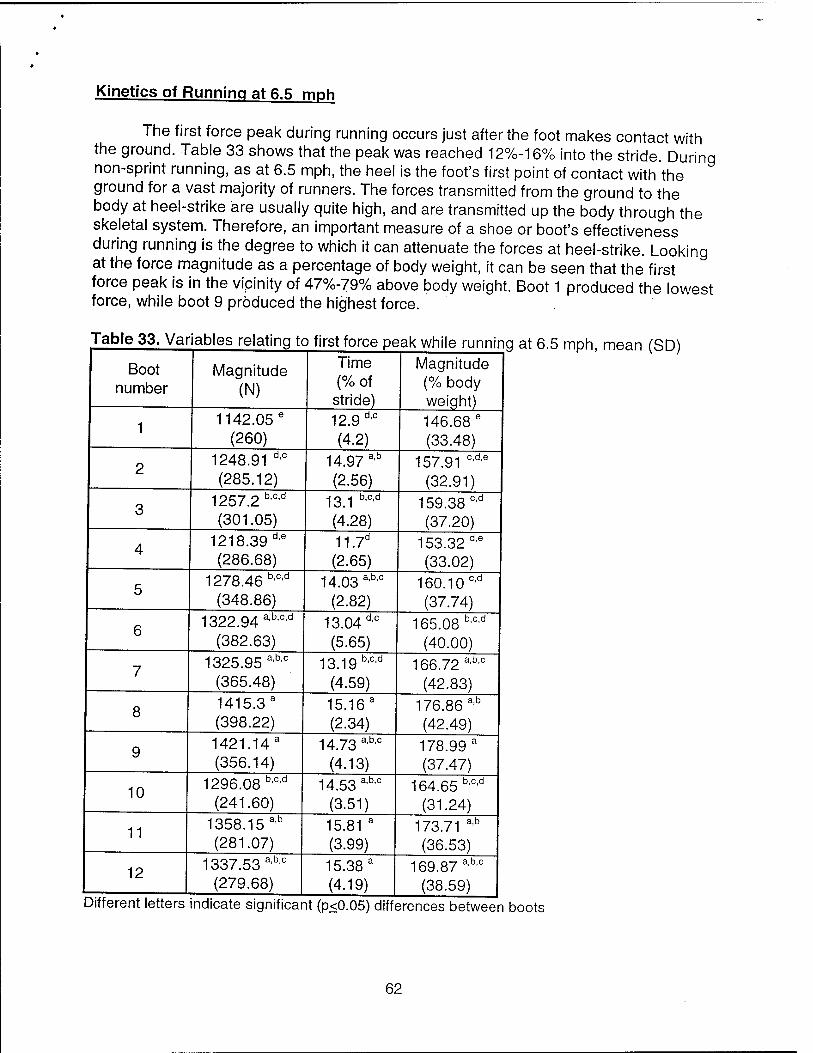
Kinetics of Running at 6.5 moh
The first force peak during running occurs just after the foot makes contact with the ground. Table 33 shows that the peak was reached 12%-16% into the stride. During non-sprint running, as at 6.5 mph, the heel is the foot's first point of contact with the ground for a vast majority of runners. The forces transmitted from the ground to the body at heel-strike are usually quite high, and are transmitted up the body through the skeletal system. Therefore, an important measure of a shoe or boot's effectiveness during running is the degree to which it can attenuate the forces at heel-strike. Looking at the force magnitude as a percentage of body weight, it can be seen that the first force peak is in the vicinity of 47%-79% above body weight. Boot ,1 produced the lowest force, while boot 9 produced the highest force.
Table 33. Variables relating to first force peak while running at 6.5 mph, mean (SD)
Boot number
1
8
10
11
12
Magnitude (N)
1142.05 s
(260)
1248.91 (285.12)
d,c
1257.2 bcd
(301.05)
1218.39 de
(286.68)
1278.46 b'c'd
(348.86) 1322.94
(382.63)
a,b,c,d
1325.95 aÄC
(365.48)
1415.3 a
(398.22) 1421.14 a
(356.14)
1296.08 b'c'd
(241.60)
1358.15 (281.07)
a,b
1337.53 ab,c
(279.68)
Time (% of
stride) 12.9 (4.2)
d,c
14.97 (2-56)
a,b
b,c,d 13.1 (4.28)
11.7° (2-65)
14.03 (2.82)
a,b,c
13.04 dc
(5.65)
13.19 (4.59)
b,c,d
15.16 a
(2.34)
14.73 (4.13)
a,b,c
14.53 a'blC
(3.51)
15.81 a
(3.99)
15.38 a
(4.19)
Magnitude (% body weight) 146.68 e
(33.48)
157.91 (32.91)
c,d,e
159.38 c,d
(37.20)
153.32 (33.02)
d,e
160.10 (37.74)
cd
165.08 (40.00)
b,c,d
166.72 a'b'c
(42.83)
176.86 (42.49)
a,b
178.99 a
(37.47)
164.65 b'c'd
(31.24)
173.71 (36.53)
a,b
169.87 ab'c
(38.59) Different letters indicate significant (p<0.05) differences between boots
62
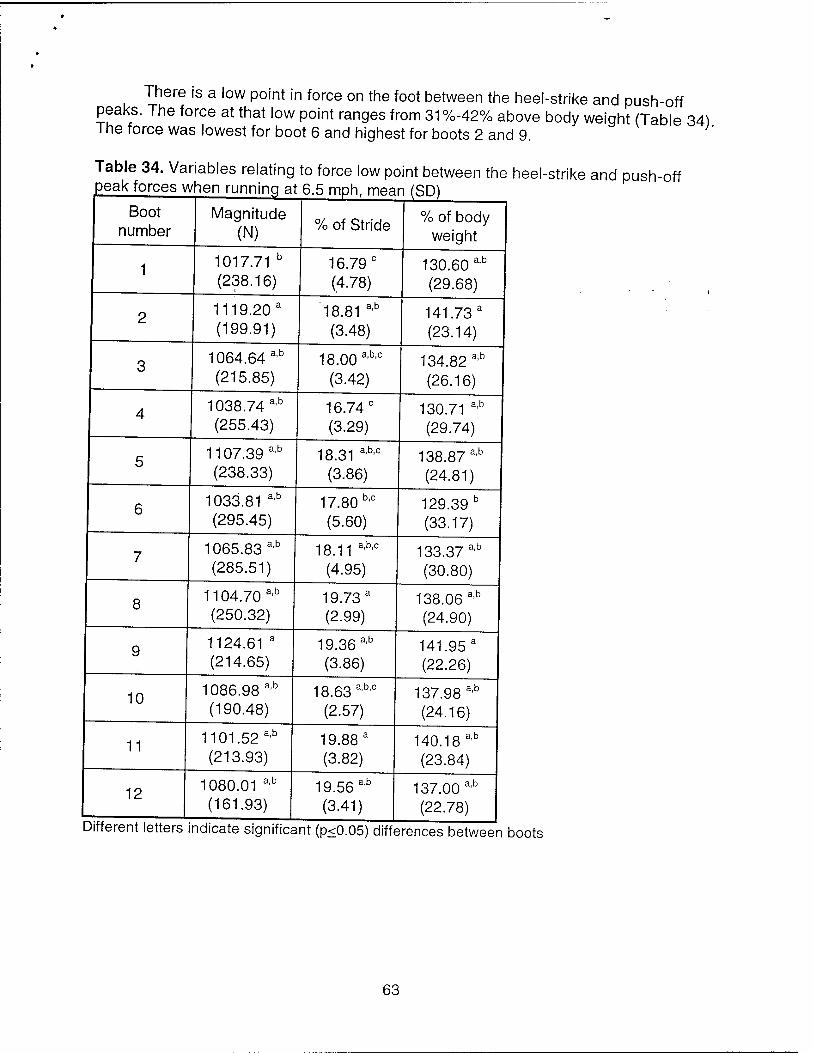
*
• •
There is a low point in force on the foot between the heel-strike and push-off peaks. The force at that low point ranges from 31%-42% above body weight (Table 34) The force was lowest for boot 6 and highest for boots 2 and 9.
Table 34. Variables relating to force low point between the heel-strike and push-off peak forces when running at 6.5 mph, mean fSD)
Boot number
Magnitude (N) % of Stride % of body
weight
1 1017.71 b
(238.16) 16.79 c
(4.78) 130.60 ab
(29.68)
2 1119.20 a
(199.91) 18.81 a'b
(3.48) 141.73 a
(23.14)
3 1064.64 a'b
(215.85) 18.00 a'b'c
(3.42) 134.82 a'b
(26.16)
4 1038.74 ab
(255.43) 16.74 c
(3.29) 130.71 a'b
(29.74)
5 1107.39 ab
(238.33) 18.31 a'b'c
(3.86) 138.87 ab
(24.81)
6 1033.81 ab
(295.45) 17.80 b'c
(5.60) 129.39 b
(33.17)
7 1065.83 a'b
(285.51) 18.11 a'b'c
(4.95) 133.37 a'b
(30.80)
8 1104.70 a'b
(250.32) 19.73a
(2.99) 138.06 ab
(24.90)
9 1124.61 a
(214.65) 19.36 ab
(3.86) 141.95 a
(22.26)
10 1086.98 ab
(190.48) 18.63 ab'°
(2.57) 137.98 a'b
(24.16)
11 1101.52 ab
(213.93) 19.88 a
(3.82) 140.18 ab
(23.84)
12 1080.01 ab
(161.93) 19.56 ab
(3.41) 137.00 a'b
(22.78) different letters ndicate signifies int (p<0.05) diffe
63
'rences betweer l boots
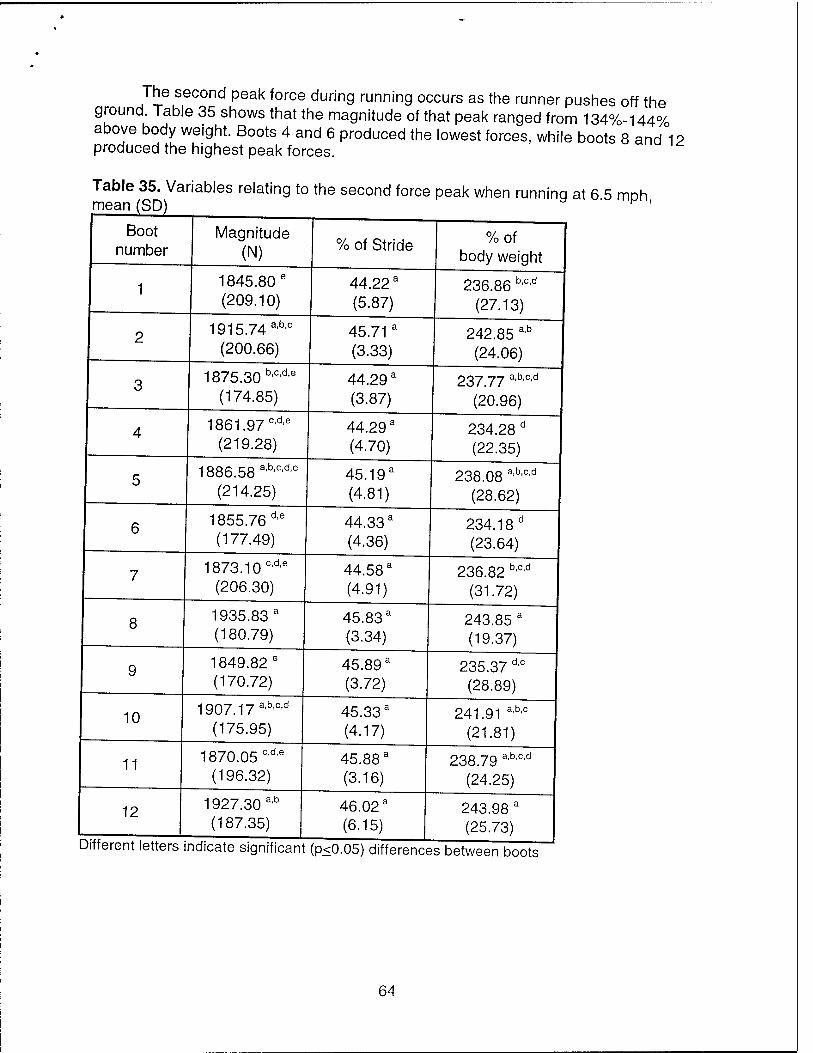
The second peak force during running occurs as the runner pushes off the ground. Table 35 shows that the magnitude of that peak ranged from 134%-144% above body weight. Boots 4 and 6 produced the lowest forces, while boots 8 and 1? produced the highest peak forces.
Table 35. Variables relating to the second force peak when runninq at 6 5 moh mean (SD) K '
I Boot number
Magnitude (N) % of Stride %of
body weight
1 1845.80 e
(209.10) 44.22 a
(5.87) 236.86 b'c'd
(27.13)
2 1915.74 abc
(200.66) 45.71a
(3.33) 242.85 a'b
(24.06)
3 1875.30 b'cde
(174.85) 44.29 a
(3.87) 237.77 a'b,c'd
(20.96)
4 1861.97 c,d,e
(219.28) 44.29a
(4.70) 234.28 d
(22.35)
5 1886.58 a'b,c,d'e
(214.25) 45.19a
(4.81) 238.08 a'b'c'd
(28.62)
6 1855.76 de
(177.49) 44.33a
(4.36) 234.18 d
(23.64)
7 1873.10 c'd,e
(206.30) 44.58a
(4.91) 236.82 b,c,d
(31.72)
8 1935.83 a
(180.79) 45.83a
(3.34) 243.85 a
(19.37)
9 1849.82 s
(170.72) 45.89a
(3.72) 235.37 d'c
(28.89)
10 1907.17 a'b'c,d
(175.95) 45.33 a
(4.17) 241.91 a'b'c
(21.81)
11 1870.05 c'de
(196.32) 45.88 a
(3.16) 238.79 a'b'c'd
(24.25)
12 1927.30 ab
(187.35) 46.02 a
(6.15) 243.98 a
(25.73)
64
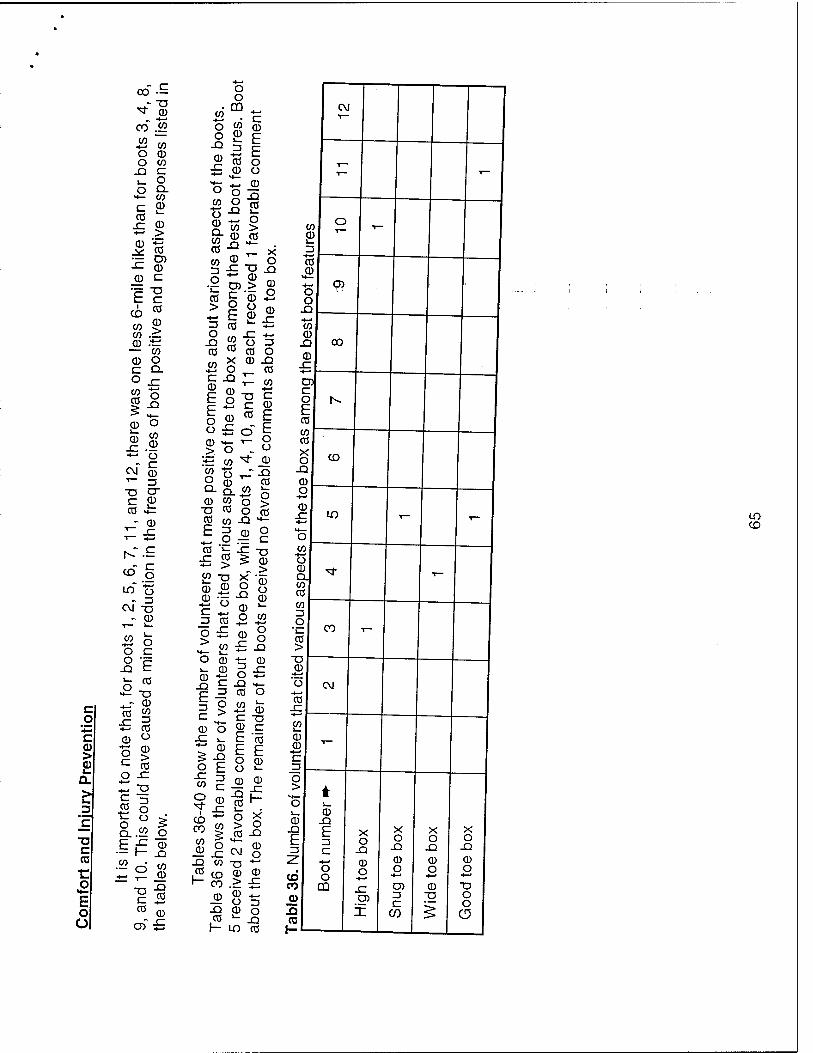
c o
"•J3 c <D > 0) k-
Q. >
[c ■n c CB
r o E o o
oo -^
^ CD
CO w
■fr-
o o XI
03
(1)
0
to CD to c o Q. to CD
0
"•4—*
CO D) CD C
IE cc CD >
CO o Q.
CD
CO CO
_0
CD c o CO cd
CD O
CD CO
X .9 ■— O
CM~ Q5 T- -j
-D O-
cc £: - CD
K.E
co §
LO" Ü
CM "D - CD
5 c3 o c O c
X! £=
^r CD « w x 5 *-> TO CD ° O §
o x ■4—»
iS o ^ ° R.22 E F "CD CO
5 o
r— \u r— X2
v- CO
•o "9 c .2 CO
CO ■♦-»
o o X
CD
o o CD
li 3 E cd o Q> °
■fc ~ CD ° o X Ä ° CC (11 *■' CJ X to > S- CD cd
co £ II o =5 £ ^3 x O CD •= ö)> cd £ CD > o Ü 4-EfD
CM
13 o X cd
£ 0 C X CD
E E o
CD O
•4—»
-x cd ^ £
3 Ü 3 10 cd o X CD X
cd co
CD
CD c cd
CD
C CD
E E o ü
CO
o . CO "* _CD Ü —"X
- CD ' cd
0 W O > ■D cd o cd cd co x *•-
■C T3
E ? cd x x cd 5 ■fr- ^ "^
cd >
CD © CD ~
4—« U C *-, 3 cd a- O CD j_ CD CD ~
II
X o X
CD O
CD
CD >
'CD Ü CD
CO ■fr-*
o o X
0 CD
CD O X !_ ~ CD
^ -9 X 3 to c
2 CD
CD CO
_0 _£ X CO £ CD I- CO
_0 X cd f-
co
t; CD
o£ X W- cd o
£ CD C T3 CD C
II O CD Ü >- CD CD
cd ^
> S cd x
CM CD 0
TS -4—'
CD CD > X
•+-» CD ^__, O -I CD n
X m cd
to CD
cd CD
H— •4—' o o X
CO CD X
CD X
c o E cd to cd
x o X
CD O
CD X
CO ■*—'
Ü CD Q. CO cd
to
g
cd >
T3 CD
•4—»
'ü •4—»
cd x
2 CD CD
■fr- C
o >
03
CO
CD
ID CD
CO
CM
CD X
E 3
CO co
X CO »-
CD X
E zs c
o o
CD
X o X
CD O
D3
X
x o X
CD o a» c
<Z)
X o X 0 O
0 T3
X o X 0 o
■*—'
T3 O O
CD
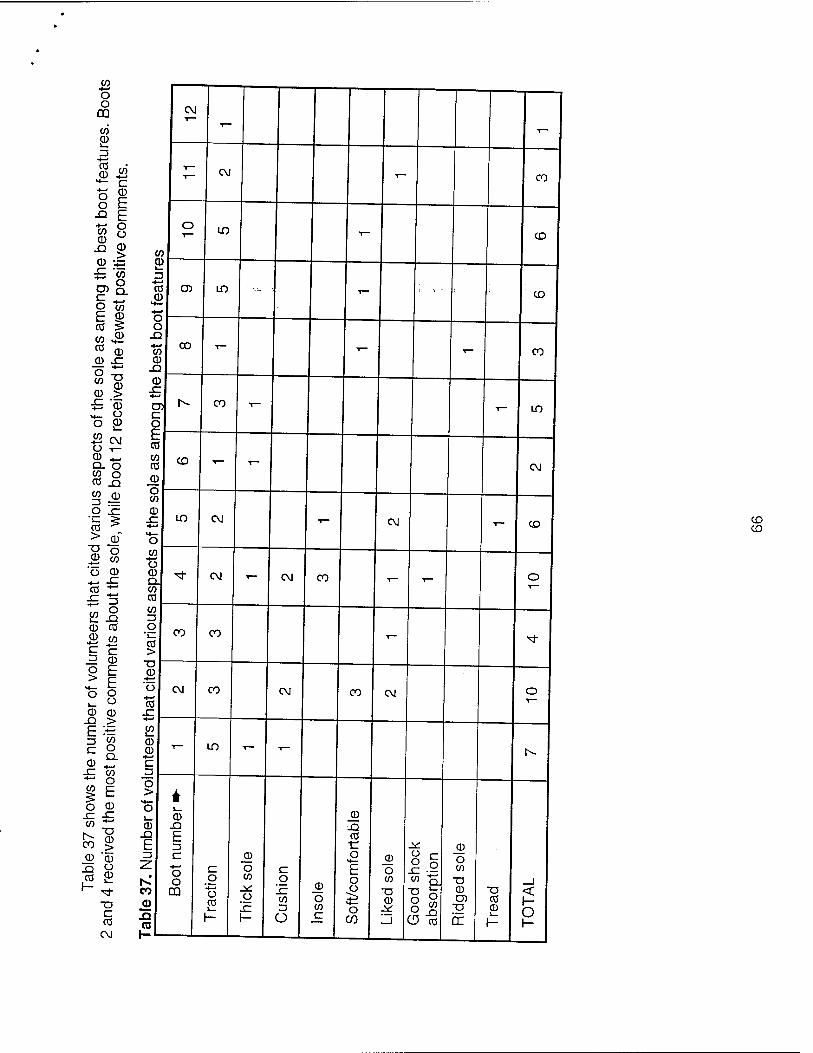
CO
o o
CÜ
to CD
CO CD
M— ■f-* o o Xi
CO
a CD E E
X2 o
CD •*=
»a o to E § CO 5 to .2 °3 CD
_CD XT
«I CD > £ CD M- O o 2 £ C\J O T- CD H^ Q- O
CO X2 CO _^
O XT
"§ * > CD"
"^ ö o> co O CD +- -C co r
2.8 CD CO Q> co
O >
O CD E E
ö o ._ o CD CD
-Q > E S ZS C
CO O Q_
■+—< CO o
CD
CD JO A—»
% O
co ^ CD 'CD 3 o CO 2
»-* T3 O CO
CM
CM
T- -
T— CM - CO
O LO I— CD
C/3
2 = CO 0>
O) LO ■-•-■ ; ■■ T— ; -. - 1 CD
o o
X5 4—« CO
CO •«- 1- ,- CO CD
X!
CD x: •*-> D3 r- CO 1— .,_ LO L: o E CO
CO CO
CO "-- T— CM
JD o CO
CD x: LO CM
T- CM l— CD H—
Ü
Ü CD ^ CM 1- CM co T— ,_ O
CO ' ' CO
CO 3 o
*1_
CO
CO CO ■■- M"
>
(1) •*—• o CO
CM CO CM co CM o
.c CO 1_
CD CD
i— LO *- -" h- c n O >
«4— i o i_
1» CD CD CD X! X}
X2 f- CO b rs ■c *: CD
2 c o o
c CD
o o o
M—
F CD
o . ° c 2$ o
CO
N. o CO o CD
o o CO co ^ T3 _J
CO
(1)
OD •4—1 O CO
ü JO CO
Ü T3 _
CD 8 ö 5 co
CD CO
< 1-
1— .c 3 CO o XL 73 CD o CO
1- H
Ü c CD Zi ( CC 1-
CD CD
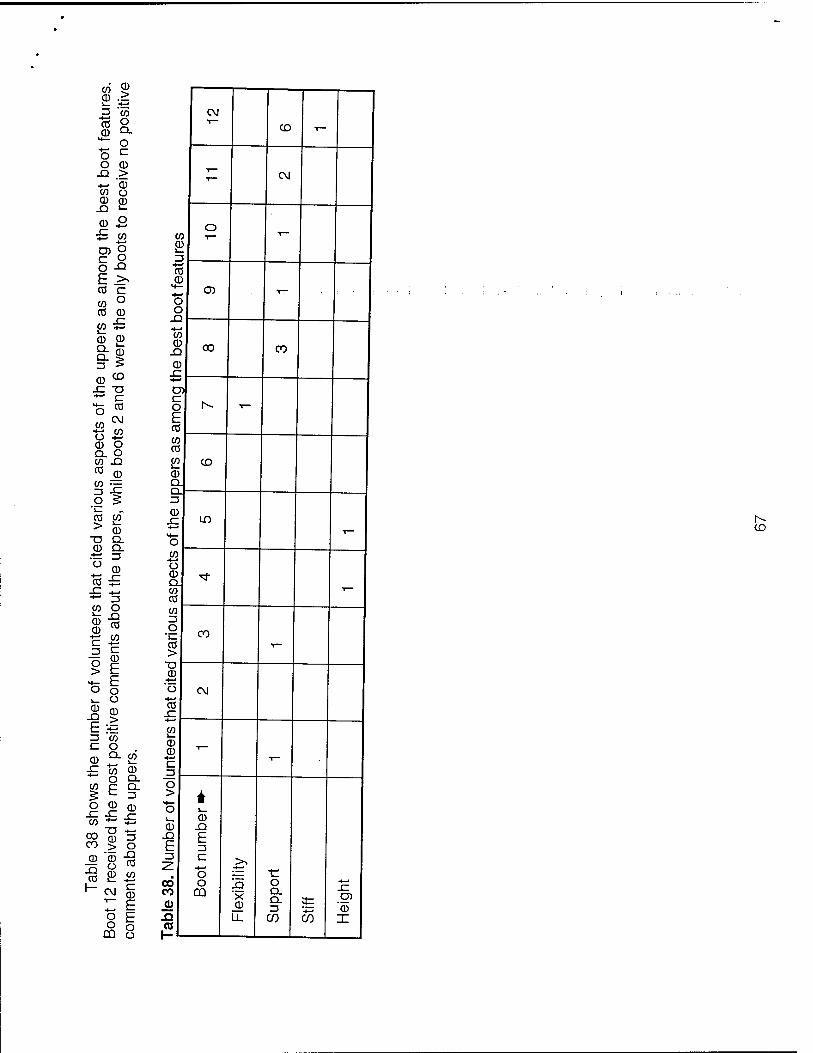
co 0 0 .^
3
CO 0
co o Q. o c >
CO Ü 0 0
O O
.Q
0 JZ co O) o c 2 o -Q E>^ 03 C
CO ° CO CD
CO += 0 o
äs 3 >
0) <o JZ T3 — C
O * CO ™ tS £ CD O
°- 8 CO -Q <° 0 CO =
.2 ^ CO co~
> CU- TS Q. 0 Q_
ü 0 CO £
JZ ^
CO O
©•§ CD u
+i CO
II ^ E o O s_ Ü
E s 3 CO c: o
O CL
§ E §■ o o „ co *" *=
8 "§ "S CO > O
® "g "co ■§ 2 £2 *- CM §
o E Cü ü
CM
CD *-
- CM
o CO
1
CD i—
Zi ■*—•
CO CD
O T^
O o
J2 - .^_-_ •*—» CO CD CO CO
CD JZ •1—»
03 C o 1^ 1—
E CO CO CO
2 CD
CD Q. Q. 3 CD
JZ LO .+-J , o CO •+-» o CD Q.
'tf- CO 1
CO CO 3 o
"l-_ CO CO T—
> u 0 •*—>
"o CM ■+-*
CO JZ
CO 1_
0 0 ~r~
■*—* c 3
o >
H— * o j_
1_ 0 0 JQ
JD E E ZI 3 c
•4—»
o 1= ■c CO o J5 o •4—»
JZ CO CQ x Q. Q. Z> 0 0 H—
'0
-s LL CO CO X £L 1
CD
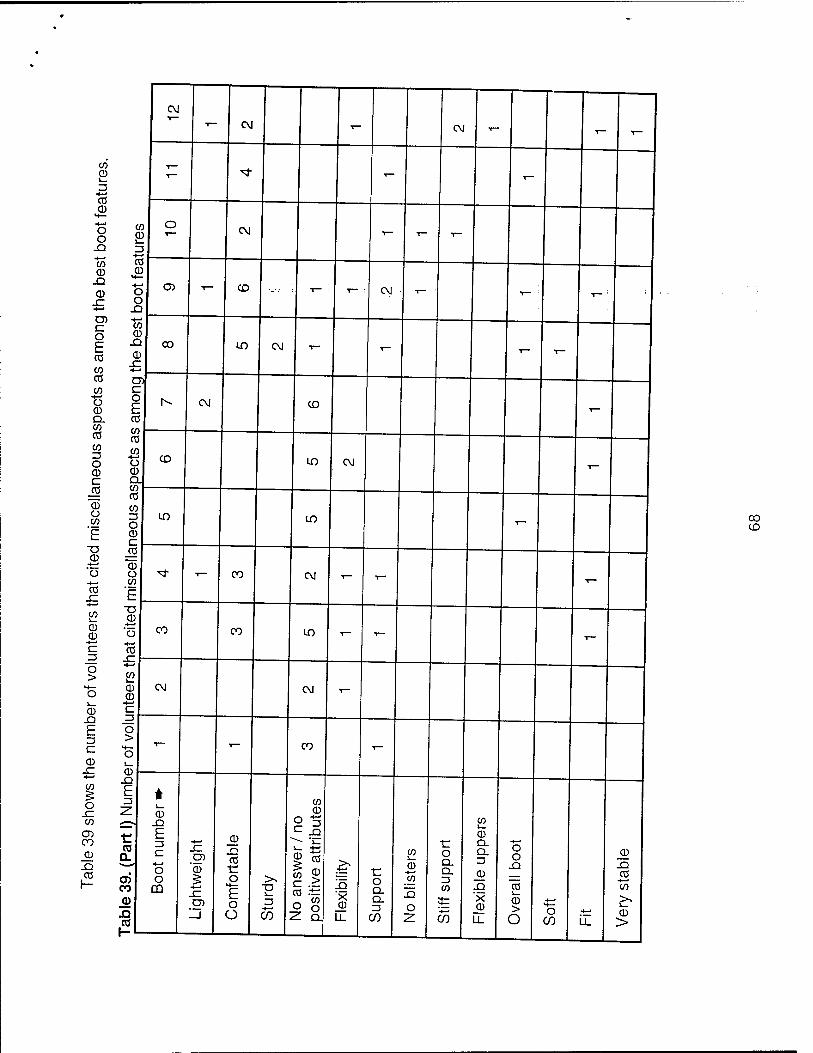
co © 3
•f—' CO ©
4—' o O
.Q
to 0)
JQ ©
C o E CO
CO CO
CO -H^ Ü CD Q. CO CO
CO
o CD c ro
"© o w
■D CD
-♦-^
"o 4—»
CO
CD CD c
_3 o >
CD
E 23 C
CD
CO
co O) CO
XJ CO
CM T_ CM - CM T—
- -
r~ "Sf
"
T—
) o ) ■>-
CM
5
(I M—
O O) ■<- CO ■_•.• T— i T- CM . T- T_ c .a CO CD .u CD
00 to CM ^ -r- 1— T-
JC +J
u > —"
o E r-« CM CD T_ CO CO CO CO *—* ü 0
CD LO CM T-
Q_ CO CO
CO 3 o
LO LO T-
CD r
_co "en
~~~
ü CO
^ 1_ CO CM 1~ r~ T-
E T5 CD •*—' o CO CO LO T- T- ,_
■♦—'
CO
CO 1_
CD CM CM ,— (I) •*->
3
"Ö >
H— o ' 'r~ CO •<- 1_
CD ■
E * 3 CO z:
(7)
CD .a E 3 C
o o
sz CD
'CD
_© o CO
o >,
CD
^ *»— i_ +-
| OB
» ^ co .*: o 8
o
(0
© "co
o Q. Q. 3
CO
CD a. a. 3
CD
-I—« o o ©
-Q CO
CO © ja en
OQ CD _l
H—
E o Ü
■a 3
co ; X CD
LL
Q. Q. 3
CO O Z
CO M—
CO
X CD
LL
CO
© > O CO LL
CO
© >
f-L 1
CO CD
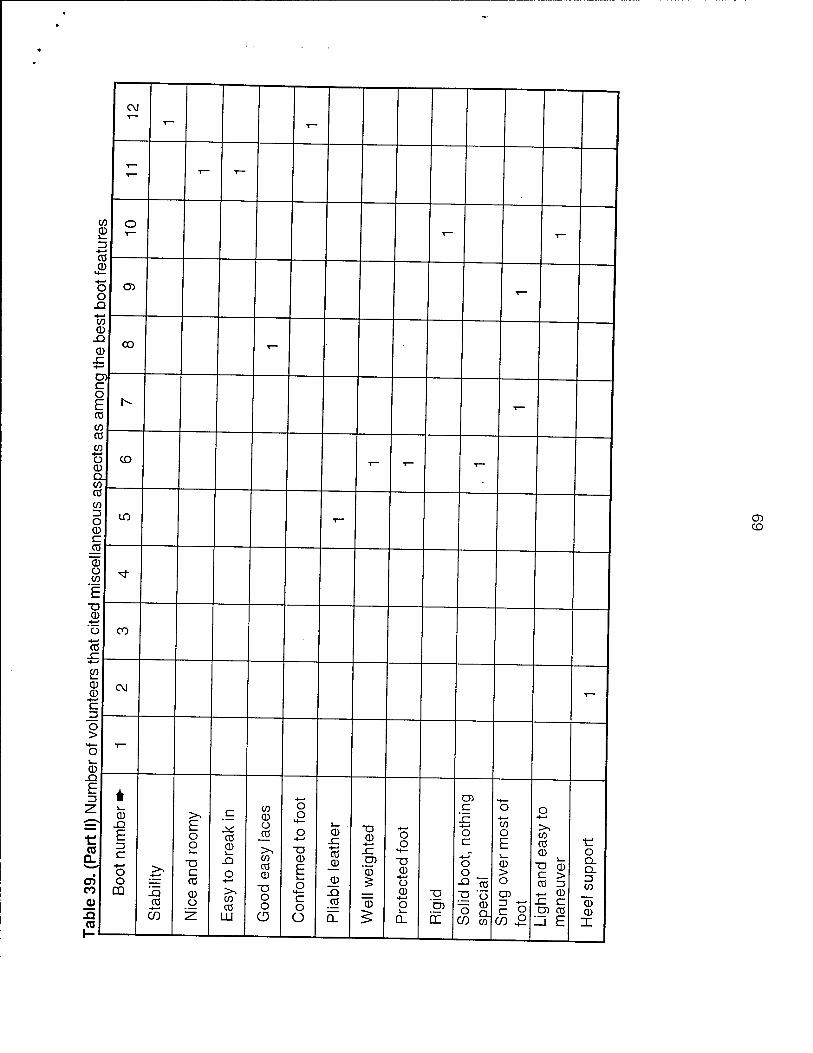
C\J
■""" -"
^
C/3 O Ü1 T- -,— 3
a Cl)
M—
r O) o
v
•4—" CO CD n CD
CO T_' .c ■*—»
c o E h- .,_ CO CO CO
en o CD
C£> 1— T- T—
Q. CO CO
CO 3 o CO T—
CD c CO
CD Ü CO -* E 0)
o CO .+_.J
CO .£-
CO -
CD CM u; T— •*—< c -i - o >
H— •r— o i_
0 -Q
E Z3 i ■♦—' CD 2
05
CD
E c •^ o
E o o
CZ
CO CD
co CD Ü
_co
o o
H—
O •4—«
T3 _c -1—•
CO _0
T3 CD o
C
-4—' o c
o co o E
o
co CO 0 o
tL >, T3
O
CO CO CD
CD
E CD
'CD "a 0
o o 0 > T3 CD
C >
Q. Q.
CO
d)
CO
o CÜ la
CO •*—»
CO
CD Ü
iz
■♦—<
>> CO CO
u.
T3 O O
o
o c o Ü
0
CO 0
ü 0 o a.
T3
'CD :
ir c
^ CO ■a ü
3 a -0 co (
o en
/> £ :
CO 3 +- 0 C C CO CO
3 E
3 CO
0 0
X
en CD
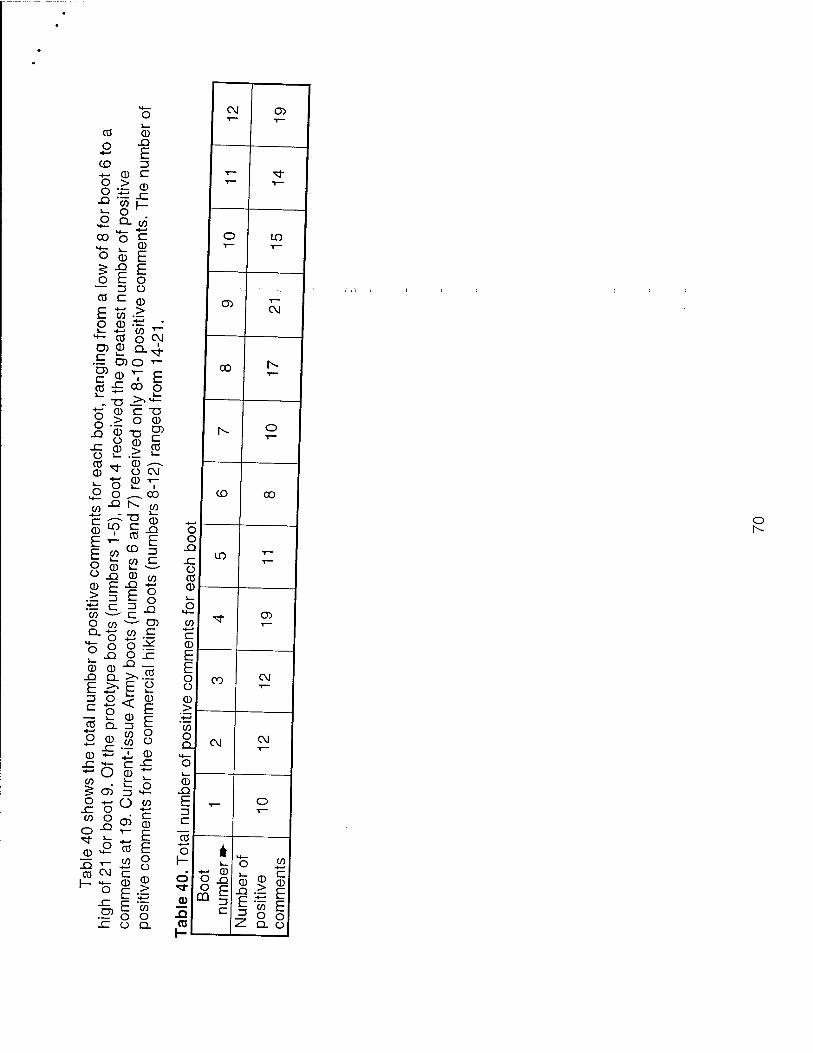
CG
O
CD
CD
E 3
*- CD c g > CD
-Q "co l_
£ Q. co c CD E E o ü
CD >
oo o
'S Q
o E — 13 co c
E to 2 B ■■£ T-- 0)0)0.4
•i= D)0 T-
c ® V £ co £ oo o
_ "O ->>*-
8 -2: o CD X5 © T3
O CD O
0) 3 °8
D) c CO
CD -—. ü CM CD T-
9 >
00 to
co
to -° ^ _
E T! ä E £ co <° ^ O CD J2 c
O X) CD
§ E p - .> 3 L g co -—' c JJ
o co "— c^ Q. -t; co c
co ü CD
CD CD
E >^E " 3 o ip
« " ^ CO
E E
w, o cu co o " "^ JD
CD r CD ■•-
- o 5 CT> O +-
JC o to o o -Q
^ o <D M-
"^ -r- to
1— o 3 H—
Ü to r o> CD T_ F
CO E
"CO <M
>- O
CD
O ü
© ®
E M o o ü Q.
CM CD
LO
a> CM
00
h-
o o
JD sz ü co ©
co c © E E o ü © >
co 00
o
io
CD
oo CM
co o
CM CM
©
E 3 C
o
o
_©
Y-
*-• CD
2 -£> ° E 3 C
CQ © ©
co
©
-, w E ^ o O 2 Q. ü
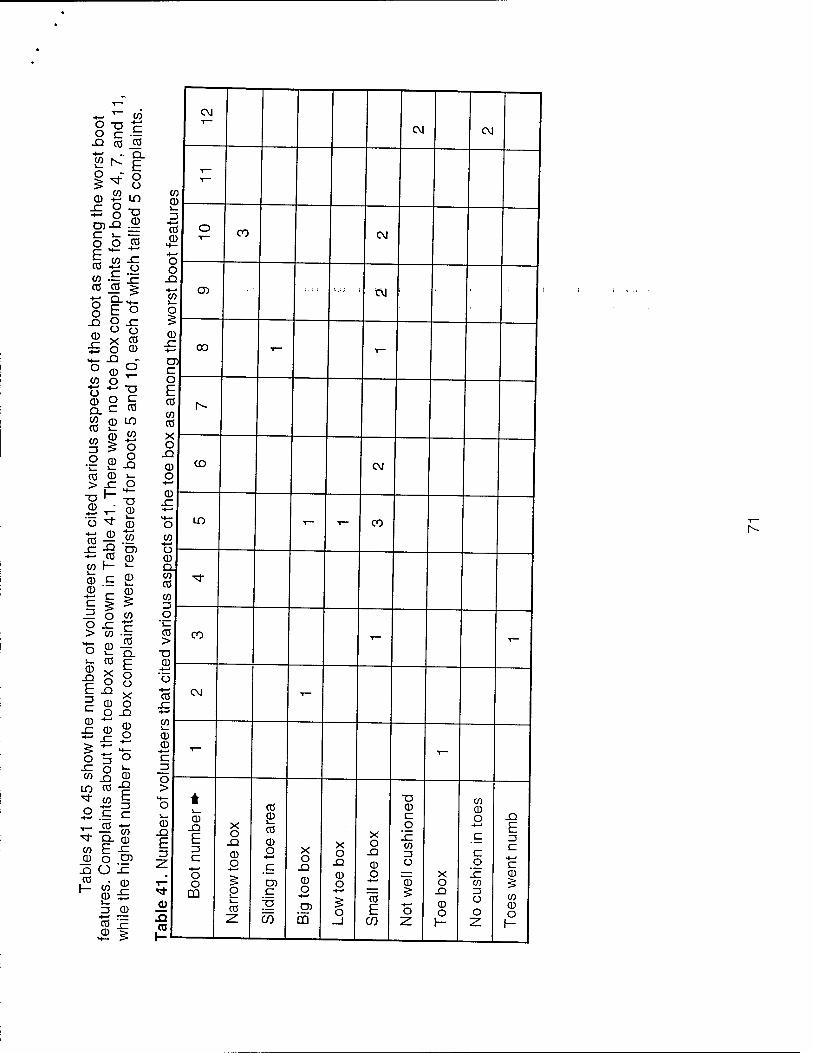
*- """ co S "° c O c •—
X! 03 JO
© i2 us £ 8^ 0>.Q.9> goß
03 -^ o OT ~ 1c CO JO g;
8|c
£ O ©
° © ? MO
© ° s Q. C CO W © LO 05 © W
" S R •° 2-8 03 CD v-
>££ "^ K -o "o "3" CD
«I« +- CO Q <0 I— >-
© E 2 © _ CD
§ 5 ^ d O W 0 ■*= c > W 'S CJ 1_ Q_ 1. (Ö c © X £ P § 8 |-° X p CD O L o H © ~ m
-*= © n
■C o l- C0 .Q ©
LO CO -g "* CO E= 0 c c £-£ « "fr Q. o co E -c CD o en 5ü£ CO • 05 I- co j£
CD £
'S IE
C\J
<M CM
T—
T—
cr a; 13
•4—"
CO ©
O CO CM
«4—
■#—•
c 0
-Q ■4—»
(0 CD ■■•" CM I—
O 5 © x: 00 1— T-
a- c 0 E CO Is» CO CO
X 0
.a. a) CD CM 0
© .r •*-> H— O IO T- T— CO
CO Ü © D. CO CO
^ CO -J 0 1_
CO > CO T- T-
T3 (11
■+—•
Ü
CO CM 1-
-C •+—•
i_
© ©
4-< T- C _5 >
H— i -O CO O CO CD CD L.
© 0 c O £2 CD
£3 E E
X 0 SI CD O
CO
© 0 ■♦—'
c
X 0 Si
X 0 Si
X 0 Si
CD
0 1c
CO Z3 Ü
C
c 0
E =3 c
a 0 5 CD O — X Jz CD T- 0 CD CD O
•♦-• CD 0 CO ^
© SI
GQ O i_ CO
2
c
CO
O
co m 0
_l E
CO
-4—»
O
Si
CD O
=3 Ü O z:
CO CD O
1- l-L
I»-
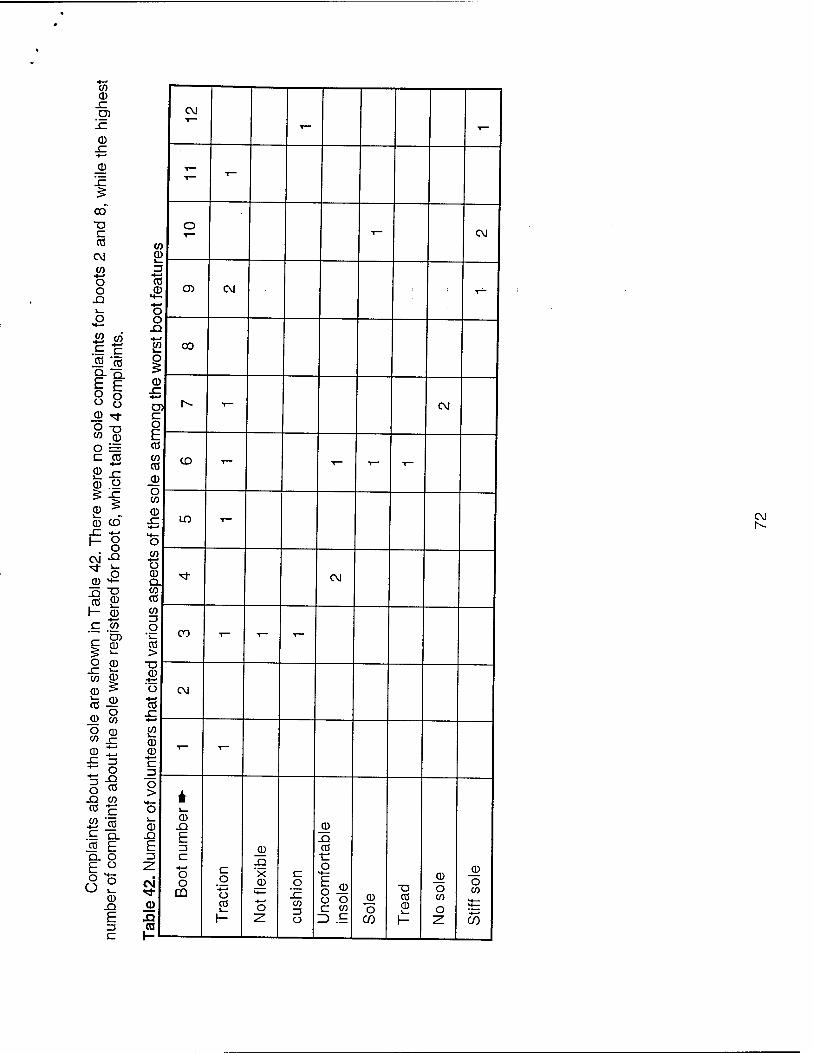
V a
JC TO
JZ
CD JT ■4—'
CD
x: $■
CO
TJ c CO
CM
CO •4-1
o o Xi i—
o »+—
to
c CO
•4—»
c CO CO Q. n b F u ü
o o CD «a- O -n U) CD O — c CO
-t—»
e> x: CD o < x: CD £ x_ CD CD r ■4—«
f- o o
CM X2
^ o CD M—
n xs CO ID
f- 0> ■4-^
c W m CD
O CO < i_
(0 CD
CD £ (0 CD
O CD CO O CD to r CD
■4—»
X. ~i o
X5
o CO
.o t/> CO c CO CO c CL CO b Q. Ü
F o o o
4—
o 1_
CD X2
b 13 C
<M
T— T-
- -
CO 0
o - CM
3 •4-« 03 (D *^-
•♦-» o o
•4-» s» 8
O) CM ^
CO
CD X:
TO C o E CO
CO CO
CD
O CO
CD x: H— o
N- - CM
CD - - - -
LO *-
CO •4-» Ü CD Q. CO CO
M- CM
CO
o CO >
CO - - T—
CD ■*—*
'o •+—* CO x:
CM
J2 CD CD
c - 1—
o > o CD
X2
F Z5
CM <* 0) XI (0
CD JO
F 13
•4—'
o o
c _o o CO
H
CD
X2 X
_CD
-4—'
O
Z
o XI CO
Ü
©
X2 CO
o
1- Ü o CZ CO
=> .£
CD
O CO
T3 CO CD
1-
CD
O CO
O -z.
CD
O CO
CO
CM I"-.
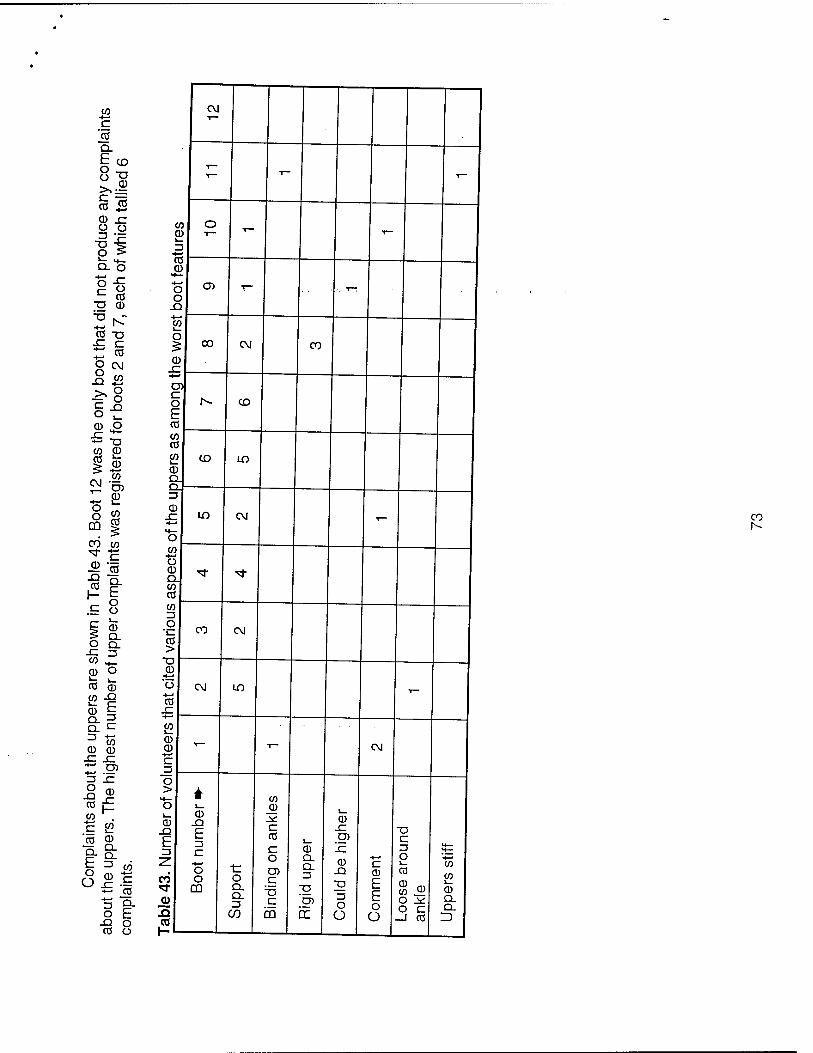
CO
c jo Q.
£«> 8 "a
a> x S| 2 j? a. o c CO
■g CD
£ § O CM
EB
£ -Q o v. CD O
CO p
o o
CD CO CO
CD Q_ Ca- rs
CO CO
®-Co
.E Ü c o x CO
CD ö CO (D co x
CD t °- ? Q. C 3 ■*-■ CO 0 CD X JC r .s> Z3 x
cofE CO .
.1 2 CO CD
E =» w ^ x ~
■^ CO
8 E -S ° CO Ü
CO CD l_
To CD
O o
X! ■4—»
£2 o
CD X
CD C o E co CO CO
£2 CD
a. CD
O CO
■♦—» Ü CD Q. CO CO
CO CS g CO >
CO X
CD X
E
CO
O
CO
eg
CO T-
oo
h-
<M
CD
Lf)
CO
LO
CO
CO CM
CM
CM LO
co
CD x E Z3 £=
■*—«
O o
CÜ o a. a. ZJ
c/)
CO _CD
c CO
c o CO c
TJ c
GO
CD Q. Q.
■g
'g) ir
(M
CD x gi x CD x ;g
o O
c CD E E o Ü
T3 C =S O
C0
CO ^ o _* o c
—I CO
co
CO
CD Q_ CL 3
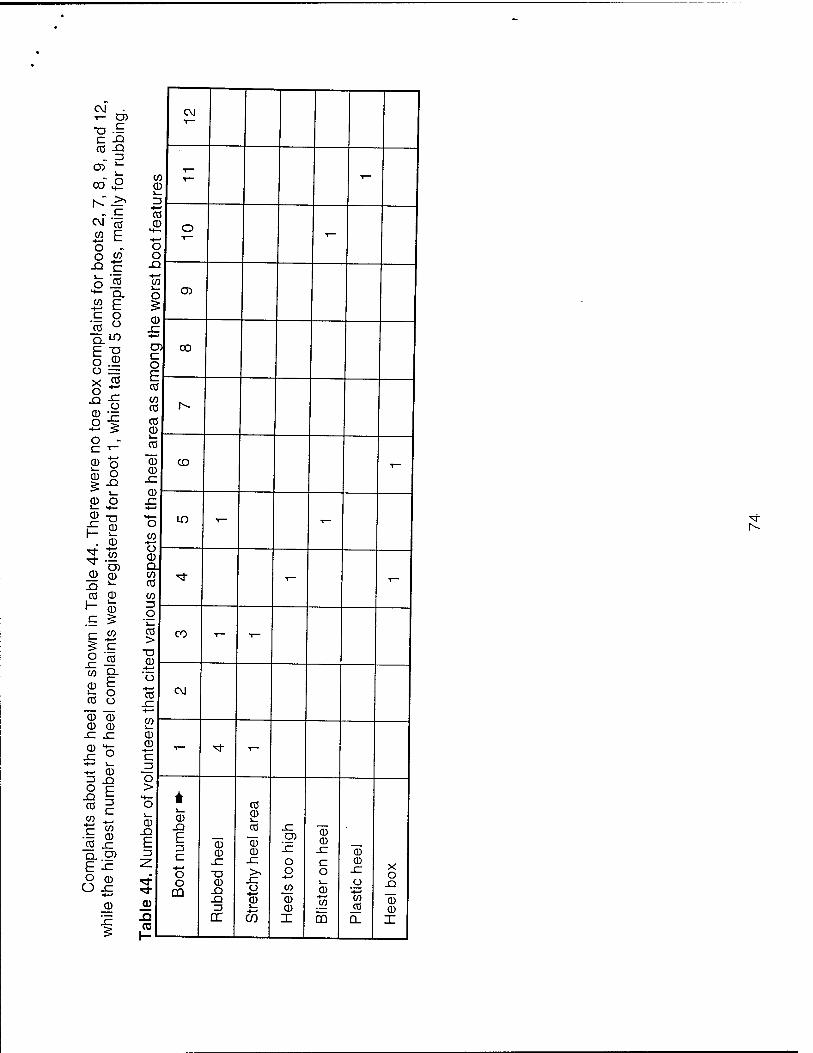
eg . i- D)
c .o _ =3
O) ^
00 £
CM""CB w E o - o w
■Q c
o J2 *- Q. i2 E c o '5 ° Q.LO E "ö o 9 o = sx CO o t:
CD ■=
o - £ o
<D O
® -o
3 » CD CD S ^
CO CD
I- ffl c 5
ig O jo CO D-
b ° CO Ü
"53 © CD CD
-C sz CD ^
° F CO I w ~
_C0 SZ Q. O) E i= O CD Ü JC
CD Ü.
C\J
« T_ 1—
o; ._ z
■#—
cc CD o
H—• 1— ' o o
_Q
(/) o CD
5 CD
-»—' cr CO c o E CO
CO co h- CO Cl)
CO
CD CD __ CD
SZ
CD SZ •4—'
H—
o LO T- i-
CO o CD Q. CO CO
•* i— T-
CO -J o -_. CO > CO •<- ■»-
T3 CD
Ü
CO C\J ,c~ •♦—'
I—
CD CD 1— ^t -,— c
_Z> o >
«4— * o CO -_ CD
E
CD
E ZS CZ
"CD CD
8> CO
0 CD
SZ
'sz "05 CD
SZ "53 -7 SZ SZ o c CD
o T3 >> o o SZ X o
*t o CD SZ L_ o _Q «a- CD X! o CO <D '43
CD
-Q
Si zs
or 2
-4—«
CD CD X
CO
m CO CO
Q_
CD CD X co 1
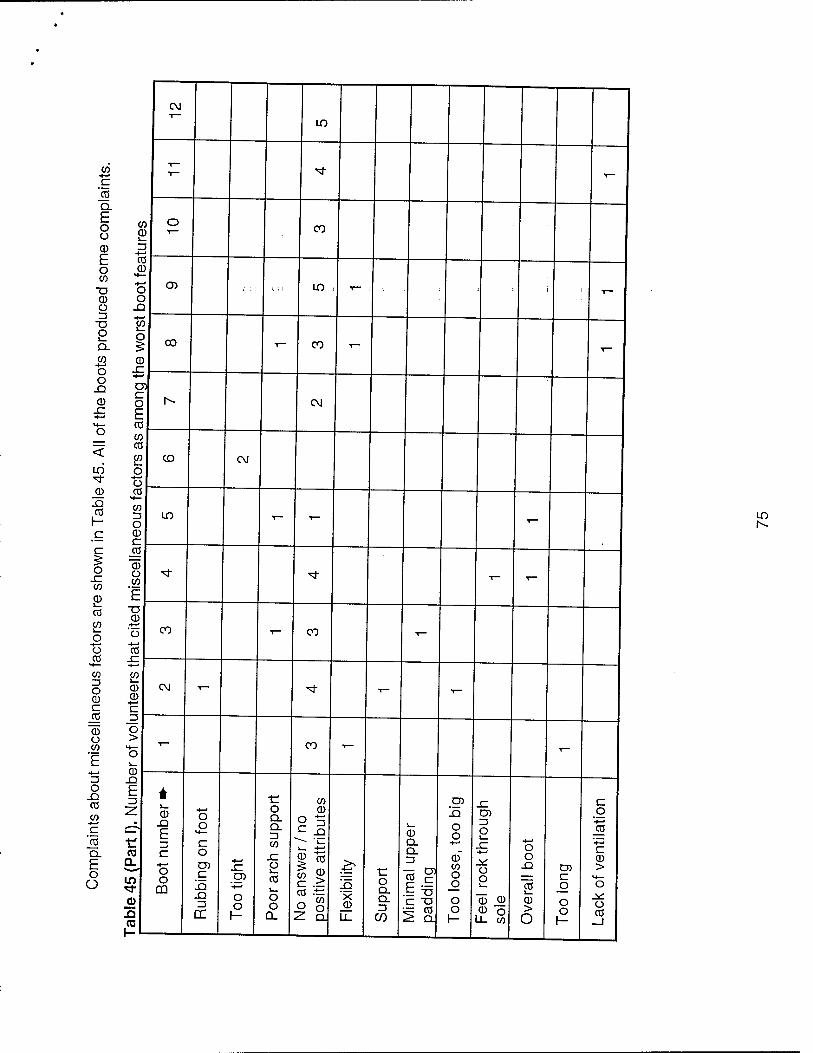
CM
LO
CO ■»—•
c
CL E o ü
CD E o co
"O CD Ü
T3 O
Q. CO -*—» O o
0
LO
CO h- C
c o CO
CD
CO co o
-♦—» o CO
CO
c jo
E o Ü
CO CD
CO CD
H—
•4—»
o o .a •*-*
o
CD sz ■4—>
D) c o E CO
CO CO
o o
■B CO
o CD c CO
CD
-ü ■+—»
CO
CO co ID o CD
CD CD
c r CO -5
CD o o > CO H—
E o 4-, CD 13 .o o
-Q CO
E
CO a LO
a>
re
CT>
CO
CO
LO
CO
C\J
CD
LO
CM
LO
co
CM
CD
E
o o
CÜ
o o
M—
a o c
X!
cr
CO
CO
o o
o Q. CL =3 CO
JC Ü i— CO u. o o
Q_
CO
CO 0
o !_ .Q
1_
CD
CO c
CO
CD > CO •4—*
o co o
^. Q.
X CD
o Q. Q. 13
CO
CD CL Q.
E~ .E T3 C T3 .= CO <> QJ
CD id O O
■*—•
CO o o o o
CD
o
o o
"CD CD CD o
LL CO
O O
-Q
"cö i_ CD > o
c
o o
c _o "•♦—«
CO
c CD >
M— o
_*: o co
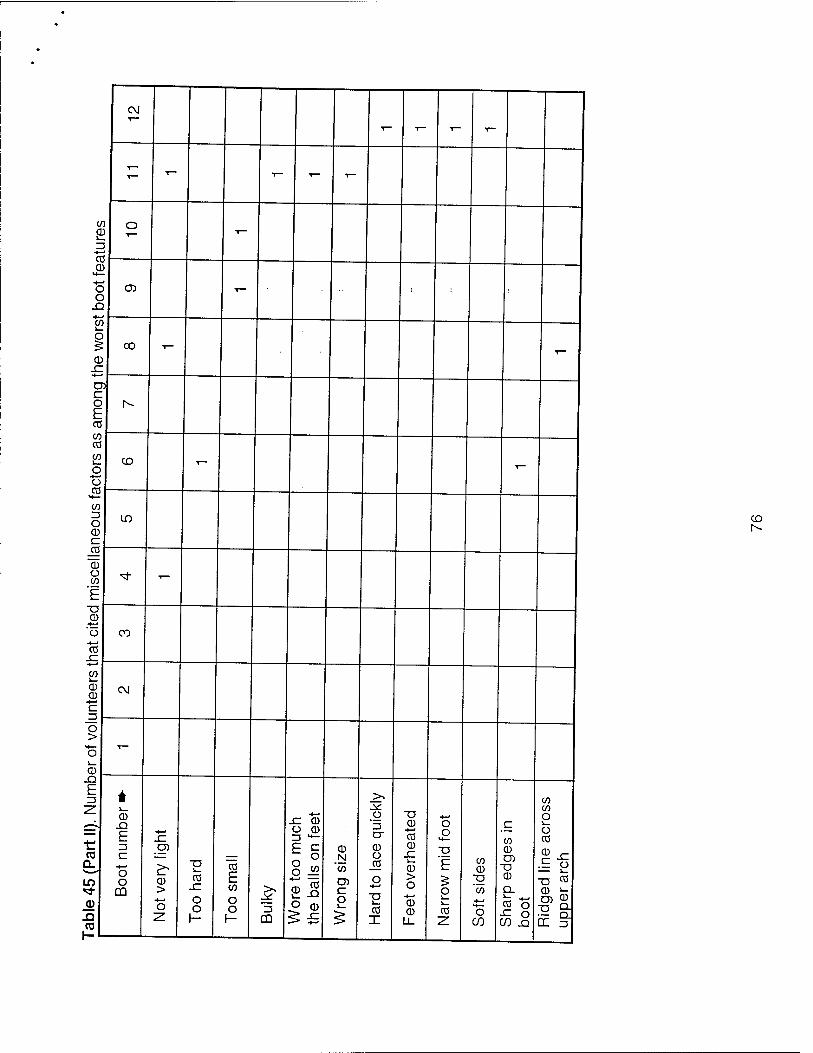
CM
T- T- . T-
- - - - -
co CD
•♦—•
O -
CD H—
■4—»
o o
XJ *—*
G> -
co o
CD XT
00 T—
-
C o E CO
K
CO CO
o Ü CO
CD - -
M—
CO rs o CD
LO
CD o co 'E
^t -
'o -4—»
CO x:
co
CO
CD CD •«—» C D -
CM
o >
H— o CD
-
X! E z:
co
in
CD
i CD X) E c
o o
GD
x: CD
ir CD > o 2
T3
CO x: o o
"c5 E CO
o o 1- CÜ
x: CD ü CD
8 »
O CD
CD N
'co CD c o
O
CT CD Ü
_C0
O
■O i_ CO I
T3 0
-t—' CO CD x: 0 > 0
•4—•
0 0
LL
■+-' O O
H—
T3
E
0 i_ i_ CO
co 0
T3 'co
'S CO
c
co 0 CD 73 0 Gi- rt +- CO 0
■*= O 10 XJ
CO co 0 i_ 0 CO
E 0 — i_
T3 °S 0 »- CD ©
£ §■
CD
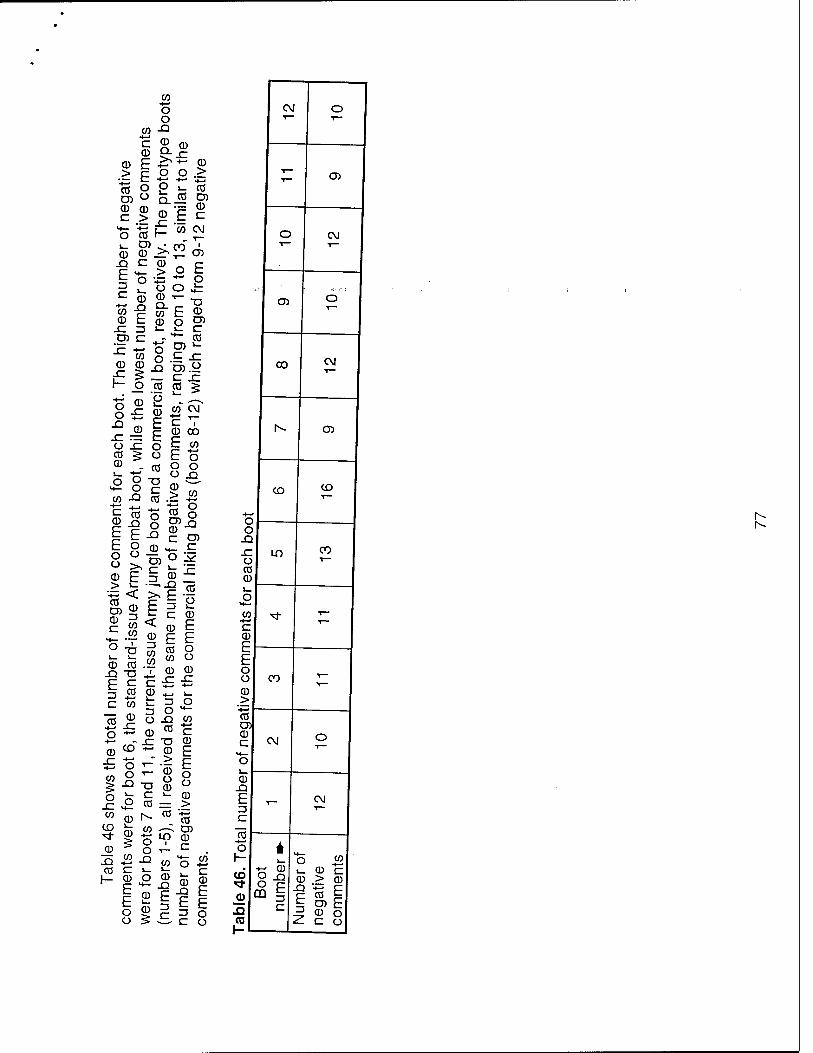
CD >
CD >
CO
o o
C(I)(D
11^ C o o
Ä ^ "K ■*-' ••-* 03 O O j_ cC a> ° Q.JS S? g | o I S
"5 '"5 t- w £1 CD 0) -^T- O)
-Q C CD _ p
£ o ■+= ~ o = ^_ O O .fc
S P « EI CD t <D o ^
£ ^ -g O) t- OT o C JC
5 2 .a ra 2 g _ c JC
_o CO CO ^ ^- m 'o *" ,_, (~> CU i_ - JTp o£ g ££ -^ = fc P ,« 2 -E o £ £ « 5 o E o 11 - co o o o g -o m Ü
w
b-
- 8 c S> to -Q co.i
•4-J ■*—•
§.Sg CO
.Q P c 2 CD E o CD H- E
S§ E I g g |< o E t .52 CD E E
>- " S «J ü CD co .2 „, m JD T3 ± 2 2 P c c £ i= 5 co CD ^ i_ C W i- 5 £
— /IN ^ O M_
« J ° -9 -Ö O ~ CD « C
— T3 CD CD CD
±3 Ö ^
o o 5 ~ ^ w CD r^ * *s
d) ^ Or- C .
iiiii
8 Ö CD
CM o 1
- CD
o CM T—
O) b
CO CM
f- CD
CD CD T—
•f-* o o .a .c LO CO ü 1~~
CO CD i—
o H—
03 •4-» M- T-
C CD C . c E o ü CO
1
CD .> CO D) CD C CM o
h*_
O
a -Q E .,_ CM 3 T—
c CO
■4—<
o *
C£>
o c ^2
DO
OT
num
ber O «
L O C 0) > CD
^ CO ^
5 CD o (C *. £ C Ü h-L-
1^
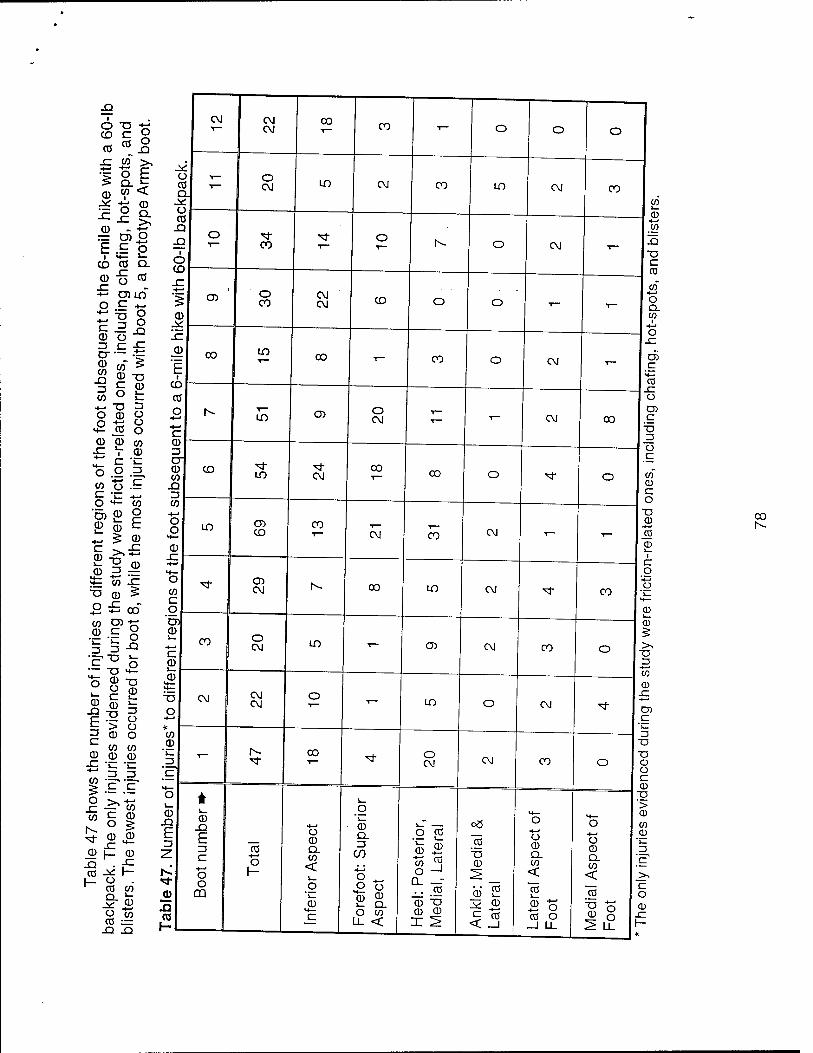
O TJ ••=• CO C © CO <* 2
•> o E 0 »< ^ n ® ^-2 £ CD - ~ = D) O E.E o
CD CO Q.
CD "o CO -C ~ - ■»-' D) LO O C *- -ig c 3 o CD O 3 C £
8 <o 3= J2 CD -o 3 C 0) CO ° t
•4- "D ^ O CD © o r °
v{i _C0 o CD CD CO £ V CD £ C ■£= O 2 .3 co 'tS .E E '= — O **- CO '5)0)0 2 © E
+- 5: CD
CD
CD =3 -S £ «IE T3 CD >
°£oo" CO D) •}=;
-g-i § 3 3-"
•'E 5 o •— "D H- ^ CD -a
CD ■*-*
0 Ü C CD
CD
X! -Ö
E. > ° ^ CD O
m CO CO CD CD CD £ "*- '"- sii x: -^ w co er CD ™ ° 3 £ © © © l— CD
,2-s1-: ^ CO CO
5-© CO 1= X! XJ
eg CM 00 i— CM CO o o O
^ / c ) T- I o a c
5 i- CM LO CM CO LO CM CO
.y CO c ) — — 1_
et _ CD
r CO
x _ ¥ co
O r- o CM ^_ 5
a CD
T3
CD o CO
CM CM CD o o T~
CO ■4—»
O cx
CD CO .M ■4—»
x: - Ü
_©
E CO LO
00 - CO o CM - c5
CD CO
CO ,c~ Ü
O Is- LO CD o
CM "- ,- CM 00
D) c
c CD
3
3 cr © CD "* ^f 00
Ü C
CO LO CM CO o ■* o CO o CD
n C o
T3 CO
o o LO CD CO ,_ ., CD
CD T- CM co CM T_ -I— CO
© CD
i
H— O o CO
^ CD CM K 00 LO CM "t CO
_o c
■ o CD
D) 0)
a> 5 T3 r
CO O CM LO ^ CD CM CO o
CD 3
co CD — M— M— CD
T3
O
eg CM CM
O T— LO O CM ^t TO
•*—>
CO 13 © Ü
3^ 11 K
M- CO
■* o CM CM CO o
T3 CD O c 0
■g o *
© X2 CD
o •4—1
_o CD i_T — OÖ
M— o o
> CD
CO
b 3
«3-
©
E 3 C
© 1 o ca
o
o © CL C0 < o
Q_ 3
° — £ 2. O CO
U- <
O CO
o 3 to "j o —' 0 - . . CO
"cö "■a CD
© 2
■♦—' Ü CD Q. CO <
"cö
o CD Q. co <
"cö
CD
c o
X]
i2 1 CD "O CD © X 2
3? ©
< _i
S o CO O
—1 Li_
"° o ® O r 2 u_ f
CD
CO
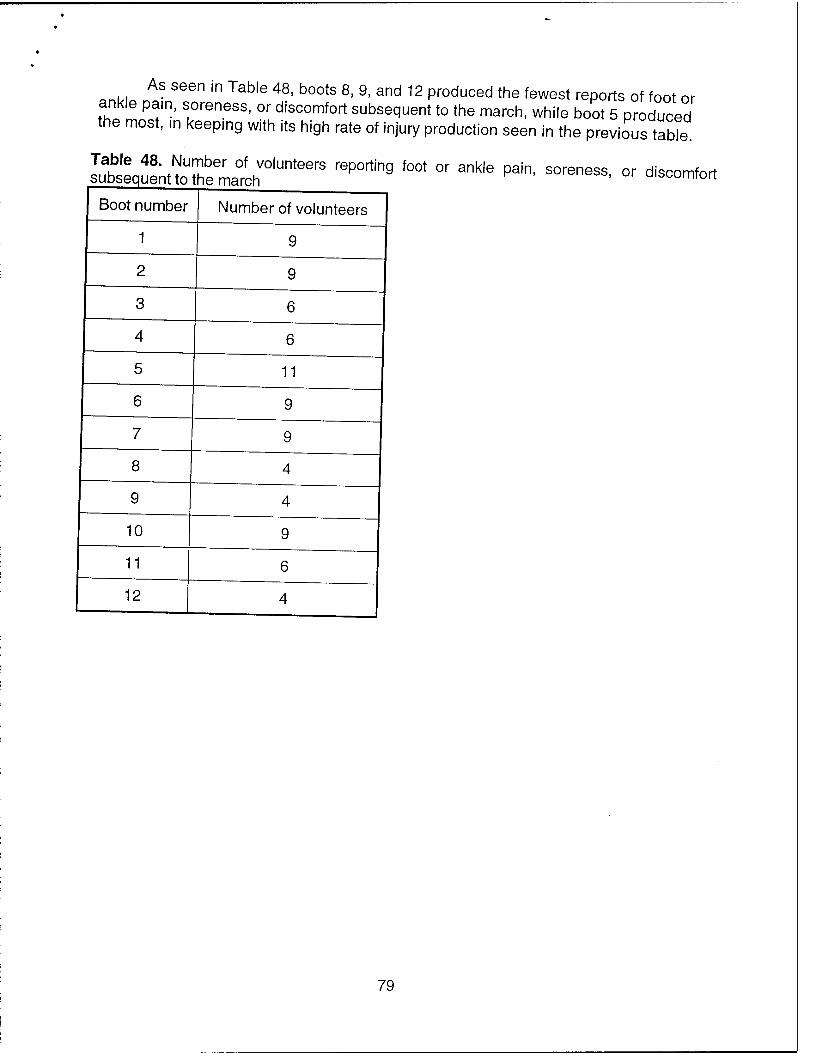
anWa AS Seen m Table 48' b00ts 8. 9> a"d 12 produced the fewest reports of foot or
ankle pain, soreness, or discomfort subsequent to the march, while boot 5 produced the most, in keeping with its high rate of injury production seen in the previous table
sTubbsequenttoThbell^™ ^^ *** °r ^ ^ "' or d-omfor1
Boot number
1
Number of volunteers
11
7
8
10
11
12
79
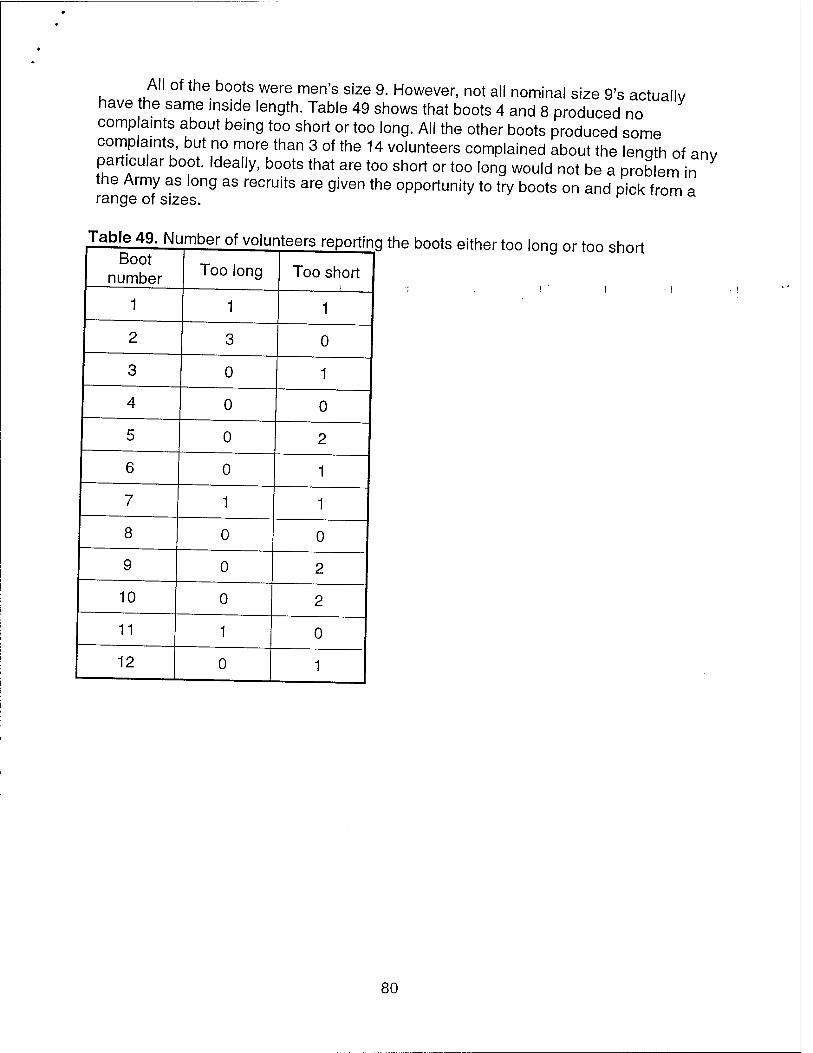
All of the boots were men's size 9. However, not all nominal size 9's actually have the same inside length. Table 49 shows that boots 4 and 8 produced no complaints about being too short or too long. All the other boots produced some complaints, but no more than 3 of the 14 volunteers complained about the length of anv particular boot. Ideally, boots that are too short or too long would not be a problem in the Army as long as recruits are given the opportunity to try boots on and pick from a range of sizes.
Table 49. Number of volunteers reporting the boots either too long or too short Boot
number
1
Too long
1
Too short
0
0
0 0
7
0
0
0 0
0
10 0
11 0
12 0
80
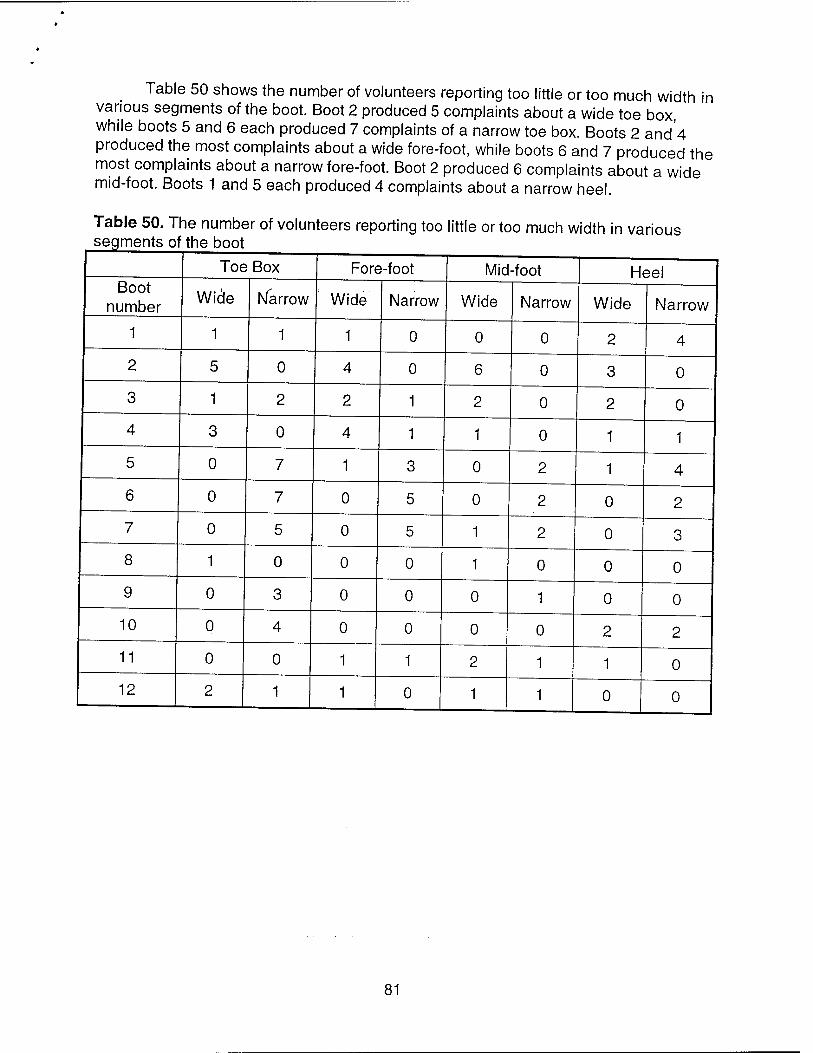
Table 50 shows the number of volunteers reporting too little or too much width in various segments of the boot. Boot 2 produced 5 complaints about a wide toe box, while boots 5 and 6 each produced 7 complaints of a narrow toe box. Boots 2 ancU produced the most complaints about a wide fore-foot, while boots 6 and 7 produced the most complaints about a narrow fore-foot. Boot 2 produced 6 complaints about a wide mid-foot. Boots 1 and 5 each produced 4 complaints about a narrow heel.
Table 50. The number of volunteers reporting too little or too much width in various segments of the boot
Toe Box Fore-foot Mid-foot Heel Boot
number Wide Harrow Wide Narrow Wide Narrow Wide Narrow
1 1 1 1 0 0 0 2 4
2 5 0 4 0 6 0 3 0
3 1 2 2 1 2 0 2 0
4 3 0 4 1 1 0 1 1
5 0 7 1 3 0 2 1 4
6 0 7 0 5 0 2 0 2
7 0 5 0 5 1 2 0 3
8 1 0 0 0 1 0 0 0
9 0 3 0 0 0 1 0 0
10 0 4 0 0 0 0 2 2
11 0 0 1 1 2 1 1 0
12 2 1 1 0 1 1 0 0
81
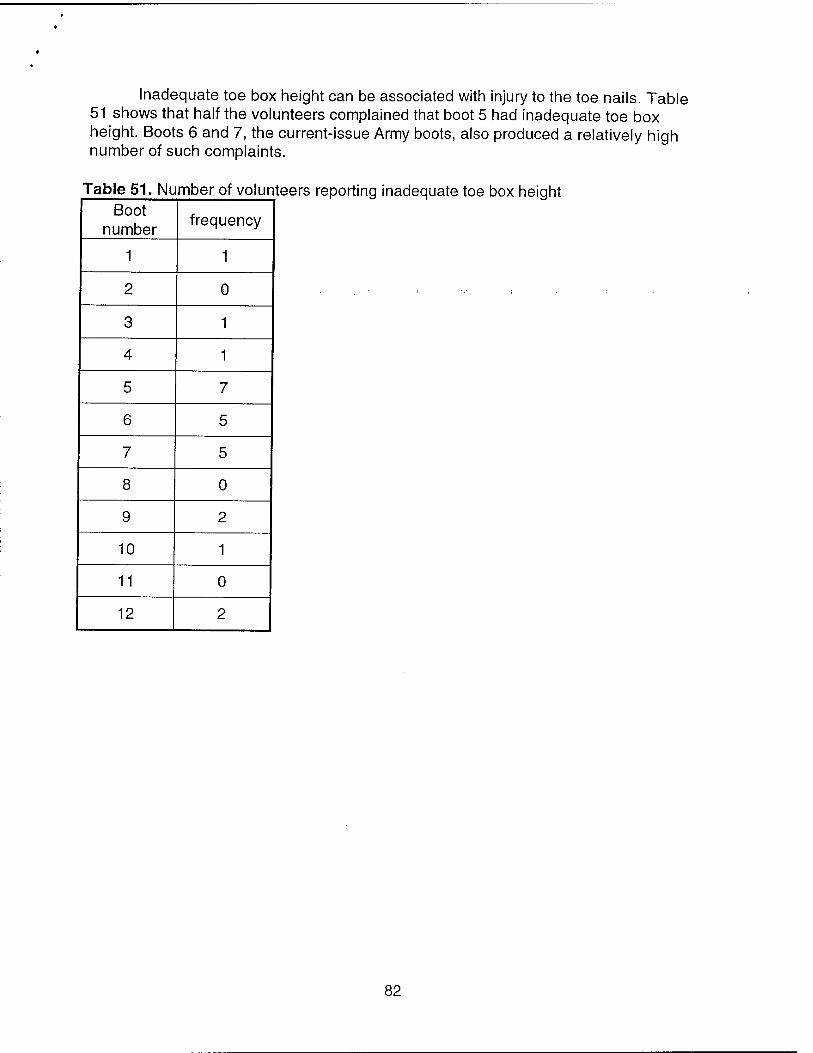
Inadequate toe box height can be associated with injury to the toe nails. Table 51 shows that half the volunteers complained that boot 5 had inadequate toe box height. Boots 6 and 7, the current-issue Army boots, also produced a relatively high number of such complaints.
Table 51. Number of volunteers reporting inadequate toe box height Boot
number frequency
1 1
2 0
3 1
4 1
5 7
6 5
7 5
8 0
9 2
10 1
11 0
12 2
82
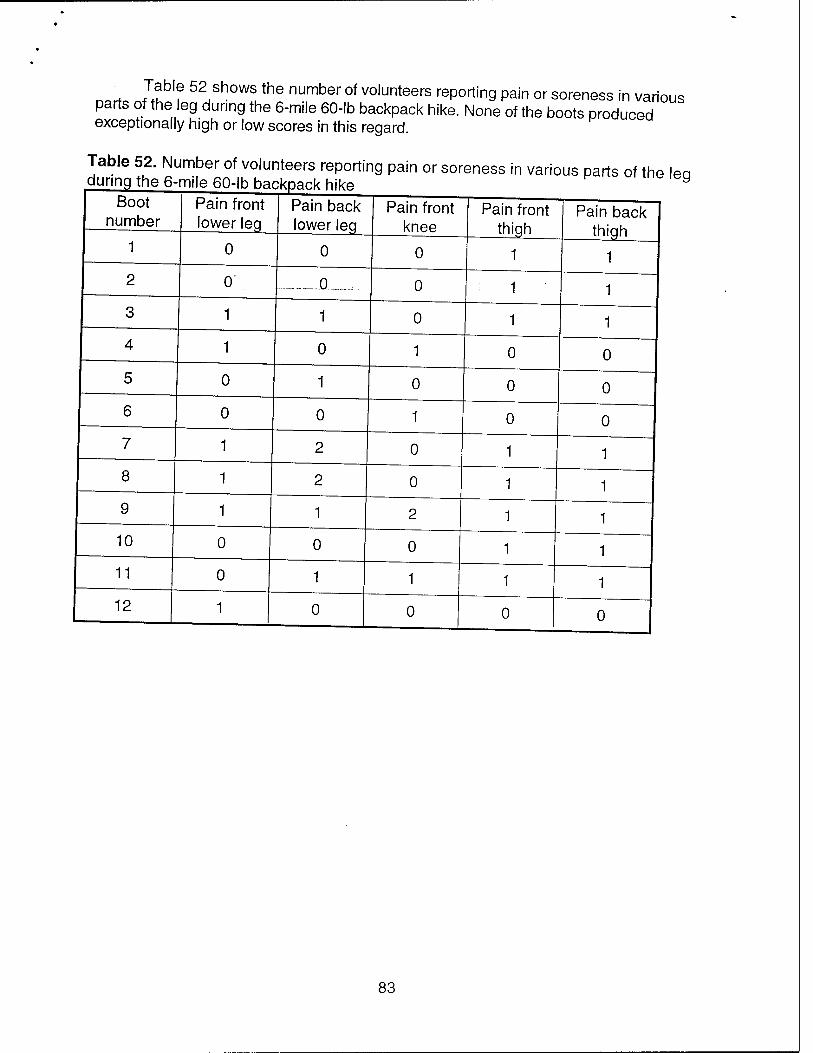
n3*o Zf'f 52Jsh0Ws
utne number of volunteers reporting pain or soreness in various
parts of the leg during the 6-mile 60-lb backpack hike. None of the boots produced exceptionally high or low scores in this regard.
Table 52. Number of volunteers reporting pain or soreness in various parts of the lea
Boot number
I Pain front lower leg
I Pain back lower leg
Pain front knee
Pain front thiqh
Pain back thiqh
1 0 0 0 1 1
2 0' .. J0._ ,... 0 1 1
3 1 1 0 1 1
4 1 0 1 0 0
5 0 1 0 0 0
6 0 0 1 0 0
7 1 2 0
8 1 2 0
9 1 1 2
10 0 0 0
11 0 1 1
12 1 0 0 0 0
83
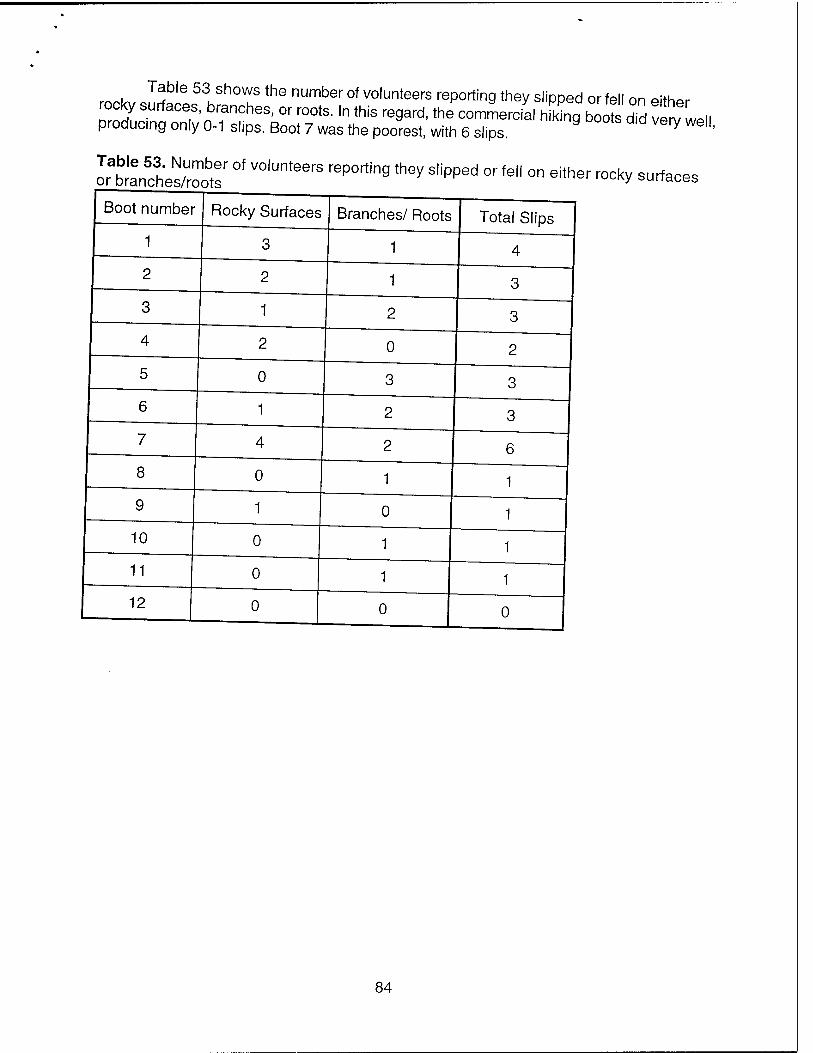
Jlb!L5llh^!!he.nUmbef0f.V0,unteers reP°rtin9 they slipped or fell on either cial hiking
poorest, with 6 slips. producing only 0-1 shps. Boot 7 was the poorest, with 6 slips. V '
ÄS5T °' V°'UnteerS reP°rtin9 '^ S'iPPed °r fe" °n either «"** surfa^s Boot number
1
Rocky Surfaces Branches/ Roots
1
Total Slips
0
0
8 0
10
11
12
0
0
0 0 0
84
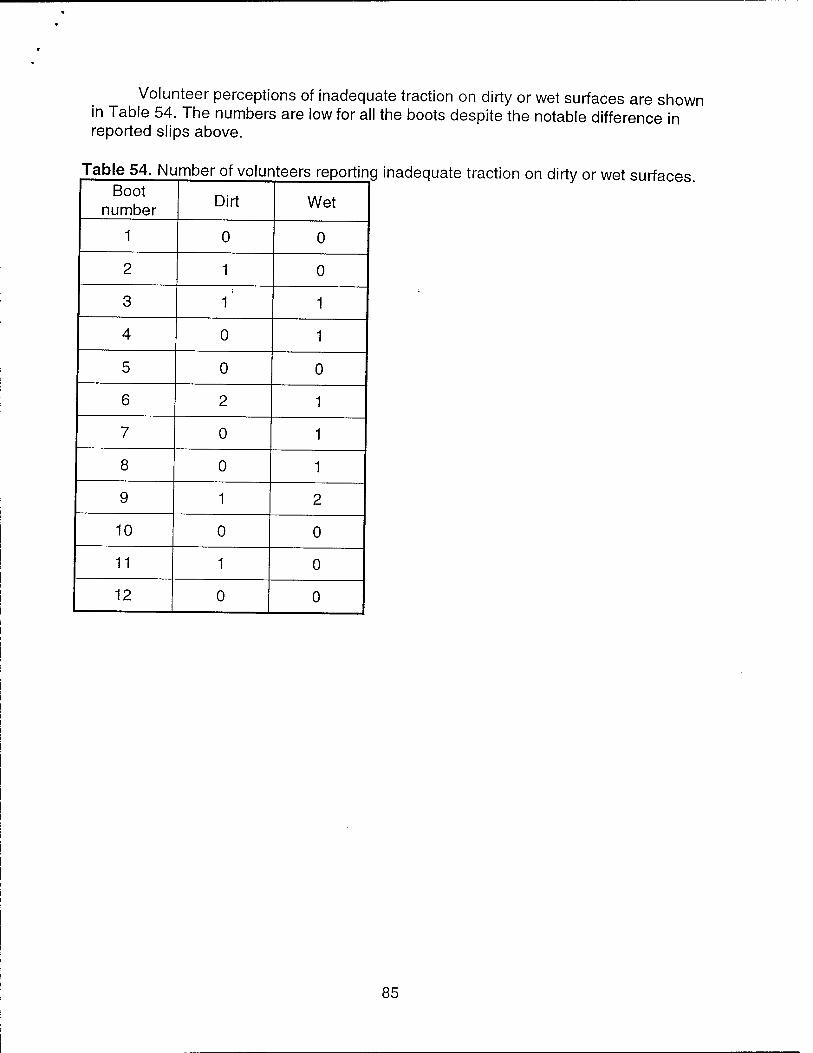
•
Volunteer perceptions of inadequate traction on dirty or wet surfaces are shown in Table 54. The numbers are low for all the boots despite the notable difference in reported slips above.
Table 54. Number of volunteers reporting inadeauate traction on dirtv nr w<=>t surface Boot
number Dirt Wet
1 0 0
2 1 0
3 1' 1
4 0 1
5 0 0
6 2 1
7 0 1
8 0 1
9 1 2
10 0 0
11 1 0
12 0 0
85
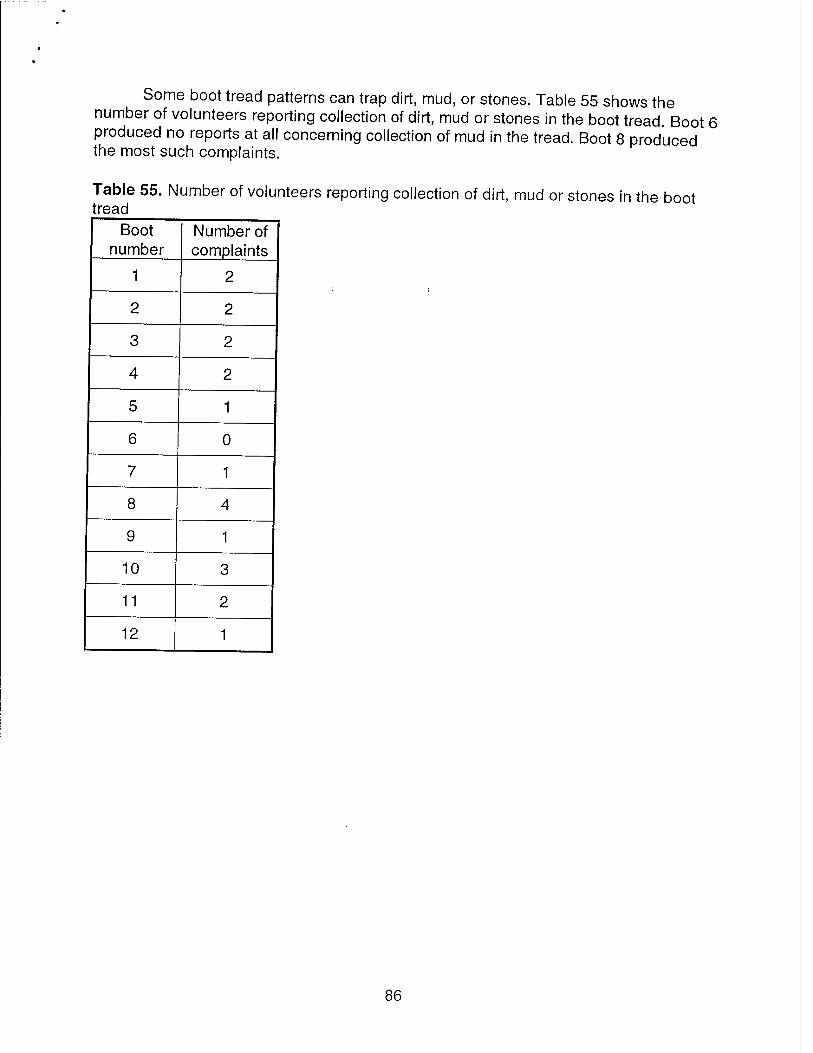
Some boot tread patterns can trap dirt, mud, or stones. Table 55 shows the number of volunteers reporting collection of dirt, mud or stones in the boot tread. Boot 6 produced no reports at all concerning collection of mud in the tread. Boot 8 produced the most such complaints.
Table 55. Number of volunteers reporting collection of dirt, mud or stones in the boot tread
Boot number
Number of complaints
1 2
2 2
3 2
4 2
5 1
6 0
7 1
8 4
9 1
10 3
11 2
12 1
86
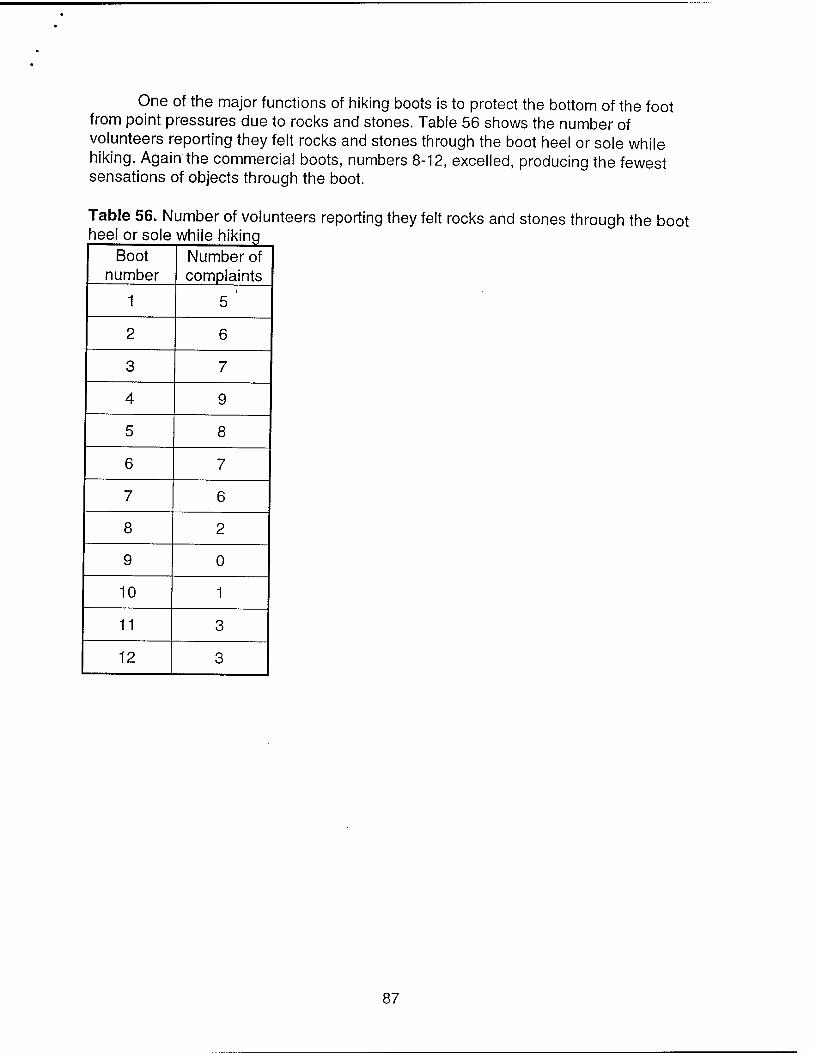
One of the major functions of hiking boots is to protect the bottom of the foot from point pressures due to rocks and stones. Table 56 shows the number of volunteers reporting they felt rocks and stones through the boot heel or sole while hiking. Again the commercial boots, numbers 8-12, excelled, producing the fewest sensations of objects through the boot.
Table 56. Number of volunteers reporting they felt rocks and stones through the boot heel or sole while hiking
Boot number
Number of complaints
1 5 '
2 6
3 7
4 9
5 8
6 7
7 6
8 2
9 0
10 1
11 3
12 3
87
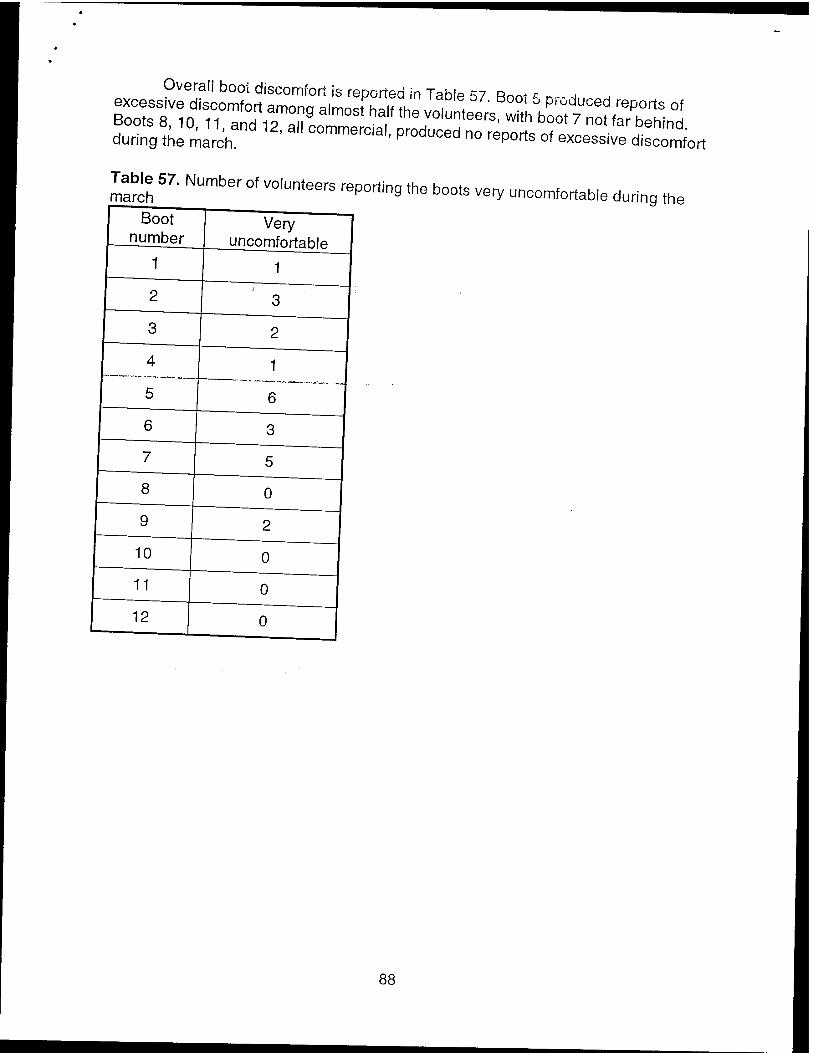
Overall boot discomfort is reported in Table 57 Rnnt * r- H *
Bor^od?iordT:r,mo^ during the march ' "" C°mmeraa'' Pr°dUCed n0 rePorts °' »=essive dfecomfort
Table 57. Number of volunteers reporting the boots march
Boot number
Very uncomfortable
1
2 I
3 [
1
3
2
4 I
5 T
6 T
1
6
3
7 I 5
8 I 0
9 I 2
10 I 0
11 I 0
_ 12 I
0
very uncomfortable during the
88
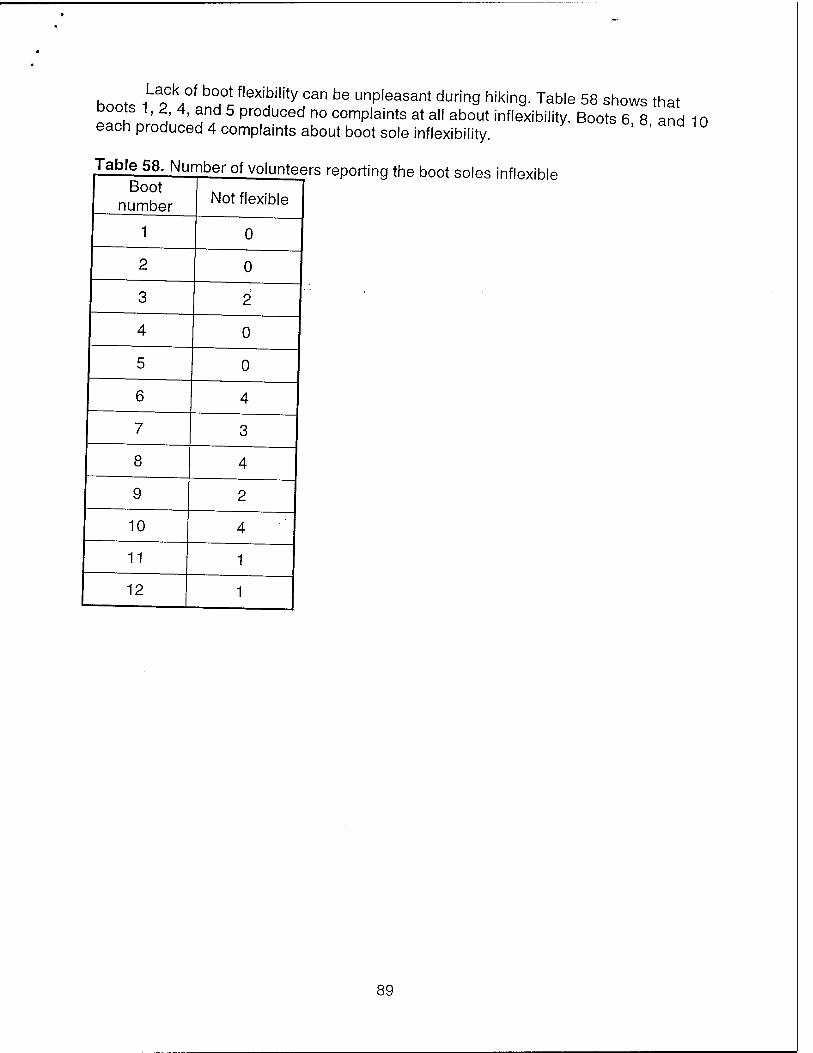
hont, 10/ b°°"lex'blllty can be unpleasant during hiking. Table 58 shows that Doots 1,2,4, and 5 produced no complaints at all about inflexibility. Boots 6 8 and 1 n each produced 4 complaints about boot sole inflexibility.
Table 58. Number of volunteers reporting the boot soles inflexible Boot
number
1
Not flexible
0
0
0
0
6 4
7 3
8 4
9 2
10 4
11 1
12 1
89
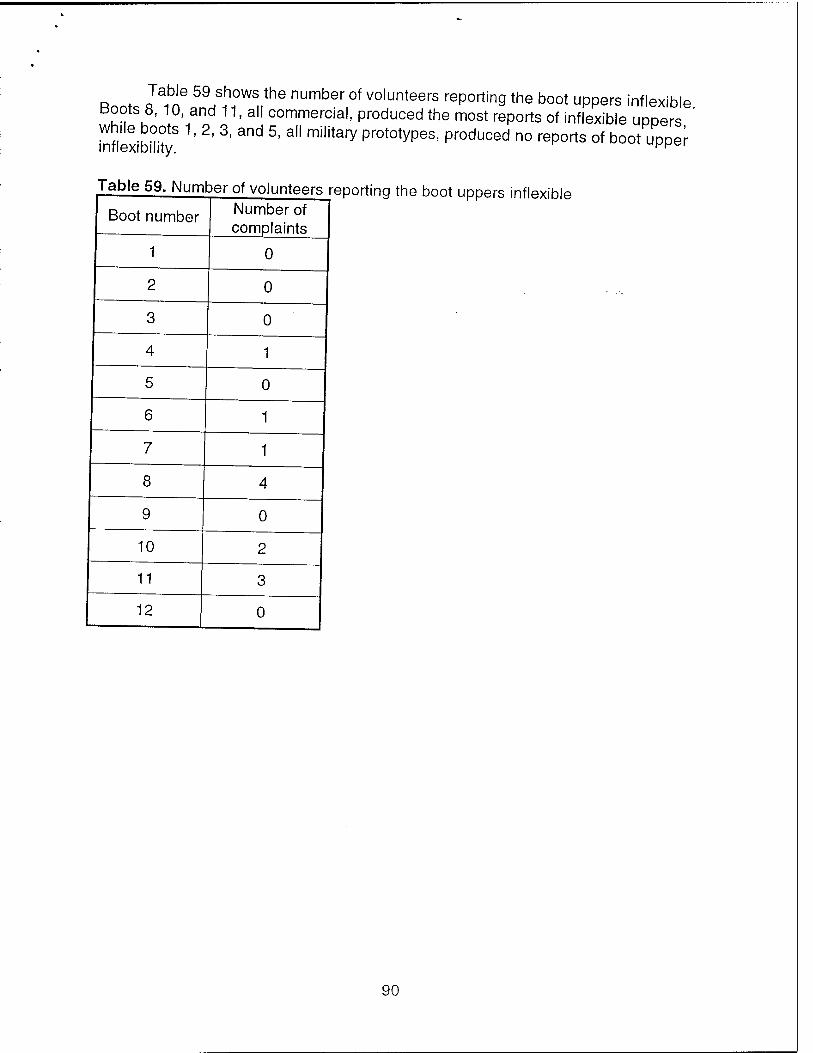
Rnntc I in 59^hH0WVhe number of volunteers reporting the boot uppers inflexible
boots 8, 10, and 11, all commercial, produced the most reports of inflexible uppers while boots 1, 2, 3, and 5, all military prototypes, produced no reports of boot upper inflexibility. Hpei
Table 59. Number of volunteers reporting the boot uppers inflexible
Boot number I Number of complaints
1 0
2 0
3 0
4 1
5 0
6 1
7 1
8 4
9 0
10 2
11 3
12 0
90
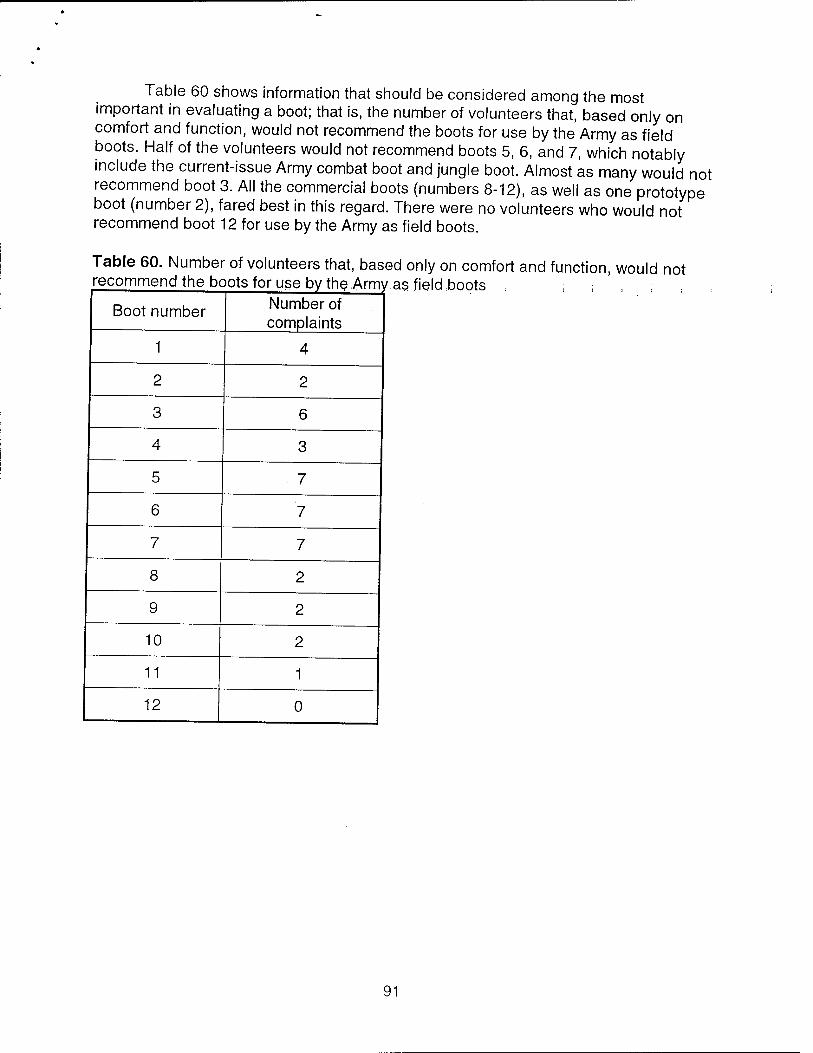
Table 60 shows information that should be considered among the most important in evaluating a boot; that is, the number of volunteers that, based only on comfort and function, would not recommend the boots for use by the Army as field boots. Half of the volunteers would not recommend boots 5, 6, and 7, which notably include the current-issue Army combat boot and jungle boot. Almost as many would not recommend boot 3. All the commercial boots (numbers 8-12), as well as one prototype boot (number 2), fared best in this regard. There were no volunteers who would not recommend boot 12 for use by the Army as field boots.
Table 60. Number of volunteers that, based only on comfort and function, would not recommend the boots for use by the Army as field boots ,;;;;;,:
Boot number Number of complaints
1 4
2 2
3 6
4 3
5 . 7
6 7
7 7
8 2
9 2
10 2
11 1
12 0
91
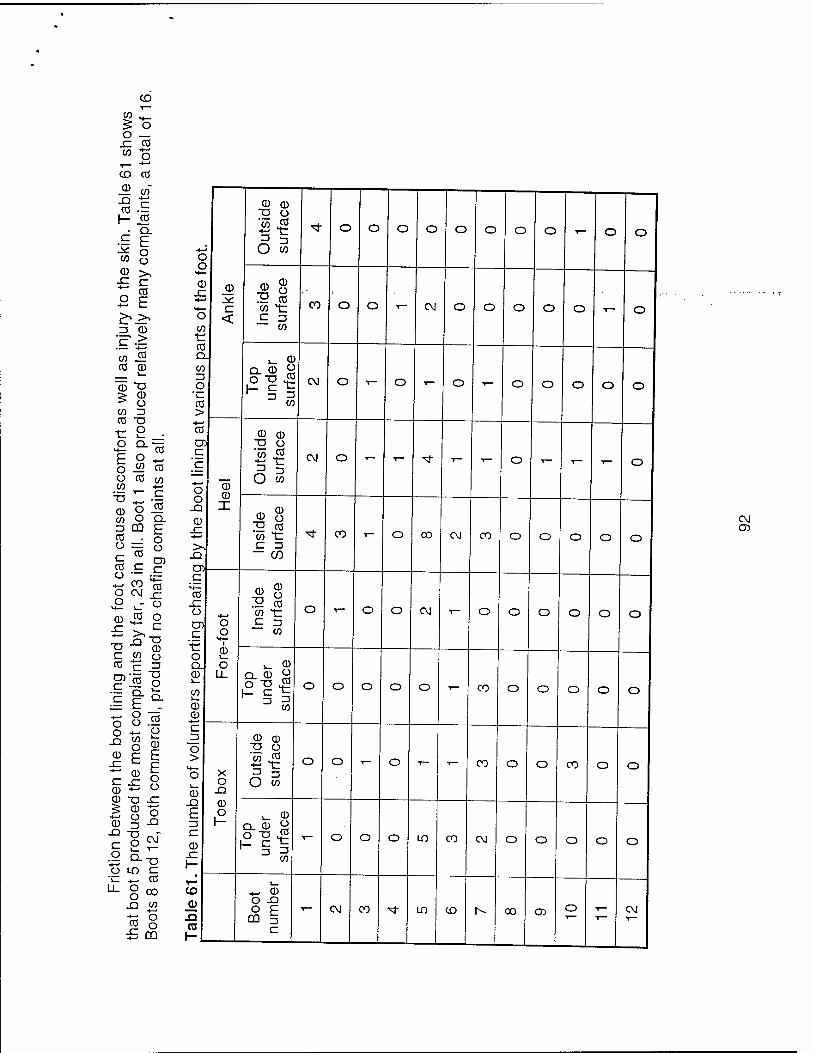
CD
CD 03
® W ■° c "5 •= h- «
i§ ^r SE ^>< Z5 CD
'co JÜ CO 0) \_
"CD "O
> Ü CO 3 03 T3
tr 2 ■ M— CO
E ° — o sa <a O (Ö w CO t-i
• il =5 CD 03 . o =
CO
Q. E O Ü
CO Ü
O N r O - o o £ o - >•£ £ i2 o CO c 3
I E &
^8! O ~ o
■° 8 g * E | c -C R CD T3 x: 5 CD "5 CD Z3 X2
O LO C 'i_ .»_. CO u- g«,
eg o £ CD
4««
o o
CD
c <
Out
side
su
rfac
e
^* o o o o O o O o - o o
CD JZ -^ H— o CO
CD ü
2 CO CO t
~ CO
co o o T— CM o O O O o T— o
03 Q. CO Z5
_o CO >
i_ CD
CO
(M o - o - o - o o o o o
CO
'c
o CD X
CD CD "O ü 'co i5
O co
eg o - - <sf *- - o - - - o
o X! CD x:
X2 TO
■S 8 T3 CO CO t C ZS — CO
"tf CO - o CO CM CO o o o o o
C M—
CO x: ü
C '■f
O o
M— I
CD i_ o
0) ^ .13 CO CO t
CO
o 1— O o CM - o O o o o o
o Q_ CD ^_ CO i— CD CD *—<
i_ CD
CO
o o o o O - CO O o o o o
L. =i O >
H— o CD
X o
XJ CD O 1-
CD CD "D Ü 'co cö
O CO
o o T— o - - CO o o co o o
X2 E zs
CD x: H
!_ CD
8-8| •- §3
CO
- o o o LO CO CM o o o o o
XI CO h-
O XJ ° E CD §
c
- CM CO M- LO CD
...
N- CO o> o -
CM
CM CD
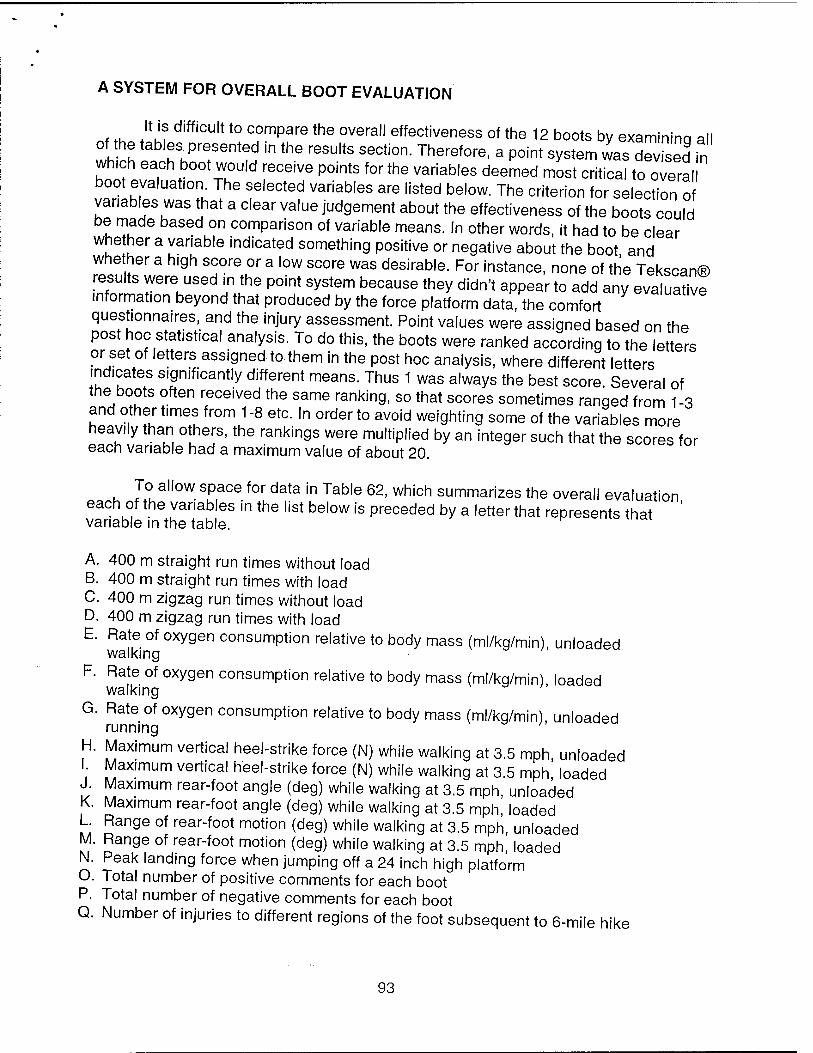
A SYSTEM FOR OVERALL BOOT EVALUATION
«f th }XiH diffiCUlt t0 compare the overaM effectiveness of the 12 boots by examininq all of the tables presented in the results section. Therefore, a point system was 3 in
wh,ch each boot would receive points for the variables deemed most critical to overal boot evaluation The selected variables are listed below. The criterion for selection of variables was that a clear value judgement about the effectiveness of the boots could be made based on comparison of variable means. In other words, it had to be clear whether a variable indicated something positive or negative about the boot and whether a high score or a low score was desirable. For instance, none of the Tekscan® results were used m the point system because they didn't appear to add any evaluative information beyond that produced by the force platform data, the comfort questionnaires, and the injury assessment. Point values were assigned based on the post hoc statistical analysis. To do this, the boots were ranked according to the letters or set of letters assigned to them in the post hoc analysis, where different letters indicates significantly different means. Thus 1 was always the best score. Several of the boots often received the same ranking, so that scores sometimes ranged from 1-3 and other times from 1 -8 etc. In order to avoid weighting some of the variables more heavily than others, the rankings were multiplied by an integer such that the scores for each variable had a maximum value of about 20.
To allow space for data in Table 62, which summarizes the overall evaluation each of the variables in the list below is preceded by a letter that represents that ' variable in the table.
A. 400 m straight run times without load B. 400 m straight run times with load C. 400 m zigzag run times without load D. 400 m zigzag run times with load E. Rate of oxygen consumption relative to body mass (ml/kg/min) unloaded
walking
F. Rate of oxygen consumption relative to body mass (ml/kq/min) loaded walking
G. Rate of oxygen consumption relative to body mass (ml/kq/min) unloaded running
H. Maximum vertical heel-strike force (N) while walking at 3.5 mph unloaded I. Maximum vertical heel-strike force (N) while walking at 3.5 mph' loaded J. Maximum rear-foot angle (deg) while walking at 3.5 mph, unloaded K. Maximum rear-foot angle (deg) while walking at 3.5 mph, loaded L Range of rear-foot motion (deg) while walking at 3.5 mph, unloaded M. Range of rear-foot motion (deg) while walking at 3.5 mph, loaded N. Peak landing force when jumping off a 24 inch high platform O. Total number of positive comments for each boot P. Total number of negative comments for each boot Q. Number of injuries to different regions of the foot subsequent to 6-mile hike
93
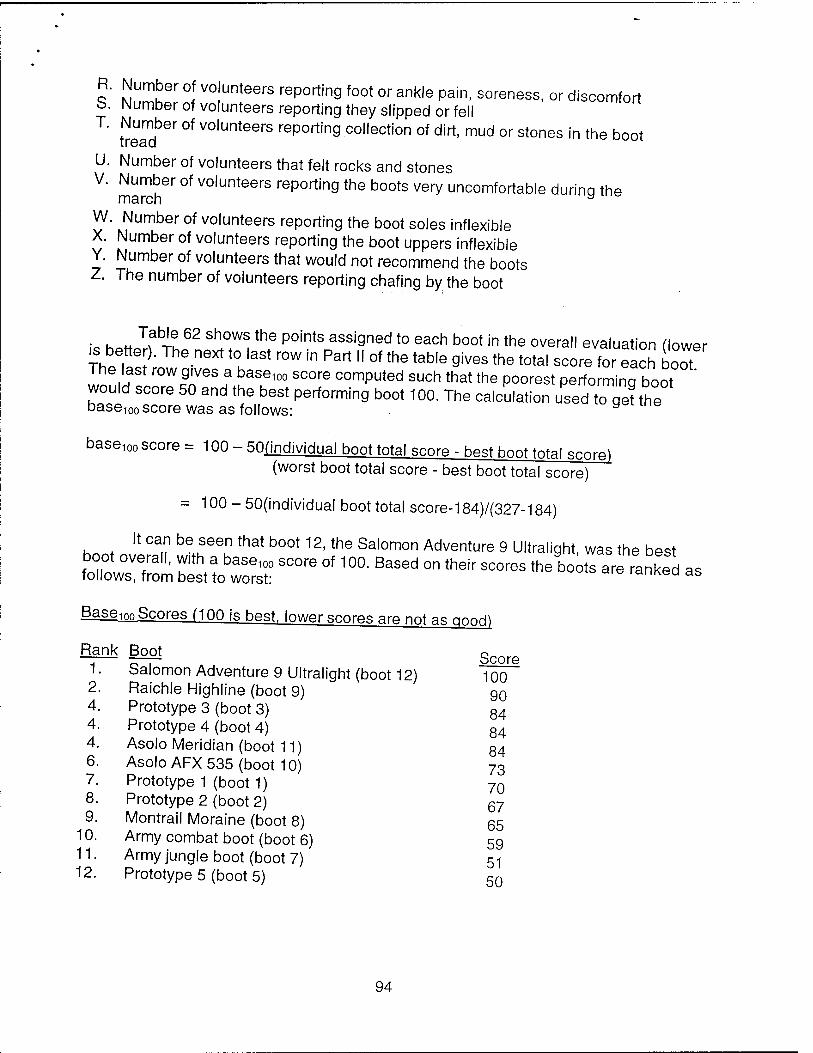
R. Number of volunteers reporting foot or ankle pain, soreness, or discomfort b. Number of volunteers reporting they slipped or fell s T Number of volunteers reporting collection of dirt, mud or stones in the boot
U. Number of volunteers that felt rocks and stones V. Number of volunteers reporting the boots very uncomfortable during the
march y
W. Number of volunteers reporting the boot soles inflexible X. Number of volunteers reporting the boot uppers inflexible Y. Number of volunteers that would not recommend the boots Z. The number of volunteers reporting chafing by the boot
k hot Jf r! 62 Sh°W^ the P0htS assi9ned t0 each boot in the overall evaluation (lower ThP It?' neXt t0KlaSt r°W in Part " °f the tab,e 9ives the total «core for each booT The last row gives a base100 score computed such that the poorest performing boot would score 50 and the best performing boot 100. The calculation used Zet the base100 score was as follows: y
base100 score = 100 - 50(individual boot total score - best boot total snom) (worst boot total score - best boot total score)
= 100 - 50(individual boot total score-184)/(327-184)
It can be seen that boot 12, the Salomon Adventure 9 Ultralight, was the best
££Ä CÄ SC°re °' 10°- BaS8d °n th8ir —the b00tS - -^ - Base100 Scores (100 is hest. lower snores are not as gnnH)
Rank Boot Score 1. Salomon Adventure 9 Ultralight (boot 12) 100 2. Raichle Highline (boot 9) g0
4. Prototype 3 (boot 3) 84
4. Prototype 4 (boot 4) 84
4. Asolo Meridian (boot 11) 84
6. Asolo AFX 535 (boot 10) 73
7. Prototype 1 (boot 1) 70
8. Prototype 2 (boot 2) 67
9. Montrail Moraine (boot 8) 65 10. Army combat boot (boot 6) 59 11. Army jungle boot (boot 7) 51 12. Prototype 5 (boot 5) 50
94
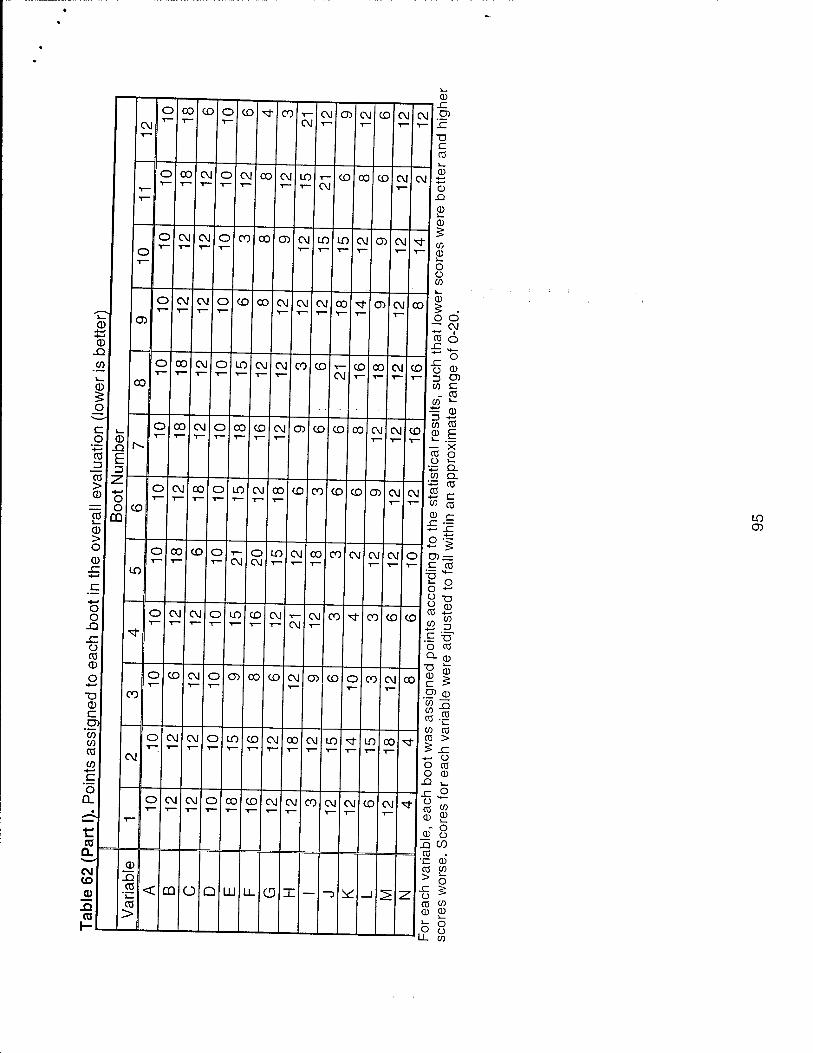
oo CD CO CO C\J CM
CM CD CM CD CM CM
CD x:
TS c CO
CD
0
to
CD
o
O)
c o
*■*—'
Cd _3
CO > CD
15 CD > o CD
o o
-Q sz o CO CD
CD c D)
'to to CO to
■4—«
c 'o
CO Q.
CM CO
ro
00
00
CM
CM
CM
CM
CM
00
M oo
CM
CO
CD
CM
CM
CO
CO
00
CM
CD
in
CM
m
CD
LO
CM 00
o oo
oo
CO
CM
CD
CM
LO
CM
CM
CM
CM
LO
CD
CD
CM
CM
CO
CM
LO
CO
CD
CD
CM
CD
CM
CM
CM
CM
CM
LO
00
CD
CO
CM
CD
CD
CM
CM
CM
CM
CD
LO
CD
CD
CM
JD X!
•£l< CO >
CÜ
CM
CM
CM
CM
CO
CD
CD
CD
CO
CM CO
CM
CO
CD
CO CO
CM
00
LO
Ü Q
CO
CD
CD
CM
CM
00
CD
LU U_
CM
O
CD
CD
CM
CD
CM
CD
CM
CD
CM
CM
CO
CM
CO
CM
CD
CM
CM CO
ID
CO
LO
CD CD
CM
CM
~3
CM CD
00
CM
00
0 .4—1
CD X! 0 0
to I— o Ü to
0 5 . o o
s™ CO o
o 0 Z3 03 CO C - CO
to "-
CO CO
2.1 8 s CO Q_
w co
o -^
D) = C CO
is " -a o 0 CO •*->
to §
O CO
O- 0 73 0 0 s c > O) CD CO 25 W CO CO .2
CO CO CO >
*- Ü O CO O 0
x> ,_ ■c ■£ o 0 £
JD 8 XJ CO co . ™ 0 CO w
> o "5 * co w CD 0
U- w
LO CD
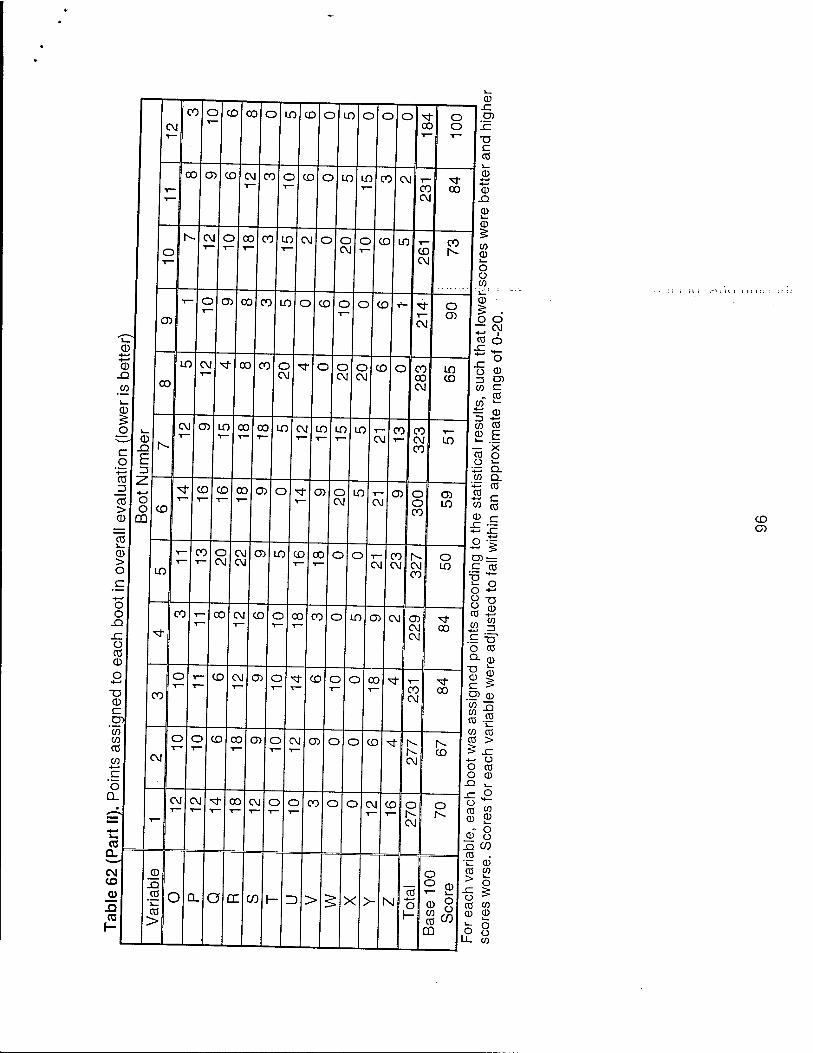
CD O
DISCUSSION
Many significant differences were found between the boots in regard to many variables that reflect the boots' effectiveness in preventing injury to the soldier and enhancing performance. The extensive data produced by the experiment should allow fact-based decisions concerning military boot design.
The variables addressed in this experiment covered most of the three levels of requirements of military boots specified by Hamill and Bensel (6). The 400 m straight and zigzag runs with and without a load addressed the locomotor capabilities of the wearer. The oxygen uptake tests for loaded and unloaded walking, and unloaded running, addressed the efficiency of locomotion. The tabulation of injuries addressed the goal of minimizing the occurrence of lower extremity injury and pain. The requirement of providing comfort was assessed by the questions the volunteers answered about each boot after the 6 mile backpack march. Information was provided, as well, on the weight of the boots and how high they come up the ankle. This study did not address military requirements of water resistance and durability of the uppers or soles, nor maximal unit cost or production factors. Such considerations may impede adaptation of boots or boot features that performed very well on our tests.
Despite the fact that, in their boot materials testing study, Hamill and Bensel (6) found the black leather combat boot and the hot weather jungle boot to show poorer impact attenuation than commercial footwear, as measured by peak deceleration, time to peak deceleration, and peak pressure, we found that these two current-issue boots did not show high foot impact forces during both unloaded and loaded walking. The reason is likely that the walker makes subconscious adjustments in gait in response to the hardness of the footwear. Thus the hard soles of the current-issue military boots likely caused gait adjustments so that the volunteers did not strike the ground forcefully. These results are in contrast to the human testing of Hamill and Bensel (8) in which they found that the jungle and combat boots produced higher peak impact forces than commercial footwear. However, Hamill and Bensel found no difference between the various boots for foot impact force during running, and sometimes lower impact for the military boots.
Hamill and Bensel (9) showed no difference among footwear as to the heart rate or oxygen consumption of males. In contrast, we found a number of significant differences among the boots as to oxygen consumption during unloaded and loaded walking, as well as running.
Just as in the study of Williams et al. (17) who compared current-issue combat and jungle boots to commercially available boots, and a hybrid boot composed of the outer shell of the jungle boot and a non-standard polyurethane sole, we found that, with the exception of prototype boot 5, the prototypes and the commercial boots were superior overall to the standard leather and jungle boots. Their conclusion, that optimal characteristics of commercially available boots can be combined to create a military prototype boot surpassing those in current use, is in keeping with ours.
97
We observed ground impact landing forces following a jump from a 0 6 m hiqh box to be in the range of 7 times body weight. This is in the general range of the 6 times bodv weight landing forces observed by McNitt-Gray (13). In contrast to the finding of Hamill and Bensei s (9), the footwear with the highest uppers did not produce the longest times for agility runs. One reason might be that the agility runs were not of the same type Another reason might be that although the prototype boots were high, they were more flexible than are the current-issue combat boots.
CONCLUSIONS
The boots are discussed below in the order of their rankings, from best to worst:
• The Salomon Adventure 9 Ultralight (boot 12) is the best boot of those tested It ranked highly as to almost all the critical variables, and was particularly stronq as to subjective ratings of the volunteers. It was the only boot that not a single volunteer would not recommend for military use. None of the volunteers found the boot uncomfortable.
• The Raichle Highline (boot 9) was a very good all-around boot. It was excellent as to subjective volunteer ratings, shielding the foot from rocks and stones, boot upper flexibility, and preventing chafing. K
The following 3 boots all had the same score » Prototype 3 (boot 3) was a fairly good boot which performed well as to control of
rear-foot motion during unloaded walking, boot upper flexibility, and lack of chafinq Most of its other scores were mid-range.
• Prototype 4 (boot 4) was superior in keeping the foot from pronating. It received a lot of positive comments, had good sole flexibility and didn't chafe. Its weaknesses were high heel-strike force and poor shielding against rocks and stones
• The Asolo Meridian (boot 11) was also a good all-around boot. It scored very well in minimizing impact in the jump landing, volunteer perceptions of comfort and lack of chafing. It was generally mid-range for the remaining variables, except for poor showings on the 400 m straight run with a load and heel-strike force while walkina with a load. a
The Asolo AFX 535 (boot 10) scored very well as to perceived comfort, prevention of slipping, and rate of oxygen consumption during unloaded walking. It performed poorly at preventing foot or ankle pain, soreness or discomfort and had a stiff sole Prototype 1 (boot 1) scored very well as to flexibility of both the boot uppers and sole, perceived comfort, attenuation of heel-strike force during loaded walkinq and attenuation of impact during jump landing. However, it didn't score strongly on most other variables, and produced several reports of foot or ankle pain, soreness or discomfort.
Prototype 2 (boot 2) scored very well as to flexibility of both the boot uppers and sole, lack of chafing, and attenuation of impact during jump landing. However it didn t score strongly on most other variables, and scored poorly as to heel-strike
98
force during unloaded walking, ankle stabilization, and number of reports of foot or ankle pain, soreness, or discomfort.
• The Montrail Moraine (boot 8) scored very highly as to attenuation of heel-strike force during both unloaded and loaded walking, positive volunteer comments, prevention of foot injuries, prevention of slipping, protection against rocks and stones, perceived comfort, and prevention of chafing. However, the boot had several weak areas and performed poorly on the 400 m straight run with load, control of rear-foot motion, and collection of dirt and stones in the sole. Both the boot uppers and soles were perceived as inflexible.
• The current-issue Army combat boot (boot 6) was third from last as to overall score. It scored well as to attenuation of heel-strike force during walking and prevention of dirt buildup in the boot tread. However, many other scores were fair to poor. The boot garnered its worst scores on the 400 m zigzag run without a load, rate of oxygen consumption during unloaded running, number of reports of foot or ankle pain, soreness or discomfort, and sole stiffness. Fully half of the volunteers said they would not recommend the boot for military use.
• The Army jungle boot (boot 7) scored next to last of the 12 boots. The boot scored well as to prevention of dirt and rock buildup in the sole tread and flexibility of the boot uppers. However, the boot scored poorly on the 400 m straight run with load, rate of oxygen consumption during unloaded walking, number of reports of foot or ankle pain, soreness, or discomfort, and number of slips and falls. Fully half of the volunteers said they would not recommend the boot for military use.
• Prototype 5 (boot 5) was the worst boot of all. While it scored well in prevention of pronation during both loaded and unloaded walking, resistance to collection of dirt and stones in the boot tread, and flexibility of both uppers and soles, it didn't score well on most other tests. Its most outstanding weaknesses were at the 400 m straight run with load; rate of oxygen consumption during unloaded and loaded walking; heel-strike force during loaded walking; number of injuries subsequent to the 6 mile hike; number of reports of foot or ankle pain, soreness, or discomfort; number of reports that the boots were very uncomfortable; and boot chafing. Fully half of the volunteers said they would not recommend the boot for military use.
Knowledge of which boot did the best on each test can help determine which features of each boot may be worth incorporating into a future military boot. Therefore, the best performer on each test is indicated below:
• The 12 boots did not differ as to 400 m straight run time without load. • Prototype 3 produced the fastest 400 m straight run times with load. • Prototype 5 and the Salomon boot produced the fasted 400 m zigzag run times
without a load. • The 12 boots did not differ as to 400 m zigzag run times with load. • The Asolo AFX 535 produced the lowest rate of oxygen consumption for unloaded
walking. • The Salomon boot produced the lowest rate of oxygen consumption for loaded
walking.
99
The Salomon boot produced the lowest rate of oxygen consumption for unloaded running.
The Montrail Moraine produced the lowest maximum vertical heel-strike force during unloaded walking. Prototype 1 produced the lowest maximum vertical heel-strike force during loaded walking.
Prototypes 4 and 5 were best at controlling foot pronation during unloaded walking Prototype 5 was best at controlling foot pronation during loaded walking. Prototypes 4 and 5 were best at controlling range of rear-foot motion durinq unloaded walking.
Prototype 4 was best at controlling range of rear-foot motion during loaded walking The Asolo Meridian was best at attenuating peak landing force when jumpina off a 24 inch high platform.
The Raichle Highline received the greatest number of positive comments. The jungle boot and Asolo Meridian received the fewest negative comments The Montrail Moraine produced the lowest number of foot injuries consequent to the 6-mile hike. NOTE: The only injuries evidenced during the study were friction- related ones, including chafing, hot-spots, and blisters. The Montrail Moraine, Raichle Highline, and Salomon Adventure produced the fewest complaints of foot or ankle pain, soreness, or discomfort. The Salomon boot produced the fewest number of slips or falls (none). The Army combat boot produced the least collection of dirt, mud or stones in the boot tread.
The Raichle Highline provided the best protection against rocks and stones All the commercial boots except the Raichle Highline were best at comfort in producing no complaints of extreme discomfort during the 6 mile march. Prototypes 1,2,4, and 5 had the most flexible soles. Prototypes 1, 2, 3, and 5, as well as the Raichle Highline and Salomon Adventure had the most flexible uppers. The Salomon received the most recommendations for use as a military boot. The Montrail Moraine and Salomon boots produced the fewest reports of chafing.
RECOMMENDATIONS
Of the prototypes, boots 3 and 4 produced the best overall test results Because the Solomon boot was so clearly superior to the other boots and the Raichle Highline was a strong second place, some of their features are worthy of consideration for incorporation into a future military boot. However, the fact that these two commercial boots were from non-U.S. manufacturers (Salomon from France and Raichle from Switzerland) may prevent the inclusion of specific proprietary features into U S military boots. Licensed manufacture in the U.S. of foreign products or components is a possible solution.
100
It is important to note that we did not perform some essential off-the-wearer tests on the boots, such as tests for resistance to wear, water, organic liquids, heat, flame, etc. Neither did we test how the boots function after being used for several months. Evidence from such tests should be combined with evidence from our experiments for overall boot evaluation.
101
8.
REFERENCES
1' Prtn69C4^8-46d1 J SsT"' ^ bi°meChaniCS durin9 Wa,kin9 and run™9- Mayo Clin
2. Clarke, T.E., E.C. Frederick, and C. Hamill. The study of rear-foot movement in running. In Sport Shoes and Plavina Surfaras E.C. Frederick (Ed.) Champaign, IL: Human Kinetics Publishers, 1984, pp. 166-189
3. Clarke T.E., E.C. Frederick, and H.F. Hlavac. Effects of a "soft orthotic device on reartoot movement in running. Podiatric Sports Medicine 1(1):20-23 1983
4. Dempster, W.T. Space requirements of the seated operator. WrightPatterson Air Force Base Technical Report WADC-TR-55-159,1955.
5. Department of the Army, Headquarters. Foot Marches. Washinqton D C FM 21-18, 1990. " ' '
6. Hamill, J. and C. K. Bensel. Biomechanical Analysis of Military Boots Phase 1 Materials Testing of Military and Commercial Footwear. U.S. Army Natick Research, Development and Engineering Center Technical Report NATICK-TR-93/006, October 1992.
7. Hamill, J. and C. K. Bensel. Biomechanical Analysis of Military Boots- Phase 2 Volume 1. Human User Testing of Military and Commercial Footwear US Armv Natick Research, Development and Engineering Center Technical Report NATICK- TR-96/011 -VOL-1, February 1996a.
Hamill, J. and C. K. Bensel. Biomechanical Analysis of Military Boots- Phase 2 Volume 2. Human User Testing of Military and Commercial Footwear U S Army Natick Research, Development and Engineering Center Technical Report NATICK-TR-96/012-VOL-2. February 1996b. Hamill, J. and C. K. Bensel. Biomechanical Analysis of Military Boots Phase 3 Recommendations for the Design of Future Military Boots. U.S. Army Natick Research, Development and Engineering Center Technical Report NATICK-TR-96/013, February 1996.
Hughes, J. and N. Jacobs. Normal human locomotion. Prosthetics and Orthotics International 3:4-12, 1979.
11. Knapik J., K. Reynolds, J. Staab, J.A. Vogel, and B. Jones. Injuries associated with strenuous road marching. Mil Med 157: 64-67, 1992
12. Martin, P.E. and Nelson, R.C. The effect of carried loads on the walking patterns of men and women. Ergonomics 29:1191-1202, 1986. McNitt-Gray, J. Kinematics and impulse characteristics of drop landings from three heights. International J Sport Biomech, 7:201-224, 1991 Nigg, B.M., A.H. Bahlsen, S.M. Luethi, and S. Stokes. The influence of running velocity and midsole hardness on external impact forces in heel-toe runninq Journal of Biomechanics. 20:951-959, 1987.
15. Robinson, J.R., E.C. Frederick, and L.B. Cooper. Systematic ankle stabilization and the effect on performance. Med Sei Sports Exerc, 18:625-628 1986 Ross, D. If your boots are giving your feet fits, simple remedies are at hand. Backpacker June 1996, pp. 60-68 and 110-113, 1996
10
13.
14.
16.
102
17. Williams, K. M., S. K. Brodine, R. A. Shaffer, J. Hagy, and K. Kaufman Biomechanical Properties of Infantry Combat Boot Development Naval Health Research Center Technical Report NHRC-97-26, San Dieoo CA October 1997. '
18. Winter, P.A. Biomechanics of Human Movement .Inhn \A/iioy qrH Snrr N York, 1979.
103
APPENDIX A
Boot Questionnaire and Foot Injury Recording Form
104
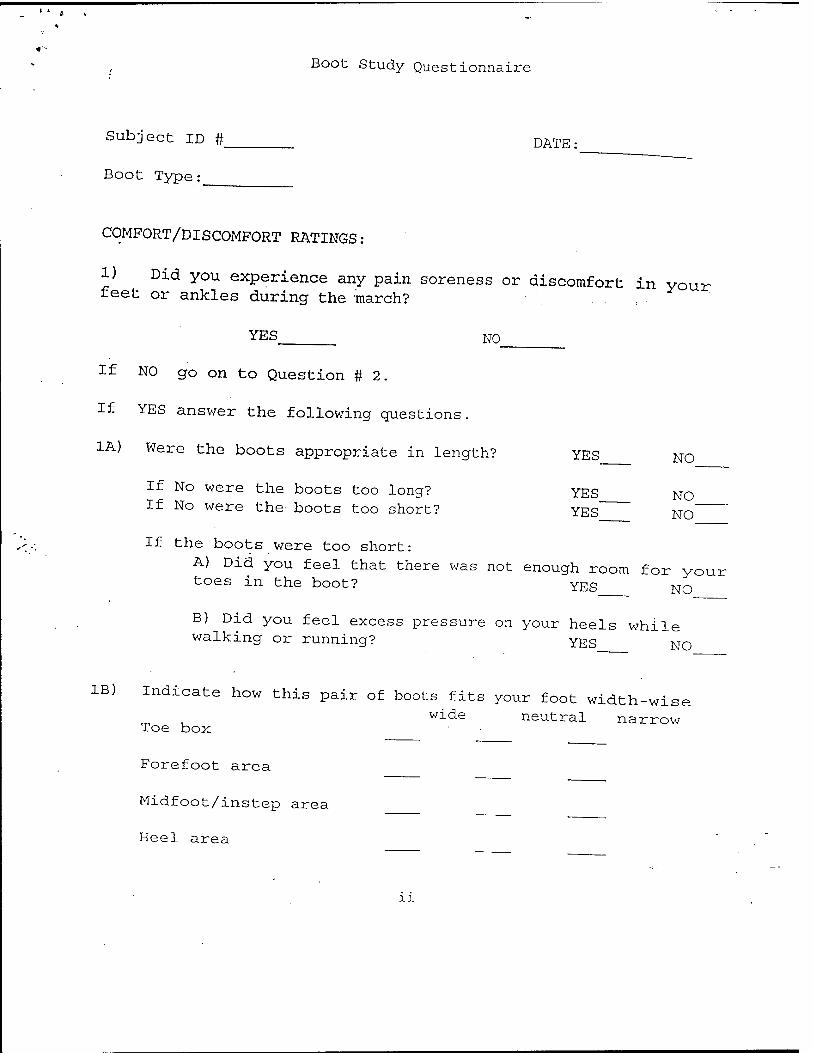
Boot Study Questionnaire
Subject ID # DATE;
Boot Type:
COMFORT/DISCOMFORT RATINGS:
1) Did you experience any pain soreness or discomfort in your feet or ankles during the 'march?
YES NO
If NO go on to Question #2.
If YES answer the following questions.
1A) Were the boots appropriate in length? YES NO
If No were the boots too long? YES NO
If No were the boots too short? YES NO"
If the boots were too short:
A) Did you feel that there was not enough room for your toes in the boot? YES NO
B) Did you feel excess pressure on your heels while walking or running? YES NO
IB) Indicate how this pair of boots fits your foot width-wise
wide neutral narrow Toe box
Forefoot area
Midfoot/instep area
Heel area
11
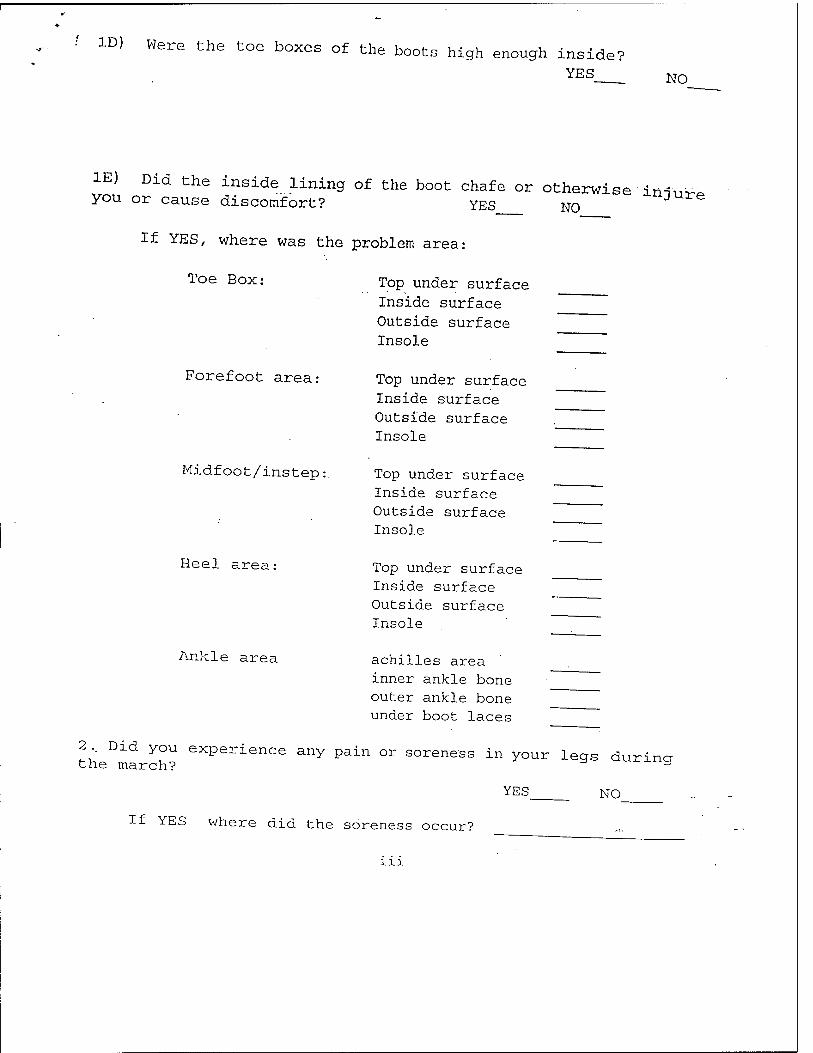
' ID) Were the toe boxes of the boots high enough inside? YES NO
IE) Did the inside lining of the boot chafe or otherwise irH^-v- you or cause discomfort? YES NO ]
If YES, where was the problem area:
Toe Box:
Forefoot area:
Midfoot/instep:
Top under surface Inside surface Outside surface Insole
Top under surface Inside surface Outside surface Insole
Top under surface Inside surface Outside surface Insole
Top under surface Inside surface Outside surface Insole
achilles area inner ankle bone outer ankle bone under boot laces
2 Did you experience any pain or soreness in your legs durina the march? <-u.j.ny
YES NO
Heel area:
Ankle area
If YES where did the soreness occur?
111
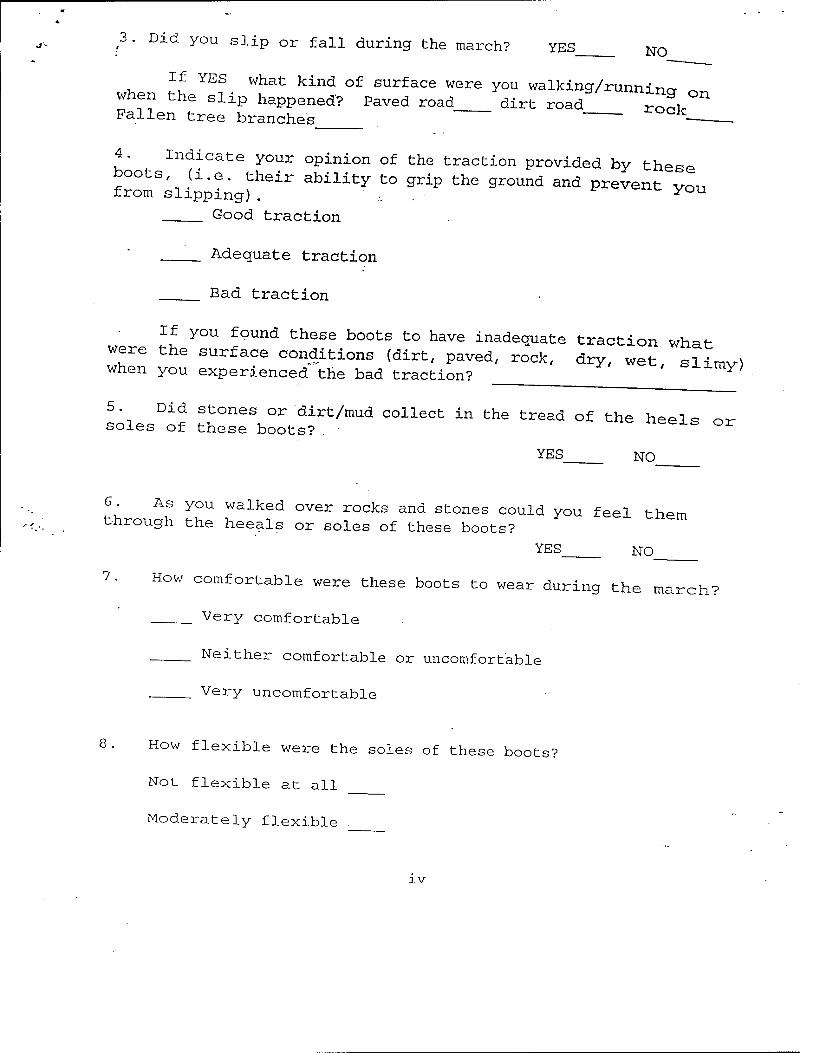
3. Did you slip or fall during the march? YES No
If YES what kind of surface were you walking/runnincr ^ when the slip happened? Paved road dirt road roL Fallen tree branches ■
4. Indicate your opinion of the traction provided by these boots (i.e. their ability to grip the ground and prevent von from slinninal r you from slipping) Good traction
Adequate traction
Bad traction
If you found these boots to have inadequate traction what were the surface conditions (dirt, paved, rock, dry, wet, slimy) when you experienced the bad traction? -Limy;
5. Did stones or dirt/mud collect in the tread of the heelq or- soles of these boots? . S or
YES NO
through IT rlk?d °Ver r°CkS and St°neS C°Uld y°U feel them through the heeals or soles of these boots?
YES NO
7. How comfortable were these boots to wear during the march?
Very comfortable
Neither comfortable or uncomfortable
Very uncomfortable
8 How flexible were the soles of these boots?
Not flexible at all
Moderately flexible .
IV
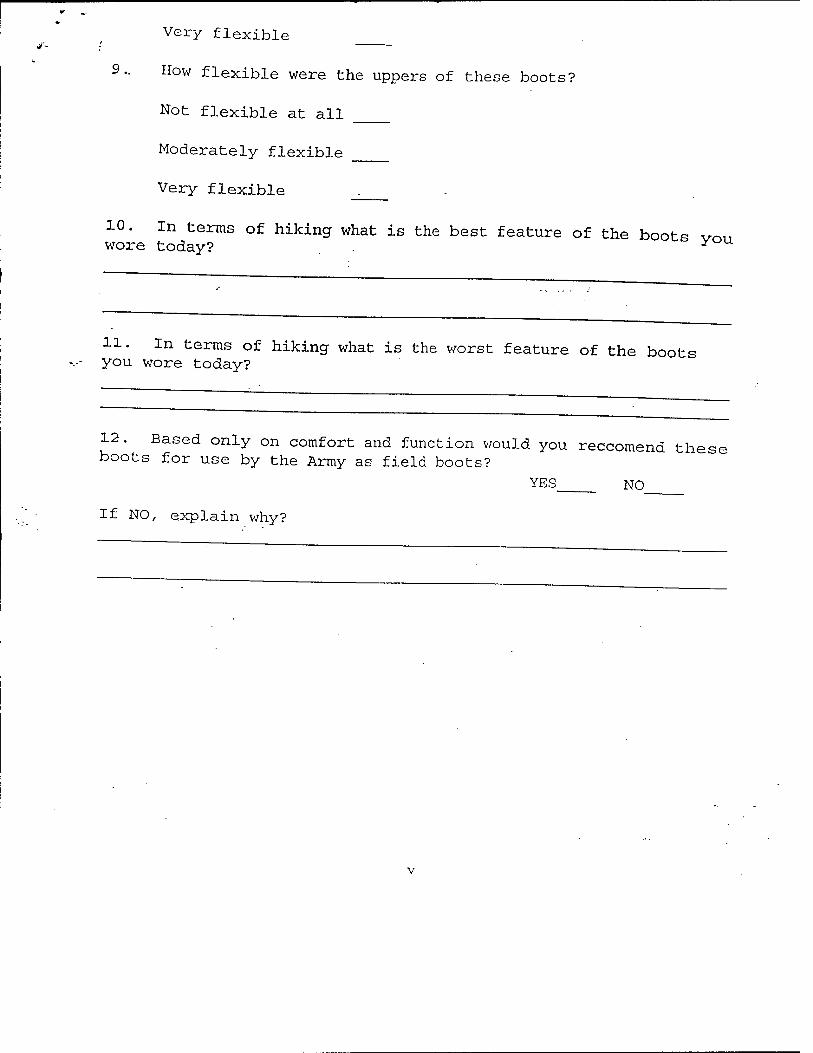
jT-
Very flexible
9.. How flexible were the uppers of these boots?
Not flexible at all
Moderately flexible
Very flexible _.
10. In terms of hiking what is the best feature of the boots v™, wore today? y
11. In terms of hiking what is the worst feature of the boot« you wore today?
12. Based only on comfort and function would you reccomend these boots for use by the Army as field boots?
YES NO
If NO, explain why?
v
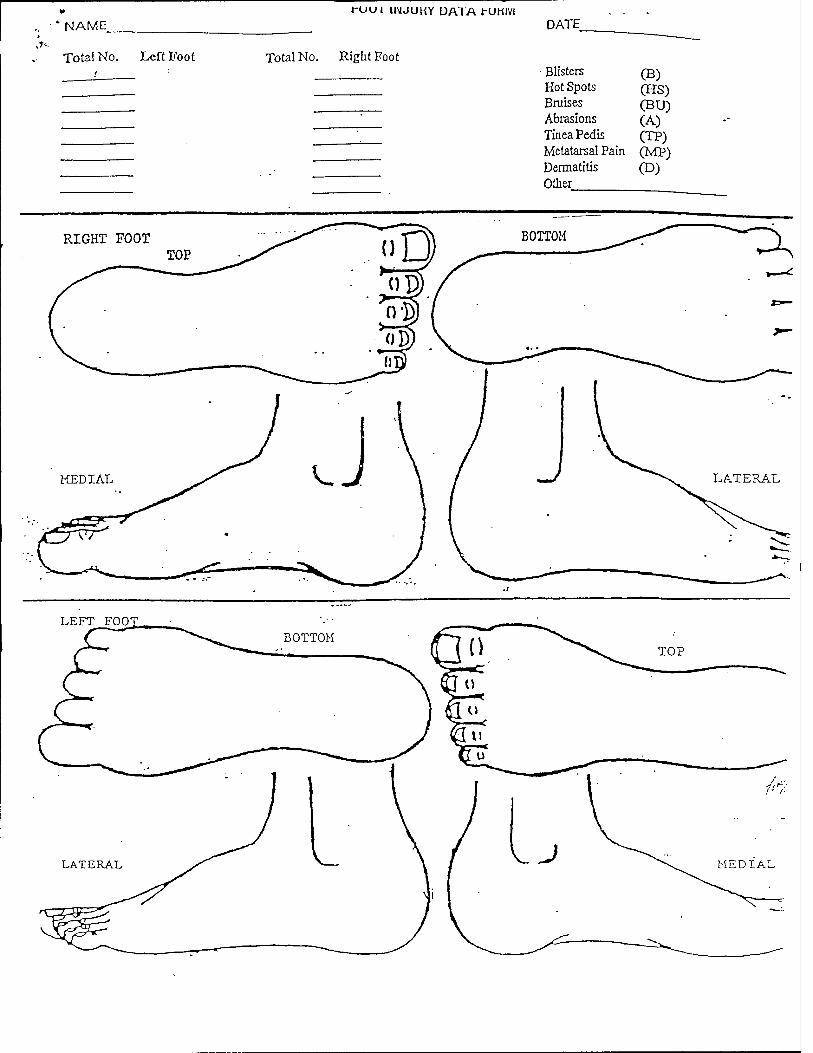
l-uui IIMJUKY DATA t-UKlVl * NAME
Total No. Left Foot Total No. Right Foot
DATE
Blisters (B) Hot Spots CHS) Bruises CBU) Abrasions (A) Tinea Pedis CTP) Metatarsal Pain CMP) Dermatitis CD) Other
RIGHT FOOT

![Dâ Ûx Zz> ZmŠúñ ì {z t wìb ã à kZLL · 2016-12-24 · iiiúúúú]]]‡‡‡‡zzzZZZzZ YYYY ~~~ggg~g††††BBBB @@**@*YYYY cŠŠŠŠBBBB ®))!*ziú òiú (¦))z×iú](https://img.pdfslide.us/doc/110x75/5e3f04fa188c3a5e627f95f0/d-x-zz-zm-z-t-wb-2016-12-24-iiiaaaazzzzzzzz.jpg)


![ÜÜÜôôôônnnnûûûÜû qqqqôôôô†††$$$$ÖÖ†Ö]]]Ö]ààààôôôô 6666 ... · ::::ììììsssszzz^^^^~~~~zzzzzzzz££££ÅÅÅÅ´´´´ââââzzzÛÛÛÛ{{{{kkkZZZkZqqqqCCCCÙÙÙÅÅÅÅ]]]ÑÑÑ»»»»](https://img.pdfslide.us/doc/110x75/5e24d3a7800fa50dd75cc341/oeoeoennnnoe-qqqqaaaa.jpg)