Embed Size (px)
Citation preview

NASA/TM--1999-209296
U.S. ARMY
RESEAflCHLABORATORY
Blade Heat Transfer Measurements
and Predictions in a Transonic
Turbine Cascade
ARL-TR-2029
P.W. Giel
Dynacs Engineering Company, Inc., Cleveland, Ohio
G.J. Van Fossen and R.J. Boyle
Glenn Research Center, Cleveland, Ohio
D.R. Thurman and K.C. Civinskas
U.S. Army Research Laboratory, Glenn Research Center, Cleveland, Ohio
August 1999
https://ntrs.nasa.gov/search.jsp?R=19990095794 2018-07-26T16:44:33+00:00Z

The NASA STI Program Office... in Profile
Since its founding, NASA has been dedicated tothe advancement of aeronautics and spacescience. The NASA Scientific and Technical
Information (STI) Program Office plays a key part
in helping NASA maintain this important role.
The NASA STI Program Office is operated by
Langley Research Center, the Lead Center forNASA's scientific and technical information. The
NASA STI Program Office provides access to theNASA STI Database, the largest collection of
aeronautical and space science STI in the world.
The Program Office is also NASA's institutionalmechanism for disseminating the results of its
research and development activities. These results
are published by NASA in the NASA STI ReportSeries, which includes the following report types:
TECHNICAL PUBLICATION. Reports of
completed research or a major significant
phase of research that present the results ofNASA programs and include extensive data
or theoretical analysis. Includes compilationsof significant scientific and technical data andinformation deemed to be of continuing
reference value. NASA's counterpart of peer-
reviewed formal professional papers buthas less stringent limitations on manuscript
length and extent of graphic presentations.
TECHNICAL MEMOILANDUM. Scientific
and technical findings that are preliminary orof specialized interest, e.g., quick release
reports, working papers, and bibliographiesthat contain minimal annotation. Does not
contain extensive analysis.
CONTRACTOR REPORT. Scientific and
technical findings by NASA-sponsoredcontractors and grantees.
CONFERENCE PUBLICATION. Collected
papers from scientific and technicalconferences, symposia, seminars, or other
meetings sponsored or cosponsored byNASA.
SPECIAL PUBLICATION. Scientific,technical, or historical information from
NASA programs, projects, and missions,
often concerned with subjects having
substantial public interest.
TECHNICAL TRANSLATION. English-
, language translations of foreign scientificand technical material pertinent to NASA'smission.
Specialized services that complement the STIProgram Office's diverse offerings include
creating custom thesauri, building customized
data bases, organizing and publishing researchresults.., even providing videos.
For more information about the NASA STI
Program Office, see the following:
• Access the NASA STI Program Home Page
at http://www.sti.nasa.gov
• E-mail your question via the Internet [email protected]
• Fax your question to the NASAAccess
Help Desk at (301) 621-0134
• Telephone the NASA Access Help Desk at(301) 621-0390
Write to:
NASA Access Help Desk
NASA Center for AeroSpace Information7121 Standard Drive
Hanover, MD 21076

NASA / TM--1999-209296
U.S. ARMY
ARL-TR-2029
RESEARCH LABORATORY
Blade Heat Transfer Measurements
and Predictions in a Transonic
Turbine Cascade
P.W. Giel
Dynacs Engineering Company, Inc., Cleveland, Ohio
G.J. Van Fossen and R.J. BoyleGlenn Research Center, Cleveland, Ohio
D.R. Thurman and K.C. Civinskas
U.S. Army Research Laboratory, Glenn Research Center, Cleveland, Ohio
Prepared for the
1999 International Gas Turbine and Aeroengine Congress
cosponsored by the American Society of Mechanical Engineers andthe International Gas Turbine Institute
Indianapolis, Indiana, June 7-10, 1999
National Aeronautics and
Space Administration
Glenn Research Center
August 1999

Acknowledgments
This work was supported by the NASA Glenn Research Center under contract NAS3-98008 with Dynacs
Engineering Co., Inc., with Mr. Robert J. Boyle as monitor. The support of Ms. Mary Ann Johnston is
digitizing the data and of Mr. James Fellenstein and Ms. Margaret Proctor in measuring the
surface roughness is also gratefully acknowledged.
NASA Center for Aerospace Information7121 Standard Drive
Hanover, MD 21076
Price Code: A03
Available from
National Technical Information Service
5285 Port Royal Road
Springfield, VA 22100Price Code: A03

Blade Heat Transfer Measurements and Predictions
in a Transonic Turbine Cascade
P. W. Giel
Dynacs Engineering Company, Inc.
Brook Park. O1t 44142
G. J. Vail Foss(_ll, R. J. Boyle
NASA Glenn Research Center
(qeveland. Otl 44135
D. R. Thnrnlan and K. C. Civinskas
I r.S. Army llesearch Lal)oratory / Vehicle Technology' ('enter
NASA Glenn Research Center
(:leveland, OH 44135
ABSTRACT
Detailed heat transfer nleasurements and predict, ions
are given for a t ur[)ine rotor with 136 o of turning and
an axial chord of 12.7 cm. Data were' obtained for inlei
Reynolds numbers of 0.5 and 1.0 × 10 _, for isentropic exil
Math munbers of 1.0 and 1.3. and for inlet turbulence
int,etlsities of ().'25_ and 7.0t_. Measurelnents were made
in a linear cascade having a highly three-dimensional flow
tield resulting fl'om thick il|[et boundary layers. The 1mr -
pose of the work is to provide benchmark quality data
for l[lree-dil|lensiollal (?FD code and model verification.
Data were ol)tainc,d by a steady-stat.e t.echnique using a
heated, isothermal blade. Heat fluxes were determined
from a calibrated resistallce layer ill conjunct.ion with a
surface temperature measured by calibrated liquid crys-
tals. The results show the effects of strong secondary
vortical flows, laminar-to-turlmlent transition, shock im-
I)ingement, and increased inlet turbulence on the surface
heal transfer.
LIST OF
(', _( b. -
d -
/v+
L.r
M
P
/it) l ,
([1!
I'
II( i.
741
l
r
T _A
l:
9 +
2
d
(
0
It
ttt
P
O"
SYMBOLS Subscril)t,s
specific heat [J/kg.K] ....
blade axial chord [cm] <'u
rotor leading edge diameter [cm] /,.
thermal COll(luctivity [W/m.l(] _.,.
equivalent roughness height i,,
longitudinal integral t url)ttlence length scale [cm] L';
Math illlml)er Sul)erscripts
pressure [t'a] t
l)randtl lmml)('r
heat flux [W/re'-']
recovery fact.or, r= Pr 113
tleynolds nullll)er, l/, i,, = td "i,, ( ',/H
blade surface coordinate' [cln]
Stanton number
tlli(:kness [cm]
teml)erature [1{]
t.urbulence intensify
l.otal velocity [m/s]
equivalent normal dislam'*'
spanwise (radial)coordinate"
specific heat. ratio, _ = 1.4
.()9(_ boundary layer thickness [,'m]
emissivity
ilOlldilllellSiolla] surface telllp,f'l';ll iil,t,
= (y,_ - 7;,,,)/(7_.,, - 7L)dynamic viscosity [kg/s-m]
turbulent eddy viscosity [kg/s.m]
density [kg/m a]
Stefan-Boltzlnanl| ('onstald
adiabatic wall teml)erature
copl)er substrate
liquid crystal
exit. freest.ream value
inlet, fre_,st, ream vahle
isentropic value
total conditions
NASA/TM--1999-209296 1
INTRODUCTION
ttighly detailed heat transfer data at. conditions ap-
proximating those in actual engines are needed to ver-
ify conlputational fluid dynamic (CFI)) predictive analy-
ses. Accurate local heat transfer predictions are required
to improve blade service life and to reduce cooling re-
quirements. Accurat.e heat transfer measurements for
(!!"1) veritication require the good spatial resolution of
a large-scale facility. The large scale, Colnbiued with high
F_vynohls and Math numbers, in turn requires high mass
tlow rates per passage. A linear cascade, with fewer bladesthan a full annular cascade, provides better spatial resolu-
tion for the saute overall flow rate. Previous studies have
shown that rotor geometries in linear cascades provide
good midspan data as compared to their rotating equiva-lents. See, tk)r example, Baugtm vtal. (1995) or Guenette
et al. (19_.q). Also, (;raziani et al. (1980) studied the ef-
t'ect.s of thick and thin endwall.boundary layers Oll rotorheat transfer in a low speed linear cascad¢'. Blair (1994)
measured heat transfer in a low speed facility on a rotat.-
ing blade that had the same midspan section as the blade
of (;raziani etal. (1.9_0). Similar thrvt_-dimensional heat
lransfer patterns were observed at and below nlidspan ofthose two tests. Linear cascades can and have also been
used to study tip clearance heat lransfer, but the eurrenl
study eluphasizes blade data away from the lip region.
Although many t.urbinv applications use film coolingfor blade lemlwrature control, data withoul film cooling
are needed to validat, e predictions of l,eat transfer coeffi-
cients. With tilm cooling present, difl'eretwes between the
analysis and dala could be due to dilferences in eitherheal transfer coetticient s or in the film effectiveness dis-
tribution. Transition influences blade heat transfer, while
endwall flows are more likely to be turlmlent. Transitionis not an issue in film cooled blades, where the film cool-
ing trips the flow to turl)ulent. However, it is important
to accurately predict transition, both for heat transfer ona non-tihn cooled blade, and for the aerodynamics of the
low pressure turbine where heat transfer data can be usedto vvrit)' transition predictions. Secondary flow effects onhe;a! transfer ditfe," between the blade and eudwall.
Aerodynamic and heat transfer data are needed atthe same flow conditions to thoroughly understand the
flow physit's. The objective of the current study is to
I)rovi(tv a detailed, high Mach numt)vr rotor blade heattransfer data sel 10 CFD code developers and users so
tha! they can better manage the uncertainty associatedwith heat transfer predictions. The current st.udy, along
with the aerod_ namic study ((;tel el al., l.q.q6a), and the
en(Iwall heat transfer study ((;iel et al., 1998), t)rovide a
complete and detailed data set for (TD co(Iv and model
validation. A baseline 3-D (TD analysis is included to
illustrate where improved modeling is needed.
Along wit.h the studies mentioned above, tie-
tailed measurenlents were reported by Goldstein and
Spores (1988) and (;oldstein el al. (1995) for rotors in
large scale low speed linear cascades. These studies
used a naphthalene sublimation lechnique while Graziani
etal. (1080) used heated blade and eudwall surfaces.
I)unn el al. (1994) measured rotor heat transfer at dis-
crete chordwise and spanwise locations in a shock lube fa-
cility at. engine-typical gas-to-wall temperature ratios andMach nulnbers. These tneasurenlonts were on engine-size
hardware using heat flux gauges. ('.onsequcntly. lhc res-
olution was less than for the large scale facility measure-
merits. Martinez-Botas etal. (199:1) used a liquid crystal
technique t.o measure heat transfer for an uncoolcd statorin a blowdown annular cascade at transonic conditions.
The NASA Glenn Research Center Transonic Turl)ine
Blade Cascade provides heat transfer and aerodynamic
data to verify CFD analyses. I)ata were obtai,led for eightdifferent flow conditions, and illustrate the effects of vary-
ing Reynolds nulnber, exit Mach number, and inlet turl)u-lvnce. Measuremenls were made at. inlvl R%'llolcts num-
bers of t1.5 and 1.0 × 10';, and exit pressures correspond-
tug to isentropic Math numbers of 1.0 and 1.3. Tests were
conducted at high and low inlet t urlmlencv l_,vels. Twvh, v
blades ensured good periodicity. The axial chord was
12.7 era. The Reynolds and Mach nunlbers are relevant
to high pressure turbines where heat tralJsf'er is critical.
Results herein show the effects of shock/boundary layer
interactions and of longitudinal vortices on blade heattransfer, which become more significan! as Math num-
bers and flow turning increase.
The rotor, of constant cross section, is highly loaded
with 136 degrees of turning, and an inlet flow angle of 63.6
degrees. The cascade geometry is Iwo-dimensiona[, but
the flows are highly three-dimensional due to thick bound-
ary layers developed on the long cascade inlet. Each
boundary layer was one-third of the half-span. The full
span-to-axial chord ratio was 1.2. The thick boundarylayers and high flow turning resulted in spanwise flow vari-
ations as large as those seen in rotating l urbiues. See, for
example, .loslyn and l)ring (19.97) or Thulin el al. (l.q_2).
These variations result from secondary flows, and accu-
rately predicting them is a significant test of a three-
dimensional analysis. Tests were don_" with and without
a blown, square bar grid upstream of the blade row.
IMng liquid crystals to measure heat transfer gave
good spatial resohttion. Several versions of liquid crystal
measurenlent techniques have been used for gas t.urbiuerelated measurements. A transient technique was used
by Martinez-Bot.as el al. (1994), and a st.early-state tech-
nique was used by Hippensteele el al. (1985). The rough-
ness of the liquid crystals is documellted because of its
heat transfer imt)ortance.
NASA/TM--1999-209296 2

°"_: optional,,, turbulence
_ I!gdd-N
inlet
ao.
4-
exhaust
+15-72.4 , _'x
- \' ""'i" -30
L "
63.6
r r I Ek
disk diam.t.8m ___A'
Fig. 1 Transonic Turbine Blade Cascade
Rotor shape was influenced t)y both aerodynamic
and heat transfer considerations. Predicted rotor protile
loss was (-onsisten! with current design practice. Arts et
al. (1997). Dunn el al. (19.q4), and Blair (1994) allloltg
others, showed naidspan rotor blade leading edge Ileal
transfer rates nearly twice the highest values seen else-
where on tile blade. Civinskas et al. (1990) showed heat
transfer in this region was reduced using a large leading
edge dianleter, and aerodynamic losses were not signifi-
cantly increased. The rotor shape was chosen I.o achieve
aeeel)tabh" aerodynamics with a lower than typical ra-
t.to of peak-to-average heat transfer. This lower peak-
to-average heat transfer had a secondary t)enefit in that
measuring heal t.ransfer ow, r a narrower range inherent 13'
reduces experinlenta] uncertainly.
DESCRIPTION OF FACILITY
Cascade Description All initial facility deseril)tion
was given by Verhoff et al. (19.q2). The cascade inh'l
section was analyzed and redesigned ((;tel el al. 1.9!)(fl))
to inlprove inlet tlow l)illelm, ise unifortnity. Figure 1 showsall overall view of the redesigl|ed facility. Passage I is at
the upper left and passage 11 is at the lower right.
High pressure, anll)ient tenlperature air was throttled
to an inlet total pressure near one atmosphere for the high
Reynolds number tests. Low tleynolds number tests had
an inlet total pressure Ileal" one-half atmosphere. The air
discharged into an exhaust header mainlained at, a 12oln-
inal pressure of 15.9 kPa (2.::{ psia). A valve between thetest section and exhaust header was used t,o maintain the
desired exit Maeh munber. Figure 1 shows the test sec-
tion mount,ed on a large disk. whMl can rotate t,o vary
inlet, incidence angle. Hesults herein were obtained at the
design inh't flow angle of 63.6 degrees. [lpst, rean_ inlet,boards were ilse([, but to luinimize downstreanl shock re-
fleet ions no exit tailboards were used. Thick boundary
layers developed in the long inlet section. Aerodynamic
probe and blade loading data w'rified tile existence of
strongly three-dinlensional passage tlow.
pressuresurl_ce
blade
suctionsurface
blade
neoprene andadhesive
Cover -_
Fig. 2 Heat Transfer Measurement Blades
Table 1 Blade and cascade parametersand dilnensions
(;eometrie paranmter Valueaxial chord
l)itch
span(,rile chord
stagger anglethroat (limension
t]lroat area: 1 passage
leading edge dianleter
trailing edge dianleter
turl:)ulence grid
12.70 cnl (5.000 inches)
13.00 em (5.119 inches)
15.24 e|n (6.000 inches)
18.,12 e|n (7.250 inches)4 1.54 °
3.35_ em ( 1 .'L93 inches)53.!)4 era'-'
2.657 (-Ill (1.(/46 inches)
0.518 Clll (0.204 illc[les)
2.54 eln square I)ar
Flow paranleter Value
Inlet Reynolds No.
Exit lteynolds No.Inlet Maeh N<)., All,S'
Exit l\lach No., :ill,s"
Inlet _ - no grid
with grid
lnlet flow angle
I)esign flow turning
0.5 × lff; o2' 1.0 × 1()";
0.9 × 10'; or 1._ × 1()';
0.38
1.32 or 0.98
3.2 cm (1.2 inch)
2.0 tin (0.8 inch)(i3.6 °
1360
Blade and cascade details are given in Table 1. The
two blades fornling passage 5 were instrumented: one for
the StlCl,ioll surface and one for the I)ressure surface with
some leading edge overlap. Both endwalls were 6.35 cnl
(2.50 in.) thick clear acrylic for optical access.
NASA/TM--1999-209296 3

Measurenmnt Blade Description High strength
metal blades were fabricated from high-conductivity,
oxygen-free COl)per t,o withstand large pressure differen-
finis due to high exit Math uuml)ers. They wore under-
cut by 0.66 mm (0.026 m.) to accommodate a composite
low t herlnal conductivity layer across which heat trans-
fer rates were measnred. Figure 2 shows the layer to be
(/.15 mm (0.001i in.) of double-faced adhesive film and
0.51 rain (0.020 in.) of neoprene rubber. Liquid crystals
were sprayed on the outer surface. The adhesive tilm and
the neoprene rubber were rolled carefidly onto the cop-
[>er surface. The following transient tests were performed
to verify unii'orm bonding of both: A heat gun was nsed
to cluiekly heal tile surI%ce until the liquid crystal yellow
It,,' was visibh'. The surface was then allowed to cool.
Any regions with air bubl)les 1.1"apped ill the composite
layer respouded more slowly to the t.ransient heating and
cooling and thus appeared as obvious distortions in the
yellow line. The layer in 1his region was then l)uncl.ured
with a line hypodernde needle to eliminate the bul)lAo. In
another test., the I)Iade healers were turned on abruptly
while the test section was under a vacuum. A spanwise
liquid crystal yellow line was observed to move from the
thinner sections of the blade slowly towards tile thicker
sections. The two-dimensionality of this line further ver-
ified uniform composite layer bonding.
('ylindrica[ electrical cartridge heaters extended the
entire span of the blades jusl under the surface. They
were positioned to maintain Col)per temperature unifor-
mity within 0.15°( ' (0.25°F). Sheathed Type E 0.51 mm
(t1.(12(/ in.) Ihernloeoul)les, in copper surface grooves,
were used by feedback control circuits and a D.C. power
supply to maintain I he Col)per substrate at. a unifornt ten>
pe,'aiure. For rues! tlow condilions tile midspan copper
thermocouple temperatures were maintained to within
+0.6°( ' (+I°F). An additional row of lhermocouples at
lhe same surface distances as the midspan row was lo-
cated (i.4 111111 ([1.2.'_ ill.) from the endwall nearest the
cameras. The four thermocoul)les surrounding any poiut
on the blade were used in a bilinear (_, z) interpolation
procedure. This interpolation gave the local 7} .,, and thus
the local heat [tux at any surface local ion, elilninating the
need to correct for endwa[[ heal loss.
The composite layer Collductanee. k/t, was calibrated
in a S_'l)arate lest. A small rectangular test plate was
made of the same Col)per nlatei'ial and was instrumenled
with the salne t hermocoul_les, adhesive fihn. neoprene
rul)ber, and liquid crystals that were use(t in the blade
tests. A thin-lilm electrical heater was I)on<led to the
bottont surface and the cnrrent and voltage were care-
hilly monitored to determine the heat flux through the
plate. Thermal insulation, therntocouples, and guard
heaters were placed on the I)ottom surface and around
all four edges. Colnpressed air was blown on the sur-
face at various flow rates to in order to vary the external
heat transfer coefficient. At each blowing rate, the heater
power was adjusted until the liquid crystal yellow line
was visible. The conductance was then calculated from
the heat flux and the temperature difference between the
copper sul)strate and the liquid crystals. The composite
layer conductance, k/l, was calibrated as 41i8 W/m:'-K,
+5_7v (82.5 BTIT/hr. ft'-'.R) and was not found to vary
significantly over the range of heat fluxes tested. The
heat transfer measurement technique was first, tested on
a circular cylinder in cross-flow, and results agreed with
well-established data.
A profilomet.er measured several 5-ram traces after
the liquid crystals were sprayed on. A 60× photomicro-
graph showed that the protilometer stylus did not alter
the crystals, The arithmetic mean roughness was 6.5/ml
and the r.ln.s, roughness was 7.8 ym. Tile average spa-
tial frequency of roughness was 10.4 mm -1 so the aver-
age peak-to-peak distance was 0.097 lllnl. "Flip equivalent
roughness height was estimated to be 7 ttm. The maxi-
taunt normalized roughness heighl, k +, was estintated to
be 3.5, so frOlll a surface roughness st.andt)oint the blade
surface was hydrat, lieally sntooth. More details of the sur-
face characteristics including digitized traces and surface
FFT's are available from the amhors.
Tul'bulenee Grid Description A 74(g open area
square bar turbulence grid. 6.9 (', Ul)stream of the lnea-
surement passage, positioned normal to the inlet flow,
was used for sonte tests (see Fig. 1). Square 25 mm
(1 in.) tubes, one extending between the inlet boards
a.t midspan, interconnected to three spanwise tubes lo-
cated on 150 mm centers fornted the grid. Balanced air
at, 965 kPa (125 psig) entered the entire grid through
both ends of the spanwise tulles, and exited npstreanl
through 75 a.2 nnn (1/b inch) diameter holes. The hole.-,
were spaced uniformly on 12.7 mm (1/2 inch) centers
with 11 on each spanwise it, be and 42 on the tube ex-
tending 1)etween the inlet boards. Each row of holes was
centered on its respective square tube. The flow from
each hole directly opposed the mainstream flow. Total
mass flow front the grid was 0.65 kg/s (1.4 lb,,,/s) for all
cases, corresponding to 5c/¢, of the cascade lnass flow at
Hci,_ = 1.0 x 10 _. This grid was used m a previous end-
wall heat transfer study (see Giel et al., 1998), bnt with
no grid air. Boyle et al. (1.q98a) showed that upstream
blowing produced a more mliform mean and fluctuating
flow field compared to an unlAown grid.
MEASUREMENT TECHNIQUES
Inlet Flow Measurements Aerodynamic probe lnea-
surements were made on a plane one axial chord up-
stream of the blade leading edge plane. Ill tile I)itch-
NASA/TM--1999-209296 4
wisedirection,the measurementscoveredtl,e primaryIleal.transfermeasurenlentpassage,passage5, andhalfof the adjacentpassages4 and6. Span,wise,the mea-surenientsstartedneartheendwall,z/span = 0.042, and
extended t,o midspan, z/span = 0.50. Time mean flow
measurements were made with a calibrated 5-hole pitch-
yaw probe. Details of the measurement techniques are
giveu by Giel et al. (1.9.96a). Turbulence intensity and
integral length scale were measured with a single 5 tml
hot wire. The wire output voltage was calibrated against
a densit,y-velocity l)roducl, in a free air ,let: this COllil)eli-
saled for the fact, that pressure in the rig was lower l,han
atmospheric. Data was recorded at a sanlpling frequency
of 76.2 kHz with all antialiasing filter cutoff frequency of
25.4 kHz. 1()48576 data poiuts were recorded for cecil
length scale. The data was analyzed in 32768 blocks with
5[)(70 overlap. This resulted hi a lowest disiinguishal)le
frequelicy ()f 2.3 tlz. The resulting 63 autocorrelat, ions
were then averaged aud the result fit. with all exponential
curve of the forni r(t) = exp(-('t). Length scale was
theu COllit)uled as L.r = l:av.q/( _ as discussed ill Vail Fos-
sen el al. (1995).
Blade Static Pressure Measurements Surface
static pl'eSsllres were measured using a separate blade sol.
The t.wo blades forlning passage 5 were iust.ruuiented with
149 st, at.it pressure i,aps Oil !) spauwise t)lalleS exl.elldillg
over the entire blade span. Details of the blade static
pressure nieasurelnelltS are given I)3' GieI el. al. (1996a).
Heat T'l'ansfer Me, asllrelllents All array of dots. vis-
ible through the liquid crystals, were tirst paint,ed on l,he
outer surface. Next, two nficro-encapsulated chiral lie-
matic liquid crystals wilh different yellow-band l,empera-
tures were mixed and sprayed elite the surfaces, and ()lit()
a Sel)arate instruniented calibration plate to deterniine
their temperature characteristics. Moffat (1990) showed
thai nficro-encapsulated crystals are less sensitive to illu-
minating and viewing angles than non-encapsulated crys-
tals. No differences in isotherm location were detected
between overlapping I)hotographs.
Two liquid crystals, each with a full color bandwidth
of +1°( ', were used due 1,o surface teml)erature limits.
Low surface temperatures give high uncertainty, and high
surface temperalures cause i.he neol)rene t,o separate front
t.he surface. Tile higher leinperature crystal nieasured low
Stanton number regions and the lower t.enlperature crys-
tal measured high Siauton lnnnl)er regious. For au inlet
air tenll)erat, llre of 18°C (65°F), crystal temperatures of
38.1°C (100.6°F), and 48.1°( ' (118.5°F) were used. Ill re-
gions where data were available from both crystals, agree-
nienl between the crystals verified thai. the correct defini-
tion of St.allt.ou uunlt)er was used and that the adiabatic
wall t,elnl)erat.ure was reasonal)ly accurate.
1.0pressure side suction side
4 I0.8-t . -<: ,. I
t
'°+l + + 1- ....... i I_ _- _ i: ...... ,0.4 " " ' _ "
N " + _ ' ,' ,,, + "
0.2 .,. _ - _ ,; ,r,,, .
0.0 i I + , , , I , , , I I ' ' i i I ' ' ' i I ' ' ' I I ' ' +
-1.0 -0.5 0.0 0.5 1.0 1.5s / span
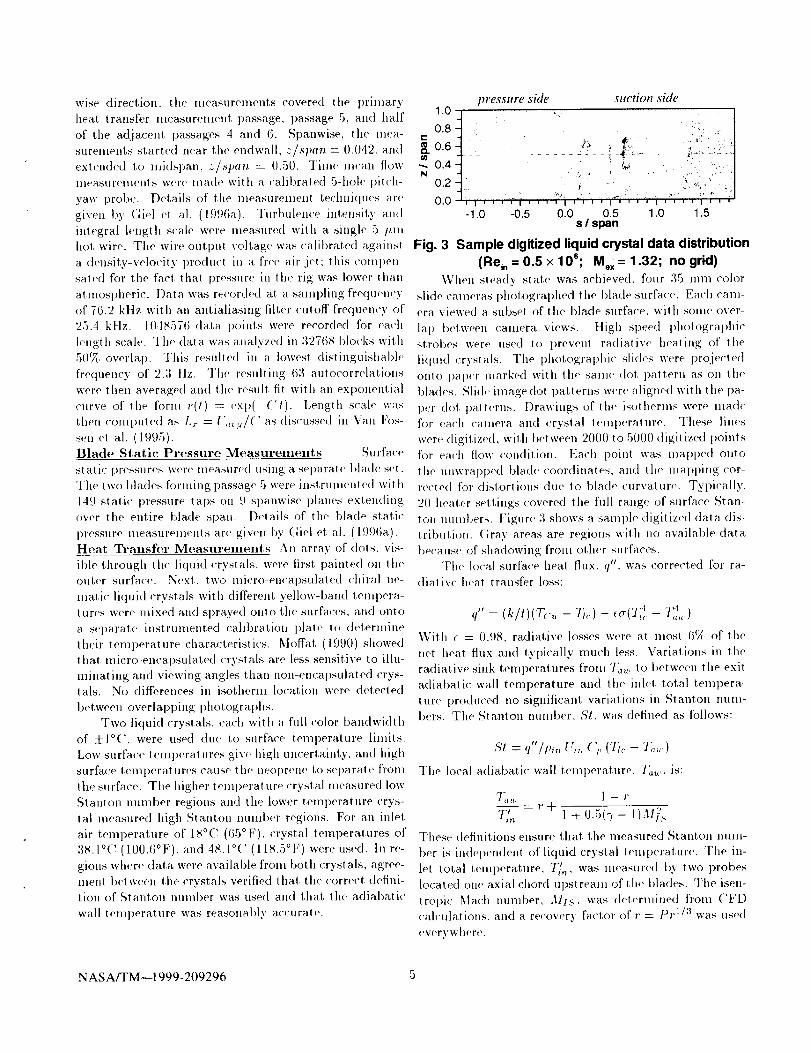
Fig. 3 Sample digitized liquid crystal data distribution
(Rein = 0.5 x lOe; M,x= 1.32; no grid)
l_,Vllell steady stale was achieved, four 35 lilnl color
slide calnoras l)hotographed the blade surface. Each canl-
era viewed a subset of the ])lade surface, with son/e over-
lap botweeu camera views, ttigh speed l)hotogral)hic
strobes were used io i)revenl radiative healing of th('
liquid crystals. The pholographic slides were projected
elite paper niarked with t,he sanle dol paltern as on the
blades. Slide image clot patterns were aligued with the pa-
per dot palterns. Drawings of the isolhernls were made
for each camera and crystal lenll)eralure. These lines
were digil ized, with between 2000 to 5000 digitized poiuts
tbr each flow condition. Each point was lnapl)ed onto
the unwral)ped blade coordiuates, alld the lliappilig col
reeled for distortions due to blade curvature. Typically,
20 healer settings covered the full range of surface Stau-
ton uuinl)ers. Figure 3 shows a sample digitized dala dis-
tribution. (ira 3 areas are regions with no available data
because of shadowing from oilier surfaces.
The local surface heal. flux, q", was corrected for ra-
diative heal transfer loss:
,/' = (klt)(Tc,, - 7)<.)- - 7);+,,.)
\Vith ( = 0.98, radiative losses were at, IIlOSI. (J(_ of the
net heat flux and typically much less. Variations m the
radiatiw> sink temperatures from 7aw to between the exit
adiabatic wall temperature and the inlet total tempera-
lure produced no significant variations in Slanton nlun-
bers. Tile Stanl,on number, St, was defined as follows:
,<,'t= q"lp., ('I)<- 7;,,,,)
The local adiat)at, ic wall l.elnperature, :]'a.... is:
7] .... 1 - r
T'. - ''+ 1 + 0.5(_ - I)MT.<
These definitions ensure that the uieasllred St.allton iiUlil-
her is indepeudeut, of lkluid crystal teniperat.ure. The hi-
let total teliiperature, _l, was liioastlrod ])3 lwo probes
located Olie axial chord upstreani of the blades. The isen-
tropic Math uulnber, ill<;, was delernihied front CFD
calculal.ions, and a recovery facl.or of r : [Jr lla was used
everywhere.
NASA/TM--1999-209296 5

I- , , , , ''"L ' ' ' ''''_I0 .... Y- ..........
0.5 Abrupt cmsmver
:=t. _ _ .... ru,,h blending -4
I'- _ ....... NhMitied tanh hlcndint, "t
0.0 Pr I | I I I I Ill I I | I |'llt7
0.1 1,0 10.0
ratio of inner-to-outer eddy viscosity, _TI/ _[TO
Fig. 4 Comparison of different blending approachesfor turbulent eddy viscosity
Uncertainty Analysis An uncertainty analysis was
l)erformed using tile method of Kline and McClintock
(1953). The lnajor sources of uncertainty are the COil-
due|ante of the low conductivity layer, 6(k/t)/(k/t) =
-t-5_/(.; the adiabatic wall temperature, aT_u. = +0.60( '
(-t-I.I)°F); the liquid crystal lemperature, aT/,. = +0.30( '
(+0.5°F); and the Col)per sul)strat.e telLlperature, aT)'u =
-+-0.30( ' (-t-I).5 ° F). The uncertainty in Ta,, assumes no till-
certainty in the recow.ry factor, r, although i! is not pre-
('isely known as shown I)3' Schliehtillg (1.q79). The overall
uncertainty in St was determi,,e(I t.o I)e less than 131.71..
This maximum uncertainty is in regions of Slant.on num-I)er less than 1 × l(1-3. For Stanton mtmbers greater
than 2 x 10 -a the uncertainty is less than 8(7(, Another
possible source of bias um'ertainty with this method istwo-dinwnsional condu('tion within the low conductivity
layer in regions of high spatial Stanton numl)er gradients.A ('onduet.ion analysis was performed to examine this er-ror. It. was found that t.he distallce froln the nlitlinnnn to
the maxinmm temperature in the region of largest spatial
gra(lie|,t was over lt) times the thickness of the low eon-
du('l.ivity layer. A gradient oflhis magnilude was found
1o have virtually no a(Iverse impact on |.he measuremenls.
CFD ANALYSIS
To illustrate where analysis iml)rovements are
needed, baseline (TI) results were done using the
three-dimensional Navier-Stokes analysis code, fCVC:aD,described I)y (:lkit,la and Yokola (1990) and by
('hima ( 19.q1). (!-type grids were generated using tilemethod of Arnone or. al. (1992). Predictions were made
using a 289 x 4.4 × 49 grid with a near wall spacing, y+ < 1.
A uniform wall tetll[)erat, llr(" was sl)ecified.
.\ two-layer algebraic tur|)ulem'e model, described I)y
(!hinla el al. (I.0.03), was used. The la_HI blending be-
lween lhe imwr and ()llle|" layers was modified 1o give
l)etlor agreen|ent with lhe data. The turl)ulent eddy
viscosity is given I)3': Ht = F/fro lanh(ItTl/lITo). Sul)-
scripts Tt and I'o refer to the |ruler and outer layers. Inthe unlno(lified blending F = I. Since the lanh(]) =
0.76, this /it is less than either the imwr or outer value
when both are equal. Other formulations, such as the[tahlwin-ix)max model rely on an abrupt cllange between
the inner anti outer regions. IlL the modified blending
F = V/(l.() + ,,,i,,((H-rl/HTo)'-', (lvrO/HT*)'-') . Figure 4
0,5 i i I i _ t i I i i i i ,I i i i t/
passage 4 _, passage 5 i passage 6
0.33
0.0 , , , , i , , , , i , , , t-2_.0 -1.5 -1.0
pitchFig. 5(a) Inlet Mach numbers without turbulence gdd
0.5 L , I i i i t I i i ; i I i i t i
t,o 30-" 0.36/ : [
_0.a0 I-
0.0-2.0 -1.5 -1.0
pitch
Fig. 5(b) Inlet Mach numbers with turbulence grid
15
105 _' ' ' i ' ' ' ' ' ' ' i ' ' ' '
0
-2.0 -1.5 -1.0
pecnFig. 5(c) Inlet turbulence intensity with grid
°3L .... : ............ '1
_r
0.0-2.0 -1.5 -1.0
p_chFig. 5(d) Inlet turbulence length scale with grid
('Oral)ares tile original and modified taMt blending with
an abrupt crossover model. The difference between the
modified blending and the abrupt crossover model is small
when PT1 < HTO. the near wall region. However, the
modified tanb blending is higher after lhe crossover point,
but rapidly returns to tile outer layer value.Transit|oil start was sl)ecified using Mayle's 11991)
model. Tu at. transition start was the Ul)stream Tu times
the ratio of t,he Ul)St,ream velo('ity to the lo('al isentroI)ic
velocity. The transition length lnodel of Boyle and Si-mon (1998b), an extension of the one by Solomon el
al. (1995) to include Math llUlllt)er effects, was used.
MEASUREMENT RESULTS
Inlet Flow Measurements hdet mean flow and tur-
bulence quantities measured one axial chord upst.ream of
the blades are shown in Fig. 5. With no turbulence grid
in place, the turbulence intensity was spatially uniformwit.h values of 0.51_, at. He'|, = 0.5 × 10'; alid ().251,,_, at
f?_i, = 1.0 x 10 t_.
NASA/TM--1999-209296

M., = 0.98
o!0:!,,,:O,:o6o
-1.0 -0.5 0.0 0.5s I span
Mex = 1.32
,.o|11o!71ol) ,,) :.
-I .o -o.5
,------ 1.o.,
/ / 0.9 ,,
1.0 1.5
0.0 0.5 1.0 1.5slspan
Fig. 6 Calculated isentropic surface Mach numberBlade Static Pressures Figure 6 shows cah'ulated
isentropic surfa('e Math number distributions on the un-
wrapl)ed blade, since blade heat transfer is largely de-
termined by flow features evident in the Ma('h num-
ber distributions. The origin, s = 0, is the geomel.-
ric stagnation line at the design inlet flow angle. (;iel
el al.. (1.9.q6a) showed that the Math numbers obtained
from the 3D Navier-Stokes ('ode describe(I earlier agreed
well with blade loading measurements. The calculated
values were used for heat transfer data reduction because
they provided signiticantly better spatial resolution than
was available from the experimental data. The surface
Mach number distributions were not affected by Reynolds
mmfl)er variations, and their siguifi('ance will be discussed
in conjunction with the heat transfer results.
Heat Transfer Measurements St.anton number con-
lours on the unwrapped blade surface are shown in
Figs. 7(a) through 7(h). The eight flow conditions are
given in Tat)le 2. Exit. Math number variation effects are
shown in alternate figures. (;rid turbulence effects are
seen by comparing alternate pairs of figures. Reynolds
number effects are seen by comparing the first four fig-
ures to the last four. Regions with no data available are
shown as gray areas, and their extent deI)ends on shadows
and local heat transfer gradients.
Figure 7(a) shows the ,qt.anton number distribution at.
Rei,, = 0.5 × 1() '_, .1I_.,- = 1.32, with the turbulence grid.
The pressure side shows a relatively fiat St distribution
with a minimum above 3 × 10 -a, increasing to 5 × 10 -3
near the trailing edge. The stagnation region is evident,
with a maximum 5,'t over (5 × 10 -3. The Stanton number
levels on the suction side of the leading edge initially drop
to between 4 × 10 -3 and 5 × 10 -a, while those on the
pressure surface decrease below 4 x 10 -3. The grid causes
Table 2 Description of blade heat
transfer cases
( :ase Hcin
1 0.502 -4- 0.003 x 10';
2 0.500 + 0.002 x 1() '_
3 0.498+ 0.005 x 10 '_
'1 0.488 + 0.001 × 10 '_
5 1.003 + 0.007 × 10'36 1.006 + 0.002 × 10';
7 0.999 4- 0.003 x 10 '_
8 0.989 -4- 0.003 x I 0 c
1.322 4- 0.003
0.985 4- 0.001
1.313 4- 0.003
0.992 4- 0.001
1.322 + 0.00l
0.9_1 4- 0.001
1.314 + 0.001
0.998 4- 0,001
7'u grid
yes
yes
no
no
yes
yes
11o
11o
(all n i,(atat, ilitie._ bas(d on 9.5% co,rid( ,c_ limits)
early transition, resulting in levels near midspan close to
£'1 = 5 × 10 -3 . The decelerating flow region (adverse
pressure gradient) evident in Fig. 6 near s/span = 0.5
('auses thickening of the turbulent boundary layer, result-
[rig ill a nlinil|ulnl ,£'1 of 3 X 10 -3. From this poiul on,
the effects of l.he secondary flows are evident. Many of
these effecls ('an be attril)uted to the vortex strn('tures
described by (;oldstem and Spores (19_8). The passage
vortex and the pressure-side leg of the horseshoe vor-
tex now apl)roach the suction surface. Heat transfer is
enhanced by the relatively cool secondary flow fluid im-
pinging on the endwall regions of the suction surface. The
vortices lift off the endwall and approach ,nidspan. Pre-
vious measurements showed the vorti('es exit the rotor
at. approximately 27)(7(, span. The throat is Ioeate(l al
s/span = 1.046 on the suction surfa('e. The supersonic
exit flow causes an oblique shock from the trailing edge
of the adjacent blade to impinge on the suction surface.
The effects of the shock/l)oundary layer interaction are
evident at s/.span = 1.3. The shork iml)ingemeut causes
a thickening of the boundary layer resuhing in lower heal
t.ransDr. After the shock, secondary flows again cause
higher heat transfer rates near the endwall. The ,qt.anton
number then de('reases as the suction surface boundary
layer again grows as the flow approaches the trailing edge.
eFigure 7(b) shows the results for (as 2, which differs
from the previous one by a reduction in exit Mach number
from t.;]2 1.o 0.98. The measurements show, as expected,
that the heat transfer on the pressure surface and on the
suction surface upstream of the throat are the same for
these two cases to within the experimental uncertainty.
Downstreanl of the throat, however, no shock is present
to interrupt the suction surface |)oundary layer and the
Stalll.O[l number contours continue smoothly to the trail-
mg edge. The secondary flow efDet.s on heat transfer are
similar to those observed by (;raziani eta]. (1980) anti I)y
Blair (1994) in the region between the hub and midspan.
Figure 7(c) shows measurentents also taken at. R(h, =
0.7) × 1()"; and at. M¢..r = 1.32. but. with no inlet turlmlence
NASA/TM--1999-209296 7
pressure side suction side
i °°........J - i"_0.,1( 4/
0.0 l, ,,,,_; i, , , ....-_.o -o.5 o.o 0.5 _.o _.s
(a) Re_n= 0.5 × lOS; M,x= 1.32;with grid
1.0
t !i0.6 __
10.2
1.(3
0.8
0.E
0.4
0.2
0.0
t_. >_--_--_d I 1c• o,
4_ l_'4--J?_"-k_4_i _.O.E
-1.o -o.s o.o o.s 1.o 1.s
(b) Rein = 0.5 × 10⁶; M,, = 0.98; with grid
-_.0 -o.s 0.0 0.5 1.0 1.5
(c) Rein = 0.5 x 10s; M,x = 1.32; no grid
pressure side ._m'tion side
-_.o -o.5 o.o o.s _.o
(e) Rein = 1.0 x 10_; M,_
1.5
= 1.32; with grid
I-_.o _.5 o.o o._ _.o 1.s
(f) Re_ = 1.0 x 10s; M,_ = 0.98; with grid
\ 7;i 6_¸¸¸¸¸o,o604 .....
5 _'4_,_ _ o._0.2 ) 2 2 ' _p z 5 0._
-1.0 -0.5 0.0 0.5 1,0 1.5s/span
(d) Rein = 0.5 x 10_; M,x = 0.98; no grid
-1.0 -0.5 0.0 0.5 1.0 1,5
(g) Re,, = 1.0 x lOS; M,, = 1.32; no grid
-1.0 -0.5 0.0 0.5 1.0 1.5s/_pan
(h) Rein= 1.0 × 10s; Mex = 0.98; no grid
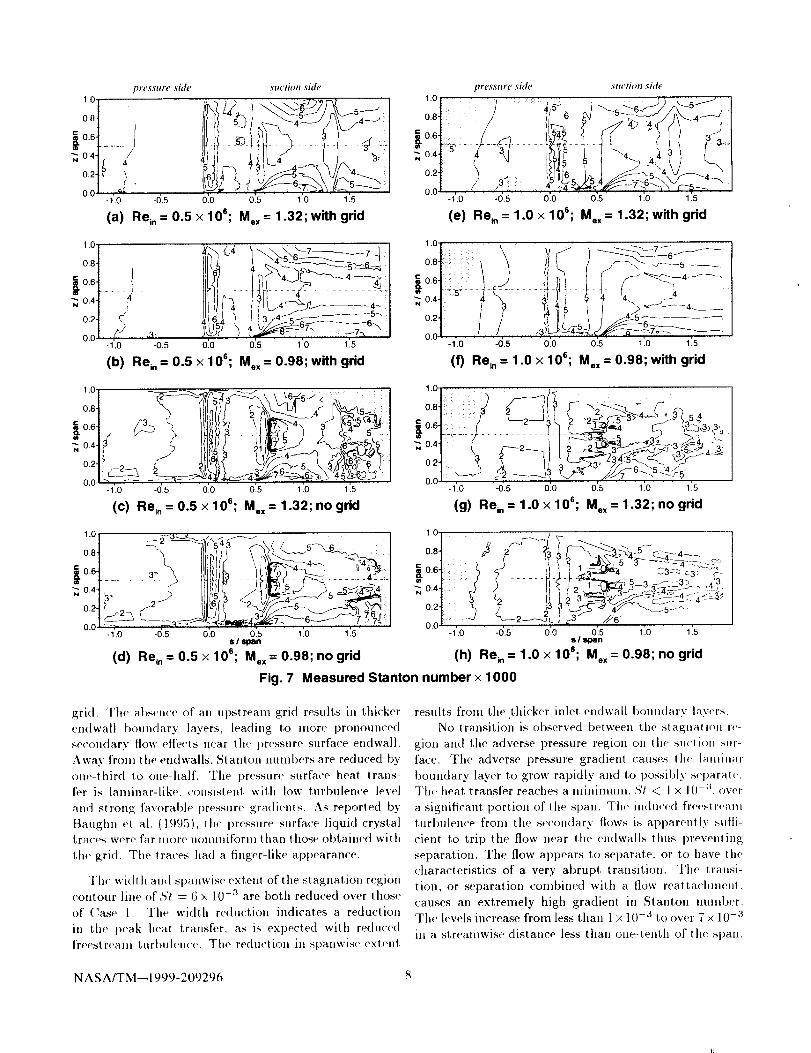
Fig. 7 Measured Stanton number x 1000
grid. The al)sen('e of all upstream grid results ill thicker
endwall boundary layers, leading to inure pronounced
secondary flow efl'e('t.s near the pressure surface endwall.
Away from the endwalls, Stantou mmit)ers are reduced by
one-third to one-half. The pressure surface heat. t,rans-['er is lanlinar-Iike, consistent with low turbulence level
alld strong favorat)le pressure gradients. As repori, ed by
Baughn et al. (t995), the pressure surface liquid crystaltra('es were far more nommiform than those obtained with
the grid. The traces had a finger-like appearance.
Thr width all([ spanwise extent of the stagnation regioncontour line of,b't = 6 x 10 -3 are both reduced over those
of ('ase 1. The width reduction indicates a reduction
in the peak heat transfer, as is expected with reducedfreestreain t,url)ulence. The reduction in spanwise extent
results from the thicker inlet endwall boundary layers.
No transition is observed between the sl,a.gll;-Ilion I'_'-
glen alld the adverse pressure region Oil the suction mir-face, The adverse pressure gradient causes l,he [alllill;lr
boundary layer to grow rapidly and to possibly separat<The heat t,rans[er reaches a mininnun. ,$'1< l x 10 -:_, over
a signiticant l)ortiou of the span. Tile induced fr('(,st r('alll
turbulence from the secondary flows is apparently suffi-
cient to trip the flow near the endwalls thus preventing
separation. The flow appears to separate, or to have ihe
ctiaracteristics of a very abrupt transitioli. The transi-
tion, or separation combined witti a flow reattachnienl,
causes an extremely high gradient in Stanton nuniber.The h'vels increase from less than 1x 10 -a to over 7 x 10 -a
in a streainwise distauce less than oue-l,elith of the span,
NASA/TM--199%209296 8

Rivir et al. (1994) observed a sintilar sharp increase ill
heat transfer ill a rea,ttachnlent region downstream of a
turbulent separation bubble. Further downstream, the
Stanton number distribution of this no-grid case looks re-
markably like that of the turbulence grid case, Case I.
I)owllstream of the shock, t,he levels are again generally
ill agreement wil.h Case 1, but the distribution is much
more distorted. Although the midspan symnietry appears
to be quite good, tile figure shows that two-dimensional
midspan calculations would be inappropriate without ac-
counting for niidspau inflow.
Figure 7(d) shows tile measurement results for a sonic
exit. case. Case 4. Again, R_i,, = 0.5 x 1()_; with no grid
present. Again, there is excellent agreement with the pre-
vious supersonic exit. ease on tile pressure surface and
on the suction surface upstream of the throat.. Down-
strealil of the throat, tile coil|our lines generally follow
the streamwise direction but again were nlore distorie(I
than those of the turbulence grid case.
Figure 7(el shows the results of t.h(' first, l_ci,, =
1.0 × 10 c; case. (:ase 5. The turbulence grid was installed
and the exit. was supersonic. (:omparing this ('as(' l.o
Case 1 shows the etf('('t.s of increased Reynolds number
ou heal transfer. The efl'ect.s are sntall on the I)ressure
surface because high fl'eest.ream turl)ulenee gives early
transition at either Reynolds nun|l)er. As expected, the
peak stagnation Stanton nmnber is reduced about 20(/c
with increased Reynolds nUnlber. Around midsl)ail the
high freestream turbulence and high Ileynolds number
cause very early suction surfa('e transitio|l, and N'I lev-
els are hardly reduced from their peak st.agnat.ion region
levels. The St levels decrease slightly as the suction sur-
face boundary layer thickens. Because the tlow is highly
turbulelit by this point, the slight adverse pressure gra-
dient near s/span = 0.5 has ahnost no effect on the heat
transfer, and ,'gl levels remain at about 4 × 10 -a until the
shock inlpingement location. The core region following
the shock impiugement, location again appears to lye in-
del)endent of R.eynolds nunlber, taking on values of about
3 × l(1-3. Near the endwal[ tile Slanloll number levels
are nearly indel)endent of Reynolds number. Recall how-
ever, that for equivalent St.anion nunlbers, doubliug the
Reynolds uumber doubles the heat transDr coefficient.
The measurenlen( results for this case clearly ver-
i_ that the blade design objective of more uniform heat
transfer rates over the blade surface has been success-
fully met. Those design objectives are most relevant, for
this case because the high Reyuolds number alld the high
freestream turbuleuce levels are most similar to a high
pressure turbine rotor operating enviromnent..
(:omparing Fig. 7(f) to Fig. 7(_) shows the effects of
exit Macfi number on the heat transfer for two cases with
Hei, = 1.(I × I(Y_ and with an inlet turlmlen('(' grid.
pressure side suction side
4 12
-1.0 -0.5 0.0 0.5 1.0 1.5s/span
Fig. 8 Sample nondimensional surface temperature, 0
(Rein = 0.5 x 10e; M,_ = 1.32; no grid)
The peak stagnat.ion values for this case were jusl, under
5 x 10 -3 while for (la.se 5 111('3, were just. over 7l × 10 -3.
The two cases again look very' similar on tile pressure
surface and upstreani of the throat on tile suction sur-
fa('e. Downst.reani of the throat, t,he contour lilies again
generally follow the sireaniwise direction.
[:igure'7(!/) StlOWS the reSllllS at l_fi,, = 1.0 × I/Y;,
Jl,.,. = 1.32, with no turbulence grid. The peak stag-
nalion region %(.anton numt)er is just under 4 × 10 -3 .
The pressure surface is transitional because of the high
]leyuolds nuniber. Suction surface transition is ntore
conipli(-al.ed than ally' of tile previous cases. At. about
3()(_,, 50(_,, aud 7()_, span, the flow starts to transition
just. downst, realn of the sl.agilat.ioii region aild coutiulleS
tile i,ransiiion process relatively slowly. At 40% and 60(7((
spali ]lOVleVer, the flow reluaillS lalliinar unlil it reaches
the slight adverse pressure gradient at s/span = 0.54
where it appears to separate, then reatlach and be('ome
fully turbulent. The behavior at these two discrete sl)an-
wise locations resembles that of the entire (-ore region of
the H<i,, = 0.5 × 10 °, no grid cases. The most likely'
cause of tlle relatively earls' transition spots was the dots
painted on the surface at 3:_(/¢,, 5()_Y¢, and 67(/(( span al
,s/spa, = 0.33. The dots were barely l)er('epi.il>le to the
touch, I)til the high Reynolds uuinl)ers apparently made
the [)Oulldary layer very sensii, ive to slnall disturbauces.
Following this region, the St anion nunlber contours again
resenible all of tile other supersonic exit cases.
Figure 7(h) shows that the pressure surface and the
suci, ion surface upstream of the throat, again agree very
well wit.il tile l)revious supersoni(" exit. ('as('. Downstreanl
of the throat, (,he Stant,on number contours again follow
the streainwise direction.
The nleasuremeut technique produ('es a blade sur-
face that is not uniform in either surface lenlperature or
surface heal. flux. A sample non-dimensional blade stir-
face t.emperature, 0, is shown ill Fig. 8 for the (:ase 3
which had tile largest 0 variation. 0 is indet)endeni of
the parl.icular measurement, temperatures and is inversely
proportional to the Stanton nulnber, so that boundary
coudiiions for all cases can be found frOlll the Stanton
llunlbers.
NASA/TM--1999-209296 .9

_4×
2
pressure sue'tion0 I i I i , I , , , * I , , J , I i i i 1 I 1 ' , ' I i i i
-I .0 -0.5 0.0 0.5 1.0 1.5
(a) Rei, = 0.5 x 10e; M,x = 1.32; with grid
pressure sm'tumd
0 I , t , I t i 1 1 t i i t i I I I , , I , , , , I , , ,
-1.0 -0.5 0.0 0.5 1.0 1.5
(e) Rein = 1.0 x 10_; M,x = 1.32; with grid
O
oo--4>:
2
8 ] .... I , , , , i i , , , i i i , i i i i i t ] , i
6
, _._i..2_g..._oo ° 05£ ._,_tr_ ..... i_'o_
prcsMlrf Sllction0 1 z , I I 1 t l i I i I i I I , , i i I i I i i I i i t
-_.0 -0.5 0.0 0.s _.0 _.5
(b) Re_, = 0.5 x 10_; M,x = 0.98; with grid
6
OOO
Ta
2
I .... I ' ' ' ' t , ' ' ' I , , , ' I , , , , I , ,
_a_
• 'A _ #/ .... ,._ ,_o._, ..........
• -- _r ._.-_-_1_ _0o_ ,, . _ oo0oooo0o
pressure : sue'lion
0 _ , .... , .... I , , , _ _ .... , .... _ , ,-1.0 -0.5 0.0 0.5 1.0 15
(f) Rein = 1.0 × 10_; M.. = 0.98; with grid
6
gO
--4
¢/)
2
8 i .... i , , , , i , , , , i , , , , I , , ' ' I , , ,
-
,_ d °o .-a- ' _ a_o _-
bo_ 19go° I¢ _ _ _/ _oo_lt,_ -
"-"-'_'_o_ sue "lion -]_r_,ssler_,
0 i , , , l 1 , , , _ t 1 i i i 1 , , , , i , , , , i , t ,
-I 0 -0.5 0.0 0.5 1.0 1.5
(C) Rein = 0.5 x 10_; M,. = 1.32; no grid
8,
6i
_,4
2
I .... I , .... ' ' ' I , , ' ' i , , , , 1 , , ,
I) I'L'S,_IlI'[' ,{lie 'tiOIt
I _ i i I I i i i i I I i i i I i i i i i , , 1 1 i , , 1
-1.0 -0.5 0.0 0.5 1.0 1.5
(g) Re_n= 1.0 × 10_; M0.= 1.32; no grid
6
--4X
(/}
2
I , , , , I ' ' ' ' I , ' ' ' I , , , , I ' ' ' ' _[;_' '
-s2_'_ o_ o. o0_O_oooooo _
oooo_Ooo.... ! \%__oo°°7E
pr_re < % _';t.'tion .I I , , I , , , , I , t , , t , , _ i I i I , , I t _ ,
-I .0 -0.5 0.0 0.5 1.0 1.5II I llpan
(d) Rein = 0.5 x 10_; M,x = 0.98; no grid
6
o_4
2
I
sl,an expr catc
IOC_: _ zx _ ..... _,_,_,_,_,,_
na oO H I_ o
pressure .';m'li,on
-1.0 -0.5 0.0 0.5 1.0 1.5sl span
(h) Rein = 1.0 x 10_; M,. = 0.98; no grid
Fig. 9 Measured and predicted Stanton no. × 1000
An exalnple ushig (Ta.se :_ (Fig. 7c) will now be dis- approxiniatety T._u,..f .... /7[,, -- 1.73 showing that the
cussed to relate actual t eniperat.ures to values of O. Mea- present ineasilrement t echniqiie produ('es a tilernlal
sureilleuts near the stagnatiou region with _c.'_,/_',, = boundary condition nnieh closer to a uniforni surfa('e t eln-
1.(i9 showed ,qt = 15.1 × 10 -3 illld 0 = ].0.q. These Iliea- perat.ure tilan a uniform heat flux.
surenlents required a copper teniperature of T_.,/77i, , = The liquid crystal Slant.on nuniber data were infer-
1.18. l}ecause the copper t.eniperature was essentially uni- polated onto lines at z/span = 0.10, 0.2,5, and 0.50. Line
forni, regions of low heat transfer had higher surface t.eln- plots of this data are shown in Figs. 9(a) througli 9(h).
peratures. For exaniple, in lhe separated flow region tile The cont.otlr plots of Fig. 7 show overall trends and span-
niininiilin Slant on iiilniber was approxin]at,ely 0.7 x l(] -3. wise variations, but lille plots Call be useful for exlract.ing
0 }iere was approximately 8.t5, result.ing ill a surface t.elll- lllOre details of the data. (1olnputational results a.|r t.he
l)eralure of _'l,,,..f(,c_/Ti: = 1.115. llad lhese measure- same. spanwise locations are also shown in the figures.
illelils been niade with a uniforln heat flux technique, l.[ie
surface lelnperalure hi the low ,ql region would have been
NASA/TM--1999-209296 10
pressure side
2 ,
(a) Rein = 0.5 x 1
suction side
Z--?.
,-_, _ Fi 3,hi
! If VJ, ''l
06; M,x = 1.32; with grid
pressure side
(e) Rein
suction side
II3.=.
_-_._
= 1.0 x 10⁶; M,,= 1.32; with grid
(b) Rein = 0.5 × 10⁶; M,x = 0.98; with grid
2.
=.ii
(f) Rein = 1.0 × 10⁶; M,x= 0.98; with grid
(c) Rein = 0.5 × 1 06; M,_
L)_/U
= 1.32; no grid (g) Rein = 1.0 × 10⁶; M,x = 1.32; no grid
(d) Rein = 0.5 × 10⁶; M,_ = 0.98; no grid (h) Rein= 1.0 × 10⁶; M°x= 0.98; no grid
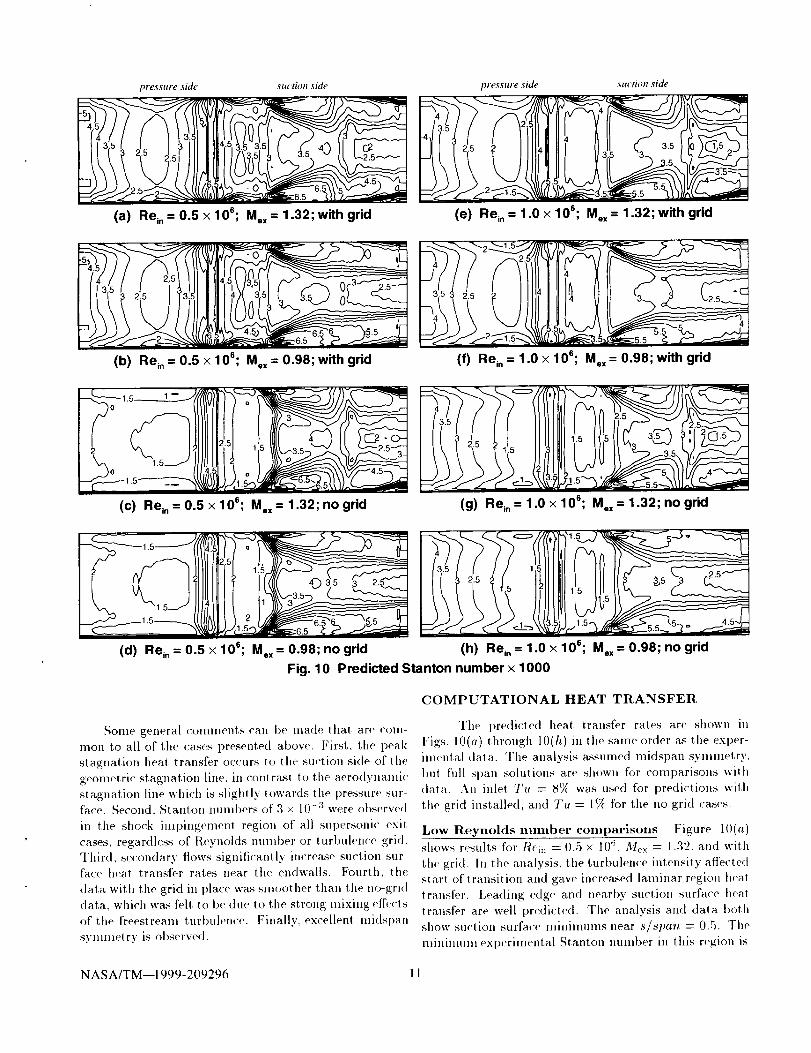
Fig. 10 Predicted Stanton number × 1000
_onle general eOlllltieut,s call ])e made that are coin-men to all of the cases presented above. First, the peak
stagnation heat transfer occurs to the suctiou side of the
geometric stagnation line, in contrast to the aerodynalnie
stagnation line which is sliglltly towards the pressure sur-face. Second. Stanton nunlbers of 3 × 10⁻³ were observed
in the shock impingement region of all supersonic exit
cases, regardless of Reynolds nnmber or turbuletlce grid.
Third, secondary flows significantly increase suction sur-face heat transfer rates near the endwalls. Fourth, the
data with the grid in place was snioother than the uo-griddata, which was felt to be due to the strong mixing effects
of the freestream turbulence. Finally, excellent midspan
symmetry is observed.
COMPUTATIONAL HEAT TRANSFER
The predicted ]teat transfer rates are shown in
Figs. 10(a) through 10(/I) in the salne order as the exl)er-imelital data. The analysis assumed midspan symmetry,
but full span solutions are shown for comparisons wiihdata. All inlet Tit = 8(U¢,was used for predictions with
the grid installed, and Tu = 1(_, for the no grid cases.
Low Reynolds mlmber comparisons Figure 10(.)
shows results for Rein = 0.5 × I0 '_, M_x = 1.32, and with
the grid. In the analysis, the turbulence intensity affectedstart of transition and gave increased laminar region Ileal
transfer. Leading edge and nearby suction surface Ileal
transfer are well predicted. The analysis and data both
show suction surface minimums near .s/span = 0.5. The
nmUlnUln experimental St, antoli number in this region is
NASA/TM--1999-209296 11

a × 10 -a. At. s/span = 0.5 predictions show a region al
this level, and a mi,linmn_ at 2.5 × 10 -3 close to one quar-
ter span. The midspan peak Stanton nmnber of 4 × 10 -3
is downstream of the experimental peak, indicating the
transition length is overpredicted. However, overall tile
agreement with the data ill the transition region is good.
At. s/span = 0.5 a high heat transfer region forms near
the endwall. This region expands downstream consistent
with the data. The peak experilnental Stanton nulnber
is 7 × 10 -3 , while tile peak predicted value is 6.5 × 10 -a.
Heal transt>r behavior in this region is clue to secondary
flows as discussed by Goldstem el al. (1.(LqS), and is not
jtlsl dlle lo ('ross channel flows passing over the unheated
endwall. An analysis wilh the blade and endwall both
heated showed blade heat transfer very similar to the pre-
dictions. Tile effect of the shock on the heat transfer is
clearly seen, as it was in the data. After the shock, the
predicted midspan heat transfer decreases, but this is not
seen ill the data. (:lose t.o the endwalls both the analysis
and the data show regions of increased heat transfer af-
ter the shock. The peak computed value in this region is
.1.5 × 10 -3, while the peak data value was 5 × 10 -3.
Both the computations and exl)eriment show a very,
rapid decrease in pressure surface Ileal transfer away froln
lhe leading edge. The lninimunl experimental contour
level is 4 × 10 -a, and encomtmsses nearly two thirds of
lhe pressure surface. Tile absolute minimum measured
pressure surface St.anton number was close to 3 × 10 -a.
Except close to tile endwall, the nlininnun predicted Stau-
Ion number is 2.5 × 10 -a. Transition was predicted to
begin at (-lose t,o 30(7o of tile surface distance, and was
not conq)tete until after 5()(g of the surface distance. (!n-
derpredicting the nfininuml ,_tant.Oll nmnber appears to
imply a poor slart of transition prediction. However, if
the analysis underpredicted the effects of freestream tur-
bulence on the pressure snrfa('e Ileal lrausfer, it would
also mMerpredi('t the heat transfer, even if the start and
[engt h of t.ransition were correctly predicted. (.:lose to the
endwall at 400{ of the pressure surface distance a region of
low heat transfer is predicted, but is nol seen in the data.
At <'lose to .90(_, of the surfa<'e distance there are Stanton
number levels of 5 × 10 -a in both tile experimental and
conlputational contours.
Figure 10(b) shows predictions for the lower exit
Math numl)er ease. A change ill heat. transfer is only
seen from the throat region to the trailing edge of the
suction surface. At this lower Mach numl)er there is lit-
lie evidence thai tile nluch weaker shock affecls the heat
Iransfer. Over the lasl 400{, of the suction surface the
Stallion nulnber lines are nearly horizontal. This loca-
lion is governed by tile cascade aspect ratio. The cas-
cade symmetry forces the secondary and vortex flows to
stop tuoving closer to midspan at. some chordwise loea-
tion. Close to midspan the analysis shows Dower than
measured heat transfer. In addition to a deficiency in the
turbulence modeling, the analysis could be overpredicting
the amount of secondary flows forced into the lnidspan
region, giving a thicker boundary layer and reduced heat
transfer.
Figure 10(c) shows heat, transfer levels on the pres-
sure surface, and the suction surface prior to transition,
are affected when the grid is absent. The l)ressure surface
heal transfer is much lower at. the 1(7( inlet Tu level. At
the leading edge the midspan St.a'lltOll Illllll[)er is slightly
less than 4.,5 × 10 -a. This corresponds to a t;rossling nun>
ber, Nud/_, of 1.04. The experimental leading edge
Frossling number is higher, 1.39. There is no mechanism
for the model to augment the Ileal transfer at low tur-
bulence intensity, so tile analysis gives the same result as
laminar flow at. the stagnation point of a cylinder. Tile
calculatious predicted laminar flow on the pressure sur-
face. In tile experimental data there is a large pressure
surface area enclosed within the £'t = 2 × 10 -3 contour. In
the calculations there is a mmmmm contour of 1.5 × 10 -:_
and at midspan it extends into the region where tile ex-
perilnental data show increased heat transfer. (qoser to
the pressure surface trailing edge the experimental Stan-
ton number level is 3 × 10 -3, while the calculated value
is only 2 x 10 .3 . These results indicate that |here is a
mechanisln increa.sing the pressure surface ileal, transfer
thai the analysis does not. account for.
Suction surface heat transfer also differs between the
high and low Tu cases due lo t.urbtdence modifying the
transition start location. Data show a mininmm Stan-
ton number contour of l × 10 -3. Tile prediction shows a
nmfimum contour level of 1.5 x 10 -a, enclosing a some-
what larger area. The start of trausition is accurately
predicted. Prior to transition, the suction surface of the
blade shows the same relaiive behavior as the pressure
surface. In these laminar regions the predicted heat. trans-
fer is lower than tile data.
hi the midspan region, after the minimum suctioll
surface heat transfer, tile predicted heat transfer shows a
much lower peak than the data. These differences may
be due to flow separation and reattachment, rather than
transition. The aualysis predicted a low shear value at
tile start of transition, and a very short transition region
caused by the adverse pressure gradient. If the actual
transition was slightly later than predicted, separation
would have occurred. Very high Ileal. transfer is exl)ected
at, reattachment. The experimental heat transfer shows
two small contour areas above and below midspan at. a
level of St = 7 x 10 -3. The analysis showed a Colltour
lew_l in tile same region between :_.5 × 10 -a and 4.0 × 10 -a.
The algebraic turbulence model used did not correctly
predict, the heat. transfer ill this region, and improved
NASA/TM--1999-209296 12
turbulencemodelsshouldgivebetteragreement.(_al-culations were done with the wall t,eml)eratures varying
in tile same manner as that shown in Fig. 8, but did not
improve the agreement with data.
The increased near-endwall heat transfer due io sec-
ondary flows is very similar to the no grid case, and is
well predicted. The peak l>redicted Stanton nmnber is
6.,5 x 10 -3, while the peak measured value is 7 x 10 -a.
The behavior in the shock impingment region is also well
predicted. Both data and predictions show contour levels
of 3 x 10 -3. Downstream of the shock, near midspan, l[le
data show Stanton utnnber levels at)eve 4 x 10 -3. The
predict, ion shows a decrease ill heal transfer towards the
trailing edge. This behavior is similar to that for the cor-
responding high Tu case. Away from nlidspan the grid
case data show a higher average Ileal transfer level, and a
more chaotic distribution. The analysis, however, shows
similar behavior but at, a slightly lower level. The surface
pressure distributions were tile same for the high and low
Tu analyses. There was no mechanism in the analysis
that wouM aecolmt for higher freestream turlmlenee af-
t,er the flow was fully turbulent.
Figure 10(d) shows that decreasing Mach number
from 1.:/2 to 0.98 for the no grid case, resulted in changes
similar to those for the san,e Mach uuml)er change at. the
high Tu grid case.
High Reynolds number comparisons The primary
effect of increasing the Fleynolds number by a factor of
two oil the heat transfer distribution is to change the tran-
sition location. Prior to transition the Stanton uuml)er is
expected to decrease by v_ when the lleynolds ,mml)er is
dout)led. For flflly turbulent flow the Stanton mmd)er is
expected to decrease I)3' 13% when the Reynolds number
is doubled, assuming Sl _ H_-°"-'.
The first, comparison is between the two I/eyuolds
numbers at AI_× = 1.32 and the grid installed. Fig-
ure 10(e) shows that downstream of the leading edge on
the suction surface the Stanton number is higher for the
higher Reynolds number, as it is in the data. This is
due to transition moving forward at, the higher Re. The
leading edge heat transfer decreases only by about 1.5¢7c.
However, this is consistent wit, h the high turbulence in-
tensity and high Red. Tile correlation of Van Fossen
et al. (1995) predicts a 26% reduction in ,b'l due to the
change in Reynolds number, tlowever, tile correlation
also I)redict.s that at higher Frossling numbers, seen in
the data. the effect, of a Reynolds lmmber variation is
less. Elsewhere on the blade, the change ill Stanton num-
ber is as expected. The flow is turbulent, and there is
a decrease of 10-20% in the Stanton number when the
Reynolds numl)er is doubled.
Conq)aring Figs. 10(<) and 10(f) shows the same heat.
transfer changes at. tile high Fleynolds nun|her for a Math
numl)er change as were seen at the low Reynokts nulnber.
Ow_rall, the agreement with the data is good. tlowever,
again the predictions show too low a heat transfer on the
suction surface midsI)an region downstream of the throat.
l"igure 10(9) shows that, with no grid in place, in-
stead of decreased St when He doubles, the Stauton num-
t)er more than doubles near the pressure surface trailing
edge. This is due to transition. At the lower Reynolds
number, pressure surface transition did not occur. At the
higher t{eynolds number transition was predicte<l to 1)e-
gin near 30</< of pressure surface distance, and end at 60¢7_
of the surface <listance. This is consistent with the experi-
mental data, although the <-hange in St is not as dramatic
in tile data. Suction surface transit, ion was predicted to
occur at. nearly the same location for both Reynolds num-
bers. Prior t.o transition the lower Reynolds lmmber had
a region between /l = 1.5 and 2 x 10 -a. For the higher
Reynolds mmlber the same region shows Stantou num-
1)ers less than 1.5 x 10 -3. This is cousislent with what
one woul<l expect for laminar flow. Figure 10(h) shows
that the change in St, ant,<)n nmnber with decreased Maeh
numl)er is the salne at, bol.h Reynolds nunlt)ers.
Overall the analysis underl)redicts the heat transfer,
which may be I)artly due to differences in the mamwr
in which lhe heat 1.ransfer coefficient was defined. For
consistency with the experimental data tile ,qtanton lllllll-
I)ers are based oil the wall Ileal flux divided I)y the dif-
ference I)etween the wall teml)eratt|re anti the adiat)atic
wall temperature. The same adiabatic wall teml)erature
distrit)ution was used l.o <h,ternline the experimental and
Cmnl)utational St.anion re|tubers. Therefore. differences
are due to differences ill the wall heat flux. Calculations
were done with different wall temperatures. From the
resultant, Ileal fluxes t,he atliabatic wall lemperat, ure was
calculated for each grid point on the blade surface. The
r<'covery factor determined from the Navier-Stokes anal-
ysis was closer t,o unity than tile recovery factor used to
calculate tile Stanton lmmbers. Tile recovery fact,or was
also greater than most of the recovery factors given t)3:
Schlichting (1979). If the inlet total Iemperature was
used to cah:ulate St,ant,on munbers instead of the local
adial)atic wall teml)erature, predicted Sl.antou llulul)ers
would be up to 40(7_ higher. Differences arising fl'om dif-
ferences ill tile recovery factor ()lily hel l) to explain dif-
ferences ill the suction surface heat transfer. Only Ileal
trallsfer ill high Math numl)er regions is affecte(] by vari-
ations in the reeow_ry factor.
NASA/TM--1999-209296 13

SUMMARY AND CONCLUSIONSThe wimary effect of a factor of two variation in
Reynolds number was to move the transition locations.
For l he low inlet turbulence intensity cases, flow oil the
suction surface remained laminar u I) to all adverse pres-
sure gradient region. Subsequently, the Stanton number
rose rapidly to a high level. At low 7'u, pressure surface
transit, ion was observed at high, but not at low, Reynolds
mnnbers. Tile shock in the supersonic exit cases impinged
Oil Ill(" su('lioll surface, where n|easurements and calcu-
lations showed Slant.on numl)er levels of 3 x 10 -3 inde-
pendent of tleynolds ntnnber and turbulence grid. The
subsonic cases showed Stauton re|tuber contours gener-
ally following the ext)ected streamlines and remaining
unchanged after the throat. The data showed thai. the
turbulence grid increase([ leading edge heat transfer and
moved the transition locations forward. For the high
tleynol(ls number and turbnlence grid case the suction
surface transil.ion moved almost t.o the stagnation point.
t'ven with high turbulence the midspan leading edge
heal iransfer did not greatly exceed that seen elsewhere
along nfidspan. The good spatial resolution due l.o the
large scale and the liquid crystal technique allowed the
secondary flow effects to be clearly quantified.
(k)ml)aring compulal.ional and experimental results
illuslrated regions of go<)<[ agreelnent and ,'egions where
mod,'ling inll)rovements are needed. Transition was well
predicted, as were the effects of secondary flows on the
suction surface heal t.ransDr. High heat transfer in the
near endwall region was well predicted. The leading edge
heat transfer was well predicted for tile high turbulence
mlensity cases, but was underpredicted for the low tur-
bulence intensity cases. For the low tleynolds nulnber, no
grid eases, the analysis t)redicted a very short suction sur-
face transition region, due to all adverse pressure gra(li-
ent. Experiment ally, the laminar flow may have separal.ed
and reattached rather than smoothly trarlsitioned, which
may be the reason that the al,alysis underpredicted the
heat transfer. The analysis also tmderpredicted the heat
Iransfer near midspan downstreanl of the throat on the
suction surface. This could be due to turl)ulence model
deficiencies, or all overprediction of tile amount of fluid
forced into the midsl)al, regkn, by secondary flows. The
latter woukl cause the cah'ulated midspan ])oundary layer
1o be thicker than the ext)erimental one, leading to lower
Ileal I ransfer.
The blade heat transfer data presented here. the end-
wall heat transfer data of Giel el. al. (1998), along with
the aerodynamic data of (;tel et al. (1996a) comprise a
conlplel._" set of data for (TD code and model validation.
Electronic datla tabulations for all eight cases, includil|g
raw digitized data to allow contour plotting at any level,
are available upon request.
REFERENCES
Arnone, A, Lieu, M.-S, and Povinelti, L. A., 1992,
"Navier- Stokes Solution of Transonic (_ascade Flows Using
Non-Periodic C-Type (Irids," AIAA Jour,:d of Propulsion
and Power. Vol. 8, No. 2, pp. 410-,I17.
Arts, T., Duboue, J.-M., and Rollin, C,., 1997, "Aero-
Thermal Performance Mea.surements and Analysis of a Two-
Dimensional High Turning Rolor Blade," ASME paper 97-
(;T-120.
Baughn, J. W., Butler. R..1., Byerley, A. R.. and Rivir,
It. B., 1995, "An Experimental Investigation of Ileal Transfer,
Transition and Sepm'ation on Turbine Blades at Low t/eynolds
NumbeJ" and High Turbulence lnlensily,'" ASME pal)er 95-
WA/ttT-25.
Blair, M. F., 1994. "An Exl)erimental Study of Heal
Transfer in a Large-Scale Turbine Rotor Passage," ASME
.Iournal of 7urbomachinery, Vol. 116, No. 1. pp. 1-13.
Boyle, R. J., Lucci, B. L., Verhoff, V. G., Camperchioli,
W. P.. and La, It., 1998a, "Aerodynamics era Transitioning
Turbine Stator Over a Range of Reynolds Numl)ers,'" ASME
paper 98-GT-285.
Boyle, R. J., and Simon, F. F.. 199Stl), "Math Number Ef-
fects on Turbine Blade Traalsilion Length Prediction," ASME
paper 98-GT-367.
Chima, R. V.. and Yokota, ,l. W., 1990, "Numerical
Analysis of Three-Dimensional Viscous Internal Flows," AIAA
Journal, Vol. ;2_, No. 5, pp. 798-806.
Chima, R. V., 1991, "Viscous Three-Dimensional Calcu-
lations of Tra_asonic Fan Performance," AGARD Propulsion
and Energetics Symposium on Computatioiml Fluid Mechan-
ics for Propulsion, San Antonio, Texas, May 27-31.
Chima, R. V., C,iel, P. W., and Boyle, R..I., 199:1. "An
Algebraic Turbulence Model for Three-Dimensional Viscous
Flows," AAIA paper 93-0083, (NASA TM- 105931 ).
('ivinska._, K. C., Boyle. t/..I., and Me( :onnaughey, It. \'.,
1990, "q_lrbine Blading Designed for ltigh tteat Load Space
Propulsion Applications." AIAA Journal of tb'opulsion and
Power, Vol. 6, pp. 598-611.
Dram, M. G., Kim, J., Civinskas, K. (?., and Boyle, R. J.,
1994, "Time-Averaged Heat Transfer and Pressure Measure-
ments and Comparison with Predictions for a Two-Stage Tur-
bine," ASME Journal of Turbomachin_ry, Vol. 116, pp. 14-23.
NASA/TM--1999-209296 14

Giel, P. W., T[mrman, D. R., Lopez, 1., Boyle, R. J..
Van Fossen, G. J., Jett, T. J., Camperchioli, W. P., anti
l,a, H., 1996a, "Three-Dinlensional Flow Field Measurements
in a Transonic Turbine Cascade," ASME paper 96-GT-113,
presented at the ASME International (gas Turbine (Ionfer-ence, Birmingham, England, June 10-13.
Giel, P. W., Sirbaugh, J. R., Lopez, I., and Van Fos-
Sell. G..].. 199Gb, "Three-Dinlensiollal Navier-Stokes Analysis
and Redesign of an Imbedded Belhnouth Nozzle ill a Turbine
(:ascade Inlet Section." ASME Journal o.f [}trbonuwhit_e'ry,
Vol. llS, No. 3, pl ). 529-535.
Giel, P. W., Thurman, D. FL, Van Fossen. G. J., ttippen-
steele, S. A., and Boyle, R. J., 199_, "Endwall bleat Transfer
Measurements in a Transonic Turl)ine Cascade," ASME Jour-
nal of ]'urbomachit_tr!j. Vol. 120, No. 2, pl ). 305-313.
(;oldstein, R. ,1.. and SI)ores. R. A., 19,%% "Turlnllent
Transport on the F;ndwall in the l_egion l_,elweell Adjacent
Turbilw Blades," ASME Journal of Heat Trans.fcr, Vol. 1 t0,
No. ,t. pp. 862-_69.
(;oldstein, R. J., Wang, tl. P.. and .labl_ari, M. Y.. 1995,
"The Influence of Secondary Flows Near tilt: Endwall and
Boundary Layer Disturbance on (:onveetive Transl)ort t:rom a
Turl)ine Blade," ASME Journal o.[ ]',rbomaehincr!l. Vol. 117,
No. 4, pp. 657-665.
(;raziani. R. A.. Blair, M. F., Taylor. R..1.. and Mayle,
R. E., 19_0, "An Experiulental Study of Endwall and Airfoil
Surface Heat Transfer in a Large Scale Turbine Blade Cas-
cade," AS.ME .lourrml of Ett.qine_rin 9 .for Power. \'ol. 102,
No. 2, pp. 1-11.
Guenette, G. R., t'_pstein. A. It., Giles, M. B., Haitnes, R.,
and Norton, R..l. (;., 19s9, "Fully Scaled Transonic Turbine
l/or or Ileal Transfer Measurements," ASME Journal of ]!ur-
bomo(h_ntry. Vol. 111, No. 1, i)p. 1-7.
blipl)ensteele. S. A., Russell, L. M., and Torres, F. ,l.,
1988, "Local Heat-Transfer Measurements on a Large Scale-
Model Turbine Blade AM'oil Using a (:omposite of a Heater
Elemenl and Liquid (!rystals," ASME Journal o.f Enginctrin9
for Gas 7itrbines and l_owtr. Vol. 107, pp. 953-960.
.loslyn, D., and I)ring, R., 1992, "Three-Dimensional
Flow in an Axial Turbine: Part 1 Aerodynamic Mecha-
nisms." ASME Journal o.[ Turboma(hi,wry. Vol. 114, No. 1.
pp. (;1-70.
I'(line, S. J.. and Mc(:lintock, F. A., 1953. "'I)escril)ing
Uncertainty in Single-Sample Experilnents," Mechanical l¢l_-
gin_ering, Vo[. 75, ,lan., pp. 3-8.
Martinez-Botas, R. F.. Lock, G. D., and Jones, T. V.,
199,1, "Heat Transfer Measurenlents in all Animlar Cascade
o[ q'ransonic (;as Turbm(, Blades Using the Transienl Liquid
(:ryst al q'echnique,'" A SM I'; 94-( ;% 172.
Mayle, R.E., 1991, "The Role of Laminar-Turbulent Tran-
sit,ion in (;as Turbine Engines," ASME Journal of ]'urboma-
chincry. Vol. 113, pp. 509-537.
Molt'at, t{..l., 1990. "Experiment al |[eat qYansfer," Proc,
o[ th¢ .Vinth Int'l Ht,t ])'ans.[er ('or@, Jerusalem. Israel,
Vol. 1, pp. 1s7-205.
l:_ivir, I/. B., Johnston, ,]. P., and Eaton, J. K., 1994,
"'Heat Transfer on a Flat Surface [Tnder a [legion of Turlm-
lenl Separation." ASMI'; Journal of Turboruachincry. Vol. 116,
No. 1, pl ). 57-G2.
S('hlichtillg, tl., 1979. Boundary-La_l_r Theory, Sevelllh
Edition, MeGraw-ttill, New York, p. 714.
Solonlon, W. J.. \Valker, (',. J.. and Gostelow, J. I)..
1995. "Transition Length Predict ion For Flows Wit h Rapidly
( lhanging Pressure ( ;radient s,'" iXS M t'] paper 95-( _T-241.
Thulin. R. I).. ttowe, D. ('., and Singer, I. I)., 19,_2. "En-
ergy [_'flici(:lfl, Engine t lig,h-Pressure Turl)ine Detailed Design
[/eport.'" NASA (:R-165608.
Van ["ossen, (i. ,I.. Silnolmau, t/. J., and ('hing, ('. Y.,
1995, "Influence of Turlmlen('e Parameters, [/eynolds Number.
and Body Shape on Slagnation-Region Ileal Tratlsfer.'" ASME
.lournal of H_at Tract@r, Vol. 117, pp. 597-603.
Verhofl', V. G., (?alnperchioli, W. P., and I,opez. 1., 1992,
"TransolfiC Tm'lfine Blade Cascade Testing Facility," AIAA
Paper No. 92-,t034, NASA TM-105646.
NASA/TM--1999-209296 15

REPORT DOCUMENTATION PAGE FormApprovedOMB No. 0704-0188
Public reporting burden for this collection of information is estimated to average 1 hour per response, including Ihe lime for reviewing instructions, searching existing data sources,
gathering and maintaining the data needed, and compleling and reviewing the collection of information. Send comments regarding this burden estimate or any other aspect of this
collection Of information, including suggestions for reducing this burden, to Washington Headquarters Services, Directorate for Information Operations and Reports, 1215 Jefferson
Davis Highway, Suite 1204_ Arlington, VA 22202-4302, and to the Office of Management and Budget, Paperwork Reduction Proiect (0704-0188), Washington, DC 20503.
1. AGENCY USE ONLY (Leave b/ank) 2. REPORT DATE 3. REPORT TYPE AND DATES COVERED
August 1999 Technical Memorandum
4. TITLE AND SUBTITLE 5. FUNDING NUMBERS
Blade Heat Transfer Measurements and Predictions in a Transonic
Turbine Cascade WU-523-26-13-(X)
6. AUTHOR(S) I L 161 102AH45NAS3-98008
P.W. Giel, G.J. Van Fossen, R.J. Boyle, D.R. Thurman and K.C. Civinskas
7. PERFORMING ORGANIZATION NAME(S) AND ADDRESS(ES) 8. PERFORMING ORGANIZATIONREPORT NUMBER
NASA Glenn Research Center
Cleveland, ()hit) 44135-319 Iand E- I 1775
U.S. Army Research LaboratoryCleveland. Ohio 44135-319 I
9. SPONSORING/MONITORINGAGENCYNAME(S) ANDADDRESS(ES) 10. SPONSORING/MONITORINGAGENCY REPORT NUMBER
National Aeronautics and Space Administration
Washington. I)C 20546-(XX)1 NASA TM-- 1999-209296andU.S. Army Research LaboratoD' ARL-TR-2029
Adelphi, Maryland 20783-1145
11. SUPPLEMENTARY NOTES
Prepared for the 1999 International Gas Turbine and Aeroengine Congress cosponsored by the American Society of
Mechanical Engineers and the International Gas Turbine Institute, Indianapolis, Indiana, June 7-10, 1999. P.W. Giel,
Dynacs Engineering Company, Inc., Brook Park, Ohio; (work funded under NASA Contract NAS3-98008); G.J.
VanFossen and R.J. Boyle, NASA Glenn Research Center; D.R. Thurman and R.C. Civinskas, U.S. Army Research
Laboratory, NASA Glenn Research Center. Responsible person, R.J. Boyle, organization code 5820, (216) 433-5889.
12a. DISTRIBUTION/AVAILABILITY STATEMENT 12b. DISTRIBUTION CODE
Unclassified - Unlimited
Subject Categories: 02, 07 and 34 Distribution: Nonstandard
This publication is available from the NASA Center for AeroSpace Information, (301) 621-0390
13. ABSTRACT (Maximum 200 words)
Detailed heat transfer measurements and predictions are given for a turbine rotor with 136 ° of turning and an axial chord
of 12.7 cm. Data were obtained for inlet Reynolds numbers of 0.5 and 1.0×10⁶, for isentropic exit Mach numbers of 1.0
and 1.3, and for inlet turbulence intensities of 0.25% and 7.0_. Measurements were made in a linear cascade having a
highly three-dimensional flow field resulting from thick inlet boundary layers. The purpose of the work is to provide
benchmark quality data for three-dimensional CFD code and model verification. Data were obtained by a steady-state
technique using a heated, isothermal blade. Heat fluxes were determined from a calibrated resistance layer in conjunction
with a surface temperature measured by calibrated liquid crystals. The results show the effects of strong secondary
vortical flows, laminar-to-turbulent transition, shock impingement, and increased inlet turbulence on the surface heat
transfer.
14. SUBJECT TERMS
Gas turbines: Heat transfer: Transonic flow; Supersonic turbines; Cascade wind tunnel;
Liquid crystals; Turbomachinery; Turbulent heat transfer; Convective heat transfer;
Stanton number
17, SECURITY CLASSIFICATIONOF REPORT
Unclassified
NSN 7540-01-280-5500
18. SECURITY CLASSIFICATIONOF THIS PAGE
Unclassified
19. SECURITYCLASSIFICATIONOF ABSTRACT
Unclassified
15. NUMBER OF PAGES21
16. PRICE CODE
A0320. LIMITATION OF ABSTRACT
Standard Form 298 (Rev. 2-89)Prescribed by ANSI Std. Z39-18
298-102