Embed Size (px)
Citation preview

lAD ii -I
US ARMY MEDICAL RESEARCH LABORATORY
FORT KNOX, KENTUCKY 40121
0REPORT NO. 769
CO z LASER INDUCED SKIN LESIONS
(Final Report)by
Q0 Arnold S. Browneli, Ph. D.Wordie H. Parr, Ph.D.
Captain David K. Hysell, VCand
Captain Robert S. Dedrick, VC
13 March 1968
SMAY 2 51968
B
This document has been approved for public release and sale;its distribution is unlimited.
UNITED STATES ARMYMEDICAL RESEARCH AND DEVELOPMENT COMMAND

REPORT NO. 769
CO Z LASER INDUCED SKIN LESIONS
(Final Report)by
1Arnold S. Brownell, Ph. D.Wordie H. Parr, Ph.D.
Captain David K. Hysell, VC"'and
Captain Robert S. Dedrick, VC':
Biophysics Division
Pathology Division
US ARMY MEDICAL RESEARCH LABORATORYFort Knox, Kentucky 40121
13 March 1968
Cutaneous and Deep Burns Induced by Laser Radiation
Work Unit No. 103Surgery
Task No. 01
Research in Biomedical SciencesDA Project No. 3A014501B71R "
'Present address: 64 Glenwood Avenue, Glens Falls, New York 12801.
This document has been approved for public release and sale;
its distribution is unlimited.fil

USAMRL Report No. 769DA Project No. 3A014501B71R
ABSTRACT
V I CO 2 LASER INDUCED SKIN LESIONS
OBJECTIVE
To define skin response to different exposure time-irradiancecombinations using CO 2 laser radiation (10.6 ).
METHODS
Lesions ranging from a mild erythema to partial tissue coagula-
tion were produced on depilate! porcine skin. Exposure times for agiven irradiance with a 50 percent probability of producing a particulargrade of lesion were then established.
RESULTS AND CONCLUSIONS
The dose-response relationships for producing different gradesof cutaneous burns were determined for power densities within therange of 0. 69 to 13.6 watts/cm2 and exposure times of 0. 2 to 40 sec.The data obtained are adequate to establish safety standards for cutan-eous injury within these ranges. A relatively simple model which de-scribes the exposure parameters to produce threshold skin lesionswithin the reported range is discussed.
..
J)

TABLE OF CONTENTS
Page No.
INTVRBODUJCTION ........................................
METHODS .............................................. 1
R.ESULJ..TS............................................. 3
DISCUJSSION ........................................... 6
CONCLU'ESIONS .......................................... 9
LITER.A.TUJRE CITED ................................... 10
Figure 1 ......................................... 2Figure 2 .............................. 0...........5Figure 3 ......................................... 6
Table 1 ......................................... 12Table 2 ......................................... 17Table 3 ......................................... 18
SCO2 LASER INDUCED SKIN LESIONS
INTRODUCTION
A recent report by Brownell et al (1) presented data defining a setof exposure conditions necessary to produce minimal detectable lesionsin porcine skin with radiation from a CO? laser. They found that the re-lationship between irradiance and exposure time was approximately de-
scribed by a simple power function of the form H = at-b where H is theincident irradiance, t is the exposure time, and a and b are empiricalconstants. However, the relationship was determined only for the lim-ited range of irradiance extending from 1. 5 to 8 watts/cm2 . Additionalmeasurements have indicated that outside this range the dose-responserelationship may change and can no longer be descrcibed by the same e-quation.
This study was conducted to extend the range of the dose-responserelationship to higher and lower irradiance levels than the previous re-port. In addition, the exposure parameters were determined for burnsmore severe than the minimal erythema.
METHODS
Except where noted, the methods and equipment used in this in-vestigation have been described in detail elsewhere (1). The CO Z laser
was designed and constructed by the Martin Marietta Corporation (2).The laser output was routinely measured with an inver 4;ed cone calorim-eter which was calibrated against a constant flow water calorimeter witha silver chloride window, both of which were designed and constructedat this laboratory. The beam size was limited by an aperture to 19 mmdiameter at the target site, except for the irradiance levels of 10.6 and13. 6 watts/cm 2 . In the case of experiments involving these two irradi-ance levels, the beamwas focused and recollimated by 80 cm and 45 cmfocel length lenses which produced beam diameters of 14 and 16 mn, re-spectively, at the target site.
In order to achieve the power densities required over a reason-ably large area it was necessary to adjust the laser for highly multi-moded operation. The resulting output beam consisted of an array ofciosely spaced regions of rather sharply peaked energy flux distribu-tion (see reference 1 for a more detailed discussion of energy distribu-tionwithinthe laser beam). Itwas estimatedthat the energy distributionwithin the output beam ranged within plus or minus 25% of the measuredaverage value.hA
UA

The power output of the laser was very stable except when it wasreducedto the point where the power density was about 1 watt/cm2 or lessat the targ. t site. Under these conditions the output tended to decreaseslowly and intwo cases dec-: ased as much as 2076 dur1,7g the experiment.
Fifty-nine pigs, with pigment-free skin, were used in the experi-
ments. Their weights averaged 37 pounds, Acepromazine aad pentobar-bital sodiumwere given as the preanesthetic and the anesthetic, res'?ec-tively. The skin area to be exposed was closely clipped and cleaned. Thearea was then divided into four rows and ten columns, providing a gridof 40 squares. Figure 1 illustrates the placement of the grid patternand burns. Three to eight animals were used for each irradiance level.To minimize variation in area to area sensitivity, th, exposure timeswithin each irradiance group were randomly assigned to the grid pattern.Each irradiance-exposure time combination was generally replicated 10-20 times with each animal within a group receiving approximately thesame number of exposure combinations. The room temperature was heldwithin 72-78°F in order to reduce the influence of ambient temperature (3).
Fig. 1. Porcine skin immediately following exposure to laserradiationof2. 5 watts/cm 2 and exposure times of 1.4 to 5. Z sec.
2
4 Ot.

Subtle differences in color, intensity and uniformity of the surfaceappearance of the lesions were used to evaluate the severity of the cu-taneous burns. The categories used were:
0 No detectable change
1 Erythema (red burn)1-1 Erythema, disappears within 18-24 hr1-2 Mild erythema1-3 Moderate erythema1-4 Severe erythema with bluish cast
2 Coagulation (white burn)2-1 Spotty coagulationZ-Z Uniform white burn
The final evaluations of the burns were made 18-Z4 hr after exposure.
The median effective exposure time (EEt 5 0 ) was determinedgraphically for each subdivision of burn severity at each irradi3nce lev-ei used by the probit method of Litchfield and Wilcoxon (4). The EEt 5 0is the exposure time for a given irradiance with a 50% probability ofproducing a given grade of lesion.
Biopsik.s were taken from a selected number of lesions for histo-logical and histochemical evaluation in order to determine the correla-tion between the microscopic and surface appearance of the lesions (5).
RESULTS
The data obtained from the gross evaluation of 2, 288 porcine skinburns are presented in Table 1 (page 12). The number of burns in eachgrading classification is listed for each irradiance-exposure time com-bination used. For this report grades 0 and 1-1 were combined sinceboth represent undetectable lesions 18-24 hours post-exposure,
In almost every instance, either during or immediately followingthe exposure period, the skin at the exposure site developed a diffuse,transient erythema. This erythema usually extended beyond the limitsof the exposure site. In general, the longer the exposure time the long-er this transient erythema persisted. In the case of burns which per-sisted beyond 24 hours the peripheral erytherri subsided, leaving awell marked lesion closely corresponding to the size of the laserbeam.
~~-

From the data in Table 1 the median effective exposure time(EEt 50 ) has been determined for each subdivision of burn severity at eachirradiance level used. The results are presented in Table 2 (page 17).Since the data for 2-1 burns at irradiances of 1. 1 and 1. 2 watts/cm2
were too limited for meaningful calculations of confidence limits, ap-proximate EEt 5 0 values were determined by extrapolating the availabledata to the 50%6 probability level. The extrapolation was accomplishedby using the slope of curves for other grades of burn in the same series.No 2-1 burns were produced with an irradiance of .69 watts/cm2 fortheexposure times used.
Effective exposure times for other than the 50%6 level may be de-termined from the data in Table 2 by use of the slope function S as de-fined by Litchfield and Wilcoxon (4). The effective exposure times atthe 16%6 and 84%o probability level may be calculated as follows:
EEtI6 = EEt 5 0 +S
EEt 8 4 = EEt 5 0 x S
The mean slope function for the data in this report is 1. 16 L 0. 05; valuesof S calculated for different groups of irradiance or burn grades did notdiffer statistically. A straight line drawn through the 16%6 and 84%6 pointsplotted on logarithmic probability paper provides a curve from whichtheapproximate EEt can be determined for any probability level desired.
The data in Table 2 are presented graphically in a log-log plot inFigure 2 (next page). A power function such as H = at b when graphedas log-log plot yields a straight line; however, it can be seen in Figure2 that the slope of the curve for threshold lesions changes dt high andatlow irradiance levels. It is apparent that this simple power function isinadequate to describe the relationship between irradiance and exposuretime for even the limited range of exposure conditions tested here.
The curves for the more severe burns show the same generaltrends as that for mild erythema. Note that the curves for the variotasgrades of burns tend to zonverge at the longer exposure times. It isquite obvious from the graph that fo. ioi i exposure times a relativelysmall increase in irradiance car < n '. difference between a mildand a severe burn.
The data in Table 2 for mild erythema (1-2) and partial coagula-tion (2-1) have been used to calculate the median effective radiant expo-sure as a function of exposure time for the two levels of burns. The
4

AMild Erythemna (1 -2)
o Moderate Erythema (1-3)
10' a Severe Erythema (1-4)
8.0v Spotty White Burn (2-1)
W 4.0 -0 a q
3.o-
,z:iw 2.0"jU
VV
1.000 T
.8 A
A 0 a
.8
.2 .4 .4.6 .8 1.0 2 3 4 6 810 20 3040 60MEDIAN EFFECTIVE EXPOSURE TIME (SEC)
Fig. 2. Median effective exposure times vs. irradiance for
thermal skin lesions. f
values are tabulated in Table 3 (page 18) and graphically presented in
the semilogarithmic plot of Figure 3 (next page). The data points arek connected with solid lines to show the trend in each case.
The appare ', plateau on the data curves in Figure 3 at short ex-
posure times strongly suggests that fhe median effective -adiant expo-
sure necessary to produce these lesions will decrease little, if any, as
the exposure time is further reduced. If this is the case, then for ex-posure times shorter than those shown, the ED 5 0 for mild erythemawill be approximately 3 joules/cm2 and 8 joules/cmZ Zor partial white
• burns.
5
U _ _ _ _,__ _

34 I140 0c
32
30
, Spotly While Burn ( 2 - 128- Mild Erythema (1-2)
26 /
24-
IiI
S22
20/
//W =°°
// /iS10 /t
8 1
6
4-
p O p I I I * p
. ,4"'.6 1 2 4' 6 10 20 40 60, EXPOSURE TIME (SEC)
11
Fig. 3. Radiant exposure as a function of exposure time to pro-duce thermaliskinlesions. Dashedlines are theoretically derived;see text for explanation.
DISC USSION
The data for long exposure times and low irradiance shows con-siderable scatter (Fig. 2). Three possible explanations are suggestedfor the variability. It was previously mentioned that at low power 1ev-els the power output tended to fall off during the exposure period. Sincethe irradiance values given are the averages of the values determinedbefore, during and following the experiments, there is increased uncer-tainty in the dosimetry at the lower irradiance levels. It can be seen inFigure 2 that in the lower irradiance range a small error in dosimetrycould result in a big error in the median effective exposure time.
6

A second possibility for introducing variability in the data isiation in surface temperature of the porcine skin at the time of exI ,sure. IBerkley et al (3) found that if the skin temperature is lowered by 10°C
the radiant exposure required to produce a comparable degree of dam-age increases by 30-40%o. Barbiturates are known to affect the abilityof animals to maintain their body temperature. The magnitude of thiseffect on the skin surface temperature in these experiments was not de-termined. Any variability in surface temperature could result in an al-teration of the grade of burn for a given exposure.
Finally, '.e non-uniform distribution of energy flux in the laserbeam could lead to errors in assessment of the appropriate irradiance.In some cases the irradiance pattern in the beam was duplicated in theerythema intensity in the skin. Apparently this -.'as of more significanceat low irradiance levels, when most of these cases were noted.
There is considerable interest in developing mathematical models
to accurately predict the parameters resulting in specific radiation in-duced injuries over a wide range of wavelengths, exposure tirmes and in-tensities (6-10). Recently, Peacock (9) formulated a mathematical mod-el based on increases in surface temperature to predict threshold injur-ies induced by laser radiation. Although the model is successful in es-tablishing worst case limits for safety standards, it falls short of ac-curately describing the radiation levels necessary to induce specificlevels of thermal injury. The induction of thermal lesions in skin cer-tainly is not uniquely a surface phenomenon and any model should includedepth as a parameter.
Ar attempt is made with these data to make a simple correlationbetween tissue temperature and observed effect. It is assumed that theunique maximum temperature generated at the epidermal-dermal junc-tion for a given exposure episode determines the specific extent of therm-al injury to the tissue. The epidermal-dermal junction was chosen asrepresenting the most appropriate depth because of the proximity of thedermal capillary bed, the role of the basal layer of the epithelium in re-generation of new tissue, andthe morphologically distinct appearance ofthis junction.
In order to calculate the temperature rise at the epidermal-dermaljunction, the following assumptions are made: the skin is a semi-infiniteisotropic receiver, initially at a uniform temperature throughout; thethermal properties of the skin are constant and do not change with tem-perature; the surface is perfectly insulated and there are no reradiationlosses; the radiation input iE, a square wave and is normal to and uniform
7

over the surface of the tissue. An additional assumption made is thatthe tissue is opaque to the radiation which is absorbed at the surface.The last assumption appears to be reasonable and should lead to a closeapproximation to the real system, since the half-layer value of wet tis-sue and water for 10. 6 micron (g) radiation is approximately 10- 3 cmwith an absorption coefficient of about 700 cm " 1 (11-12). Moreover,Peacock (9) hao shown that the surface tei.iperatures calculated by meansof the opaque model agree viththose calculated by means of the diatherm-ous model. Agreement is to within 807o for exposures down to 0. 1 secwhen the thermal constants assumed here are used along with an ab-sorption coefficient of 700 cm - 1.
Under these conditions the temperature rise during the exposureepisode may be written (7, 8, 9) as
8.36 I x x4at x
Where U(x, t) = temperature rise at depth x and time t
I = irradiance (joules sec-lcm " 2 )
t = exposure time (sec)x= tissue depth (cm)
thermal inertia (cal 2 cm-Zdeg--sec - 1 )
a thermal diffusivity (cm 2 sec - 1)e:-fc = complimentary error function
The values used for the thermal constants:
t= 11.7 x 10"4calcm'4deg'?sec " 1
a = 8.4 x 10- 4 cm 2 sec - 1
were those derived experimentally for pig skin by Davis (7, 8). Theaverage depth of the epidermal-dermal junction was measured micro-scopically as 75 4 in biopsy samples taken from the skin of our experi-mental animals.
In Figure 3 the theoretical curve for a 25°C temperature riseshows a reasonably good fit to the experimental data for the productionof mild erythema over the eitire range tested. A 40°C temperaturerise provides the curve which best fits the data for the white burn;
)8
______________

however, the fit is rather poor. It is obvious that this model is inade-quate to accurately describe the dose-effect relationship for severeburns even over this limited exposure range. K
Though the theoretical curve appears to have a good fit to the ex-perimental data for mild erythema, its applicability over a wide rangeof exposure times is questionable. It was assumed that the maximumtemperature at the epidermal-dermal junction uniquely determines theextent of the thermal injury. But Stoll and Greene (13) have shown forirradiance levels lower than those used in these experiments that thecalculated maximum temperature at the epidermal-dermal junction ofhuman skin to produce either threshold pain or threshold blisters in-creases with increasing irradiance. The assumption also ignores the
Jtime-temperature history of the epidermal- dermal junction and the con-tributions of the reot of the tissue in eliciting the measured response.Weaver and Stoll (10) concluded, from calculations made on the basisof the "damage integral" model (6), that the higher the irradiance thegreater the contribution to thermal injury from the cooling portion ofthe temperature episode. Certainly the temperature gradient withinthe skin during the exposure period varies markedly with irradiance.Although in all cases for mild erythema the calculated maximum tem-perature rise at the epidermal-dermal junction is 25°C, the calculatedmaximum temperature rise at the surface of the tissue for equivalentexposure episodes is 43. 9°C for 12.4 watts/cm 2 (. 2 sec exposure time)and 26. 3C for . 75 watts/cm 2 (20 sec exposure time). Additional data,especially for very short exposure times, is needed to determine whetherthe proposed model will be useful in defining the exposure parametersJ ' necessary tc. produce threshold burns over awide range of exposure con-
ditions or that the goodness of fit shown here for a limited range is for-tuitous.
il The "damage integral" model takes into account the time-temper-ature history of the biological specimen and can easily be modified toaccept thermal constants and damage rates which vary as a function oftemperature. To evaluate the utility of the model for accurate predic-tions a computer program is being developed. This program will beused to analyze burn data from laser radiation over a wide range of ex-posure conditions and severity levels.
j CONCLUSIONSThe empirically determined dose-response relationship for the
induction of thermal lesions in porcine skin by CO 2 laser radiation is9
4I

adequate to establish laser safety standards for these injuries withinthe exposure time range of 0. 2 to 40 sec.
A relatively simple model can describe, with reasonable accuracy,the exposure parameters necessary to produce threshold skin lesionsWithin this same range of exposure times. However, the model is inade-quate for more severe levels of injury.
Dose-response relationships should be determined at very shortexposure times to determine the validity of extending the range of pre-
• dic'ion of the model.
LITERATURE CITED
1. Brownell, A. S., W. H. Parr, D. K. Hysell and R. S. Ded-rick. Threshold lesions induced in porcine skin by CO? laserradiation. USAMRL Report No. 732, 1967 (DDC AD No. 659-347).
Z. Flint, G. W. Lasers and their effects. Ann. Prog. ReportMartin Co., Orlando, Florida. Contract No. DA-49-193-MD-2456, OR 8338, 1966.
3. Berkley, K. M., H. E. Pearse and T. P. Davis. Studies offlash burns: The influence of skin temperature in the produc-tion of cutaneous burns in swine. Univer. of Rochester Atom-ic Energy Project Report UR-338, 1954.
4. Litchfield, J. T. and F. Wilcoxon. A simplified method ofevaluating dose-effect experiments. J. Pharm. Exp. Therap.96: 99, 1949.
5. Hysell, D. K. and A. S. Brownell. Correlation between thegross and microscopic appearance of CO Z laser induced por-cine skin burns. USAMRL report (in preparation).
6. Henriques, F. C. Studies of thermal injury. V. The pre-dictability and the significance of thermally induced rateprocesses leading to irreversible epidermal injury. A. M. A.Arch. Pathol. 43: 489, 1947.
7. Davis, T. P. A theoretical and experimental investigation ofthe temperature response of pig skin exposed to thermal radiation.Univer. of Rochester Atomic Energy Report UR-533, 1959.
10
_ _ _ _ _ _ _

8. Davis, T. P. The heating of skin by radiant energy. In:J. D. Hardy, Temperature, Its Measurement and Control inScience and Industry. New York: Reinhold Publishing Corp.,1963, p. 149.
9. Peacock, G. R. Surface temperature as a parameter in esti-mating laser injury threshold. USAMRL Report No. 733,1967 (DDC AD No. 658967).
10. Weaver, J. A. and A. M. Stoll. Mathematical model of skinexposed to thermal radiation. NADC-MR-6708, 1967.
11. Hardy, J. D. and C. Muschenheim. Radiation of heat fromthe human body. V. The transmission of infra-red radia-tion through skin. J. Clin. Invest. 15: 1, 1936.
12. McAlister, E. D. Infrared-optical techniques applied tooceanography. I. Measurement of total heat flow from thesea surface. Appl. Optics, 3: 609, 1964.
13. Stoll, A. M. and L. C. Greene. Relationship between painand tissue damage due to thermal radiation. J. Appl. Physiol.14: 373, 1959.
11

TABLE 1
Tabulati-d D6se-Response Data
Irradiance Exposure No. of burns(watts/cm2 ) Time 0(sec) or' ,
1-1 1-2 1-3 '-4 2-1 Total
.06 15 15
.11 17 17
.16 14 14
.21 8 7 15
.25 3 12 1530 17 17
13.6 .35 .3 2 15.40 9 6 15.50 3 7 4 1 15.6o 2 10 4 16
7 1 1 13 15Z9 1 1 13 1589 14. 16
.11 ' 16 16
.16 '17 17
.21 17 17
.25 13 4 IT
.31 10 7 17
.36 2 15 17a0.6 .41 1 17 18
.45 1 15 16
.51 14 3 17
.61 6 9 2 17
.70 1 10 5 1 17
.79 7 10 2 19
.89 1 9 7 17
.99 3 1 14 18
.39 5 6 11
.49 4 18 22
.59 18 4 22
.68 12 10 22
.79 2 16 4 22
.88 4 6 10
.99 2 2 16 2 227.6 1.08 6 4 10
12

TABLE 1 (cont)
Irradiance Exposure No. of Burns(watts/cm2 ) Time 0
(sec) or1-1 1-2 1-3 1-4 2-1 Total
1.18 1 3 18 22
1.29 2 7 91.39 23 231.48 io 10
1.59 12 12
1.78 12 12
1.99 12 12.60 10 2 12
.69 8 4 12
.79 2 7 9
.90 11 111.10 10 1 11
4.7 1.30 5 10 15
1.50 1 5 5 111.70 3 3 6 12
1.90 1 8 9.0 2 10 12
.38 12 12
.49 12 12.60 12 12.69 12 12
.79 16 2 18
.89 18 18
J.99 17 2 19
1.20 11 1 121.40 7 12 19
3.7 1.60 2 15 1 18
1.80 1 12 7 20
2.00 11 7 1 19
2.20 1 6 8 5 202.41 3 6 7 3 19
2.61 1 6 8 4 19
2.81 6 5 8 193.01 1 4 14 193.21 1 17 183.43 7 7

TABLE 1 (cont)
Irradiance Exposure No. of Burns(watts/cmz ) Time 0
(sec) orI-I i-Z 1-3 1-4 2-1 Total
1.40 12 121.70 18 182.00 16 2 182.31 8 10 182. 61 1 17 182.91 2 15 1 18
2.5 3.22 14 1 1 163.53 9 7 2 183.83 4 5 6 3 184.13 2 2 12 4 204.43 1 2 3 11 174.73 z 5 11 184.94 2 17 195.23 1 1 10 1Z3.93 12 5 174.23 6 15 214.53 4 17 214.84 5 16 214.97 1 14 155.24 18 185.64 19 19
1.7 6.02 1 11 1 1 1 156.99 4 6 1 4 158.02 4 6 5 159.02 1 4 10 15
10.0 2 13 1511.0 15 1512.0 15 154.96 14 1 156.01 13 1 146.98 10 5 158.01 5 10 15
1.2 9.01 1 14 1510.0 11 2 1 1411.0 6 6 1 1 1412.0 2 7 4 z 15
14

ITABLE 1 (cont)
Irradiance Exposure No. of Burns(watts/cmZ) Time 0
(sec) or1-1 1-2 1-3 1-4 2-1 Total
8.03 15 1510.1 15 1512 0 12 3 15J0 3 12 15
1.1 16.0 11 4 1518.0 5 5 5 1520.0 8 6 1 1522.0 1 9 5 1510.3 10 1012.3 8 814.4 10 1016.3 9 1 1018.3 7 3 10
.87 20.4 4 5 923.3 1 7 1 926.4 5 3 1 929.3 2 3 3 1 932.4 1 3 4 1 935.5 5 4 938.4 5 441.4 2 7 915.4 16 2 1818.5 3 14 1 1821.6 1 14 1 1624.0 1 11 6 1827.7 1 7 9 1730.7 1 11 5 17
.74 33.7 8 7 3 1836.7 1 9 7 1738.9 1 5 11 1742.7 5 9 1445.8 3 3 12 1848.5 3 14 1751.6 3 14 1754.4 2 14 16
15
I.V___________________________________________________________________________ I

TABLE 1 (cont)
Irradiance Exposure No. of Burns
(watts/cm Time 0(sec) or
1-1 1-2 1-3 1-4 2-1 Total
10.4 9 912.3 10 10!4.4 8 816.5 8 1 918.5 6 3 920.4 8 3 11
.69 23.5 3 5 1 926.1 1 7 2 1029.5 1 6 1 832.3 6 2 1 935.5 4 4 1 938.3 2 5 2 941.3 5 3 8
2, 288
16

t- a% N a', 0 LAO 0? in
N, .0 wO 0 '.0 co 1-4 00 N r- 00
LA C.:
a' 0 NA CO a' C% - %.0 0 4 a ' 44 N 0 N
0 *~ 06 C4N"t4
N 4 C OO6U) -N mA(? Ln
~ r- c LA~j4r-0 LA mA mA-4
r-4 :4 N N :v
c LA w' %c'0 LA) a' LA N j4N 0 r
N e U
N - N2 0D r4 - a A 't -4 N .4.3
N N CO
0 tn '.0 m.N
1-4 N- ~ N 04
-4 N A -. N Nc'oa
N LA LA) C'n LA -4 4-4 a' t D j '00
'4 ' ~ C 06 al' C" I'
'-4 - - N
A 0
N m mA 0 - fn MA N C7%
w 17
u_ r___ __ lo a,

TABLE 3
Radiant Energy to Produce 1-2 and 2-1 Burns
1-2 Burns 2- 1 Burns
Exposure Time Radiant Exposure Exposure Time Radiant Exposure(Sec) (jcales/cmZ ) (Sec) (joules/cm2 )
.22 3.0 .66 9.0
.30 3.2 .91 9.6
.37 Z. 8 1.1 8.4
.71 3.3 1.7 8.0
1.3 4.8 2.9 10.7
2.3 5.8 4.3 10.8
4.1 7.0 8.4 14.3
7.4 8.9 14 17
13.1 14.4 23 25
17.4 12.9 37.4 32.5
19.9 17.3 39.6 29.3
21.6 14.9
18
I
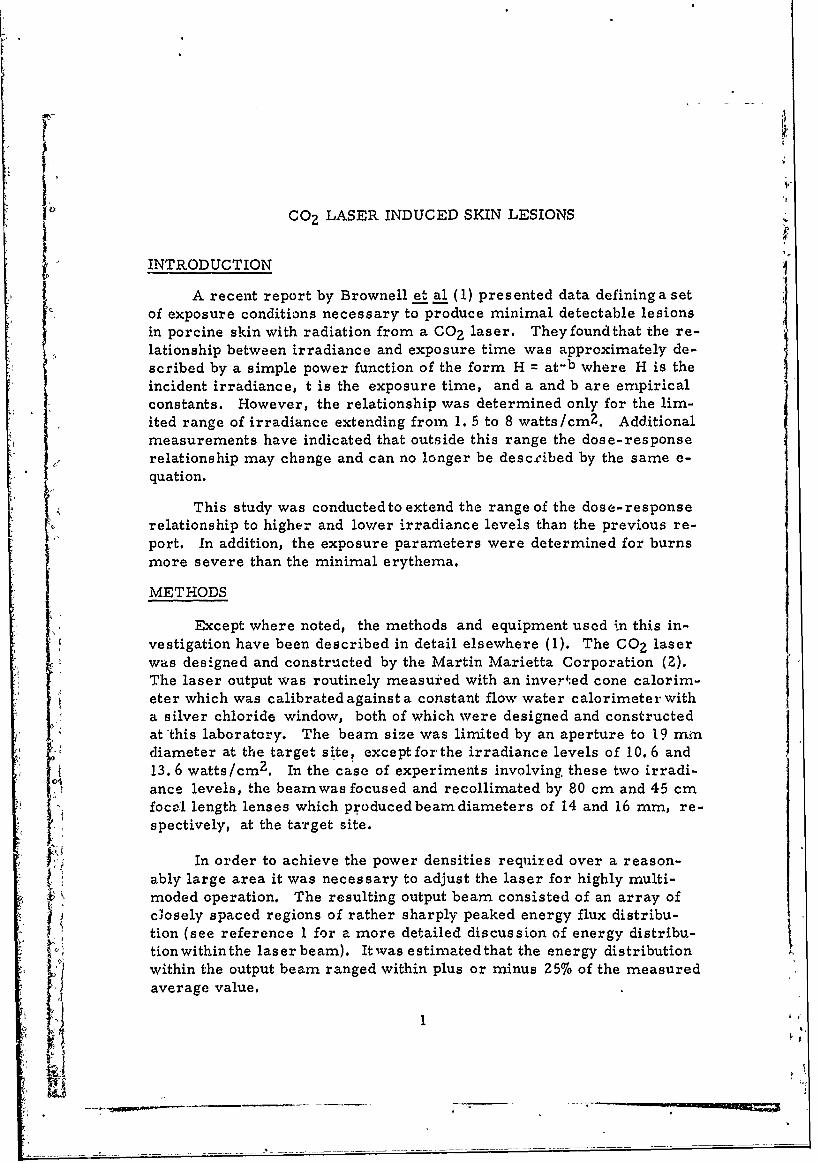
DISTRIBUTION LIST
10 copies to:
US Army Medical Research and Development CommandDepartment. of the Army, Washington, D. C. 20315
20 copies to:
Defense Documentation Center, Cameron Station,
Alexandria, Virginia 22314
1 copy to:
US Army Combat Development Command, Medical Service Agency,Brooke Army Medical Center, Fort Sam Houston, Texas 78234
Walter Reed Army Institute of Rescarch, WRAMCWashington, D. C. 20012
US Army Medical Equipment Research and Development Laboratory,Fort Totten, Flushing, Long Island, New York 11359
US Army Medical Biomechanical Research Laboratory, WRAMC,Forest Glen Section, Washington, D. C. 20012
US Army Medical Research and Nutrition Laboratory, FitzsimonsGeneral Hospital, Denver, Colorado 80240
US Army Research Institute of Environmental Medicine, US ArmyNatick Laboratories, Natick, Massachusetts 01762
US Army Aeromedical Research Unit, US Army Aviation Center,Fort Rucker, Alabama 36362
The Historical Unit, US Army Medical Service, Forest Glen Section,WRAMC, Washington, D. C. 20012
Technical Director of Research, Armed Forces Institute of
Pathology, Washington, D. C. 20012
Commanding Officer, US Army Environmental Health Agency,Edgewood Arsenal, Maryland 21041

UNCLASSIFIEDSecurity Classification DO 6CUMENT CONTROL DATA-R St D
(Security classification of title, body of abstract and Indexing annototlon must be entered when the overall report Is classlfled)
1. ORIGINATING ACTIVITY (Corporate author) |2a. REPORT SECURITY CLASSIFICATION
US Army Medical Research Laboratory b. UNCLASSIFIEDFort Knox, Kentucky 40121'GROUP
3. REPORT TITLE
L CO2 LASER INDUCED SKIN LESIONS
4. DESCRIPTIVE NOl ES (Type of report and Inclusive datea)
Final Report5. AU THORIS) (First name, middle Inlilal, last name)
Arnold S. Brownell, Ph.D., Wordie H. Parr, Ph. D., Captain David K. Hysell, VCand Captain Robert S. Dedrick, VC
4. REPORT DATE 7a. TOTAL NO. OF PAGES 7b. NO. OF REFS
13 March 1968 18 1341a. CONTRACT OR GRANT NO. 9a. ORIGINATOR'S REPORT NUM7"ERIS)
6. PROJECT NO. 3A014501B71R 769
c-Task No. 01 9b. OTHER REPORT NO(S) (Any other number& that may be aeaIgnedthis report)
d.Work Unit No. 103 t )
10. DISTRIGUTION STATEMENT
This document has been approved for public release and sale; its distribution isunlimited.
I1. SUPPLEMENTARY NOTES 12. SPONSORING MILITARY ACTIVITY
US Army Medical Research and Develop-
ment Command, Washington, D.C. 20315
I3.' ASTRACT
Depilated skin of white pigs was exposed to different exposure time-irradiance
combinations using CO 2 laser radiation (10. 6 microns), The lesions produced rangedfrom a mild erythema to partial tissue coagulation. The probability ot producing aparticular grade of lesion was then established for power densities within the rangeof 0. 69-13.6 watts/cr 2 and exposure times of 0. 2 to 40 sec. Data obtained are ade-quate to establish laser safety standards. A relatively simple model is discussedthat describes the exposure parameters to produce threshold skin lesions. (U)
I
I473 REPLACES DO FORM 1478. I JAN 04. WHICH ISDI ,17 DOOsY o FoT OR ARMY U59. UNCLASSIFIEDSecurity Class'ification

UNCLASSIFIEDSecurity Classification
14. LINK A LINK B LINKKEY WORD-
ROLE WT ROLE WT ROLE WT
Laser, injury, biologicalRadiationThermalSkinBurnsInfrared rays
II
Li
AG 3511-0-Army-Knox-Jun 68-225 UNCLASSIFIED-Security Classification
A _ _ _ _ _ _ _ _ _ _ _ _