Embed Size (px)
Citation preview

Technical Report INP-SL-2 October 1999
US Army Corps of Engineers Engineer Research and Development Center
Innovations for Navigation Projects Research Program
by Brian H. Green
Approved For Public Release; Distribution Is Unlimited
Prepared for Headquarters, U.S. Army Corps of Engineers
'ffSIC Q'iJAlii'i;'::/ .ü:;r:..

m
as»*
Si
sap
HI Ü «as
The contents of this report are not to be used for advertising, publication, or promotional purposes. Citation of trade names does not constitute an official endorsement or approval of the use of such commercial products.
The findings of this report are not to be construed as an official Department of the Army position, unless so desig- nated by other authorized documents.
i Hi l Els g§ Ü SB
9
i
Ü
ü PS P
i PRINTED ON RECYCLED PAPER
I

Innovations for Navigation Technical Report INP-SL-2 Projects Research Program October 1999
Development of Soil-Based Controlled Low-Strength Materials by Brian H. Green
U.S. Army Engineer Research and Development Center Waterways Experiment Station 3909 Halls Ferry Road Vicksburg, MS 39180-6199
Final report Approved for public release; distribution is unlimited
Prepared for U.S. Army Corps of Engineers Washington, DC 20314-1000
Under Work Unit 33142

Army Engineer Research and Development Center Cataloging-in-Publication Data
Green, Brian H. Development of soil-based controlled low-strength materials / by Brian H. Green ; prepared
for U.S. Army Corps of Engineers. 60 p.: ill.; 28 cm. — (Technical report; INP-SL-2) Includes bibliographic references. 1. Fills (Earthwork) 2. Hydraulic structures — Design and construction. 3. Strength of
materials. I. United States. Army. Corps of Engineers. II. U.S. Army Engineer Research and Development Center. III. Structures Laboratory (U.S.) IV. Innovations for Navigation Projects Research Program (U.S.) V. Title. VI. Series: Technical report INP-SL ; 2. TA7 E8 no.lNP-SL-2

Contents
Preface v
Conversion Factors, Non-SI to SI Units of Measurement vi
1—Introduction 1
2—Background 3
Controlled Low-Strength Materials 3 Properties of Controlled Low-Strength Material 5
3—Previous Research 9
4—Objectives 11 Hypothesis 11 Significance 11 Research Objectives 11
5—Research Methodology 12
General Discussion of Case Study Area 12 Geology of the Case Study Area 13 Materials Used to Produce a Soil-Based
Controlled Low-Strength Material 17 Proposed Mixture Proportion Matrix and Test Methods 18
6—Research Program 20
Materials Used to Produce the Soil-Based CLSM Mixtures 20 Equipment and Methodology 22 Mixture Proportioning 24
7—Results 27
8—Summary and Conclusions 33
Unhardened Property Test Results 33 Strength Test Results on Hardened Specimens 33 Recommendations for Further Study 34
References 35
Appendix A: Results of Tests of Cement and Fly Ashes Al
Appendix B: CLSM Mixture Proportions, 1-yd3 Batch Bl
in
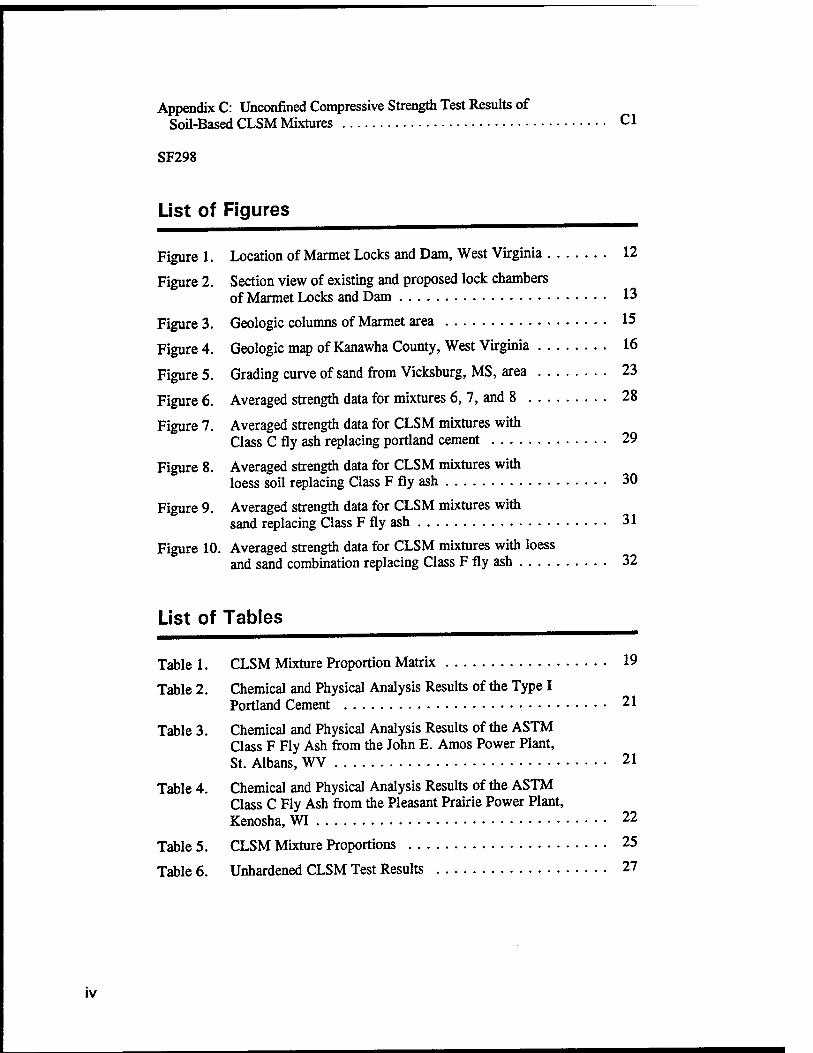
Appendix C: Unconfined Compressive Strength Test Results of Soil-Based CLSM Mixtures Cl
SF298
List of Figures
Figure 1. Location of Mannet Locks and Dam, West Virginia 12
Figure 2. Section view of existing and proposed lock chambers of Mannet Locks and Dam 13
Figure 3. Geologic columns of Marmet area 15
Figure 4. Geologic map of Kanawha County, West Virginia 16
Figure 5. Grading curve of sand from Vicksburg, MS, area 23
Figure 6. Averaged strength data for mixtures 6, 7, and 8 28
Figure 7. Averaged strength data for CLSM mixtures with Class C fly ash replacing portland cement 29
Figure 8. Averaged strength data for CLSM mixtures with loess soil replacing Class F fly ash 30
Figure 9. Averaged strength data for CLSM mixtures with sand replacing Class F fly ash 31
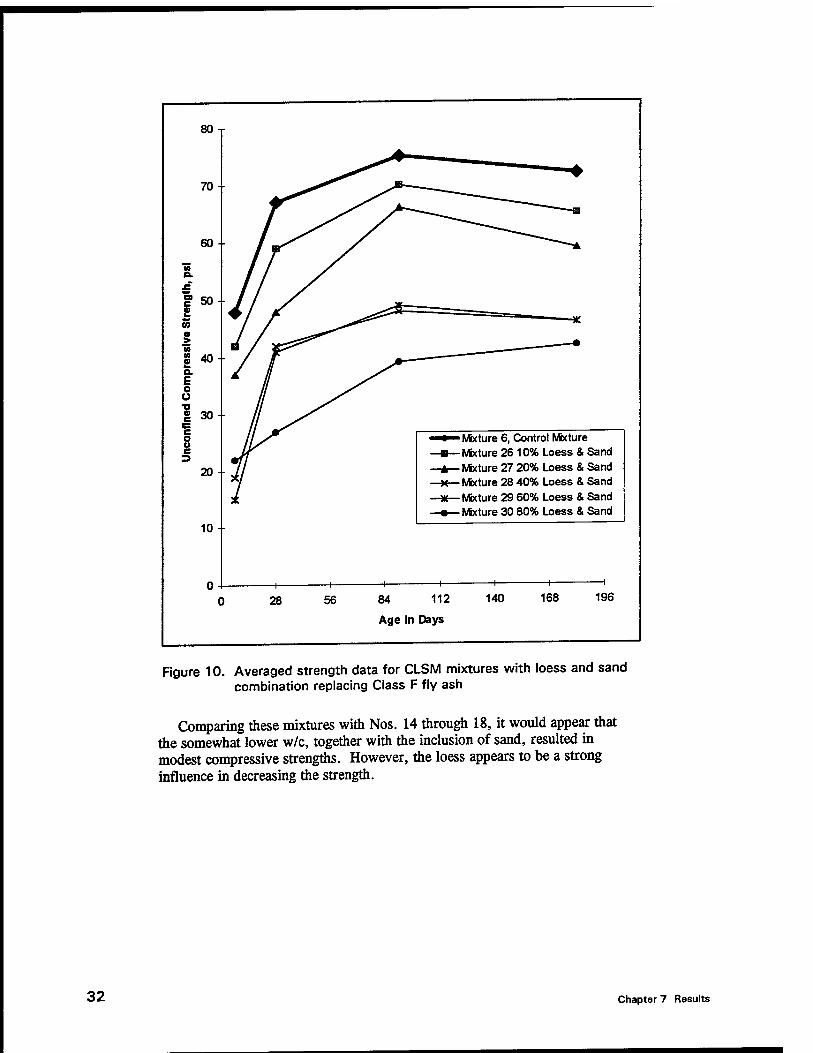
Figure 10. Averaged strength data for CLSM mixtures with loess and sand combination replacing Class F fly ash 32
List of Tables
Table 1. CLSM Mixture Proportion Matrix 19
Table 2. Chemical and Physical Analysis Results of the Type I Portland Cement 21
Table 3. Chemical and Physical Analysis Results of the ASTM Class F Fly Ash from the John E. Amos Power Plant, St. Albans, WV 21
Table 4. Chemical and Physical Analysis Results of the ASTM Class C Fly Ash from the Pleasant Prairie Power Plant, Kenosha, WI 22
Table 5. CLSM Mixture Proportions 25
Table 6. Unhardened CLSM Test Results 27
IV

Preface
The work described in this report was authorized by Headquarters, U.S. Army Corps of Engineers (HQUSACE), as part of the Innovations for Navigation Projects (INP) Research Program. The work was performed under Work Unit 33142, "Concrete and Grouts for Underwater Placement," managed at the U.S. Army Engineer Research and Development Center (ERDC) Structures Laboratory (SL). Mr. Billy D. Neeley, SL, was the Principal Investigator.
Dr. Tony C. Liu was the INP Coordinator at the Directorate of Research and Development, HQUSACE. Dr. Reed L. Mosher, SL, was the Laboratory Manager for the INP Program; Dr. Barry D. Fehl, ERDC Information Technology Laboratory, was the INP Program Manager.
The work was performed at ERDC, and this report was prepared by Mr. Brian H. Green, Concrete and Materials Division (CMD), SL, under the general supervision of Dr. Bryant Mather, Director, SL, and Mr. John Q. Ehrgott, Assistant Director, SL, and under the direct supervision of Dr. Paul Mlakar, Chief, CMD. Messrs. Michael Lloyd, Rudolph A. Andreatta, and Melvin C. Sykes, Operations Group, CMD, provided technical assistance and performed the laboratory work. Dr. Tarun Naik, University of Wisconsin Milwaukee, provided technical guidance for this study. Mr. Neeley, Research Group, CMD, and Dr. Raymond S. Rollings, ERDC Geotechnical Laboratory, provided technical review. Mr. Michael Nield, U.S. Army Engineer District, Huntington, provided information on the geology of the case study area.
At the time of publication of this report, Dr. Lewis E. Link was Acting Director of ERDC, and COL Robin R. Cababa, EN, was Commander.
The contents of this report are not to be used for advertising, publication, or promotional purposes. Gtation of trade names does not constitute an official endorsement or approval of the use of such commercial products.

Conversion Factors Non-SI to SI Units of Measurement
Non-SI units of measurement used in this report can be converted to SI units as follows:
Multiply By To Obtain
cubic foot 0.02831685 cubic metres
cubic yards 0.7645549 cubic metres
Fahrenheit degrees 5/9 Celsius degrees1
feet 0.3048 metres
inches 25.4 millimetres
miles (U.S. statute) 1.609347 kilometres
pounds-force 4.448222 newtons
pounds (force) per square inch 6.894757 kilopascals
pounds (mass) 0.4535924 kilograms
pounds (mass) per cubic foot 16.01846 kilograms per cubic metre
1To obtain Celsius (C) temperature readings from Fahrenheit (F) readings, use the following formula: C = (5/9)(F-32).
VI

1 Introduction
The U.S. Army Corps of Engineers (USACE) has initiated a research program to investigate innovative construction techniques for future USACE Civil Works structures that will be located throughout the United States. As a part of the Innovations for Navigation Projects (INP) Research Program, the USACE will conduct research to develop new materials and methodologies for the construction and repair of existing and future Corps hydraulic structures.
This research effort, "Development of Soil-Based Controlled Low-Strength Materials," contributes to this new program. It concerns the use of controlled low-strength material (CLSM) as a backfill material. CLSM is defined by the American Concrete Institute (ACI) as "...materials that result in a compressive strength of 1,200 psi [8.3 MPa] or less" (ACI 1992). CLSM is self- compacting, cement-based material used primarily as a backfill (ACI 1994a). Unlike conventional backfill, CLSM mixtures do not require mechanical compaction after placement. This allows for a more economical approach to backfilling since the equipment and labor required to place and compact conventional fill are eliminated.
When new lock chambers or other large construction activities are undertaken, a considerable amount of soil or rock, or both, is excavated and removed from the construction site. Some of this material may be reused as a compacted structural backfill or random backfill. However, there are situations when this material is not used and is placed in a spoil pile at the construction site or must be hauled away from the construction site. The excavated material that may be reused more commonly consists of the low- plasticity to non-plastic material. These materials are more readily placed and compacted as standard structural backfill. Many of the excavated materials not used are those in the clay fraction that plot above the A-line on the plasticity chart of the Unified Soil Classification System (USCS) (Casagrande 1948). The high plasticity of these materials may preclude their use as backfill materials.
As a case study example, the U.S. Army Engineer, Great Lakes and Ohio River Division, Huntington District, is adding a new lock chamber at the Marmet Locks and Dam on the Kanawha River in West Virginia. The construction of this new lock chamber will require the excavation of large amounts of soil. Current construction plans call for the new lock chamber to be built adjacent to the existing lock chambers on the right downstream bank of the river. The modernization also includes plans for excavated material not used in the new construction to be disposed of on newly acquired project lands
Chapter 1 Introduction

(Nield 1998). The right downstream bank of the river below the construction site will serve as a permanent storage for the excavated waste. The excavated material will be placed in mounds or hills that will take up valuable real estate and serve no useful purpose. However, with appropriate research and development activities, these waste piles can be converted to economically useful and environmentally sound construction materials. Other locally available waste or by-product materials can also be incorporated into a soil- based CLSM, providing additional economic benefits and a more positive environmental impact.
Construction of the new lock chamber at Mannet Locks and Dam will create a large void between the existing lock chambers and the proposed new lock chamber. Plans call for this void area to be backfilled to meet the structural requirements of the lock walls. Also, the backfilled area could be used to meet operational needs of the lock system. The volume of this void area is projected to be in the range of 61,160 m3 (80,000 yd3). Use of an economical soil-based CLSM in this void area, using otherwise undesirable excavated material from the project site, is an attractive option.
Chapter 1 Introduction

2 Background
Controlled Low-Strength Materials
The ACI defines CLSM as materials that result in unconfined compressive strengths of 1,200 psi (8.3 MPa) or less (ACI 1992). CLSM should not be considered as a type of low-strength concrete, but rather as a structural backfill. CLSM is known by many different names such as flowable fill, controlled density fill, unshrinkable fill, flowable fly ash, flowable mortar, fly ash slurry, and soil-cement slurry. As stated earlier, the primary application of CLSM is as a structural backfill or backfill in lieu of compacted soil. Because CLSM needs no mechanical compaction and can be proportioned to be very fluid, it is ideal for use in restricted-access areas where placing and compacting conventional fill is difficult. If future excavation is anticipated, the maximum long-term compressive strength should generally not exceed 2 MPa (300 psi) (ACI 1994a).
Long-term compressive strengths of 0.3 MPa to 2 MPa (50 to 300 psi) are very low when compared with conventional concrete. However, in terms of allowable bearing pressure, which is a common criterion for measuring the capacity of a soil to support a load, 0.3- to 0.7-MPa (50- to 100-psi) strengths are equivalent to a well-compacted fill. CLSM is very fluid while it is being mixed and placed and has a consistency of a lean cement slurry or grout. However, several hours after placement, the material hardens enough to support traffic loads without settling.
Although CLSM generally costs more per cubic yard than most soil or granular backfill materials, its many advantages often result in lower in-place costs. In fact, for some applications, CLSM may be the only reasonable backfill method available (ACI 1994a).
CLSM mixtures usually consist of portland cement, fly ash or other similar by-products, coarse or fine aggregates, and water. Ready-mix concrete producers are the largest producers of CLSM and produce CLSM with the same component materials used in the production of concrete. Some mixtures consist of portland cement, water, and fly ash only. Materials used to make CLSM may meet ASTM or other standards, but the use of materials meeting standard specification requirements is not always necessary. Selection of materials should be based on availability, cost, specific application, and the necessary characteristics of the mixture such as flowability, strength,
Chapter 2 Background

excavatability, and density (ACI 1994a). This research will study the feasibility of incorporating soil into a CLSM.
Portland cement is used to provide the compressive strength for the mixture and to bind the other materials together. Generally, the higher the cement content of the mixture, the higher the strength. If a highly reactive Class C fly ash is used, a lower cement content is possible without loss of strength because of the cementitious nature of the fly ash. Since low strengths are desired for CLSM, long-term strength tests of trial batches should be monitored in order not to exceed desired maximum strength.
Large quantities of water are used in CLSM because they impart the flowability, self-leveling, and self-consolidation features. Water that is normally used to produce concrete is acceptable for use in CLSM. Water amounts can be varied to adjust the strength of the CLSM. Increasing the water-to-solids ratio will increase the flowability but will decrease the strength of the hardened material.
Fly ash can also help the flowability of CLSM. The spherical fly ash particles increase the flowability for a given water content, or conversely, reduce the amount of water required for a given degree of flowability. Bleeding of free water is reduced by using fly ash because of the increase of solids and therefore less segregation of the solids. Both Class F and C fly ashes can be used in CLSM.
Aggregates are used as an economical constituent material in CLSM since they are usually the lowest cost material other than water. Aggregates increase the density of CLSM but will decrease the flowability. For economic reasons, aggregates are often the major constituents of a CLSM. Ready-mix concrete producers have ample supplies of aggregates at their batching facilities. Locally mined stone or gravel is more economical and is normally used in CLSM. Some of the aggregates used to produce CLSM are
• 9.5-mm (%-in.) nominal maximum size aggregate (NMSA) with sand.
• 75-mm (%-in.) NMSA with sand.
• Sandy soils, with more than 10 percent passing the 75-^m (No. 200) sieve.
• Quarry waste products, generally less than 300 ^m in particle size.
• ASTM C 33 specification aggregates within specified gradings (ACI 1994a).
Other possible materials for use in CLSM may be bottom ash from the coal combustion process, used foundry sand, and reclaimed crushed concrete. When available, these materials may be more economical than other materials. It is necessary to test these materials before they are used to ensure their acceptability and feasibility in a CLSM.
Chapter 2 Background
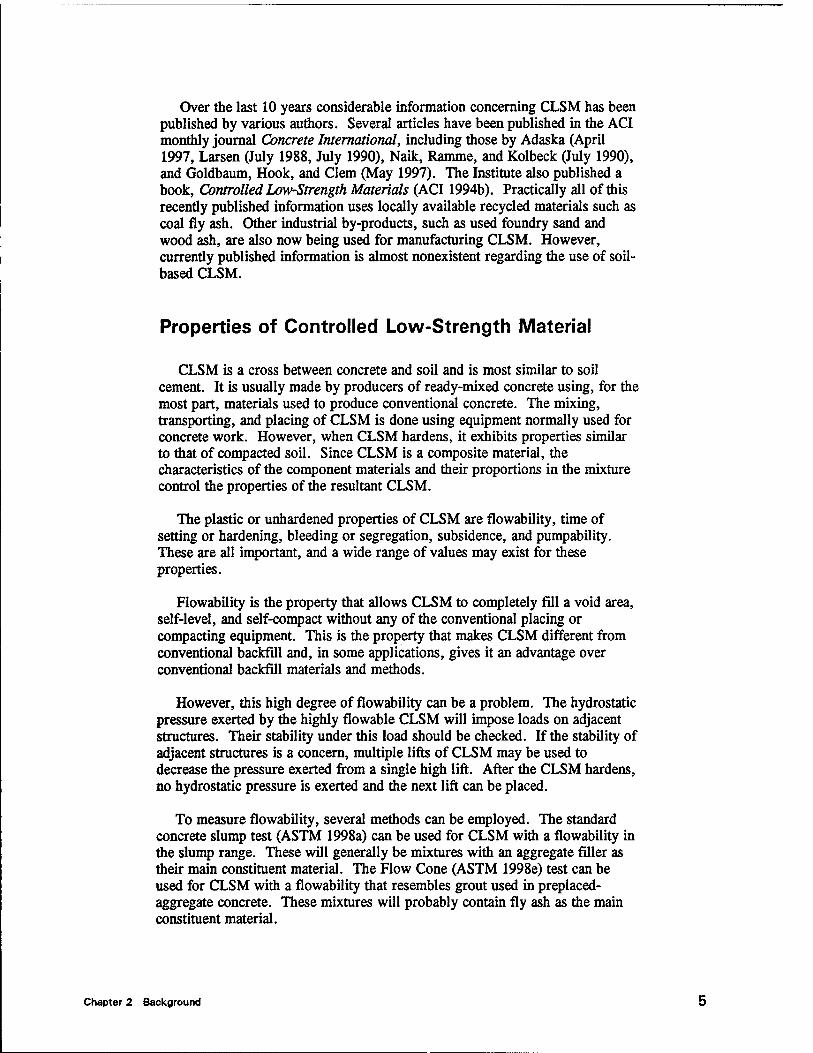
Over the last 10 years considerable information concerning CLSM has been published by various authors. Several articles have been published in the ACI monthly journal Concrete International, including those by Adaska (April 1997, Larsen (July 1988, July 1990), Naik, Ramme, and Kolbeck (July 1990), and Goldbaum, Hook, and Clem (May 1997). The Institute also published a book, Controlled Low-Strength Materials (ACI 1994b). Practically all of this recently published information uses locally available recycled materials such as coal fly ash. Other industrial by-products, such as used foundry sand and wood ash, are also now being used for manufacturing CLSM. However, currently published information is almost nonexistent regarding the use of soil- based CLSM.
Properties of Controlled Low-Strength Material
CLSM is a cross between concrete and soil and is most similar to soil cement. It is usually made by producers of ready-mixed concrete using, for the most part, materials used to produce conventional concrete. The mixing, transporting, and placing of CLSM is done using equipment normally used for concrete work. However, when CLSM hardens, it exhibits properties similar to that of compacted soil. Since CLSM is a composite material, the characteristics of the component materials and their proportions in the mixture control the properties of the resultant CLSM.
The plastic or unhardened properties of CLSM are flowability, time of setting or hardening, bleeding or segregation, subsidence, and pumpability. These are all important, and a wide range of values may exist for these properties.
Flowability is the property that allows CLSM to completely fill a void area, self-level, and self-compact without any of the conventional placing or compacting equipment. This is the property that makes CLSM different from conventional backfill and, in some applications, gives it an advantage over conventional backfill materials and methods.
However, this high degree of flowability can be a problem. The hydrostatic pressure exerted by the highly flowable CLSM will impose loads on adjacent structures. Their stability under this load should be checked. If the stability of adjacent structures is a concern, multiple lifts of CLSM may be used to decrease the pressure exerted from a single high lift. After the CLSM hardens, no hydrostatic pressure is exerted and the next lift can be placed.
To measure flowability, several methods can be employed. The standard concrete slump test (ASTM 1998a) can be used for CLSM with a flowability in the slump range. These will generally be mixtures with an aggregate filler as their main constituent material. The Flow Cone (ASTM 1998e) test can be used for CLSM with a flowability that resembles grout used in preplaced- aggregate concrete. These mixtures will probably contain fly ash as the main constituent material.
Chapter 2 Background
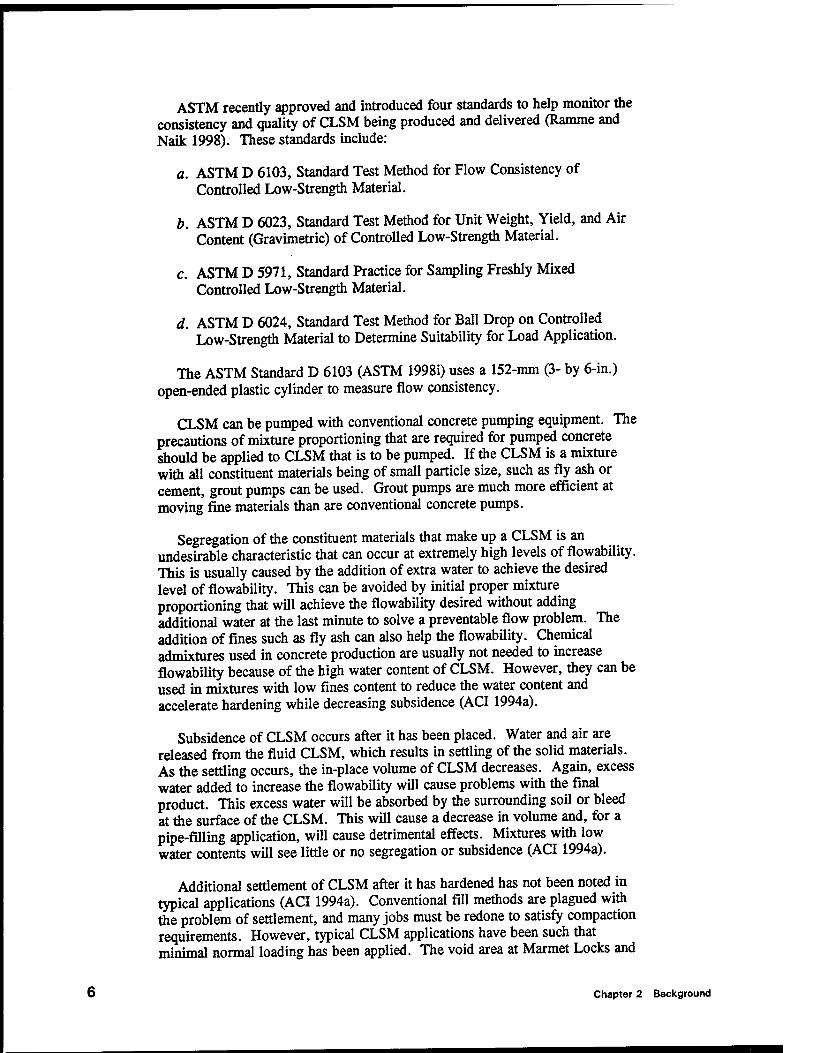
ASTM recently approved and introduced four standards to help monitor the consistency and quality of CLSM being produced and delivered (Ramme and Naik 1998). These standards include:
a. ASTM D 6103, Standard Test Method for Flow Consistency of Controlled Low-Strength Material.
b. ASTM D 6023, Standard Test Method for Unit Weight, Yield, and Air Content (Gravimetric) of Controlled Low-Strength Material.
c. ASTM D 5971, Standard Practice for Sampling Freshly Mixed Controlled Low-Strength Material.
d. ASTM D 6024, Standard Test Method for Ball Drop on Controlled Low-Strength Material to Determine Suitability for Load Application.
The ASTM Standard D 6103 (ASTM 1998i) uses a 152-mm (3- by 6-in.) open-ended plastic cylinder to measure flow consistency.
CLSM can be pumped with conventional concrete pumping equipment. The precautions of mixture proportioning that are required for pumped concrete should be applied to CLSM that is to be pumped. If the CLSM is a mixture with all constituent materials being of small particle size, such as fly ash or cement, grout pumps can be used. Grout pumps are much more efficient at moving fine materials than are conventional concrete pumps.
Segregation of the constituent materials that make up a CLSM is an undesirable characteristic that can occur at extremely high levels of flowability. This is usually caused by the addition of extra water to achieve the desired level of flowability. This can be avoided by initial proper mixture proportioning that will achieve the flowability desired without adding additional water at the last minute to solve a preventable flow problem. The addition of fines such as fly ash can also help the flowability. Chemical admixtures used in concrete production are usually not needed to increase flowability because of the high water content of CLSM. However, they can be used in mixtures with low fines content to reduce the water content and accelerate hardening while decreasing subsidence (ACI 1994a).
Subsidence of CLSM occurs after it has been placed. Water and air are released from the fluid CLSM, which results in settling of the solid materials. As the settling occurs, the in-place volume of CLSM decreases. Again, excess water added to increase the flowability will cause problems with the final product. This excess water will be absorbed by the surrounding soil or bleed at the surface of the CLSM. This will cause a decrease in volume and, for a pipe-filling application, will cause detrimental effects. Mixtures with low water contents will see little or no segregation or subsidence (ACI 1994a).
Additional settlement of CLSM after it has hardened has not been noted in typical applications (ACI 1994a). Conventional fill methods are plagued with the problem of settlement, and many jobs must be redone to satisfy compaction requirements. However, typical CLSM applications have been such that minimal normal loading has been applied. The void area at Marmet Locks and
Chapter 2 Background

Dam is of sufficient volume and depth that the mass of the CLSM itself could result in creep of the mass. Due to this aspect of the proposed application, measurement of creep properties of the CLSM appears warranted.
Time of setting or hardening of a CLSM is the time it takes the mixture to go from a plastic or fluid state to a hardened state with enough strength to support a person to stand on the material (ACI 1994a). Many factors affect the hardening or setting time of a CLSM:
a. Type and quantity of cementitious material.
b. Permeability and degree of saturation of surrounding soil that is in contact with the CLSM.
c. Fluidity of the CLSM.
d. Mixture proportions of the CLSM.
e. Ambient and mixture temperature.
/. Humidity.
g. Depth of fill (ACI 1994a).
The time of setting can be as short as 1 hr, but generally is 4 to 5 hr. Hardened properties of CLSM include unconfined compressive strength, density, settlement, permeability, shrinkage, and excavatability. Unconfined compressive strengths can range from 0.3 to 0.7 MPa (50 to 100 psi), simulating well-compacted soil (ACI 1994a). It may be important to determine the long-term strength of a mixture that may be excavated at a later date. As with most portland cement and fly ash concrete and grout mixtures, CLSM can continue gaining strength with age given the proper conditions, such as a moist environment. It may be important therefore to limit long-term strength so as to facilitate later excavation.
Density of CLSM depends on the constituent materials and their proportions in the mixture. The densities can range from 1,442 to 2,323 kg/m3 (90 to 145 lb/ft3).
Permeability of CLSM mimics that of silty sand soils. Typical values are in the range of 10"4 to 10"5 cm/sec (ACI 1994a). Finer constituent materials and mixtures of higher strength can achieve permeabilities as low as 3.3 x 10"6cm/sec (GAI Consultants, Inc. 1988).
Shrinkage of CLSM is very small and has been reported to be in the range of 0.02 to 0.05 percent (Naik, Ramme, and Kolbeck 1990). This small amount will not affect the performance of a CLSM. Where shrinkage cracks do occur, subsequent lifts of CLSM will fill these cracks. A high-strength CLSM mixture or even a concrete mixture could be placed as a top wearing surface where needed.
Chapter 2 Background

Excavation of CLSM, as mentioned earlier, is a important consideration on many jobs. An unconfined compressive strength of 0.3 MPa (50 psi) or less can be excavated by hand. A mechanical backhoe would be advantageous at strengths higher than 0.7 MPa (100 psi). Limiting the amount of cementitious materials in the mixture can help keep long-term strength down. Again, it is suggested that long-term strength test results be conducted to estimate the potential for later excavatability.
Chapter 2 Background

3 Previous Research
Adaska (1997) reported that the use of soil-based CLSM goes back to work reported by the U.S. Bureau of Reclamation (USBR) in 1964. Howard (1994) described this material as "soil-cement slurry." It was used for pipe bedding on 515 km (320 miles) of the Canadian River Aqueduct Project, which runs from north of Amarillo to south of Lubbock, TX (Howard 1994). Following the successful evaluation of some test sections, a soil-cement slurry was used which incorporated "local blow sand" deposits. This CLSM product was basically high-slump, low-strength concrete (Howard 1994).
As mentioned in the general discussion, CLSM is typically delivered to the job site in truck mixers. CLSM mixtures normally do not use soil as a constituent material. However, the use of the excavated soil is mentioned in ACI (1994a, Chapter 3). An example of the lack of soil as a constituent material in CLSM is Table 5.1 of the same document, which lists over 20 CLSM mixtures, none of which contains soil. The bias against using soil as a constituent is further evidenced in Section 3.7 (ACI 1994a), which warns that
...soils with clayey fines have exhibited problems with incomplete mixing, stickiness of the mixture, excess water demand, shrinkage, and variable strength. These types of soils are not usually considered for CLSM applications.
CLSM has evolved into a deliverable product by producers of ready-mixed concrete, with the materials used to produce it being ones readily available to them. These materials are usually portland cement, fly ash, fine aggregate, and water. The producer is able to maintain a quality-controlled mixture with known properties by using some of the constituent materials normally used to produce mortar. Soils can have variable properties that these producers do not want to contend with unless more assurance can be given of a technically usable and marketable product. The use of excavated materials is not widespread because of the logistics of getting the soil into the truck mixer at the job site. Many ready-mix concrete producers also do not have extra storage bins and other ancillary equipment needed to incorporate soil into the truck mixer at the batch plant. Even so, with proper selection of mixtures, proper mixture proportioning, and adequate mixing, the incorporation of soil into CLSM may be a viable option in some cases.
On large USACE projects, a concrete batching and mixing plant is usually set up onsite for the production of concrete for the project. In this situation,
Chapter 3 Previous Research

the use of the excavated soil is possible since the soil would be readily available in the same area as the concrete batching and mixing equipment.
The use of soil in CLSM mixtures has not been thoroughly investigated since the early work done by the USBR. The soil types suggested for use by the USBR for CLSM are those classified as silty sand, with the fines content not to exceed about 30 percent (Howard 1994). Fines are not defined, but it is assumed Howard is referring to the USCS (Casagrande 1948) whereby materials passing the 75-^m (No. 200) sieve are classified as "fine-grained." Howard also states that the fines used must be nonplastic, or have a low plasticity index of 3 or less. Other problems can be caused by organic impurities in the soil, which can lead to extended time-of-setting and lower ultimate strengths. However, potential problems associated with organic materials in soil could normally be detected during mixture proportioning trial batches. If problems are detected, steps can be taken to correct the problem, or if necessary, eliminate the soil from consideration.
The USBR used the soil-cement slurry on two projects, the Canadian River Aqueduct, previously described, and the McGee Creek Aqueduct located in southeast Oklahoma. The soil for the McGee project was from local sand and gravel pits and classified as SP, SP-SM, and SM. The fines contents ranged from 5 to 15 percent (Howard 1994). Both of these projects used granular materials similar to materials commonly found at ready-mix concrete batching facilities. This research will investigate, not only materials of this type or classification, but also materials that classify as ML or CL in the USCS (Casagrande 1948). The ML and CL soil materials are usually not incorporated into standard backfill and are normally relegated to a waste pile. The use of these waste materials can be of great economic and environmental benefit.
10 Chapter 3 Previous Research
4 Objectives
Hypothesis
Excavated soil that would normally be disposed of in a spoil pile may be used to produce a soil-based CLSM. This CLSM could be used to fill large volumes of space created by lock wall construction which would normally be filled with conventional compacted soil backfill. The CLSM will allow the use of the excavated materials from the construction site and other by-product materials. Materials such as soil, portland cement, Class C fly ash, Class F fly ash, and water will be combined into mixtures of flowable consistency to determine if a soil-based CLSM can be developed.
Significance
This project is significant because there is very little information on the feasibility and use of a soil-based CLSM. Previous work in this area focused on the use of sandy soils. Not enough is known about the use of a soil-based CLSM that incorporates silty and clayey soils.
The determination of whether this is a viable option can lead to future cost- saving for the USACE and others needing to fill large voids with an inexpensive, structural-fill material. By incorporating materials that are, for the most part, currently wasted into spoil piles, there is potential for reducing material costs and being more environmentally conscious.
Research Objectives
The research is intended to determine the feasibility of soil-based CLSM and whether a satisfactory strength can be obtained with some combination of Class F and Class C fly ashes, portland cement, a CL or ML soil, an SP sand- size material, and water. Mixtures will be proportioned to a flowable consistency, but will set and gain strength with time. These mixtures will be proportioned and then produced in a laboratory setting, their plastic properties will be measured, and then they will be cast into cylinder molds. The strength gain of the hardened mixtures will be measured at 7, 28, 91, and 182 days age.
Chapter 4 Objectives 11

5 Research Methodology
General Discussion of Case Study Area
The Mannet Locks and Dam are located approximately 109 km above the mouth of the Kanawha River at Mannet, WV. The location of the Marmet Locks and Dam can be seen in Figure 1. The existing structure was completed in 1934 and consists of a nonnavigable dam with twin locks, each 17.1 by 109.7 m long. The small size of the existing Marmet locks presents a significant impediment to river commerce in the form of long delays associated with breaking down large tows in order to pass them through the locks. To improve the efficiency of the locking operations, a new lock chamber (33.5 by 243.8 m long) has been proposed. The new lock chamber will be located adjacent to the existing chambers on the downstream right bank of the river (Nield 1998).
Figure 1. Location of Marmet Locks and Dam, West Virginia
12 Chapter 5 Research Methodology

After the new lock chamber has been constructed, a large void between the old and new chambers will be filled with some type of backfill material. It is proposed that this void be filled with a soil-based CLSM. This void area will be of considerable volume, with one estimate placing the volume at 200 m3 per metre length. The total volume of this void area is projected to be in the range of 61,160 m3 (80,000 yd3). This research will help project engineers decide on the possible use of a soil-based CLSM to fill the void area. This void area is labeled "200 cu m/m" on the section view of the existing and proposed lock chambers (Figure 2).
150
EXISTING IMS
OD
i i i i I i i i i I i i i i 1 i i i i I i i i i I i i I i I I J l_L
200
190
170
160
150 -100 -15 -50 -25 0 25 50 15 100
Figure 2. Section view of existing and proposed lock chambers of Marmet Locks and Dam
Geology of the Case Study Area
The existing Marmet Locks and Dam are located in the Kanawha Section of the Appalachian Plateau Physiographic Province (Nield 1998). This section is characterized by a maturely dissected, unglaciated plateau with deep, steep- sided valleys and narrow winding ridges (Krebs and Teets 1914). This landscape developed as a plateau of very little relief which was uplifted and subsequently eroded by the downcutting of streams rejuvenated by the uplift. The region has a dendritic drainage pattern with the primary river being the Kanawha. At the project site, the Kanawha River has a narrow meander belt and flows in a northwestern direction through the ancient preglacial Teays River Valley (Nield 1998). The Kanawha River flows through a moderately wide valley (760 to 900 m) with a relatively flat floodplain, at elevations of 180 to 190 m above mean sea level (Nield 1998). The valley walls rise steeply
Chapter 5 Research Methodology 13

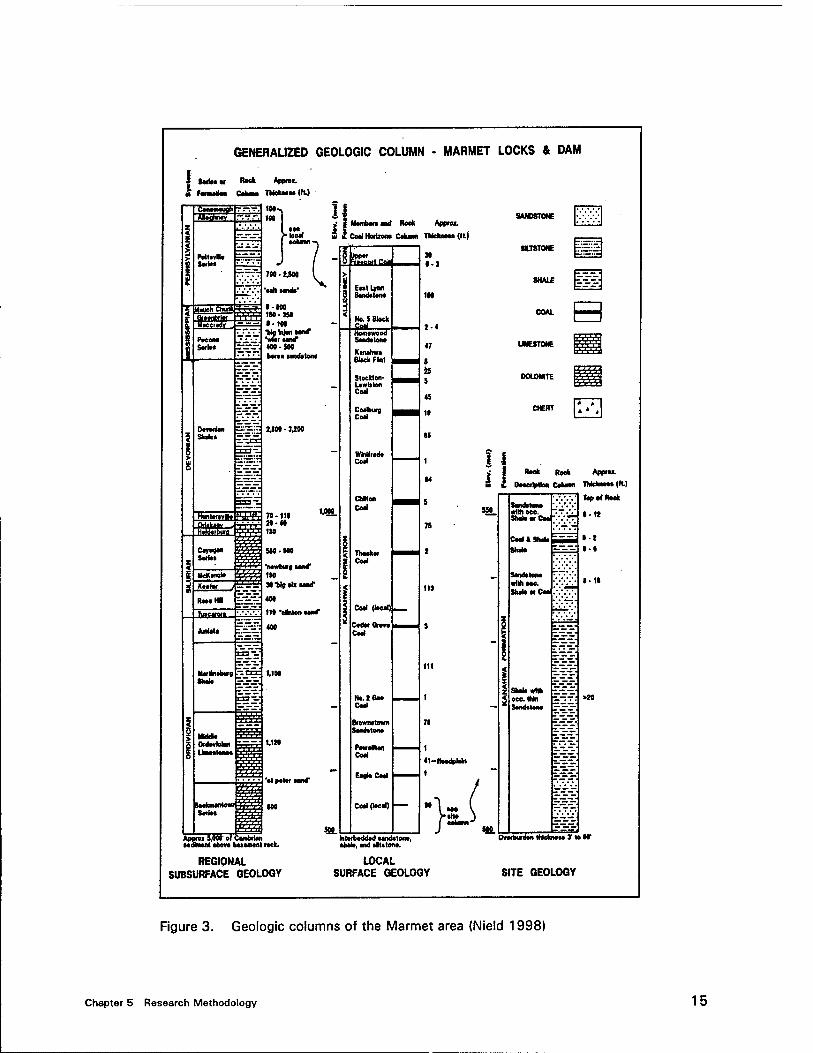
from the floodplain to the ridge crest at elevation 425 m, giving about 245 m of relief. The regional rock types (within 20 km) are sedimentary strata of Pennsylvanian Age. Sedimentation took place on a broad, subsiding basin with thick horizontal beds. The beds were alluvial sediment deposited on a low- lying floodplain in shallow fresh water, swampy, or meandering stream depositions environments with few marine transgressions (Krebs and Teets 1914). Sediments deposited in these environments are subject to lithologic variation due to cut and fill caused by meandering streams. These conditions lead to sediments that are lithified into rocks which display either gradational or abrupt changes in both horizontal and vertical directions. The regional bedrock in descending geologic order consists of the Conemaugh, Allegheny, and Pottsville Groups. Figure 3 is a Geologic Column showing regional, local, and site geology of the Mannet area.
The Conemaugh Group is the youngest division in the region and is located primarily north of the project. The Conemaugh has a regional thickness of approximately 180 m and is defined with its upper boundary placed at the base of the Pittsburgh Coal and the lower boundary placed at the top of the Upper Freeport Coal (Doll, Wilmouth, and Whetstone 1960). The Conemaugh Group consists of an upper portion containing a mixture of sandstone and shale, a middle portion consisting of fine-grained sandstone and shales, and a lower portion consisting mainly of massive sandstones (Krebs and Teets 1914).
The Allegheny Formation has a local thickness of approximately 45 m and is placed between the top of the Upper Freeport Coal and the top of the Homewood Sandstone (Doll, Wilmouth, and Whetstone 1960). This formation is located throughout the region. The Allegheny consists of two or three rather thick sandstones, separated by thin shales and claystones (Krebs and Teets 1914). The Pottsville Group has a variable thickness throughout the region, ranging from 210 m in the north to at least 760 m in the south (Doll, Wilmouth, and Whetstone 1960). The Pottsville is the basal division of the Pennsylvanian System and includes all beds from the top of the Homewood Sandstone to the unconformity between the Pennsylvanian and the Mississippian Systems. The Pottsville is exposed in the mid- to southeastern portions of the region. The Pottsville Group is divided into three major formations which are, in descending geologic order, the Kanawha, the New River, and the Pocahontas formations (Krebs and Teets 1914). The Kanawha Formation of the Pottsville Group is the prominent rock formation in the Marmet project area (Nield 1998). It consists mainly of thick, crossbedded sandstones, which alternate with thinner sandy shales, thin coal beds, the Kanawha Black Flint, and a few thin marine sediments. Most of the sandstone beds are fining upward with a thin conglomerate layer at the base, occasional coal lenses, and a sharp lower contact against the underlying claystones or shales. The shales are mostly purple and dark gray in color, with the coals tending to be thin and shaly (Krebs and Teets 1914). A surface geology map of Kanawha County is shown as Figure 4.
Overburden at the site ranges in thickness from approximately 12 to 18 m (Nield 1998). The top of rock surface at the site lies at approximate elevation 168.5 m, with only slight variations of 1 m or less. The bedrock at the
14 Chapter 5 Research Methodology
GENERALIZED GEOLOGIC COLUMN - MARMET LOCKS & DAM
| MH« Rock Approi.
jt fOMMllin Cohan THclUHM(fL)
Conomougn T.—. AloflhrWY
Pott»«* MM
yöcc~»av
PoCOfM JJ.IS Mo« —--.
Shdei —-Tf
5iES HTJ&W
Coymo« Sorter
MeKorulo Hooter 7
iUSMSU_
Ami UMT of Carobrlori wttwwnl ob»
Y'i'iV
'I'l'l'l'
IN
Vlood »• I Mombon and Rook AM»«.
3 I Coti Horizon» Cobran TMcknn« (It)
7M-UM V
I-WO 190. 3» i-IM ttalnJunMiMr "wter oond* 4M-M0 boroo «ondotono
UM-UM
n-iii H-M HO
MO-NO
"nowburf lono" IN N-MotlxuM*
1.10*
5S8.
rto>or ttlDt ■«part Cna
tlym datona
No. S Block
far Kmatnvl Block Flnl
Slockton- Lowlston Cod
Codbura. Cod
WMfrod* Cod
Chiton Cod
Thook« Cod
Cod (loul)_
CodorGrovo Cod
HO.IOM Cod
Brownotowii Sondotono
Cod
EogkCod
CodOocd)
N 0-)
IN
z-4
I obovo bMcroont rock.
REGIONAL SUBSURFACE GEOLOGY
fcitartwddad Mndtlon«, •hat«, and altstona.
LOCAL SURFACE GEOLOGY
'}
SANDSTONE
•JJSTONE
e UMESTDNE
CHERT * *'t
w.
Roek Rook Appro*
DoooripUoa Cohran IMckmo (M.)
top 0« Nook
7.ÜJ • • n «HHii Sholo or Coo '-'
Sondotono «rithooo. Skdo or Cool'V
Mn --.-?: >»
It II
I»
Ovorburdon tnidmooo * to IT
SITE GEOLOGY
Figure 3. Geologic columns of the Marmet area {Nield 1998)
Chapter 5 Research Methodology 15

EXPLANATION
hUiii ] < s «= L»u.uviu« J ,[ 5
OUNKARD SEItlCS
■MtlOIISAHEU SERIES
C0MEM4USH SERIES
»UEtHENY SERICS
CD ronsvu-LE SCRIES
letn 0 iUJn t_l_l L_l I
GEOLOGIC MAP OF KANAWHA COUNTY, WEST VIRGINIA AfeNtd ttm Gtoiogie Mo ef
Bui vtfo<«to(Stqtt.19321
Figure 4. Geologic map of Kanawha County, West Virginia (Doll, Wilmoth, and Whetstone 1960)
16 Chapter 5 Research Methodology

project site consists of sedimentary rocks of the Pennsylvanian-aged Kanawha Formation within the Pottsville Group, and includes a thick sandstone member, a shale member, and an interbedded member of shale and sandstone (Nield 1998).
Site investigations have been performed at the Marmet project site in preparation of the Feature Design Memorandum on Geology and Foundations. This site investigation included a subsurface exploration program of more than 154 borings, including over 1,500 lin m of 51-mm-diam split-spoon sampling and 40 m of 127-mm-diam fixed-piston sampling of the in situ soils. Rock- core drilling was also performed on the bedrock. These samples were logged and tested for gradation, Atterberg Limits, moisture content, and specific gravity (Nield 1998).
Materials Used to Produce a Soil-Based Controlled Low-Strength Material
The materials used to produce the soil-based CLSM were some combination of the following:
Portland cement Class F fly ash Class C fly ash CL or ML soil SP-sand Water
Portland cement is the common cementing medium used to produce concrete. It is a hydraulic cement produced by pulverizing clinker consisting of hydraulic calcium silicates, and usually contains one or more of the forms of calcium sulfate as an interground addition (ACI1992). Portland cement clinker is derived from the high-temperature calcination to incipient fusion of carefully controlled amounts of calcium carbonate (usually limestone), siliceous, and aluminous materials. Because portland cement is a cementitious material, it can impart great strength to a concrete or CLSM mixture. A minimum amount of portland cement will be used in the experimental CLSM mixtures in an effort to minimize long-term strength gain. Portland cement is also the most expensive component material used in this research to produce the CLSM mixtures. Because of the nature of the CLSM, very small amounts of portland cement are used in relation to fly ash amounts and the other constituent materials.
Fly ash is a by-product of the burning of pulverized coal or lignite in electric-power plants. During combustion of powdered coal, the coal passes through the high-temperature zone in the furnace where the carbon is burned off. Mineral impurities, such as clay, quartz, and feldspar, will melt at the high temperature. The liquid matter is quickly transported to lower- temperature zones, where it solidifies as spherical particles of glass. Some of this material agglomerates and forms bottom ash, but most of it is transported
Chapter 5 Research Methodology 1 7
out with the flue gas stream and is called fly ash. The fly ash is collected in electrostatic precipitators or by mechanical collectors as fine particles.
Fly ashes are divided into two categories in ASTM 618 (ASTM 1998d) based on differences in composition. The two categories are Class F and Class C. Class F fly ashes are usually derived from the burning of anthracite or bituminous coals. They generally contain less than 10 percent CaO by chemical analysis, and they contain a greater combination of silica, alumina, and iron than do Class C fly ashes. The Class F fly ashes, due to the high proportions of silica and alumina, consist principally of aluminosilicate glasses.
Class C fly ash is usually derived from the burning of lignite or sub- bituminous coals and generally contains 15 to 35 percent CaO by chemical analysis. The Class C fly ashes are generally more reactive than the Class F fly ashes because they contain most of the calcium in the form of reactive compounds. There is also evidence that the principal constituent, the noncrystalline phase, contains enough calcium ions to enhance the reactivity of the aluminosilicate glass. Because of this high reactivity, Class C fly ashes often react directly with water to form cementitious phases.
As an example of how a soil-based CLSM can be used in the field, the current excavation plan at the Marmet Locks and Dam is to selectively store the excavated material as it is removed from the construction site. The SM, SP, GM, and other granular materials will be incorporated into standard structural backfill where possible. The lack of a sufficient volume of granular material to fill the large void would require additional fill material to be brought in by barge. To reduce transportation costs and effort, it is proposed to incorporate the otherwise unused ML and CL material either alone or in combination with the granular material in a CLSM.
Samples of soil from the proposed construction site at the Marmet Locks and Dam were not available to produce a soil-based CLSM as an example for the case study area. Therefore, a loess soil from the Vicksburg, MS, area was used to produce a soil-based CLSM mixture. An SP sand-size material was also used to produce a CLSM mixture, and this SP material was then combined with the loess soil to produce a soil and sand combination CLSM.
Proposed Mixture Proportion Matrix and Test Methods
A test matrix of mixture proportions was developed, and mixtures of these proportions were produced using a laboratory mixer. A control mixture was proportioned using portland cement, Class F fly ash, and water. The first change in the control mixture was to vary the amount of portland cement. The mixture scenario was to substitute Class C fly ash for the portland cement in amounts of 10, 20, 40, 60, and 80 percent replacement by mass.
The next three scenarios of mixtures replaced ASTM Class F fly ash with varying amounts of the soil; the next scenario, with varying amounts of sand; and the last class, with varying amounts of a soil and sand combination. The amounts
1 8 Chapter 5 Research Methodology

of replacement of each of these three scenarios was 10, 20, 40, 60, and 80 percent of the ASTM Class F fly ash by mass. The CLSM mixture proportion matrix is shown in Table 1.
Table 1 CLSM Mixture Proportion Matrix
Mixture Class
ASTM Type I Cement
ASTM Class F Fly Ash
ASTM Class C Fly Ash Soil Sand
Soil & Sand Combination Water
Baseline X X X
Increased Portland cement
X X X
Decreased Portland cement
X X X
Class C replacing Portland cement
X X X X
Soil replacing Class F fly ash
X X X X
Sand replacing Class F fly ash
X X X X
Soil/sand combination replacing Class F fly ash
X X X X
After mixing, the unhardened CLSM mixtures were sampled and tested in accordance with applicable ASTM Standards as follows: D 6103, D 6023, D 5971, and C 1064 (ASTM 1998f-i).
Twelve cylinders, 76 by 152 mm (3 by 6 in.), were molded from each batch of CLSM. These cylinders were covered and stored under laboratory ambient conditions until the test date. On each test date, three specimens were demolded from each mixture, the ends shaved with a diamond-blade circular saw, and the cylinder measured for final height after sawing. The cylinders of CLSM were tested for uniaxial unconfmed compressive strength at 7, 28, 91, and 182 days age.
Chapter 5 Research Methodology 19

6 Research Program
Materials Used to Produce the Soil-Based CLSM Mixtures
Materials used to produce the CLSM mixtures were obtained from several sources. These materials are described below. The numbers in parentheses are Concrete and Materials Division (USACE) identification numbers assigned to ensure traceability.
The portland cement (980158) conformed to requirements for ASTM C 150, Type I (ASTM 1998b). The cement was manufactured by the Blue CircleCement Company, Calera, AL. Chemical and physical properties of the cement and detailed test data are given in Appendix A. A summary is provided as Table 2. This cement was purchased in sacks from the Mississippi Materials Company, Vicksburg office.
Two fly ashes were used. The first, supplied by JTM Industries, met the requirements of ASTM C 618, Class F (980221) (ASTM 1998d). This Class F fly ash was produced at the John E. Amos Power Plant, which is owned by American Electric Power and is located near St. Albans, WV. This 2,900-MW power plant produces between 350,000 and 400,000 metric tons of fly ash each year. Only about 10 to 15 percent of this fly ash is currently being used in concrete or other cement-based mixtures. The majority of the fly ash is placed as engineered backfill at a disposal site owned by the power producer. Chemical and physical properties of the Class F fly ash are given in Appendix A, with a summary provided as Table 3.
The other fly ash (980220) met the ASTM C 618 (ASTM 1998d) requirements for Class C fly ash and was supplied by the Wisconsin Electric Power Company. This fly ash was produced at the Pleasant Prairie Power Plant near Kenosha, WI. Results of chemical and physical analysis of the Class C fly ash are given in Appendix A and summarized in Table 4.
Soil from the case study area was not available. A loess soil (980225) from the Vicksburg, MS, area was used as a substitute. Loess is described as a well-sorted, porous, slightly indurated, eolian silt (Krinitzsky and Turnbull 1967). Approximately 1 metric ton of the loess was dug with a front-end loader from an area located on WES property. The soil sample was classified
20 Chapter 6 Research Program

Table 2 Chemical and Physical Analysis Results of the Type 1 Portland Cement
Chemical Analysis, %
ASTM C 150 Spec Limits Type 1 (ASTM 1998b)
Si02
Al203
Fe203
CaO MgO S03
Loss on ignition Insoluble residue Na20 K20 Alkalies-total as Na20 Ti02
P2O6 C3A c3s C2S C4AF
21.1 4.6 3.0
62.3 2.2 2.6 1.7 0.2 0.04 0.69 0.49
7 50 22
9
6.0 max 3.0 max 3.0 max 0.75 max
Physical Tests Results
ASTM C 150 Spec Limits Type I
Surface area, m2/kg (air permeability) Autoclave expansion, % Initial set, min (Gillmore) Final set, min (Gillmore) Air content, % Compressive strength, 3-day, psi Compressive strength, 7-day, psi
373 0.01
145 330
6 3,660 4,500
280 min 0.80 max
60 min 600 max
12 max 1,740 min 2,760 min
Table 3 Chemical and Physical Analysis Results of the ASTM Class F Fly Ash from the John E. Amos Power Plant, St. Albans, WV
Chemical Analysis, %
ASTM C618 Spec Limits Class F (ASTM 1998d)
Si02 AI2C-3
Fe203
Sum CaO MgO S03
Moisture content Loss on ignition Available alkalies (28-day)
50.2 24.9
3.8 78.9
1.0 0.8 0.2 0.1 0.6 0.55
70.0 min
5.0 max 3.0 max 6.0 max
Physical Tests Results
ASTM C618 Spec Limits Class F
Fineness, % retained on 45-A<m sieve Water requirement, % Density, mg/m3
Autoclave expansion, % Strength activity index w/cement, 7-day, % Strength activity index w/cement, 28-day, %
27 99
2.20 -0.02
76 80
34 max 105 max
0.8 max 75 min 75 min
Chapter 6 Research Program 21

Table 4 Chemical and Physical Analysis Results of the ASTM Class C Fly Ash from the Pleasant Prairie Power Plant, Kenosha, Wl
ASTM C618 Spec Limits
Chemical Analysis,% Class C
Si02 34.5 -
Al203 18.7 -
Fe203 6.2 —
Sum 59.5 50.0 min
CaO 34.0 -
MgO 4.7 -
S03 2.4 5.0 max
Moisture content 0.2 3.0 max
Loss on ignition 0.3 6.0 max
Available alkalies (28-day) 0.99 —
ASTM C 618 Spec Limits
Physical Tests Class C
Fineness, % retained on 45-^m sieve 16 34 max
Water requirement, % 94 105 max
Density, mg/m3 2.58 — Autoclave expansion, % 0.05 0.8 max
Strength activity index w/cement, 7-day, % 98 75 min
Strength activity index w/cement, 28-day, % 97 75 min
as a clayey silt or ML with 99.9 percent of the soil passing the 75-^m (No. 200) sieve. The liquid limit of this soil was 33, the plastic limit was 26, and the plasticity index was 7.
The other material used to produce the CLSM mixtures was a nonplastic natural sand (970547) from a sand and gravel pit located in the loess-belt gravels in Mississippi. This was a silica sand that is excavated, washed, and screened for use in the production of concrete. However, this material does not meet ASTM C 33 requirements for use as a concrete sand. The grading curve of this sand is shown in Figure 5. This material classified as a sand or SP material and had a specific gravity of 2.70.
Equipment and Methodology
The mass of all component materials used to produce the CLSM mixtures was measured using a Fairbanks Morse, Model 42-2072-BD, 175-lb (79-kg)-capacity scale that measures to 0.1 lb (45 g).
The mixer used to mix each CLSM mixture was a Hobart Model H-600 floor mixer with a capacity of 0.0283 m3 (1.0 ft3). A wire-whip was used to mix Mixture Nos. 0 through 5. A flat-paddle mixing blade was used on all other mixtures.
22 Chapter 6 Research Program

iHOBM AS y3SiWO0 IfGDiGd
8 8 S 8 8 I? 8 S
~
9 -t o _ o i 0 «s -
5- S o - * M -
IS _
0 i /
H D -
V /
10 - / •
* - / / n - /
«I» F
t.
n -
* -
to -
5 2 V)
d
o to
2
d 2
S
01
2
s a
L <
CD
3
o OD 8 ? 8
IH0I3M AB fflNli iN30M3d
o 10
a. z
UJ
I or
1 o
CO 0)
en
L. 3
.Q CO
Ü
> E o
c CO to
09 > 3 Ü O) C
TJ CO k-
O
in
3 O)
Chapter 6 Research Program 23

All unhardened tests made on the CLSM mixtures yielded results that conformed to the applicable ASTM test procedures listed in Chapter 5 of this report. The methodology and equipment used to perform each test are described in these procedures.
The uniaxial unconfined compressive strength specimens were tested on a Tinius-Olsen universal testing machine. This testing machine measures in pounds-force. Ultimate stress is then determined by dividing the ultimate load required to fail the 76- by 152-mm (3- by 6-in.) specimen by the average cross- sectional area of the specimen.
Over 30 CLSM mixtures were proportioned and mixed in the Hobart mixer. After the mass of all dry materials and the water had been determined and batched, the water was put into the mixing bowl of the mixer. The mixer was turned on at a slow rate of speed (gear 1), and the dry materials were added to the bowl. After all dry materials were in the bowl, the mixing speed was increased (gear 2) and the mixture was mixed for 3 min. After this 3 min of mixing, the mixer was stopped and a sample was taken for the flow consistency test, ASTM D 6103 (ASTM 1998i). After the flow test, the tests for unit weight and yield, ASTM D 6023 (ASTM 1998h), were completed. Last, the air content of each mixture was determined using a Type-B Meter as outlined by ASTM C 231 (ASTM 1998c).
After the unhardened tests had been completed, the CLSM material not used in the air content measurements was cast into the 76- by 152-mm (3- by 6-in.) cylindrical specimen molds. Twelve cylinders were cast from each batch of CLSM. After casting, these cylinders were covered with tight-fitting lids and placed on shelves for storage. All of these cylinders were cured on shelves at laboratory-ambient conditions until time of strength testing. The strength of these cylinders of CLSM was determined at 7, 28, 91, and 182 days age. Three cylinders of CLSM were tested at each test date for each batch. At each test date, three cylinders were retrieved from the group being measured that day, the ends of the cylinders were cut smooth with a diamond- blade table saw, and they were then tested for unconfined compressive strength.
Mixture Proportioning
The CLSM mixtures were all proportioned by modifying a control mixture. The control mixture was developed from a generic fly ash-based CLSM mixture which, in a 0.7645-m3 (1.0-cu yd) batch, uses 907 kg (2,000 lb) of fly ash, 34 kg (75 lb) of portland cement, and 454 kg (1,000 lb) of water. From this generic mixture, a trial batch was produced having an approximate volume of 0.017 m3 (0.6 ft3). This first mixture used 18.1 kg (40 lb) of fly ash, 0.7 kg (1.5 lb) of portland cement, and 9.1 kg (20 lb) of water. The goal was to produce a CLSM mixture that had a flow measurement of 30 to 38 cm (12 to 15 in.) in diameter when tested in accordance with ASTM D 6103 (ASTM 1998i). Preliminary Mixture Nos. 0 through 4 were used to develop this control mixture. Each was discarded because of failure to meet flow requirements. Mixture Nos. 5 and 6 became the control mixtures by meeting
24 Chapter 6 Research Program

the flow requirements. They both had the same mixture proportions. These were the first mixtures cast into cylinder molds for later-date strength testing. The mixture proportions for Mixture Nos. 5/6 through 30 are given in Table 5. Referring to Table 1, six different classes of mixtures were examined. While batch volumes were not held constant as mixture constituents were varied, batch sizes generally ranged from approximately 0.14 to 0.17 m3 (0.5 to 0.6 ft3). Appendix B lists the batch weight for each mixture proportion on a 1-yd3 basis.
Table 5 CLSM Mixture Proportions
Mixture Number
Water, lb
Cement, lb
Class F Fly Ash. lb
Class C Fly Ash, lb
Loess Soil. lb
Sand, lb
Water-Cement + Fly Ash Ratio w/(c + m)
5/6 17.2 1.5 40 0 0 0 11.47 0.41
7 17.2 1 40 0 0 0 17.20 0.42
8 17.2 2 40 0 0 0 8.60 0.41
9 17.2 1.35 40 0.165 0 0 12.74 0.41
10 17.2 1.2 40 0.33 0 0 14.33 0.41
11 17.2 0.9 40 0.66 0 0 19.11 0.41
12 17.2 0.6 40 0.99 0 0 28.67 0.41
13 17.2 0.3 40 1.32 0 0 57.33 0.41
14 18.6 1.5 36 0 4 0 12.40 0.50
15 20 1.5 32 0 8 0 13.33 0.60
16 20 1.5 24 0 16 0 13.33 0.78
17 21 1.5 16 0 24 0 14.00 1.20
18 21 1.5 8 0 32 0 14.00 2.21
19 17.2 1.5 36 0 0 4 11.47 0.46
20 15.2 1.5 32 0 0 8 10.13 0.45
21 15.4 1.5 36 0 0 8 10.27 0.41
22 15.4 1.5 32 0 0 16 10.27 0.46
23 14.2 1.5 28 0 0 24 9.47 0.48
24 12.9 1.5 24 0 0 32 8.60 0.51
25 12.2 1.5 20 0 0 40 8.13 0.57
26 17.2 1-5 36 0 2 2 11.47 0.46
27 18.2 1.5 32 0 4 4 12.13 0.54
28 16.2 1.5 24 0 8 8 10.80 0.64
29 15.2 1.5 16
■
0 12 12 10.13 0.87
30 14.2 1.5 0 16 16 9.47 1.50
NOTE: A table of factors for converting nor page vi.
l-SI units o r measure ment to £ >l units is presented on
Chapter 6 Research Program 25

Mixture No. 6 was the control mixture and was a repeat of Mixture No. 5. However, for Mixture No. 6, the flat-paddle mixer blade was used instead of the whip-type mixer blade. All mixtures made after Mixture No. 6 used the flat-paddle mixer blade. Mixture Nos. 7 and 8 increased and decreased the porüand cement content, respectively. Mixture Nos. 9 through 13 increased the Class C fly ash content and decreased the portland cement content. The water and Class F fly ash contents were held constant for Mixture Nos. 5 through 13.
The next three sets of mixtures kept the portland cement content constant. The Class F fly ash was removed from the mixtures and replaced with loess, sand, or a 50/50 loess soil and sand combination. Mixture Nos. 14 through 18 replaced the Class F fly ash with loess soil. Mixture Nos. 19 through 25 replaced the Class F fly ash with sand. Mixture Nos. 26 through 30 replaced the Class F fly ash with a loess soil and sand combination.
After mixing, the CLSM was sampled for unhardened properties tests. These tests were performed on each mixture as soon as mixing was completed. The flow consistency test was run first, followed by the temperature, unit weight, and air content tests. The CLSM was then cast into cylinder molds and stored.
26 Chapter 6 Research Program

7 Results
The results of the unhardened tests are given in Table 6. These tests were all carried out in accordance with the ASTM Standards, as noted in Chapter 2. The equipment and methodology used to make these measurements are described in Chapter 5. As described earlier, cylinders of the CLSM were cast and measured for unconfmed compressive strength at later test dates. The results of these tests are tabulated in Appendix C. The following discussion and plots summarize the data. The data that are plotted in the summary figures represent the average of three test cylinders for each mixture at each test date.
Table 6 Unhardened CLSM Test Results
Mixture Number
Temperature, °F
Flow Consistency
Unit Weight lb/ft3
Air Content %
Yield ft3
1st Measure in.
2nd Measure in. Air Water CLSM
6 73.4 68.6 71.6 11 % 11% 100.7 1.7 0.583 7 72.8 68.4 71.2 11% 12% 99.9 1.8 0.583 8 72.9 68.7 71.2 11.0 11.0 101.1 1.7 0.586
9 72.2 __ „ n% 11% 100.3 1.9 0.585 10 72.9 68.9 73.5 11% 11% 100.3 1.7 0.586 11 72.3 68.5 72.1 1314 12% 100.3 1.65 0.586 12 67.5 65.4 67.8 13.0 13% 100.3 1.55 0.586 13 71.6 65.8 70.5 13% 14.0 99.9 1.7 0.589
14 70.7 67.3 68.9 12.0 12% 98.2 1.45 0.612 15 64.3 68.3 66.2 14)4 13% 94.6 1.2 0.650 16 69.1 70.5 65.6 15.0 14% 96.2 1.0 0.639 17 69.4 70.1 65.6 14/4 14.0 95.8 1.8 0.654 18 73.4 66.8 68.9 13% 13.0 100.3 0.6 0.623
19 72.2 64.6 68.5 15% 16.0 100.3 0.3 0.585 20 72.2 64.6 67 15.0 15% 103.7 1.2 0.547 21 71.4 70.0 70.4 12.0 12.0 105.5 1.25 0.577 22 66.6 68.2 68.5 13% 13)4 109.2 0.9 0.594 23 71.5 68.3 70.3 13)4 12% 114.2 1.0 0.593 24 70.5 66.7 70.0 n% 12.0 119.3 0.75 0.590 25 70.1 69.6 68.5 12.0 12.0 124.1 0.7 0.594
26 75.1 66.4 69.5 11.0 11% 101.3 1.3 0.579 27 72.7 66.9 66.8 > 16.0 > 16.0 99.1 0.9 0.602 28 72.5 66.9 69.5 i2y4 12% 103.1 0.9 0.560 29 76.1 65.8 68.6 12)4 12% 105.1 0.65 0.539 30 73.0 71.0 72.0 13.0 12% 107.7 0.65 0.517
Chapter 7 Results 27

The first plot (Figure 6) summarizes the average of unconfined compressive strengths for Mixture Nos. 6 through 8. The resulting plots of the averaged strength data from Mixture Nos. 6, 7, and 8 indicate that, with a decrease in Portland cement, the strength decreases at all ages. Conversely, with an increase in portland cement, the strength increases. The water content remained at the same level for these three mixtures; therefore, the change in Portland cement content effectively raised and then lowered the water-cement ratio (w/c) of the CLSM. These results follow what one expects when either increasing (Mixture No. 7) or decreasing (Mixture No. 8) the w/c of a cementitious mixture. This demonstrates that, with a small decrease or increase of the portland cement in a CLSM mixture, one can see changes in the strength, because of changes in the water-cement ratio.
140 T
120
100 -
oi c
v> >
Q. E o o •a x e is c o u e 3
80 --
60
40
20
»Mixture 6 Control Mixture
- Mixture7 Decreased Cement
-Mixture 8 hcreased Cement
28 56 84 112
Age in Days
140 168 196
Figure 6. Averaged strength data for mixtures 6, 7, and 8
Another question could be posed regarding the contribution to strength from the fly ash. When used in ordinary concretes, fly ash reacts with calcium ions liberated during hydration of portland cement to produce additional strength in the hardened concrete. Because of this reaction, when fly ash is used, the water-cementitious materials ratio is expressed as w/(c+m), where "m" denotes the fly ash. However, due to the small quantity of portland cement in relation to the fly ash, it is unclear whether any significant pozzolanic reaction of the
28 Chapter 7 Results

fly ash will occur. Indeed, the significant changes in compressive strength (49-percent change for Mixture No. 7 at 91 days age and 43-percent increase for Mixture No. 8 at 91 days age) would appear to be better described by the w/c than the w/(c+m) (Table 5), which was only slightly changed.
The average unconfined compressive strengths for Mixture Nos. 9 through 13 are plotted in Figure 7. In these mixtures, portland cement was replaced with Class C fly ash in the indicated percentages, effectively raising the w/c even though the w/(c+m) remained constant. The plots indicate the compressive strength decreased as the portland cement was replaced with Class C fly ash. The control mixture (No. 6) is plotted with fliese data for comparison. The strengths of all five mixtures in this class are lower than that of the control mixture. This would be expected since the strength contribution of Class C fly ash is not as great as that of portland cement and the w/c was increased. Water content for Mixtures 9 through 13 was the same.
80
70
60
| 50
> 40 -■
a. E o ü
30
5 20
10 - -*-
»Mixture 6 Control Mixture -Mixture 9 10% Class C Fly Ash -Mixture 10 20% Class C Fly Ash -Mixture 11 40% Class C Fly Ash -Mixture 12 60% Class C Fly Ash -Mixture 13 80% Class C Fly Ash
-+- -t-
28 56 84 112
Age in Days
140 168 196
Figure 7. Averaged strength data for CLSM mixtures with Class C fly ash replacing portland cement
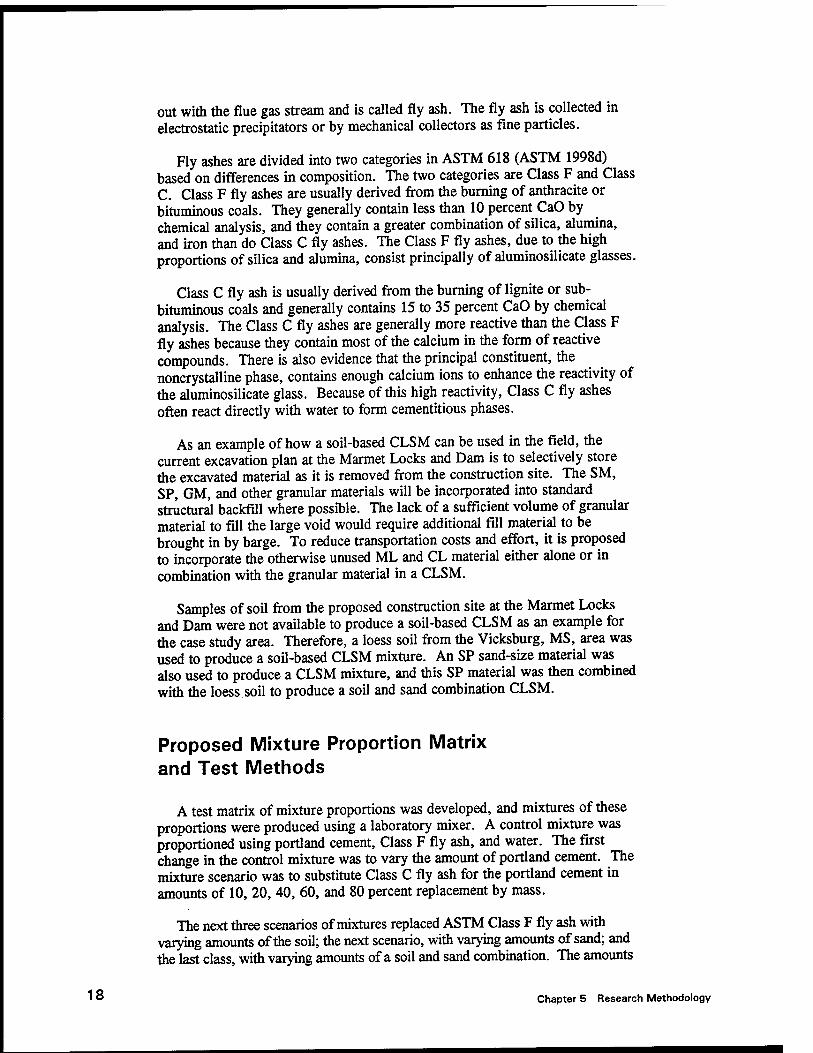
Figure 8 is a plot of the average compressive strength data of the CLSM mixtures with the loess soil replacing the Class F fly ash. The strength of each of these mixtures was less than that of the control mixture. The portland cement content was held at 1.5 lb (0.7 kg) for each mixture. However, it was
Chapter 7 Results 29
80 T
70
60
g 50
40 - a. E o o "8 30 -
c o o
■5 20
10 -
Mixture 6, Control Mixture Mixture 14 10% Loess
Mixture 15 20% Loess
Mixture 16 40% Loess
Mixture 17 60% Loess
Mixture 18 80% Loess
H
28 56 84 112
Age in Days
140 168 196
Figure 8. Averaged strength data for CLSM mixtures with loess soil replacing Class F fly ash
necessary to increase the water content for each of these mixtures to maintain a flow consistency equal to or greater than that of the control mixture due to the increased surface area imparted by the loess particles. Therefore, by increasing the water content, the w/c was increased somewhat. This increase in the w/c would be expected to result in a decrease in compressive strength, although not to the degree indicated in these mixtures. Another contributor to the decrease in strength could be the decrease of Class F fly ash and the increase of loess soil. Since the Class F fly ash is pozzolanic, it is expected that some contribution to strength development results from its presence, even though that contribution appears to be small. Therefore, the strength contribution by the Class F fly ash is decreased when the fly ash amount is decreased. The loess does not appear to contribute any cementitious or pozzolanic strength properties to the mixtures. Referring to the strength trends and the w/c, the soil actually contributes to a decrease in compressive strength with increasing soil amounts.
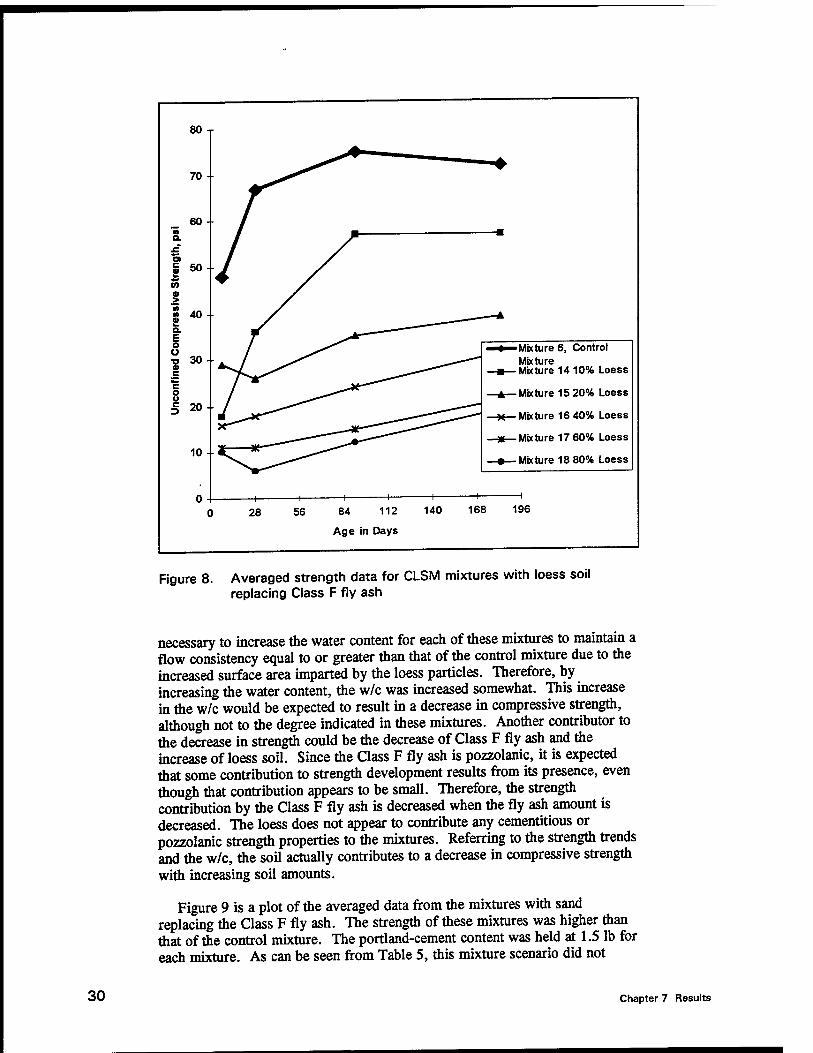
Figure 9 is a plot of the averaged data from the mixtures with sand replacing the Class F fly ash. The strength of these mixtures was higher than that of the control mixture. The portland-cement content was held at 1.5 lb for each mixture. As can be seen from Table 5, this mixture scenario did not
30 Chapter 7 Results

200
180 -
160 -•
x 140 4- c
S 120 +
a E o ü 1 c IC c o u
100 --
80
60 --
40 -
20 -•
•"»Mixture 6, Control Mixture «—Mixture 19 10% Sand *—Mixture 20 20% Sand *—Mixture 21 18% Sand X—Mixture 22 33.3% Sand •—Mixture 23 46% Sand H—Mixture 24 57% Sand — Mixture 25 67% Sand
-+- 28 56 84 112
Age in Days
140 168 196
Figure 9. Averaged strength data for CLSM mixtures with sand replacing Class F fly ash
replace the Class F fly ash pound-for-pound, as was the case for the loess soil mixtures and the loess and sand combination mixtures. The mixture proportions for this mixture scenario resulted in replacement amounts of 10, 18, 33.3, 46, 57, and 67 percent. It was necessary to decrease the water content for each of these mixtures to maintain the flow consistency equal to or greater than the control mixture due to the decreased surface area imparted by the larger sand particles. The sand particles would have segregated to the bottom of the mixing bowl if the water contents had not been decreased. Therefore, by decreasing the water content, the w/c was decreased. This decrease in w/c would be expected to result in an increase in compressive strength, although not to the degree indicated in these mixtures. For example, Mixture Nos. 8 and 24 have the same w/c (8.60) yet Mixture No. 24 is 54 percent stronger at 91-days age. The data suggest that inclusion of the rigid sand particles in the CLSM increases compressive strength.
Figure 10 plots the averaged data of the unconfined compressive strength of Mixture Nos. 26 through 30. These mixtures were made with a combination of loess soil and sand replacing Class F fly ash.
The portland cement amount was held at 1.5 lb for each mixture. Except for Mixture No. 27, it was necessary to decrease the water content for each of these mixtures to maintain the flow consistency equal to or greater than the control mixture. All of these mixtures were lower in strength than the control mixture.
Chapter 7 Results 31
80 T
70 -
60-
« a.
g 50
W at >
E o ü -a at
e o u e
30 -
20 -
10 -
• Mature 6, Control Mbcture -Mbcture 26 10% Loess & Sand
-A— Mbcture 27 20% Loess & Sand -X— Mbcture 28 40% Loess & Sand -*— Mature 29 60% Loess & Sand -•— Mbcture 30 80% Loess & Sand
28 56 84 112
Age in Days
140 168 196
Figure 10. Averaged strength data for CLSM mixtures with loess and sand combination replacing Class F fly ash
Comparing these mixtures with Nos. 14 through 18, it would appear that the somewhat lower w/c, together with the inclusion of sand, resulted in modest compressive strengths. However, the loess appears to be a strong influence in decreasing the strength.
32 Chapter 7 Results

8 Summary and Conclusions
Unhardened Property Test Results
The flow consistency results from Table 6 indicate that it is possible to produce CLSM mixtures that are fluid enough for placement. All of the mixtures were equal to or exceeded the control mixture (Mixture No. 6) in flow consistency.
However, many of the mixtures exhibited some segregation of the solid particles in the bottom of the mixing bowl after the mixing was stopped. This is an undesirable characteristic, and future work on these mixtures would include modification to prevent this segregation. Mixture Nos. 10, 13, 14, 19, 20, 22, 23, 27, and 28 were noted to have this segregation problem. Most of the segregation was noted as being slight to moderate, and minor mixture proportion adjustments could remedy this problem. One solution to reduce segregation of the solid particles would be to lower the water content of the mixtures. However, lowering the water content could decrease the flow consistency of the mixtures. It will also decrease the w/c, therefore causing the strength of the mixtures to increase.
Strength Test Results on Hardened Specimens
All of the CLSM mixtures exhibited a gain in unconfmed compressive strength with age.
As discussed in Chapter 5, the strength results of Mixture Nos. 6, 7, and 8 indicate that the w/c has a greater influence on the strength of the CLSM mixtures than the w/(c+m).
Mixture Nos. 9 through 13 had constant water contents but essentially an increasing w/c with the removal of the portland cement. The w/(c+m) remained constant. The resulting strengths of these mixtures decreased with decreased portland cement content. The data from the first eight mixtures suggest that the w/c is controlling the strength of the mixtures.
In Mixture Nos. 14 through 18, the loess replaced the ASTM Class F fly ash. Again, the w/c was increased above that of the control mixture.
Chapter 8 Summary and Conclusions 33

However, even with the w/c being the same for Mixture Nos. 15 and 16, and for Mixture Nos. 17 and 18, there was a continual decrease in strength. This decrease in strength is due to the increase of the loess content. In the future, to increase the strengths of mixtures containing soil, it may be necessary to increase the portland cement content. However, the loess mixtures did gain strength with time, indicating that soil can be used as a constituent material in CLSM mixtures.
In Mixture Nos. 19 through 25, sand replaced the Class F fly ash. As explained in Chapter 5, the w/c was lowered to minimize segregation of the sand particles. However, the relatively high strengths realized from these mixtures must be from the hard sand particles, as the w/c of several of these mixtures is the same as that of several mixtures in the sand and soil combination scenario. The soil and sand combination mixtures were much weaker than these sand only mixtures.
The last scenario of mixtures was the loess and sand combination. This combination was a 50/50 split between the two materials, and this combination replaced the Class F fly ash pound for pound. The strengths of these mixtures decreased with the increase of the loess and sand combination. However, the strengths were higher than the equivalent replacement level of the loess scenario. Again, as explained earlier, the results indicate that the loess soil has a greater effect on the ultimate strength than does the w/c in this situation.
Recommendations for Further Study
This research program was conducted to determine the feasibility of developing soil-based CLSM mixtures that can be used to replace conventional compacted-soil backfill. Several CLSM mixture scenarios were proportioned, mixed in the laboratory, tested for unhardened properties, and tested for unconfined compressive strength. The results indicate that a soil-based CLSM is feasible.
The unconfined compressive strengths of the mixtures containing soil decreased with increased amounts of soil. If these decreases are at a level that is unsatisfactory, steps can be taken to increase the strength by decreasing the water-cement ratio. This can be accomplished by increasing the portland cement content or decreasing the water content. Any adjustments would need to be tested to ensure that other parameters, such as flow consistency, are not adversely affected.
As noted earlier, soil from the Marmet Locks and Dam case study area was not available, and a loess soil was used in this study. It is recommended that, for a soil-based CLSM to be used at the case study area, it is necessary that trial batches be made using the soil from that area. It is believed that further study using soil from the case study area will further increase our knowledge about soil-based CLSM mixtures. This recommendation applies to any area wanting to take advantage of this method of void filling.
34 Chapter 8 Summary and Conclusions

References
Adaska W. (1997). "Controlled low-strength materials," Concrete International 19(4), 41-43.
American Concrete Institute. (1992). "Cement and concrete terminology," Publication SP-19 (92). ACI, Farmington Hills, MI.
. (1994a). "Controlled low-strength materials," ACI 229R-94. American Concrete Institute manual of concrete practice, Part 1, Farmington Hills, MI.
. (1994b). "Controlled low-strength materials," SP-150, Wayne S. Adaska, ed., Farmington Hills, MI.
American Society for Testing and Materials. (1998a). "Standard test method for slump of hydraulic cement concrete." 1998 Annual book ofASTM standards, Section 4, v. 04.02, Designation C 143, Philadelphia, PA.
. (1998b). "Standard specification for portland cement." 1998 Annual book of ASTM standards, Section 4, v. 04.01, Designation C 150, Philadelphia, PA.
. (1998c). "Standard test method for air content of freshly mixed concrete by the pressure method." 1998 Annual book ofASTM standards, Section 4, v. 04.02, Designation C 231, Philadelphia, PA.
. (1998d). "Standard specification for coal fly ash and raw or calcined natural pozzolan for use as a mineral admixture in concrete." 1998 Annual book of ASTM standards, Section 4, v. 04.02, Designation C 618, Philadelphia, PA.
. (1998e). "Standard test method for flow of grout for preplaced- aggregate concrete (flow cone method)." 1998 Annual book ofASTM standards, Section 4, v. 04.02, Designation C 939, Philadelphia, PA.
(1998f). "Standard test method for temperature of freshly mixed portland cement concrete." 1998 Annual book ofASTM standards, Section 4, v. 04.02, Designation C 1064, Philadelphia, PA.
References 35

American Society for Testing and Materials. (1998g). "Standard practice for sampling freshly mixed controlled low-strength material." 1998 Annual book ofASTM standards, Section 4, v. 04.09, Designation D 5971, Philadelphia, PA.
. (1998h). "Standard test method for unit weight, yield, and air content (gravimetric) of controlled low-strength material." 1998 Annual book ofASTM standards, Section 4, v. 04.09, Designation D 6023, Philadelphia, PA.
. (I998i). "Standard test method for flow consistency of controlled low-strength material." 1998 Annual book ofASTM standards, Section 4, v. 04.09, Designation D 6103, Philadelphia, PA.
Casagrande, A. (1948). "Classification and identification of soils," Transactions of the American Society of Civil Engineers 113, 901-91.
Doll, W. L., Wilmoth, B. M. Jr., and Whetstone, G. W. (1960). "Water Resources of Kanawha County, West Virginia; Bulletin 20, West Virginia Geological and Economic Survey, Morgantown, West Virginia, WV.
GAI Consultants, Inc. (1988). "Laboratory testing of fly ash slurry." Report No. CS-6100. Electric Power Research Institute (EPRI), Palo Alto, CA.
Goldbaum, J. E., Hook, W., and Clem, D. (1997). "Modification of bridges with CLSM," Concrete International 19(5), 44-47.
Howard, A. (1994). "Soil-cement slurry pipe embedment in controlled low strength materials," SP-150, American Concrete Institute, Farmington Hills, MI, 97-107.
Krebs, Charles E., and Teets, D. D., Jr. (1914). "West Virginia geologic survey," Kanawha County, Wheeling News Litho. Co., Wheeling, WV.
Krinitzsky, E. L., and Turnbull, W. J. (1967). Loess deposits of Mississippi. The Geological Society of America, Inc., Boulder, CO.
Larsen, R. L. (1988). "Use of controlled low-strength materials in Iowa," Concrete International 10(7), 22-23.
. (1990). "Sound uses of CLSM in the environment," Concrete International 12(7), 26-29.
Naik, T. R., Ramme, B. W., and Kolbeck, H. J. (1990). "Filling abandoned underground facilities with CLSM fly ash slurry," Concrete International 12(7), 19-25.
Nield, M. (1998). "Geology and foundations; Feature Design Memorandum, Marmet Locks and Dam, Kanawha River Lock Replacement," U.S. Army Engineer District, Huntington, WV, 1-25.
36 References
Ramme B., and Naik, T. (1998). "Controlled low-strength materials (CLSM) state-of-the-art," Paper, 1998 Spring Convention, American Concrete Institute, Houston, TX, 1-6.
References 37

Appendix A Results of Tests of Cement and Fly Ashes
Appendix A Results of Tests of Cement and Fly Ashes A1

TO: Brian Green CEWES-SC-C Engineering Mechanics Branch
REPORT OF TESTS ON HYDRAULIC CEMENT
FROM: U.S. Army Engineer Waterways Experiment Station (WES) Engineering Sciences Branch, CEWES-SC-E 3909 Halls Ferry Road Vicksburg, MS 39180-6199
Company: Blue Circle Cement Company
Location: Calera, AL Specification: ASTM C 150, L LA
Contract No.: Project: Soil-Based CLSM
Test Report No.: WES 12-98 Program: Single Sample CMDNo.: 980158 WIC No.: 004H28 Date Sampled: 2-18-98
3-20-98 . _Partial test result JTests complete, material x"l _does, L__ _does not meet specificati ion
Chemical Analysis Si02, % A1203, % F&A, % CaO, % MgO, % so3, % Loss on ignition, % Insoluble residue, % ... . Na20, % K20, % Alkalies-total asNa20, % I1O2, % P7Os,% ■2^S>
C3A,% . C3S,% . C2S,% . C.AF, %
Results 21.1 4.6 3.0
62.3 2.2 2.6 1.7
0.29 0.04 0.69 0.49
50 22
Retest
ASTM C 150 Spec Limits
"Type!"
6.0 max 3.0, 3.5 max"
3.0 max 0.75 max
0.60 max
Physical Tests
Heat of hydration, 7-day, cal/g Surface area, m2/kg (air permeability) Autoclave expansion, % Initial set, min. (Gillmore) Final set, min. (Gillmore) Air content, % Compressive strength, 3-day, psi Compressive strength, 7-day, psi False set (final penetration), % Remix penetration (false set), %
373 0.01 145 330
3660 4500
280 min 0.80 max
60 min 600 max
12 max 1,740 min 2,760 min
50 min
REMARKS: "See ASTM C 150 CF: Prepared by: Reviewed by:
1. Technical review. 2. Chief, Eng Sei Br.
MELVIN C. SYKES ENGINEERING SCIENCES BRANCH STRUCTURES LABORATORY
Information given in this report shall not be used in advertising or sales promotion to indicate endorsement of this product by the U.S. Government. .
A2 Appendix A Results of Tests of Cement and Fly Ashes

REPORT OF TESTS ON POZZOLAN
TO: FROM: Brian Green U. S. Army Engineer CEWES-SC-C Waterways Experiment Station (WES) Engineering Mechanics Branch Engineering Sciences Branch, CEWES-SC-E
3909 Halls Ferry Road Vicksburg,MS 39180-6199
Company: Wisconsin Electric Power Test Report No.: WES 10C-98 Location: Pleasant Prairie Power Plant, Kenosha County, WI
Program: Single Sample
Specification: ASTM C 618, available alkalies CMD No.: 980220 Contract No.: WIC No.: 004H28 Project: Soil-Based CLSM Date Sampled: 2-12-98
Partial test result 3-20-98 Tests complete, material |X] < does, 1 1 does not meet specification
Chemical Analysis Results Retest
ASTM C 618 Spec Limits «Class C
Si02, % A1203> % FePa, %
Sum, %
34.5 - 18.7 - 6.2 -
59.5 50.0 min CaO, % MgO, % S03, % Moisture content, %
34.0 - 4.7 - 2.4 5.0 max 0.2 3.0 max
Loss on ignition, % Available alkalies (28-day), %
0.3 6.0 max 0.99 1.5 max
Physical Tests Fineness (45 micrometre, % retained 16 34 max Fineness variation, % Water requirement, %
5 max 94 105 max
2.58 - Density variation, % Autoclave expansion, % Strength activity index w/cement, 7-d, % Strength activity index w/cement, 28-d, % Reactivity with cement alkalies: Mortar expansion, 14-d, %
5 max 0.05 0.80 max 98 75 min 97 75 min
100 max
Cement used: Blue Circle, Calera AL, WES 12-98, CMD NO. 980158 CF: Prepared by: Reviewed by:
1. Technical review. 2. Chief, Eng Sei Br.
Isl MELVIN C. SYKES ENGINEERING SCIENCES BRANCH STRUCTURES LABORATORY
Information given in this report shall not be used in advertising or sales promotion to indicate endorsement of this product by the U.S. Government.
Appendix A Results of Tests of Cement and Fly Ashes A3
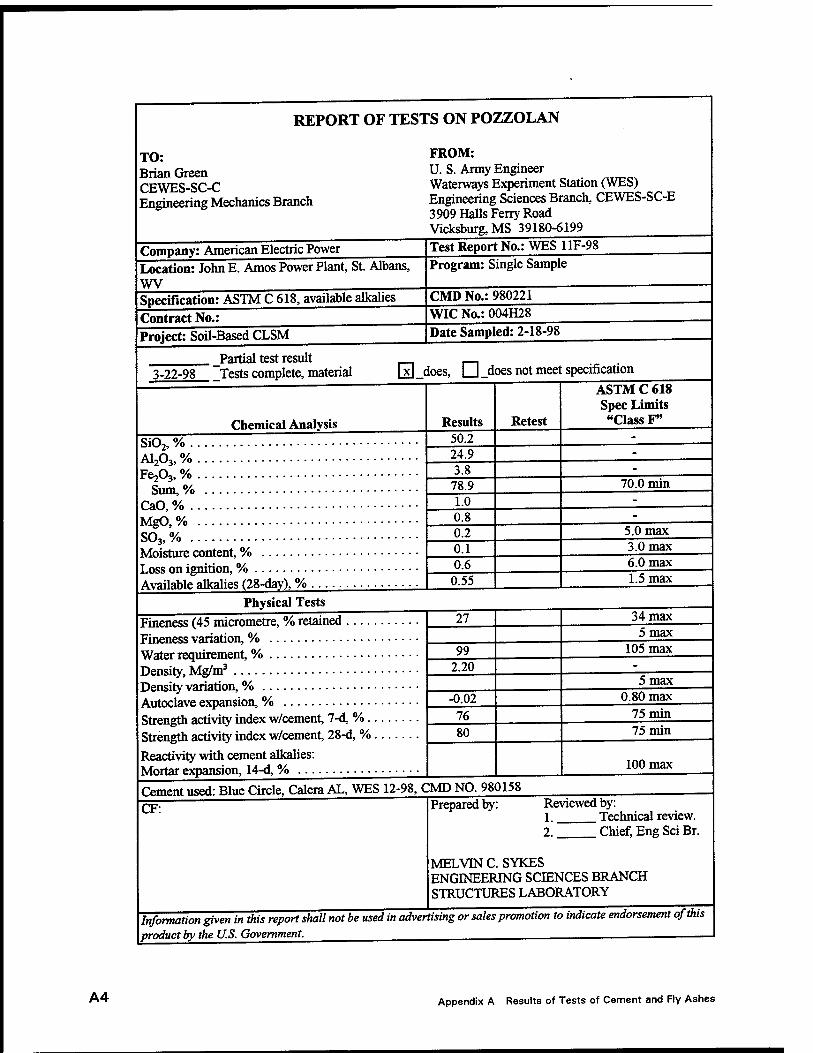
REPORT OF TESTS ON POZZOLAN
TO: Brian Green CEWES-SC-C Engineering Mechanics Branch
FROM: U. S. Army Engineer Waterways Experiment Station (WES) Engineering Sciences Branch, CEWES-SC-E 3909 Halls Ferry Road Vicksburg,MS 39180-6199
Company: American Electric Power Location: John E. Amos Power Plant, St. Albans, WV Specification: ASTM C 618, available alkalies Contract No.: Project: Soil-Based CLSM
Test Report No.: WES 11F-98 Program: Single Sample
CMD No.: 980221 WIC No.: 004H28 Date Sampled: 2-18-98
3-22-98 . Partial test result
Tests complete, material [x] does, CH _does not meet specification
Chemical Analysis Si02, % A1203, % FejOs, %
Sum, % CaO, % MgO, % SO3, % Moisture content, % Loss on ignition, % Available alkalies (28-day), %
Results 50.2 24.9 3.8
78.9 1.0 0.8 0.2 0.1 0.6
0.55
Retest
ASTM C 618 Spec Limits "Class F"
70.0 min
5.0 max 3.0 max 6.0 max 1.5 max
Physical Tests Fineness (45 micrometre, % retained Fineness variation, % Water requirement, % Density, Mg/m3 Density variation, % Autoclave expansion, % Strength activity index w/cement, 7-d, %. Strength activity index w/cement, 28-d, % Reactivity with cement alkalies: Mortar expansion, 14-d, %
27
99 2.20
-0.02 76 80
34 max
105 max
0.80 max 75 min 75 min
Cement used: Blue Circle, Calera AL, WES 12-98, CMD NO. 980158 CF: Prepared by:
5max
5 max
100 max
Reviewed by: 1. Technical review. 2. Chief, Eng Sei Br.
MELVIN C. SYKES ENGINEERING SCIENCES BRANCH STRUCTURES LABORATORY
Information given in this report shall not be used in advertising or sales promotion to indicate endorsement of this product by the U.S. Government. . _
A4 Appendix A Results of Tests of Cement and Fly Ashes
Appendix B CLSM Mixture Proportions, 1-yd3 Batch
Appendix B CLSM Mixture Proportions B1

Mixture Number Water, lb Cement, lb
Class F Fly Ash, lb
Class C Fly Ash, lb
Loess Soil, lb
Concrete Sand, lb
5/6 797 69.5 1,852 0 0 0
7 797 46.3 1,852 0 0 0
8 792 92.2 1,843 0 0 0
9 793 62.3 1,846 7.6 0 0
10 792 55.3 1,843 15.2 0 0
11 792 41.5 1,843 30.4 0 0
12 792 27.6 1,843 45.6 0 0
13 788 13.8 1,834 60.5 0 0
14 821 66.2 1,588 0 176 0
15 831 62.3 1,329 0 332 0
16 845 63.4 1,014 0 676 0
17 867 61.9 661 0 991 0
18 910 65.0 347 0 1,387 0
19 793 69.2 1,662 0 0 185
20 750 74.0 1,580 0 0 395
21 721 70.2 1,685 0 0 374
22 700 68.2 1,455 0 0 727
23 647 68.3 1,275 0 0 1,093
24 590 68.7 1,098 0 0 1,464
25 555 68.2 909 0 0 1,818
26 802 69.9 1,679 0 93 93
27 816 67.3 1,435 0 179 179
28 781 72.3 1,157 0 386 386
29 761 75.1 801 0 601 601
30 742 78.3 418 0 836 836 I
B2 Appendix B CLSM Mixture Proportions
Appendix C Unconfined Compressive Strength Test Results of Soil- Based CLSM Mixtures
Appendix C Unconfined Compressive Strength Tests Results of Soil-Based CLSM Mixtures C1

Mixture Name
Cylinder Number
Date Tested
Age in Days
Total Load
Ibf
Unconfined Compressive
Strength psi
62 BG Mixture 5
1
2
3
10-Mar-98
10-Mar-98
10-Mar-98
7 7
7
165
256
240
23
36
34
4
5
6
31-Mar-98
31-Mar-98
31-Mar-98
28
28
28
497
435
488
70
62
69
7
8
9
02-Jun-98
02-Jun-98
02-Jun-98
91
91
91
530
601
565
75
85
80
10
11
12
01-Sep-98
01-Sep-98
01-Sep-98
182
182
182
511
496
72
70
63 BG Mixture 6
1 2 3
11-Mar-98 11-Mar-98
11-Mar-98
7 7 7
391 319
311
55
45 44
4 5 6
01-Apr-98
01-Apr-98
01-Apr-98
28
28
28
524
453
451
74
64
64
7
8
9
03-Jun-98
03-Jun-98
03-Jun-98
91
91
91
549
502
534
78
71
76
10
11
12
02-Sep-98
02-Sep-98
02-Sep-98
182
182
182
577
416
536
82
59
76
63 BG
Mixture 7
1
2 3
11-Mar-98
11-Mar-98
11-Mar-98
7
7 7
218
202
193
31
29
27
4
5
6
01-Apr-98
01-Apr-98
01-Apr-98
28
28
28
228
266
245
32
38
35
7 8
9
03-Jun-98
03-Jun-98
03-Jun-98
91 91
91
312
268
282
44
38
40
10
11
12
02-Sep-98
02-Sep-98
02-Sep-98
182
182
182
295
299
42
42
C2 Appendix C Unconfined Compressive Strength Test Results of Soil-Based CLSM Mixtures

Mixture Name
Cylinder Number
Date Tested
Age in Days
Total Load Ibf
Unconfined Compressive
Strength psi
63 BG
Mixture 8 1
2
3
11-Mar-98
11-Mar-98
11-Mar-98
7
7
7
437
399
242
62
56
34
4
5
6
01-Apr-98
01-Apr-98
01-Apr-98
28
28 28
659
660
612
93
93 87
7
8 9
03-Jun-98 03-Jun-98
03-Jun-98
91 91
91
806
718 880
114
102
124
10
11
12
02-Sep-98
02-Sep-98
02-Sep-98
182
182
182
948
926
918
134
131
130
65 BG
Mixture 9 1
2
3
13-Mar-98
13-Mar-98
13-Mar-98
7
7
7
344
333
349
49
47
49
4 5
6
03-Apr-98 03-Apr-98 03-Apr-98
28
28 28
388
429
461
55 61
65
7
8
9
05-Jun-98
05-Jun-98
05-Jun-98
91
91
91
444
323
523
63 46
74
10
11
12
04-Sep-98
04-Sep-98
04-Sep-98
182
182
182
516
533
321
73
75
45
65 BG Mixture 10
1
2 3
13-Mar-98
13-Mar-98 13-Mar-98
7
7 7
302
279
325
43
39
46
4
5
6
03-Apr-98
03-Apr-98
03-Apr-98
28
28
28
340 351
330
48
50
47
7
8
9
05-Jun-98
05-Jun-98
05-Jun-98
91
91
91
455
454
479
64
64
68
10 11
12
04-Sep-98 04-Sep-98
04-Sep-98
182
182
182
319
471
465
45
67
66
65 BG Mixture 11
1 2
13-Mar-98
13-Mar-98 7
7 265 251
37 36
Appendix C Unconfined Compressive Strength Tests Results of Soil-Based CLSM Mixtures C3

I
Mixture Name
Cylinder Number
Date Tested
Age in Days
Total Load
Ibf
Unconfined Compressive
Strength psi
3 13-Mar-98 7 252 36
4
5
6
03-Apr-98
03-Apr-98
03-Apr-98
28
28
28
269
287
240
38
41
34
7 05-Jun-98 91 344 49
8 05-Jun-98 91 333 47
9 05-Jun-98 91 338 48
10
11
04-Sep-98
04-Sep-98
182
182
376
306
53
43
33 12 04-Sep-98 182 231
65 BG
Mixture 12
1
2
3
13-Mar-98
13-Mar-98
13-Mar-98
7
7
7
164
185
192
23
26
27
4 03-Apr-98 28 183 26
24
28 5
6
03-Apr-98
03-Apr-98
28
28
170 199
7
8
05-Jun-98
05-Jun-98
91 91
243
262
34
37
9 05-Jun-98 91 274 39
10 04-Sep-98 182 238 34
11 04-Sep-98 182 236 33
12 04-Sep-98 182
65 BG
Mixture 13
1
2
3
13-Mar-98
13-Mar-98
13-Mar-98
7
7
7
119
94
95
17
13
13
4
5
03-Apr-98
03-Apr-98
28
28
133
110
19
16
6 03-Apr-98 28 114 16
7 05-Jun-98 91 111 16
8
9
05-Jun-98
05-Jun-98
91
91
123
140
17 20
10
11
04-Sep-98 04-Sep-98
182 182
142
88
20
12
12 04-Sep-98 182 153 22
68 BG
Mixture 14
1
2
3
16-Mar-98
16-Mar-98
16-Mar-98
7
7
7
122
131
119
17
19
17
Il
C4 Appendix C Unconfined Compressive Strength Test Resu.ts of Soi.-Based CLSM Mixtures

Unconfirmed Total Compressive
Mixture Cylinder Date Age in Load Strength Name Number Tested Days Ibf psi
4 06-Apr-98 28 295 42
5 06-Apr-98 28 219 31
6 06-Apr-98 28 246 35
7 08-Jun-98 91 380 54
8 08-Jun-98 91 420 59
9 08-Jun-98 91 403 57
10 08-Sep-98 183 413 58
11 08-Sep-98 183 403 57
12 08-Sep-98 183 402 57
68 BG 1 16-Mar-98 7 212 30
Mixture 15 2 16-Mar-98 7 220 31
3 16-Mar-98 7 180 25
4 06-Apr-98 28 207 29
5 06-Apr-98 28 194 27
6 06-Apr-98 28 160 23
7 08-Jun-98 91 259 37
8 08-Jun-98 91 247 35
9 08-Jun-98 91 227 32
10 08-Sep-98 183 294 42
11 08-Sep-98 183 249 35
12 08-Sep-98 183 281 40
69 BG 1 17-Mar-98 7 116 16
Mixture 16 2 17-Mar-98 7 119 17
3 17-Mar-98 7 113 16
4 07-Apr-98 28 126 18
5 07-Apr-98 28 129 18
6 07-Apr-98 28 130 18
7 09-Jun-98 91 176 25
8 09-Jun-98 91 170 24
9 09-Jun-98 91 172 24
10 08-Sep-98 182 235 33
11 08-Sep-98 182 206 29
12 08-Sep-98 182 - -
69 BG 1 17-Mar-98 7 82 12 Mixture 17 2 17-Mar-98 7 84 12
3 17-Mar-98 7 70 10
4 07-Apr-98 28 83 12
5 07-Apr-98 28 73 10
Appendix C Unconfined Compressive Strength Tests Results of Soil-Based CLSM Mixtures C5

Mixture Name
Cylinder Number
Date Tested
Age in Days
Total Load
Ibf
Unconfined Compressive
Strength psi
6 07-Apr-98 28 80 11
7
8
9
09-Jun-98
09-Jun-98
09-Jun-98
91
91
91
102
98
111
14
14
16
10
11
12
08-Sep-98
08-Sep-98
08-Sep-98
182
182
182
151
141
156
21
20
22
70 BG
Mixture 18
1
2
3
18-Mar-98
18-Mar-98
18-Mar-98
7
7
7
72
69
67
10
10
9
4
5
6
08-Apr-98
08-Apr-98
08-Apr-98
28
28
28
44
44
43
6
6
6
7
8
9
10-Jun-98
10-Jun-98
10-Jun-98
91
91
91
91
78 83
13
11
12
10 11
12
09-Sep-98 09-Sep-98
09-Sep-98
182
182
182
126
140
142
18 20
20
71 BG
Mixture 19
1
2
3
19-Mar-98
19-Mar-98
19-Mar-98
7
7
7
360
314
309
51
44
44
4
5
6
09-Apr-98
09-Apr-98
09-Apr-98
28
28
28
505
396
540
71
56
76
7
8
9
11-Jun-98
11-Jun-98
11-Jun-98
91
91
91
599
591
579
85
84
82
10
11
12
10-Sep-98
10-Sep-98
10-Sep-98
182
182
182
599
564
625
85
80
88
71 BG Mixture 20
1
2
3
19-Mar-98
19-Mar-98
19-Mar-98
7
7 7
383
347
375
54
49
53
4
5
6
09-Apr-98
09-Apr-98
09-Apr-98
28
28
28
636
606
586
90
86
83
C6 Appendix C Unconfined Compressive Strength Test Results of Soil-Based CLSM Mixtures

Unconfined Total Compressive
Mixture Cylinder Date Age in Load Strength Name Number Tested Days Ibf psi
7 11-Jun-98 91 794 112
8 11-Jun-98 91 771 109
9 11-Jun-98 91 785 111
10 10-Sep-98 182 655 93
11 10-Sep-98 182 524 74
12 10-Sep-98 182 626 89
71 BG 1 19-Mar-98 7 402 57
Mixture 21 2 19-Mar-98 7 481 68
3 19-Mar-98 7 393 56
4 09-Apr-98 28 755 107
5 09-Apr-98 28 726 103
6 09-Apr-98 28 729 103
7 11-Jun-98 91 881 125
8 11-Jun-98 91 826 117
9 11-Jun-98 91 827 117
10 10-Sep-98 182 958 136
11 10-Sep-98 182 896 127
12 10-Sep-98 182 938 133
71 BG 1 19-Mar-98 7 425 60
Mixture 22 2 19-Mar-98 7 448 63
3 19-Mar-98 7 286 40
4 09-Apr-98 28 671 95
5 09-Apr-98 28 757 107
6 09-Apr-98 28 658 93
7 11-Jun-98 91 905 128
8 11-Jun-98 91 907 128
9 H-Jun-98 91 919 130
10 10-Sep-98 182 598 85
11 10-Sep-98 182 733 104
12 10-Sep-98 182 - --
72 BG 1 20-Mar-98 7 . 544 77
Mixture 23 2 20-Mar-98 7 466 66
3 20-Mar-98 7 585 83
4 10-Apr-98 28 830 117
5 10-Apr-98 28 903 128
6 10-Apr-98 28 941 133
7 12-Jun-98 91 1103 156
8 12-Jun-98 91 1081 153
Appendix C Unconfined Compressive Strength Tests Results of Soil-Based CLSM Mixtures C7

C8
Mixture Name
Cylinder Number
Date Tested
Age in Days
Total Load
Ibf
Unconfined Compressive
Strength psi
9 12-Jun-98 91 1062 150
10
11
12
11-Sep-98
11-Sep-98
11-Sep-98
182
182
182
1196
1176
1079
169
166
153
72 BG
Mixture 24
1
2
3
20-Mar-98
20-Mar-98
20-Mar-98
7
7
7
484
495
522
68
70
74
4
5
6
10-Apr-98
10-Apr-98
10-Apr-98
28
28
28
708
695
723
100
98
102
7
8
9
12-Jun-98
12-Jun-98 12-Jun-98
91
91
91
1324
1194
1212
187
169
171
10
11
12
11-Sep-98
11-Sep-98
11-Sep-98
182
182
182
890
1122
1147
126
159
162
72 BG
Mixture 25
1
2
3
20-Mar-98
20-Mar-98
20-Mar-98
7 7 7
419
392
496
59
55
70
4 5
6
10-Apr-98
10-Apr-98
10-Apr-98
28
28
28
918
991
852
130
140
121
7
8
9
12-Jun-98
12-Jun-98
12-Jun-98
91
91
91
1339
1060
1128
189
150
160
10
11
12
11-Sep-98
11-Sep-98
11-Sep-98
182
182
182
1271
1280
1293
180
181
183
72 BG
Mixture 26
1
2
3
20-Mar-98
20-Mar-98
20-Mar-98
7
7 7
294
313
285
42
44
40
4
5
6
10-Apr-98
10-Apr-98
10-Apr-98
28
28
28
469
412
377
66
58
53
7
8
9
12-Jun-98
12-Jun-98
12-Jun-98
91
91
91
498
490
487
70
69
69
Appendix C Unconfined Compressive Strength Test Results of Soil-Based C

Unconfined Total Compressive
Mixture Cylinder Date Age in Load Strength Name Number Tested Days Ibf psi
10 11-Sep-98 182 440 62
11 11-Sep-98 182 509 72
12 11-Sep-98 182 427 60
72 BG 1 20-Mar-98 7 285 40
Mixture 27 2 20-Mar-98 7 243 34
3 20-Mar-98 7 253 36
4 10-Apr-98 28 335 47
5 10-Apr-98 28 344 49
6 10-Apr-98 28 340 48
7 12-Jun-98 91 489 69
8 12-Jun-98 91 448 63
9 12-Jun-98 91 455 64
10 11-Sep-98 182 408 58
11 11-Sep-98 182 412 58
12 11-Sep-98 182 421 60
72 BG 1 20-Mar-98 7 166 23
Mixture 28 2 20-Mar-98 7 115 16
3 20-Mar-98 7 113 16
4 10-Apr-98 28 316 45
5 10-Apr-98 28 292 41
6 10-Apr-98 28 281 40
7 12-Jun-98 91 342 48
8 12-Jun-98 91 330 47
9 12-Jun-98 91 350 50
10 11-Sep-98 182 334 47
11 11-Sep-98 182 321 45
12 11-Sep-98 182 - -
72 BG 1 20-Mar-98 7 102 14
Mixture 29 2 20-Mar-98 7 106 15
3 20-Mar-98 7 105 15
4 10-Apr-98 28 292 41
5 10-Apr-98 28 289 41
6 10-Apr-98 28 291 41
7 12-Jun-98 91 329 47
8 12-Jun-98 91 353 50
9 12-Jun-98 91 357 50
10 11-Sep-98 182 359 51
11 11-Sep-98 182 319 45
Appendix C Unconfined Compressive Strength Tests Results of Soil-Based CLSM Mixtures C9

Mixture Name
Cylinder Number
75 BG
Mixture 30
12
1
2
3
4 5 6
7
8
10
11
12
Date Tested
11-Sep-98
23-Mar-98
23-Mar-98
23-Mar-98
13-Apr-98
13-Apr-98
13-Apr-98
15-Jun-98
15-Jun-98
15-Jun-98
14-Sep-98
14-Sep-98
14-Sep-98
Age in Days
182
Total Load
Ibf
294
Unconfined Compressive
Strength psi
42
7 149 21
7 154 22
7 162 23
28 215 30
28 186 26
28 180 25
91 272 38
91 274 39
91 276 39
182 311 44
182 271 38
182 299 42
C10 Appendix C Unconfined Compressive Strength Test Results of Soil-Based CLSM Mixtures

REPORT DOCUMENTATION PAGE Form Approved
OMB No. 0704-0188 Public reporting burden for this collection of information is estimated to average 1 hour per response, including the time for reviewing instructions, searching existing data sources, gathering and maintaining the data needed, and completing and reviewing this collection of information. Send comments regarding this burden estimate or any other aspect of this collection of information, including suggestions for reducing this burden to Department of Defense, Washington Headquarters Services, Directorate for Information Operations and Reports (0704-0188), 1215 Jefferson Davis Highway, Suite 1204, Arlington, VA 22202- 4302 Respondents should be aware that notwithstanding any other provision of law, no person shall be subject to any penalty for failing to comply with a collection of information if it does not display a currently valid OMB control number. PLEASE DO NOT RETURN YOUR FORM TO THE ABOVE ADDRESS.
1. REPORT DATE (DD-MM-YYYY) 2. REPORT TYPE October 1999
3. DATES COVERED (From - To) Final report
4. TITLE AND SUBTITLE 5a. CONTRACT NUMBER
Development of Soil-Based Controlled Low-Strength Materials Sb. GRANT NUMBER
5c. PROGRAM ELEMENT NUMBER
6. AUTHOR(S)
Brian H. Green
5d. PROJECT NUMBER
5e. TASK NUMBER
5f. WORK UNIT NUMBER INPWU 33142
7. PERFORMING ORGANIZATION NAME(S) AND ADDRESS(ES)
U.S. Army Engineer Research and Development Center Waterways Experiment Station 3909 Halls Ferry Road Vicksburg,MS 39180-6199
8. PERFORMING ORGANIZATION REPORT NUMBER
Technical Report INP-SL-2
9. SPONSORING / MONITORING AGENCY NAME(S) AND ADDRESS(ES)
U.S. Army Corps of Engineers Washington, DC 20314-1000
10. SPONSOR/MONITOR'S ACRONYM(S)
11. SPONSOR/MONITOR'S REPORT NUMBER(S)
12. DISTRIBUTION / AVAILABILITY STATEMENT
Approved for public release; distribution is unlimited.
13. SUPPLEMENTARY NOTES
14. ABSTRACT This study reports research on the use of soil-based controlled low-strength material (CLSM) as an economical approach to
conventional backfilling at new navigation lock chambers and other large construction activities. This research comprises one element of the U.S. Army Corps of Engineers' Innovations for Navigation research program, which is investigating innovative construction techniques for future Corps navigation structures.
As defined by the American Concrete Institute, CLSM includes those "materials that result in a compressive strength of 1,200 psi [8,274 kPa] or less." CLSM is self-compacting, cement-based material that, unlike conventional backfill, does not require mechanical compaction after placement. This allows for a more economical approach to backfilling since the equipment and labor required to place and compact conventional fill are eliminated.
The case study was a proposed lock chamber at the Mannet Locks and Dam on the Kanawha River in West Virginia. A large void between the existing lock chambers and the proposed new lock chamber will result. Plans are to backfill this area to meet the structural requirements of the lock walls and to satisfy other project operational needs. Use of an economical soil-based CLSM in this area, incorporating otherwise undesirable material excavated during project construction, represents an attractive option.
More than 30 CLSM mixtures were proportioned, mixed in the laboratory, and tested for unhardened properties and uncompressive strength. The flow consistency of all die CLSM mixtures tested was equal to or higher than the control mixture, and all of the mixtures exhibited a gain in unconfined compressive strength. These results indicate that a soil-based CLSM is feasible.
15. SUBJECT TERMS Backfill Navigation structures
Controlled low-strength materials
16. SECURITY CLASSIFICATION OF:
a. REPORT
UNCLASSIFIED
b. ABSTRACT c. THIS PAGE
UNCLASSIFIED
17. LIMITATION OF ABSTRACT
18. NUMBER OF PAGES
60
19a. NAME OF RESPONSIBLE PERSON
19b. TELEPHONE NUMBER (include area code)
Standard Form 298 (Rev. 8-98) Prescribed by ANSI Std. 239.18


![Research Article Cytotoxic Activity of Kenaf Seed Oils from ... · Evidence-Based Complementary and AlternativeMedicine materials like a liquid [ ]. Additionally, it can readily change](https://img.pdfslide.us/doc/110x75/60daa24d72792841e4096a82/research-article-cytotoxic-activity-of-kenaf-seed-oils-from-evidence-based-complementary.jpg)