Embed Size (px)
Citation preview
U.S. and World Cotton Economic Outlook
March 2010
Prepared by:Economic Services
National Cotton Council
U.S. and World Cotton Economic Outlook
March 2010
Prepared by:Economic Services
National Cotton Council

Macroeconomic Environment
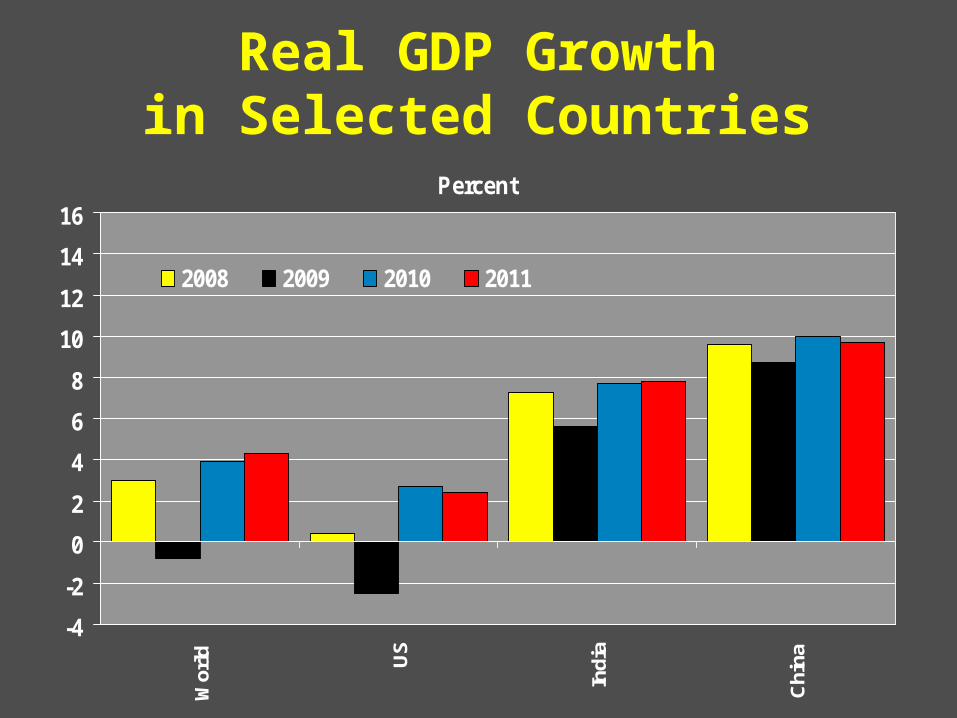
Percent
-4
-2
0
2
4
6
8
10
12
14
16W
orld US
Indi
a
Chi
na
2008 2009 2010 2011
Real GDP Growthin Selected Countries
U.S. Cotton Supply
30
40
50
60
70
80
90
100
110
Au
g
Se
p
No
v
Ja
n
Ma
r
Ma
y
Ju
l
Se
p
No
v
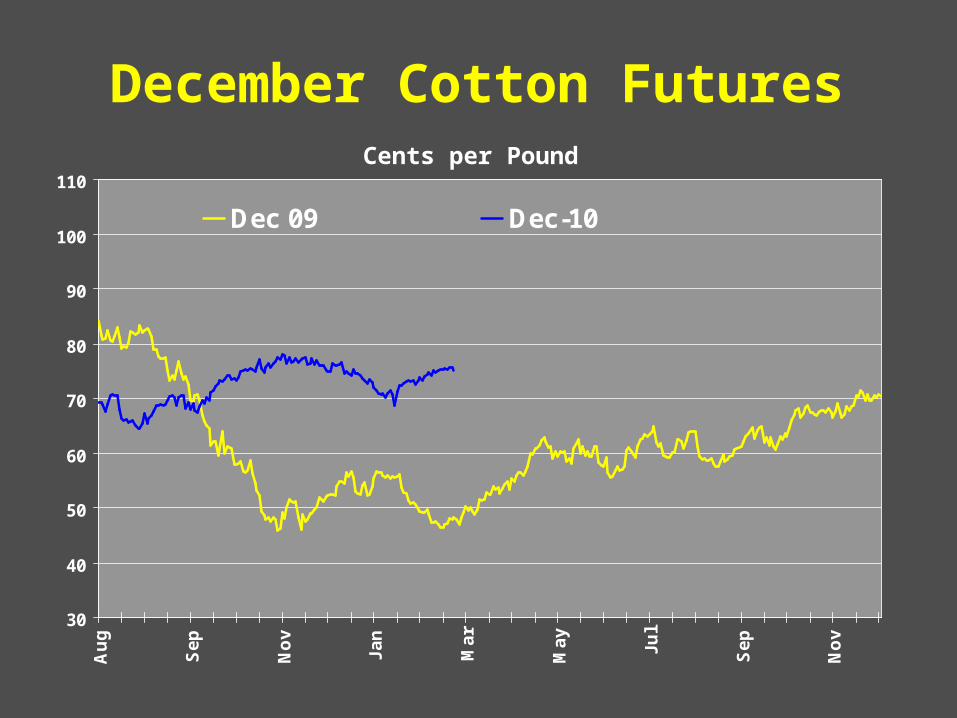
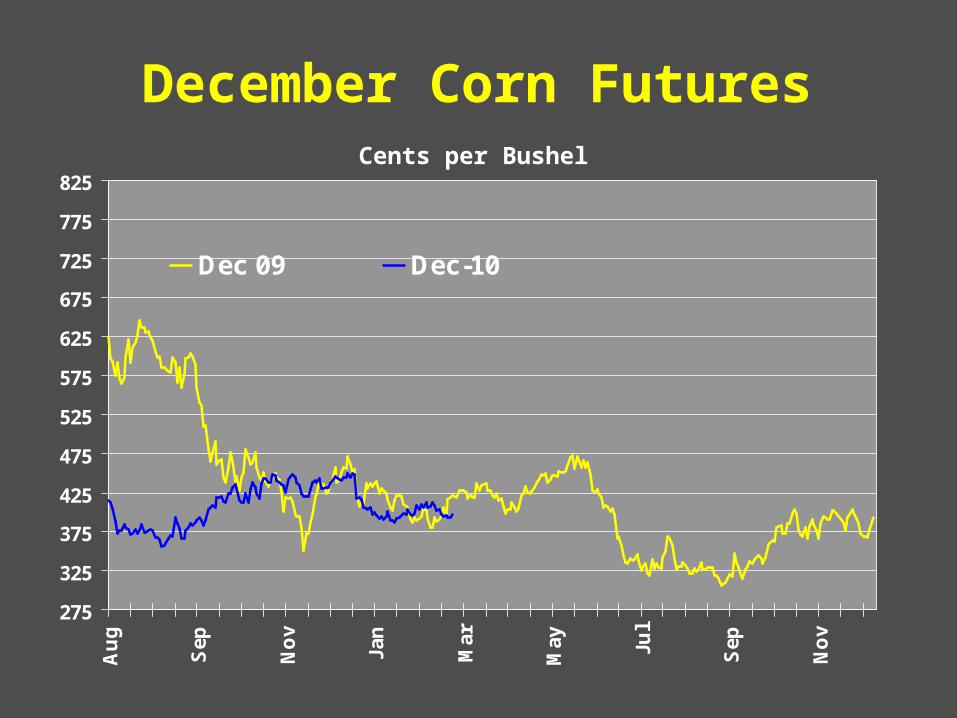
Dec 09 Dec-10
December Cotton FuturesCents per Pound
275
325
375
425
475
525
575
625
675
725
775
825
Au
g
Sep
No
v
Jan
Mar
May Ju
l
Sep
No
v
Dec 09 Dec-10
December Corn FuturesCents per Bushel
580
680
780
880
980
1080
1180
1280
1380
1480
1580
1680
Au
g
Sep
No
v
Jan
Mar
May Ju
l
Sep
No
v
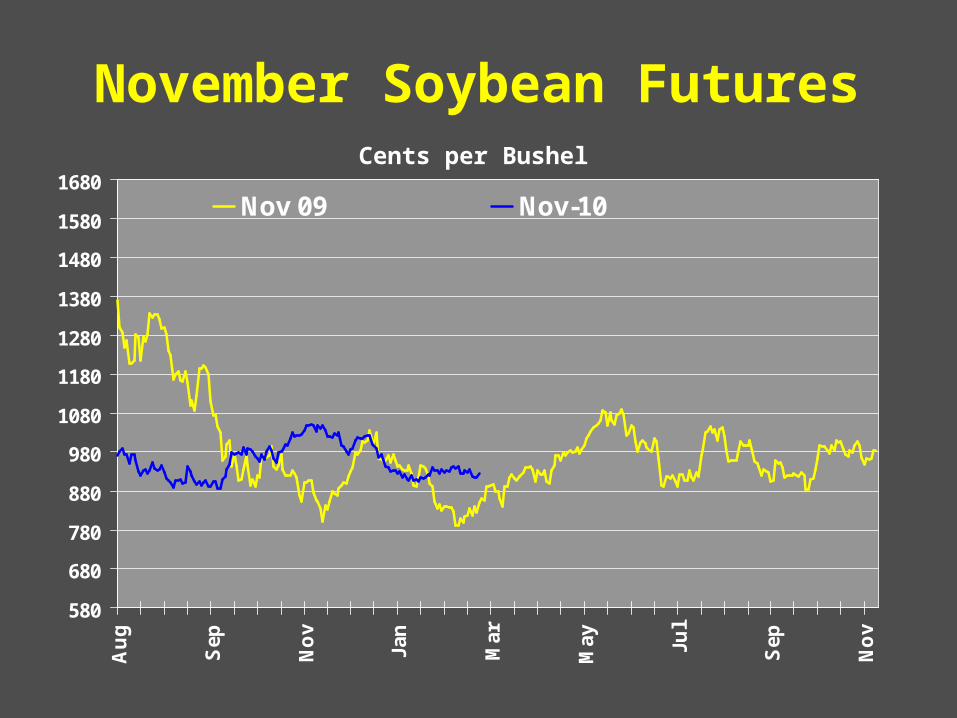
Nov 09 Nov-10
November Soybean FuturesCents per Bushel
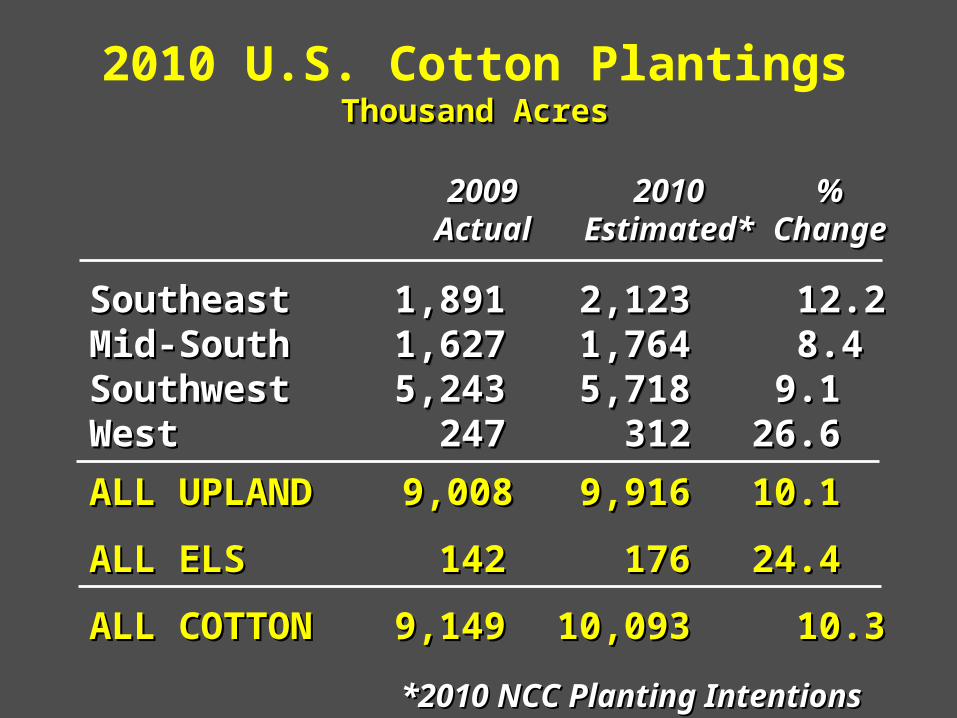
SoutheastSoutheast 1,891 1,891 2,123 2,123 12.212.2Mid-SouthMid-South 1,627 1,627 1,764 1,764 8.4 8.4 SouthwestSouthwest 5,243 5,243 5,718 5,718 9.1 9.1 WestWest 247 247 312 312 26.6 26.6
ALL UPLANDALL UPLAND 9,0089,008 9,9169,916 10.110.1
ALL ELSALL ELS 142 142 176 176 24.4 24.4
ALL COTTONALL COTTON 9,149 9,149 10,093 10,093 10.310.3
2010 U.S. Cotton Plantings
20092009 20102010 %% Actual Actual Estimated* Estimated* ChangeChange
20092009 20102010 %% Actual Actual Estimated* Estimated* ChangeChange
Thousand AcresThousand AcresThousand AcresThousand Acres
*2010 NCC Planting Intentions Survey *2010 NCC Planting Intentions Survey
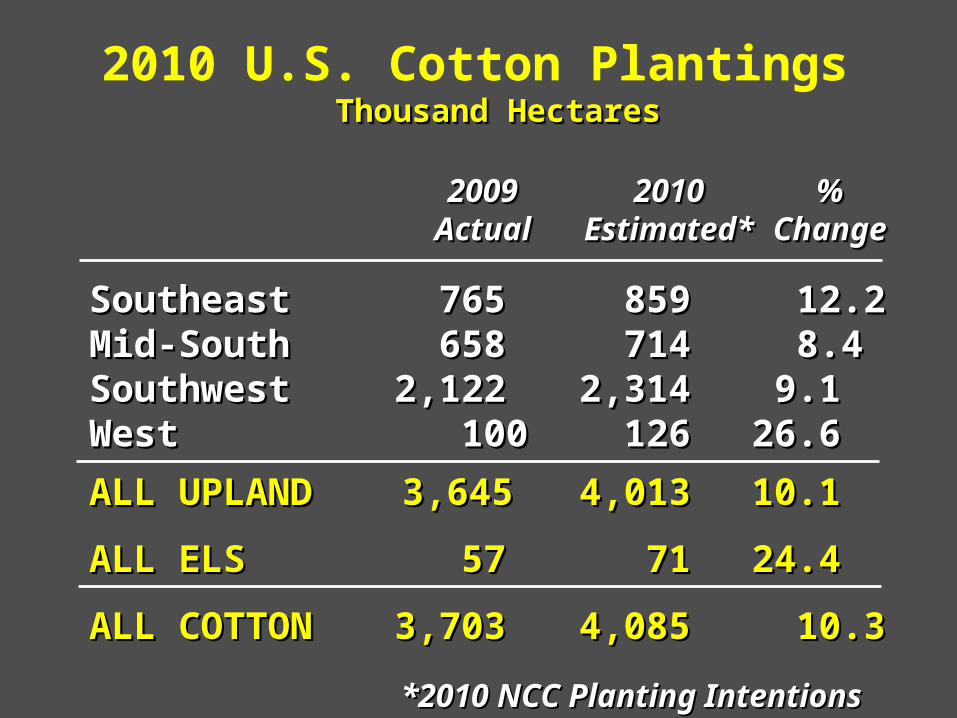
SoutheastSoutheast 765 765 859 859 12.212.2Mid-SouthMid-South 658 658 714 714 8.4 8.4 SouthwestSouthwest 2,122 2,122 2,314 2,314 9.1 9.1 WestWest 100 100 126 126 26.6 26.6
ALL UPLANDALL UPLAND 3,6453,645 4,0134,013 10.110.1
ALL ELSALL ELS 57 57 71 71 24.4 24.4
ALL COTTONALL COTTON 3,703 3,703 4,085 4,085 10.310.3
2010 U.S. Cotton Plantings
20092009 20102010 %% Actual Actual Estimated* Estimated* ChangeChange
20092009 20102010 %% Actual Actual Estimated* Estimated* ChangeChange
Thousand HectaresThousand HectaresThousand HectaresThousand Hectares
*2010 NCC Planting Intentions Survey*2010 NCC Planting Intentions Survey
0
4
8
12
16
20
24
28
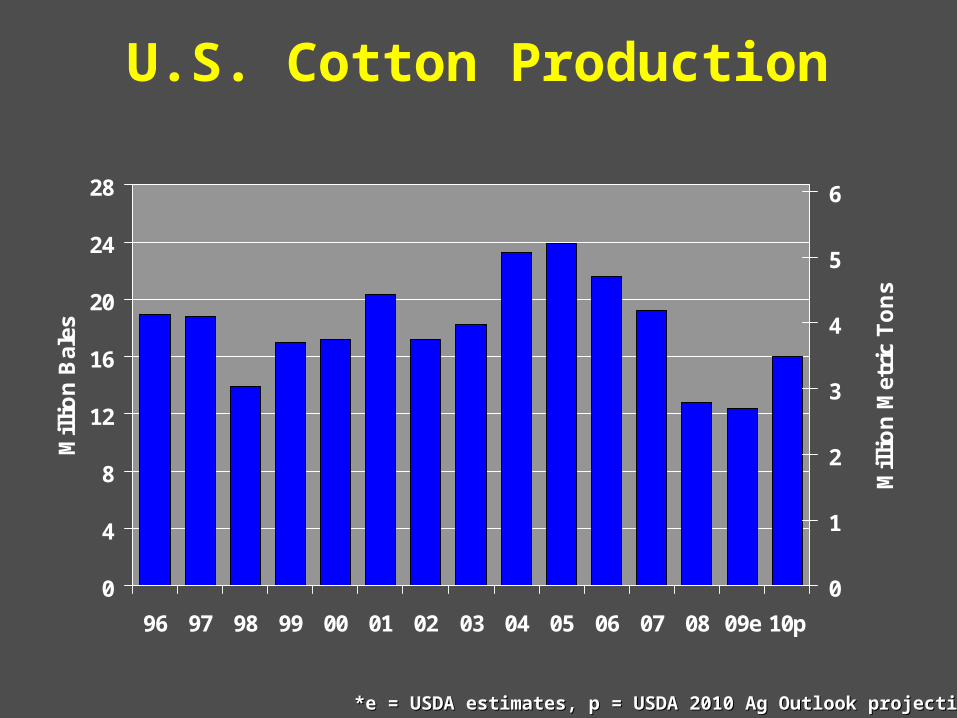
96 97 98 99 00 01 02 03 04 05 06 07 08 09e 10p
Mil
lio
n B
ales
0
1
2
3
4
5
6
Mil
lio
n M
etri
c T
on
s
U.S. Cotton Production
*e = USDA estimates, p = USDA 2010 Ag Outlook projections *e = USDA estimates, p = USDA 2010 Ag Outlook projections
0
5
10
15
20
25
30
35
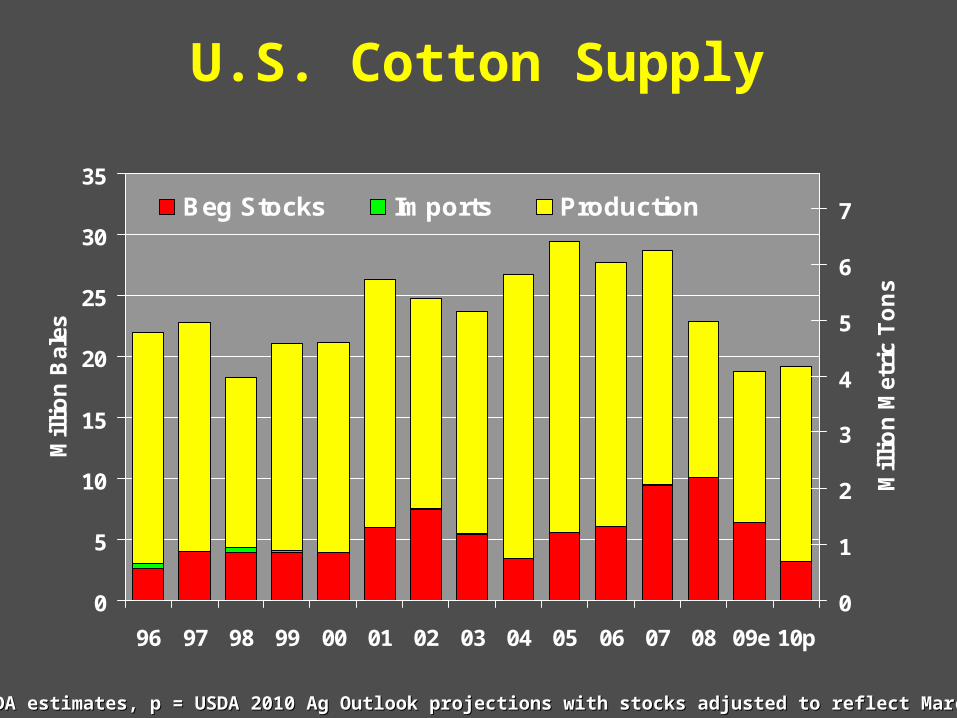
96 97 98 99 00 01 02 03 04 05 06 07 08 09e 10p
Mil
lio
n B
ales
0
1
2
3
4
5
6
7
Mil
lio
n M
etri
c T
on
s
Beg Stocks Imports Production
U.S. Cotton Supply
*e = USDA estimates, p = USDA 2010 Ag Outlook projections with stocks adjusted to reflect March WASDE*e = USDA estimates, p = USDA 2010 Ag Outlook projections with stocks adjusted to reflect March WASDE

U.S. Cotton Demand
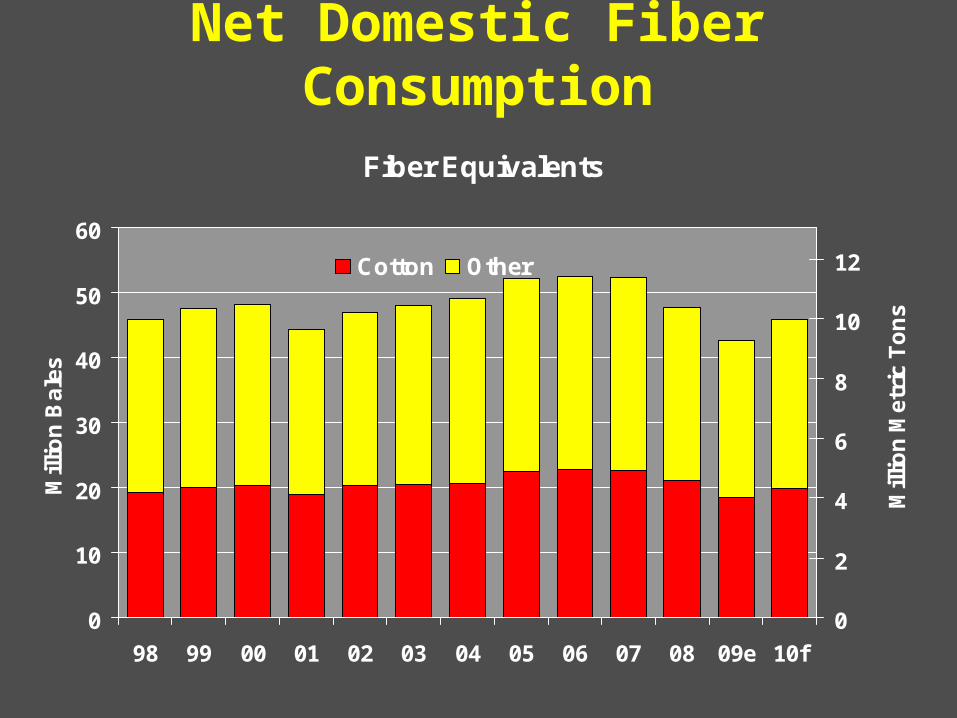
Fiber Equivalents
0
10
20
30
40
50
60
98 99 00 01 02 03 04 05 06 07 08 09e 10f
Mill
ion
Ba
les
0
2
4
6
8
10
12
Mill
ion
Me
tric
To
ns
Cotton Other
Net Domestic Fiber Consumption
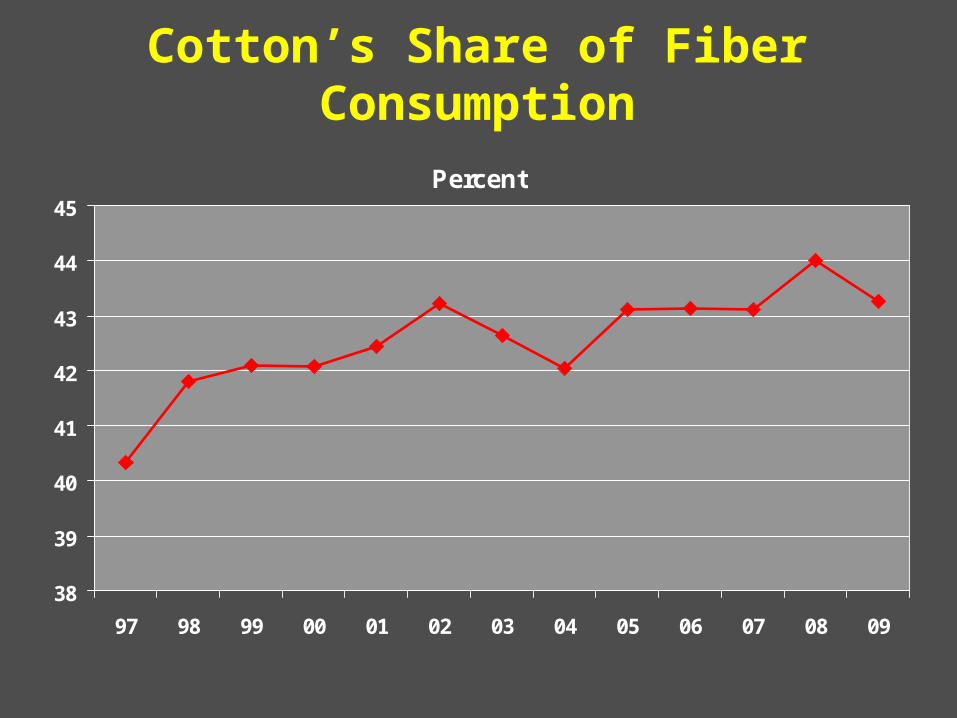
Percent
38
39
40
41
42
43
44
45
97 98 99 00 01 02 03 04 05 06 07 08 09
Cotton’s Share of Fiber Consumption
Fiber Equivalents
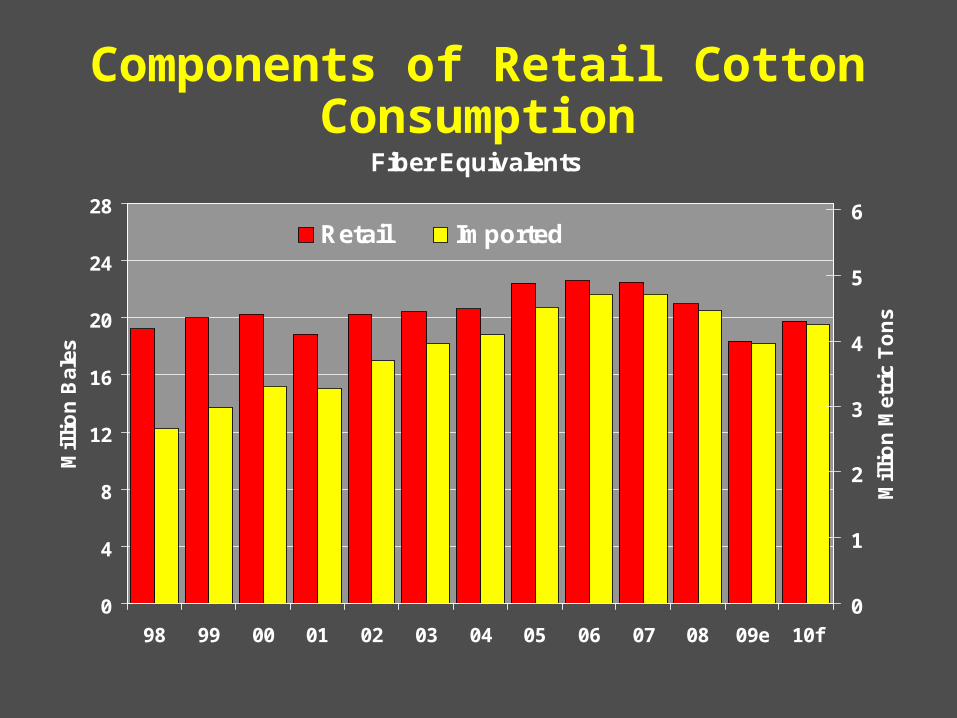
0
4
8
12
16
20
24
28
98 99 00 01 02 03 04 05 06 07 08 09e 10f
Mil
lio
n B
ales
0
1
2
3
4
5
6
Mil
lio
n M
etri
c T
on
s
Retail Imported
Components of Retail Cotton Consumption
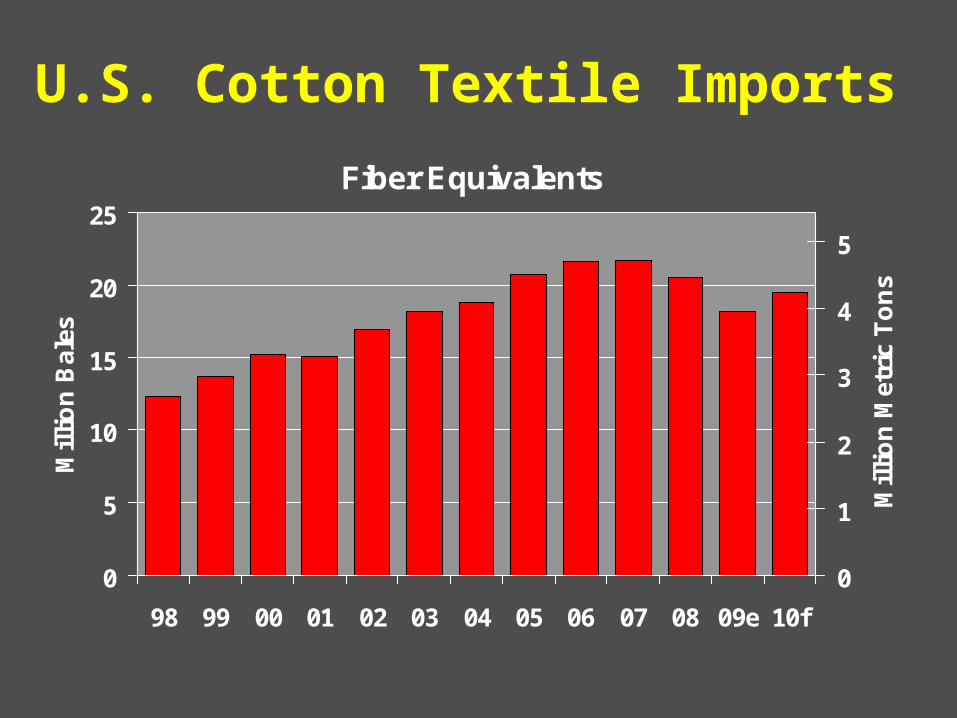
Fiber Equivalents
0
5
10
15
20
25
98 99 00 01 02 03 04 05 06 07 08 09e 10f
Mil
lio
n B
ales
0
1
2
3
4
5
Mil
lio
n M
etri
c T
on
s
U.S. Cotton Textile Imports
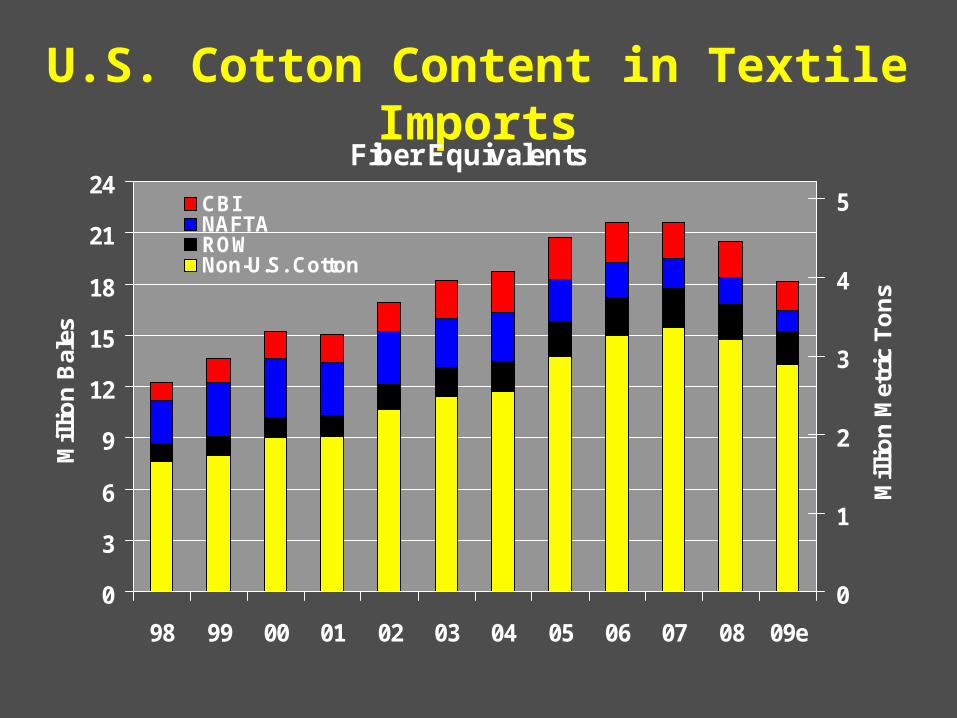
U.S. Cotton Content in Textile ImportsFiber Equivalents
0
3
6
9
12
15
18
21
24
98 99 00 01 02 03 04 05 06 07 08 09e
Mil
lio
n B
ales
0
1
2
3
4
5
Mil
lio
n M
etri
c T
on
s
CBINAFTAROWNon-U.S. Cotton
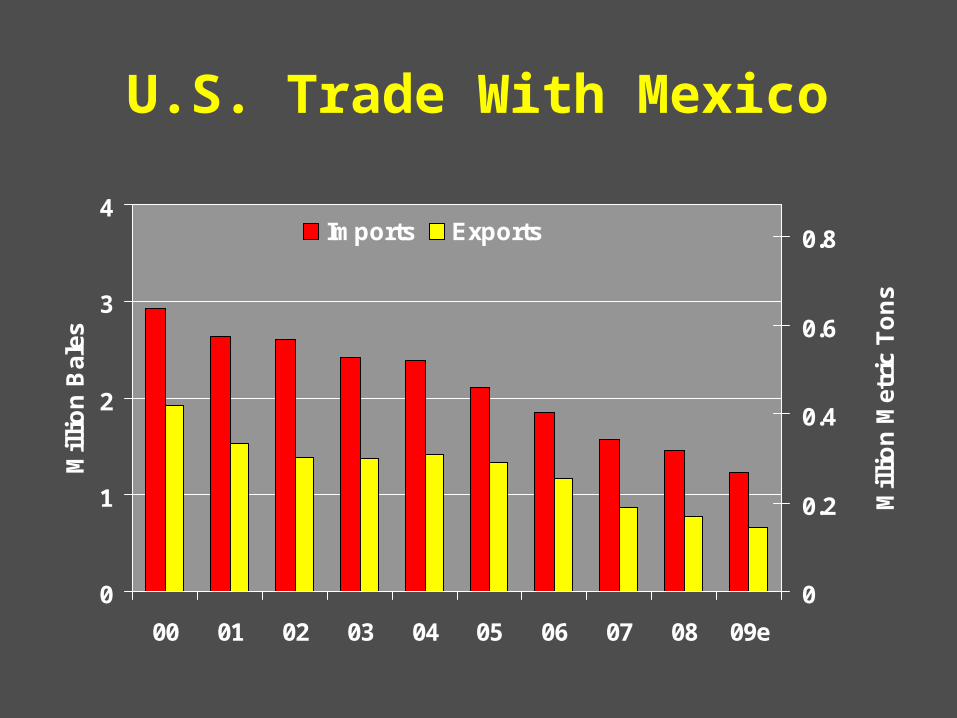
U.S. Trade With Mexico
0
1
2
3
4
00 01 02 03 04 05 06 07 08 09e
Mil
lio
n B
ales
0
0.2
0.4
0.6
0.8
Mil
lio
n M
etri
c T
on
s
Imports Exports
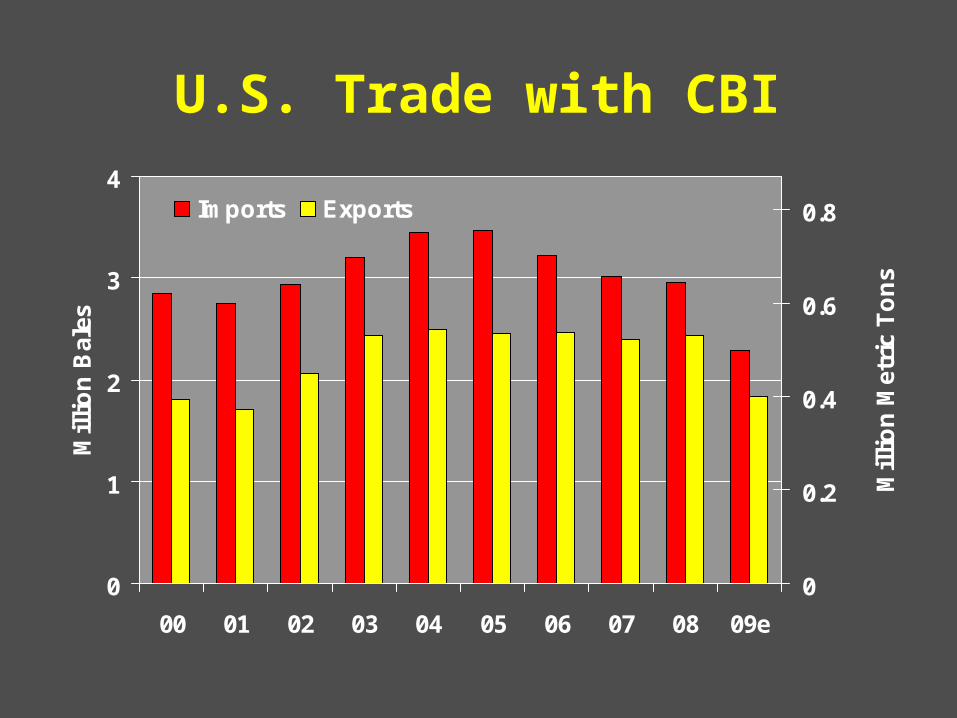
U.S. Trade with CBI
0
1
2
3
4
00 01 02 03 04 05 06 07 08 09e
Mil
lio
n B
ales
0
0.2
0.4
0.6
0.8
Mil
lio
n M
etri
c T
on
s
Imports Exports
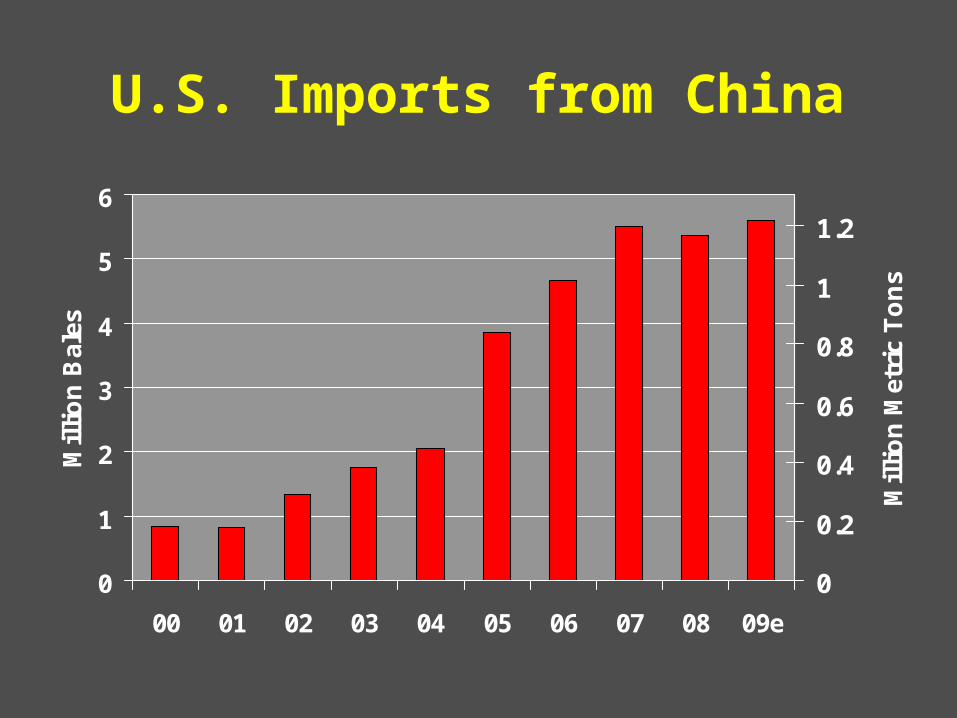
U.S. Imports from China
0
1
2
3
4
5
6
00 01 02 03 04 05 06 07 08 09e
Mil
lio
n B
ales
0
0.2
0.4
0.6
0.8
1
1.2
Mil
lio
n M
etri
c T
on
s
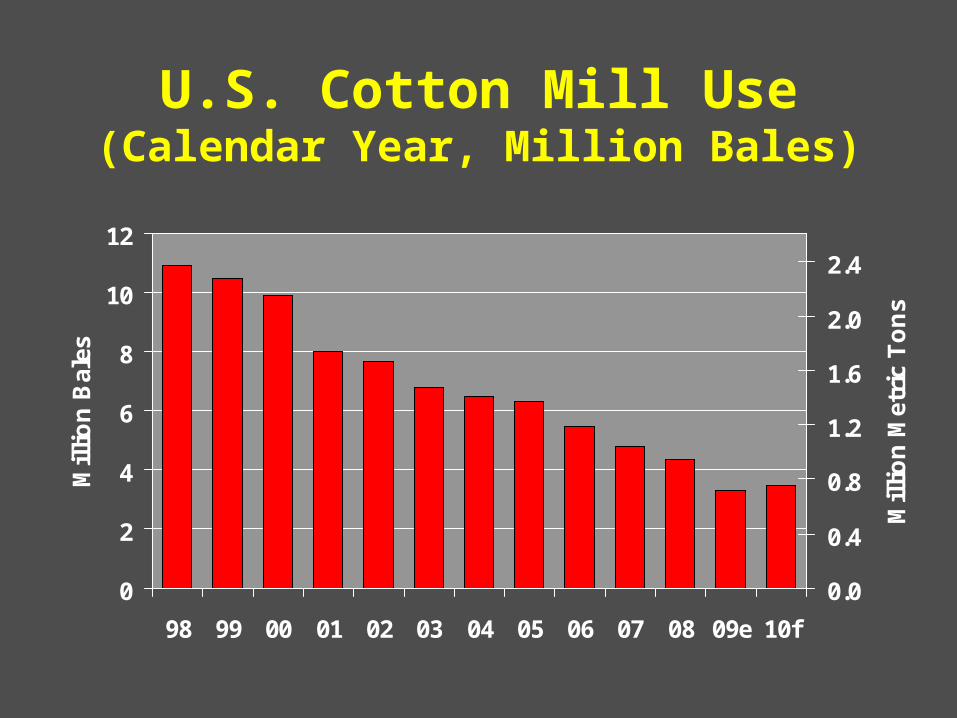
U.S. Cotton Mill Use(Calendar Year, Million Bales)
0
2
4
6
8
10
12
98 99 00 01 02 03 04 05 06 07 08 09e 10f
Mil
lio
n B
ales
0.0
0.4
0.8
1.2
1.6
2.0
2.4
Mil
lio
n M
etri
c T
on
s
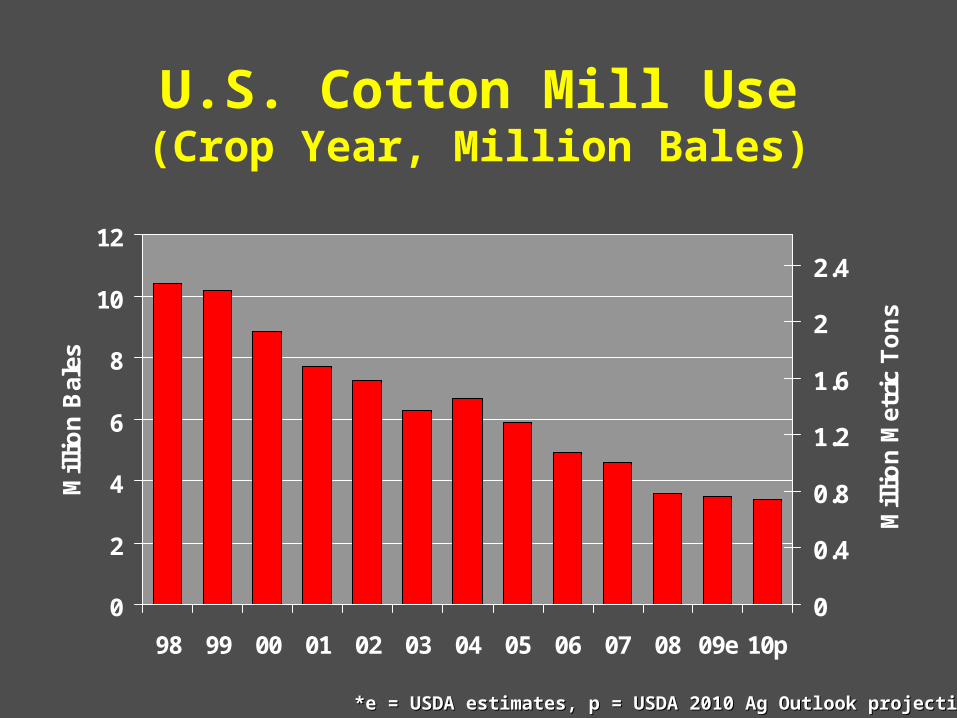
U.S. Cotton Mill Use(Crop Year, Million Bales)
0
2
4
6
8
10
12
98 99 00 01 02 03 04 05 06 07 08 09e 10p
Mil
lio
n B
ales
0
0.4
0.8
1.2
1.6
2
2.4
Mil
lio
n M
etri
c T
on
s
*e = USDA estimates, p = USDA 2010 Ag Outlook projections *e = USDA estimates, p = USDA 2010 Ag Outlook projections
0
5
10
15
20
25
30
98 99 00 01 02 03 04 05 06 07 08 09e 10p
Mil
lio
n B
ales
0
1
2
3
4
5
6
Mil
lio
n M
etri
c T
on
s
Exports Mill Use Production
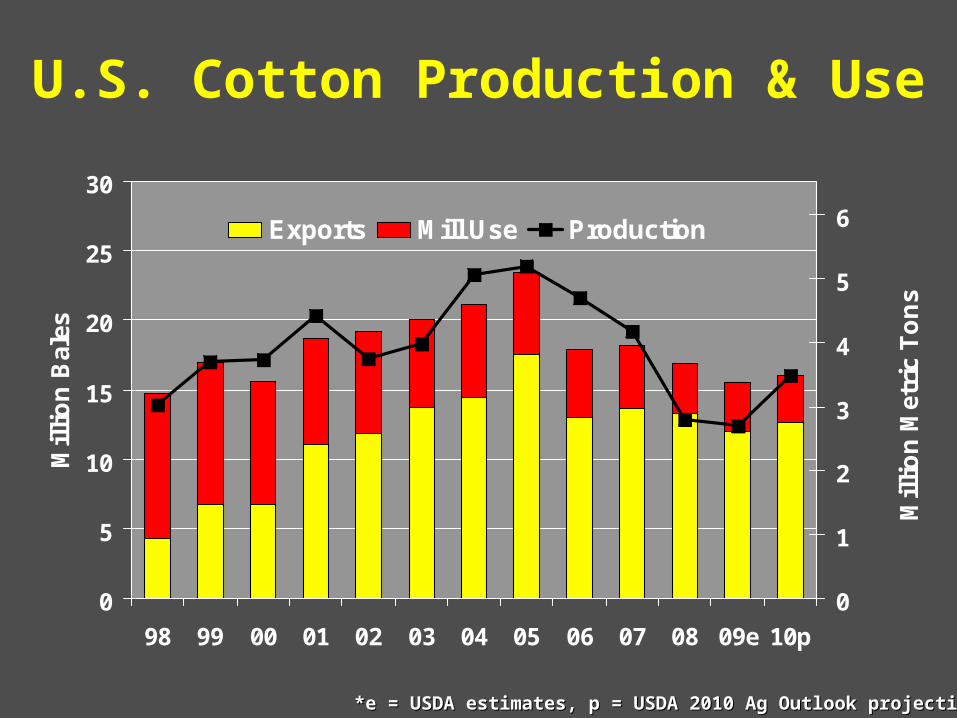
U.S. Cotton Production & Use
*e = USDA estimates, p = USDA 2010 Ag Outlook projections *e = USDA estimates, p = USDA 2010 Ag Outlook projections
The World Market & U.S. Cotton Exports
-10
0
10
20
30
40
50
60
70
97 98 99 00 01 02 03 04 05 06 07 08 09e
Mil
lio
n B
ales
-2.2
-0.2
1.8
3.8
5.8
7.8
9.8
11.8
13.8
Mil
lio
n M
etri
c T
on
s
Net Imports Production Use Stocks
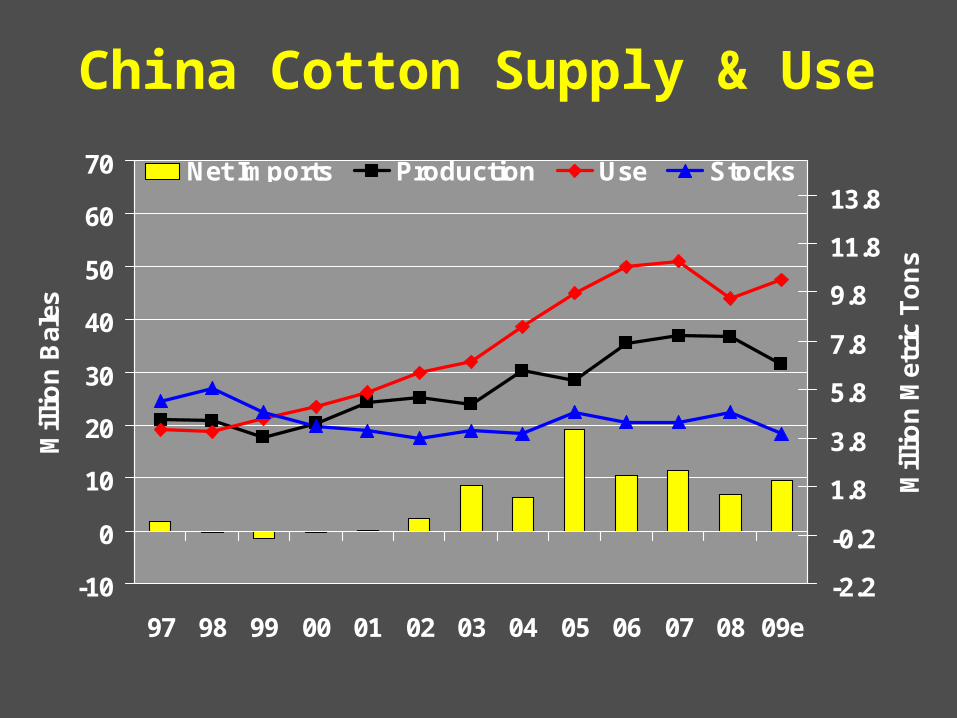
China Cotton Supply & Use
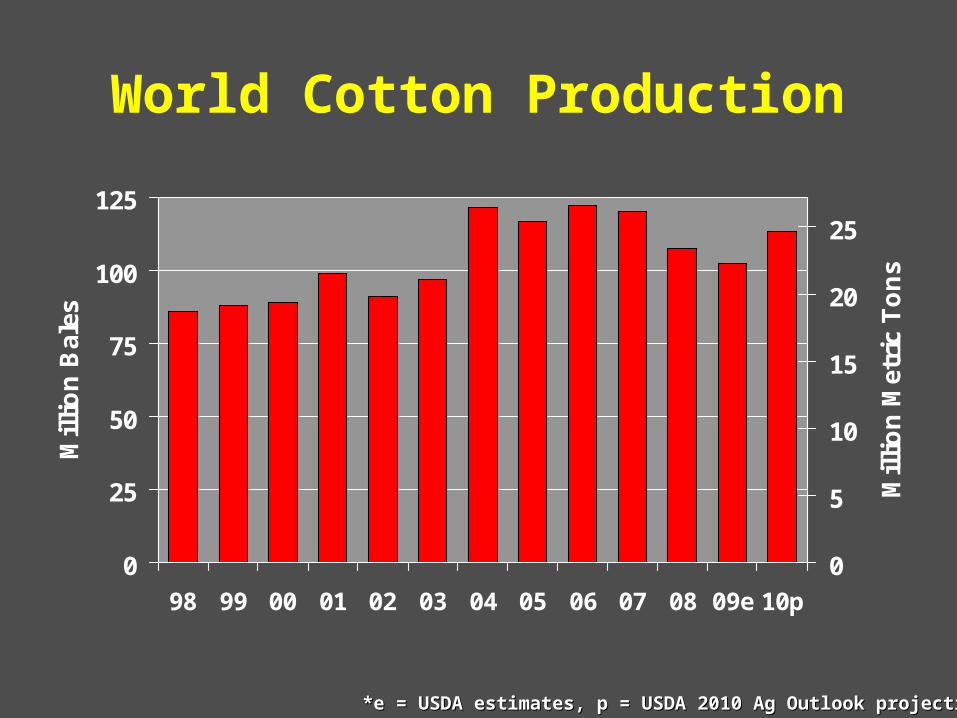
World Cotton Production
0
25
50
75
100
125
98 99 00 01 02 03 04 05 06 07 08 09e 10p
Mil
lio
n B
ales
0
5
10
15
20
25
Mil
lio
n M
etri
c T
on
s
*e = USDA estimates, p = USDA 2010 Ag Outlook projections*e = USDA estimates, p = USDA 2010 Ag Outlook projections
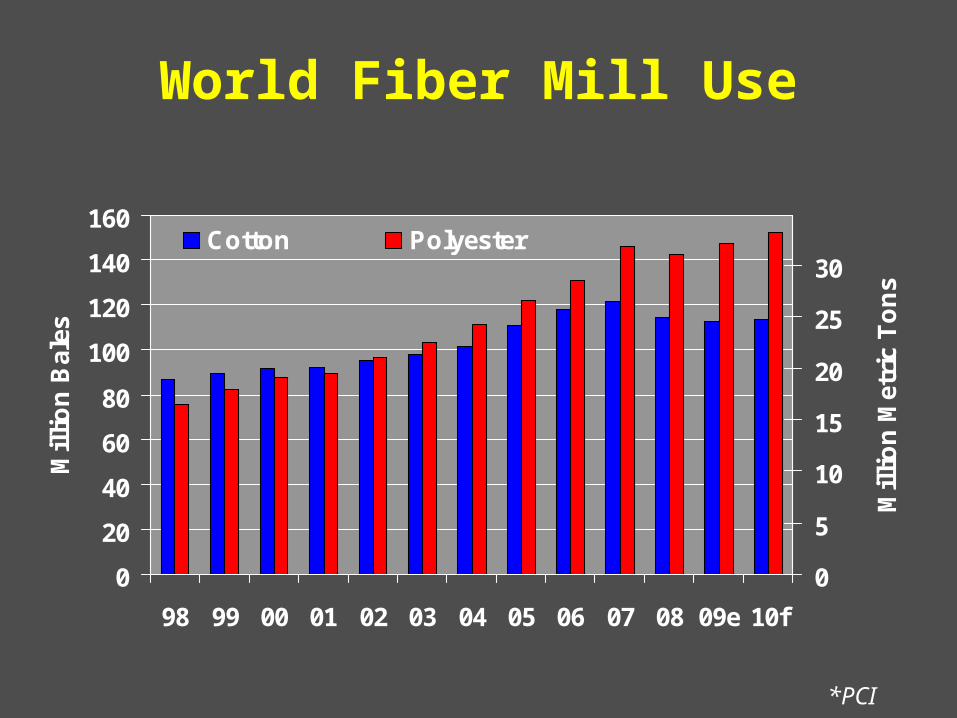
0
20
40
60
80
100
120
140
160
98 99 00 01 02 03 04 05 06 07 08 09e 10f
Mil
lio
n B
ales
0
5
10
15
20
25
30
Mil
lio
n M
etri
c T
on
s
Cotton Polyester
World Fiber Mill Use
*PCI
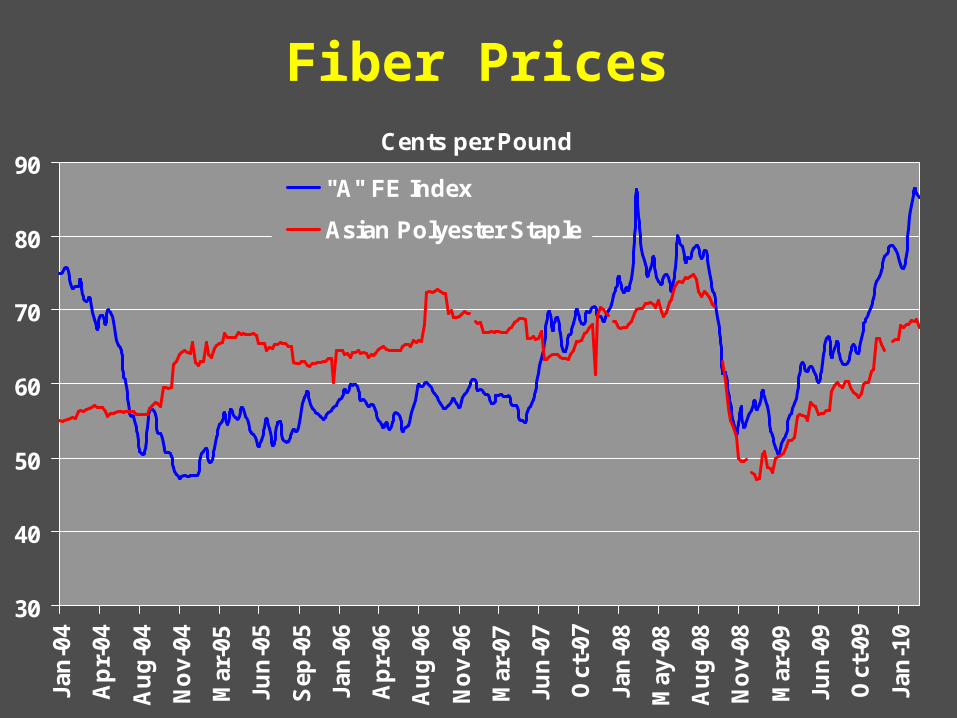
Cents per Pound
30
40
50
60
70
80
90
Jan
-04
Ap
r-04
Au
g-0
4
No
v-04
Mar
-05
Jun
-05
Sep
-05
Jan
-06
Ap
r-06
Au
g-0
6
No
v-06
Mar
-07
Jun
-07
Oct
-07
Jan
-08
May
-08
Au
g-0
8
No
v-08
Mar
-09
Jun
-09
Oct
-09
Jan
-10
"A" FE Index
Asian Polyester Staple
Fiber Prices
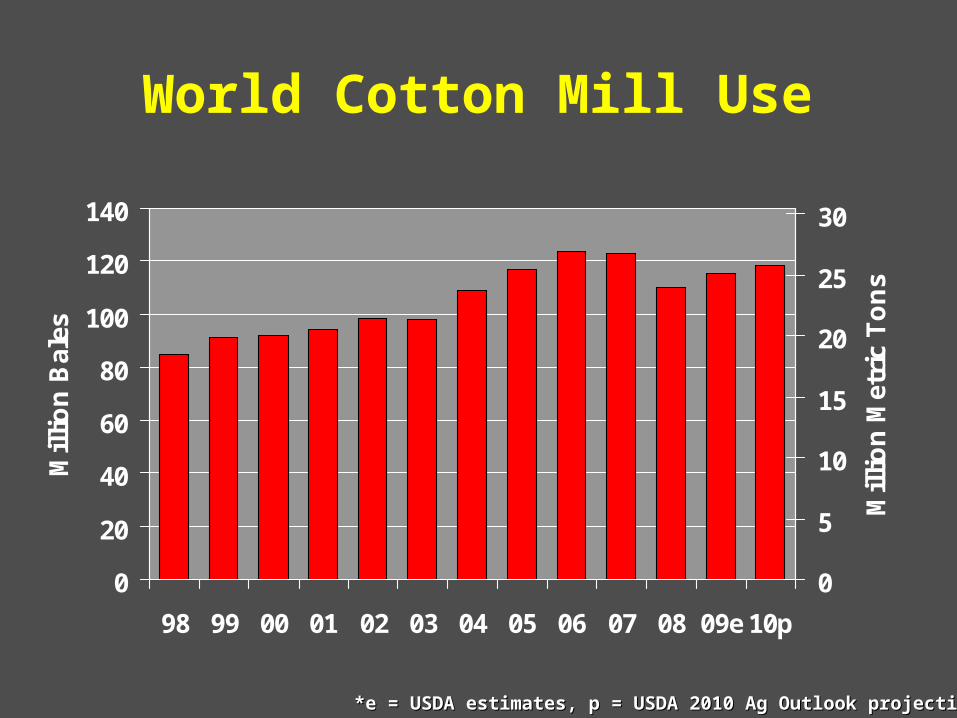
World Cotton Mill Use
0
20
40
60
80
100
120
140
98 99 00 01 02 03 04 05 06 07 08 09e 10p
Mil
lio
n B
ales
0
5
10
15
20
25
30
Mil
lio
n M
etri
c T
on
s
*e = USDA estimates, p = USDA 2010 Ag Outlook projections *e = USDA estimates, p = USDA 2010 Ag Outlook projections
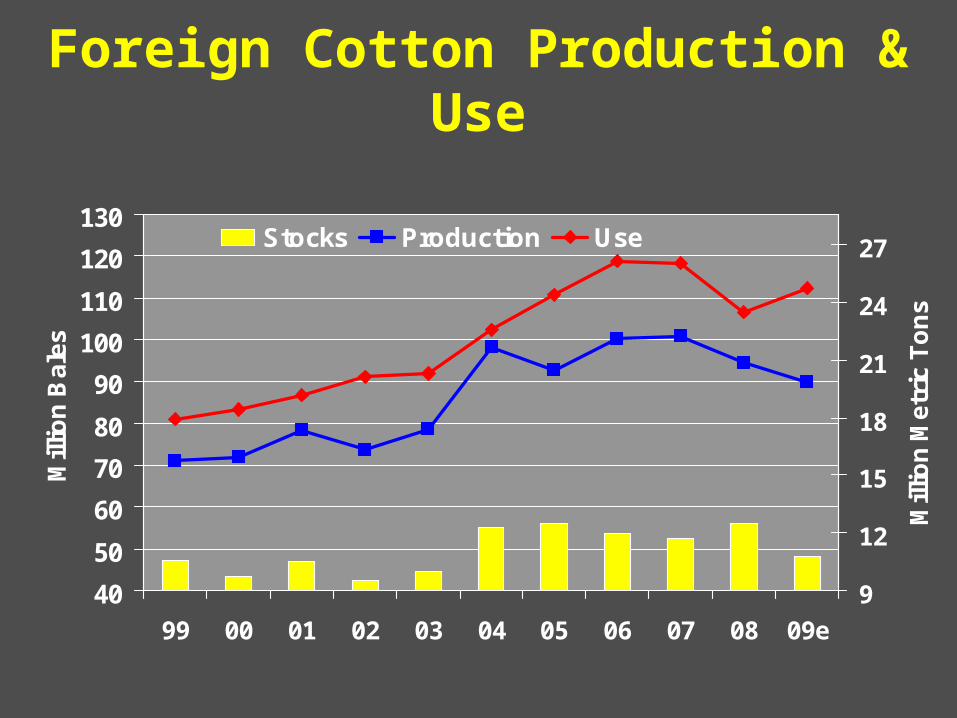
40
50
60
70
80
90
100
110
120
130
99 00 01 02 03 04 05 06 07 08 09e
Mill
ion
Ba
les
9
12
15
18
21
24
27
Mill
ion
Me
tric
To
ns
Stocks Production Use
Foreign Cotton Production & Use
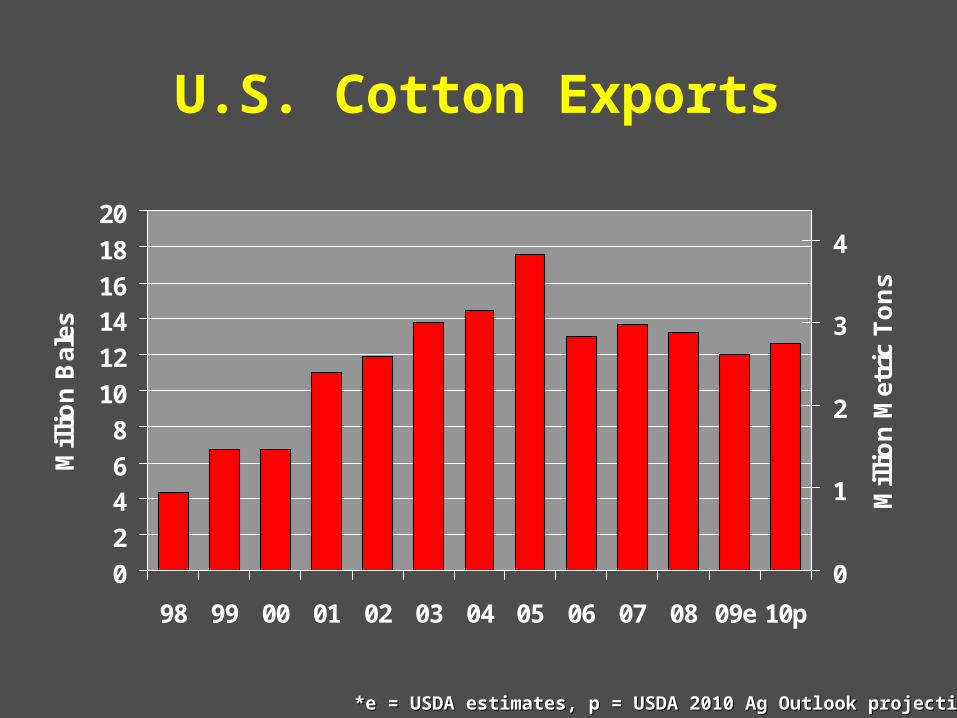
U.S. Cotton Exports
0
2
46
8
10
12
1416
18
20
98 99 00 01 02 03 04 05 06 07 08 09e 10p
Mil
lio
n B
ales
0
1
2
3
4
Mil
lio
n M
etri
c T
on
s
*e = USDA estimates, p = USDA 2010 Ag Outlook projections *e = USDA estimates, p = USDA 2010 Ag Outlook projections
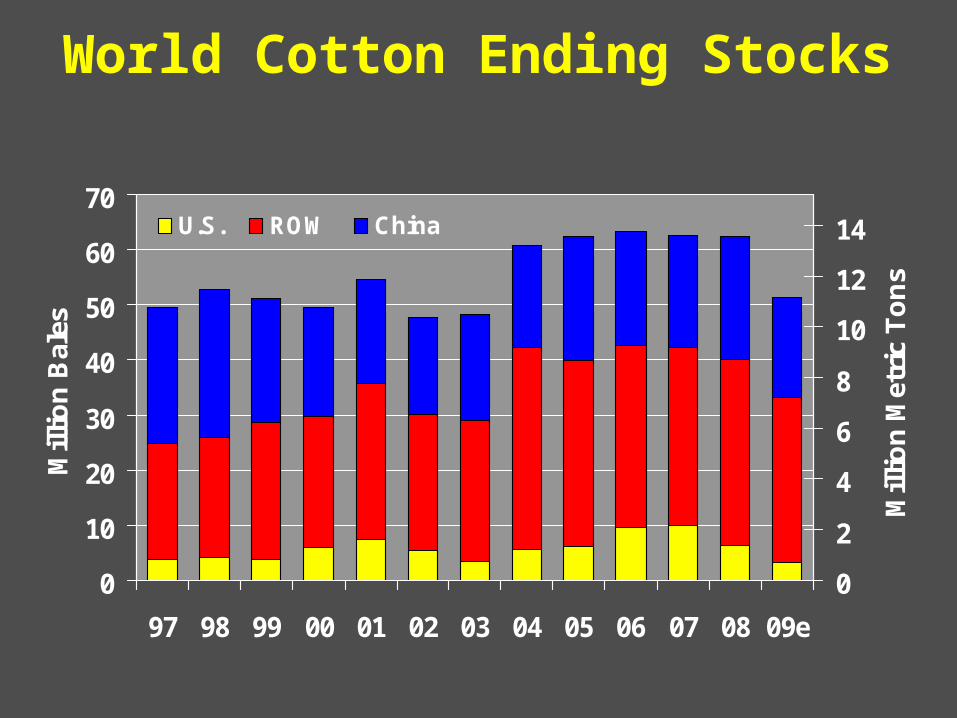
World Cotton Ending Stocks
0
10
20
30
40
50
60
70
97 98 99 00 01 02 03 04 05 06 07 08 09e
Mil
lio
n B
ales
0
2
4
6
8
10
12
14
Mil
lio
n M
etri
c T
on
s
U.S. ROW China
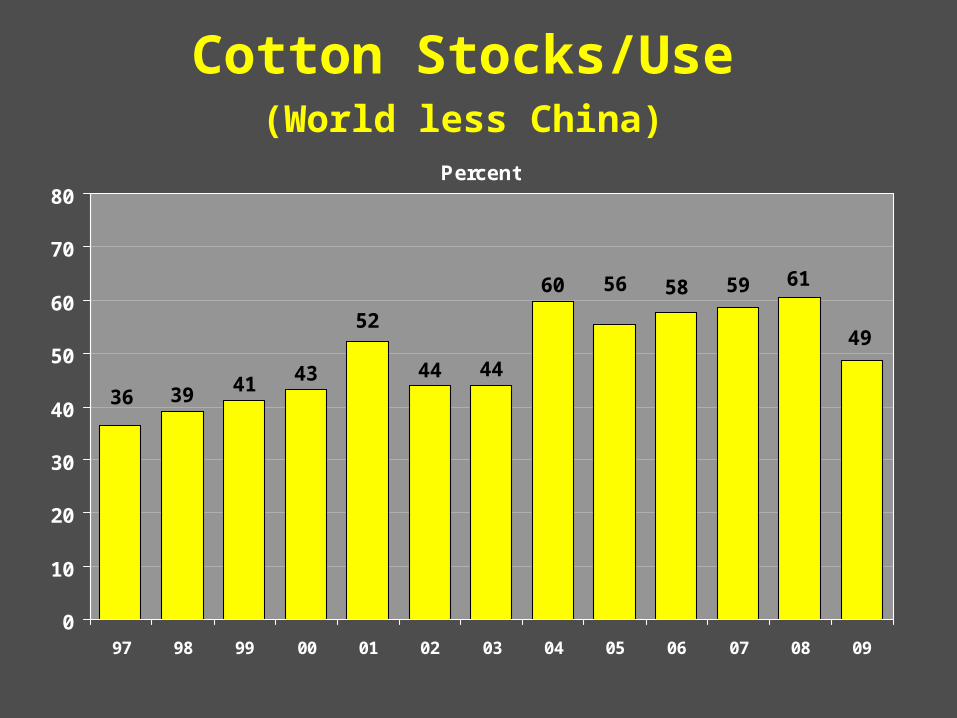
39 4144
3644
52
43
58
49
61595660
0
10
20
30
40
50
60
70
80
97 98 99 00 01 02 03 04 05 06 07 08 09
Percent
Cotton Stocks/Use (World less China)

U.S. Supply and DemandMillion Bales
Beginning Stocks 6.34 3.20Production 12.40 16.00Imports 0.01 0.00
Total Supply 18.74 19.20
Mill Use 3.50 3.40Exports 12.00 12.60
Total Offtake 15.50 16.00
Ending Stocks 3.20 3.20Stocks-to-Use Ratio 20.6% 20.0%
2009/10e* 2010/11p*
*e = USDA estimates, p = USDA 2010 Ag Outlook projections with stocks adjusted to reflect March WASDE*e = USDA estimates, p = USDA 2010 Ag Outlook projections with stocks adjusted to reflect March WASDE
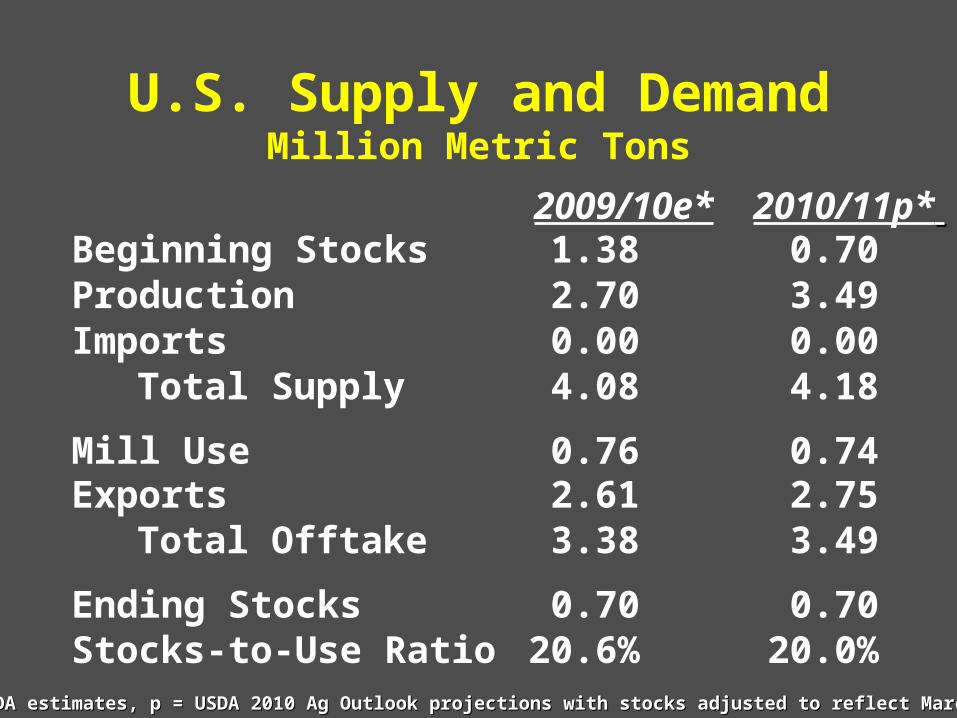
U.S. Supply and DemandMillion Metric Tons
Beginning Stocks 1.38 0.70Production 2.70 3.49Imports 0.00 0.00
Total Supply 4.08 4.18
Mill Use 0.76 0.74Exports 2.61 2.75
Total Offtake 3.38 3.49
Ending Stocks 0.70 0.70Stocks-to-Use Ratio 20.6% 20.0%
2009/10e* 2010/11p*
*e = USDA estimates, p = USDA 2010 Ag Outlook projections with stocks adjusted to reflect March WASDE*e = USDA estimates, p = USDA 2010 Ag Outlook projections with stocks adjusted to reflect March WASDE
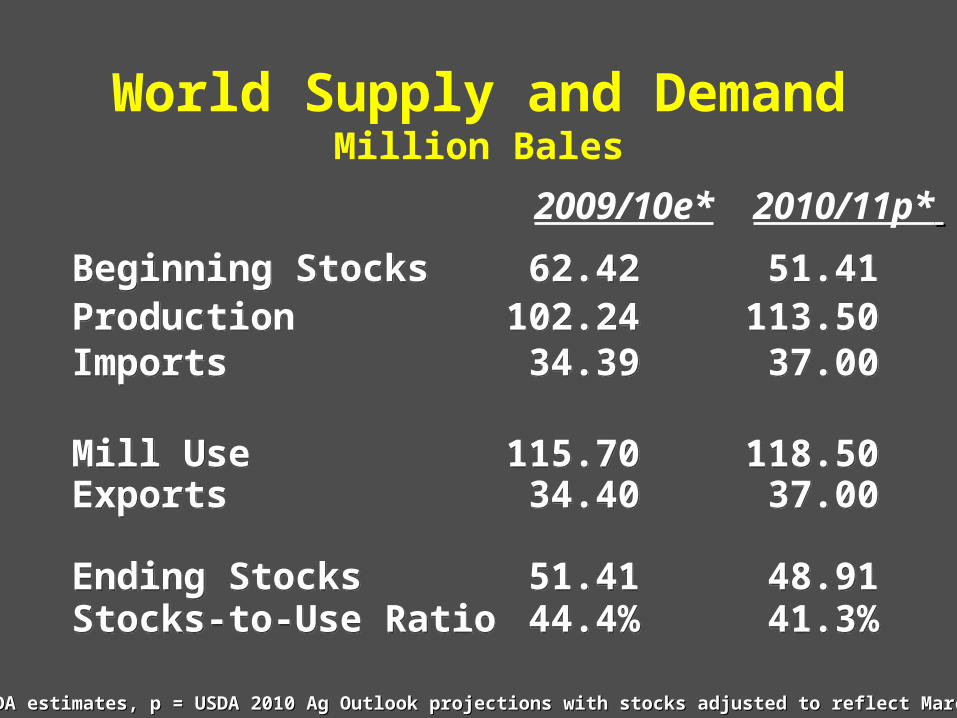
Beginning Stocks 62.42 51.41Production 102.24 113.50Imports 34.39 37.00
Mill Use 115.70 118.50Exports 34.40 37.00
Ending Stocks 51.41 48.91Stocks-to-Use Ratio 44.4% 41.3%
Beginning Stocks 62.42 51.41Production 102.24 113.50Imports 34.39 37.00
Mill Use 115.70 118.50Exports 34.40 37.00
Ending Stocks 51.41 48.91Stocks-to-Use Ratio 44.4% 41.3%
World Supply and DemandMillion Bales
2009/10e* 2010/11p*
*e = USDA estimates, p = USDA 2010 Ag Outlook projections with stocks adjusted to reflect March WASDE*e = USDA estimates, p = USDA 2010 Ag Outlook projections with stocks adjusted to reflect March WASDE
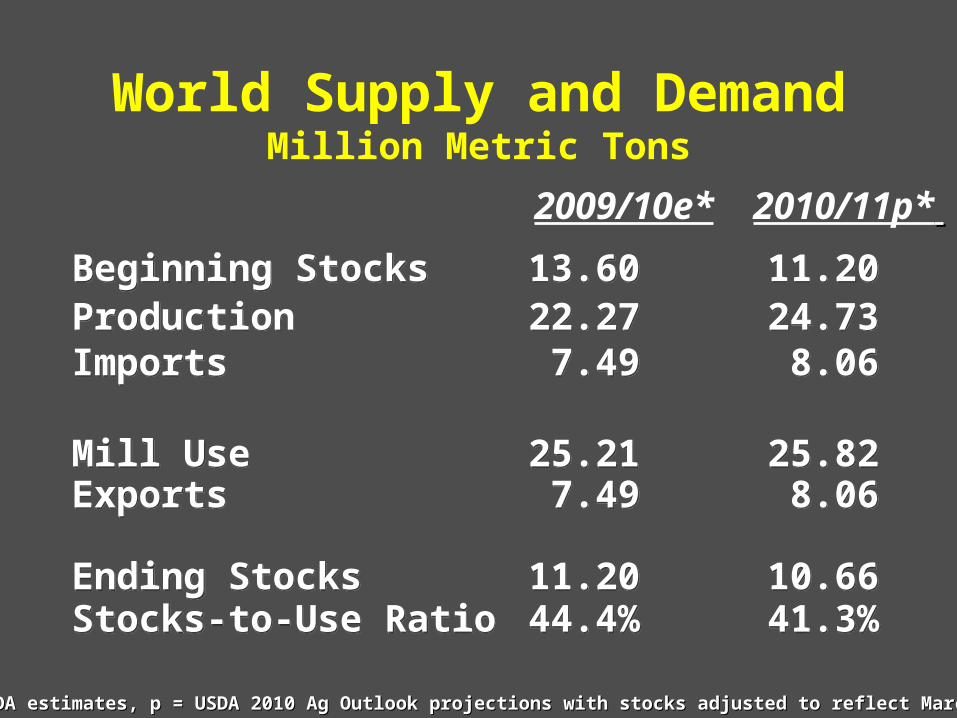
Beginning Stocks 13.60 11.20Production 22.27 24.73Imports 7.49 8.06
Mill Use 25.21 25.82Exports 7.49 8.06
Ending Stocks 11.20 10.66Stocks-to-Use Ratio 44.4% 41.3%
Beginning Stocks 13.60 11.20Production 22.27 24.73Imports 7.49 8.06
Mill Use 25.21 25.82Exports 7.49 8.06
Ending Stocks 11.20 10.66Stocks-to-Use Ratio 44.4% 41.3%
World Supply and DemandMillion Metric Tons
2009/10e* 2010/11p*
*e = USDA estimates, p = USDA 2010 Ag Outlook projections with stocks adjusted to reflect March WASDE*e = USDA estimates, p = USDA 2010 Ag Outlook projections with stocks adjusted to reflect March WASDE
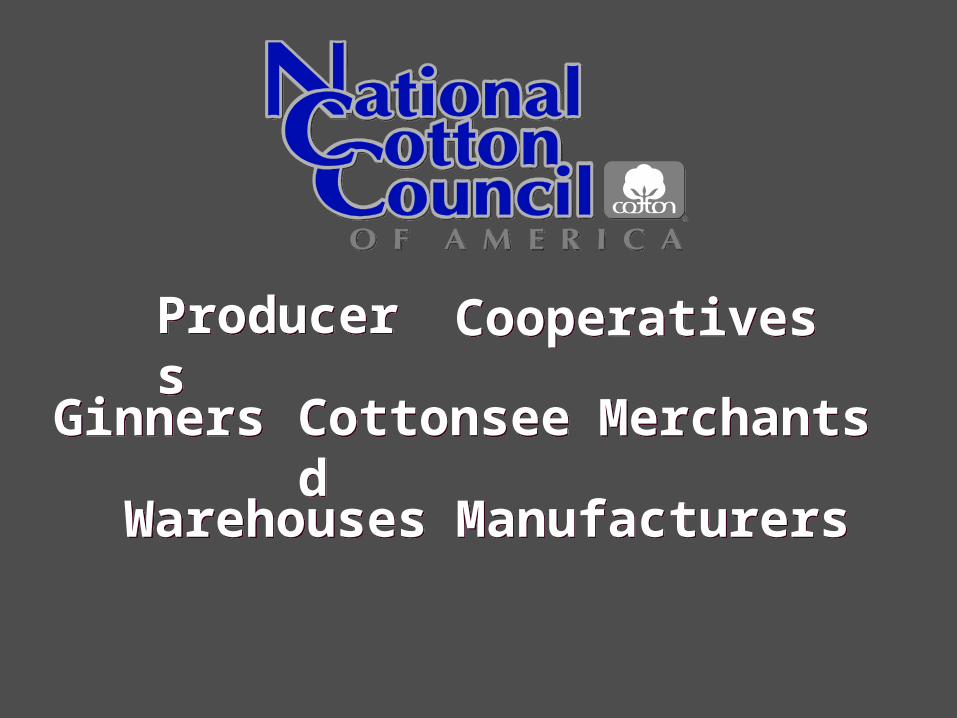
MerchantsMerchantsGinnersGinners CottonseedCottonseed
ProducersProducers
CooperativesCooperatives
WarehousesWarehousesManufacturersManufacturers