Embed Size (px)
Citation preview

Contract Report HL-93-1March 1993
US Army Corps AD"A265of Engineers 781Waterways Experiment l!lI'IhIi'! 'Iit'!'i IIIIStation
Flood Control Structures Research Program
Velocity and Scour Predictionin River Bends
by Colin R. ThorneUniversity of Nottingham
Steven R. AbtColorado State University
DTICELE2ýF. E
JUN 16 1993 LE
Approved For Public Release; Distribution Is Unlimited
93-13518
Prepared for Headquarters, U.S. Army Corps of Engineers

Flood Control Structures Contract Report HL-93-1
Research Program March 1993
Velocity and Scour Predictionin River Bends
by Colin R. Thorne
University of NottinghamDepartment of GeographyUniversity ParkNottingham, England NG7 2RD
Steven R. Abt
Civil Engineering DepartmentEngineering Research CenterColorado State UniversityFort Collins, CO 80523
I e~siorn For
S CRA&IK•iC iAJ3
jBy -. ..-------------
D; t ib tton
Availability Codes
Avail and j orDist Special
Final report 4Approved for public release; distribution is unlimited
VrC C~j*•a ' IN SPECT ED .
Prepared for U.S. Army Corps of EngineersWashington, DC 20314-1000
Monitored by Hydraulics LaboratoryU.S. Army Engineer Waterways Experiment Station3909 Halls Ferry Road, Vicksburg, MS 39180-6199
Under Work Unit 32544

US Army Corpsof Engineers N
I :Waterways Experiment SainCtlgn-nPbiainDt
wyExemetStation .
NF WAT ERA10NII©r" TTO
•CAHAMS FRRYROA
Watthouerbay k inperivemend Satind Analytica nd-i emPiricalo prDictioa fsorpo et n o
cTione Coin m R. bends"
1.RVerochtyannes 2.scour (rdit ydnrauli engineer Coing 3. STroe[amfo Stveloiy 4. Mbpepandring riveU.SI b, See .I.Uie tts Army. Corps of Engineers.;mnioe bIyrll.sLbraoy U.S. Army Engineer WtrWaeways Experiment Station. I.FodCnrlSrcue eerhPorm .Tte I
re pot ( . Army ;U2.rcm. -- S.ontract rep erimen Sain3-
TA7ONE W34c noHL-93-Watthouerwbays Experime ent Satind AnalytngicaPulanepricato prDactao fsorpo et n
cThorne Coin madR.bns
Velociter cannels.2cour prditinnriulir bendsineerCoin R. SThrne(and]o Stvenoiy R. MpeparederfngrvUr.SL bSee . t ntdSae. Army. Corps of Engineers; moioedb ydalcsLbraoy U.S. Army Engineer WtrWaeways Experiment Station. I.FodCnrlSrcue eerhPorm .Tte I
Thi eotcnit ftorprsb h uhr nitled "Estimation of velocity and shear stress a h ue aki ie ed.VI il:Aayiaathouebakiriebed"ad"nltcland empirical prediction of scour pool depth and locain- e;urbns.VI.Sre:Cnrc
Waepot(..Am ;q•=•,;trways Experiment Station. IV FloHL-93-1.tre eeac rorm V ile I
TA7 W34c no.HL-93-1

PREFACE
The two studies reported herein were performed at Colorado State University, Fort Collins,
CO, and the University of Nottingham, Nottingham, England, under contract to the US Army
Engineer Waterways Experiment Station (WES) during the period October 1989 to June 1992.
This investigation was sponsored by the Headquarters, US Army Corps of Engineers
(HOUSACE), under the Flood Control Structures Research Program as part of Civil Works
Investigation Work Unit No. 32544, "Riprap Toe and End Section Design," under HQUSACE
Program Monitor, Mr. Tom Munsey.
This investigation was accomplished under the direction of Messrs. F. A. Herrmann, Jr.,
Director of the Hydraulics Laboratory (HL), WES; R. A. Sager, Assistant Director of HL; and G.
A. Pickering, Chief of the Hydraulic Structures Division, HL. The Contracting Officer's
Representative was Dr. S. T. Maynord, who was under the direct supervision of Mr. N. R. Oswalt,
Chief of the Spillways and Channels Branch, Hydraulic Structures Division, HL.
At the time of publication of this report, Director of WES was Dr. Robert W. Whalin.
Commander was COL Leonard G. Hassell, EN.

CONTENTS
Page
PR EFAC E ................................................... 1
ESTIMATION OF VELOCITY AND SHEAR STRESSAT THE OUTER BANK IN RIVER BENDS
ANALYTICAL AND EMPIRICAL PREDICTION OF SCOUR POOLDEPTH AND LOCATION IN MEANDER BENDS
2

ESTIMATION OF VELOCITY AND SHEAR STRESS
AT THE OUTER BANK IN RIVER BENDS
prepared for
US Army Engineer Waterways Experiment Station3909 Halls Ferry Road, Vicksburg, Mississippi 39180-6199
prepared by
Colin R. Thome
University of NottinghamDepartment of Geography
University ParkNottingham, England NG7 2RD
and
Steven R. Abt
Civil Engineering DepartmentColorado State University
Fort Collins, Colorado 80523February 1990
DACW39-89-K-0015

SUMMARYBank erosion is a serious problem to river engineers concerned with
channel stabilization and navigation. Severe erosion often occurs at theouter bank in channel bends, where flow velocities adjacent to the bankare elevated due to the effects of curvature on channel flow. Erodingbanks may be stabilized and protected from erosion using riprap. Whenselecting the appropriate size of stone to be used to protect a bank in agiven bend, it is necessary to be able to predict the intensity of flowattack on the bank. This may be represented by either the near bankvelocity oi tho boundary shear stress on the bank. This report deals withthe development of improved methods to predict outer bank velocities andshear stresses. Two approaches are examined. The first uses a statisticaltreatment of observed data from natural and artificial channels toformulate predictive equations for the ratio of depth avaraged longstreamvelocity over the toe of the outer bank and for the shear stress in thatlocation. The second tests two analytical models of bend flow to gaugetheir accuracy and set limits to their applicability in predicting outerbank velocity.
The results show that several factors appear to influence outer bankvelocity at a natural bend. Multivariate equations involving radius ofcurvature to width ratio, relative bend length, width to depth ratio.relative depth and bank angle are proposed to predict the ratio of outerbank toe velocity to average velocity. Simplified equations using only theradius of curvature to width ratio are also proposed. The configuration ofthe channel upstream of the bend is shown to be important, and separateappproaches are formulated for bends downstream of straight andmeandering reaches. For artificial channels Rc/w dominates the analysis,but it is also shown that the mobility of the bed strongly influences theouter bank velocity and shear stress.
Model tests reveal that the model developed by Bridge (1982)consistently predicts the observed outer bank toe velocity to within +/-15%. Errors grow alarmingly for bends with Rc/w values less than 2 andthe model crashes for bends with Rc/w < 1. Odgaard's (1989) model tendedto under predict outer bank velocity by between 5 and 40%. This was thecase because the model did not predict outer bank scouring in bends withbed material coarser than medium sand. However, its application waslimited because it predicted negative depths at the inner bank and crashedfor long bends. In contrast to Bridge's model, Odgaard's model remainedstable at very low Rc/w bends, errors remaining in the 5 to 40% range.
It is recommended that the results of this study be further tested andverified. However, on the basis of the results to date, the model developedby Bridge is recommended for use in bends with Rc/w valus greater than 2.For very tight bends, Odgaard's model shows strong potential, but it mustbe modified to allow greater mobility and scour of coarse bed materials.
1

PREFACE
This project was sponsored by the Hydraulics Laboratory at the US Army EngineerWaterways Experiment Station (WES). The project was monitored by Dr. Steve Maynord. Dr.Maynord aiso made available field and laboratory data which were very useful in carrying out thework. Helpful advice was given by Mr. Randy Oswalt at WES on a number of occasions. Dataassimilation and reduction were undertaken by a research assistant, Sue Reed, with greatdiligence and skill. The menu-driven programming of the Bridge and Odgaard bend flow modelswas performed by Andy Markham in the course of his graduate studies. The PrincipalInvestigators wish to record their thanks to each of these individuals for their valuablecontributions to the project.
2

TABLE OF CONTENTS
SUMMARY 1
PREFACE 2
MAIN TEXT
Introduction 5
Objectives 8
Approaches Adopted 8
Data-Based Approach 9
Sources of Data 9Data base 9Examination of Data 17
Effect of Channel Shape 22Effect of Bank Roughness 22Effect of Bedforms 22Effect of Entrance Conditions 28Effect of Bend Length 33Effect of Aspect Ratio 36Effect of Relative Depth 41Effect of Oute. Bank Angle 41Main Points 52
Analysis of Data 53Prediction of Outer Bank Velocity in Open Channel Bends 53
Natural Rivers: Straight Approach Conditions 54Natural Rivers: Meandering Approach Conditions 54Trapezoidal and Rectangular Channels 57Laboratory Channels with Mobile Beds 57Laboratory Channels with Immobile Beds 57
Prediction of Outer Bank Shear Stress 60Laboratory Channels with Mobile Beds 60Laboratory Channels with Immobile Beds 60
Modeling Approach 63
Background 63Basic Principles of Numerical Modelling of Bend Flow 64Review of Important Bendflow Models 66
3

Mo .els Used 69Results of Model Applications 70Analysis of Results 70Prediction of Outer Bank Velocity 74
Conclusions -'4
Recommendations 74
REFERENCES ON RVER MEANDER FLOW 76
APPENDIX A - SOURCES OF DATA USED IN THIS PROJECT 86
APPENDIX B - ADDITIONAL PARAMETERS USED IN 90MODELING APPROACH
4

MAIN TEXT
Introduction
Serious bank erosion often occurs at the outer bank in meander bends.This erosion is driven by the natural tendency of river meanders toincrease in amplitude and migrate downstream through time. The severityof flow attack on the bank is known to be controlled by the hydraulics offlow adjacent to the bank and especially the propensity for scour in thearea of the bank toe. Cnversely, the mechanics of failure and thesequence of events involved in the erosion, collapse and basal clean-outphases of bank retreat are closely related to the engineering properties ofthe bank materials and the bank stratigraphy. But the overall rate ofretreat of the bank is known to be determined by the capacity of thenear-bank flow to entrain and remove slumped bank materials, whilecontinuing to erode the bank and t ,gger further failures (Thorne, 1982;Lapointe and Carson, 1986).
The importance of bank attack and toe scour by the flow have longbeen recognised, and their intensity has been found to be a function of theooundary shear stress acting on the bed and bank at the outer bank in ameander. But in practical terms the boundary shear stress is aparticularly difficult parameter to predict accurately. Indeed, nonespecialists even find it difficult to visualize boundary shear stress.Consequently, it is desirable to relate the severity of bank attack and toescour to less obscure flow descriptor, such as near-bank velocity. Somemodelers even prefer to relate bank attack and retreat rates to near bankvelocities instead of bank shear stress (Odgaard, 1990). Theory showsthat near-bank velocity and boundary shear stress are in an, case closelyrelated, although the relation between them is neither simple, or easilyquantified for real world situations.
The preferred treatment to stabilize and protect the outer bank in ameander bend uses a blanket of loose stone called riprap. When usingriprap it is necessary to select the appropriate size for the stone on thebasis of the intensity of flow attack as represented by either the boundaryshear stress on the outer bank or the flow velocity over the toe of theouter bank. Presently, this achieved using semi-empirical diagrams (Figs.1 and 2).
The first (Fig. 1) predicts the ratio of velocity over the outer banktoe to average velocity in the approach channel (VtoeNavg) as a functionof the radius of curvature to width ratio for the bend (Rcfw). The second(Fig. 2) predicts the ratio of outer bank shear stress to average boundaryshear stress in the approach channel (tb/to) as a function of the radius cf
curvature to width ratio for the bend.
5

Fig. 1 WES design diagram for prediction of outer bank velocity at a bend
VTOE.6
TRCPNTERLANE RADIUS
R WANTER-SUFAE RAIUSh
Fig. 2 WES design diagram for prediction of outer bank shear at a bend
sa 3. 0 .u Ce .... a fifL.aar2Z.4
o
A .. '? V, $-CT0 C... C"L. Ait, SI
so 24,1 #-iOCT. CO C.- Ptf It -
o* CE"?ga.LO 110".%11at as0
IT S Afl.Ct *cu0UC.0: SIt..*0t A *RoAC" CIAl"tti
MAXIMAUM SHEAR AT CHANNEL SENDS
6

The velocity diagram uses a logarithmic scale for the independentvariable (Rc/w) and a linear scale for the dependent variable (VtoeNavg).Two lines are plotted, corresponding to natural channels (withasymmetrical cross-sections) and trapezoidal channels (with symmetricalcross-sections), respectively. The ratio of outer bank to mean velocity ismarkedly higher in natural than trapezoidal channels. Plotted as straightlines on a semi-log graph, these lines indicate logarithmic relationsbetween (Rc/w) and (Vtoe/Vavg) for the two types of channel. Theequations of the lines are not given, but analysis of the graph suggeststhat they approximate to:
Natural Channels
V7R
VAVGl = 1.75 - 0.5 log (5-) (1)
Trapezoidal Channels
VMV -oG = 1.6- 0.71 log I.--) (2)VAVGw
The shear stress diagram uses logarithmic axes for both independent(Rc/w) and dependent (tb/to) variatbles. Again, two lines are plotted, this
time corresponding to smooth and rough channels. All data appear to comefrom laboratory flumes, no data from natural rivers are included. Roughchannels are found to have significantly higher stress ratios than smoothchannels, for the same value of (Rc/w), although the line for roughchannels is fitted to only two points and is heavily extrapolated. Plottedas straight lines on log-log graph, these lines indicate power functionrelations between (Rc/w) an-! (tb/to). The equation for the smooth channel
line is given on the diagram as:-
tb (R "0"5
- . Z265 -(3)to
No equation for the rough channel line is given, but examination of thegraph suggests that the line may be described by:-
tb3.R -0.5
t
While either diagram can give reasonable results when used with
sound engineering judgement and with careful consideration of the limits
7

to its applicability, it is nonetheless desirable to develop improvedprocedures that better account for the parameters of flow hydraulics,boundary roughness and channel geometry that are believed to influenceflow intensity at the outer bank in a meander bend. Several other aspectsof bend geometry, channel shape and boundary roughness have been shownto influence bend flow patterns significantly on both theoretical andpractical grounds (Thorne, 1978; Hooke and Harvey, 1983; Rais, 1984;Lapointe and Carson, 1986; Pizzuto, 1987; Thorne and Osman, 1988;Odgaard, 1989), and a methood which uses only a single parameter tocharacterize the bend, ignoring all others, cannot account for tE'aseeffects.
Objectives
The objectives of this study are to develop improved analyticaltechniques to estimate the velocity and shear stress distributions at theouter bank in a river bend. The approach adopted is to examine thesedistributions as functions of the planform and cross-sectional geometryof the bend, the nature of the bed and bank materials, and the planform andaverage flow parameters in the approach channel.
The primary objective is to concentrate on defining maximum valuesof depth averaged velocity that occur in the bend along the outer bank (thatis over the toe of revetted banks). The second aim is to produce theequivalent relationships for boundary shear stress at the outer bank in ameander bend.
Emphasis is placed on basing the relationships on parameters readilyavailable to design engineers, rather than variables such as "centerlinemean velocity" which although theoretically significant, are usuallyunkown and which would themselves be difficult to predict or estimate.
Approaches Adopted
Broadly, two approaches have been used. The first is based orstatistical analysis of a data base on bend flow assembled from publishedand unpublished reports of studies made on rivers and in laboratory flumesall over the world. The second attempts a more theoretical approach,being based on application of three recently developed mathematicalmodels of bend flow hydraulics. There are advantages and disadvantagesto both approaches and these are discussed in the sections concerned withthe Final Discussion and Conclusions.
8

Data-Based Approach
Sources of Data
Data were obtained from a number of diverse sources. The sourcesactually used are listed in Appendix A. The initial data came from studiesundertaken by the Principal Investigators and their colleagues at ColoradoState University, London University, UK and the University of East Anglia,UK. These data were readily to hand and included all of the parametersnecessary for this analysis. They required only a little time and effort toassemble.
The second source of data was from researchers known to be workingon bend flow problems and with whom the Principal Investigators havegood working relationships. In response to requests from the Pi's or theirresearch associates, copies of research reports and published articlescontaining full data sets were supplied by these individuals, mostly in atimely fashion. This allowed easy extraction of the relevant parameters.In cases where a particular measurement was not reported, telephonecalls to the original researchers usually elicited the missing information.
The third source of data was from papers published in professionaland learned journals. This proved to be the least satisfactory source.Journal papers almost never contain full data sets, and published summarydiagrams of the distribution of parameters such as depth-averagedvelocity are too small to be used for data extraction with any degree ofaccuracy or precision. The addresses given in articles are oftenincomplete or out of date and telephone and FAX numbers are omitted. Mostauthors were extremely slow to respond to written enquiries sent byordinary mail and some seemed reluctant to part with data at all. Theseproblems led to several promising leads being reluctantly abandoned anddata sets excluded from the analysis.
The data set which has resulted is then not universal in its scope. Itdoes, however, contain only data which the Principal Investigatorsopinions is sound and complete. The range of sizes and types of channelencompassed is large and there is a sufficient number of entirelyindependent data sets to support the statistical analysis. Consequently, itis probable that the addition of a few further data is unlikely tomaterially alter the overall distribution of data or the outcome of theanalyses.
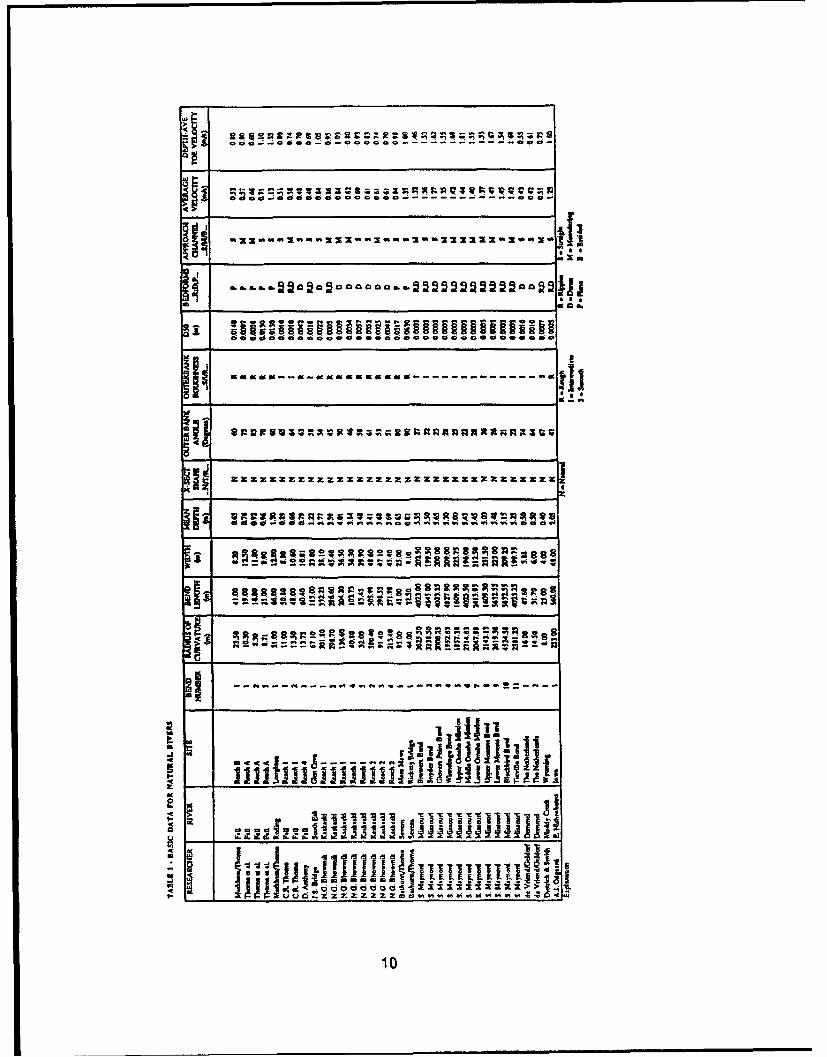
Data base
The basic data assembled in this study are listed in Tables 1, 2 and 3,for Natural Rivers, Trapezoidal Channels and Rectangular Channelsrespectively. The published and unpublished sources of data are listedseparately in the reference section of this report.
9
- - - - - -000 -- - -a o
S!i
----- -- ------------1~t
ql- Rg$~!sao 8: 1 C!ýW A-a
z- -
C mm: ". j ltlll
I I I
10

9P 9
------- -- -- -
c a.
'Mal
0
Ha~
4m~ ~
U, Ca -11

figo~ ~ ~ od c o
P V. P ri
Iiic89
a ;Z 8$AEE R c =K I sR s er
d 6 id 6c
~~r4
ob0 0 0 q
-C.
5,6 i U
uhf dlS0 ___!1 ~ 12

The basic data were used to derive parameters of bend geometry andhydraulic roughness which could affect the pattern of flow through thebend. The derived data are listed in Tables 4, 5 and 6 for Natural Rivers,Trapezoidal Channels and Rectangular Channels respectively.
An important aspect of any experimentally based study is to identifythe range of each variable observed. When applying relationships based onthe experimental results, these ranges must set the limits to theapplicability of the relations. It is highly speculative and very risky toapply any empirical relationship outside the range of data from which ithas been developed and tested. The range of each of the variables is listedin Data Tables 7, 8 and 9 for Natural, Trapezoidal and RectangularChannels, respectively.
13

a.
.. .doo • oa •c . = • .. o o .
0
--- -- -- ---- w ".-
14

TABLE I - DgfRiVD DATA FOR TRAPEZOIDAL CHANNESU
RESEAROWJ - CANNEL. S BEND RdW LJW Wid dubo VU~a HANMBhER 3RS
--- - - -- - RATIO
AJ. Odpard Lab6 mmud Ift Hyd Ra. 1 537 2MU3 1.2 500.0 17AJ. Oped Lab6 aamd WIS 1 5.37 M9.7 24.40 533.3 1.24
WSR" 0) ILL.Dj. 1 2.25 354 W.4 20.5 1.3WSRfT (12) .ILID. 2 2.27 5.36 1.70 20.2 1.MWoR.P OM11 I1.L.S.D 3 2.27 3-56 V)7 202 1.42WESrRIFT H.LZ.D. I SM9 1 19.21 11.0 1.21
WES MFV ILLSD. 2 99 5.23 19.21 11.0 1.19D. Usagel Lab.0mm1 USSR 1 3.75 0.91 5.70 2210. 1.31D. Mawfw LAb.0smmus& ML4 atln 1 3.72 SAS 10.00 290. 2.30D. Muenar L~asmvd WT 1 1.6 1.76 21.33 100.0 2.000. thisefl LAb.Casmd MTr 2 1.25 101 L3 1ISM0 2.30Wat A i~Wale I~b6wm MT= 4 21? 1.31 10.70 11400 1M0IPPW AD,*ikw [AkGlossa WT 7 2.51 262 10.14 700.0 1.7581111-01o4ya lAkcbm 1.24v. lows 1 4.16 6.54 20.10 02OLO 2.09 I.0effl.OiYml LAO.~ad 13.4, IMw 2 W.9 6.23 14M3 1450.0 2.03 2.
Ia.O~m hr- Or1A 0W IPT 1 I t 2.911 3.04 7.95 770.0 1.17 1.40
TABLE f - DERIVED DATA FOR UECTA?4CULAR CHANNELS V.bRESEARCHER, CHANNEL SITE SEN4D YXIM 1.v W/M 450 BEDFRMS VW SHEAR
NUMBE -RJ>.P-STIM3__________RATIO
OnMGM & takb.omus Balsm Iin& 1 0.33 0.4W6 3.000 29200p 12DN~udnbm, Lab.Ohmust Bmairn. 2ss 0.53 M 5.00 1920 ps 1.30
* Lob.Ohuni am. his, 3 M1 044 20.00 9We Is 1.20La wse M W 4 0.13 01?7 10M0 940.0 ps 3.3
vasslvy &old@ UY. hipuim Rad 1.41. 1 3.00 3.15 132.56 PWI 2.36Rames Ranmk~~ii 2 3.00 1.15 9.26 311 p 2.46
* odf 2610,4061111111h6 3 so0 Us1 2.35 205.2 p 2.46I A Ban I, Lab nmi 2.Ank.UZ 1 351 20.93 100 1524 P 1.122ft-v~ am3 ia 1 2.0 1.34 13.3 400.0 D.333Mebwsatat "a Co si ian. 1 430 34.24 2D.00 SSA D 1.30Yklm tal. LAb6 mdw iqm 2 430 2424 11.23 61.1 D 1.22
flows aal. Lab6OrNud up., 3 430 24.4 15.*7 70.0 0 11MSua.4konatal. Lab.00met D.tloIdW 1 5.00 19.35 11.73 117.3 D 1.13Suakuu a al. LI2LC0111104 D2*.1H11m 2 3.00 19.55 25.00 =.2 D 1.27Haile Lab.urnd Upqiula.Ssu 1 2.36 5.77 13.70 243.3 p2.00OAC " Lbtsmed Upiue".Sweim 2 236 5.77 10.53 311.7 1.230Ha*&kLe 2bOwend Upmh. Swaim 3 1.36 5.77 10.37 306? p 250
HalLAb6 Oumud UppMKaSWWM 4 2.36 5.77 7.81 4207 p 1.73arty &Ho LAIL Oswad F.dukkhm, Can 2 100 3.24 &67 2300. p 1.40Bwuy& Ho Lab, Olanud Redasictsm Cal 5 430 1071 U.7 1000. ps lA
wIVY&24O LAIL 0vard Pfua4.ckimCan 7 9.02 9A43 2.22 1500. p 1.40Buy&H* U~k ONOuW PF.4aikkees Cas 9 9.02 9.43 6166 300.0 p 1.310rw. lain, & Lstk 01011d 011H 1 3.65 5.73 11.00 530.0 D 1.31
Kuniady Lab. Chmd UHR 2 7.79 12.24 9.00 530.0 D 2.23M~cswa& 1110 L.Ab Omaud New lnuW~c 1 3.00 3.14 5,00 20.0 p 1.17Mccrs& any LAb6Owemd Newflnuwwick 2 3.00 3.14 5.00 5200Q ps 2.27Na.'. & Towmi Lak Owamed Culpip. Can 2 1.00 237 7.30 57.1 p 1.30
do [Ab6Oasmud caignsycon 2 3.00 3.13 7.30 57.1 p 2.40dViAi& &Koch L.ab.m~ Cho" 1F 2.S0 4.62 1000 2100.0 p 21M
d.VuWald& Rod% LAb Ommaud 1)1 2 2.50 442 20.00 4.3 Is 2.Mdo Vudaid AKea LabOmw"d DdfHy* ~LAI& 1 5.33 MOD0 24L00 25000 P 1.10do Viea d&Koch LAb Oland DeUHy~& uiLabb 2 1.70 12.0 24.00 25000 P 1.25C .LYen LI& 03.uud mat1 I 3.65 5.73 20-03 417.2 P 3.5M.3W.k Ji &rteafIfh LAU Clumia AjhrwA Umiwuky Al 3.42 14,07 13.35 500.0 P 2.27
I~k. AIs. rh Suflur LA& OmuW I Albou Undyoculcy B2 1 3.42 26.0V7 12.130 37M00 I p 1 .20?
15

Table 7 - Range of Variables for Natural Channels
Measured Variables----------------------------------------------------Variable Units Range------------- w---------------------------------------Radius of Curvature meters 8 - 4,525Bend Length meters 16 5,633Width meters 4 - 232Average Depth meters 0.4 - 5.65Outer Bank Angle degrees 21 - 90Outer Bank Roughness - - Rough-IntermediateMedian Bed Material Size millimeters 0.3 - 63Bedforms -- Plane - DunesApproach Channel -- Straight-MeanderingAverage Velocity meters/second 0.42 - 1.47Depth-averaged Toe Velocity meters/second 0.55 - 1.81
Derived Variables
R/w -- 0.75 - 21.6L/w - - 1.45 - 26.9wld - - 9.05 - 46.1d/D50 - - 13.8 - 18,833Vtoe/Vavg -- 1.04- 1.57
Table 8 - Range of Variables for Trapezoidal Channels
Measured Variables
Variable Units Range
Radius of Curvature meters 1.5 - 15.24Bend Length meters 1.27 41.18Width meters 0.61 - 6.76Average Depth meters 0.07 0.78Outer Bank Angle degrees 27 56Outer Bank Roughness - Smooth-IntermediateMedian Bed Material Size millimeters Smooth - 38.1Bedforms - - Plane-Dunes
Approach Channel -- Straight-MeanderingAverage Velocity meters/second 0.34 - 1.07Depth-averaged Toe Velocity meters/second 0.42 - 1.50
16

Derived Variables--------------------------------------------------R/w - - 1.23 - 4.16L/w - - 1.31 - 16.88w/d - - 5.70 - 24.40d/D50 - - 11.0 - 2290Vtoe/Vavg -- 1.03 - 1.42Ttoe/Tavg -- 1.00 - 2.80
Table 9 - Range of Variables for Rectangular Channels
Measured Variables
Variable Units Range
Radius of Curvature meters 0.8 - 50Bend Length meters 0.42 72.0Width meters 0.30 6.00Average Depth meters 0.05 - 0.27Outer Bank Angle degrees 18 - 90Outer Bank Roughness - - Rough-SmoothMedian Bed Material Size millimeters Smooth - 40Bedforms - - Plane-DunesApproach Channel - - StraightAverage Velocity meters/second 0.24 - 0.66Depth-averaged Toe Velocity meters/second 0.35 - 0.81
Derived Variables
R/w -- 0.83 - 9.01L/w -- 0.44- 19.55w/d - - 2.22 - 24.0d/D50 -- 4.3 - 2,500Vtoe/Vavg - - 1.10 - 1.38Ttoe/Tavg -- 1.20 - 2.46
Examination of Data
Before undertaking any advanced analysis or statistical treatment ofdata, it is important to examine the data carefully in the light of existingknowledge annd theory. This allows the researcher to identify expectedand unexpected trends and relationships, and establishes the analyticalframework for the formal treatment of the data. This, fairly lengthy,procedure is essential if the resulting relationships are to have physicalas well as statistical significance.
17

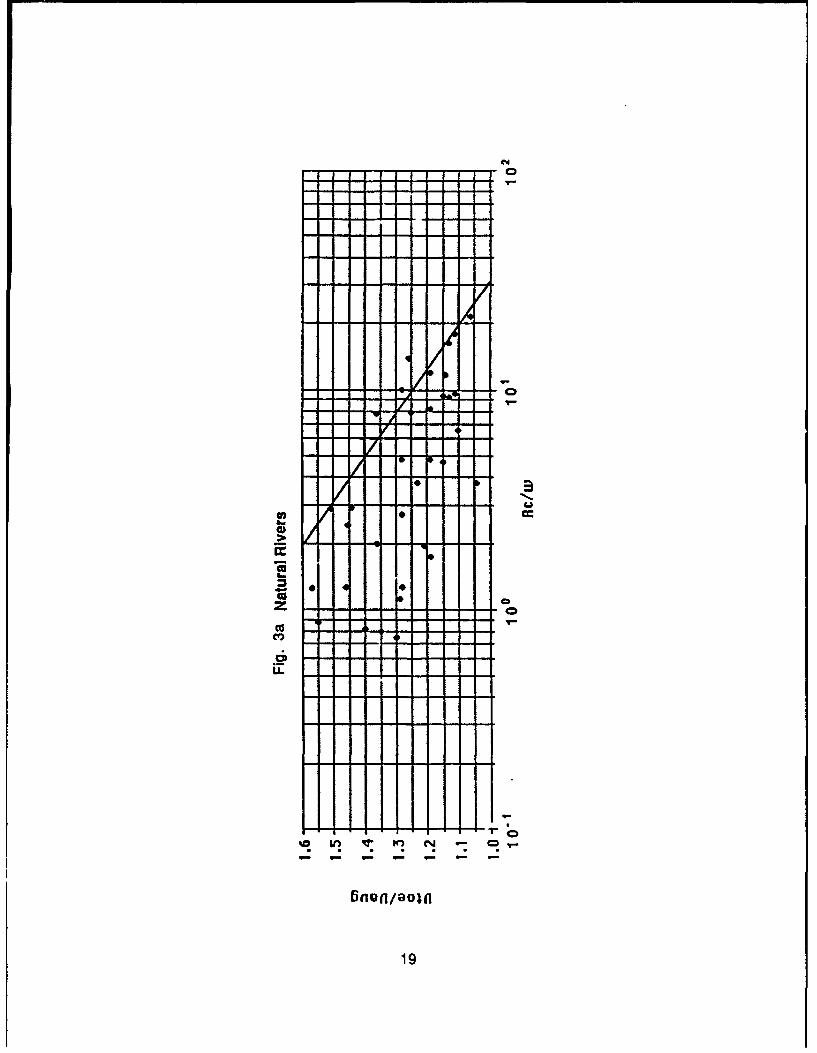
The first step was to establish how the data collected in this studyplott-d in relation to thq design curve developed by the US Army EngineerWaterways Ex* eriment Station. Hence, a semi-logarithmic plot of (Rc/w)versus (Vtoe/Vavg) was produced for the Natural River data, with the WESdesign curve marked on (Fig. 3a). The design line does not pass .:hrough thepoints, but does form a good upper bcund to the data with the exception ofonly three out of 34 points. Thus, it may be concluded that the WES designcurve represents a reasonable, but rather conservative approach to theestimation of (VtoeNavg) in natural channels. This is essential so that inthe final design, the size of rip.:ap specified is always on the safe side. Aregression line through the scatter of the points for Vtoe/Vavg could beused, but this would require that a factor of safety be introduced in therelationship between the critical local velocity for entrainment and thesize of stone used in a revettrment. Present WES preference is to positionthe design line as an upper bound to the data, so that all of the zone ofuncertainty is on one side of the line (Oswald, personal communication,March 1990).
However, there is considerable scatter in the data, and this deservescomment. Partly, it is a result of the methods used to collect the data.Usually, velocities were measured at a finite number of cross-sectionsaround each bend. In some studies many sections were used (up to sevenper bend), but in others only a few (less than three) were used. Outer bankvelocities at intermediate points between sections were not measured.Consequently, there is no guarantee that the actual maximum outer bank ina bend would be observed in any study. Indeed, in studies with only a fewsections, it is highly probable that the outer bank maximum velocity for abend would not be measured. It is therefore to be expected that field datashould plot either close to or below a line defining the maximum possibleratio of outer bank to average velocity. However, even for bends withmultiple measured sections, the data often plot well below the WES line.This suggests that there may be further variables affecting the velocityratio which are unaccounted for in the WES analysis.
Points for bends of very low Rc/w values reveal that the monotonicincrease in Vtoe/ Vavg observed as Rc/w decreases may cease at an Rc/wof about 2. For Rc/w values less than 2, the data show a wide range ofVtoe/ Vavg values, but the veloci.y ratio never exceeds 1.6. This accordswith other recent studies of bend flow in very tightly curved bends, whichhas shown that both outer bank scour pool depth and outer bank retreatrate may actually decrease with decreasing Rc/w for bends with Rc/wless than 2 (Biedenharn et al., 1989; Thorne, 1989). This is not unexpectedtheoretically, as there is a major discontinuity in the way the pattern ofbend flow responds to increasing bend tightness at Rc/w of between 2 and3 (Bagnold, 1960). Further data and analyses are required to confirm thistentative finding.
18
(CM
"---
- - - - -
19~

aY)
02

N
C~ 00
C/ to
/ -- ---
Cm
C C
21

It is concluded that the actual ratio of outer bank toe velocity to
average velocity at a bend increases as the ratio of radius of curvature towidth decreases, in bends with Rc/w greater than 2. In a natural channelthe actual velocity ratio observed in the field is unlikely to exceed thevalue predicted from the WES design curve, but it is likely to beconsiderably lower under some circumstances. For very tight bends withRc/w less than 2, a wide range of VtoeNavg values is possible, butmaximum values never exceed 1.6.
Effect of Channel ShapeFigure 3b shows the same plot for trapezoidal channels, again with
the relevant WES design curve superimposed. The trend of the line isclearly correct, but the data tend to scatter about the line rather thanlying near or below it as in the case of natural channels. Three out of tenpoints lie significantly above the line, suggesting that it might be prone tounderestimating the actual ratio of toe to average velocity under somecircumstances.
Figure 3c shows the same plot for rectangular channels. Both thelines for natural and trapezoidal channels are superimposed. The data tendto plot around the line for trapezoidal channels, eleven points lie aboveand six below the line. As the shape of a rectangular channel is somethingbetween trapezoidal and natural, the plotting position of the points is asexpected. The plot suggests that VtoeNavg values in rectangular channelsare lower than those found in natural channels, but may be somewhathigher than those found in trapezoidal channels.
In order to establish which other variables influence the velocityratio for a bend, separate semi-logarithmic graphs were plotted forfurther, different channel characteristics.
Effect of Bank RoughnessFigures 4a and 4b show the Rc/w versus VtoeNavg relations for
natural bends with intermediate roughness outer banks and rough outerbanks, respectively. Examination of the plots shows complete overlapbetween the data clouds for the two bank types. This suggests that, for therange of bank roughness represented in the bends studied, the roughness ofthe outer bank did not materially affect the velocity ratio.
The banks of the laboratory flumes used to generate the data fortrapezoidal and rectangular channels showed an insufficient range ofroughness to allow separation of the data in this way.
Effect of BedformsFigures 5a, b and c show the Rc/w versus VtoeNavg relations for
natural bends with plane, ripple and dune, and dune bedforms, respectively.Examination of the plots shows complete overlap of the data clouds for thethree bedforms, suggesting that in natural bends the bedform did notsignificantly affect the velocity ratio.
22

..i
-• - : -- --
E --
S- -
a "-
0--------------------- -
0----3

N
cmm
0
o ,
00
a-a
%0 LM IT1'
24

S.
m
CC
z
0es
0T
U)
25

N
cis
CLL
26-
0Q
*G
0 - -
C
6 -6

00
0)
qlU
0) 9
e'-
a) 9
9 C
U4-
U -2 _
U.
U) __ - - - -
C
27

Figures 6a and b show the relations for rectangular channels with
plane and dune beds, respectively. The plots show that dune-bedded bends
seem to have higher velocity ratios than plane-bedded bends for the same
Rc/w value. This appears to conflict with the finding for natural channels,
that bedform did not affect the velocity ratio.The probable explanation centers on the state of mobility of the bed
in the flume studies. The presence of dunes clearly indicates mobile-bedconditions and, therefore, the potential for scour and fill. In a mobile-bedexperiment I would expect a scour pool to develop in the bed adjacent tothe outer bank and a point bar to form at the inner bank, so that in time thecross-section would come to some extent to resemble that of a naturalchannel. Data collected at that time would plot between the lines forfixed and natural channels.
Conversely, a plane bed indicates immobile conditions and a fixed,rectangular cross-section. Data from such a channel should plot close tothe line for trapezoidal channels. Viewed in this light, the data fordifferent bedforms simply illustrate the effect of cross-sectional shape,with mobile-bed rectangular channels approximating to natural channelsand immobile-bed rectangular channels being similar to trapezoidalchannels. Re-examination of the data for trapezoidal channels shows thatthis effect is also evident there. The two points which plot well above theWES design curve both come from a channel with a granular, deformablebed.
On this basis it seems sensible to consider laboratory channels aseither having a mobile or an immobile bed, pooling together those withinitially trapezoidal and rectangular cross-sectons.
Effect of Entrance ConditionsFigures 7a and b show the Rc/w versus Vtoe/Vavg relations for
natural channel bends with straight and meandering entrance conditions,respectively. Examination of the plots suggests that for the same Rc/wvalue, bends downstream of straight reaches have higher velocity ratiosthan those downstream of meandering reaches. The WES design curveforms a reasonable upper bound to the data for bends with straightentrance conditions, but significantly over-estimates the increase in thevelocity ratio that accompanies a decrease in Rc/w for bends inmeandering reaches. The discrepancy increases as the Rc/w decreases.
This is, potentially, an important finding because it suggests thatdifferent design approaches might be appropriate for single, isolatedbends and the consectutive bends of a meandering river.
The difference may arise due to the contrasting transversedistributions of longstream velocity at the entrance of bends withstraight and meandering reaches upstream.
At the end of a long, straight approach reach the maximum velocityfilament is close to the channel centerline. It must cross only half thechannel width before encountering the outer bank zone, and elevating outerbank toe velocities relative to the average velocity. This is usually
28

~-
0CC
*
a,,
CCaCD
-_0
Cr
mc
finei/gOln
29

-CA
LL - --
03

N
an
mc
31
0)U_- - -
Co
C
6n4-aol
-3

N
0 -D
Ua
Sna..C]
w
SC o
a.- - - - -
0
.0
II
0
6nflif/aOfll
32

achieved just after the bend apex, in the second half of the bend, where
skewing of the flow by the bend is at its strongest.Conversely, at the exit of an upstream bend the maximum velocity
filament is located adjacent to the outer bank for that bend. If the nextbend (which is of opposite curvature) is immediately downstream, then atits entrance the maximum velocity filameri is located near the inner bank.It must ;ross the whole channel width before encountering the outer bankzone. This requires fully developed secondary flow and a long bend, and isseldom achieved until downstream of the bend exit, wh6re the strength ofskewed flow is already declining. As a result, the ratio of outer bank toaverage velocity in such a bend may be lower than that in an equivalentbend at the end of a straight reach. This preliminary finding is consistentwith long-held ideas on the effect o& entrance conditions on bend flow(see for example, Chacinski and Francis, 1952) and it merits furtherresearch.
The only break-djwn of the data to show a systematic and significantdifference in the relationship between Rc/w and Vtoe/Vavg was that byentrance condition. It was, therefore, decided to continue this breakdownwhen examining the impact of the other parameters of bend geometry, andbed and bank characteristics.
Effect of Bend Lengtl'This was investigated using an dimensionless index of bend length
(Llw) similar in concept to the dimensionless bend curvature index Rc/w.Figures 8a and b show the relations for natural channel bends withstraight and meandering entrance crriditions, respectively.
The trend in both graphs is for Vtoe/Vavg to increase as L/w, the
dimensionless length of the bend, decreases. This seems surprising since,from first principles, I would have expected that the asymmetry of theflow would be greater in a long bend than a short one due to the greater
length o, iurved channel over which the skewed flow may develop.However, it must be noted that bend length is initimately related to theRc/w value as well as the L/w value.
It is a geometric fact that tight bends must be short in length,
otherwise a neck cut-off occurs. Consequently, there is a high positivecorrelation (R - 0.88) between Rc/w and LUw (Table 10). Hence, shortbends have high VtoeNavg ratios not because they are short, but becausethey are tight. The effects of bend length cannot easily be separated fromthose of radius of curvature to width ratio. Physically. what happens isthat in a short, tight bend the maximum velocity filament crosses thechannel rather abruptly and meets the outer bank at an acute angle. Theresult is that acceleration of the outer bank velocity in a short, tight bend
would be expected to be greater than that in a long/gentle bend. The onlyway to separate the effect of L/w acting alone is through multipleregression, which examines the variation of VtoeNavg caused be a changein L/w after the effects of Rc/w have been accounted for. This rnalysis isperformed later in the report.
33

ca
CL
cc
0.I
_: :34-
4- --
.k !--
a!0) -
U :
irl l
M~
%O U! !94
34

CC
C1
C.ci
co
Jr-- t-Ln ~ ~ to-
C -35

Table 10 Correlation Matrix Between derived Parameters
Corriiation Matrix for Variables: X1 ... X5
Rc/w L/w wid d/DSO Bank An...
Rc/w 1L/w .881 1wld .758 .688 1
d1DSO .858 .834 .885 1
Bank Angle -. 775 1-.777 -67 -. 86 _
The results for trapezoidal and rectangular channels could not bebroken down between straight and meandering entrance conditions due tolimitations in the scope of the data set. There were not enough cases withmeandering entrance conditions to allow a meaningful analysis. As mostof the data come from straight approach conditions, the results should beon the safe side with regard to meandering approach channels.
The results are plotted in Figs. 9 and 10 for trapezoidal andrectangular channels, respectively. In both cases the trend of the data isapparently similar to that for natural channels (Fig. 8a and b). However,the comparison of the plots with those for natural channels emphasizesthe relatively restricted range of L/w ratios found in the laboratorychannels, which makes it less easy to identify any trend in the data.
Effect of Aspect RatioFigures 11a and b show the relations for aspect ratio (w/d) versus
VtoeNavg in natural channel bends with straight and meandering entranceconditions, respectively.
The trend in both graphs is for Vtoe/Vavg to increase as width todepth ratio decreases. This is explained by the different flow patterns innarrow, deep channels versus shallow, wide channels. In a shallow, widechannel bed roughness dominates the flow pattern, flow is pseudotwo-dimensional, and both curvature and outer bank effects are relativelyless important. Conversely, in a narrow, deep channel the flow is fullythree-dimensional and strong skew-induced and outer bank secondarycurrents dominate the flow pattern. It is these secondary currents whichare responsible for the accelaration of near bank primary velocities in theouter bank region. Consequently, the increase in the outer bank toevelocity is much greater in a narrow, deep channel than in an equivalentshallow, wide one. Again, Table 7 reveals a positive correlation betweenw/d and Rc/w (R = 0.76), however. Therefore, final cosideration of theeffect of w/d on Vtoe/Vavg must be reserved until a multiple regressionhas been performed.
36

CL-J.
cmC
z c-n/oi
2-------------------

cm
L N
-CDmm
LCID
38
o -• -_
6n0/O(
C -- -

N
C.CD
m-
0L.
0.--a-U,-
*_ -1uI-
0
5 rI~o/ao~In
39

N
0'0
00
0.40

The results for trapezoidal and rectangular channels are shownin Figs. 12 and 13, respectively. The ranges of wld encountered inlaboratory channels are severely restricted compared to natural channels,but the trend in the data does not contradict the results for natural
channels.
Effect of Relative DepthFigures 14a and b show the relations for relative depth (d/D50)
versus VtoeNavg in natural channel bends with straight and meanderingentrance conditions, respectively.
The trend in both graphs is for VtoeNavg to increase as relativedepth decreases. This is explained by the effect of flow resistance onaverage velocity in a channel. Relative depth (the inverse of relativeroughness (D50/d)) characterizes how deep the flow is in terms of themedian size of the bed material. It represents the hydraulic smoothnessof the channel, which is primarily responsible for determining the flowresistance coefficient, and hence the average velocity. In a relativelydeep, smooth channel (high diD50) resistance is low and average velocityhigh when compared to an otherwise equivalent shallow, rough channel(low diD50). Consequently, when the outer bank toe velocity is divided bythat average velocity in a deep, smooth channel, the quotient is lower thanin an otherwise equivalent shallow, rough channel. The differencebecomes more marked as d/D50 decreases. It should be noted though thatthis effect operates on the quotient VtoeNavg. It does not mean thatabsolute values of Vtoe will be lower in a deep, smooth channel than in ashallow, rough one, because the actual value of Vavg may also be muchhigher in the smoother channel. The correlation matrix (Table 7) shows astrong, positive correlation between d/D50 and Rc/w (R - 0.86). Hence,final judgement on the relationship bewteen diD50 and VtoeNavg mustawait the multiple regression analysis.
There is considerable scatter in both the graphs, especially that forstraight approach conditions (Fig. 14a), but the points for bends withstraight entrance approach channels consistently plot higher than thosefor meandering approaches. This suggests that compared to meanderingrivers, maximum values of Vtoe/Vavg are higher for bends with straightapproach channels, and increase more markedly as dID50 decreases.
The results for trapezoidal and rectangular channels are shown inFigs. 15 and 16, respectively. The trends in the data support the resultsfor natural channels over a wide range of relative depths.
Effect of Outer Bank AngleFigures 17a and b show the relations for outer bank angle versus
VtoeNavg in natural channel bends with straight and meandering entranceconditions, respectively.
The trend in both graphs is for Vtoe/Vavg to increase with increasingbank angle.
41

N-'0
Co
wz - -�
z--------------------z - -o-5
o -
N'U
I-Cu
C
'a N o- - - - - - -
ii o� / a o � ii
42

U0
U.~
• !n
- -•
0 _-
43

In0
w.0
C.) CU.,
o Cp p, �oa..a.
pa-U,
N0
I..
'0 U) � � N - C -
- - - - - - -
t3rwgi,'ao�i
44

. 0
- I I I
Zo
CuZ
oo
cm
a. L
cc
Cuz
cc
z
45

ujzz
N
-JJ
0.
A
--- 46

CD0z
CM10
cca
.p-
CL
CC
6fl~fl/9ooli
47

CN
-I
cc)
CCDo C
UccS0
I-
LM.
48

0)4,
C cCu- -'-
0 La.
0 .
C- z
cc
Is
49
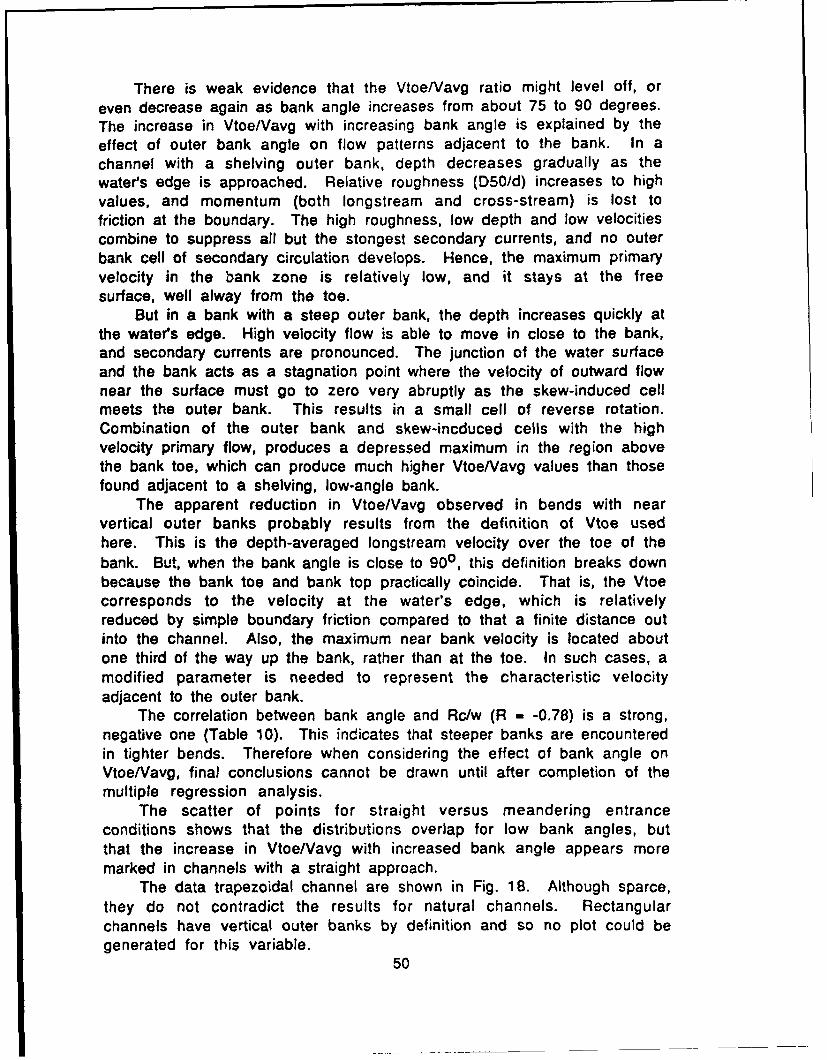
There is weak evidence that the VtoeNavg ratio might level off, or
even decrease again as bank angle increases from about 75 to 90 degrees.The increase in Vtoe/Vavg with increasing bank angle is explained by the
effect of outer bank angle on flow patterns adjacent to the bank. In achannel with a shelving outer bank, depth decreases gradually as thewater's edge is approached. Relative roughness (D50/d) increases to highvalues, and momentum (both longstream and cross-stream) is lost tofriction at the boundary. The high roughness, low depth and low velocitiescombine to suppress all but the stongest secondary currents, and no outerbank cell of secondary circulation develops. Hence, the maximum primaryvelocity in the bank zone is relatively low, and it stays at the freesurface, well alway from the toe.
But in a bank with a steep outer bank, the depth increases quickly atthe water's edge. High velocity flow is able to move in close to the bank,and secondary currents are pronounced. The junction of the water surfaceand the bank acts as a stagnation point where the velocity of outward flownear the surface must go to zero very abruptly as the skew-induced cellmeets the outer bank. This results in a small cell of reverse rotation.Combination of the outer bank and skew-incduced cells with the highvelocity primary flow, produces a depressed maximum in the region abovethe bank toe, which can produce much higher VtoeNavg values than thosefound adjacent to a shelving, low-angle bank.
The apparent reduction in Vtoe/Vavg observed in bends with nearvertical outer banks probably results from the definition of Vtoe usedhere. This is the depth-averaged longstream velocity over the toe of thebank. But, when the bank angle is close to 900, this definition breaks downbecause the bank toe and bank top practically coincide. That is, the Vtoecorresponds to the velocity at the water's edge, which is relativelyreduced by simple boundary friction compared to that a finite distance outinto the channel. Also, the maximum near bank velocity is located aboutone third of the way up the bank, rather than at the toe. In such cases, amodified parameter is needed to represent the characteristic velocityadjacent to the outer bank.
The correlation between bank angle and Rc/w (R - -0.78) is a strong,negative one (Table 10). This indicates that steeper banks are encounteredin tighter bends. Therefore when considering the effect of bank angle onVtoeNavg, final conclusions cannot be drawn until after completion of themultiple regression analysis.
The scatter of points for straight versus meandering entranceconditions shows that the distributions overlap for low bank angles, butthat the increase in Vtoe/Vavg with increased bank angle appears moremarked in channels with a straight approach.
The data trapezoidal channel are shown in Fig. 18. Although sparce,they do not contradict the results for natural channels. Rectangularchannels have vertical outer banks by definition and so no plot could begenerated for this variable.
50

CD
'cu
z
0-
CD
q V0to e
Naolai
'51

Main Points
After this preliminary examination of the data the following pointswere noted:
1. The WES design curve represents a conservative approach to theestimation of (VtoeNavg) in natural channels.
2. Points for bends of very low Rc/w values reveal that the monotonicincrease in Vtoe/ Vavg observed as Rc/w decreases may cease at anRc/w of about 2.
3. For trapezoidal channels, the WES design curve might be prone tounderestimating the actual ratio of toe to average velocity under somecircumstances.
4. Vtoe/ Vavg values in immobile bed rectangular channels are similar tothose found in immobile bed trapezoidal channels.
5. The roughness of the outer bank does not significantly affect the ratioof outer bank toe velocity to average velocity in the bends studied.
6. The presence of bedforms does not significantly affect the ratio ofouter bank toe velocity to average velocity in the bends studied. It isnoted, though, that the velocity ratio for immobile, trapezoidal orrectangular channels is significantly lower than that for mobile-bed,trapezoidal or rectangular channels with the same Rc/w ratio.
7. The ratio of outer bank toe velocity to average velocity in a bendimmediately downstream of a straight reach may be significantlyhigher than that in a bend downstream of a bend of opposite curvature.The WES design line appears to be a good upper bound for bendsdownstream of straight reaches but may over-estimate the velocityratio in bends in meandering reaches.
8. Bend geometry parameters L/w, w/d and d/D50 are all show strong,positive correlations with Rc/w. This makes it difficult to identifytheir individual effects on Vtoe/Vavg. From the individual plots itappears that VtoeNavg increases as L/w, w/d and d/D50 decrease.
9. Bank angle, a, shows a strong, negative correlation with Rc/w.VtoeNavg appears to increase as the bank angle increases. There issome evidence that Vtoe/Vavg might decrease as bank angle increasesfrom about 75 to 90 degrees.
It should be noted that there is considerable scatter in the graphsproduced here. It would be a simple matter to "massage" the data in orderto obtain tighter distributions. This temptation has been resisted,however, and the data are exactly as they were extracted from the variousreports and papers. No doubt, some errors of judgement have been madeand some bends have been mis-classified. But re-assigning bends todifferent "straight' and "meandering" categories now would undermine theobjectivity of the study. The analysis is based on the our best judgementwithout the benefit of hind-sight. If it cannot produce good results underthese circumstances, then it would be unlikely to be of practical use.
52

Analysis of Data
The examination of the data has established that variables other thanRc/w appear to influence the ratio of outer bank toe velocity to averagevelocity in a channel bend. Up to now, each of the potentially significantvariables has been considered separately, as if it acted alone to influenceVtoe/Vavg. In nature this is not the case, as the actual Vtoe/Vavg valuefor a bend is the product of the mutual interaction of all the significantcontrolling variables. Significant correlations exist between thevariables, and these may obscure the true effect of each on the dependentvariable (VtoeNavg).
To develop a predictive approach which reflects this situation,multiple regression was used to produce equations expressing thedependent variable VtoeNavg as a function of all 'independent" variablesidentified as being potentially significant in the previous section. Astepwise regression was used. This adds each independent variable in turnto the regression analysis, rejecting any variable which does not addsignificantly to the strength of the regression equation.
From the examination of the data it was concluded that the linearrelation between Rc/w and VtoeNavg may break down for Rc/w valuesless than 2. There are sound theoretical reasons to expect this, and thedata are consistent with the idea that as bends tighten to Rc/w valuesless than 2 major changes in flow pattern occur, often leading toimpinging flow and areas of separation at the outer bank. In view of this,it was decided to limit the curve fitting to bends with Rc/w values equalto or greater than 2.
It was noted earlier that in some studies only a few sections weremonitored in each bend, and that consequently the data collected do notrepresent the absolute maximum ratio of VtoeNavg for that bend. Thisexplains why some points plot low in the various distributions shown inFig. 3. Taking this fact together with the recommendation from WES thatan upper bound line is preferable to a best-fit line when predictingVtoe/Vavg for riprap design, it was decided to perform the multipleregression using only points from the top edge of the scatter. Theseturned out to come mostly from bends which were intensively studied (forexample, studies by Thorne et al., Dietrich, Bridge). Some data came fromsingle sections too, apparently where those sections happened to havecoincided with the highest values of Vtoe/Vavg for the bend. Hence, thecorrelation coeffiecients indicate the linearity of the upper surface of thedata cloud, rather than the strength of the regression as such.
Prediction of Outer Bank Velocity In Open Channel Bendways
Natural RiversIn line with the finding that the approach condition did appear to
affect the velocity ratio for natural rivers, separate analyses wereperformed for straight and meandering approach conditions.
53

Natural Rivers: Straight Approach ConditionsThe points used to define the upper boundary are indicated in Fig. 19.
The equation for natural rivers with straight entrance conditions is:
itE=1.29 - 0.5 log (') + 0.4 log (.:)-0.06 log (B)+ 0.16 log (a) (5)VAVG 5DW
The adjusted coefficient of determination for this equation (r2 ) is0.905, indicating that the equation is well fitted to the upper surface ofthe data cloud. The width-depth ratio did not contribute sufficiently toappear in the equation.
For comparison with the WES design curve, and to evaluate whetherthe improvement in accuracy merits the increased complexity 3f eqn. 5, aline was also fitted to the data using simple regression for Vtoe/Vavg asa function of Rc/w. The resulting equation is:
VTO = 1.6 6 - 0.4 2 log () (6)VAVG W
The adjusted coefficient of determination for this equation (r2 ) is0.90, indicating good linearity at the upper edge of the data cloud. Theresulting line is shown in Fig. 19.
Natural Channels: Meandering Approach ConditionsThe points used to define the upper boundary are shown in Fig. 20.
The resulting equation for natural rivers with meandering entranceconditions is:
V7X= 0. 95 -0.16 log IRc-)0.06 log (L+ 0.06 log (w- + 0.25 log (a) (7)AVG W W
The adjusted coefficient of determination for this equation (r2 ) is0.985, indicating that the equation is well fitted to the upper surface ofthe data cloud. The relative depth did not contribute sufficiently to appearin the equation.
For comparison with the WES design curve, and to evaluate whetherthe improvement in accuracy merits the increased complexity of eqn. 7, aline was also fitted to the data using simple regression for Vtoe/Vavg asa function of Rc/w. The resulting equation is:
V Rc""E = 1.4 - 0.24 log (2.) (8)
AVG
54

14~
Cl)
CC
CnC

LU
Cacc
0
ca
%1ý Ln 9
I.. -- 56

The adjusted coefficient of determination for this equation (r2 ) is0.87, again indicating good linearity at the upper edge of the data cloud.The line produced by this equation is shown in Fig. 20.
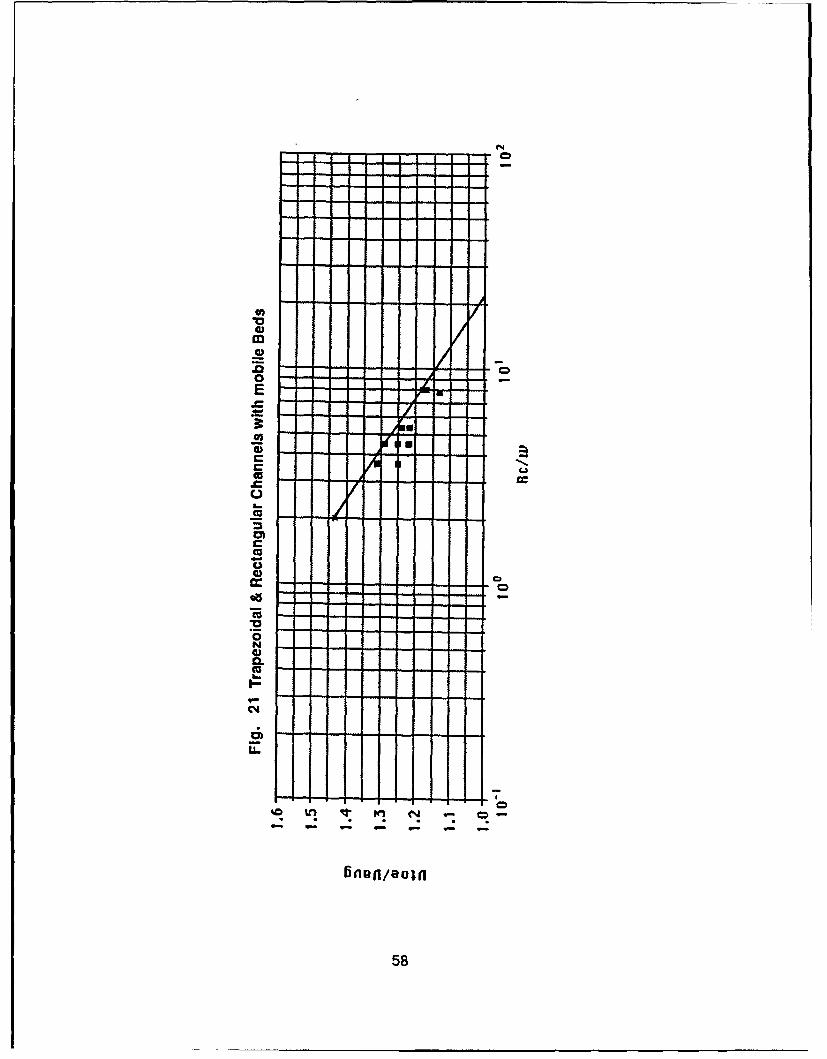
Trapezoidal and Rectangular Channels
There was no obvious difference between the data clouds fortrapezoidal and rectangular channels, but the state of bed mobility didappear to affect the outer bank to average velocity ratio for laboratorychannels. The plots for mobile and fixed bed channels are shown in Figs.21 and 22 respectively. Hence, separate analyses were carried out formobile and fixed-bed channels.
Laboratory Channels with Mobie BedsThe points used to define the upper boundary are indicated in Fig. 21.
There was insufficient range in the other variables (I'w, w/d, d/D50, a) toallow their meaningful inclusion in the analysis. Hence a predictiveequation based on Rc/w was produced. This is:
-IE = 1.55 - 0.41 log .. CN (9)VAVG
The adjusted coefficient of determination for this equation (r2 ) is0.98, indicating good linearity at the upper edge of the data cloud. The lineproduced by this equation is shown in Fig. 21.
Laboratory Channels with Immobile BedsThe points used to define the upper boundary are indicated in Fig. 22.
The WES diagram (Fig. 1), indicates that VtoeNavg is independent of Rc/wfor Rc/w values greater than 6. Accordingly, only points with Rc/w valuesless than 6 were used to define the upper boundary. There wasinsufficient range in the other variables (L/w, w/d, d/D50, a) to allowtheir meaningful inclusion in the analysis. Hence a predictive equationbased solely on Rc/w was produced. This is:
V-E 1.73- 0.89 log (i -) (10)VvVAVGw
The line produced by this equation is shown in Fig. 22.
57
ccN
Ci
CL
_e-- 0
o N
05C.)
a-I
C) • • •
CnNaof
C58

IN
D
Imm
ca
ca
it
-
04U
Q
59

Prediction of Outer Bank Shear Stress in Open Channel Bendways
Very little reliable data on shear stress distributions in naturalchannels could be obtained. Consequently, the analysis was limited to datafrom laboratory flumes. It should be noted that in very few cases wereboth velocity and shear stress data available from the same series ofexperiments. Therefore, the data points used in this part of the study donot correspond to those used to investigate Vtoe/Vavg.
Nevertheless, experience gained in the analysis of Vtoe/Vavg didsuggest that the state of bed mobility might affect the shear stress ratiofor a bend. The plots for mobile and fixed bed channels are shown in Figs.23 and 24 respectively. Separate analyses were performed for channelswith mobile and immobile beds.
There was insufficient data to support multiple regression, and soanalysis was limited to simple regression on upper boundary points topredict tb/to as afunction of Rc/w.
Laboratory Channels with Mobile BedsThe points used to fit a line to the data are indicated in Fig. 23. The
equation of the resulting line is:
tb R -0.5to -. 33
which is almost identical to the equation of the WES design curve forrough channels. However, this line is based on very limited data. As aresult the top of the data cloud is poorly defined, producing anunacceptably low regression coefficient of only 0.27 for the upperboundary line. The line is shown in Fig. 23.
Further data from natural and mobile-bed laboratory channels areurgently needed to confirm the form, exponent and constant in thisequation.
Laboratory Channels with Immobile BedsThe points used to fit a line to the data are indicated in Fig. 23. The
WES diagram limits analysis to bends with Rc/w values between 1 and 5.For consistency, these limits were applied to the data used here also. Theequation of the resulting line is:
Lb - R -0.5--b 2g (R-) (12)
to
which is very similar to the WES design equation for smooth channels. Thehigh correlation coefficient r - 0.96 indicates good linearity in the upperboundary of the data.
60

Fig. 23 Rectangular Channels with Mobile Beds
10 1 .-..
, ,
100 .. ...
1101
Rc/w
61
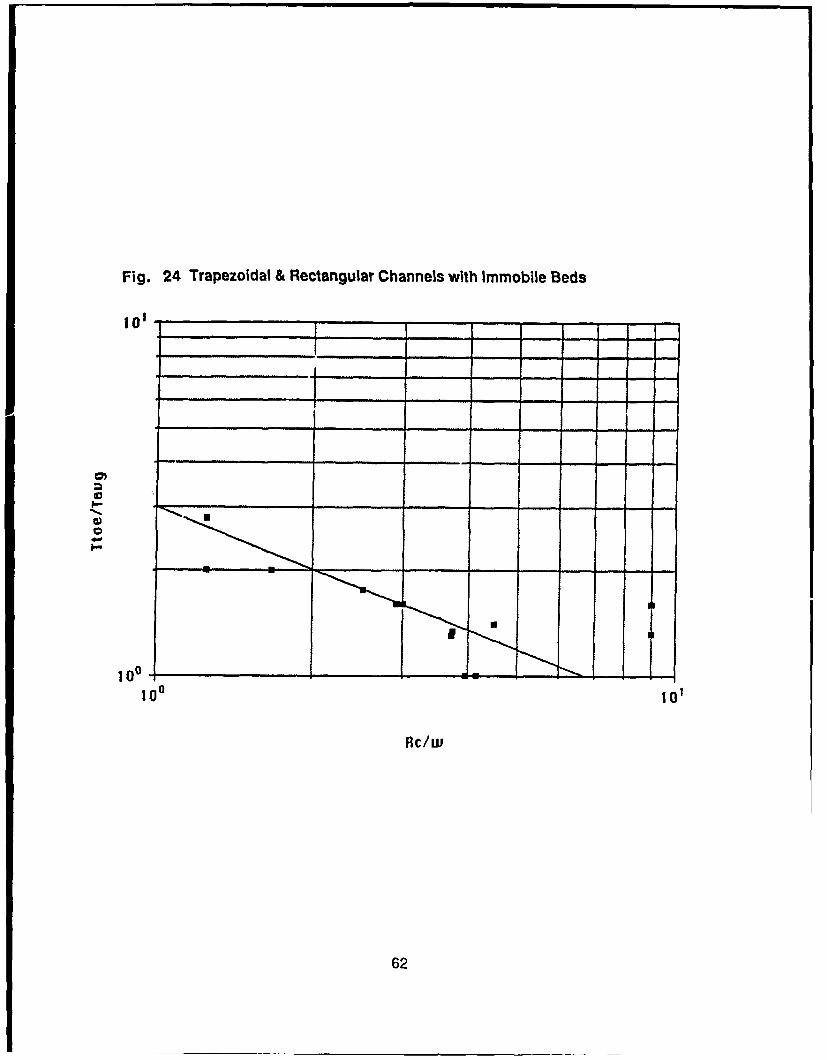
Fig. 24 Trapezoidal & Rectangular Channels with Immobile Beds
i01 ....
1 _____0______ ________
10 0
1000
2c/w
62

Modeling Approach
Background
During the last decade, a large number of papers presentingmathematical models for predicting the flow and bed t.-pography in riverbends has appeared in the literature. The authors have expressed a varietyof opinions regarding the relative importance of the factors which controlmeander morphology. Most models are intended for use bysedimentologists interested in reconstructing past environments (eg.Allen, 1970, Bridge, 1976), or by river engineers attempting to predict thedistribution of scour as an aid in the design of successful channelstabilization schemes (eg Odgaard, 1987). However, many models may becriticized because they are unnecessarily complicated and esoteric forthese tasks, and because no attempt is made by the author(s) torecommend where, when, and now they should be applied to naturalwaterways. Some very pertinent remarks were made concerning the roleof mathematical models in fluvial geomorphology and river engineeringduring a discussion by conference participants at the concluding session ofthe ASCE Rivers '83 conference, New Orleans, 1983 (Elliott, 1983). Theseare encapsulated by a comment from Charles Neill, a practising riverengineer from Northwest Hydraulic Consultants, Canada. He said,
"It is important that mathematical models should have a goodfamiliarity with the range of features encountered. .... It wouldbe a service to the profession if these could be used toproduce generalized tables, graphs or programs thatwould enable reasonable estimates of velocity and sheardistributions to be made by practising engineers, withoutthe necessity of access to an elaborate modelling facility" (Neill,1983)
Difficulties are often encountered when attempting to apply modelsto natural systems. If the model requires certain input parameters thatneed to be known or to be measured in the field (the centreline meanvelocity or the mean Darcy-Weisbach friction factor are examples), it isoften difficult to assign a value with confidence. Often, fieldmeasurements unavailable and estimates are unreliable, and it may be thecase that the model output may highly sensitive to incorrect values havingbeen assigned to the input parameters.
Also, many models are written by, and apparently for, researchers.Unless you are a spccialist, expert in programming, three dimensionalfluid mechanics, and mathematics, it is virtually impossible to use themfor a real world application without detailed assisstance from the authorof the computer coding.
In this part of the project, we examined a number of mathematicalmodels, hoping to select several to try as predictors of outerbank velocity
63

in bendways. Before going on to report the results from the modelsselected, it is relevant to present a short outline of the physical basis for
the models.
Basic Principles of Numerical Modeling of Bend Flow
The numerical modelling of flow and sediment processes in river
bends is a subject that is receiving ever-increasing attention, and a largenumber of models are available. There are two components to mostmodels. The first involves a solution to the equations of motion for fluidflow. The second is the interaction between the flow and the bedtopography. This requires balancing the different forces acting onbed-material particles to produce an equilibrium bed topography.
All flow models start with the equations of motion for fluid flow.For application to bend flow, the equations are usually written incylindrical coordinates. Given below are the equations of motion for thesteady flow of an incompressible fluid in an orthogonal cartesiancoordinate system (Rozovskii, 1957). The velocity components in the s(streamwise), n (perpendicular to s-axis), and z (vertical upwards fromthe stream bed) directions are denoted u, v, and w respectively, r = localradius of curvature; p - pressure; and F - friction term in the s, n and zdirections respectively.
au au Ru uv lIpU-+v•- +w-+- ---- +F
as on k r r as
a v ay uz2 l+t*-- +V• +W W - =' - Fnas on az r r an
u-0 + v- + w- +g - -- + Fzas on aw r az
The left hand sides of these equations are the convective acceleration
terms. There are no local acceleration terms (a/at) and so strictlyspeaking the models are not prognostic but diagnostic.
The continuity equation for 3-dimensional, incompressible flow isalso specified:
. I I+--) + aw 0
as r D\ az
The principal cross-stream and downstream force balances are between:
1) the centrifugal and pressure gradient forces in the cross-streamdirection: and2) the downstream balance between gravitational and frictional forces.
64

Secondary circulation is usually considered to be the most importanteffect of curvature on flow, but the tilting of the water surface is alsovery important, because it alters the downstream slope of the watersurface, generating large cross-stream variation in the downstreamboundary shear stress and velocity fields.
Flow and bed topography models attempt to simulate the bedmorphology of a channel bend by assuming that, at equilibrium, the forcesdirected inwards and outwards on each bed particle are balanced (Allen,1970; Bridge,1977). This means that particles of different sizes travelalong paths of equal depth along the channel, under the influence oflongstream drag. Models that use this scheme differ in the way in whichthe forces of lift and longstream drag are determined. The balance offorces acting on a particle in the mean flow direction is:
FD cos d = (W-FL) cosa tani
where FD - drag force, d = deviation of the bed shear stress vector fromthe longstream direction, W - submerged weight, FL = lift force, tanj isthe dynamic friction coefficient due to collisions with the bed and othergrains, and a - transverse slope of the point bar surface (Bridge, 1977)(see figure 25).
DOWMIRM FLOW"M DIRECflON
Figure 25 Definition diagram for flow in an open channel bend (adapted
from Bridge, 1977)
The transverse force balance is therefore:
FD sin d = (W-FL) sin a
For any given point on the transverse bed profile, the balance of drag andimmersed weight components acting on a bed particle is:
65

p (D/2) 2 tan d= p (D/2)3-(s- r)gsina
Where D - particle diameter, tx . longstream bed shear stress, and s and r- the sediment and fluid densities, respectively.
The theory assumes that the particles are moving as contact load. Itis also important to note that for suspended particles, forces due to liftand the cross-stream component of particle weight are insignificant.Another assumption common to many models is that the angular deviation(d) of the shear stress vector from the downstream direction (andtherefore the local transverse bed slope) is proportional to the ratiobetween the depth and radius of curvature:
und=C h
where C is an empirical coefficient. This relation, developed by Rozovskii(1957) from the equations of motion, is actually applicable only tofully-developed secondary flow. Fully-developed flow occurs in thedownstream part of long, constant-radius reaches where flow and bedtopography remain constant with distance downstream and are independentof upstream conditions. For developing flow where flow and bedtopography do not remain constant with distance, the governing equationsare more complex and difficult to solve.
As the outward component of gravity is proportional to the cube ofthe diameter of the grain whilst the inward-acting drag on the particle isproportional to the square of the diameter. This leads to a sortingmechanism, recognized as an important process in meander bends by Allen(1970), Bridge (1977), Dietrich and Smith (1984) and Parker and Andrews(1985), whereby for the same velocity, larger particles will tend to roll,due to gravity, out towards the pool, while smaller ones will tend to beswept inwards by fluid drag (Fig. 26). Wilson (1973) used the sameprinciple to propose a'- explanation for sorting in straight channels.
Review of Important Bendflow Models
Most researchers begin their analyses with the equations of motionand continuity, then simplify them until a solution is possible (eg. Dietrichand Smith, 1983; Odgaard, 1987). Others use simpler concepts ofmomentum and force, and treat the flow as a single unit, usingdepth-averaged equations (eg. Dietrich, 1988). The problem with thelatter approach is that the effect of the secondary currents cannot beaccounted for by the governing equations.
66

X F1 d Xx
Fl P Fgj
FgX
FI Fx
Figure 26 Forces acting on a particle at or near the bed. Opposingfrictional resistance of the bed not shown. Forces are lift (FI), drag (Fd),gravity (Fg), and the cross-stream component of gravity (Fgx).Thegravitational force is proportional to the cube of the particle diameter,and the fluid forces are proportional to the square of the diameter. Theresult is a sorting mechanism. (Adapted from Dietrich, 1988)
Authors using the former method can control the secondary currentsand the bed topography using these equations, but one needs to ask whetherthe simplifying assumptions made in order to solve the governingequations are justifiable for flow in bends.
The first important contribution was from a Dutch engineer, L VanBendegom, in 1947, who formulated a model similar in principle to thefundamental model described in the previous section, and was the first tohypothesize that transverse bed slope bears a simple inverse relation tograin size. A complete appraisal of his work can be found in Allen (1978).Independent work by Rozovskii (1957) produced very similar results.Rozovskii developed v model for two-dimensional flow using the equationsof motion. He later extended his analysis to consider flow in threedimensions and finally used his model to consider the development anddecay of the helical flow cell. Much later, Engelund (1974) used ananalysis of fluid motion developed by Rozovskii to produce a model forflow and bed topography. He claimed that the velocity defect law bestdescribes velocity distribution in rivers. He first approximatedtwo-dimensional bend flow, and subsequently included some second-ordercalculations to take into account the effect on the flow field of radialvariations of depth and velocity. Bridge (1978) used Engelund's approachfor bends approximating sine-generated paths. In his model, there is nocross-stream discharge of sediment at equilibrium, and grain sizeincreases with increasing shear stress, so that the maximum sedimenttransport is towards the centre of the channel.
67

There has been much criticism of the approach taken by Engelund andBridge. Dietrich and Smith (1984) point out that there are severaldeficiencies in the flow and the force balance equations. In particular,they argue that convective accelerations should not be consideredsecond-order effects, but are important enough to be consideredzero-order, ie. of primary importance. Although this hypothesis may becorrect, Dietrich and Smith found that their model is very sensitive to theconvective acceleration terms. This means that to apply their modelsuccessfully, measurements of the elevation of the water surface have tobe accurate to within a fraction of a millimetre (Anthony, 1987). Theyclaim their results to be supported by the flume data of Yen (1970). Theimplication of their argument is that the core of maximum sedimenttransport crosses the channel in a bend. Because of convectiveaccelerations, the equilibrium bed slope is one that causes sufficientcross-stream bedload transport against the inward secondary currents,that the zone of increasing boundary shear stress in the pool is balancedby a convergence of sediment transport; the cross-stream sedimentdischarge is not zero. In addition, they describe a more sophisticatedsorting procedure for sand-bed channels where the migrating shear stressfield causes skewing of dune orientation. In the upstream part of the bend,where the maximum-i shear stress is near the inner bank, the inner bank endof dunes will migrate forward more rapidly than the outer bank ends, sothe dunes will be skewed across the channel. Troughwise currents in thelee of the dune cause inward transport of fine particles while larger onesroll outwards. Near the bend exit the shear stress peak, having crossedthe channel, causes the outer-bank end of the dunes to migrate morerapidly than the inner bank end, causing troughwise transport towards thepool even against the action of the main helix (figure 27). This is inaddition to the simple force balance sorting scheme proposed by Wilson(1973) which still operates on the stoss side of the dunes. They arguethat only where the shear stress field does not vary in the downstreamdirection (at the downstream end of a bend) will a particle force balancethat assumes no net cross-stream transport apply.
Decreasing shear stess Increasing shear stress
NBedform Cmt
o Coam= Sedimentm
-' k os-stearn•-velocityI
Figure 27 Sediment pathlines through a sand-bed meander bend. (Adaptedfrom Dietrich and Smith, 1984a).
68
Smith and Mclean (1984) further developed Dietrich and Smith's(1983) model, and successfully tested it against the flume data of Hooke(1975).Zimmerman and Kennedy (1978) proposed a model for transverse bed slope.They considered the spatially varying centrifugal force as exerting atorque force on the water. They balanced this force against the friction ofthe bed. They tested their results against flume data and agreement wasgenerally good except in the outer bank region. However, their model isonly applicable for fully-developed flow and can only produce a lineartransverse bed slope, although linear transverse bed slopes are seldomfound in river bends.
Another important distinction can be made between models that dealwith fully-developed flow and models that deal with developing flow.Most models deal with fully-developed flow, but Odgaard (1986a & b)argued that an understanding of the role of developing flow is critical iferosion and depostion in river bends is to be understood fully. He proposeda model, based on a solution to the equations for conservation of mass,conservation of momentum, and lateral stability of the stream bed, thataccounts for both developing flow, and convective accelerations. Withflow conditions varying in the downstream direction, the governingequations are complex and difficult to solve, so models in this class needmany simplifying assumptions. Kalkwijk and DeVriend (1980) wrote amodel for two-dimensional flow in order to simulate flow in river bendswhere the depth is small compared to the width, and the width is smallcompared to the radius of curvature. They found good agreement betweenthe results of their model and flume data. Discrepancies were foundbetween the measured and theoretical velocity profiles at the outer bank,and at the entrance to the bend where the theoretical results were ratherhigh. DeVriend and Geldof (1983) developed Kalkwijk and DeVriend's(1980) model and tested it using data from two bends on the RiverDommel, Holland. The agreement between measured and computed resultswas generally good, but the model did not work well for the bend exitsbecause they did not adequately account for the effect of secondary flow.
Chang(1984) developed a model (FLUVIAL-12) applicable to curvedalluvial streams with non-erodible banks, and able to simulate stream bedchanges during a given flow. FLUVIAL-12 is unique in that it can accountfor changes in stage. The model incorporates the major effects of helicalflow, and performed well when tested with data from the San LorenzoRiver.
Models Used
Two models were applied to predict the ratio of outer bank to averagevelocities in bendways: those of Bridge (1_012) and Odgaard (1988). Thesemodels were unusual in that their authors were willing to make them fullyavailable to us and assist us in their application. Most modellers do not
69

release their models in this way for a variety of reasons. Others supplied
copies of papers reporting their models, but not computer codes. The task
of rewriting entire codes for extremely complex models was simply
beyond the resources available to this project.The details of the models may be found in papers authored by Bridge
(1982) and by Odgaard (1988). Some additional parameters were requiredfor application of the models. These are listed in Appendix B.
Menu-driven FORTRAN programs were produced by a researchassociate, Dr Andrew Markham on the basis of complete codings suppliedby the authors. A disk with the menu-driven programs may be found at theend of this report, in Appendix C. These programs were used to produceestimates of the maximum depth averaged velocity over the toe of theouter bank at each natural and laboratory channel bend.
Results of Model Applications
The results are listed in Table 11. Bridge's model failed for bendswith very low radius to width ratios (Rc/w < 1), which caused the modelto crash. Odgaard's model failed in many more cases. The problem wasthat in long bends the model predicted negative water depths at the innerbank, leading to its crashing. Further work on the model has so far failedto resolve this problem, although a solution must be possible. Probably, itwill be essential to work directly with Prof. Odgaard to solve it.
Analysis of Results
The results are plotted as observed versus predicted outer bankvelocities in Fig. 28. The agreement is generally quite good, althoughsystematic errors are apparent in both graphs. In the case of Bridge'smodel these can be largely explained by a plot of the percent error, definedby:
(observed V=,- predicl V) 0CTO = -observed V,,0
versus the Rc/w ratio. The results are plotted in Fig 29. Bridge's model is
seen to give generally excellent accuracy for bends with Rcfw valuesgreater than 2, but to be unacceptable for tighter bends with Rc/w < 2.This accords with the theory of bend flow, the results of the data basedapproach and Bridge's own guidelines on the use of his model. More dataare needed for Odgaard's model, but the preliminary results show that it isprone to underestimating the toe velocity by up to about 30 percent. Thisoccurs because for bends with coarse sand or gravel beds the model doesnot predict the bed scouring at the outer bank which is observed in nature.Outer bank depths are only marginally greater than centerline depths, andlikewise outer bank velocities are only slightly greater than the centerlinevelocity. However, the errors do not increase markedly at low Rc/wvalues, and the model is consistent right down to Rc/w = 0.8.
70

Table 11. Results of Model Tests
Observed Vtoe Rc/w Bridge's Vtoe Error (%) Odgaard Vtoe Error (%)
1 0.80 2.87 0.90 -12.500 0.52 35.0002 0.80 0.82 0.56 30.0003 0.60 0.75 0.42 30.0004 1.10 0.88 0.67 39.1005 1.35 1.75 1.70 -25.9006 0.80 1.25 0.45 43.800 0.57 28.7007 0.74 1.27 1.25 -68.900 0.66 10.8008 0.70 1.27 0.92 -31.4009 0.69 2.92 0.70 -1.400
10 1.05 7.92 0.95 9.50011 0.95 6.58 0.99 -4.20012 1.03 3.76 1.02 0.97113 0.80 1.12 1.06 -32.50014 0.93 0.8015 0.83 7.83 0.72 13.30016 0.74 1.94 0.99 -33.80017 0.70 4.70 0.78 -11.40018 0.98 3.80 1.59 -62.200 0.93 5.10019 1.60 4.84 1.39 13.100 1.35 15.60020 1.46 17.90 1.48 -1.40021 1.53 16.23 1.48 3.30022 1.62 10.00 1.47 9.30023 1.55 9.34 1.56 -0.64524 1.69 8.23 1.70 -0.59225 1.81 13.85 1.62 10.50026 1.55 9.64 1.63 -5.20027 1.55 9.26 1.54 0.64528 1.67 11.75 1.66 0.59929 1.54 21.62 1.58 -2.60030 1.69 11.92 1.84 -8.90031 0.55 2.72 0.57 -3.600 0.45 18.20032 0.61 2.42 0.50 18.000 0.45 26.20033 0.75 2.00 0.67 10.700 0.60 20.00034 1.60 4.85 1.77 -10.60035 0.52 4.5 0.50 3.800 0.40 23.10036 0.55 4.5 0.56 -1.800 0.47 14.50037 0.60 4.5 0.59 1.700 0.47 21.70038 0.46 8.0 0.46 0.000 0.41 10.90039 0.48 8.0 0.48 0.000 0.43 10.40040 0.35 3.0 0.29 17.100 0.30 14.30041 0.35 3.0 0.29 17.100 0.30 14.30042 0.55 0.55 0.000 0.49 10.90043 0.73 0.70 4.100 0.66 9.60044 1.36 1.06 22.100 1.06 22.10045 1.39 1.05 24.500 1.08 22.30046 0.73 0.76 -4.100 0.57 21.90047 0.68 0.76 -11.800 0.57 16.20048 0.42 0.35 16.700 0.37 11.900
71

Fig. 28 Results of Model Tests
Analytical Approach - Bridge's Model
2-
xx2x*X
CD Ix " x
CD x
0 0
0 2I
Observed Utoe (m/s)
Analytical Approach - Odgaard's Model
S2.0-
EV
2- 1.5-
C-
r 0.5
S0.0
0.0 0.5 1.5 2.0Observed ltoe (m/s)
72

Fig. 29 Error Distributions as a Function of Rc/w
Analytical Appoach - Bridge's Model
6 0 .. 1 1 1
40 - -
20 --= -
__0_" - " - - "- -- = .o-20-
L . gEmS-40-
-60--
-80100 101 102
Rc/W
Analytical Approach - Odgaard's Model
6 0 - 11 11...- -
40- - - I30- --. l20- -, l1 0' ..
..- 2 0 I I30i-40 -. .- --50-
-60 li-i-70 iI-80 II
10" 100 10' to2Rc/w
73

Prediction of Outer Bank Velocity in Natural Channel Bendways
On the basis of this test, Bridge's model can be relied upon to predict
the outer bank velocity in a bend to within approximately +/-15 percentfor bends with Rc/w greater than 2. This would appear to make it a strongcandidate for adoption as a design method. For engineering designpurposes it might be desirable to introduce a factor of safety of 1.15 tothe predicted velocity to ensure that any error is on the safe side.Bridge's model should definately not be used for bends with Rc/w < 2,where it is prone to large errors.
Bridge's model is available in menu driven format for IBM PCcomputers or compatible machines, and it is relatively easy to use(Appendix A).
Odgaard's model could not be fully tested as it crashed for many ofthe bends studied. For the bends at which it did work, errors werebetween 5 and 40 percent, for bends with Rc/w ratios between 0.8 and 5.Further work is needed before Odgaard's model could be recommended aoruse as a design method, but the fact that it does not fail for short, tightradius bends is very encouraging.
Conclusions
The prediction of outer bank velocity in bendways is a complicatedproblem. This velocity is affected by a number of factors, which are
themselves closely inter-related. A data based approach seeks to developa predictive equation by examining the relationship between independentand dependent variables illustrated by observations in real flows. Ananalytical approach attempts to use basic physics and the laws of motionto derive equations describing bend flow. It must be remembered thoughthat even the "analytical" approach involves assumptions concerning thethree dimensional nature of the flow, and calibration using empirical data.
To a scientist the analytical approach is preferable philosophically,provided that the underlying theory is sound. It is not yet agreed that
this is so for the models tested here, and so they merit use only if theycan produce acceptable results. This appears to be the case for the Bridgemodel.
Recommendations
It would be foolish to base a new design method on the results of asingle, relatively small, study. Consequently, it is recommended that:
1. Follow-up work be undertaken to verify the findings reported here. Inparticular, further experimental work is needed in laboratorychannels with a mobile bed and static banks to investigate how thepattern of bed scour affects the distribution of velocity adjacent to
74

the bank.2. Field data on shear stress distributions on the outer bank "tre
essential it that approach to riprap sizing is to be sustained.3. A major initiative on flow in very tight berids of Rc/W < 2 is needed.
It is clear that results from longer radii's bends cannot be backextrapolated into this zone. The flow in ruch bends can impinge onthe outer bank at a very acute angle. This links the problem to that ofimpinging flow in braided channels.
4. A better definition of outer bank velocity is needed. This study hasshown that in many cases the maximum flow attack on the outer bankoccurs on the bank face some distance above the toe, rather than atthe toe itself. This is not accounted for in the present designapproach.
5. For natural channels it appears that different equations may beappropriate for bends with straight and meandering approachchannels. If this is true in general, it has important implications 'orriver training and stabilization.
6. Several of the equations produced here deserve further testing andconsideration as design methods.
7. On the basis of this study, the model developed by John Bridge of theState University of New York at Binghamton appears to predict outerbank velocity to within +/-15 percent ior bends with Rc/w > 2. It istherefore recommended as a possible design approach to riprap s~zirg.
75

REFERENCES ON RIVER MEANDER FLOW
Anthony, D.J. 1987. 'Stage-dependant channel adjustments in a meanderingriver, Fall River, Colorado', thesis presented to Colorado StateUniversity, Fort Collins, Colorado in partial fulfillment of therequirements for the degree of Master of Science, 180pp.
Bagnold, R.A. 1960. 'Some aspects of the shape of river meanders', USGSProfessional Paper, 282E.
Bagnold, R.A. 1966. 'An approach to the sediment transport problem fromgeneral physics', USGS Professional Paper, 422-1.
Bagnold, R.A. 1980. 'An empirical correlation of bed-load transport rates influmes and natural rivers', Proc. Royal Society of London Series A,372, 453-473.
Barrage, A. and Dracos, Th. 1976. 'Turbulence measurements in rivers',Procedings of the 2nd International IAHR symposium on stochastichydraulics, 2-4 August, 1976.
Bathurst, J.C. 1977. 'Resistance to flw in rivers with stony beds', thesispresented to the School of Environmental Science, University of EastAnglia, Norwich in complete fulfillment of the requirements of thedegree of Doctor of Philosophy, 401pp.
Bathurst, J.C. 1979. 'Distribution of boundary shear stress in rivers', in D.D.Rhodes and G.P. Williams (eds), Adjustments of the Fluvial System,Procedings of the 10th annual geomorphology symposium, New York,21-22 September, 1979.
Bathurst, J.C. Thorne, C.R. and Hey, R.D. 1977. 'Direct measurements ofsecondary currents in river bends', Nature, 269, 504-506.
Bathurst, J.C. Thorne, C.R. and Hey, R.D. 1979. 'Secondary flow and shearstress at river bends', Journal of the Hydraulics Division, Proc. ASCE,105 (HY10), -)77-1295.
Bejan, " 1982. ':Yeoretical explanation for the incipient formation ofme:- ders in .i".iht rivers', Geophysical Research Letters, 9 (8),831-834.
Best, J.L. and Reid, ,. 1984. 'S9paration zone at open-channel junctions',Journal of Hydrauilc Engineering, 110 (11), 1588-1594.
Beven, K.J. Kirkby, M.J. Schofield, N. anJ Tagg, A.F. 1984. 'Testing aphysically- based flood forecasting model (Topmodel) for three UKcatchments', Journal Lp Hydrology, 69, 119-143.
Bhowmi"-,, N.G. 1979 'Hydraulics of Flow in the Kaskasia River, Illinios',Report of I nvestigation 91, Illinios State Water survey/RI-91/79.
Bhc,.--ik, N.G. 1982, 'Shear stress distribution and secondary currents ins'raight open channels'. In R.D Hey, J.C. Bathurst, and C.R. Thorne (eds),Gravel-Bed Rivers, Chi,,i-ister: Wiley, 36-51.
Blair, T.C. 1987. 'Sedimentary processes, vertical stratifica:ion sequencesand geomorphology of the Roaring River Alluvial Fan, Rc.ky Mount;kinNational Park, Colorado', Journal of Sedimentary Petrologv, 57 ,1),
76

1-18Bray, D.I. and Ho, J.C.T. 1985. 'Boundary shear stress distribution in
60-degree rectangular open-channel bends', Proc. Canadian Society forCivil Engineers Annual Conference, Saskatuon. 319-339
Brice, J.C. 1974. 'Evolution of meander loops', Geological Society ofAmerica Bulletin, 85, 581-586.
Brice, J.C. 1983. 'Planform properties of meandering rivers', in RiverMeandering, Procedings of the conference Rivers '83, New Orleans,Louisiana, 24-26 October, 1983, 1-14.
Bridge, J.S. 1975. 'Computer simulation of sedimentation in meanderingstreams', Sedimentology, 22, 3-43
Bridge, J.S. 1976. 'Mathematical model and FORTRAN IV program to predictflow, bed topography and grain size in open-channel bends', Computersand Geosciences, 2, 407-416.
Bridge, J.S. 1977. 'Flow, bed topography, grain size and sedimentarystructure in open-channel bends: a three-dimensional model', EarthSurface Processes, 2, 401-416.
Bridge, J.S. 1978. 'Flow, bed topography, grain size and sedimentarystructure in open-channel bends: a three-dimensional model: a reply',Earth Surface Processes, 3, 423-424.
Bridge, J.S. 1982. 'A revised mathematical model and FORTRAN IV programto predict flow, bed topography and grain size in open-channel bends',Compters and Geosciences, 8 (1), 91-95.
Bridge, J.S. 1984. 'Flow and sedimentary processes in river bends:comparison of field observation and theory', in River Meandering,Procedings of the conference Rivers '83, New Orleans, Louisiana,24-26 October, 1983, 857-872.
Bridge, J.S. and Dominic, D.F. 1984. 'Bed load grain velocities and sedimenttransport rates', Water Resources Research, 20 (4), 476-490.
Bridge, J.S. and Jarvis, J. 1977. 'Velocity profiles and bed shear stressover various bed configurations in a river bend', Earth SurfaceProcesses, 2, 281-294.
Bridge, J.S. and Jarvis, J. 1982. 'The dynamics of a river bend: a study inflow and sedimentary processes', Sedimentology, 29, 4P9-541.
Brundett, E. and Baines, W.D. 'The production and diffusion of vorticity induct flow', Journal of Fluid Mechanics, 19 (3), 375-394.
Callander, R.A. 1978. 'River meandering', Annual Review of Fluid Mechanics,10, 129-158.
Carey, W.C. 1969. 'Formation of flood plain lands', Journal of the HydraulicsDivision, Proc. ASCE, 95 (HY3), 981-994
Carson, M.A. and Lapointe, M.F. 1983. 'The inherent assymetery of rivermeander planform', Journal of Geology, 91, 41-55.
Chakinski, T.M. ar,d Francis, J.R.D. 1952. 'Discussion of: On the origin ofriver meanders, by P.W. Werr.er', Transactions of the AmericanGeophysical Union, 33 (5), 771-773.
Chang, H.H. 1980. 'Stable alluvial canal design', Journal of the Hydraulics
77

Division, Proc. ASCE, 106 (HY5), 873-891.Chang, H.H. 1984. 'Regular meander path model', Journal of Hydraulic
Engineering, 110 (10), 1398-1411.Chang, H.H. 1985a. 'Water and sediment routing through curved channels',
Journal of Hydraulic Engineering, 111 (4), 644-658.Chang, H.H. 1985b. 'Formation of alternate bars', Journal of Hydraulic
Engineering, 111 (11), 1412-1420.Chang, H.H. Simons, D.B. and Woolhiser, D.A. 1971. 'Flume experiments on
alternate bar formation', Journal of the Waterways, Harbors andCoastal Engineering Division, Proc. ASCE, 97 (WW1), 155-165.
Chen, G. and Shen. H.W. 1983. 'River curvature-width ratio effect on shearstress', in River Meandering, Procedings of the conference Rivers '83,New Orleans, Louisiana, 24-26 October, 1983, 687-699
Chitale, S.V. 1970. 'River channel patterns', Journal of the HydraulicsDivision, Proc. ASCE, 96 (HYl), 201-221.
Coleman, N.L. 1986. 'Effects of suspended sediment on the open-channelvelocity distribution', Water Resources Research, 22 (10), 1377-1384
DeVriend, H.J. and Geldof, H.J. 1983. 'Main flow velocity in short riverbends', Journal of Hydraulic Engineering, 109 (7), 991-1011.
Dietrich, W.E. 1987. 'Flow and sediment transport in river bends', in K.S.Richards (ed), River channels: environment and process, Oxford:Blackwell, 391 pp.
Dietrich, W.E. and Smith, J.D. 1983. 'Influence of the point bar on flowthrough curved channels', Water Resources Research, 19 (5),1173-1192.
Dietrich, W.E. and Smith, J.D. 1984a. 'Bed load transport in a rivermeander', Water Resources Research, 20 (10), 1355-1380.
Dietrich, W.E. and Smith, J.D. 1984b. 'Processes controlling the equilibriumbed morphology in river meanders', in River Meandering, Procedings ofthe conference Rivers '83, New Orleans, Louisiana, 24-26 October,1983, 759-769.
Dietrich, W.E. Smith, J.D. and Dunne, T. 1979. 'Flow and sediment transportin a sand-bedded meander', Journal of Geology, 87, 305-315.
Dietrich, W.E. Smith, J.D. and Dunne, T. 1984. 'Boundary shear stress,sediment transport and bed morphology in a sand-bedded rivermeander during low and high flow', in River Meandering, Procedings ofthe conference Rivers '83, New Orleans, Louisiana, 24-26 October,1983, 632-639.
Draper, N.R. and Smith, H. 1966. Applied regression analyis, Chichester:Wiley, 407pp.
Eakin, H.M. 1935. 'Diversity of current direction and load distribution onstream bends', Transactions of the American Geophysical Union, II,467-472.
Einstien, H.A. and Harder, J.A. 1954. 'Velocity distribution and the boundarylayer at channel bends', Transactions of the American GeophysicalUnion, 35 (1), 114-120.
78

Einstein, H.A. and Li, H. 1958. 'Secondary currents in straight channels',Transactions of the American Geophysical Union, 39 (6), 1085-1088.
Einstein, H.A. and Shen, H.W. 1964. 'A study of meandering in straightalluvial channels', Journal of Geophysical Research, 69 (24),5239-5247.
Engelund, F. 1974. 'Flow and bed topography in channel bends', Journal ofthe Hydraulics Division, Proc. ASCE, 100 (HY11), 1631-1648.
Ferguson, R.I. 1973. 'Regular meander path models', Water ResourcesResearch, 9 (4), 1079-1086.
Ferguson, R.I. 1977. 'Meander migration: equilibrium and change', in K.J.Gregory (ed), River Channel Changes, Chichester: Wiley. 235-248.
Francis, J.R.D. and Asfari, A.F. 1970. 'Visualisation of spiral motion incurved open channel of large width', Nature, 225, 725-728.
Friedkin, J.F. 1945. 'A laboratory study of the meandering of alluvialrivers', US Army Waterways Experiment Station, Vicksburg,Mississippi.
Fujita, Y. and Muramoto, M. 1985. 'Studies on the process of development ofalternate bars', Bulletin of the Disaster Reseach Institute, KoyotoUniversity, 35 (314), 55-86.
Gardner, R.H. Huff, D.D. O'Neill, R.V. Mankin, J.B. Carney, J. and Jones, J.1980. 'Application of error analysis to a marsh hydrology model',Water Resources Research, 16 (4), 659-644.
Gessner, F.B. 1972. 'The origin of secondary flow in turbulent flow along acorner', Journal of Fluid Mechanics, 58 (1), 1-25.
Gessner, F.B. and Jones, J.B. 1965. 'On some aspects of fully developedturbulent flow in rectangular channels', Journal of Fluid Mechanics,23 (4), 689-713.
Gibson, A.H. 1908. 'On the depression of the filament of maximum velocityin a stream flowing through an open channel', Proc. Royal Society ofLondon, Series A, 82, 149-159.
Gulliver, J.S. and Halverson, M.J. 1987. 'Measurements of large streamwisevortices ir, an open channel flow', Water Resources Research, 23 (1),115-123.
Hack, J.T. and Young, R.S. 1959. 'Intrenched meanders o' the north fork ofthe Shenandoah River, Virginia', USGS Professional paper, 354-A.
Hawton, D.A. 1980. 'Problems and practicalities of the electromagneticflowmeter in stream flow measurements', final year undergraduateproject submitted tc the School of Environmental Science, Universityof East Anglia, Norwich in partial fulfilment of the degree of Bachelorof Science, 63pp.
Henderson, F.M. 1966. 'Open Channel Flow', London: Macmillan, 502pp.Hey, R.D. 1976. 'Geometry of river meanders', Nature, 262, p482.Hey, R.D. 1978. 'Determinate hydraulic geometry of river channels', Journal
of the Hydraulics Division, Proc. ASCE, 104 (HY6), 869-885.Hey, R.D. 1979. 'Causal and functional relations in fluvial geomorphology',
Earth Surface Processes, 4, 179-182.
79

Hey, R.D. and Thorne, C.R. 1975. 'Secondary flow in river channels', Area, 7(3), 191-195
Hey, R.D. and Thorne, C.R. 1981. 'Flow processes and river channelmorphology', in D.E Walling, and T.P. Burt (eds.), CatchmentExperiments in Fluvial Geomorphology, Norwich: Geo-Books.
Hey, R.D. and Thorne, C.R. 1986. 'Stable channels with mobile gravel beds',Journal of Hydraulic Engineering, 12 (8), 671-689.
Hickin, E.J. 1974. 'The development of meanders in natural river channels',American Journal of Science, 274, 414-442.
Hickin, E.J. 1977. 'Hydraulic facors controlling channel migration', in R.Davidson-Arnott, and W. Nickling, (eds.), Research in Fluvial Systems,Procedings of the 5th Guelph Geomorphology Symposium. Norwich:Geo-books, 59-72.
Hickin, E.J. 1978. 'Mean flow structure in meanders of the Squamish River,British Columbia', Canadian Journal of Earth Sciences, 15 (11),1833-1849.
Hickin, E.J. and Nansen, G.C. 1975. 'The character of channel migration onthe Beatton River, Northeast British Columbia, Canada', GeologicalSociety of America Bulletin, 86, 487-494
Hickin, E.J. and Nansen, G.C. 1984. 'Lateral migration rates of river bends',Journal of Hydraulic Engineering, 110 (11), 1557-1567.
Hinze, J.O. 1967. 'Secondary currents in wall turbulence', Physics of FluidsSupplement, 10, 5122-5125.
Hooke, J.M. 1987. 'Discussion of: Lateral migration rates of river bends, byE.J. Hickin and G.C. Nansen', Journal of Hydraulic Engineering, 113 (7),915-918.
Hooke, J.M. and Harvey, A.M. 1983. 'Meander changes in relation to bendmorphology and secondary flows', in J.D. Collinson and J. Lewin (eds.),Modern and Ancient Fluvial Systems, IAS publication no. 6, Oxford, UK:Blackwell, 121-132.
Hooke, R. leB. 1975. 'Distribution of sediment transport and shear stress ina meander bend', Journal of Geology, 83 (5), 543-565.
Hooke, R.leB. and Chase, C.G. 1978. 'Discussion of: Flow, bed topography,grain size and sedimentary structure in open channel bends: athree-dimensional model, by J.S. Bridge', Earth Surface Processes, 3,421-422.
Ikeda, S. Parker, G. and Sawai, K. 1981. 'Bend theory of river meanders. PartI. Linear development', Journal of Fluid Mechanics, 112, 363-377.
Ikeda, S. and Nishimura, T. 1985. 'Bed topography in bends of sand-siltrivers', Journal of Hydraulic Engineering, 111 (11), 1397-1411.
Ippen, A.T. and Drinker, P.A. 1962. 'Boundary shear stress in curvedtrapezoidal channels', Journal of the Hydraulics Division, Proc.ASCE, 88 (HY5), 143-179.
Jackson, R.G. 1975. 'Velocity-bedform-texture patterns of meander bendsin the Lower Wabash River of Illinois and Indiana', Geological Society
80

of America Bulletin, 86, 1511-1522.Jaeggi, M.N.R. 1987. 'Interaction of bed load transport with bars',in: R.D.
Hey, J.C. Bathurst, and C.R. Thorne, (eds), 'Gravel Bed Rivers',Chichester: Wiley, 829-841.
Julien, P.W. and Thorne, C.R. 'Discussion of: Flow and bed topography inalluvial channel bends, by A.J. Odgaard', Journal of HydraulicEngineering, 111(6), 1031-1033.
Kalkwijk, J.P.Th. and DeVriend, H.J. 1980. 'Computation of the flow inshallow river bends', Journal of Hydraulic Research, 18 (4), 327-342.
Keller, E.A. 1972. 'Development of alluvial stream channels: a five-stagemodel', Geological Society of America Bulletin, 83 (2), 1531-1536.
Kellerhals, R, Church, M, and Bray, D.I. 1976. 'Classification and analysis ofriver processes', Journal of the Hydraulics Division, Proc. ASCE, 102(HY7), 813-829.
Kirkby, M.J. Naden, P.S. Burt, T.P. and Butcher, D.P. 1987, 'ComputerSimulation in Physical Geography', Chichester: Wiley, 227pp.
Knighton, D. 1984. 'Fluvial Forms and Processes', London: Edward Arnold,218pp.
Langbein, W.B. and Leopold, L.B. 1966. 'River meanders-theory of minimumvariance', USGS Professional Paper, 422-H.
Lapointe, M.F. and Carson, M.A. 1986. 'Migration patterns of an assymetricmeandering river: the Rogue River, Quebec', Water Resources Research,22 (5), 731-743.
Leeder, M.R. and Bridges, P.H. 1975. 'Flow separation in meander bends',Nature, 253, 338-339.
Leliavsky, S. 1955. 'An Introduction to Fluvial Hydraulics', London:Constable and Co. 257pp.
Leopold, L.B. 1982. 'Water surface configuration in river channels andimplications for meander development', in: R.D. Hey, J.C. Bathurst, andC.R. Thorne, (eds), 'Gravel Bed Rivers', Chichester: Wiley.
Leopold, L.B. Bagnold, R.A. Wolman, M.G. and Brush, L.M. 1960. 'Flowresistance in sinuous or irregualr channels', USGS Professional Paper,282-D.
Leopold, L.B. and Langbein, W.B. 1966. 'River meanders', ScientificAmerican, 214, 60-70.
Leopold, L.B. and Wolman, M.G. 1957. 'River channel patterns-braided,meandering and straight', UfGS Professional Paper, 282-B.
Leopold, L.B. and Wolman, M.G. 1960. 'River meanders', Geological Society ofAmerica Bulletin, 71, 769-794.
Leopold, L.B. Wolman, M.G. and Miller, J.P. 1964. 'Fluvial Processes inGeomorphology',San Francisco: Freeman.
Lewin, J. 1976. 'Initiation of bed forms and meanders in coarse grainedsediment', Geological Society of America Bulletin, 87, 281-285.
Lewin, J. 1977. 'Channel pattern changes', in K.J. Gregory (ed.), RiverChannel Changes, Chichester: Wiley. 167-184.
Lewin, J. and Brindle, B.J. 1977. 'Confined meanders', in K.J. Gregory (ed.),
81

River Channel Changes, Chichester: Wiley. 221-233.Matthes, G.H. 1941. 'Basic aspects of stream meanders', Transactions of
the American Geophysical Union, 22 (3), 632-636.McCrea, G.H. and Bray, D.I. 1984. 'Effects of cross-sectional shape on open
channel bend flow', Proc. Canadian Society of Civil Engineers AnnualConference, Halifax, 515-529.
McCutcheon, 1988. 'Discussion of: Meander flow model. 1: Development', byA.J. Odgaard', Journal of Hydraulic Engineering, 819-822
Muller, A. 1976. 'Effect of secondary flow on turbulence in an open channelflow', Proc. 2nd International IAHR conference on stochastichydraulics, 2-4 August, 1976, 3.1-3.22
Nansen, G.C. and Page, K. 1983. 'Lateral accretion of fine-grained concavebenches on meandering rivers', in J.D. Collinson and J. Lewin (eds.),Modern and Ancient Fluvial Systems, IAS publication no. 6, Oxford, UK:Blackwell, 133-143.
Nelson, J.M. 1988. 'Mechanics of flow and sediment transport overnon-uniform erodible beds', thesis presented to the University ofWashington, in partial fulfillment of the requirements of degree ofDoctor of Philosophy, 228pp.
Noble, C.A. and Palmquist, R.C. 1968. 'Meander growth in artificiallystraightened streams', Proc. Iowa Academy of Science, 75, 234-242.
Odgaard, A.J. 1981. 'Transverse bed slope in alluvial channel bends',Journal of the Hydraulics Division, Proc. ASCE, 107 (HY12),1677-1693.
Odgaard, A.J. 1986. 'Meander flow model. I: Development', Journal ofHydraulic Engineering, 112 (12), 1117-1136.
Odgaard, A.J. 1986. 'Meander flow model. II: Applications', Journal ufHydraulic Engineering, 112 (12), 1137-1150
Odgaard, A.J. 1987. 'Streambank erosion along two rivers in Iowa', WaterResources Research, 23 (7), 1225-1236.
Odgaard, A.J. 1989. 'River-meander model. I: Development', Journal ofHydraulic Engineering, Vol. 115,No. 11, 1433-1450.
Odgaard, A.J. 1988. 'River-meander model. I1: Applications', Journal ofHydraulic Engineering, Vol. 115,No. 11, 1450-1464.
Odgaard, A.J. and Bergs, M.A. 1988. 'Flow processes in curved alluvialchannels', Water Resources Research, 24 (1), 45-56.
Osman, A.M. and Thorne, C.R. 1988. 'Riverbank stability analysis. I: Theory',Journal of Hydraulic Engineering, 114 (2), 134-150.
Osterkamp, W.R. 1978. 'Gradient, discharge and particle-size relations ofalluvial channels in Kansas, with observations on braiding', AmericanJournal of Science, 278, 1253-1268.
Parker, G. and Andrews, E.D. 1985. 'Sorting of bed load sediment by flow inmeander bends', Water Resources Research, 21 (9), 1361-1373.
Parker, G. Diplas, P. and Akiyama, J. 1983. 'Meander bends of highamplitude', Journal of Hydraulic Engineering, 109 (10), 1323-1337.
Perkins, H.J. 1970. 'The formation of streamwise vorticity in turbulent
82

flow', Journal of Fluid Mechanics, 44 (4), 721-740.Pitlick, J. and Harvey, M.D. 1987. 'Geomorphic response of Fall River
following the Lawn Lake flood, Rocky Mountain National Park,Colorado', Final report, contract no. DAAG29-85-K-0108, US ArmyResearch Office.
Pitlick, J. and Thorne, C.R. 1987. 'Sediment supply, movement and storagein an unstable gravel-bed river', in C.R. Thorne, J.C. Bathurst, and R.D.Hey (eds.), Sediment Transport in Gravel Bed Rivers, Chichester:Wiley, 151-178.
Prandtl, L. 1952. 'Essentials of Fluid Dynamics', London: Blackie, 452pp.Prus-Chacinski, T. 1954. 'Patterns of motion in open channel bends',
International Association of Scientific Hydrology, 38 (3), 311-318.Quraishy, M.S. 1944. 'The origin of curves in rivers', Current Science, 2,
36-39.Quick, M.C. 1974. 'Mechanism for streamflow meandering', Journal of the
Hydraulics Division, Proc. ASCE, 100 (HY6), 741-753.Rais, S. 1985. 'Analysis of flow close to the outer bank of a meander bend',
thesis presented to Colorado State University, Fort Collins, Colorado,in partial fulfilment of the requirements for the degree of Doctor ofPhilosophy, 287pp.
Raisz, D. 1955. 'Which way does a river meander ?', PhotogrammetricEngineering, 21, p738.
Reid, J.B.Jr. 1983. 'Artificially induced concave bench deposition as ameans of floodplain erosion control',in River Meandering, Procedingsof the conference Rivers '83, New Orleans, Louisiana, 24-26 October,1983, 295-304.
Richards, K.S. 1976. 'Morphology of riffle-pool sequences', Earth SurfaceProcesses, 1, 71-88.
Rozovskii, L.L. 1957. 'Flow of water in bends of open channels', translatedby the Israel Programme for Scientific Translation (1961), 233pp.
Schumm, S.A. 1963. 'Sinuosity of alluvial rivers on the Great Plains',Geological Society of America Bulletin, 74, 1089-1100.
Schumm, S.A. 1977. 'The Fluvial System', New York: Wiley-lnterscience,338pp.
Schumm, S.A, and Lichty, R.W. 1965. 'Time, space, and causality ingeomorphology', American Journal of Science, 263, 110-119.
Schumm, S.A. and Khan, H.R. 1972. 'Experimental study of channel patterns',Geological Society of America Bulletin, 83, 1755-1770.
Shen, H.W. and Komura, S. 1968. 'Meandering tendencies in straight alluvialchannels', Journal of the Hydraulics Division, Proc. ASCE, 94 (HY4),997-1015.
Siegenthaler, M.C. and Shen, H.W. 1983. 'Shear stress uncertainties in bendsfrom equations', in River Meandering, Procedings of the conferenceRivers '83, New Orleans, Louisiana, 24-26 October, 1983, 662-674.
Stearns, P.F. 1883. 'On the current meter, together with the reason why themaximum velocity of water flowing in open channels is below the
83

surface', Transactions of the American Society of Civil Engineers, 12,331-338.
Swan, D. Clague, J.J. and Luternauer, J.L. 1979. 'Grain-size statistics 2:Evaluation of grouped moment measures', Journal of SedimentaryPetrology, 49 (2), 487-500.
Tanner, F.W. 1960. 'Helicoidal flow, a possible cause of meandering',Journal of Geophysical Research, 65 (3), 993-995.
Taylor, G. Crook, K.A.W. and Woodyer, K.D. 1971. 'Upstream-dipping foresetcross-stratification: Origin and implications for palaeoslopeanalysis', Journal of Sedimentary Petrology, 41 (1), 578-581.
Thompson, A. 1986. 'Secondary flow and the pool-riffle unit: A case studyof the processes of meander development', Earth Surface Processesand Landforms, 11, 631-641.
Thomson, J. 1876. 'On the origins and winding of rivers in alluvial plains',Procedings of the Royal Society of London, 25 (5), 5-8.
Thorne, C.R. 1978. 'Processes of bank erosion in river channels', thesissubmitted to the School of Environmental Science,University of EastAnglia, Norwich, in complete fulfilment of the requirements of thedegree of Doctor of Philosophy, 447pp.
Thorne, C.R. and Lewin, J. 1979. 'Bank processes, bed material movementand planform development in a meandering river', in: D.D. Rhodes andG.P. Williams (eds), Adjustments of the Fluvial System, Iowa:Kendall/Hunt, 117-137.
Thorne, C.R. and Osman, A.M. 1988. 'Riverbank stability analysis, 2:Applications', Journal of Hydraulic Engineering, 114 (2), 151-172.
Thorne, C.R. Rais, S. Zevenbergen, L.W. Bradley, J.B. and Julien, P.Y. 1983.'Measurements of bend flow hydraulics on the Fall River at low stage',Water Resources Field Support Laboratory project report no. 83-9P,Fort Collins, Colorado.
Thorne, C.R. Zevenbergen, L.W. Bradley, J.B. and Pitlick, J. 1985.'Measurements of bend flow hydraulics on the Fall River at bankfullstage', Water Resources Division project report no. 85-3, Fort Collins,Colorado.
Thorne, C.R, Zevenbergen, L.W. Rais, S. Bradley, J.B. and Julien, P.Y. 1985.'Direct measurements of secondary currents in a meandering sand-bedriver', Nature, 315, 746-747.
Thorne, C.R. 1982. 'Processes and mechanisms of bank erosion', in: R.D. Hey,J.C. Bathurst, and C.R. Thorne, (eds), 'Gravel Bed Rivers', Chichester:Wiley, 227-259.
Thorne, C.R. and Hey, R.D. 1979. 'Direct measurements of secondarycurrents at a river inflection point', Nature, 280, 226-228.
Thorne, C.R. and Rais, S. 1983. 'Secondary current measurments in ameandering river', in River Meandering, Procedings of the conferenceRivers '83, New Orleans, Louisiana, 24-26 October, 1983, 675-686.
Van Alphen, J.S.L.J. Bloks, P.M. and Hoekstra, P. 1984. 'Flow and grainsizepattern in a sharply curved river bend', Earth Surface Processes andLandforms, 9, 513-522.
84

Varshney, D.V. and Garde, R.J. 1975. 'Shear distribution in bends inrectangular channels', Journal of the Hydraulics Division, Proc. ASCE,101 (HY8), 1053-1066.
Werner, P.W. 1951. 'On the origin of river meanders', Transactions of theAmerican Geophysical Union, 32 (6), 898-902.
Wilson, I.G. 1973. 'Equilibrium cross-section of meandering and braidedrivers', Nature, 241, 393-394.Woodyer, K.D. 1970. Discussion of:'Formation of flood plain lands', by W.C. Carey, Journal of theHydraulics Division, Proc. ASCE, 96 (HY3), 849-850.
Yalin, M.S. 1972. 'The Mechanics of Sediment Transport', Oxford: Pergamon,298pp.
Yang, C.T. 1971. 'On river meanders', Journal of Hydrology, 13, 231-253.Yen, C.L. 1970. 'Bed topography effect on flow in a meander', Journal of the
Hydraulics Division, Proc. ASCE, 96 (HY1), 57-73.Yen, C.L. and Yen, B.C. 1971. 'Water surface configuration in channel bends',
Journal of the Hydraulics Division, Proc. ASCE, 97 (HY2), 303-321.Zimmerman, C. and Kennedy, J.F. 1978. 'Transverse bed slopc in curved
alluvial streams', Journal of the Hydraulics Division, Proc. ASCE, 104(HY1), 33-48.
85

APPENDIX A - SOURCES OF DATA USED IN THIS PROJECT
86

Source of data for natural cihannels.
Anthony, D.J. (1987). "Stage dependent channel adjustments in a
meandering river, Fall River, Collorado." MSc. Thesis. Colorado State
Univ.
Bathurst, J.C. (1977). "Resistance to flow in rivers with stoney beds." PhD.
Thesis. Univ. of East Anglia. U.K.
Bhowmik, N.G. (1979). 'Hydraulics of flow in the Kaskaskia River,
Illionois." Report of Investigation 91. ISWS/RI - 91179.
Bridge, J.S., and Jarvis, J. (1985). "Flow and sediment transport data."
De Vriend, H.J., and Geldof, H.J. (1983). 'Main flow velocity in short and
sharply curved river bends. Communications on hydraulics Report No.
83-6.
Dietrich, W.E., and Smith, J.D. From 'Boundary shear stresses and sediment
transport in river meanders of sand and gravel.' In River Mendering,
American geophysical union, Water Resources Monagram. Ikeda, S, and
Parker, G. (eds.).
Markham, A.J. (1990). "Flow and sediment processes in gravel bed river
bends." PhD. Thesis. Queen Mary and Westfield College, Univ. of London.
Maynord, S. (1990). On behalf of the U.S. Army Engineering Waterways
Experiment Station.
Odgaard, A.J., and Mosconi, C.E. (1987). "Streambank protection by
submerebed vanes." J. Hydr. Engrg., ASCE, 113(4), 520-536.
87

Sources of data for trapezoidal channels.
Odgaard, A.J., and Bergs, M.A. (1988). *Flow processes in curved alluvial
channel." Wat. Res. Res., 24(1), 45-56.
Odgaard, A.J. (1984). *Flow and bed topography in alluvial channel bend."
J. Hydr. Engrg., ASCE, 110(4), 521-536.
WES. Received from S. Maynord of the Hydraulics Laboratory Structures
Division of the US Army Engineering Waterways Experiment Station.
Ippen, A.T., and Drinker, P.A. (1962). "Boundary shear stresses in curved
trapezoidal channels." J. Hydr. Div., ASCE, 88(5), 143-179.
Yen, B.C. (1965). "Characteristics of subcritical flow in a meandering
channel." Thesis, Inst. for Hydr. Res., Univ. of Iowa, Iowa City, Iowa.
Hicks, F.E., Jin, Y.C.. and Steffler, P.M. (1990) *Flow near sloped bank in
curved channel." J. Hydr. Engng. ASCE 116(1) 55-70.
88

Sources of data for reclanoular cannels.
Fox, J.A., and Balt, D.J. (1967). 'The analysis of secondary flow in bends
in open channels." Proc. Inst. of Civil Engrs. 39 Paper No. 7087.
467-475.
Rozovskli, (1961); Kikawa et al, (1976); and Struiksma et al, (1986)
from Johannesson, H. and Parker, G. (1989) "Velocity redistribution in
meandering rivers.* J. Hydr. Engrg., ASCE, 115(8), 1019-1039.
Onishi, Y., Jain, S.C., and Kennedy, J.F. (1972) "Effects of meandring on
sediment discharges and friction factors of alluvial streams." Report
No. 141. Inst. for Hydr. Res., Univ. of Iowa, Iowa City, Iowa.
Mc Crea, G.H., and Bray, D.I. (1984). 'Effects of cross-sectional shape on
open channel bend flow.* Proc. from the 1984 CJCE Annual Conference,
Halifax, N.S. May 23-25 1984 pp.515-529.
de Vriend, H.J., and Koch, F.G. (1977) 7Flow of water in a curved open
channeP with a fixed plane bed." Delft Hydraulics Lab., Delft Univ. of
Technol., T.O.W. Report R657-V/M1415-11.
de Vriend, H.J., and Koch, F.G. (1978) "Flow of water in a curved open
channel with a fixed uneven bed." Delft Hydraulics Lab., Delft Univ. of
Technol., T.O.W. Report R657-VIl/M1415-11.
Yen, C.L. (1967) "Bed configurationand characteristics of subcritical
flow in a meandering channel.) Thesis presented to the University of
Iowa, lowa City, !owain partial fulfilment of the requirements for
the degree of Doctor of Philosophy.
89

APPENDIX B - ADDITIONAL PARAMETERS USED IN MODELING APPROACH
90

AESEARCHER RIIVI SITE BEND SLOPE DARCY- DLSCH4AILGE 5(USPA lYS(NI0"3) WVSaRAO (m 3
,s)
MatmOu"int FaG RamcB I iA6 0.27 Z.2 1.43
Thimm at l. Fhll Re A I 1.16 0.21 .A L3
Thme tIL sFi Rau A 2 2.14 0.73 4.65 3Im
ThemLat FAig RmbcA 3 129 0.19 V75 1.9
MUarh*m& ms Raft LovhIm5 I Ii 0.14 17,63 1359
11=4 FNo Rmauh 1 1 1.73 2.33 4 2.2
7rmm Fait Remb 1 2 1.73 0.25 4 22
Arndony Fal Rmach 4 I 1.32 0.36 4 2i
DBh•k &Jais SouthEsk 1 GleCn a s "cs Z1 1.1
Bloawmik KukL*b RbON I I 0.2W 0.0.5 120.6 1.07
B110-m k Knmmk 9mb 1 2 0.203 0.077 1402 1.07
Bhu4mmk Kumaklk ReUac 1 3 0.203 0.0905 122.3 1.22
Bhlow,•k Kakb b Re1c 4 0.203 0.159 36.4 2.59
Btmmik Kukmkia Reach 1 5 0.203 0.116 95.1 2.67
Bhmn Kmkmmd Raich 2 2 a 117 0.034 101.1 1.08
EBowik KMaaki Reawl 2 3 0.1t`7 0.091 105.7 4.36
Btotwnk Knumkk Reach 2 4 .LI17 0.091 102.2 123
Bhdmt & Thrme Seven Ma6 Mawr I 1.61 0.093 15.3 1.11
Buamust & Thorme Severn kty Bidge 1 1.3 0.049 10.7 1.06
Maynard Miuomd thmes lmd 1 0.19 0.049 1433.5 1.13Mayn•rd Missouri Snydar rd 2 0.39 0.044 1492.3 1.07
Maynar Miusom Glove Poinsue6d 3 0.19 0.052 1435.4 1.21
Maynard Miouri Winnela aOW 4 0.19 0.043 1495.4 1.27
msrm Missoui UpyeOmah Mksslon 5 0.19 0.037 1602.1 1.06
Maynrd Miamori Middl Omal~m Miskm 6 0.19 0.039 1531.2 1.14
Maynard Missoi Lowe Owm Missloe 7 0.19 0.04I 1621.4 1.03
Mayr/ad Missouri Upper MOmWm"nod 0.19 0.04 1595.3 1.02
Maya Missouri LowMr mm Bad 9 0.19 0.038 1796.4 1.24
Mayad M01ssl DBoibI D, BAa to 0.19 0.057 1562.6 1.15
Ma•nard Mimil Taville Bend 11 0.19 0.039 1419.1 1.13
de Vrkmd & GddoE floMsua bemNedeiusads 3 0352 0.11 1.3 1.3
de sVsend & Oddol D.mrAn ThoNedrlmda 2 0-52 0.116 1.26 1.05
Dekwb & Smith Muaddyi Ir Wymm5k I 3.4 0.145 0.36 1.07
lO- .&M...Ni"• nabot. .. . 6 .3 V.7 123 1.65
91

0 01 aI 11
0E
-- - - ----------. '.
=) ~ ~ -6 - %
AI A
LQ C0C
92

ci ac---Qeeci
Hlf
ci6 C @IIa
04s,Z91
GO.O.acS
El
093

ANALYTICAL AND EMPIRICAL PREDICTION OF SCOUR POOL
DEPTH AND LOCATION IN MEANDER BENDS
prepared for
US Army Engineer Waterways Experiment Station3909 Halls Ferry Road, Vicksburg, Mississippi 39180-6199
prepared by
Colin R. Thorne
University of NottinghamDepartment of Geography
University ParkNottingham, England NG7 2RD
and
Steven R. Abt
Civil Engineering DepartmentColorado State University
Fort Collins, Colorado 80523April 1992

SUMMARY
Bend scour due to bed erosion by curved flow leads to deep pools close to the outer bank in
meander bends.
The strength of helical flow which drives bend scour is known to be a function of the geometry of
the bend and the hydraulics of flow through the bend. Helical flow, fast near bank velocities and
deep scour all tend to de-stabilise the outer bank at a bend. Bendways are often the sites of severe
bank attack and retreat as a result. Consequently, a great deal of time and effort is spent on the
stabilisation of outer bank lines using dumped stone and riprap.
For a bank stabilisation scheme to be successful it must guard against both the erosive
velocity (and shear stress) of the flow and the deep scour of the b:d adjacent to the bank.
Experience shows that failure is just as likely to occur due to under-estimation and allowance for
toe scour than to under-design with respect to velocity.
In an earlier report the authors examined the methods available to predict near bank velocities
and bank shear stresses at the outer bank in bendways (Thorne and Abt, 1990). In this report the
authors go on to consider the methods available to predict near bank scour depth. Both analytical
and semi-empirical approaches are considered. The analytical approaches use existing and available
bend flow models developed by John Bridge and by Jacob Odgaaxd. The empirical approach is
based on a statistical analysis of hydrometric data from the Red River in Arkansas and Louisiana
undertaken by the first author on behalf of the Vicksburg Dismct, US Army Corps of Engineers.
These predictive techniques are tested using a dam set for over 250 bends assembled from a
variety of rivers around the world. All flows referred to in the set are high, in-bank flows
corresponding to 'formative' discharges in the channel. The dam set covers a wide range of sizes
of river from laboratory channels to very large alluvial streams. It also encompasses rivers with
bed materials ranging from sand to boulders. The rivers display both freely migrating bends with
outer banks formed in easily erodible alluvium, constrained bends with resistant outer banks and
stable bends with revetments at the outer bank.
The results confirm that there is a close relationship between bend geometry and scour depth
that may be characterised by a dimensionless graph with the ratio of bend radius of curvature
divided by crossing width (Re/w) on the x-axis and the ratio of bend maximum scour depth to mean
crossing depth (dmf/dbar) on the y-axis.

Application of the bend flow models produced mixed results. The Bridge model produced
wide scatter and generally tended to over-estimate scour depth. The model worked better for long
radius bends and errors increased alarmingly as the Rc/w value decreased to about 2. It is
recommended that application of this model be restricted to bends with Rc/w greater than 4 and that
it be recognised that errors of +50% are common and +100% are possible. Bridge has developed a
new model which should do better and will supply this for public use shortly (Bridge, personal
communication, 1992).
Odgaard's model consistently under-estimated scour depth. For smaller rivers predicted
values were about -50%, but on larger rivers the model crashed. However, unlike Bridge's model,
the results were consistent even for the tightest bends and actually did quite well for Rc/w = 1.
Under-predictions seemed to be due to the difficulty the model had in correctly predicting the
entrainment and transport of any sediments coarser than fine sand. If this problem could be over-
come, the model has great potential. It should be noted that the version of Odgaard's model used
here is being replaced by an up-dated and improved model (Odgaard, personal -.ommunication,
1992).
Overall, the empirical method produced the best agreement between observed and predicted
scour depths. Practically all predictions fell within +/- 50% of observed values across the whole
range of river scales, scour depths, bed materials and bend geometries. The great majority of the
predictions fall within a band of +30% to -25%, which is close to being acceptable for engineering
purposes.
It is therefore recommended that the empirical equation be further tested and evaluated for use
as an aid to scour prediction in bends where more sophisticated methods and models are
unavailable or inapplicable. This equation is:
(dmax/dbar) = 2.07 - 0.19 In (Rc/w)
where,
dmax = maximum scour depth in bend
dba- = mean depth at the upstream crossing
Re = bend radius of curvature
w = width at upstream crossing
The equation refers to maximum scour during high, steady, in-bank flows. It cannot be used
to predict low-flow scour, or scour variation with changing stage during a hydrograph. Also, care
must be taken if the equation is used to predict scour associated with flows greater than bankfull
stage. If them is significant inter-action beween the in-channel and overbank portions of the flow
then scour patterns and amounts are not predictable on the basis of in-bank hydraulics alone.
2
PREFACE
This project was sponsored by the Hydraulics Laboratory at the US Army EngineerWaterways Experiment Station. The project was monitored by Dr Steve Maynord. The work was
undertaken partly at Colorado State University and partly at the University of Nottingham,England. Throughout the project the active support of engineers and scientists at WES aided itscompletion. Essential data for the Red River were supplied by Mr Fred Pinkard, VicksburgDistrict, US Army Corps of Engineers. Data were acquired, reworked and tabulated by researchassistants at Colorado State and Nottingham with great tenacity and skill. The Principal
Investigators wish to record their thanks to each of the individuals for their valuable contributions.
3

TABLE OF CONTENTS
SUMMARY 1
PREFACE 3
CONVERSION FACTORS 7
MAIN TEXT 8
Introduction 8
Objectives 9
Review of Possible Approaches to be Adopted 10
Bend Migration and Bank Failure 10
Modeling Bend Processes 12
Approaches Adopted 14
Data-Base: Sources and Features 16
Sources of Data 16
Data-Base Characteristics 16
Thorne and Abt (1990) 16
Red River Hydrographic Surveys 17
British Gravel-Bed Rivers 17
River data from other Researchers 19
Laboratory Flume Data 20
Conclusions 20
Analysis of Data 20
Results of Scour Depth Predictions 20
Examination of Results 20
Thorne and Abt (1990) 20
Red River Hydrographic Survey 1981 21
Red River Hydrographic Survey 1969 2 1
British Gravel-Bed Rivers 22
River data from other Researchers 22
Laboratory Flume Data 23
Summary data for All Rivers 23
4

Conclusions 24
Scour in Revetted and Free Meanders 24
Extrapolation to High Flows 27
CONCLUSIONS AND RECOMMENDATIONS 28
REFERENCES 29
DIAGRAMS AND TABLES 33
5

List of Figures
Figure 1. Dimensionuess Maximum Scour Depth as a function of
Bend Geometry for data from Thorne and Abt (1990)
Figure 2. Dimensionless Maximum Scour Depth as a function of
Bend Geometry for Red River, 1981
Figure 3. Dimensionless Maximum Scour Depth as a function of
Bend Geometry for Red River, 1969
Figure 4. Dimensionless Maximum Scour Depth as a function of
Bend Geometry for British Gravel-Bed Rivers
Figure 5. Dimensionless Maximum Scour Depth as a function of
Bend Geometry for Data from Various Researchers
Figure 6. Dimensionless Maximum Scour Depth as a function of
Bend Geometry for Flume data
Figure 7. Observed vs Predicted Maximum Bend Scour Depths
for data from Thome and Abt (1990)
Figure 8. Observed vs Predicted Maximum Bend Scour Depths
for Red River, 1981
Figure 9. Observed vs Predicted Maximum Bend Scour Depths
for Red River, 1969
Figure 10. Observed vs Predicted Maximum Bend Scour Depths
for British Gravel-Bed Rivers
Figure 11. Observed vs Predicted Maximum Bend Scour Depths
for Data from Various Researchers
Figure 12. Observed vs Predicted Maximum Bend Scour Depths
for Flume data
Figure 13. Errors in Predicted Maximum Bend Scour Depth
for Natural River data from Thorne and Abt (1990)
Figure 14. Errors in Predicted Maximum Bend Scour Depth
for Red River, 1981
Figure 15. Errors in Predicted Maximum Bend Scour Depth
for Red River, 1969
Figure 16. Errors in Predicted Maximum Bend Scour Depth
for British Gravel-Bed Rivers
Figure 17. Errors in Predicted Maximum Bend Scour Depth
for Data from Various Researchers
Figure 18. Errors in Predicted Maximum Bend Scour Depth
6

for data from Laboratory Flumes
Figure 19 Observed versus Predicted Maximum Bend Scour for All Data
Figure 20 Errors in Prcdicte.d' Maximum Scour Depths for All Data
Figure 21 Observed N ,.."'As Predicted Maximum Bend Scour for
Revetteci Bends
Figure 22 Errors in Predicted Maximum Scour Depths for R.everted Bends
Figure 23 Semi-log Plot of Dimensionless Maximum Bend Scour Depth
for Reverted Bends
Figure 24 Observed versus Predicted Maximum Bend Scour for
Reverted Bends (Empirical and Revement Equations)
Figure 25 Errors in Predicted Maximum Scour Depths for Reverted Bends
(Empirical and Revetment Equations)
Figure 26 Semi-log Plot of Dimensionless Maximum Bend Scour Depth
for Free Meanders
List of Tables
Table 1. Base data for Natural Rivers from Thorne and Abt (1990)
Table 2. Calculated data for Natural Rivers from Thome and Abt (1990)
Table 3. Base data for Red River Hydrographic Survey, 1981 from Thome (1988)
Table 4. Calculated data for Red River Hydrographic Survey, 1981
Table 5. Base data for Red River Hydrographic Survey, 1969
Table 6. Computed data for Red River Hydrographic Survey, 1969
Table 7. Base data for British gravel-bed rivers from Hey and Thorne (1986)
Table 8. Calculated data for British gravel-bed rivers from Hey and Thorne (1986)
Table 9. Base data supplied by Other Researchers
Table 10. Calculated data for base data supplied by Other Researchers
Table 11. Base data for selected flume channels
Tab!e 12. Calculated data for selected flume channels
7

MAIN TEXT
Introduction
Most alluvial rivers have a meandering planform. Such rivers naturally migrate back and
forth across their flood plain by a combination of relatively orderly meander loop growth arnd
downstream progression which is interupted occasionally through abrupt by-passing of acute bends
by chute and neck cut-offs. Generally, meander growth and progression occur through retreat of
the outer bank and advance of the inner bank of a bend, although in particular cases this pattern
may be reversed. The resulting flood plain deposits vary widely in their composition and
engineering properties, depending on the depositionary environment in which they were produced.
Easily eroded meander belt alluvium generated by point bar deposition at the inner bank in bends is
interspersed by tougher back swamp deposits from slack water areas and resistant clay plugs in
abandoned channels (Fisk, 1943; 1947).
A great deal of engineering work is undertaken each year on rivers of all scales from small
creeks up to the Lower Mississippi to curtail and control the lateral activity of meanders. This is an
essential component of projects to improve navigation, increase flood capacity, stabilize banklines,
decrease flood plain destruction and reduce the downstream dredging requirement of the river.
Bank stabilization is achieved using structures made from a wide variety of materials and
combinations of materials and treatments. For example, on the Mississippi River upper bank riprap
and lower bank articulated concrete mattress (ACM) are used to protect against the erosive attack of
the near bank flow, together with bank regrading and sub-surface drai'age control to prevent mass
failure. On smaller rivers riprap may be used alone, or increasingly, its use in combination with
low cost alternatives and vegetation is a common solution.
Bank stabilization assumes particular significance where a levee or an important piece of
infra-strucrure is set back only a short distance behind the bank line. At such locations retreat of the
bank cannot be allowed because it would put the levee or structure in jeopardy. Yet despite
awareness of the potentially damaging impacts of failure, revetments do still occasionally fail,
resulting in retreat of the bank line, destruction of areas of the flood plain and, in some cases, the
loss of a section of levee. Riprap failure due to under-design of the size or thickness of the riprap
blanket are comparatively rare. More often the cause of failure is scouring of the bend pool
adjacent to the outer bank to a greater depth than that allowed for in the design of the revetment.
Scour below the toe of the revetment may trigger mass failure of the whole bank (including, or
followed by, the levee above) by one a variety of mechanisms. The mechanisms identified as being
the most critical include: rotational slip, slab-type collapse and retrogressive flow failure (Turnbull
et al., 1966; Torrey, 1988). Consequently, it is important to be able to predict the likely maximum
scour depth in a bend accurately when designing revetmenL
8

However, past studies have demonstrated the difficulty of making accurate prdictions of the
likely magnitude and location of the maximum scour depth in a bend. For example, some studies
have indicated that the severity of outer bank pool scour in revetted bends actually increases
compared to free, alluvial meanders (Friedkin, 1945; Thorne, 1988). Other studies have
concluded that the evidence is equivocal and have gone so far as to suggest that stabilizing the outer
bank with riprap may lead to a decrease in scour depth (Harvey and Sing, 1989). It is therefore
vital that improved approaches to scour depth prediction in meander bends be developed so that
scour potential may be accurately predicted and allowed for in the design of the revetment.
Predictions should and perhaps must allow for and include any increase in outer bank pool scour
that might follow stabilization of the bank line.
A further problem in scour pool prediction lies in the fact that pool scour is discharge related.
As stage rises it is generally found that pools in bends are scoured deeper, with the eroded material
being deposited on the shoals at the crossings between bends. On the falling stage at the end of the
event, material is re-eroded from the crossings and deposited in the next bend pool downstream.
Hence, there is no clear indication of the high stage bed topography once the flood has passed.
Observations of scour depth at low flows are relatively straight forward. However, it is much
more difficult to make observations of scour depths at high flows and so reliable field data are
scarce. Yet, it is usually during high flows that maximum scour occurs and it is during, or
immediately after, high flows that most failures occur. This explains why the design of
stabilization works is based on a flow of relatively long return period such as the 10 or 20 year
flood. In this regard it is desirable that methods be established to extrapolate observations or
calculations of scour depth for low or intermediate flows up to higher flow levels.
Objectives
In view of the numerous problems of bank instability encountered and the great expenditure
of funds on bank stabilization it is desirable that improved methods be developed to predict ,he
ultimate, maximum scour depth in bends of the meandering rivers. Ideally these aspects of channel
geometry should be predicted analytically, from the distribution of flow velocity and boundary
shear stress in the bend in general, and close to the outer bank in par-icular. But at present our
understar,--"ng of flow processes in bends is incomplete and our ability to snrilate the flow and
sedimentary processes numerically is limited. Also, existing approaches to flow and sediment
modeling are research based and often have data requirements that cannot be met in routine, day-to-
day applications. This has led to the development and use of empirical equations and curves based
on field and laboratory observation, but lacking a basis in the theory of fluid flow and
sedimentation in curved channels.
9

The technical objective of this project is to examine empirical and analytical approaches to
scour depth prediction in the light of increased data availability through river and flume studies and
in view of recent advances in bend flow modelling. The specific objectives are:
1. To compile an extensive and reliable data base on bend scour depths in relation to bend
geometry, boundary materials and flow hydraulics;
2. To examine the applicability and accuracy of present empirically derived predictors of
scour pool depth and location;
3. To test the applicability and accuracy of present analytical models of bend flow as
predictors of scour pool depth and location;
4. To identify if the erosion resistance and mass stability of the eroding outer bank plays
any identifiable role in affecting scour pool depth;
5. To establish the degree to which scour pool depth in revetted bends increases relative to
similar, unrevetted bends;
6. To examine the difficulties of extrapolating predictions based on flows of short return
period to long period or 'design flow' conditions; and
7. To recommend a best approach to scour pool depth and location prediction for alluvial
and revetted bends of natural channels for future research and development.
Review of Possible Approaches to be Adopted
Bend Migration and Bank Failure
Bend migration occurs through bank retreat and usually takes place as a result of erosion of
the bank and bed adjacent to the bank by the flow, coupled with periodic mass failures of the bank
und...: gravity. Processes and mechanisms of bank erosion and retreat have been reviewed in detail
elsewhere and are not exhaustively reported here (Thorne, 1978; US Army, 1981; Thorne, 1982;
Thorne and Abt, 1989; Thome and Abt 1990).
During failure the slump debris falls, slides, or flows to the toe of the bank under gravity. It
is removed from there by the river over a period of days, weeks or months. This is the basal clean-
out phase of bank erosion. While in place at the toe of the bank, slump debris tends to stabilize the
bank by protecting the intact bank from further flow erosion and by buttressing it against mass
failure. Hence, it is the rapidity with which it is removed and the bank re-eroded which primarily
determines the long-term rate of retreat of the bank (Thorne, 1978; Lapointe and Carson, 1987).
This is the case even in situations where the most obvious mechanism of bank retreat is mass
failure rather than direct entrainment by the flow. Removal of slump debris and continued bank
erosion depend on the near bank sediment balance between in-coming sediment from utstream and
10

out-going sediment downstream, which in turn depends on the distributions of near bank velocity
and boundary shear stress around the bend. If supply and removal rates are balanced then the
elevation of the toe is constant and the bank retreats by parallel reureat. However, if the scour
potential of the flow near the bank exceeds the supply of material from bank erosion and failures,
the bed is scoured to make up the deficit and elevation of the bed is lowered. Bed degradation has
the effect of further destabilizing natural banks and thereby increasing the volume and frequency of
mass failures. In this way the sediment flux at the toe is balanced and further scouring is
suppressed. But, if the outer bank is stabilized by a structure, mass failures do not occur and the
bank is non-erodible. In this case the ultimate scour depth is limited either by the resistance to
erosion of the substrate or by the decrease in bed shear that occurs when the pool approaches the
hydraulically determined maximum for the given bend geometry. If no resistant materials are
encountered and the bed material is not capable of armoring by selective entrainment, then very
deep scouring may occur before the bed topography fully adjusts to the imposed shear stresses at
the bed.
In this respect, models of flow and sediment processes in bends have highlighted the close
links between bed scour and bank erosion (Thome, 1978; Lapointe and Carson, 1987; Thorne and
Osman, 1988; Thorne, 1991). Investigations show the locus of bank erosion and retreat to closely
follow that of the scour pool in a bend. Partly this is the case because high flow velocities attack
both the bed and bank simultaneously, but also the very existence of a deep scour hole close to the
bank is itself a destabilizing factor with regard to mass failure. A deep scour hole increases both
the bank height and its steepness, both of which reduce the factor of safety with respect to mass
failure. There is evidence that the critical height for mass instability may represent a limiting factor
on scour depth in bends with banks formed in weak, alluvial materials (Trhome and Osmnan, 1988).
Conversely, deep scour holes are often associated with strong, cohesive banks. This is particularly
the case for resistant outcrops of backswamp or clay-plug materials in otherwise alluvial bends.
These outcrops often have significant scour holes associated with them.
These concepts and arguments explain why an increase in scour depth may follow
stabilization of a bank through the construction of a revetment. Care must be taken to properly
allow for this increased scour in the design of the structure in order to guard against failure by
launching. Conversely, scour should not be over-predicted as this leads to over-design of the
structure, poor cost effectiveness and wasted money.
The depth of scour is also discharge dependent. At low flows pools at bends tend to fill with
material washed off the crossing upstream. At medium flows pools are scoured of this temporarily
deposited material, while at the highest in-bank discharges the bed is scoured down further still.
This makes it difficult to predict maximum bed scour purely on the basis of bed topography
established from low-flow hydrographic surveys. Even if high flow soundings are available, it is
11

usually still necessary to extrapolate because the data refer to a flow lower than the design flood for
the structure.
Studies of bend migration and bank retreat have established that the rate and distribution of
bank erosion may be related to two fundamental factors: firstly the flow velocity adjacent to the
bank (for example Hasegawa, Parker, Ikeda; see Ikeda and Parker, 1991 for a state of art review)
and, secondly, the depth of scour adjacent to the bank (for example, Odgaard; see Odgaard, 1989
for a recent summary). Many researchers see these as alternative approaches and argue that if one
of the factors is successful then the other must be wrong. It is now well established that in nature
banks may retreat either because of flow erosion by direct entrainment, or because of toe scour and
mass collapse followed by basal clean-out. Hence, the two factors of near bank velocity and near
bank depth are complimentary to one another and in different circumstances either one may be
primarily responsible for controlling the rate and distribution of bank retreat. In this respect near
bank velocity and scour depth are recognised not as alternative factors in controlling bank stability
and retreat, but are complimentary factors.
Modelling Bend Processes
To translate this qualitative understanding of bend flow and sediment processes into a
quantitative and predictive approach depends either on the statistical analysis of empirical data
defining the relevant variables, or on the application of analytical models for depth averaged flow in
bends. The empirical, or data-based approach must be based on experience from a wide range of
types and scales of river. The limits to the data-base set limits to the applicability of the method and
to the reliability of the predictions. However, while it is desirable to use as large a data-set as
possible, close attention must also be paid to data quality. If spurious or unreliable data are
included, these greatly diminish the value of the data-base. Hence, the empirical approach is
essentially data-dependent and relies on wide ranging but high quality data. Conversely, to
understand the rationale for the selection of the particular models it is necessary to review briefly
the basis for two-dimensional bend flow modeling.
The complete equations of motion for flow in bends cannot be solved analytically. Provided
that certain simplifying assumptions can be made, then numerical solutions are possible (Smith and
McLean, 1982). However, controversy in the academic world centers on the nature of the
assumptions which are tenable.
The question the validity of assumptions is best addressed through consideration of the
relative importance of each of the terms in the equations for downstream and cross-streaam slopes at
meander bends. These equations have been derived from the governing equations for the vertically
averaged motion through bends by Smith and McLean (1984). The derivation requires that certain
assumptions be made, the main one being that shear stresses due to lateral boundary layers can be
neglected. Dietrich and Whiting (1989) give the slope equations so derived as:
12

S tzs)b < u.> d< us> < u,> (d< us > < u- >
rgh (1- N)g ci g (I-N) R-(t)b < 1 <u > u > <u >2= ,bs - + n
n rgh (1-N)Rg -N g • 2(1-N) Rg
where S = downstream water surface slope, Sn = cross-stream water surface slope, (tzs)b =
downstream component of total boundary shear stress, r = fluid density, g = acceleration due togravity, h = flow depth, <us > = vertically averaged downstream component of fluid velocity, N =
n/R (n = cross-stream coordinate, following the channel centerline and positive towards the leftbank, R = radius of curvature of the channel centerline), s = downstream coordinate, parallel to thechannel centerline and <un > = cross-stream component of fluid velocity. In a simplified form the
equations may be written:
S = S1 + S2 + S3 (3)
Sn = Snl + Sn2 + Sn3 + Sn4 (4)
Expressed in words, the first equation states that the downstream slope (S) is the sum of theslope components due to the downstream bed shear stress (S1 ), the downstream change inmomentum (S2 ) and the cross-stream change in momentum (S3). The second equation states that
the cross-stream slope (Sn) is the sum of slope components due to the cross-stream shear stress
(S n I), the centrifugal acceleration (Sn2), the cross-stream change in momentum (Sn3) and a smallterm produced by substitution of the continuity equation into the equations for fluid motion (Sn4 ).
Since Sn4 is small it can safely be neglected (Dietrich and Whiting, 1989).
These full equations show that the actual downstream slope cannot always be approximatedby the Darcy-Weisbach equation which only yields S I and which is only applicable to uniformflow (where S2 and S3 are zero), and that the actual transverse slope at a bend does not depend
only on the centrifugal acceleration, but is also affected by cross-stream shear stress and changes incross-stream momentum. A complete analysis of these factors is beyond the scope of this
proposal, but a few points may be made.With regard to the downstream slope, S, it is accepted that both S1 and S2 are important but
two schools of thought exist regarding the significance of S3 . Members of the first school basetheir approach on the seminal analysis by Engelund (1974) and hold that the S3 term is negligible.
Notable papers by Bridge (1977; 1984) and by Odgaard (1986; Odgaard and Bergs, 1988) follow
this approach and present field and flume data to support their case. The second school base their
13

approach on a re-examination of the equations of fluid motion undertaken at the University of
Washington in the late 1970s by a team of researchers including Dietrich, Dunne, McClean and
Smith (see Dietrich et aL., 1979; Dietrich, 1982; Dietrich and Smith, 1983; Die'ich et al., 1984;
Smith and McClean, 1984). They hold that the S2 and S3 terms are of comparable magnitude in
most natural rivers which have point bars and in which the local radius of curvature changescontinuously through the bend, although the S3 term may well be small in laboratory flumes which
lack point bars and have bends of constant radius. With respect to contrasts between sand-bed and
gravel-bed rivers, in a recent comparison reported by Dietrich and Whiting (1989) it was concludedthat the ratio of S3 to S2 in gravel-bed streams was similar to values in sand-bed streams despite
marked differences in curvature and bed grain size. This was taken to demonstrate that bed
topography effects, and particularly convective acceleration terms due to topographic steering by
the point bar, are the dominant controls on downstream slope at bends.With regard to the cross-stream slope, Sn , Dietrich and Whiting (1989) used derailed field
observations to show that the cross-stream momentum transfer term, Sn3, is only negligible if flow
at the bend entrance is skewed so that the maximum velocity is already near the outer bank. In
most rivers, where consecutive bends are of opposite curvature, this will not be the case and the
cross-stream discharge and momentum flux associated with the movement of the core of maximum
velocity from near the inner to near the outer bank will be an important factor in determining the
cross-stream water surface slope in both sand-bed and gravel-bed rivers.
Approaches Adopted
On this basis it would appear that models based on the Engelund approximations do neglect
significant terms and that models based on the full equations of Smith and McLean are preferable.
However, derivatives of the Smith and McLean analysis place such heavy requirements on the
accuracy and availability of data that they cannot be applied to field situations. For example, to
properly account for the effects of convective accelerations in bend flow it is necessary to know the
watt= surface topography in the bend to millimeter accuracy (Anthony, 1987; Dietrich and Whiting.
1989). This would be possible to measure at normal flow, in small rivers, although only at very
great expense. However, to use such models to predict the longterm bed configuration in large
rivers would not be possible and to deal with high flows of around bankfull discharge in even
medium sized watercourses is not feasible with present technology.
Recently, in an evaluation of several bend flow models Markham (1990) concluded that
models based on the Engelund approach and neglecting the convective acceleration terms can give
reasonable approximations of the main flow and morphological features of meander bends. He
found that the main features of bends are predictable, but that in detail every bend is different. This
14

is the case because each bend is the unique product of the sequence of flow events, approach
channel orientation and sedimentary materials encountered in the bed and banks. These factors are
stochastic and cannot be predicted deterministically. However, for practical and engineering
purposes there is no justification for attempting to predict them, since the fine details of flow and
morphology are usually of no consequence to engineering schemes to stabilize the bend. This
conclusion has also been reached by even the strongest advocates of the most complex bend flow
models, who agree that while "blue skies" and academic studies should strive to be geophysically
correct, much simpler models may be safely applied for practical and design work (Dietrich and
Whiting, 1989).
The most promising approach is, therefore, to use the latest versions of models developed
from the Engelund analysis and having data requirements which can realistically be met in real
world situations. In a previous study of outer bank toe velocities in bends Thorne and Abt (1990)
applied PC compatible versions of models by Bridge and by Odgaard which fulfil these criteria.
They were found to give outer bank velocity predictions which were better than those obtainable
from empirical curves provided that close attention was paid to the limits of applicability of the
models. The complete findings of that study are not repeated here since the work was undertaken
for WES under contract number DACW39-89-K-0015 and is reported in detail in the relevant
document (Thorne and Abt, 1990).
The technical approach in this project applies and tests the Bridge and Odgaard models as
predictors of scour pool depth. In parallel an empirical analysis of the data base will be undertaken
to develop morphometric relationships between independent variables describing the bend
geometry and dependent variables defining the location and severity of scouring in the bend pool.
A project along these lines was recently successfully completed using data from a 1981
hydrographic survey of the Red River, dealing with the reach between Index, Arkansas and
Shreveport, Louisiana (Thorne, 1988). Data from 70 bends was used to produce a regression
equation for the prediction of maximum bend scour (dma) on the basis of the mean depth of the
approach channel at the crossing upstream of the bend (dbar) and the bend geometry represented by
the ratio of bend radius (Rc)divided by width at the upstream crossing (w). The regression
equation for the empirical method is:
(dmax/dbar) = 2.07 - 0.19 In (Re/w) (5)
The correlation coefficient was 0.8 and was statistically significant at the 0.01 level of
confidence. The coefficient of determination was 0.64, indicating that variation in (Rc/w) was able
to account for 64% of the variation in (dmax/dbar). The lower limit to the applicability of the
equation is an Rc/w value of 2. This is consistent with the observation that the monotonic increase
15

in scour depth with decreasing Rc/w seems to stop at this value. A complete account of the
methodology is available in Thorne (1988).
Data-Base: Sources and Features
Sources of Data
The data used in this study come from a wide variety of types and sizes of rivers, located in
different physiographic regions and from different parts of the world. The data were compiled
from existing reports and papers supplement by information solicited in letters sent to researchers
known to be actively interested in bend flow. Different studies and researchers supplied
substantially different types of data. Hence, before embarking on the detailed analysis of the data,
it is necessary to review each of the data sources and the nature, scope and features of the material
supplied. This may seem unnecessary to readers, but it is in fact crucial. Before using any
observed data to derive or test empirical and analytical models it is vital to identify the particular
characteristics of the data that may substantially impact the results.
Data-Base Characteristics
Thorne and Abt (1990). The first data used came from Thorne and Abt (1990) and wmre
compiled in a project concerned with the prediction of depth averaged velocity over the toe of the
outer bank in meanders. The base data for natural rivers taken from Thorne and Abt (1990) are
shown in Table 1. These data were compiled especially to allow application of the Bridge and
Odgaard models and so all of the required parameters were already recorded. The data had been
screened in the previous study and found to be of high quality and reliability. But the previous
application to the prediction of near bank velocity did not involve knowing the maximum scour
depth at each bend and so no record of the observed value was made in Thorne and Abt's report.
In this study the original reports were re-examined and the maximum scour depths observed at each
study bend were extracted and added to the data base. It was noted that as the surveys were based
on surveying of a finite number of cross-sections (between three and seven per bend) it could not
be guarantied that the recorded maximum scour depth was actually the maximum observed
anywhere in the bend. Also it was noted that measurements corresponded to high, in-bank flows
in the rivers rather than to 'design flows' of long return period. The additional data used in this
study are also listed in Table 1.
The consistency of the data was checked by computing dimensionless parameters of bend
geometry and scour depth. The bend geometry is represented by the ratio of bend radius of
curvature (Rc) to width at the crossing upstream of the bend (w). The scour depth is represented
by the ratio of bend maximum scour depth (dmax) to average depth at the crossing upstream of the
bend (dbar). The results are listed together with other calculated parameters in Table 2 and are
16

plotted in a dimensionless graph in Fig. 1. This graph uses (Rc/w) on the x-axis and (dmax/dbar)
on the y-axis. Theories of bendflow (Bagnold, 1960). flume studies, engineering experience and
observations on natural rivers have shown that bend scour may be up to 3 times the mean depth in
the approach channel and that the peak scour usually occurs in bends with Rc/w in the range 2 to 3.
Examination of Fig. 1 indicates that these data are consistent with these rules of thumb and on this
basis there is no reason to doubt their validity.
Red River Hydrographic Surveys. The second and third sources of data in this study
are hydrographic surveys of the Red River between Index, Arkansas and Shreveport, Louisiana.
Two surveys were used, those of 1981 and 1969. The Red in this reach is highly mobile, with
rapid bank erosion, bend migration and planforrn evolution. Consequently, the bed topography,
bend geometry and planform configuration in 1981 bears very little relation to that in 1969. Due to
the changes occuring between these two dates, it may be concluded that the surveys yield
essentially independent data sets on the relationship between bend geometry and bed topography.
The base data for 1981 are shown in Table 3, which uses data taken from Thorne (1988) together
with additional data collected in this study. The depths in this data set are referenced to the water
surface profile for the two year flow, which was identified by Biedenharn et al. (1987) as a good
guide to the channel forming flow for this river. However, no measurements of the discharge
corresponding to the two year flow at each bend were recorded by Thome (1988). Information on
the variations in the volumetric discharge for the two year flow along the study reach were supplied
by the Vicksburg District, US Army Corps of Engineers. Also, a large amount of additional
information on the meander wavelength and channel sinuosity were required. The first Pl,working with the research assistants working on this project, used maps and aerial photographs
supplied by the Vicksburg District to make measurements of the relevant planform parameters for
the study bends. Calculated parameters used in this project are listed in Table 4. The Red River
base data from the 1969 hydrographic survey are shown in Table 5. with the derived data listed in
Table 6.
The dimensionless scour depth versus the Rc/w plots for the Red River surveys are shown in
Figs. 2 and 3. Both graphs show the expected distribution, with relative scour depth increasing as
Rc/w decreases, and peaking for Rc/w values of around two. While the maximum relative scour
depths for Rc/w = 2 to 3 arm substantially higher in 1969 than those for 1981, the overall shape of
the data cloud is the same. It may, therefore, be concluded that the Red River data are consistent
with existing knowledge.
British Gravel-Bed Rivers. The fourth data set comes from a study of stable gravel-bed
rivers in the United Kingdom reported by Hey and Thorne (1986). The data extracted from their
paper together with information on bend geometry obtained in this study, are shown in Table 7.
All of the required data for this study were present except the wavelength and radius of curvature
for each individual bend. Wavelengths and bend radii could not be measured in the field, as were
17

the other parameters in this Hey and Thome's data set, but were estimated from available 1:25,000
topographic maps. The scale of the maps and size of some of the channels was such that while
measuring wavelengths was straightforward, estimating the bend radius was difficult on the
smallest rivers. Thus the accuracy of Rc must be reduced in this data set.
It should also be noted that the observed maximum bend scour depths are based on a singlecross-section in each bend and may not necessarily represent the actual maximum for the bend.Sections were located in the field specifically with the intention of representing the maximum
expression of the pool geometry, however. It would therefore be expected that true maxima be
similar to the observed values, but they could be a little larger than those observed in some cases.
The calculated data obtained in this study are listed in Table 8 and the variation ofdimensionless scour depth with Rc/w is shown in Fig. 4. This shows the expected distribution,
with dimensionless scour increasing as Rc/w decreases and peaking for Rc/w of about two. The
highest values of relative depth are rather lower than those in the other data sets, consistent with the
fact that single sections do not always intersect the point of deepest scour.
An alternative explanation for the lack of dmax/dbar values greater than about 2.5 relates tothe geomorphological and sedimentary features of these rivers. The rivers are all gravel-bedded
and display a coarse surface layer on the bed. Bed material is known to be transported at high in-
bank flows, but only at relatively low rates. The coarse bed surface is called a mobile armor.
Many engineers and scientists belive that armoring of this type limits the depth of scour because
selective winnowing of the finer material leads to the scour hole becoming covered by a lag layer of
coarse sediment. In such cases the maximum scour depth for a bend would be less than that
observed in a similar bend with a sand bed, where scour potential was not limited by armoring.
Other researchers maintain that in a live-bed with an adequate supply of bed load from upstream,
scour depends more on flux inbalance between sediment supply and removal and that parricle size
does not significantly influence scour depth (Emmett Laursen, personal communication at ASCE
conferences).
Geomorphologically, these British rivers are in a post-glacial environment. The bed and
flood plain materials through which these rivers flow were laid down after the last ice-age, between
about 11,000 and 6,000 years ago. At that time melt water was abundant and the rivers were more
powerful than they are today. A case can be made that scour potential in such cases is limited by
the fact that the contemporary river has inherited its channel and sediments from a more energetic
predecessor. This inference is that present rivers are "underfit" with regard to the geometric and
geomorphic features of the channel and that they cannot adjust the channel to suit the current flow
regime. However, Hey and Thome (1986) report regime equations for the British rivers which are
very similar to those for other gravel-bed rivers known to be in adjustment (from the USA,
Canada, New Zealand) and so this seems unlikely.
18

It is concluded that the gravel-bed river data are reliable, that the channels are adjusted,
s~able, alluvial features and that any contrasts to the data from sand-bed rivers may be legitimately
attributed to the effects of the coarse bed material in these rivers.
River data from other Researchers. The fifth data set consists of river data supplied
by various other researchers in response to letters of enquiry. Letters were sent to 66 individuals
who are known to be working on bend flow. Of those who responded positively, only four
researchers sent data that were sufficiently complete in a timely fashion. Several data sets lacked
information vital to the application of the models. Follow-up letters were sent but replies have so
far not been received. Other data sets have arrived later, and too late for inclusion in this report.
Many researchers did not respond at all and several more politely declined to share their results until
they had exhausted their own analyses. The overall response was disappointing, but not
unexpected.
The data, listed in Table 9, cover a wide range of scales of flow. At the largest scale, they
include twelve bends from the River Ganges in Bangladesh. Since the data were supplied to us it is
not possible to check how it was derived in great detail, hence uncertainties concerning the da" are
greater than for the other sources. However, all the data are reported to refer to high, in-bank
flows and should be comparable to the other four data-sets. Calculated data derived from that
supplied are listed in Table 10. Plotting the dimensionless scour depth versus the Rc/w ratio (Fig.
5) shows the expected shape to the data cloud, but with marked differences to the other data-sets.
First it is noticeable that all of the bends have rather low Rc/w values. The longest bend has an
Rc/w of only 7 and most are below 3. In view of this, deep bend scour is to be expected. Even
so, the dimensionless scour depths are still surprisingly high. In one case the maximum bend
scour is over eight times the mean crossing depth, In 6 cases it is more than four times the mean
depth. These figures are out of line with all the other data collected in this study and this must cast
doubt on their validity. Examination reveals that the twelve highest points in Fig. 5 represent the
twelve bends on the River Ganges. It seems likely that these data are not directly comparable to the
rest. The explanation probably lies in the rather low mean crossing depths of the Ganges for a river
of such great discharge (Q = 29,500 cumecs). Regime equations for the Indian sub-continent
would suggest a crossing width of about 3,000 metres and a mean depth of about 7 metres. The
observed mean values for the twelve bends are 7,238 metres and 3.61 metres, respectively. From
this it may be concluded that the regime of the lower Ganges is not consistent with that of a single
thread meandering channel. The channel is much wider and more shallow and is in fact in the
transition zone between meandering and braiding. This is consistent with my field observations
that the river displays elements of both meandering and braided planforms. Hence, the data are not
a fair test of methods developed for single-thread meandering channels in dynamic regime. The
data points corresponding to the lower Ganges have been circled to identify them in Fig. 5 and are
not used further in the analysis.
19

Laboratory Flume Data. The sixth and final data set comprises data from laboratory
flume channels with mobile bed materials that have been used to simulate flow and bend scour in
river ben ds. These data are included for interest as it is felt that real river data present a better
vehicle than flume channels for tests of practical scour predictors. However, physical modeling
using mobile bed sediments demonstrates that flumes can simulate the morphology of real rivers
and so the data are included. The data are listed in Tables 11 and 12, and are plotted as
dimensionless scour depth versus Rc/w in Fig. 6.
ConclusionsThe data set prepared in this study contains data for 257 bends on natural rivers (excluding
the 12 on the Lower Ganges). It also contains 8 points for laboratory flumes for comparative
purposes. The data have been examined carefully and (with the exception of data for the multi-
channel Lower Ganges) are believed to be representative of high in-bank flows in rivers with
mobile bed materials and predominantly self-formed channels. It is known that some of the bends
have alluvial banks formed in erodible and unstable sediments while others have banks that are
formed by less erodible and more stable backswamp, clay plug and lithified materials. Others
bends still have banks which have been artificially stabilized and which are therefore non-erodible
and fully stable with respect to mass failure. This information will be used later, in the analysis of
the role of outer bank materials and stability in affecting scour depth, but the initial analysis is based
entirely on flow mechanics.
Analysis of Data
Results of Scour Depth Predictions
The data listed in Tables 1 to 9 were used to apply the analytical models of Bridge and of
Odgaard, and the empirical model of bend scour developed by Thorne (1988) for the 1981
hydrographic survey of the Red River. When assessing the results it must be remembered that the
empirical model must fit the Red River, 1981 data reasonably well, since it was developed from
those data. The other 5 data sets do, however, present a legitimate test of the empirical equation.
Observed versus predicted plots for maximum scour depth for each of the data sets are
shown in Figs. 7 to 12. There is considerable scatter evident in all the graphs. Errors in predicted
scour depths are plotted against bend geometry in Figures 13 to 18.
Examination of Results
Thorne and Abt (1990). The Bridge, Odgaard and Empirical methods were each
applied successfully to the data from a range of rivers contained in the Thorne and Abt data set.
20

The results, in Figures 7 and 13, show that overall the empirical method did best, with a reasonable
agreement between observed and predicted scour depths and errors generally less than +/- 30% and
always less than +/- 50%. Errors tended to be greater for tighter bends, that is at lower Rc/w
values, it should be noted that the tightest bends, with Rc/w less than 2 cannot be analysed using
the empirical method.
The Bridge model produces predictions which fall around the line of perfect agreement, but
which involve considerable scatter. Errors are most pronounced for tighter bends and rise to
greater than 200% for the most acute bends. For longer bends the method does much better, with
errors generally in the range +/- 50%. Poor performance in short radius bends was a feature of the
Bridge model in predicting outer bank toe velocity (Throme and Abt. 1990) and so this result is not
unexpected. However, even for the longer radius bends some overestimates of 80 to 90% occur.
The Odgaazd model underestimated bend scour in all but a few cases, with errors as great as
60%. Examination of Figure 7 shows that predictions are quite good for bands with scour depths
up to about 7 mec'es deep, but that they seriously under-estimate the observed depths for deeper
rivers. This problem was a direct result of the difficulty of getting the model to run for large rivers.
Error messages and warnings associated with the generation of negative depths at the inner bank
caused problems in the large rivers. Also, the model did not deal well with coarse sediments. If
the bed material was coarser than sand then all scouring was suppressed and the predicted
maximum scour depth was close to but a little more than the mean depth in the approach channel.
This problem was only overcome by using a sand grain size even when the indicated bed material
was coarser. This finding corresponds to earlier experience with this version of the Odgaard
model.
Red River Hydrographic Survey 1981. The Red River survey of 1981 provided the
data for development of the empirical (regression) method and it is therefore self-evident that the
method must work fairly well for those data. Even so, the predictions are quite good, wi.h errors
generally less than +/- 20%. Errors are greater for the tighter bends.
The data from the Red River include many tight bends which led to scour over-estimates of
up to 100% by the Bridge model. The predictions were better for longer radius bends, with errors
being in the range + 50% to - 20% for Rc/w greater than 4. Unfortunately, many bends in practical
problems have Rc/w values less than 4.
The Odgaard model does poorly for these data, all which come from bends which are really
too long for the model in its present form. The model systematically under-estimates the observed
scour depth with errors in the general range of -40 to -60%.
Red River Hydrographic Survey 1969. The second set of data from the Red River
produce similar r-,sults to the first. The empirical method does best, with predicted values
21

straddling the line of perfect agreement Errors are in the range +/- 30% over quite a wide range of
Rc/w values.
The Bridge model is again prone to large over-estimates of scour depth, especially for short
radius bends, with errors un to 100%. Performance is markedly improved for less acute bends
with Rc/w values greater than 4. For these bends the Bridge model usually under-estimates the
observed scour depth by about 20%.
Odgaard's model under-estimates scour by 30 to 80% across the whole range of bend
geometries. This is consistent with its performance in the other applications.
British Gravel-Bed Rivers. The fourth data set differs from the others in dealing
exclusively with gravel and cobble-bed streams. However, despite this marked contrast in bed
materials, the empirical method continues to produce the best agreement between observed and
predicted scour depths (Figure 10). Examination of the error distribution (Figure 16) shows nearly
all errors to be within the range +50 to -25%, over a wide range of bend geometries.
The Bridge model did not work well for the gravel-bed river data. It over-predicted scour
depth in most cases (Figure 10), with errors as great as 300% (Figure 16). Similarly to the
previous data sets, the most serious errors occurred in the tight, short radius bends with Rc/w less
than 4 and some excellent predictions are made for some bends. However, even for longer bends
over-estimates of 100% still occur in 7 cases.
The Odgaard model was not applied to the gravel-bed river data. In view of its performance
in the previous tests, it was clear that the coarse gravel, cobble and boulder sediments common to
all the rivers in this set would confound the model and result in predictions of minimal scouring
below the mean depth in the approach channel.
River data from various other Researchers. The fifth data set covered a variety of
rivers, but was edited to remove the observations from the Lower Ganges in Bangladesh. The
examination of the dimensionless scour depth indicated that the values of 6 to 8 for dmax/dbar
differentiated these data from the great majority of the other observations of bend scour and channel
geometry in single-thread meandering rivers.
The plot of observed versus predicted scour depth (Figure 11) shows that the points for the
empirical method scatter around the line of perfect agreement. Predictions are better for the deeper
scours, but the method over-estimates the maximum depth in some of the shallower bends, by
100% in one case, but more commonly by about 50%.
The Bridge model over-estimates scour depth in all cases, with errors of at least 50% and
greater than 100% in four cases.
22

The Odgaard model does quite well for bends with scour depths of less than 6 metres, but it
then does poorly for the deeper rivers. This performance is in line with experience in the previous
applications.
Laboratory Flume Data. Application to the laboratory flume data showed both the
empirical and Bridge approaches to be fairly reliable. Points for both methods scatter around the
line of perfect agreement in Figure 12, with errors generally in the range of +/- 20% shown in
Figure 18. However, the empirical method did seriously over-predict scour in one case (by 60%)
and for the same case the Bridge model also did comparatively poorly, being off by 33%. This is
the only case where the Bridge model actually performs slightly better than the empirical method.
Summary data for All Rivers
The separate examination and plotting of the data from the different sources may appear long
and time-consuming, but it was essential to establish the consistency of the results across the range
of river types, researchers and measurement techniques employed by the different studies. On the
basis of the examination of the results, it is clear that the performance of the models is in fact
generally consistent across all the data sets and that it is, therefore, safe to compile all the results
together in order to produce a comprehensive overview. Summary results are shown for all the
data in Figures 19 and 20.
Figure 19 compares observed and predicted scour depths for all 256 bends. The data cover
maximum scour depths that range from a few centimetres in flume channels up to about seventeen
metres in large rivers. This encompasses the likely scour in all but the world's greatest rivers.
WiLh regard to very large rivers, data for the Ganges River had, unfortunately, to be excluded
because of their inconsistency with the other observations. Data for selected bends of the Lower
Mississippi have already been examined in another study and may be reviewed there (Thorne and
Hubbard, 1991).
Generally, the empirical method produces the best overall agreement. The points cluster
around the line of perfect agreement and errors appear to be randomly distributed. Figure 20
shows that practically all the predictions fall with +/- 50% of the observed values across the whole
range of scour depths and bend geometries, and the vast majority fall within a band from +30 to -
25%. This compares very favourably to the analytical predictions.Bridge's model produces wide scatter, with a general tendency to over-estimate scour depth.
Examination of the distribution of errors a function of bend geometry confrms the earlier results of
Thome and AbN (1990) in that errors increase markedly as the Rc/w value decreases towards a value
of 2. It has been recognised that in such tight bends the flow may strike the outer bank at a steep
angle, driving reversed flow upstream of the apex. In this respect, attack of the outer bank is
23
L __

associated with impinging flow, and this has found to be an intractable problem in both single
thread and braided rivers.
Based on these findings, the applicability of the Bridge model is limited to relatively long
radius bends, with Rc/w ratios greater than about 4. Even in these bends over-estimates of 50%,
and occasionally as much as 100%, must be expected.
Odgaard's model systematically under-predicts scour depth. For the smaller rivers points
trend around a line of -50%, but the model crashed and produced little further increase in predicted
scour depth once the observed depth passed about 10 metres. However, Figure 20 shows that
Odgaard's model was consistent even for the tightest bends, and actually did well for cases where
Rc/w was around unity. If the problems of bed material mobility and application to large rivers can
be solved, then Odgaard's model has real potential, especially for tight, short radius bands where
the empirical model is inapplicable and the Bridge model is inaccurate.
Conclusions
This study has assembled a fairly large and internally consistent data-set for scour at bends.Application of three different approaches to scour prediction has illustrated the present problems of
making accurate predictions in bends of different geometry and size. The empirical method
produces the best overall agreement, but for longer radius bends Bridge;s model does nearly as
well. The empirical method cannot be used for tight bends with Rc/w = 2 being a lower boundary.
Although it does produce predictions, Bridge's model should not be used for shorter radius bends,
where it seriously over-predicts scour depth. Odgaard's model remains consistent in under-
estimating scour depth by about 50% over a wide range of bend geometries. Accuracy actually
improves for very tight bends. The model, therefore shows promise, but could not be used
routinely in its 1988 version.
It should be noted that both Bridge and Odgaard are continuously developing and upgrading
their models. I understand from both researchers that the problems and difficulties noted in this
study are consistent with their experience and that they have been addressed in subsequent editionsof the models. The latest versions will be supplied to me to replace the earlier ones as soon as they
are ready, but nothing has appeared as yet (May 1992). Updated predictions will be producedwhen the new versions arrive.
Scour in Revetted and Free Meanders
It was discussed in the Introduction that there are reasons for thinking that scour depths in
revetted bends are deeper than for free meanders of similar geometry. The primary purpose of
this study is to assess the capabilities of the models to predict scour in revetted bends, and so this
24

part of the analysis concentrates on bends with revetted outer banks. However, as the data-set
includes both reverted and free meanders, the bends were split along those lines, to allow
comparison of revetted and free conditions. Bends which were wholly or partially constrained by
resistant outcrops of clay, backswamp deposits or Pleistocene materials were excluded. Such
bends would be expected to have scour depths intermediate between revetted and free sttes, and so
a clearer picture should emerge.
The observed and predicted results for reverted bends are shown in Figure 21. They are
broadly in line with the overall study. Bridge's model produces the most scatter and generally
over-predicts scour, Odgaard's model systematically under-predicts and the empirical model does
comparatively well. Examination of the distribution of errors (Figure 22) shows how errors in the
Bridge model increase for tight bends. His model looks inapplicable to reverted bends with Rc/w
less than 4. But for longer bends the model does quite well, with predictions in the approximate
range +15 to - 25%. The empirical model is successful, but as a considerable number of the
reverted bends come from the Red River, 1981 hydrographic survey, this is not a stringent test for
the method. Errors are evenly distributed fro a range of Rc/w values and fall in the range +25 to -
15%. Odgaard's model seriously under-predicts scour in all cases.
In the Red River study of Thorne (1988), a separate empirical analysis was developed for
reverted bends. Like the general equation for all bends, this was based on the logarithm of ((Rc/w)
- 2) as the x variable. The least squares regression equation was:
(dmax/dbar) = 2.15 - 0.27 In ((Rc/w) - 2) (6)
To examine if this equation had potential for the expanded data-set a semi-log plot of (Rc/w)
- 2) versus dmax/dbar was plotted (Figure 23). The scatter shows a linear trend to the data with a
negative slope. Consequently, the data are consistent with the form of the empirical revetment
scour equation. Figure 24 shows the observed and predicted scour depths for the empirical and
revetment equations. Figure 25 shows the distribution of errors as a function of bend geometry.
There is no obvious improvement in prediction for the revetment equation, and it actually does less
well in the reverted long radius bends of the Missouri River. On the basis of this test it does not
appear that the equation for revetted bends is any better than that for all bends.
Figure 26 shows a semi-log plot for the free meanders. Comparison with the revetted bends
in Figure 23 shows that the two data clouds overlap to such a degree that there is no easy way to
discriminate between them. This suggests that the empirical analysis based on a semi-log equation
is equally applicable to bends of all outer bank types. This finding is in contrast to the findings of
the earlier study on the Red River. There are at least two explanations for this. Firstly, it comes
about because the wider range of conditions in the rivers of the large data set have swamped
differences due to bank condition. Thus, while bank effects may be identified on a particular river,
25

they cannot be discerned in a data-set for many different rivers. Secondly, the parameters used in
this analysis may tend to collapse data for different bank conditions together. This is the casebecause the width and mean depth at the crossing are not themselves independent of the bankcondition. Rivers with stiff banks tend to be narrower and deeper than those with erodible banks.
Hence, in using crossing width and mean depth to scale bend geometry and scour depth, the banktype effects are being implicitly taken into account. Consideration of the impacts of revetments on
the regime geometry would help to resolve this issue, but is getting beyond the scope of this study.
It can be concluded though that the empirical method constitutes a robust predictor of scourdepth for bends of a variety of bank types and conditions, with errors usually within the range +1-
30%.
26

Extrapolation to High Flows
The flows referenced in this report are all high, in-bank flows that are close to 'bankfull'
discharge. In geomnorphological terms, they are believed to be the channel forming flow for alluvial
rivers: that is the flow to which the major morphological and geometrical features are adjusted.
That is not to say that higher flows do not have significant impacts on the channel and the riparian
zone. It is well known that scour of both in-channel pools and overbank areas can be considerable
during flood flows. However, over longer periods of say 20 to 50 years, the impacts of high
magnitude, low frequency events are not as important in forming the landscape as the impacts of
flows at and around bankfull flow.
In the case of revetment design, it is essential that the structure be able to withstand the short
term impact of high magnitude events, as well as being in sympathy with the hydraulic geometry
and fluvial morphology of the river, which are products of lesser events. Thus, although the use of
flows around bankfull have a role in determining the alignment and orientation of the bank line, the
strength and scour protection must guard against short duration but higher flows. The highest flow
to be guarded against is termed the 'design discharge' and will usually be a flow of quite long
return period. Depending on the level of acceptable risk and the value of the land being protected,
return periods of 20 or even 50 years may be used.
In terms of application of the scour predictors tested here this poses a problem because the
flows referenced have return periods of the order of 1 to 5 years.
In order to solve this problem it is necessary to know something about the flow stage
associated with the design flood in relation to the elevation of flood plain and, more particularly, the
top of the revetment. In general terms, the stage may be classed as either: at or below top bank;
slightly overbank; or significantly overbank.
For in-bank or bank top flows little difficulty arises. The analytical and empirical methods
described here are specifically designed to deal with high in-bank flows under which the bed ishighly mobile and to which the geometry of the channel is adjusted. In this respect the design flow
should be ideal for application of the methods. Where the design flood does not overtop the
revetment and is contained within the channel, no extrapolation should be necessary.
Design flows which are slightly out of bank pose more of a problem, since by strict
definition they are beyond the scope of the models and methods presented here. This is the case
because once the flow goes out of bank strong eddies develop at the inter-face between the channel
and flood plain elements. These eddies induce water surface topography, momentum exchanges
and shear stress distributions which cannot be predicted on the basis of in-bank flow models alone.
However, provided that the depth of flow on the flood plain is small, it may be possible to
extrapolate the approach for in-bank flows up to out of bank conditi( is. This is the case because
relatively high flood plain roughness and low flood plain flow depth combine to produce low
27

velocities of flow in comparison to those in the channel. Hence, the overbank area may be
considered more as a reservoir than an extended channel. Under these circumstances, water flow
tends to follow the line of the channel, with stable boundaries between the flowing in-bank and
static, overbank water. A notional line extending up from the bank top to the water surface may be
used to delineate the channel for modelling purposes and the methods described here may be
applied using the notional geometry of the cross-section and planform of the flowing channel.
Experience suggests that this type of extrapolation may be acceptable where the depth of flow over
the flood plain is less than 20% of the channel depth.
When the depth of flow over the flood plain is a significant proportion of that in the channel
there is strong inter-action between the in-channel and overbank elements. The flood plain has
ceased to be a reservoir and become instead the flood way of a two-stage channel, quite possibly
carrying the bulk of the discharge. There is active exchange of water (and sediment) between the
channel and the flood plain flows, and the in-bank element cannot be considered in isolation. For
example, recent research in the Science and Engineering Research Council's flood flume facility at
Wallingford has shown that when the sense of rotation of the main, helical flow in a bend may be
reversed when the overbank flow depth attains 50% of the channel depth (Donald Knight, personal
communication, 1991). This is associated with the meandering channel acting as a slot in the bed
of the floodway rather than as a sinuous channel in its own right.
Under such circumstances it is unrealistic to expect any channel flow model to accurately
predict scour pattern or depth based only on the in-bank flow parameters. Major scour will
probably be associated with points where overbank flow plunges back into the channel, and this
may well be at the inner bank, or at some indeterminate point controlled by the pattern of flood
plain topography, vegetation or development. With the present state of art either physical or
numerical modeling of the flow in the entire flood plain/channel system would be required to make
reliable predictions of velocity and scour patterns.
CONCLUSIONS AND RECOMMENDATIONS
This study has assembled a data-set for 256 bends in single-thread rivers, stream and flume
channels. The data have been examined and screened and are believed to be of a high quality. All
the observations correspond to high in-bank flows and should represent the channel forming flow.
All the rivers are believed to be flowing through alluvial channels in as much as the bed materials are
fully mobile for the reference conditions. On this basis the data should allow application of the
models for bend flow and scour prediction.
The results indicate that considerable errors can occur in the predicted scour depths. The
empirical method produces the most reliable scour estimates, with the great majority of predictions
28

being within +/- 25% of the observed maximum bend scour depth. Bridge's bend flow model does
nearly as well for long radius bends, but massively over-predicts scour depth for tight bends. As a
general rule, the Bridge method should only be used for bends with Rc/w ratios greater than 4. The
Odgaard model was the least satisfactory of the dtree. It systematically under-predicted scour depth
by about 50% and failed to account for the deep scour holes found in large rivers. Problems with
the model center on the entrainment function which does not predict any scour in bed materials
coarser than sand, and in large rivers where the program crashed due to the prediction of negative
depths at the inner bank.
There was no evidence that reverted bends suffer deeper scour than free meanders, at least in
terms of the dimensionless scour depth (dmax/dbar) scaled on the mean depth at the upstream
crossing. This may be because the mean crossing depth is itself a function of bank stiffness, and so
bank effects are accounted for in its use as a scour scaling parameter. If true, this further strengthens
the range of applicability of the empirical approach adopted by Thorne (1988).
Extrapolation of the approaches tested here to higher flows is limited by the inter-action
between in-bank and out of bank components of the flow for overbank events. Where this is
negligible, notional walls may be envisaged, separating the channel flow from the flood plain storage
and allowing the delineation of geometrical and hydraulic parameters for the in-channel portion of the
flow. Hence, provided that the water level associated with the design flood is only slightly above
the top of the revetment and remains mostly in-bank, then the methods described here can be used
with caution. However, when the overbank flow depth is a significant proportion of the channel
depth, the import and export of water from the channel to the flood plain is not negligible. Flow
patterns and bed scour will be dominated by water and momentum fluxes which cannot be predicted
by these (or any other) in-bank flow models and it would not be wise to attempt to extrapolate the
methodology to such flows. If significant out-of bank flows over and behind the revetment are to be
allowed for in the design then some form of flood plain water and sediment model is required.
REFERENCES
Anthony, DJ. (1987) "Stage dependent channel adjustments in a meandering river. Fall river,Colorado" Unpublished Masters Thesis, Colorado State University, Fort Collins, Co, 180p.
Bridge, J.S. 1977. 'Flow, bed topography, grain size and sedimentary structure in open-channelbends: a three-dimensional model', Earth Surface Processes, 2, 401-416.
Bridge, J.S. 1984 "Flow and sedimentary process in river bends; comparison of field observationsand theory" In, River Meandering, C.M. Elliott (ed.), ASCE, New York, USA, 857-872.
Dietrich, W.E., Smith, J.D. and Dunne, T. 1979 "Flow and sediment transport in a sand-beddedmeander" Journal of Geology, 87, 305-315.
Dietrich, W.E. 1982 "Flow, boundary shear stress and sediment transport in a river meander"Ph.D dissertation, Univ. Washington at Seattle, 261p.
29

Dietrich, W.E., Smith, J.D. and Dunne, T. 1984 "Boundary shear stress, sediment transport andbed morphology in a sand-bedded river during high and low flow" In, River Meandering, C.M.Elliott (ed.), ASCE, New York, USA, 632-639.
Dietrich, W.E. and Whiting, P. 1989 "Boundary shear stress and sediment transport in rivermeanders of sand and gravel" In, River Meandering, S. Ikeda and G. Parker (eds.), AmericanGeophysical Union, Water Resources Monograph 12, 2000 Florida Avenue, Washington D.C.,USA, 1-50.
Engelund, F. 1974 "Flow and bed topography in channel bends" Journal of the HydraulicsDivision, ASCE, 100(11), 1631-1648.
Fisk, H.N. (1943) "Geological Report on Clay Plugs in the Vicksburg Engineer District:Unpublished report, Mississippi River Commission, 19p.
Fisk, H.N. (1947) "Fine-grained alluvial deposits and their effects- on Mississippi River activity"Waterways Experiment Station Report, Vicksburg, 82p.
Friedkin, J.F. (1945) "A laboratory study of the meandering of alluvial rivers" WaterwaysExperiment Station, 40p.
Harvey, M. D. and Sing, E. F. (1989). "The effects of bank protection on river morophology." InHydraulic Engineering, M. A. Ports (Ed.), Proc. 1989 National Conference on HydraulicEngineering, ASCE, 212-217.
Lapointe, M.F. and Carson, M.A. (1986) "Migration patterns of an asymmetrical meandering river:The Rouge River, Quebec." Water Resources Research, 22,731-743.
Markham, A.J. 1990. 'Flow and Sediment Prccesses in Gravel-Bed River Bends', thesis submittedto the Department of Geography, Queen Mary and Westfield College, London, in completefulfilment of the requirements of the degree of Doctor of Philosophy, 4 !Op
Odgaard, A.J. 1986. 'Meander flow model. II: Applications', Journal of Hydraulic Engineering.112 (12), 1137-1150.
Odgaard, A.J. and Bergs, M.A. 1988 "Flow processes in a curvtu alluvial channle" WaterResources Research, 24(1), 45-56.
Smith, J.D. and McLean, S. R. 1984 "A model for meandering streams" Water ResourcesResearch, 20(4), 1301-1315.
"Thome, C. R. (1978). "Processes of bank erosion in river channels." unpublished Ph.D. thesis,Univ. of East Anglia, Norwich, NR4 7TJ, England, 447p.
Thorne, C R (1982) "Processes and mechanisms of River Bank Erosion", in Gravel-Bed Rivers:Fluvial Processes, Engineering and Management", R D Hey, J C Bathurst and C R Thorne (eds), JWiley and Sons, Chichester, England, pp 227-271
Thorne, C R (1988) "Bank processes on the Red River between Index, Arkansas and Shreveport,Louisiana" Final Report to the US Army European Research Office under contract numberDAJA45-88-C-0018, Dept. Geography, Queen Mary College, December 1988, 50p
30

Thorne, C.R. and Abc, S.R. (1989) "Bank Erosion Modeling and Assessment Techniques" FinalReport to the US Army Engineers Waterways Experiment Station, under contract numberDACW39-87-D-0031, Colorado State University, Ft Collins, Co., November 1989,4 Parts.
Thorne, C R & Osman, A M (1988) "Riverbank Stability Analysis: II Applications" Journal ofHydraulic Engineering, ASCE, Vol 114, No 2, pp 151-172
Thorne, C.R. and Abt, S.R. (1990) "Estimation of Velocity and shear stress at the outer bank inriver bends" Final Report to the US Army Engineers Waterways Experiment Station, undercontract number DACW39-89-K-0015, Colorado State University, Ft Collins, Co., May 1990.
Thorne, C.R. (1991) "Bank erosion and meander migration of the Red and Mississippi Rivers,USA" in Proceedings of the XX General Assembly of the IAHS, Vienna, Austia, 11-24 August,1991.
Thorne, C.R. and Hubbard, LJ. (1991) "Flow and bed topography in the Mississippi River"Report to the Mississippi River Comnmission (in preparation).
Torrey, V.H. (1988) "Retrogressive failures in sand deposits of the Mississippi River" WaterwaysExperiment Station, Technical Report GL-88-9.
Turnbull, W. J., Krinitzsky, M. and Weaver, F. J. (1966). "Bank erosion in soils of the lowerMississippi Valley." J. Soil Mech. Div., Proc. ASCE, 92(SMI), 121-136.
U.S. Army Corps of Engineers. (1981). "The stream bank erosion control evaluation anddemonstration act of 1974, Section 32, Public Law 93-251. Appendix F - Yazoo River Basindemonstration projects." Final report to congress, Office of the Chief of Engineers, WashingtonDC., USA.
31

DIAGRAMS AND TABLES
33

Fig. I Dimensionless Maximum Bend Scour Depth as a function ofBend Geometry for Data from Thome and Abt (1990)
4-
0 2
Rciw
Fig. 2 Dimensionless Maximum Bend Scour Depth as a functionof Bend Geometry for Red River, 1981
3.0-
2.8-
2.6- 12.4- __ _ _ _
2.2- -r---±-.20' J
a . ............
1.6' ......1.4' 2
1 .211.0*
0 2 4 68 10
Rc/w
34

Fig. 3 Dimensionless Maximum Bend Scour Depth as a functionof Bend Geometry for Red River 1969
*1 II i
* U
4-
gO r
2-
i- . . ... I t I
2 4 6 10 12
Rc/w
Fig. 4 Dimensionless Maximum Bend Scour Depth as a function of Bend Geometryfor British Gravel-Bed Rivers
3- I I
* I
2 -do!
0%
• 0 *, o
0 5 10
Rd/w
35

Fig. 5 Dimensionless Maximum Bend Scour as a function of Bend Geometryfor data from various researchers Note: open symbols from River Ganges
10-
___ I Ia I
6-4
4--
'13
010 15
Fig. 6 Dimensionless Maximum Bend Scour Depthfor Flume data
0 4
Rc/w
36
0!
0|
TI•
02 4 6 8
Rcjw
36

Fig. 7 Observed vs Predicted Maximum Bend Scour Depthsfor Data from Thome and Abt 1990
15"
S 10-
SBridge dmax
0 + + Odg+=ddm.x
+o+ - Empincal dmax
+ 4+
0 .5 10 15
Obscrved Scour Depth (m)
Fig. 8 Observed vs Predicted Maximum Bend Scour Depths forData from Red River 198 1(Thorne, 1988)
30-
* i
* . •
S20 i•0:__ __ Bndgc's dm
00 ir•" i •+ Odp~anfs dmax
~~~~d a -- 0._IZ' -1 Empirical dm.ax
I !
- 15
1010
5 101
Obscrvcd Scour (m)
37

Fig. 9 Observed vs Predicted Maximum Bend Scour Depths forData from Red River 1969
30 ..
! °1
20 ___.
I • Bridge's dmax
+ Odgd'sz + a÷V Empiric dmax
10- 4A
;i I +- ,47+ 'W +P. + +
5 10 15 20
Obscrvcd Scour (M)
Fig. 10 Observed vs Predicted Maximum Bend Scour Depthfor British Gravel-Bed Rivers
15 -- -
i S. I""10 -- ' -..
5 * 1 *Bridge's dmax* . . , * EmpiricalcdmaxS* " *''• i*
!I"eJ ' .iiS. i=i0:•
0 2 4 6
Obscrvcd Scour Dcpth (m)
38

Fig. I I Observed vs Predicted Maximum Bend Scour Depthsfor data from various researchers
*Bridge's dmax10- + Oidgaard's dmax
0 . * Empirical dmax
5 ++ 0+0
+ + + kgadsda
44 * + •
0 2 4 6 8 10
Obscrvcd Scour Dcpth (m)
Fig. 12 Observed vs Predicted Maximum Bend Scour Depthsfor Flume Data
0.4
i i,0.3 -"
8� V0 Bndge's dmax
. Q* Empirical dmaxS0.2- .
B IS
0.10.1 0.2 0.3 0.4
Observed Scour (m)
39

Fig. 13 Errors in Predicted Maximum Bend Scour Depth for Natural River datafrom Thome and Abt (1990)
300' -
! , ,
200'
100* *Bridge error
+ Odgaard erro2o0* Empzc crror
0-
-1000 10 20 30
Re/w
Fig. 14 Errors in Predicted Maximum Bend ScourDepths for Red River 1981 data(Note: empirical method was developed from these data)
200'
100' Bridge cffo
+' Odgaard cmc"* * * Empirical error
0-0
++++ + :+++S C
+ +
*,o •~q + !
0 2 4 10Rc/w
40

Fig. 15 Errors in Predicted Maximum Bend Scour Depths for Red River 1969 data
(Note empirical method was developed for this nver)
200
_ _ _ _ _ _ _ _ __
100' __
-•. ,I Bridge c'ror0.€ Odgm~rd's orx
""0___ Empirical error
', ",0
+.e+- + + + ÷+ 4+ + +
+! +
0 2 4 6. 10 12
Rc/W
Fig. 16 Errors in Predicted Maximum Bend Scour Depth
for British Gravel-Bed Rivers
400-
300S* I
"200. I*, Bridge Error
100 _-_ _ _ ... . j __ EmpincaJ error
WO 9 I I_ 0
-100-0 5 10
R/w
41

Fig. 17 Errors in Predicted Maximum Bend Scour Depthsfor dam from various researchers
200-
100- _____
S * + Odgaard error
0 *j
B ridge error
i+ .* Empirical error
0-0
+o .. .
++ + e+
-100-0 24 6
Rc/w
Fig. 18 Errors in Predicted Scour Depthsfor selected Flume Data
80-
60'
40-0
_ _ I_ _ _
20 , i _ Bndge error
* Empirical error
6 10I
-20- __ _ __ _I II_ _ _ _ _ __ _ _ _II
I I _ _ _ _
T I-40 -
0 2 4 6 8
Rc/w
42

.- mE Va
I--
0
U a l
of
4.E
0~ 50
a aemn
00.
(w *no 4.OIG~
434

co
4++
(nI.E _ _ _
E_____ A .
C,,
Cu
. 0..
C9 C
_ _____ _____ ____ 4-~ - -- -44

Fig. 21 Observed vs Predicted MaximumScour for Revetted Bends
30"
* 0
20-
SBridge's dmax
+ Odgaard's dmax
* Empiricaldmax
0-510 1
Obscrved Scour (ml)
Fig. 22 Errors in Predicted Maximum Scourfor Revetted Bends
200 T ,.,~ ~ ~~ +"+++k • € .•. •+++
5 1 0 1
ObserOedaardurrror
Fi.2 Err in *rdce ,MaxEmiricaScrro
* +
0 5 10 15 20 25
Rc/w
45

Fig. 23 Semi-log Plot of Dimensionless Maximum Bend Scour Depthfor Reveued BendsH i
3-
10 1
rILII!!F
"i ii ° .
I iiI II
.1 E r10 100
(Rclw) - 2
Fig. 24 Observed vs Predicted Maximum Scour
Depths for Reverted Bends
13 __ __ ." _"____
3 *_ . I
Xa*
550
119 1 1 13 15
I*• 0- r* Revetment da
I I
5 7 9 11 13 1
Observed Scour (m)
46

Fig. 25 Errors in Predicted Maximum ScourDepths for Reverted Bends
50' - i
40
M 0
30 -.....-
10 " Ir1.-.4..-..4-=.-.. ," iEmpirical error
S1R . * Revetment error
-20- ,
.30 - __ _
-40.
-50 .0 5 10 15 20 25
Rc/w
Fig. 26 Semilog Plot of Dimensionless Maximum BendScour Depth for Free Meanders
10 100
I I: III! I,
I i
3 I I
• " IO I
2 .....i. *I . , * '~ : ' '
Si • i i '
H• I
110 100
Rc/w
47

z -
V% 010 Wf- 4 0%W " C-1 o 10 C4W t r
Z f G :I n-WI nI 4"c C4~~c IN " m" C4
__ _ _ _ _ _ _ _ _ _ _ _ _ _ _ __ _ _ _ _ _ _ _ _ _ _ _ _ _
NC,ýq IN t4 "e1
Z
r4 -
CZ
r4 C
IT et4 q~ . . .e
-W-C
z
A ~ .~I
>~
99U c
so z E 0 p-I~~~ -E_ E__ _ _ _ _ _ _ _ __ _ _ _ _ _ _ _
48m U

A.A.
00,In-
(Z aou
Cc. 0
09I IT "
cI~In
a e3
4 49

TABLE 2 - CALCULATED DATA FOR NATURAL RIVERS FROM TIIORNE AND AET (1990)
RcAW dmarndlr MEASURED BRIDGES ODGAARD'S EMPIRICAL BRIDGES ODGAARD'S EMPIRICAL
dma diu dmax dmaz ERROR ERROR ERROR
(___) (m) (m)J (in) M~ M~ :a ].2.87 2.n8 1.35 1.99 0.833 1.36 47.41 -38.30 0.98
0.82 2.16 1.64 5.3522 1.3321 226.35 -18.77
0.75 1.88 1.73 6.087 1.6354 251.85 -5.47
0.88 1.90 1.82 5.6725 2.0502 211.68 12.65
1.75 2.22 2.89 4.01 2.5383 38.75 -12.17
1.25 1.79 1.59 3.01 1.4438 89.31 .9.191.27 2.64 1.74 2.62 1.2743 50.57 -26.76
1.27 2.59 2.05 2.7 1.2708 31.71 -38.01
2.92 i.89 2.3 2.56 1.5269 2.55 11.30 -33.61 10.67
7.92 1.37 5.18 5.67 4.2234 6.53 9.46 -18.47 26.06
6.58 1.47 5.27 6.16 4.1647 6.39 16.89 -20.97 21.32
3.76 1.37 5.48 9.64 5.2184 7.87 75.91 -4.77 43.59
1.12 1.65 6.34 20.55 4.8469 224.13 -23.55
0.80 1.88 6.55 21.3808 6.8718 226.42 4.91
7.83 1.55 5.27 4.93 3465M6 5.92 -6.45 -30.61 12.27
1.94 1.63 6 13.15 4.8383 119.17 -19.36
4.70 1.36 5.03 7.21 4.W945 6.94 43.34 -1661 38101
3.80 2.31 1.5 2.85 0.8993 1.27 90.00 -40.05 -15.14
4.84 0.30 1.13 L.94 1.2688 1.63 71.68 12.28 44.13
17.90 1.58 8.75 7.12 5.5786 8.57 -18.63 -36.24 -2.04
16.23 1.55 8.5 6.55 5.532 8.61 -22.94 .34.92 1.29
10.00 1.33 .5 7.61 5.7044 9.46 1.47 .23.94 26.17
9.34 1.56 8.25 7.07 5.3473 8.96 -14.30 -35.18 8.65
3.23 1.80 9 7.9 5.041i 8.61 -12.22 -43.99 -4.31
13.85 1.51 8.25 6.99 5.488 8.72 -15.27 -33.48 5.71
9.64 1.42 7.75 7.66 5.4965 9.38 -1.16 -29.08 18.40
9.26 1.89 9.5 6.72 5.0652 8.52 -29.26 -46.68 -10.34
11.75 2.14 11.75 7.06 5.5147 8.97 -39.91 -53.07 -23.63
23.62 1.65 8.5 6.28 5.1692 7.75 -26.12 -39.19 -8.85
11.92 1.52 8 6.71 5.2897 8.58 -16.13 -33.88 7.232.72 3.30 1.65 1.04 0.6406 1.07 .36.97 -63.18 -35.39
2.42 3.00 1.5 0.865 0.6549 3.12 42.33 .56.34 -25.46
2.00 2.13 0.85 0,69 0.6219 -18.82 -26,84
4.85 2.10 4.3 4.05 2.726 1 3.84 -5.81 -36.60 -10.81
50

o~~~0 w-N (N- CIO, C4
z000C
uj
<
LU
a N~~0------------lz
C F-N~ *cViN fa A C4 f- r-eq C.
Q. " -F X r.~N r"*-1 ý
C" U,4 I r4 m
4.ý
::~~~fIfI f- 1 U r"9x 0U,"l h CCoto Wf~fI- 'f4- P- z-- f- f- -I P-fI-ao wG Z1
I-. ____ C
414 414 r~l t-4M MC4 51r

00 0
u 0 .0 ; 00
minoz
00 C4 %0m 0 30-I-0 "N( N N ("I AN I W V." 1. 43-1 V.z FbD .4 V.0 %0F -
" f- V% -0W%14r- 0
- -- - - I - - -Lo --
000.F-O.0V00- 06~'
~J~ 8 -00 (NOr004 cc W%.- ( r4
aal
<-. F-F 00-0 La f4
-00Q.P-. I ' C 0 0 0 mwww vwP NP 4w wf
C4 *o'Ar, C4' 1 4# 4C
w- ~ F - - F -F -F -?'~(9(4F -F NF -F NF N( N(
Sal
*ut 1 t 0 ý' ' ~ ~ ~ (40 N '~ -
E >
w -0 wC
I N -(N - - -F F F C4 C4 00t0 0 0 cc r- r P
52

C -i o'i '.T (D ~r
rrN"m am 0'o
.dUK V*,V*
M p -c d c. 0 . 60 00 ý c - 2
-PQ P,
-i wi . w N W.-r
I-V-
aa -w
C4 ri4 eiWqC 0 tq C ~ - C4 t- C 4 4(
53

'0 X ~ w M -W
Iii-)
at~ C4 Go 'IU3~~ C~ O ~ O f - r
CAJ
V,~~ ~ C4r r I
80 00 4R w
C.) ~' ____ "I__ __ _ m__ _P.. _ __ __ __ _ __ __ __ ___w_
C4-0-
C4W%1 V , 0
m ? O " =
EU 54

V-4 No00 V t, f4 -T goI -v~ -
An v: C4 W, r (-d Ch
a00
WN W% W % LM (I l WN (I( C%~ ((4 4 r4 e- N(4 C4 "N N C4 .N .N .-- (4 CN(4 (N( (4 e-4
L)( C4 C40 C4.0 C4 r40 N.0 C4 C4 (-a (4 A~ A I~ ' . A, . _
-d - - f4 e(4 Mr - -C CNC
0.0I-'C ITC- ý z" ";
r4 --( -----
fn~~~% -p WI~
CiCP
(Nw(t0( 4 XN M- C4 -
0 so (-4W0-
2~ FGo - fm 2 14 aD4-
U3U
S
55

U~~~ -J -d -d -i -J ~4r - -. - - -r- -C -C -0 -C -C -. - -- - - C
LU
C4N 0 4-, ~ 0~ 0 @0rIi 14 f4 0I 0 @0a~' ýc @0 %0 a 0
a.'.evC4C40
ci V6 d0 d d 6cccc 0 0 iNQ
-W C 0 - ft ý0 0, w 04 W'C PC
- - - -0' 0 @ - -v 0Q - -> d---- - - -' -'
>
go ' ý.0
~~r 4 0 @ 0 C 10 0'Cix'4 ~ ~ r .ýc 10 '0'C IQ@P
I- ~ ~ ~ ~ ~ O __ __ __ __ _ _.___. _ ___.___._ __ __ __ _
56 - r

0 aq
w dw"00
ell~ 4 ~ C
0o.
coa
W,~C 'r--~' 00 no~ 0o
LZc, r
-6C,% ,I 0 0 , ' Tf o1 0e 7
r -V
A r- e M ý41 157

- e~t4 ae4'u
8z CcW ~.~I.
0
, - d wi N. 1-# -P m
O ~ C40 00-- ~ r V!,~'= = r4
0r
uLj
'p 06 vi''0.~o r
a.<
0to cy Lom r PCa c -
c q.
e4 r 1. o'
ti CK Cý58

LU
5 ix
U)w =0000 %omm C4 C00
9e
z
! , I ' p e" p _ __ _ __ __ __ _ __ __ __ _ __ __ __ _
w W-NN ( C
W2 E 0 2 ~ 0~~~
202
aC9
.. *
w5

z
C4 ~~t4 W%~-~ f'Cr1 W m Y
8~ a
rw el w q1.- v 0r
C2 wý 0 0
*d fl, - ~ cs - - rleJ 'r4V r r C
A A
113
00 4 , f.,m0 ,m-
i g o cf
r- ao -W- o 4C
VA m
60

o .! W" r! I" C
zc
0, 0U 4 ~ ~ -
Im 0 1 4 0
-Im0 0c~~~
A I _ _ __ _ _ _ _
'C -
_j . - t- 0'
0 g4~ -- CCC-%
0 '0 0~~e 'ena 0 a V~~
Z~ INL ?E
Ib~61

TABLE $-CALCULATED DATA FOR BRITISH GRAVEL.BED RIVERS FROM HEY AND TIIORNE (1986)Rc/w dmax/dbar MEASURED BRIDGE'S EMPIRICAL BRIDGE'S EMPIRICAL
dmax dmax • ax ERROR EFFICR(m) (m) Žl. ) I%) (%)
3.55 1.44 2.21 3.45 3.04 56.15 37.556.77 1.78 2.79 5.94 2.78 112.79 -0.223.01 1.76 2.88 8.09 3.39 180.82 17.761.59 1.79 2.25 6.00 166.642.29 1.69 2.33 4.65 3.18 99.72 36.604.65 2.29 2.88 3.25 2.37 12.94 -17.554.30 1.96 3 2.20 2.92 -26.69 -2.512.56 1.96 2.94 2.65 3.27 -9.85 11.195.25 1.68 3.38 5.62 3.71 66.24 9.797.11 1.43 3.57 6.32 4.40 77.01 23.252.78 1.55 2.89 3.17 3.94 9.53 36.263.07 2.58 1.96 4.42 1.56 125.36 -20.222.93 1.53 3.158 t2.93 4.31 309.55 36.535.63 1.40 2.17 2.06 2.83 -5.14 30.344.95 1.54 2.49 2.23 3.02 -10.46 21.294.86 2.64 2.85 3.65 2.02 27.95 -29.1 15.78 1.95 2.05 4.02 1.91 96.15 -6.912.96 1.39 3.41 4.08 5.11 19.50 49.952.88 1.47 4.3 8.83 6.13 105.30 42.673.48 1.72 4.12 7.46 4.77 81.05 15.734.03 1.60 2.89 4.39 3.50 51.87 21.223.96 1.61 2.18 2.11 2.62 -3.28 20.284.89 1.62 1.89 1.69 2.19 -10.43 15.641.28 2.45 2.08 4.91 136.221.19 1.27 1.63 6.08 272.833.01 2.01 2.07 5.26 2.13 154.31 2.901.22 1.53 1.74 5.21 199.571.42 1.83 1.72 6.71 289.903.02 1.59 0.81 0.89 1.05 10.47 30.113.84 1.50 0.99 1.04 1.29 5.38 30.282.92 1.61 1.11 1.06 1.44 -4.81 29.684.71 1.43 1.16 1.07 1.52 -7.95 31.32
62

TABLES (C-uta ismd) .CALCULATED DATA FOR BRITISH GRAVEL-BED RIVERS FROM HIEY AND TIIORNE 1986)
Rciw dmax/dbar MEASURED BRIDGES EMPIRICAL BRIDGES EMPIRICAL
dmax dmax dmax ERROR ER:IJ(m) (m) lm) I%) (%)
4.39 1.81 2.99 4.98 3.14 66.61 5.10
5.13 1..7 3.2 7.90 4.34 146.87 35.50
2.66 1.96 2.88 3.97 3.16 37.86 9.65
3.67 2.14 3.95 5.19 3.65 31.32 -7.60
3.70 1.96 3.35 8.18 3.37 144.30 0.54
3.09 1.32 3.15 10.88 4.91 245.26 55.76
10.28 1.41 1.13 1.21 1.33 7.36 18.12
8.26 1.40 0.98 1.16 1.21 18.16 22.96
3.01 1.29 0.88 1.79 1.41 102.86 59.74
3.00 1.54 1.49 2.56 2.01 71.62 34.81
1.53 1.65 2.43 7.85 223.16
6.05 1.77 2.35 3.02 2.40 28.71 2.112.68 2.38 1.5 3.07 1.35 104.92 -9 94
2,47 1.95 1.48 3.88 1.68 161.84 13.695.91 1.56 3.24 2.84 3.77 -12.38 16.24
3.82 1.64 3.45 3.65 4.11 5.68 19 09
6.78 1.61 2.56 2.28 2.82 -11.07 I0.116.48 1.43 2.31 2.47 2.89 6.87 25.175.68 1.32 2.99 4.04 4.12 35.13 37.74
3.57 1.40 2.02 3.77 2.86 86.64 41.454.13 1.50 1.84 2.94 2.37 59.61 28.76
0.60 1.64 2.3 2.62 2.40 13.81 4.173.55 1.54 2.95 3,43 3.79 16.25 28.593.64 1.46 3.07 3.73 415 21.47 35.185.12 1.56 3.06 4.19 3.63 36.82 18.74
8.04 1.82 2.64 5.66 2.51 114.44 -5.085.63 1.35 1.94 2.59 2.63 33.33 35.48
6.58 2.51 2.23 2.60 1.59 16.74 -28.923.58 1.41 2.72 8.36 3.83 207.49 40.70
10.68 1.55 2.18 2.11 2.34 -3.28 7.325.73 2.11 2.64 3.55 2.28 34.36 -13.82
5.69 1.95 2.42 4.68 2.26 93.35 -6.648.10 2.18 2.42 2.08 1.92 -14.19 -20.825.72 2.10 2.58 2.62 2.24 1.41 -13.2213.24 1.32 3.84 5.11 4.70 33.01 22.458.08 1.45 3.91 6.14 4.65 56.94 18.82
7.10 1.51 5-13 7.27 5.99 41.65 16.67
2.77 1.65 4.36 8.81 5.62 101.99 28.854.47 1.53 4.69 5.76 5.81 22.92 23.846.56 2.19 2.78 2.50 2.26 -9.95 -18.61
6.47 1.92 2.15 3.03 2.00 40.96 -7.00
6.90 1.55 1.35 2.50 1.54 85.08 13.946.83 1.34 1.25 2.69 1.65 115.12 31.748.61 2.50 1.05 0.76 0.72 -27.40 -31.557.96 1.76 1.83 1.81 1 80 -0.83 .1.64
63

C- 4Cvz ==etf
"AA C a
r-
5 -1
OEU g s m
o ~C00da ci4: i4 iC
fnW ncU ~0 0 0 0 0 00 icý rt tcý
-----0------W---N--4------ - - -
f"W n% = 4w% 4% 1 4 r rfrE' or 4' 0 U 'C W IN (4 C4 (4 en on o m , mM (4CM C
4 r-
SU.
P V4
4.q z f"r -W
96~A Q' u u w
4' c
A.
5)4)04 4)000 0 U 64

'U
U3
0
- ~ r-, '0: -0 leVý 1 co - r 0 a, I '
C-C rf 4w' J "m v mC Af
8 0 -- O r
rC-
Gm~ '0 -W
C4W-o'
4D C4OR Nlý . O 7
65

0 90 go CD CD 0CID
00=X .gNN qqq
00 0 m 000 m -V-
U.P
MLU 66~
<0 -~ - -go - - -N500 ~ c~~ ~ N
U:
NNNNNN ~<~CI zu we________ZL C 0 j cV - -0
ICll
z o C
< ~ =
La.
=~ wD 0 bQ C) C-~ - , CO - 1
<L <OEEE
ch U) 0 m 2m66

Form ApprovedREPORT DOCUMENTATION PAGE oANB No. 0704-0188
Pubic reporting burd en for the$ coleCoInO of Information ,, estimated to average I hour per re,'oon,, Including The time for reviewing instructionr. warchifg existing data wuorc .V
gathering and m nrtaining the data needed, and comploetinng and reviewrng the collection Of informatiron Send Conlmenrt$ rqafd'ng this bt.rdet e itrnSIe or any Other aOredt of thi,
collection Of refformaton. ,including suggestions tor reducing thins OutOen to Washington Headuarters Serv-ces, Directorate for information Operations and Reportis 1115 jeffeeron
Davis Highway. Suite 1204. ArlingtOn. VA 22202-4302. and to the Offince Of Manageement and Budget Paperwork Reduction Project (0704-01 s$). Waesiington O, 20503
1. AGENCY USE ONLY (Leave blank) 2. REPORT DATE 3. REPORT TYPE AND DATES COVERED
March 1993 Final report4. TITLE AND SUBTITLE S. FUNDING NUMBERS
Velocity and Scour Prediction in River Bends WU 32544
6. AUTHOR(S)
Colin R. Thome, Steven R. Abt
7. PERFORMING ORGANIZATION NAME(S) AND ADDRESSEES) 8. PERFORMING ORGANIZATIONUniversity of Nottingham, Department of Geography, University Park REPORT NUMBER
Nottingham, England NG7 2RD, and Civil Engineering Department,Engineering Research Center, Colorado State University,Fort Collins, CO 80523
'9. SPONSORING/MONITORING AGENCY NAME(S) AND ADDRESS(ES) 10. SPONSORING/ MONITORING
US Army Corps of Engineers, Washington, DC 20314-1000 and AGENCY REPORT NUMBER
USAE Waterways Experiment Station, Hydraulics Contract ReportLaboratory, 3909 Halls Ferry Road, HL-93-1Vicksburg, MS 39180-6199
11. SUPPLEMENTARY NOTES
Available from National Technical Information Service, 5285 Port Royal Road, Springfield,VA 22161.
12a. DISTRIBUTIONI/AVAILABILITY STATEMENT 12b. DISTRIBUTION CODE
Approved for public release; distribution is unlimited.
13. ABSTRACT (MaxImum 200 words)
This collection of two reports presents results of studies on the prediction of velocity andscour depth along the outer bank of river bends. The first report on velocity estimation showed thatthe analytical method by Bridge agreed better with observed data than either the Odgaard method oran empirical method. The second report on scour depth estimation showed that the empirical methodagreed better with observed data than either the Bridge or Odgaard analytical methods.
14. SUBJECT TERMS 15. NUMBER OF PAGES
Channel bends Scour 166Channel stabilization Velocity 16 PRICE CODE
F irnzinn rnntrrnl ......... .17. SECURITY CLASSIFICATION 18. SECURITY CLASSIFICATION 19. SECURITY CLASSIFICATION 20. LIMITATION OF ABSTRACT
OF REPORT OF THIS PAGE OF ABSTRACT
UNCLASSIFIED UNCLASSIFIEDINSN 7540-01-280-5500 Standard Form 298 (Rev 2-89)
PrntredC, by ANi Sld 139-18298,102