Embed Size (px)
Citation preview

US 202 Section 200 Operations Analysis
December 2020
US 202 SECTION 200 OPERATIONS ANALYSIS
f)dvrpc
d DELAWARE VALLEY
"'•rn1~IPC PLANNING COMMISSION
.
d DELAWARE VALLEY
fJ .,.,yrpc PLANNING COMMISSION
DVRPC's vision for the Greater Philadelphia Region is a prosperous, innovative, equitable, resilient, and sustainable region that increases mobility choices by investing in a safe and modern transportation system; that protects and preserves our natural resources while creating healthy communities; and that fosters greater opportunities for all.
DVRPC's mission is to achieve this vision by convening the widest array of partners to inform and facilitate data-driven decision-making. We are engaged across the region, and strive to be leaders and innovators, exploring new ideas and creating best practices.
TITLE VI COMPLIANCE / DVRPC fully complies with Title VI of the Civil Rights Act of 7964, the Civil Rights Restoration Act of 1987, Executive Order 72898 on Environmental Justice, and related nondiscrimination mandates in all programs and activities. DVRPC's website, www.dvrpc.org, may be translated into multiple languages. Publications and other public documents can usually be made available in alternative languages and formats, if requested DVRPC's public meetings are always held in ADA-accessible facilities, and held in transit-accessible locations whenever possible. Translation, interpretation, or other auxiliary services can be provided to individuals who submit a request at least seven days prior to a public meeting. Translation and interpretation services for DVRPC's projects, products, and planning processes are available, generally free of charge, by calling (275) 592-7800. All requests will be accommodated to the greatest extent possible. Any person who believes they have been aggrieved by an unlawful discriminatory practice by DVRPC under Title VI has a right to file a formal complaint. Any such complaint must be in writing and filed with DVRPC's Title VI Compliance Manager and/or the appropriate state or federal agency within 780 days of the alleged discriminatory occurrence. For more information on DVRPC's Title VI program or to obtain a Title VI Complaint Form, please visit: WWW,dvrpc.org!Getlnvolved!Tit/eVI, call (275) 592-1800, or email [email protected].
DVRPC is funded through a variety of funding sources including federal grants from the U.S. Department of Transportation's Federal Highway Administration (FHWA) and Federal Transit Administration (FTA), the Pennsylvania and New Jersey departments of transportation, as well as by DVRPC's state and local member governments. The authors, however, are solely responsible for the findings and conclusions herein, which may not represent the official views or policies of the funding agencies.

i
Table of Contents
Introduction ........................................................................................................................................................ 1
Purpose and Need ....................................................................................................................................... 1
Objective ....................................................................................................................................................... 1
Study Area .................................................................................................................................................... 1
Planning Process......................................................................................................................................... 3
• Phase I (Fiscal Year 2018) ............................................................................................................... 3 • Phase II (Fiscal Year 2019) .............................................................................................................. 3 • Phase III (Fiscal Year 2020) ............................................................................................................. 3
Document Overview .................................................................................................................................... 3
CHAPTER 1: Existing Conditions (Year 2019)............................................................................................... 5
Travel Time ................................................................................................................................................... 5
• NB US 202 ......................................................................................................................................... 5 • SB US 202 ......................................................................................................................................... 5
Crash Analysis ............................................................................................................................................. 6
• US 202 Mainline ................................................................................................................................ 6
Traffic Volumes and Behavior .................................................................................................................... 8
CHAPTER 2: Assessment of Peak Hour Traffic Operations ..................................................................... 13
Microsimulation Modeling ........................................................................................................................ 13
Existing Conditions ................................................................................................................................... 14
No Build (Year 2045) .................................................................................................................................. 15
• Operational Improvements ........................................................................................................... 15 • Results ............................................................................................................................................ 16
Build (Year 2045)........................................................................................................................................ 18
• Description of Build Alternatives ................................................................................................. 18 • SB Build Alternative 1 ................................................................................................................... 24 • NB Build Alternative 1 ................................................................................................................... 25 • NB Build Alternative 2 ................................................................................................................... 26 • NB Build Alternative 2A................................................................................................................. 27 • NB Build Alternative 3 ................................................................................................................... 28 • Comparison of Travel Times ........................................................................................................ 29
CHAPTER 3: Summary of Findings .............................................................................................................. 31
Findings ...................................................................................................................................................... 31

i i
Other Recommendations ......................................................................................................................... 31
Next Steps .................................................................................................................................................. 32
• Transportation Improvement Program (TIP) .............................................................................. 32 • National Highway Performance Program (NHPP) ...................................................................... 32 • Surface Transportation Block Grant Program (STBG) .............................................................. 32 • Automated Red Light Enforcement (ARLE) ................................................................................ 32
Figures
• Figure 1: Study Area .............................................................................................................................. 2
• Figure 2: NB US 202 Crash Histogram ................................................................................................. 6
• Figure 3: SB US 202 Crash Histogram.................................................................................................. 7
• Figure 4: DVRPC Traffic Counts: AM Peak Hour ................................................................................ 10
• Figure 5: DVRPC Traffic Counts: PM Peak Hour ................................................................................ 11
• Figure 6: Diagram of Existing NB US 202 and Build Alternatives 1 and 2 .......................................... 19
• Figure 7: Diagram of Existing NB US 202 and Build Alternatives 2A and 3 ....................................... 20
• Figure 8: Diagram of Existing SB US 202 and Build Alternative 1 ...................................................... 21
• Figure 9: Detail NB US 202 Build Alternative 2A Lane Diagram ......................................................... 22
• Figure 10: Concept Cross-Section of US 202 Build Alternative 2A Footprint Expansion ................... 23 Tables
• Table 1: NB Travel Times (Minutes): Westtown Road Overpass to Boot Road Overpass ................... 5
• Table 2: SB Travel Times (Minutes): Westtown Road Overpass to Boot Road Overpass .................... 5
• Table 3: Existing (Year 2019) AM Peak Hour Intersection Performance Results ............................... 14
• Table 4: Existing (Year 2019) PM Peak Hour Intersection Performance Results ............................... 14
• Table 5: Existing (Year 2019) Travel Times (Minutes) ........................................................................ 15
• Table 6: Average Annual Growth Factor by Federal Functional Class ................................................ 15
• Table 7: No Build (Year 2045) AM Peak Hour Intersection Performance Results .............................. 16
• Table 8: No Build (Year 2045) PM Peak Hour Intersection Performance Results .............................. 16
• Table 9: No Build (Year 2045) Travel Times (Minutes) ....................................................................... 17
• Table 10: SB Build Alternative 1 (Year 2045) AM Peak Hour Intersection Performance Results ....... 24
• Table 11: SB Build Alternative 1 (Year 2045) PM Peak Hour Intersection Performance Results ....... 24
• Table 12: NB Build Alternative 1 (Year 2045) AM Peak Hour Intersection Performance Results ....... 25
• Table 13: NB Build Alternative 1 (Year 2045) PM Peak Hour Intersection Performance Results ....... 25
• Table 14: NB Build Alternative 2 (Year 2045) AM Peak Hour Intersection Performance Results ....... 26

i i i
• Table 15: NB Build Alternative 2 (Year 2045) PM Peak Hour Intersection Performance Results ....... 26
• Table 16: NB Build Alternative 2A (Year 2045) AM Peak Hour Intersection Performance Results ..... 27
• Table 17: NB Build Alternative 2A (Year 2045) PM Peak Hour Intersection Performance Results ..... 27
• Table 18: NB Build Alternative 3 (Year 2045) AM Peak Hour Intersection Performance Results ....... 28
• Table 19: NB Build Alternative 3 (Year 2045) PM Peak Hour Intersection Performance Results ....... 28
• Table 20: SB Build Alternative 1 (Year 2045) Travel Times (Minutes) ................................................ 29
• Table 21: NB Build Alternatives 1, 2, 2A, 3 (Year 2045) Travel Times (Minutes) ................................ 29 Appendices
Appendix: Crash Diagrams ........................................................................................................................... A-1

i v

U S 2 0 2 S E C T I O N 2 0 0 O P E R A T I O N S A N A L Y S I S 1
Introduction
PURPOSE AND NEED US Route 202 is a major interstate route that runs from Delaware to Maine. The 59-mile stretch in Pennsylvania connects the four suburban Pennsylvania counties in the Delaware Valley Regional Planning Commission (DVRPC) region: Chester, Delaware, Montgomery, and Bucks Counties. US 202 Section 200 traverses Chester County, serving as a vital link between the state of Delaware and the US 30 corridor while also carrying local trips in the area surrounding West Chester Borough.
This part of the region has experienced considerable growth in recent decades. Chester County, specifically, continues to grow at a much faster rate than the other Pennsylvania counties in the DVRPC region. The county’s population and employment are both projected to increase by approximately 28 percent between 2015 and 2045. The resulting potential increase in traffic volumes on US 202 is expected to exacerbate congestion and increase safety concerns.
US 202 Section 200 was identified as a Priority Subcorridor in the DVRPC 2019 Congestion Management Process (CMP): www.dvrpc.org/webmaps/CMP2019. CMP Priority Subcorridors are a selected subset of CMP corridors that have the greatest significance for carrying regional travel. Operational improvements on US 202 Section 200 are needed, but budget restraints make large-scale capital improvements difficult to realize. As a result, DVRPC worked with the Chester County Planning Commission (CCPC), West Goshen Township, and the Pennsylvania Department of Transportation (PennDOT) to develop operational improvement scenarios for US 202 Section 200 between Westtown Road and Boot Road.
OBJECTIVE This study supports one main transportation objective: to improve the operational efficiency of US 202 Section 200 through West Goshen Township. This study identifies highway design alternatives that would benefit local residents and commuters by improving safety and maximizing the efficiency of existing transportation infrastructure.
STUDY AREA The study area is located on US 202 Section 200 from Westtown Road to Boot Road, including a portion of US 322 and PA 100, as well as Paoli Pike and West Chester Pike. Five intersections, two on Paoli Pike, two on West Chester Pike, and one on US 322, are included. The study area is shown in Figure 1 on the following page.

2 U S 2 0 2 S E C T I O N 2 0 0 O P E R A T I O N S A N A L Y S I S
Figure 1: Study Area

U S 2 0 2 S E C T I O N 2 0 0 O P E R A T I O N S A N A L Y S I S 3
PLANNING PROCESS This report summarizes the findings of the third phase of a three-year project. The project work is summarized below.
Phase I (Fiscal Year 2018)
• DVRPC worked with CCPC to collect data on existing conditions along the US 202 corridor, including crash data and historical speeds and travel times.
Phase II (Fiscal Year 2019)
• DVRPC used traffic microsimulation models to evaluate the Existing Conditions (Year 2018) and future No Build (Year 2045) scenarios on US 202 Section 100 from Matlack Street to Skiles Boulevard/Stetson School Drive.
• The project team developed three Build (Year 2045) scenarios, which tested distinct versions of a variety of alternatives. These alternatives include improvements at the US 202 intersection with Matlack Street and the northbound (NB) and southbound (SB) ramps at the interchange with US 322 Business/High Street. The report can be found at www.dvrpc.org/Reports/19022.pdf.
Phase III (Fiscal Year 2020)
• DVRPC used traffic simulation to evaluate the Existing Conditions (Year 2019) and future No Build (Year 2045) traffic conditions on US 202 Section 200 from Westtown Road to Boot Road.
• The project team tested three Build (Year 2045) alternatives for NB US 202 and one Build alternative for SB US 202. The four alternatives included adjustments to the roadway cross-section and acceleration and deceleration lane configuration. Methods and results are summarized in this report.
DOCUMENT OVERVIEW This report provides a summary of existing traffic conditions and includes an evaluation of No Build (Year 2045), or without improvement, traffic conditions. The study also details the highway performance results of four distinct Build (Year 2045), or improvement, alternatives. Finally, the document outlines possible funding opportunities.

4 U S 2 0 2 S E C T I O N 2 0 0 O P E R A T I O N S A N A L Y S I S

U S 2 0 2 S E C T I O N 2 0 0 O P E R A T I O N S A N A L Y S I S 5
CHAPTER 1:
Existing Conditions (Year 2019)
TRAVEL TIME Travel time data from the Probe Data Analytics (PDA)1 Suite was evaluated for NB and SB US 202, from the overpass of Westtown Road to the overpass of Boot Road. This matches the approximate 3.2-mile stretch of US 202 that includes the project study area. Supplemental travel time estimates were collected from Google Maps and measured in the field during the peak hour, both yielding similar results. A mid-day hour was included to observe the facility operating at free flow and outside of the largest daily volume intervals.
NB US 202 Table 1 shows measured travel times on US 202 in the NB direction. NB free flow travel time is approximately 3.3 minutes. It is important to note that US 202 Section 200, unlike Section 100 to the south, has no traffic signals on the highway mainline. Therefore, free flow does not vary as a result of traffic signal timing and is purely a reflection of the performance of the highway itself.
Table 1: NB Travel Times (Minutes): Westtown Road Overpass to Boot Road Overpass
Peak Hour PDA Google Maps Field Measurement AM Peak 7:30 – 8:30 4.5 4 4.34 Mid-Day 11:15 – 12:15 3.3 3 3.35 PM Peak 16:45 – 17:45 3.6 4 3.44
Sources: INRIX, 2019; Google, 2019; DVRPC, 2019
NB PM Travel Times There was little increase from free flow travel time to PM peak hour travel time. One reason for this may be decreased volumes in that direction; commuters heading north to job centers in and around the city of Philadelphia would be travelling NB in the AM peak hour and SB in the PM peak hour. A similar pattern can be seen in SB travel times during the AM peak.
SB US 202 The SB free flow travel time is approximately 3.4 minutes. Weaving is a major issue in this direction, as vehicles cut across the roadway to access the Paoli Pike and West Chester Pike ramps. Due to similar factors as on NB US 202 in the morning, traffic slows between US 322 and Paoli Pike, most notably in the evenings. This slows traffic considerably, raising corridor travel times (Table 2).
Table 2: SB Travel Times (Minutes): Westtown Road Overpass to Boot Road Overpass
Peak Hour PDA Google Maps Field Measurement AM Peak 7:30 – 8:30 3.8 4 3.52 Mid-Day 11:15 – 12:15 3.4 3 3.41 PM Peak 16:45 – 17:45 5.0 5 4.74
Sources: INRIX, 2019; Google, 2019; DVRPC, 2019
1 PDA is an analytics platform that provides third-party probe data that supports agencies in transportation planning.
Free flow travel time: The duration it takes a motorist to travel a defined route without any congestion or adverse weather conditions.

6 U S 2 0 2 S E C T I O N 2 0 0 O P E R A T I O N S A N A L Y S I S
CRASH ANALYSIS Crash summaries were prepared using data from the PennDOT Crash Data Analysis and Retrieval Tool (CDART) for the US 202 mainline in both directions, as well as at the five study intersections. The analysis covered five years, from 2014 through 2018.
US 202 Mainline Reported vehicle crashes were grouped by crash rate per million vehicle miles (MVM) of travel for each 0.1-mile segment in each direction. Figures 2 and 3 show the calculated crash rate by segment for NB and SB traffic, respectively. The following equation was used to calculate crash rate for each segment:
𝑅𝑅 =1,000,000 ∗ 𝐶𝐶
365 ∗ 𝑁𝑁 ∗ 𝑉𝑉 ∗ 𝐿𝐿
Where:
R = crash rate for the segment per MVM of travel; C = total number of crashes in the study period, per PennDOT CDART data; N = number of years of data, five, the study period from 2014 through 2018; V = number of vehicles per day per direction, obtained from DVRPC traffic counts; L = length of the roadway segment in miles, 0.1, for each segment.
Figure 2: NB US 202 Crash Histogram

U S 2 0 2 S E C T I O N 2 0 0 O P E R A T I O N S A N A L Y S I S 7
Figure 3: SB US 202 Crash Histogram
Per The 2017 Crash Facts and Statistics Booklet (PennDOT, 2017), the most recent state-wide data available at the time of analysis, the average crash rate on Pennsylvania state highways in 2017 was 1.43 crashes/MVM. Only two segments in the study had crash rates above the state average: on NB US 202 before the West Chester Pike deceleration ramp (1.712 crashes/MVM), and between West Chester Pike and Paoli Pike (2.046 crashes/MVM). This is likely due to aggressive weaving to and/or from the ramps across US 202 mainline traffic. Detailed diagrams of individual crash types and locations in the two above-average segments and at study intersections can be found in the Appendix.

8 U S 2 0 2 S E C T I O N 2 0 0 O P E R A T I O N S A N A L Y S I S
TRAFFIC VOLUMES AND BEHAVIOR The AM peak hour for this analysis is 7:30 AM to 8:30 AM, and the PM peak hour is 4:45 PM to 5:45 PM. In the AM peak hour, US 202 SB volumes are comparable to NB volumes, but the balance varies greatly within the study area. In the PM peak hour, SB volumes are consistently higher than NB volumes by about 1,000 vehicles. These commuting flows suggest a local commuting pattern toward workplaces in Pennsylvania, as opposed to those in Delaware. Truck volume percentages on US 202, US 322, and PA 100 fluctuate between 1.8 percent and 9 percent. Truck volumes are higher in the AM than in the PM.
Figures 4 and 5 on pages 10 and 11 summarize the calibrated turning movement counts (TMCs) at the intersections and highway ramps in the study area. DVRPC collected the traffic counts in the study area primarily in the fall of 2019. These traffic counts can be accessed using the DVRPC traffic counts web map: www.dvrpc.org/webmaps/TrafficCounts. Driver behavior on US 202 is affected by the close proximity of the West Chester Pike and Paoli Pike interchanges. The short distance between the acceleration ramp from West Chester Pike and the deceleration ramp to Paoli Pike forces vehicles to be more aggressive in lane change movements to and from those ramps, cutting out sharply in front of other vehicles and causing them to brake. The sudden braking causes the next upstream vehicle to slow suddenly, and a shockwave forms.
AM peak hour: The morning hour during which traffic volumes are the highest based on traffic counts collected by DVRPC in 2019.
PM peak hour: The evening hour during which traffic volumes are the highest based on traffic counts collected by DVRPC in 2019.
Slowed traffic on NB US 202 during the AM peak hour between West Chester Pike and Paoli Pike. Source: DVRPC, 2019

U S 2 0 2 S E C T I O N 2 0 0 O P E R A T I O N S A N A L Y S I S 9
The slowing of traffic on the US 202 mainline adversely affects nearby surface roads, as vehicles are unable
to merge smoothly onto the highway and ramp traffic spills back from the ramps. Queues form as large volumes seek to head north on US 202 from West Chester Pike, which creates a bottleneck for vehicles heading west into West Chester Borough. In turn, this bottleneck lessens the frequency of turning gaps for left-turning vehicles, causing queue buildup in the eastbound (EB) direction.
A queue of vehicles seeking to turn onto US 202 from West Chester Pike. Source: DVRPC, 2019
A growing left-turn queue on EB West Chester Pike in the morning. Source: DVRPC, 2019

1 0 U S 2 0 2 S E C T I O N 2 0 0 O P E R A T I O N S A N A L Y S I S
Figure 4: DVRPC Traffic Counts: AM Peak Hour

U S 2 0 2 S E C T I O N 2 0 0 O P E R A T I O N S A N A L Y S I S 1 1
Figure 5: DVRPC Traffic Counts: PM Peak Hour

U S 2 0 2 S E C T I O N 2 0 0 O P E R A T I O N S A N A L Y S I S 1 3
CHAPTER 2: Assessment of Peak Hour Traffic Operations
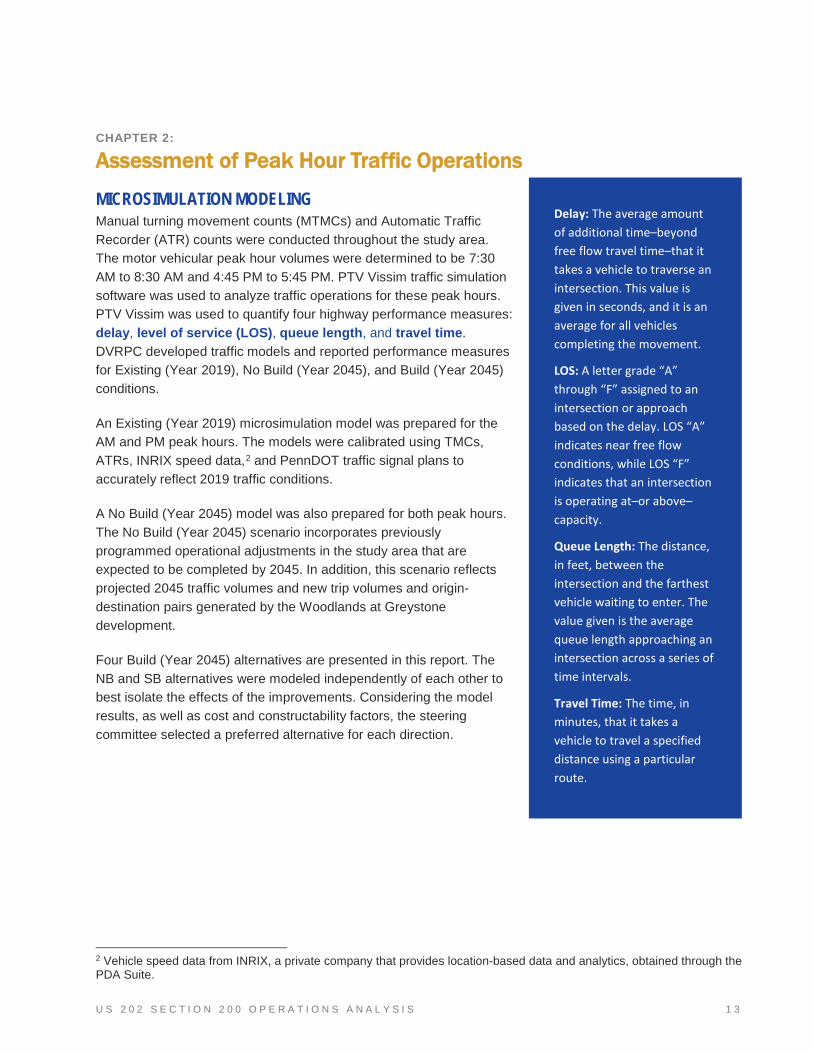
MICROSIMULATION MODELING Manual turning movement counts (MTMCs) and Automatic Traffic Recorder (ATR) counts were conducted throughout the study area. The motor vehicular peak hour volumes were determined to be 7:30 AM to 8:30 AM and 4:45 PM to 5:45 PM. PTV Vissim traffic simulation software was used to analyze traffic operations for these peak hours. PTV Vissim was used to quantify four highway performance measures: delay, level of service (LOS), queue length, and travel time. DVRPC developed traffic models and reported performance measures for Existing (Year 2019), No Build (Year 2045), and Build (Year 2045) conditions.
An Existing (Year 2019) microsimulation model was prepared for the AM and PM peak hours. The models were calibrated using TMCs, ATRs, INRIX speed data,2 and PennDOT traffic signal plans to accurately reflect 2019 traffic conditions.
A No Build (Year 2045) model was also prepared for both peak hours. The No Build (Year 2045) scenario incorporates previously programmed operational adjustments in the study area that are expected to be completed by 2045. In addition, this scenario reflects projected 2045 traffic volumes and new trip volumes and origin-destination pairs generated by the Woodlands at Greystone development.
Four Build (Year 2045) alternatives are presented in this report. The NB and SB alternatives were modeled independently of each other to best isolate the effects of the improvements. Considering the model results, as well as cost and constructability factors, the steering committee selected a preferred alternative for each direction.
2 Vehicle speed data from INRIX, a private company that provides location-based data and analytics, obtained through the PDA Suite.
Delay: The average amount of additional time–beyond free flow travel time–that it takes a vehicle to traverse an intersection. This value is given in seconds, and it is an average for all vehicles completing the movement.
LOS: A letter grade “A” through “F” assigned to an intersection or approach based on the delay. LOS “A” indicates near free flow conditions, while LOS “F” indicates that an intersection is operating at–or above–capacity.
Queue Length: The distance, in feet, between the intersection and the farthest vehicle waiting to enter. The value given is the average queue length approaching an intersection across a series of time intervals.
Travel Time: The time, in minutes, that it takes a vehicle to travel a specified distance using a particular route.

1 4 U S 2 0 2 S E C T I O N 2 0 0 O P E R A T I O N S A N A L Y S I S
EXISTING CONDITIONS
The intersection volumes, delay, LOS, and queues for the AM and PM peak hours are shown in Tables 3 and 4, respectively. The reported results represent the average of 12 simulation runs.
Table 3: Existing (Year 2019) AM Peak Hour Intersection Performance Results
7:30 – 8:30 AM Approach
Approach Volume
(veh)
Approach Delay
(s/veh) Approach
LOS Approach
Queue (ft)
Intersection Volume
(veh) Intersection
Delay (s) Intersection
LOS
US 322 & Phoenixville
Pike
Phoenixville SB 462 37.1 D 219
2,683 24.0 C Phoenixville
NB 334 37.0 D 230.6
US 322 WB 567 17.9 B 285.8
US 322 EB 1,320 18.8 B 720.6
US 202 NB Ramps & Paoli Pike
US 202 NB Ramps 199 14.0 B 100.3
1,658 9.4 A Paoli Pike EB 1,038 8.1 A 179.7
Paoli Pike WB 421 10.6 B 121.3
US 202 SB Ramps & Paoli Pike
Paoli Pike EB 729 14.0 B 213.0
1,863 14.1 B US 202 SB Ramps 806 15.4 B 380.4
Paoli Pike WB 328 11.0 B 133.7
Source: DVRPC, 2019
Table 4: Existing (Year 2019) PM Peak Hour Intersection Performance Results
4:45 – 5:45 PM Approach
Approach Volume
(veh)
Approach Delay
(s/veh) Approach
LOS Approach
Queue (ft)
Intersection Volume
(veh) Intersection
Delay (s) Intersection
LOS
US 322 & Phoenixville
Pike
Phoenixville SB 786 70.0 E 529.9
2,965 46.5 D Phoenixville
NB 607 42.5 D 420.2
US 322 WB 900 50.4 D 1,411.7
US 322 EB 672 17.3 B 348.2
US 202 NB Ramps & Paoli Pike
US 202 NB Ramps 239 13.7 B 98.3
1,979 11.6 B Paoli Pike EB 1,079 10.7 B 211.6
Paoli Pike WB 661 12.4 B 172.2
US 202 SB Ramps & Paoli Pike
Paoli Pike EB 913 14.9 B 246.9
2,242 14.5 B US 202 SB Ramps 802 15.7 B 341.4
Paoli Pike WB 527 11.7 B 199.5
Source: DVRPC, 2019

U S 2 0 2 S E C T I O N 2 0 0 O P E R A T I O N S A N A L Y S I S 1 5
Vehicle travel time is a measure of performance on highways. Average travel time was calculated using the
Existing (Year 2019) PTV Vissim microsimulation model for the distance between the Boot Road and Westtown Road overpasses— about 3.2 miles in both SB and NB directions. Table 5 shows the average calibrated base year PTV Vissim model travel times.
Table 5: Existing (Year 2019) Travel Times (Minutes)
AM Peak Hour PM Peak Hour
NB US 202 (3.2 mi) 4.10 3.53
SB US 202 (3.2 mi) 3.59 4.78
Source: DVRPC, 2019
It is evident that each direction only experiences travel times noticeably higher than those in free flow during one of the two peak hours. As detailed in Chapter 1, local commuting patterns are likely the reason for the imbalance in NB and SB volumes. This imbalance renders a countermeasure like road widening less warranted, as the capacity-adding benefits are only needed in each direction for one peak hour- and would leave the roadway overdesigned for the other.
NO BUILD (YEAR 2045) The 2045 No Build scenario incorporates identified operational improvements, projected 2045 traffic volumes, and new trips generated by the Woodlands at Greystone development.
Operational Improvements The following operational improvements are included in the 2045 No Build scenario.
• US 322 and Phoenixville Pike: Updated signal timing plan; extended turn lane storage bays: westbound (WB) right lane to 210 feet and southbound (SB) left lane to 325 feet (source: Woodlands at Greystone Transportation Impact Study prepared by Traffic Planning and Design, Inc., 2016).
• Projected 2045 Traffic Volumes: A background growth rate was applied to segments within the roadway network to capture the expected increase in traffic in the study area. The growth factors are based on the county and federal functional classification of the road segment. They were developed using the DVRPC Regional Travel Demand Model and 2045 Long-Range Plan and are consistent with the DVRPC population and employment forecasts. There are four federal functional classes represented in the study area; the projected average annual growth rate for each is presented in Table 6.
Table 6: Average Annual Growth Factor by Federal Functional Class
Federal Functional Class Average Annual Growth Factor
Other Freeway and Expressway 1.57%
Other Principal Arterial Major Collector
1.25% Local Road
Source: DVRPC, 2019

1 6 U S 2 0 2 S E C T I O N 2 0 0 O P E R A T I O N S A N A L Y S I S
Results
The intersection volumes, delay, LOS, and queues for the No Build (Year 2045) AM and PM peak hours, respectively, are shown in Tables 7 and 8. The reported results represent the average of 12 simulation runs.
Table 7: No Build (Year 2045) AM Peak Hour Intersection Performance Results
7:30 – 8:30 AM Approach
Approach Volume
(veh)
Approach Delay
(s/veh) Approach
LOS Approach
Queue (ft)
Intersection Volume
(veh) Intersection
Delay (s) Intersection
LOS
US 322 & Phoenixville
Pike
Phoenixville SB 448 35.6 D 250.9
2,624 34.0 C Phoenixville
NB 500 54.1 D 333.2
US 322 WB 280 26.9 C 195.9
US 322 EB 1,396 27.7 C 822
US 202 NB Ramps & Paoli Pike
US 202 NB Ramps 295 14.1 B 128.5
1,842 11.4 B Paoli Pike EB 1,101 10.2 B 211.8
Paoli Pike WB 446 12.8 B 131.3
US 202 SB Ramps & Paoli Pike
Paoli Pike EB 771 14.9 B 226.0
2,012 14.8 B US 202 SB Ramps 878 15.7 B 412.3
Paoli Pike WB 363 12.1 B 138.8
Source: DVRPC, 2020
Table 8: No Build (Year 2045) PM Peak Hour Intersection Performance Results
4:45 – 5:45 PM Approach
Approach Volume
(veh)
Approach Delay
(s/veh) Approach
LOS Approach
Queue (ft)
Intersection Volume
(veh) Intersection
Delay (s) Intersection
LOS
US 322 & Phoenixville
Pike
Phoenixville SB 730 73.0 E 354.1
3,356 50.8 D Phoenixville
NB 770 73.5 E 470.2
US 322 WB 806 39.7 D 1,234.6
US 322 EB 1,050 27.3 C 682.5
US 202 NB Ramps & Paoli Pike
US 202 NB Ramps 272 15.2 B 125.6
2,121 13.5 B Paoli Pike EB 1,154 13.0 B 247.7
Paoli Pike WB 695 13.7 B 196.6
US 202 SB Ramps & Paoli Pike
Paoli Pike EB 966 17.1 B 278.0
2,375 16.0 B US 202 SB Ramps 859 16.5 B 485.1
Paoli Pike WB 550 13.3 B 201.0
Source: DVRPC, 2020

U S 2 0 2 S E C T I O N 2 0 0 O P E R A T I O N S A N A L Y S I S 1 7
Average travel time was calculated using the No Build (Year 2045) PTV Vissim microsimulation model for the distance between the Boot Road and Westtown Road overpasses— about 3.2 miles in both SB and NB directions. Table 9 shows the projected No Build (Year 2045) scenario planning times from the PTV Vissim model.
Table 9: No Build (Year 2045) Travel Times (Minutes)
AM Peak Hour PM Peak Hour
NB US 202 (3.2 mi) 5.75 5.17
SB US 202 (3.2 mi) 8.43 12.80
Source: DVRPC, 2020
The same operational issue that occurs under current conditions, weaving to and from the ramps, emerges in the No Build (Year 2045) model. The SB travel times are projected to more than double in both peak hours, as increased traffic from PA 100 and US 322 joins an already-congested SB US 202. The US 322 traffic would be especially strained because the vehicles must move inward one lane to avoid being trapped in the Paoli Pike exit-only lane. At the same time, some US 202 and PA 100 vehicles attempt to shift across the roadway to exit at Paoli Pike. This problem is further exacerbated with the projected future increase in traffic volumes; as more vehicles clog the roadway during the peak hour, fewer windows are available for safe lane change maneuvers.
The performance of the signalized study intersections is expected to deteriorate as traffic volumes increase. The overall level of service at the US 322 and Phoenixville Pike intersection drops from a LOS C to LOS D. This is partially due to the Woodlands at Greystone development northwest of the intersection. Improvements at the intersection, detailed on page 15, are assumed to have been installed, along with the development in the No Build and Build 2045 traffic models, and help accommodate additional turning movements. However, the capacity of both SB Phoenixville Pike and WB US 322 is already strained in the existing year models, which do not include the addition of development-generated traffic at the intersection. Unlike the study intersection on US 322, the performance of the two intersections on Paoli Pike is linked more closely to congestion on US 202 itself. As traffic is unable to enter the highway, vehicles spill back from the ramps onto Paoli Pike.
1 8 U S 2 0 2 S E C T I O N 2 0 0 O P E R A T I O N S A N A L Y S I S
BUILD (YEAR 2045)
As previously mentioned, four Build (Year 2045) alternatives were developed and evaluated through this project. Three different alternatives were tested in the NB direction, and one was tested in the SB direction.
Description of Build Alternatives Each alternative refers to a roadway improvement in a distinct part of the study area. The improvements are described below. Please note that no improvements were modeled on surface roads or at study intersections.
SB US 202
• 1: Expanded, three-lane highway cross-section from the PA 100 merge through the West Chester Pike acceleration lane merge.
NB US 202
• 1: Expanded, three-lane highway cross-section from south of West Chester Pike deceleration lane to the PA 100 lane drop.
• 2: Expanded, three-lane highway cross-section from south of West Chester Pike deceleration lane to the US 322 lane drop. Install a collector-distributor lane from south of West Chester Pike deceleration lane to north of Paoli Pike acceleration lane.
• 2A: Expanded, three-lane highway cross-section from south of West Chester Pike deceleration lane to the US 322 lane drop. Install a collector-distributor lane from south of West Chester Pike deceleration lane to north of Paoli Pike acceleration lane, with lengthened Paoli Pike and West Chester Pike acceleration lanes.
• 3: Expanded, three-lane highway cross-section from south of West Chester Pike deceleration lane to the PA 100 lane drop. Install a collector-distributor lane from south of West Chester Pike deceleration lane to north of Paoli Pike acceleration lane.
Staying within the current roadway footprint was a priority of the steering committee. However, the added width of the dividing barrier necessary to enforce the lane change restriction of the collector-distributor lane made preserving existing shoulder width impossible in areas. Additionally, the West Chester Pike and Paoli Pike NB acceleration ramp lengths would fall below design standards for the current posted speed limit if relocated within the current roadway footprint. NB Build Alternative 2A was added to consider a scenario in which footprint expansion is permitted, both to maintain current shoulder width and to produce compliant acceleration lanes, assuming that lowering the posted speed limit in the lane is not a viable option.
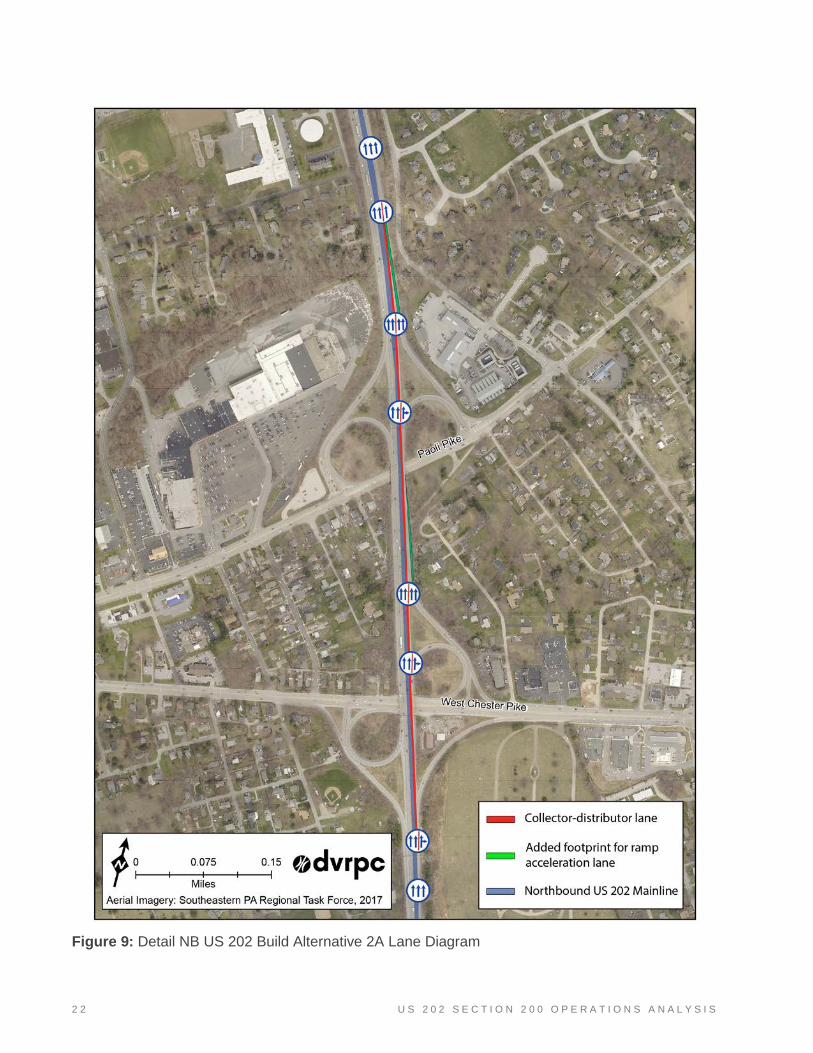
The alternatives are illustrated in Figures 6, 7, and 8 on the following pages. Figure 9 represents the extent of the collector-distributor lane and lengthened acceleration ramps to scale. Figure 10 shows a potential expansion of the roadway footprint into the berm, which is necessary north of West Chester Pike and Paoli Pike to accommodate NB Build Alternative 2A.
Collector-Distributor Lane: A supplemental facility between highway mainlines and surface roads. Its primary purpose is to eliminate unsafe lane-change movements in the highway mainline. These lanes typically run on the outside of the highway and have a single entrance and exit point to minimize ramp-to-ramp weaving.

U S 2 0 2 S E C T I O N 2 0 0 O P E R A T I O N S A N A L Y S I S 1 9
Figure 6: Diagram of Existing NB US 202 and Build Alternatives 1 and 2

2 0 U S 2 0 2 S E C T I O N 2 0 0 O P E R A T I O N S A N A L Y S I S
Figure 7: Diagram of Existing NB US 202 and Build Alternatives 2A and 3

U S 2 0 2 S E C T I O N 2 0 0 O P E R A T I O N S A N A L Y S I S 2 1
Figure 8: Diagram of Existing SB US 202 and Build Alternative 1
2 2 U S 2 0 2 S E C T I O N 2 0 0 O P E R A T I O N S A N A L Y S I S
Figure 9: Detail NB US 202 Build Alternative 2A Lane Diagram

U S 2 0 2 S E C T I O N 2 0 0 O P E R A T I O N S A N A L Y S I S 2 3
Figure 10: Concept Cross-Section of US 202 Build Alternative 2A Footprint Expansion

2 4 U S 2 0 2 S E C T I O N 2 0 0 O P E R A T I O N S A N A L Y S I S
SB Build Alternative 1
The intersection volumes, delay, LOS, and queues for the AM and PM peak hours, respectively, are shown in Tables 10 and 11. The reported results represent the average of 12 simulation runs.
Table 10: SB Build Alternative 1 (Year 2045) AM Peak Hour Intersection Performance Results
7:30 – 8:30 AM Approach
Approach Volume
(veh)
Approach Delay
(s/veh) Approach
LOS Approach
Queue (ft)
Intersection Volume
(veh) Intersection
Delay (s) Intersection
LOS
US 322 & Phoenixville
Pike
Phoenixville SB 420 39.3 D 254.5
2,583 34.7 C Phoenixville
NB 475 57.0 E 344.6
US 322 WB 273 28.7 C 220.0
US 322 EB 1,415 26.9 C 947.8
US 202 NB Ramps & Paoli Pike
US 202 NB Ramps 279 14.9 B 151.3
1,816 11.0 B Paoli Pike EB 1,095 9.4 A 178.8
Paoli Pike WB 442 12.5 B 124.7
US 202 SB Ramps & Paoli Pike
Paoli Pike EB 757 15.5 B 198.1
2,054 14.9 B US 202 SB Ramps 958 15.8 B 504.3
Paoli Pike WB 339 11.4 B 120.9
Source: DVRPC, 2020
Table 11: SB Build Alternative 1 (Year 2045) PM Peak Hour Intersection Performance Results
4:45 – 5:45 PM Approach
Approach Volume
(veh)
Approach Delay
(s/veh) Approach
LOS Approach
Queue (ft)
Intersection Volume
(veh) Intersection
Delay (s) Intersection
LOS
US 322 & Phoenixville
Pike
Phoenixville SB 665 88.2 F 442.7
3,403 60.0 E Phoenixville
NB 758 87.1 F 438.8
US 322 WB 931 49.5 D 1,509.4
US 322 EB 1,057 32.0 C 670.7
US 202 NB Ramps & Paoli Pike
US 202 NB Ramps 217 14.7 B 84.2
2,026 12.0 B Paoli Pike EB 1,134 11.7 B 405.6
Paoli Pike WB 675 11.7 B 166.5
US 202 SB Ramps & Paoli Pike
Paoli Pike EB 961 15.3 B 234.9
2,295 14.2 B US 202 SB Ramps 790 14.8 B 393.3
Paoli Pike WB 544 11.3 B 211.0
Source: DVRPC, 2020

U S 2 0 2 S E C T I O N 2 0 0 O P E R A T I O N S A N A L Y S I S 2 5
NB Build Alternative 1
The intersection volumes, delay, LOS, and queues for the AM and PM peak hours, respectively, are shown in Tables 12 and 13. The reported results represent the average of 12 simulation runs.
Table 12: NB Build Alternative 1 (Year 2045) AM Peak Hour Intersection Performance Results
7:30 – 8:30 AM Approach
Approach Volume
(veh)
Approach Delay
(s/veh) Approach
LOS Approach
Queue (ft)
Intersection Volume
(veh) Intersection
Delay (s) Intersection
LOS
US 322 & Phoenixville
Pike
Phoenixville SB 669 26.5 C 250.2
2,965 32.1 C Phoenixville
NB 500 54.4 D 332.5
US 322 WB 399 27.4 C 252.3
US 322 EB 1,397 28.2 C 820.2
US 202 NB Ramps & Paoli Pike
US 202 NB Ramps 303 14.4 B 171.0
1,913 11.7 B Paoli Pike EB 1,163 10.7 B 213.9
Paoli Pike WB 447 12.5 B 129
US 202 SB Ramps & Paoli Pike
Paoli Pike EB 775 18.3 B 248.0
2,177 17.4 B US 202 SB Ramps 1,035 17.8 B 638.0
Paoli Pike WB 367 14.3 B 140.0
Source: DVRPC, 2020
Table 13: NB Build Alternative 1 (Year 2045) PM Peak Hour Intersection Performance Results
4:45 – 5:45 PM Approach
Approach Volume
(veh)
Approach Delay
(s/veh) Approach
LOS Approach
Queue (ft)
Intersection Volume
(veh) Intersection
Delay (s) Intersection
LOS
US 322 & Phoenixville
Pike
Phoenixville SB 690 84.8 F 452.3
3,403 60.0 E Phoenixville
NB 772 74.4 E 487.9
US 322 WB 896 51.4 D 1,493.9
US 322 EB 1,045 40.5 D 690.8
US 202 NB Ramps & Paoli Pike
US 202 NB Ramps 214 16.2 B 129.5
2,029 11.4 B Paoli Pike EB 1,115 10.2 B 237.7
Paoli Pike WB 700 11.8 B 196.7
US 202 SB Ramps & Paoli Pike
Paoli Pike EB 964 14.4 B 252.8
2,230 13.6 B US 202 SB Ramps 730 14.5 B 301.9
Paoli Pike WB 536 11.1 B 212
Source: DVRPC, 2020

2 6 U S 2 0 2 S E C T I O N 2 0 0 O P E R A T I O N S A N A L Y S I S
NB Build Alternative 2
The intersection volumes, delay, LOS, and queues for the AM and PM peak hours, respectively, are shown in Tables 14 and 15. The reported results represent the average of 12 simulation runs.
Table 14: NB Build Alternative 2 (Year 2045) AM Peak Hour Intersection Performance Results
7:30 – 8:30 AM Approach
Approach Volume
(veh)
Approach Delay
(s/veh) Approach
LOS Approach
Queue (ft)
Intersection Volume
(veh) Intersection
Delay (s) Intersection
LOS
US 322 & Phoenixville
Pike
Phoenixville SB 562 30.0 C 247.1
2,678 32.9 C Phoenixville
NB 500 53.7 D 339.9
US 322 WB 221 27.2 C 139.2
US 322 EB 1,395 27.6 C 824.1
US 202 NB Ramps & Paoli Pike
US 202 NB Ramps 303 17.0 B 170.6
1,538 25.1 C Paoli Pike EB 1,103 20.4 C 273.9
Paoli Pike WB 132 69.9 E 219.5
US 202 SB Ramps & Paoli Pike
Paoli Pike EB 771 15.4 B 226.7
1,809 14.7 B US 202 SB Ramps 880 14.5 B 366.5
Paoli Pike WB 158 12.3 B 135.0
Source: DVRPC, 2020
Table 15: NB Build Alternative 2 (Year 2045) PM Peak Hour Intersection Performance Results
4:45 – 5:45 PM Approach
Approach Volume
(veh)
Approach Delay
(s/veh) Approach
LOS Approach
Queue (ft)
Intersection Volume
(veh) Intersection
Delay (s) Intersection
LOS
US 322 & Phoenixville
Pike
Phoenixville SB 673 82.8 F 461.7
3,269 52.6 D Phoenixville
NB 773 75.8 E 483.6
US 322 WB 771 35.8 D 788.4
US 322 EB 1,052 28.7 C 683.6
US 202 NB Ramps & Paoli Pike
US 202 NB Ramps 178 18.0 B 94.2
1,745 24.4 C Paoli Pike EB 1,112 25.1 C 389.4
Paoli Pike WB 455 25.4 C 281.7
US 202 SB Ramps & Paoli Pike
Paoli Pike EB 964 14.4 B 252.8
2,053 21.5 C US 202 SB Ramps 730 14.5 B 301.9
Paoli Pike WB 536 11.1 B 212
Source: DVRPC, 2020

U S 2 0 2 S E C T I O N 2 0 0 O P E R A T I O N S A N A L Y S I S 2 7
NB Build Alternative 2A
The intersection volumes, delay, LOS, and queues for the AM and PM peak hours, respectively, are shown in Tables 16 and 17. The reported results represent the average of 12 simulation runs.
Table 16: NB Build Alternative 2A (Year 2045) AM Peak Hour Intersection Performance Results
7:30 – 8:30 AM Approach
Approach Volume
(veh)
Approach Delay
(s/veh) Approach
LOS Approach
Queue (ft)
Intersection Volume
(veh) Intersection
Delay (s) Intersection
LOS
US 322 & Phoenixville
Pike
Phoenixville SB 714 26.2 C 273.3
2,991 32.0 C Phoenixville
NB 500 54.0 D 336.6
US 322 WB 386 27.5 C 258.3
US 322 EB 1,391 28.4 C 826.6
US 202 NB Ramps & Paoli Pike
US 202 NB Ramps 302 17.0 B 171.0
1,718 20.0 B Paoli Pike EB 1,097 20.4 C 272.3
Paoli Pike WB 319 21.4 C 166.7
US 202 SB Ramps & Paoli Pike
Paoli Pike EB 770 15.3 B 224.4
1,934 14.8 B US 202 SB Ramps 882 15.2 B 385.7
Paoli Pike WB 282 12.2 B 155.8
Source: DVRPC, 2020
Table 17: NB Build Alternative 2A (Year 2045) PM Peak Hour Intersection Performance Results
4:45 – 5:45 PM Approach
Approach Volume
(veh)
Approach Delay
(s/veh) Approach
LOS Approach
Queue (ft)
Intersection Volume
(veh) Intersection
Delay (s) Intersection
LOS
US 322 & Phoenixville
Pike
Phoenixville SB 675 85.6 F 455.4
3,365 58.5 E Phoenixville
NB 769 76.0 E 489.5
US 322 WB 872 47.4 D 1,456.7
US 322 EB 1,049 37.3 D 685.2
US 202 NB Ramps & Paoli Pike
US 202 NB Ramps 198 16.9 B 111.9
1,985 14.2 B Paoli Pike EB 1,120 13.7 B 268.2
Paoli Pike WB 667 14.4 B 215.1
US 202 SB Ramps & Paoli Pike
Paoli Pike EB 968 13.9 B 260.8
2,213 13.4 B US 202 SB Ramps 735 14.6 B 292.1
Paoli Pike WB 510 10.6 B 211.0
Source: DVRPC, 2020

2 8 U S 2 0 2 S E C T I O N 2 0 0 O P E R A T I O N S A N A L Y S I S
NB Build Alternative 3
The intersection volumes, delay, LOS, and queues for the AM and PM peak hours, respectively, are shown in Tables 18 and 19. The reported results represent the average of 12 simulation runs.
Table 18: NB Build Alternative 3 (Year 2045) AM Peak Hour Intersection Performance Results
7:30 – 8:30 AM Approach
Approach Volume
(veh)
Approach Delay
(s/veh) Approach
LOS Approach
Queue (ft)
Intersection Volume
(veh) Intersection
Delay (s) Intersection
LOS
US 322 & Phoenixville
Pike
Phoenixville SB 560 29.4 C 239.4
2,680 32.5 C Phoenixville
NB 501 53.2 D 330.3
US 322 WB 221 25.5 C 147.9
US 322 EB 1,398 27.4 C 821.2
US 202 NB Ramps & Paoli Pike
US 202 NB Ramps 303 16.8 B 161.5
1,538 23.2 C Paoli Pike EB 1,101 19.7 B 252.5
Paoli Pike WB 134 66.6 E 193.7
US 202 SB Ramps & Paoli Pike
Paoli Pike EB 774 15.7 B 241.0
1,816 15.0 B US 202 SB Ramps 881 15.0 B 436.4
Paoli Pike WB 161 11.6 B 130.5
Source: DVRPC, 2020
Table 19: NB Build Alternative 3 (Year 2045) PM Peak Hour Intersection Performance Results
4:45 – 5:45 PM Approach
Approach Volume
(veh)
Approach Delay
(s/veh) Approach
LOS Approach
Queue (ft)
Intersection Volume
(veh) Intersection
Delay (s) Intersection
LOS
US 322 & Phoenixville
Pike
Phoenixville SB 678 81.3 F 463.8
3,288 53.5 D Phoenixville
NB 776 79.0 E 485.5
US 322 WB 781 37.5 D 859.8
US 322 EB 1,053 28.6 C 686.4
US 202 NB Ramps & Paoli Pike
US 202 NB Ramps 169 17.9 B 95.8
1,831 21.7 C Paoli Pike EB 1,103 21.0 C 361.4
Paoli Pike WB 559 24.2 C 296.7
US 202 SB Ramps & Paoli Pike
Paoli Pike EB 947 22.5 C 311.0
2,100 18.5 B US 202 SB Ramps 729 17.6 B 406.9
Paoli Pike WB 424 10.9 B 208.1
Source: DVRPC, 2020

U S 2 0 2 S E C T I O N 2 0 0 O P E R A T I O N S A N A L Y S I S 2 9
Comparison of Travel Times
Travel time was measured using the SB Build 1 and NB Build 1, 2, 2A, and 3 microsimulation models for the distance between the Boot Road and Westtown Road overpasses- about 3.2 miles in both SB and NB directions (Table 20 and 21).
Table 20: SB Build Alternative 1 (Year 2045) Travel Times (Minutes)
Peak Hour No Build (Year 2045) Build 1
SB US 202 (3.2 mi) AM 8.43 4.79
PM 12.80 10.34
Source: DVRPC, 2020
Table 21: NB Build Alternatives 1, 2, 2A, 3 (Year 2045) Travel Times (Minutes)
Peak Hour No Build (Year 2045) Build 1 Build 2 Build 2A Build 3
NB US 202 (3.2 mi) AM 5.75 4.43 3.54 3.75 3.75
PM 5.17 3.63 3.44 3.57 3.42
Source: DVRPC, 2020


U S 2 0 2 S E C T I O N 2 0 0 O P E R A T I O N S A N A L Y S I S 3 1
CHAPTER 3:
Summary of Findings
FINDINGS The results of the microsimulation model clearly show that adding a SB travel lane, as modeled in SB Build Alternative 1, reduces average travel time on US 202. However, required reconfiguration of existing acceleration and deceleration lanes to make room for additional capacity makes merging more difficult for US 202-bound traffic from surface roads. The Build alternative also constricts acceleration ramp merging areas, one of which is a loop ramp, with longer and safer merges requiring drastic reconstruction and bridge expansion. Moreover, the alternative does not decrease the occurrence of aggressive weaving of traffic merging from US 322 and traffic heading to Paoli Pike and West Chester Pike. The issue is best addressed preventatively upstream of the study area; correction would require an origin-destination study of upstream traffic and subsequent adjustments to deter the vehicles’ usage of US 202 in peak traffic hours. Because of this, the No Build Alternative is the preferred alternative for SB US 202 in the study area.
Adding a lane in the NB direction as described in NB Build Alternative 1 reduces travel time but does not reduce weaving from the West Chester and Paoli Pike acceleration ramps. The collector-distributor lane in NB Build Alternatives 2, 2A, and 3 eliminates the weaving, but also serves to reduce gaps for merging vehicles from surface roads because NB traffic from West Chester Pike must remain in the lane until after the Paoli Pike merge. Although US 202 performance is improved, these issues cause intersection performance to suffer as ramp spillback worsens. NB Build Alternative 3 does not reduce average travel time any more than the other alternatives that employ a collector-distributor lane, suggesting extending the added lane past the US 322 lane drop is unnecessary.
NB Build Alternative 2A represents an attempt to balance the tradeoff between the performance of US 202 and that of surface roadway intersections. This alternative is unique in that it allows for expansion into the current roadway berm in places, allowing for longer acceleration lanes and a safer, smoother merge from the surface roads. The longer merge reduces ramp spillback, causing a slight increase in average NB travel time. The reduced spillback allows the LOS of the US 202 NB ramps and Paoli Pike intersection to remain at B in both peak hours, while the other alternatives (2 and 3) that incorporated a collector-distributor lane reduced the intersection LOS to C in both peak hours. Although projected to be a more expensive option than NB Build Alternative 2, the additional cost is necessary to maintain safe and efficient intersection performance, and thus NB Build Alternative 2A is the preferred alternative for NB US 202 in the study area.
OTHER RECOMMENDATIONS A number of additional performance and safety-related measures were not modeled as part of the operation analysis but are recommended for implementation throughout the study area.
• Lengthen Paoli Pike WB right turn storage lane at the intersection of US 202 NB ramps and Paoli Pike, utilizing West Goshen Township lot to provide additional storage and prevent ramp spillback into through lanes.
• Install lighting at Paoli Pike and West Chester Pike merge areas and collector-distributor lane access points on US 202 to provide enhanced visibility for drivers.

3 2 U S 2 0 2 S E C T I O N 2 0 0 O P E R A T I O N S A N A L Y S I S
NEXT STEPS
Securing funding is a crucial step toward project implementation. There are a number of funding streams and competitive grant programs available in the DVRPC region to help municipalities cover the cost of the transportation improvements described in this report. Municipalities can coordinate with each other, the county, and PennDOT to prepare and submit grant applications. Possible funding sources for the improvements identified in this study are detailed below.
Transportation Improvement Program (TIP) The TIP is the regionally agreed-upon list of priority transportation projects, as required by federal law (Intermodal Suface Tranportation Efficiency Act; Transportation Equity Act for the 21st Century; Safe, Accountable, Flexible, Efficient Transportation Equity Act: A Legacy for Users; Moving Ahead for Progress in the 21st Century Act; Fixing America’s Surface Transportation Act). The TIP document must list all projects that intend to use federal funds, along with all non-federally funded projects that are regionally significant. The Pennsylvania TIP for the counties in the DVRPC region also includes all other state-funded capital projects. The projects are multimodal; that is, they include bicycle, pedestrian, intelligent transportation systems, and freight-related projects, as well as the more traditional highway and public transit projects.
National Highway Performance Program (NHPP) The NHPP provides support for the condition and performance of the National Highway System (NHS), for the construction of new facilities on the NHS, and to ensure that investments of federal-aid funds in highway construction are directed to support progress toward the achievement of performance targets established in a state's asset management plan for the NHS.
Surface Transportation Block Grant Program (STBG) The STBG provides flexible funding that may be used by states and localities for projects that preserve and improve the conditions and performance on any federal-aid highway, bridge, and tunnel projects on any public road, pedestrian and bicycle infrastructure, and transit capital projects.
Automated Red Light Enforcement (ARLE) The ARLE program was established in 2010 as a PennDOT-administered competitive grant program. Funding for the program is generated from the net revenue of fines collected through ARLE Enforcement Systems, a tool used to automatically monitor signalized intersections for red-light-running violators on a 24/7 basis. The intent of the program is to improve intersection safety by reducing vehicle crashes and injuries due to red-light-running. The system helps to enforce traffic laws and improve safety. Eligible projects include the retiming of existing traffic control signals, installation of new or improved detection systems for traffic control signals, and roadway capacity upgrades like auxiliary turning lanes.

U S 2 0 2 S E C T I O N 2 0 0 O P E R A T I O N S A N A L Y S I S A - 1

A - 2 U S 2 0 2 S E C T I O N 2 0 0 O P E R A T I O N S A N A L Y S I S
Appendix: Crash Diagrams
Figure A-1: West Chester Pike and US 202 NB Ramps Crash Diagram

U S 2 0 2 S E C T I O N 2 0 0 O P E R A T I O N S A N A L Y S I S A - 3
Figure A-2: West Chester Pike and US 202 SB Ramps Crash Diagram
Figure A-3: Paoli Pike and US 202 NB Ramps Crash Diagram

A - 4 U S 2 0 2 S E C T I O N 2 0 0 O P E R A T I O N S A N A L Y S I S
Figure A-4: Paoli Pike and US 202 SB Ramps Crash Diagram
Figure A-5: US 322 and Phoenixville Pike Crash Diagram

U S 2 0 2 S E C T I O N 2 0 0 O P E R A T I O N S A N A L Y S I S A - 5
Figure A-6: NB US 202 West Chester Pike Off-Ramp Segment Crash Diagram
Figure A-7: NB US 202 Between West Chester Pike and Paoli Pike Segment Crash Diagram


US 202 Section 200 Operations Analysis
Publication Number: TEM279
Date Published: December 2020
Geographic Area Covered: West Goshen Township, Chester County
Key Words: Highway Operations, Level of Service, Ramps, Safety, Travel Time, US 202
Abstract: This study supports one main transportation objective: to improve the operational efficiency of US 202 Section 200 through West Goshen Township. This study identifies highway design alternatives that would benefit local residents and commuters by improving safety and maximizing the efficiency of existing transportation infrastructure.
Staff Contact: Camden Palvino Transportation Engineer 215.238.2853 [email protected]
190 N Independence Mall West 8th Floor Philadelphia, PA 19106-1520 215.592.1800 | fax: 215.592.9125 www.dvrpc.org

202


![Index [] · natural history, 202 pearls, 200 risk factors for, 200–202, 201f, 202f treatment, 202 pearls, 196 Anterior segment disorders anisocoria caused by, 283 postoperative,](https://img.pdfslide.us/doc/110x75/5f79e59c4b70414ab70deab2/index-natural-history-202-pearls-200-risk-factors-for-200a202-201f-202f.jpg)