Embed Size (px)
Citation preview
World Livestock 2013 • Changing disease landscapes
14
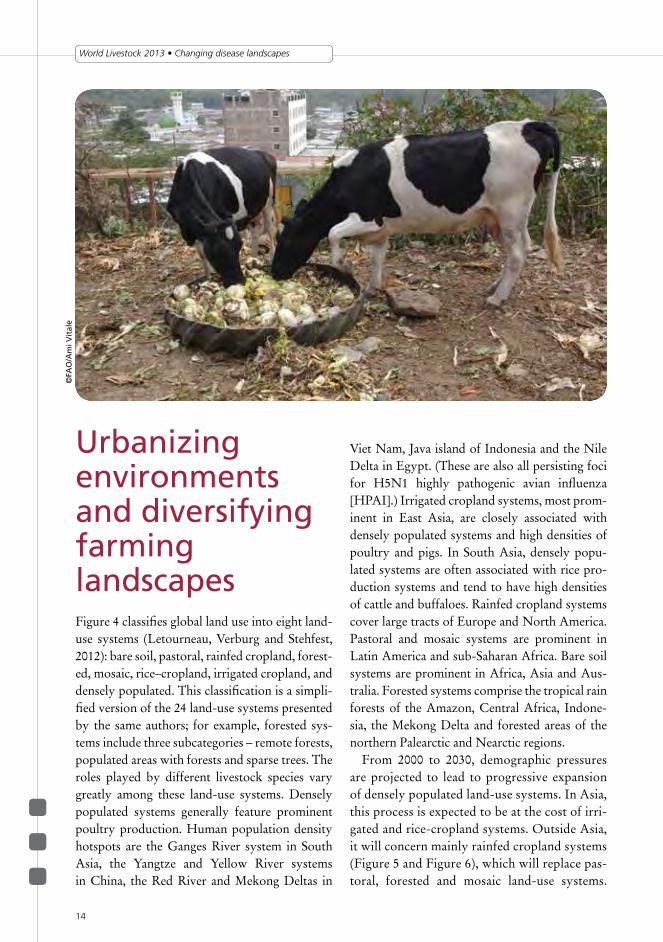
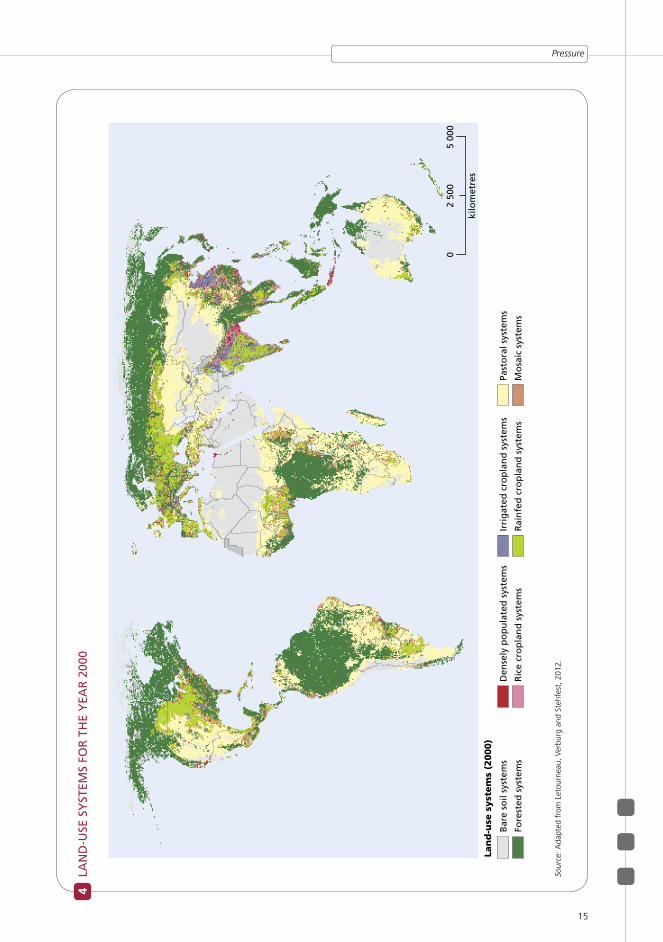
urbanizing environments and diversifying farming landscapesFigure 4 classifies global land use into eight land-use systems (Letourneau, Verburg and Stehfest, 2012): bare soil, pastoral, rainfed cropland, forest-ed, mosaic, rice–cropland, irrigated cropland, and densely populated. This classification is a simpli-fied version of the 24 land-use systems presented by the same authors; for example, forested sys-tems include three subcategories – remote forests, populated areas with forests and sparse trees. The roles played by different livestock species vary greatly among these land-use systems. Densely populated systems generally feature prominent poultry production. Human population density hotspots are the Ganges River system in South Asia, the Yangtze and Yellow River systems in China, the Red River and Mekong Deltas in
©fa
o/a
mi v
ital
e
Viet Nam, Java island of Indonesia and the Nile Delta in Egypt. (These are also all persisting foci for H5N1 highly pathogenic avian influenza [HPAI].) Irrigated cropland systems, most prom-inent in East Asia, are closely associated with densely populated systems and high densities of poultry and pigs. In South Asia, densely popu-lated systems are often associated with rice pro-duction systems and tend to have high densities of cattle and buffaloes. Rainfed cropland systems cover large tracts of Europe and North America. Pastoral and mosaic systems are prominent in Latin America and sub-Saharan Africa. Bare soil systems are prominent in Africa, Asia and Aus-tralia. Forested systems comprise the tropical rain forests of the Amazon, Central Africa, Indone-sia, the Mekong Delta and forested areas of the northern Palearctic and Nearctic regions.
From 2000 to 2030, demographic pressures are projected to lead to progressive expansion of densely populated land-use systems. In Asia, this process is expected to be at the cost of irri-gated and rice-cropland systems. Outside Asia, it will concern mainly rainfed cropland systems (Figure 5 and Figure 6), which will replace pas-toral, forested and mosaic land-use systems.
Pressure
15
4 La
nD
-use
sY
steM
s fo
r t
He
Yea
r 2
000
05
000
2 50
0
kilo
met
res
Lan
d-u
se s
yst
em
s (2
000)
Bar
e so
il sy
stem
s
Fore
sted
sys
tem
s
Den
sely
po
pu
late
d s
yste
ms
Ric
e cr
op
lan
d s
yste
ms
Irri
gat
ed c
rop
lan
d s
yste
ms
Rai
nfe
d c
rop
lan
d s
yste
ms
Past
ora
l sys
tem
s
Mo
saic
sys
tem
s
Sour
ce: a
dapt
ed f
rom
let
ourn
eau,
Ver
burg
and
Ste
hfes
t, 2
012.

World Livestock 2013 • Changing disease landscapes
16
5 pr
eDic
teD
La
nD
-use
sY
steM
s (2
030)
05
000
2 50
0
kilo
met
res
Lan
d-u
se s
yst
em
s (2
030)
Bar
e so
il sy
stem
s
Fore
sted
sys
tem
s
Den
sely
po
pu
late
d s
yste
ms
Ric
e cr
op
lan
d s
yste
ms
Irri
gat
ed c
rop
lan
d s
yste
ms
Rai
nfe
d c
rop
lan
d s
yste
ms
Past
ora
l sys
tem
s
Mo
saic
sys
tem
s
Sour
ce: a
dapt
ed f
rom
let
ourn
eau,
Ver
burg
and
Ste
hfes
t, 2
012;
sim
ulat
ion
base
d on
the
bas
elin
e sc
enar
io d
evel
oped
for
OeC
D, 2
008.
Pressure
17
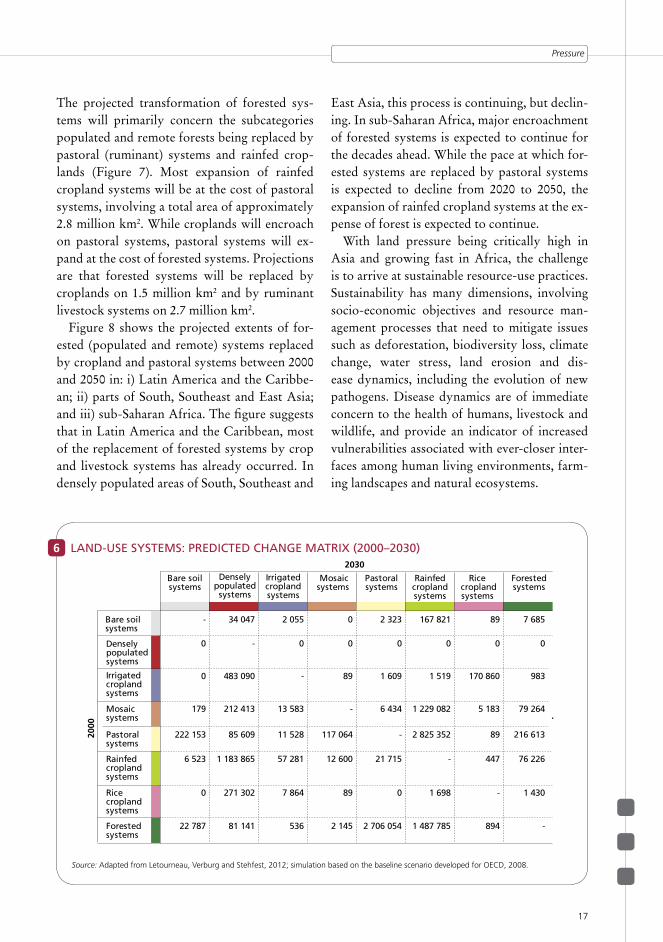
The projected transformation of forested sys-tems will primarily concern the subcategories populated and remote forests being replaced by pastoral (ruminant) systems and rainfed crop-lands (Figure 7). Most expansion of rainfed cropland systems will be at the cost of pastoral systems, involving a total area of approximately 2.8 million km2. While croplands will encroach on pastoral systems, pastoral systems will ex-pand at the cost of forested systems. Projections are that forested systems will be replaced by croplands on 1.5 million km2 and by ruminant livestock systems on 2.7 million km2.
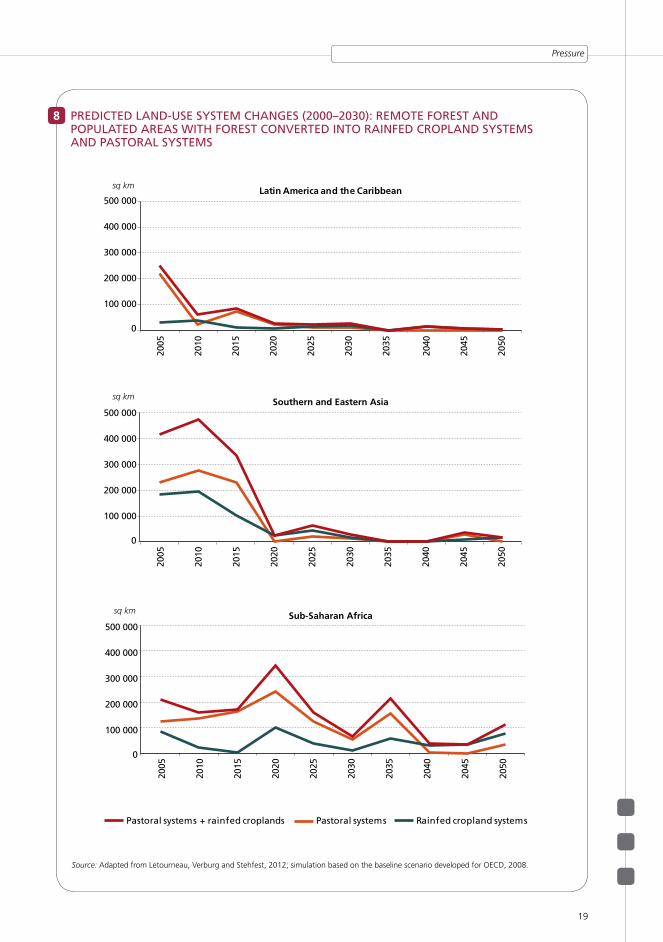
Figure 8 shows the projected extents of for-ested (populated and remote) systems replaced by cropland and pastoral systems between 2000 and 2050 in: i) Latin America and the Caribbe-an; ii) parts of South, Southeast and East Asia; and iii) sub-Saharan Africa. The figure suggests that in Latin America and the Caribbean, most of the replacement of forested systems by crop and livestock systems has already occurred. In densely populated areas of South, Southeast and
East Asia, this process is continuing, but declin-ing. In sub-Saharan Africa, major encroachment of forested systems is expected to continue for the decades ahead. While the pace at which for-ested systems are replaced by pastoral systems is expected to decline from 2020 to 2050, the expansion of rainfed cropland systems at the ex-pense of forest is expected to continue.
With land pressure being critically high in Asia and growing fast in Africa, the challenge is to arrive at sustainable resource-use practices. Sustainability has many dimensions, involving socio-economic objectives and resource man-agement processes that need to mitigate issues such as deforestation, biodiversity loss, climate change, water stress, land erosion and dis-ease dynamics, including the evolution of new pathogens. Disease dynamics are of immediate concern to the health of humans, livestock and wildlife, and provide an indicator of increased vulnerabilities associated with ever-closer inter-faces among human living environments, farm-ing landscapes and natural ecosystems.
6 LanD-use sYsteMs: preDicteD cHange MatriX (2000–2030)
Bare soilsystems
Denselypopulated
systems
Denselypopulatedsystems
Mosaicsystems
Mosaicsystems
Pastoralsystems
Pastoralsystems
Rainfedcroplandsystems
Rainfedcroplandsystems
Rice croplandsystems
Rice croplandsystems
Forestedsystems
Forestedsystems
Bare soil systems
- 34 047 2 055 0 2 323 167 821 89 7 685
0 - 0 0 0 0 0 0
0 483 090 - 89 1 609 1 519 170 860 983
179 212 413 13 583 - 6 434 1 229 082 5 183 79 264
222 153 85 609 11 528 117 064 - 2 825 352 89 216 613
6 523 1 183 865 57 281 12 600 21 715 - 447 76 226
0 271 302 7 864 89 0 1 698 - 1 430
22 787 81 141 536 2 145 2 706 054 1 487 785 894 -
Irrigatedcroplandsystems
2030
2000
Irrigatedcroplandsystems
Source: adapted from letourneau, Verburg and Stehfest, 2012; simulation based on the baseline scenario developed for OeCD, 2008.

World Livestock 2013 • Changing disease landscapes
18
7 pr
eDic
teD
La
nD
-use
sY
steM
cH
an
ges
(20
00–2
030)
: reM
ote
fo
res
t a
nD
po
puLa
teD
ar
eas
wit
H f
or
est
co
nv
erte
D
into
ra
infe
D c
ro
pLa
nD
sY
steM
s
Pop
ula
ted
are
as w
ith
fo
rest
sR
emo
te f
ore
sts
Lan
d-u
se s
yst
em
s -
sub
cate
go
ries
(2000)
05
000
2 50
0
kilo
met
res
Sour
ce: a
dapt
ed f
rom
let
ourn
eau,
Ver
burg
and
Ste
hfes
t, 2
012.
Pressure
19
8 preDicteD LanD-use sYsteM cHanges (2000–2030): reMote forest anD popuLateD areas witH forest converteD into rainfeD cropLanD sYsteMs anD pastoraL sYsteMs
0
100 000
200 000
300 000
400 000
500 000
0
100 000
200 000
300 000
400 000
500 000
2005
2010
2015
2020
2025
2030
2035
2040
2045
2050
2005
2010
2015
2020
2025
2030
2035
2040
2045
2050
2005
2010
2015
2020
2025
2030
2035
2040
2045
2050
sq km
sq km
0
100 000
200 000
300 000
400 000
500 000
sq km
Latin America and the Caribbean
Rainfed cropland systemsPastoral systemsPastoral systems + rainfed croplands
Southern and Eastern Asia
Sub-Saharan Africa
Source: adapted from letourneau, Verburg and Stehfest, 2012; simulation based on the baseline scenario developed for OeCD, 2008.

World Livestock 2013 • Changing disease landscapes
20
the coevolution of extensive and intensive systemsThis section assesses the evolution of both ex-tensive and intensive production to identify any imbalances in the overall development process that may be associated with disease emergence, spread and/or persistence.4 Intensive livestock production is increasingly the main supply source of animal-source food, enabling steady, bulk production of milk, meat and eggs of standard quality. Intensive systems thus make a major contribution to global food security, providing normally safe, healthy and nutritious food. Intensive systems are largely free from high-impact animal and zoonotic diseases, but challenges are faced during the intensification of livestock production, which involves a ma-jor scaling up of animal production, processing and supply operations. Economies of scale and
©Le
nn
y H
og
erw
erf
4 the terms “extensive” and “intensive” livestock production refer to the efficiency with which feed mass is converted into increased body mass for meat production, or into milk or eggs (tilman et al., 2002).
scope have resulted in greatly increased move-ments of inputs, live animals and livestock prod-ucts, which are associated with environmental concerns and enhanced risk of global pathogen spread. At the local scale, the animal waste gen-erated by intensive systems may, in the absence of “pre-release” waste treatment, pollute and contaminate surface and groundwater, air, soils and vegetation; in addition to chemical pollu-tion, there is also the risk of pathogen dispersal.
Epidemiology states that the transmission of a pathogen tends to increase with host density (Kilpatrick and Altizer, 2012). In this process, a pathogen may turn into a hyper-virulent disease agent; in monocultures involving mass rearing of genetically identical animals that are selected for high feed conversion, an emerging hyper-viru-lent pathogen will rapidly spread within a flock or herd. If farm-level biosecurity and hygiene are inadequate, other farms and the food chain may be affected (Engering, Hogerwerf and Slin-genbergh, 2013). Novel disease agents that first emerge in large-scale animal holdings may also infect smallholder livestock and wildlife. Anti-biotics used to prevent disease or as feed addi-tive to stimulate growth may enhance the risk of

Pressure
21
antimicrobial resistance, a public health concern of growing importance. Rapid growth of inten-sive livestock production units also increases the demand for compound feed, which is produced through the expansion of croplands, often at the expense of forested areas. Despite these chal-lenges, the high productivity levels typical of intensive systems imply highly efficient use of natural resources, with reduced environmental impact per unit of food produced. Provided that intensive systems are effectively biocontained and isolated – preventing animal-to-human pathogen transfer, pathogen contamination in the food supply chain, and waste disposal in the environment – the risks of animal/zoonotic dis-ease spread and food safety hazards are minimal.
Extensive animal production serves a vari-ety of purposes other than human food supply. Livestock are kept as a source of food, transport, draught power, fibres, manure for fuel or ferti-lizer, and cash income, as livelihood assets, and for use in rites and ceremonies. Locally adapted breeds are often highly valued in cultures and religions (FAO, 2011b). Health protection prac-tices and risk management in extensive systems contrast with the biocontainment approach adopted in intensive systems. In extensive sys-tems farmers are inclined to select sturdy, stress-resistant animals and to accommodate risky situations. For example, herders in the Sudano-Sahelian agro-ecological zone of West and Cen-tral Africa traditionally practise transhumance, with seasonal cattle movements designed to balance the risk of attracting disease – mainly tsetse-transmitted trypanosomosis – with the variable availability of water, forage and other feed resources, including crop residues and ag-ricultural by-products (Swallow, 2000). In the humid climate zones of West and Central Af-rica, pure-bred trypano-tolerant cattle and small ruminants may be kept in places where disease burdens are very high and susceptible breeds do not thrive (FAO, 2004).
In much of Africa and Asia, extensive and in-tensive systems evolve in parallel; intensive sys-tems grow fastest in areas where extensive sys-
tems are most prominent, in and near densely settled areas and urbanizing environments. The result is a progressive increase in animal bio-mass in densely populated areas, and increased animal–human contact. This development is less dominant in Latin American countries, where demographic and land pressure is lower than in Asia and Africa, and where extensive produc-tion systems are gradually being replaced by intensive systems.
FAOSTAT and FAO Global Perspective data for the period 1980–2009, and projections for 2030 (FAOSTAT, 2012; FAO, 2012c) were used to extract broad development patterns for the main livestock production categories and geographic areas. The evolution of both exten-sive and intensive production, individually and together, was assessed to identify whether and how any imbalances in overall development patterns were related to potential disease emer-gence, spread and/or persistence.
The livestock development trajectories pre-sented in Figures 9 to 12 are timed series of con-nected data pairs on: i) the economically active population in agriculture as a share of the total population; and ii) the output or volume of ani-mal produce from the standing population of animals (the input). The trajectory established provides insights into the evolution of both ex-tensive and intensive systems. The prominence of the extensive sector is reflected in the proportion of people who are active in agriculture. Growth of the intensive sector is reflected in the output/input (O/I) ratio, a measure of overall livestock productivity. Fewer and fewer people tend to en-gage in agriculture, while livestock productivity tends to increase. Livestock development trajec-tories are strongly modulated by demographic and economic forces. In most developed coun-tries, the rise in average income levels and the increased demand for animal-source food that triggered transformation of the livestock sector from extensive to intensive systems occurred when new jobs became available in the second and third sectors of the economy. In contrast, livestock productivity in much of Asia and Africa
World Livestock 2013 • Changing disease landscapes
22
is only starting to increase after a prolonged pe-riod of major demographic growth, with impacts on the opportunities for alternative employment in cities. Therefore, the agricultural labour force is not decreasing at the pace seen in developed countries. The result is that in much of Asia, and increasingly also in Africa, both extensive and in-tensive animal agriculture coexist and coevolve.
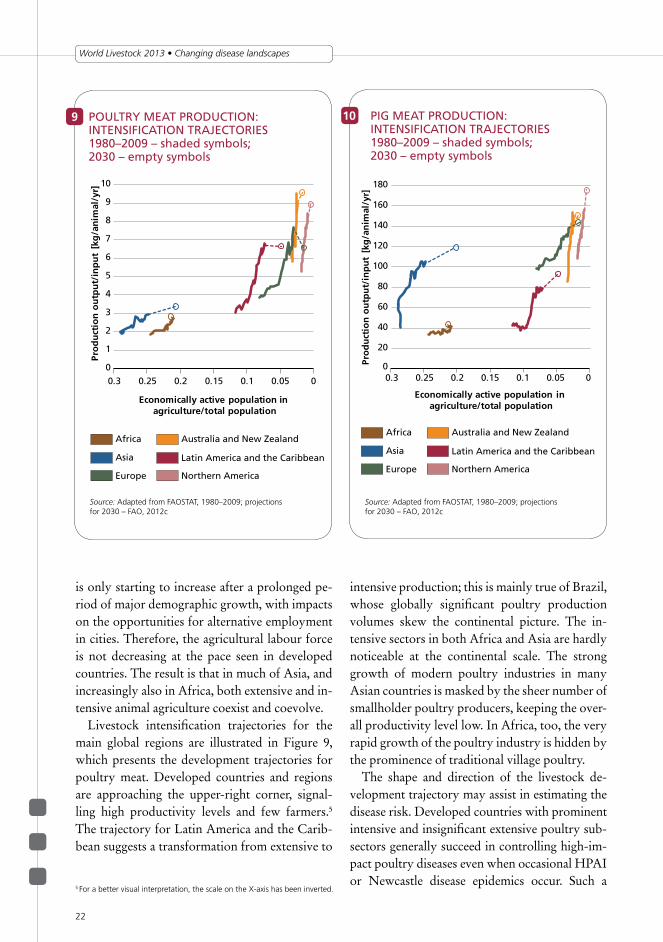
Livestock intensification trajectories for the main global regions are illustrated in Figure 9, which presents the development trajectories for poultry meat. Developed countries and regions are approaching the upper-right corner, signal-ling high productivity levels and few farmers.5 The trajectory for Latin America and the Carib-bean suggests a transformation from extensive to
intensive production; this is mainly true of Brazil, whose globally significant poultry production volumes skew the continental picture. The in-tensive sectors in both Africa and Asia are hardly noticeable at the continental scale. The strong growth of modern poultry industries in many Asian countries is masked by the sheer number of smallholder poultry producers, keeping the over-all productivity level low. In Africa, too, the very rapid growth of the poultry industry is hidden by the prominence of traditional village poultry.
The shape and direction of the livestock de-velopment trajectory may assist in estimating the disease risk. Developed countries with prominent intensive and insignificant extensive poultry sub-sectors generally succeed in controlling high-im-pact poultry diseases even when occasional HPAI or Newcastle disease epidemics occur. Such a
9 pouLtrY Meat proDuction: intensification trajectories 1980–2009 – shaded symbols; 2030 – empty symbols
Australia and New Zealand
Latin America and the Caribbean
Northern America
Africa
Asia
0
1
2
3
4
5
6
7
8
9
10
00.050.10.150.20.250.3
Pro
du
ctio
n o
utp
ut/
inp
ut
[kg
/an
imal
/yr]
Economically active population in agriculture/total population
Europe
Source: adapted from FaOStat, 1980–2009; projections for 2030 – FaO, 2012c
5 For a better visual interpretation, the scale on the X-axis has been inverted.
10 P pig Meat proDuction: intensification trajectories 1980–2009 – shaded symbols; 2030 – empty symbols
0
20
40
60
80
100
120
140
160
180
00.050.10.150.20.250.3Pr
od
uct
ion
ou
tpu
t/in
pu
t [k
g/a
nim
al/y
r]
Economically active population in agriculture/total population
Australia and New Zealand
Latin America and the Caribbean
Northern America
Africa
Asia
Europe
Source: adapted from FaOStat, 1980–2009; projections for 2030 – FaO, 2012c

Pressure
23
relatively disease-free status is more difficult to achieve in a transition economy or developing country with a rapidly growing intensive poul-try sector arising alongside a myriad of persisting smallholder systems. For example, Bangladesh, China, Egypt, Indonesia, Mexico, Pakistan and Viet Nam all feature prominent extensive as well as intensive poultry systems and are affected by the circulation of endemic forms of H5 or H7 HPAI virus.
The pig meat production trajectories also show the developed countries approaching the upper-right corner of the graph (Figure 10). Again, the trajectory for Latin America and the Caribbean suggests a transition from extensive to intensive production, mainly because of the situation in Brazil. Asia features a highly visible intensification of the pig production subsector,
reflecting the size and rapid growth of the pig industry in China, which is significant at the global scale. Africa features mainly extensive pig production, with the beginnings of inten-sification concealed by extensive or village pig production. The implications for the emergence, spread and persistence of pig diseases are dis-cussed in the next chapter.
Dairy productivity is highest in the northern part of North America (Figure 11), outpacing Eu-rope and Australia and New Zealand. The trajec-tory for Latin America and the Caribbean suggests a considerable lag. As discussed in the first section of this chapter, within Asia, the smallholder dairy subsector is particularly well established in South Asia. Dairy development in Africa is prominent at only the local level, around urban centres in North Africa, in the eastern African highlands,
11 MiLk proDuction (bovine): intensification trajectories 1980–2009 – shaded symbols; 2030 – empty symbols
0
2
4
6
8
10
00.050.10.150.20.250.3
Pro
du
ctio
n o
utp
ut/
inp
ut
[kg
x 1
03 /an
imal
/yr]
Economically active population in agriculture/total population
Australia and New Zealand
Latin America and the Caribbean
Northern America
Africa
Asia
Europe
Source: adapted from FaOStat, 1980–2009; projections for 2030 – FaO, 2012c.
12 goat anD sHeep Meat proDuction: intensification trajectories 1980–2009 – shaded symbols; 2030 – empty symbols
00.050.10.20.250.3
Economically active population in agriculture/total population
0.15
Australia and New Zealand
Latin America and the Caribbean
Northern America
Africa
Asia
Europe
0
2
4
6
8
10
12
14
Pro
du
ctio
n o
utp
ut/
inp
ut
[kg
/an
imal
/yr]
Source: adapted from FaOStat, 1980–2009; projections for 2030 – FaO, 2012c.

World Livestock 2013 • Changing disease landscapes
24
and in the relatively disease-free areas of Southern Africa, but this development is hardly apparent at the continental scale. Developing countries are generally facing a major and growing dairy deficit. As discussed in the next chapter, this situation is, in part, related to the high burden of vector-borne and other infectious, parasitic and protozoan ru-minant diseases.
Small ruminant meat productivity levels (Fig-ure 12) do not reflect the pronounced regional discrepancies observed for dairy, pig and poultry production. In Latin America and the Carib-bean, where arable land is relatively abundant,
extensive, commercial small ruminant ranching is a relatively low-cost activity. High production costs, resulting from grain feeding, are becoming increasingly common in mutton-deficit countries of the Near East and North Africa (NENA). In developing African and Asian countries, the small ruminants kept by pastoral and agropasto-ral communities and in mixed crop–livestock set-tlement areas are a major source of rural income generation, despite the challenges posed by infec-tious diseases, land pressure and climate change. The risk management implications and develop-ment potential are discussed in the next chapter.