Embed Size (px)
Citation preview
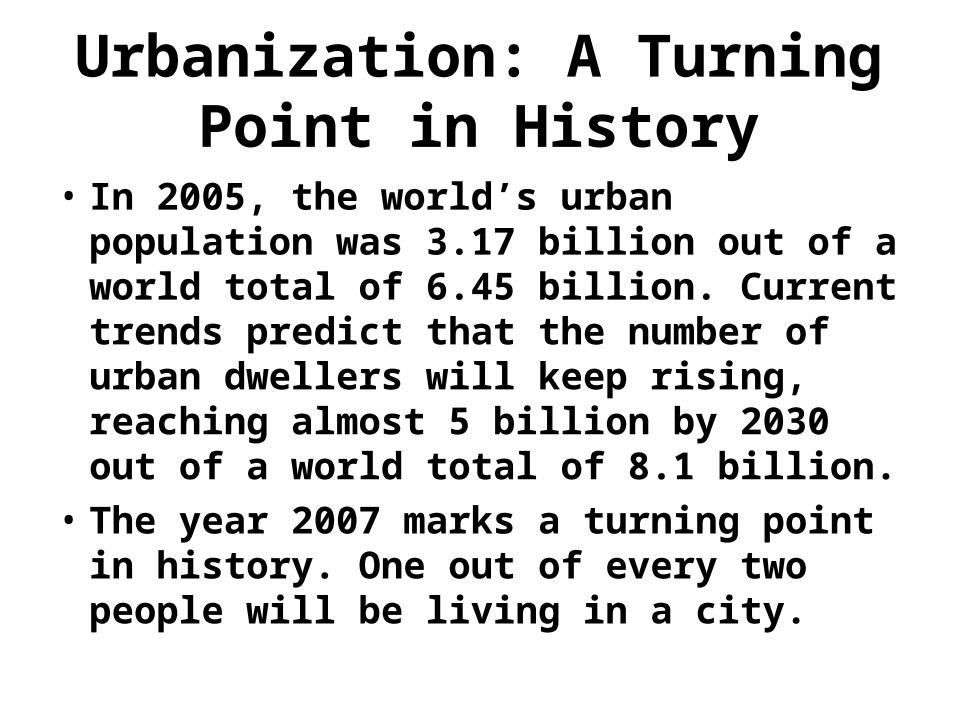
Urbanization: A Turning Point in History
• In 2005, the world’s urban population was 3.17 billion out of a world total of 6.45 billion. Current trends predict that the number of urban dwellers will keep rising, reaching almost 5 billion by 2030 out of a world total of 8.1 billion.
• The year 2007 marks a turning point in history. One out of every two people will be living in a city.
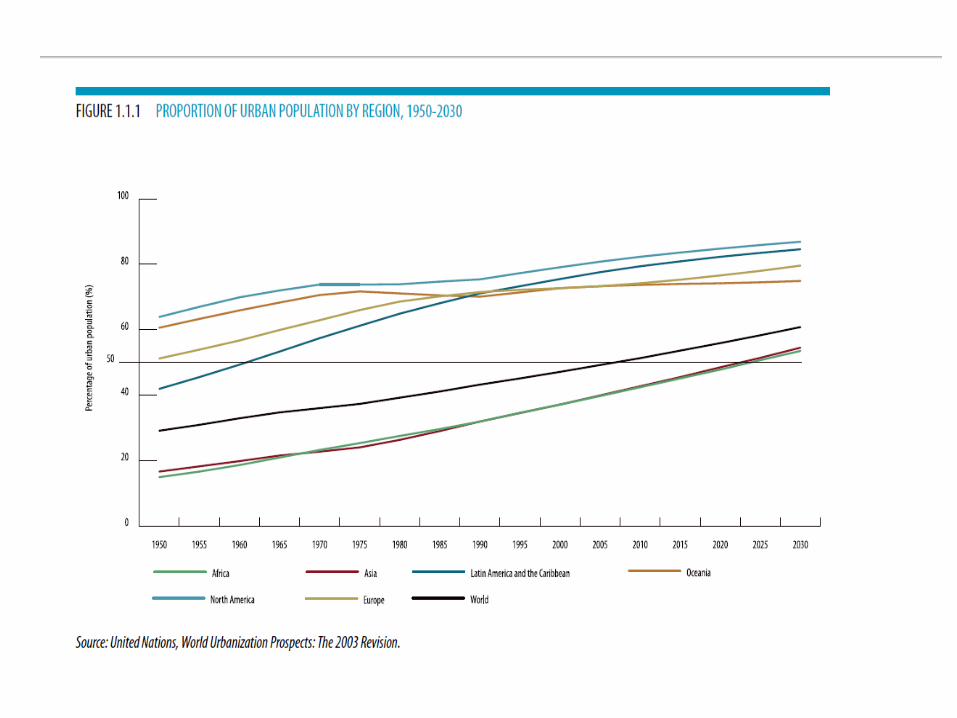
Rates of urbanization
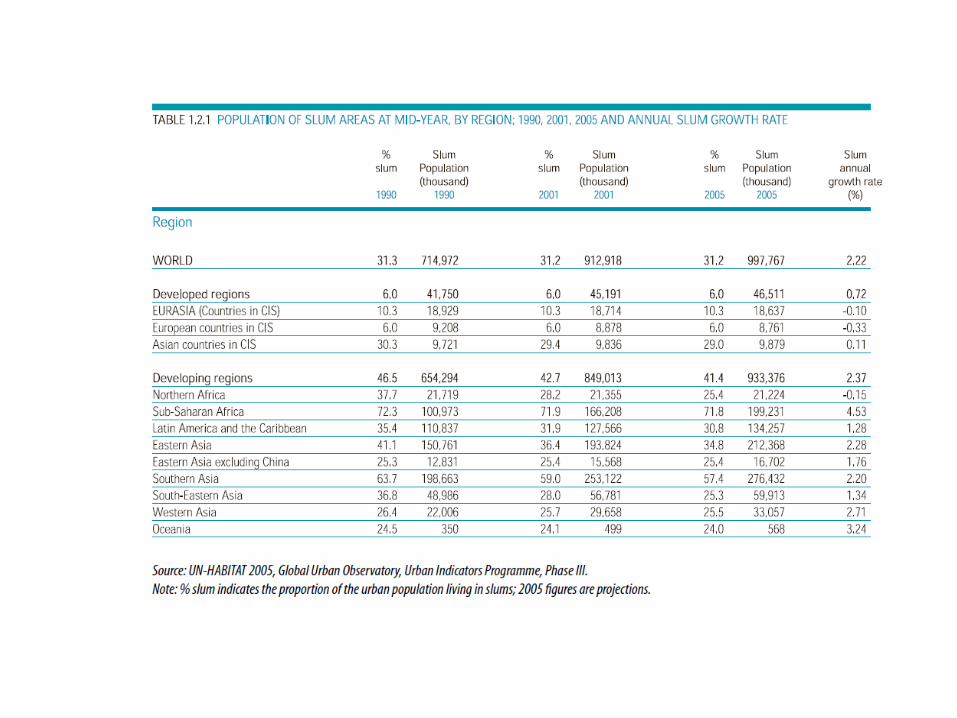
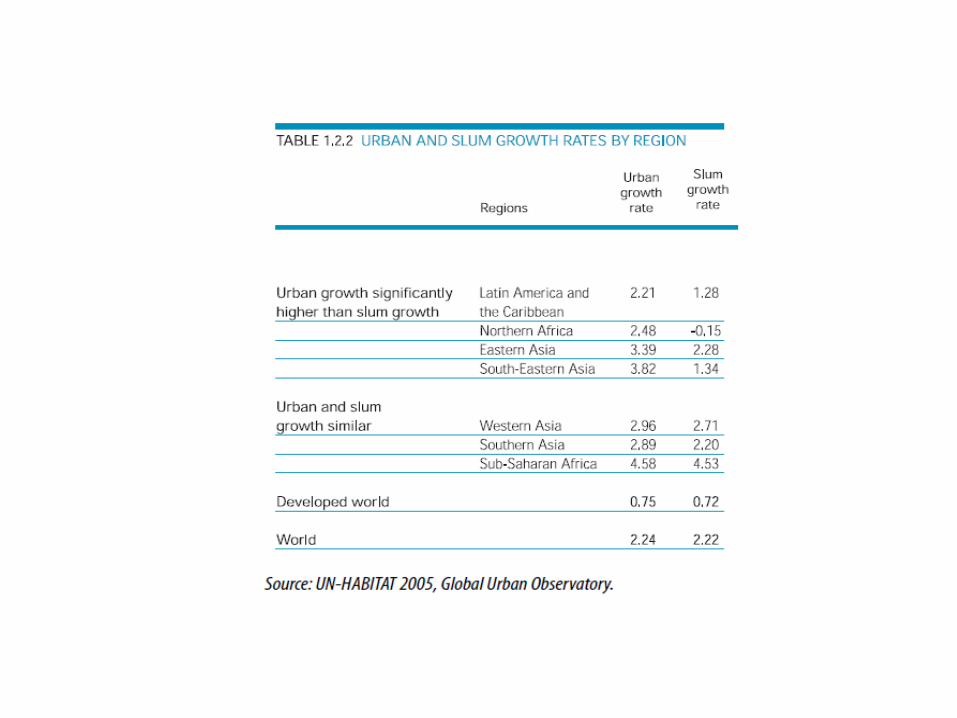
• Annual urban growth rates are highest in Sub-Saharan Africa (4.58 per cent). Followed by South-Eastern Asia (3.82 per cent), Eastern Asia (3.39 per cent), Western Asia (2.96 per cent), Southern Asia (2.89 per cent) and Northern Africa (2.48 per cent).
• The developed world’s cities are growing at a slower pace, averaging 0.75 per cent a year.
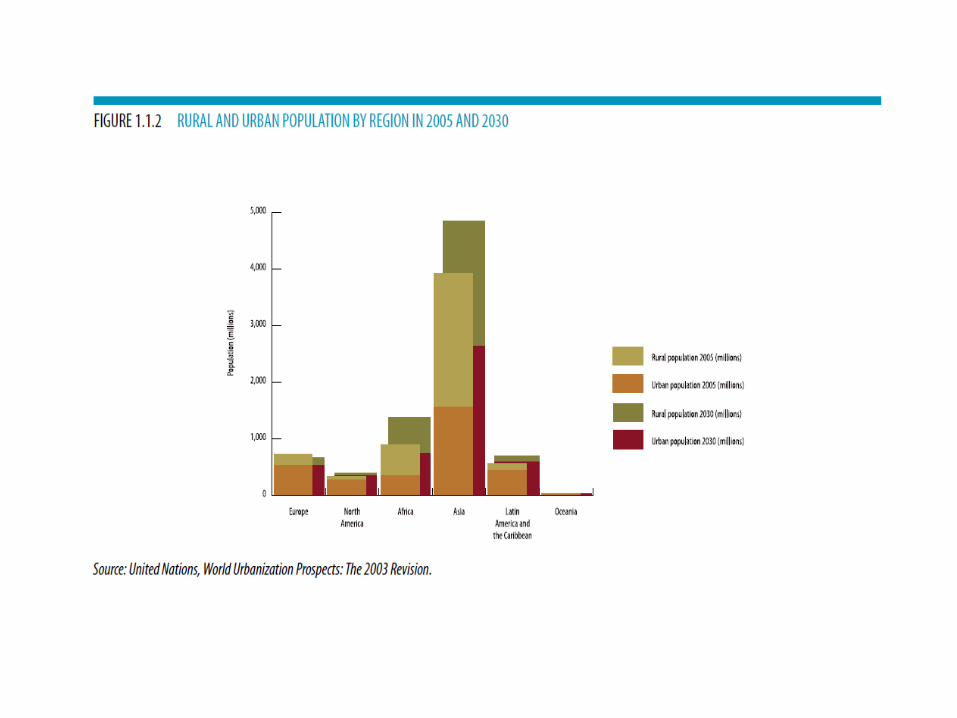
• Asia and Africa will continue to dominate global urban growth through 2030. Currently the least urbanized regions in the world, with 39.9 per cent and 39.7 per cent of their populations living in cities in 2005, respectively, by 2030, both regions will become predominantly urban, Asia with 54.5 per
cent of its population living in cities, and Africa with 53.5 per cent of its population urban.
• Asia alone will account for more than half the world’s urban population (2.66 billion out of a global urban population of 4.94 billion);
the urban population of Africa (748 million) will by 2030 be larger than the total population of Europe at that time (685 million).
Mega, medium and small
• Small cities with less than 500,000 inhabitants and intermediate cities with between 1 and 5 million inhabitants, not megacities (defined as cities with 10 million or more people), will continue to absorb most of the urban population around the world well into the future. More than 53 per cent of the world’s urban population lives in cities of fewer than 500,000 inhabitants, and another 22 per cent of the global urban population lives in cities of 1 to 5 million
inhabitants.
Economic power of cities
• In both developed and developing countries, cities generate a disproportionate share of gross domestic product (GDP) and provide huge opportunities for investment and employment. Urban-based economic activities account for up to 55 per cent of gross national product (GNP) in low-income countries, 73 per cent in middle-income countries and 85 per cent in high income countries.
• Also the attraction for migrants
Economic output of some cities
• Cities outpace even some countries in economic output. If the five largest cities in the United States – New York, Los Angeles, Chicago, Boston and Philadelphia – were treated as a single country, it would rank as the fourth largest economy in the world.
• This trend is also evident in the developing world: São Paulo, Brazil’s largest city, and Bangkok, the capital of Thailand, both host just over 10 per cent of the total population of their respective countries, but both account for more than 40 per cent of their country’s GDP.
Cities and jobs
• The concentration of economic activity in cities makes them prime generators of non-agricultural employment in both the formal and informal sectors. While the formal sector accounts for a much larger share of urban employment in industrialized countries, the informal sector employs a significant proportion of the non agricultural labour force in developing regions (up to 80 per cent in Sub-Saharan Africa and more than 60 percent in Asia and Latin America).
Shifting location of poverty
• World Bank estimates indicate that while rural areas are currently home to a majority of the world’s poor, by 2035, cities will become the predominant sites of poverty.
Urban poverty
• In Latin America, the most urbanized region in the developing world, there are more poor people living in cities than in rural areas. In 1999, only 77 million of the region’s 211 million poor lived in rural areas, while the remaining 134 million lived in urban areas. Proportionally, however, far more of those living in rural areas than in urban areas were poor: 64 per cent of the rural population lived in poverty, as opposed to 34 per cent of the urban population; levels of deprivation are also more extreme in rural areas than in urban areas.
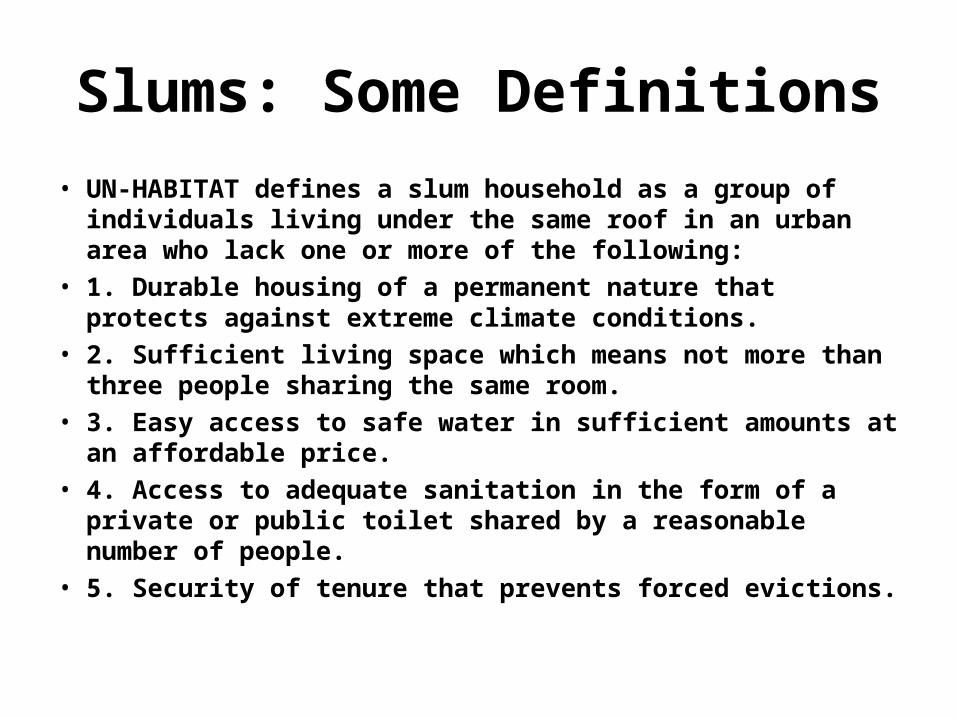
Slums: Some Definitions
• UN-HABITAT defines a slum household as a group of individuals living under the same roof in an urban area who lack one or more of the following:
• 1. Durable housing of a permanent nature that protects against extreme climate conditions.
• 2. Sufficient living space which means not more than three people sharing the same room.
• 3. Easy access to safe water in sufficient amounts at an affordable price.
• 4. Access to adequate sanitation in the form of a private or public toilet shared by a reasonable number of people.
• 5. Security of tenure that prevents forced evictions.
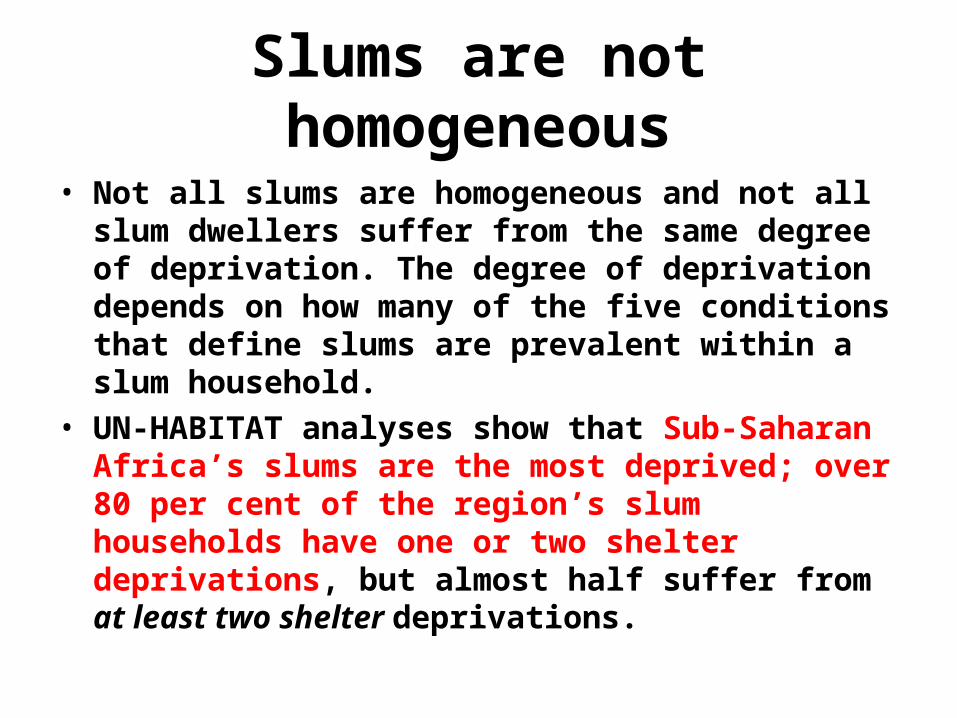
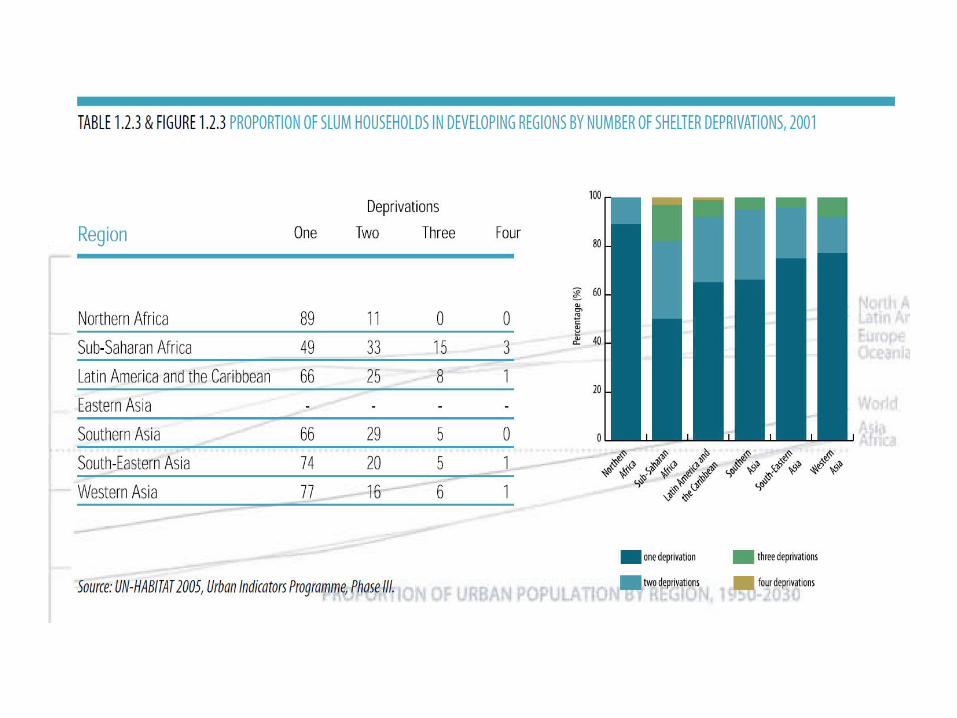
Slums are not homogeneous
• Not all slums are homogeneous and not all slum dwellers suffer from the same degree of deprivation. The degree of deprivation depends on how many of the five conditions that define slums are prevalent within a slum household.
• UN-HABITAT analyses show that Sub-Saharan Africa’s slums are the most deprived; over 80 per cent of the region’s slum households have one or two shelter deprivations, but almost half suffer from at least two shelter deprivations.
Slums & extreme poverty
• Approximately one-fifth of slum households live in extremely poor conditions, lacking more than three basic shelter needs. Generally, the lack of sanitation and water in the region’s slums is compounded by insufficient living space for families and inadequate, makeshift housing.
Slums: Neither Bricks nor Mortar, Non-Durable Housing
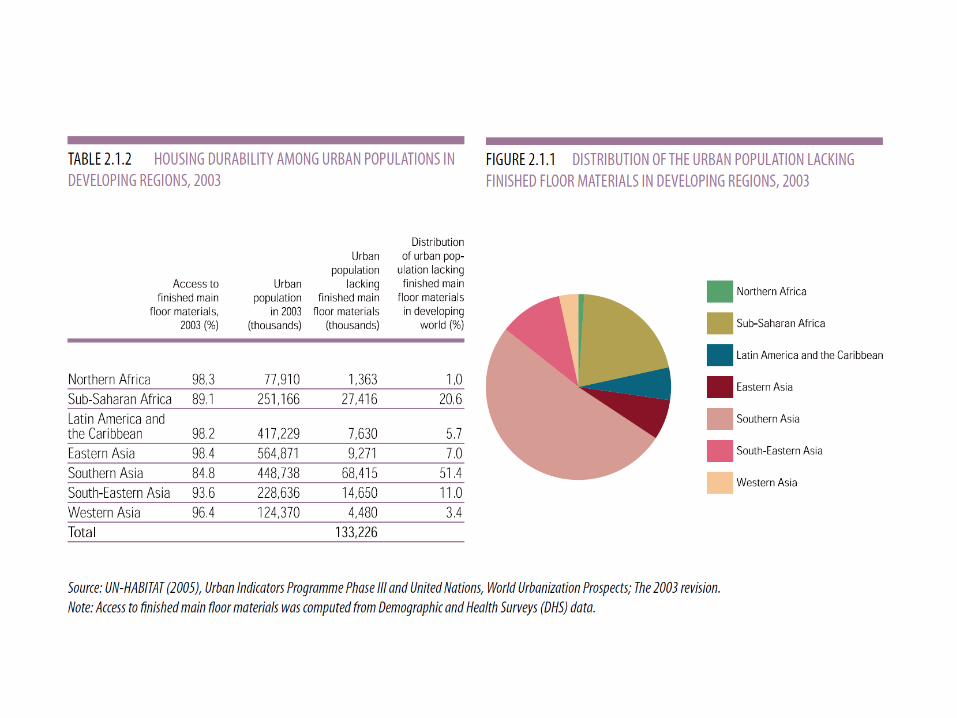
• Worldwide, 18% of all urban housing units (some 125 million units) are non-permanent structures and at least 25% of all housing (175 million houses) does not meet urban construction codes. This figure, in reality, is probably much higher.
• For every 10 non-permanent houses in the cities of developing countries, 3 or 4 are located in areas prone to
floods, landslides, hurricanes and earthquakes.
• More than 10% of the urban population in Sub-Saharan Africa lives in non-durable housing.
• But in North Africa, 99% of the total urban population lived in durable houses in 2003.
Slums: Neither Bricks nor Mortar, Non-Durable Housing
• Government investment has improved slum housing in cities in Egypt, Benin, Rwanda and Tanzania.
• More than half the people in the developing world who live in unsafe houses are Asian, many of them Indian, Nepalese and Pakistani.
• In many regions of Asia little significant progress and in providing adequate shelter has been made with exceptions such as the Indonesian cities of Bitung and Jaya Pura.
• In 2003, more than 99% of the population of Latin America and the Caribbean lived in adequate housing although slum dwellings in Guatemala, Nicaragua and Peru do not meet the UN-HABITAT standard.
• In Nicaragua, when floor and roof materials are assessed to determine housing quality, only 9% of the urban population lives in a durable home.
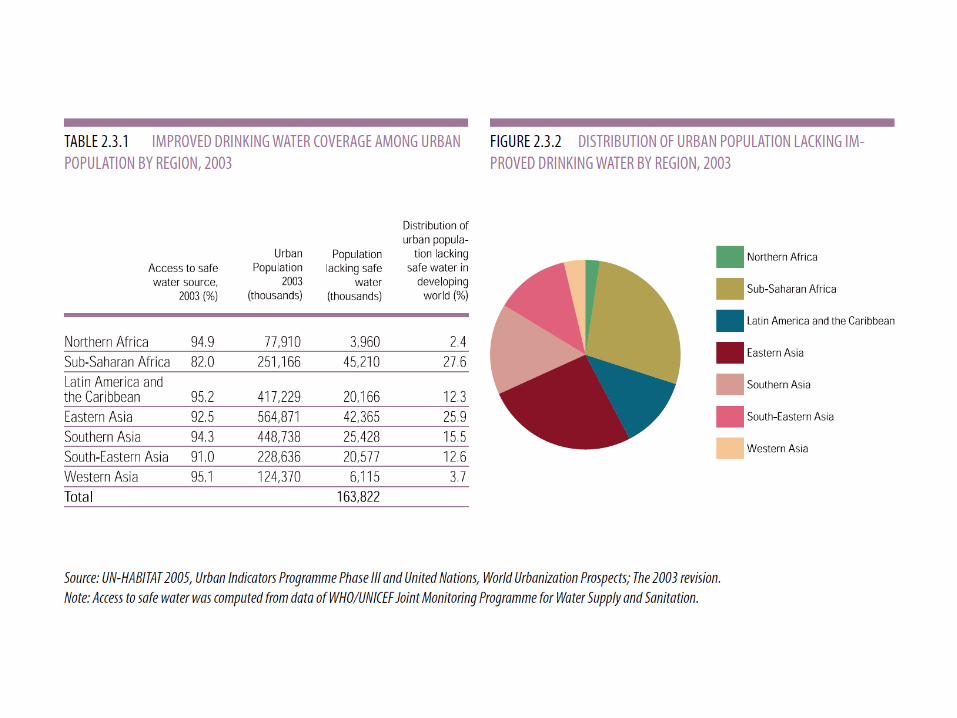
Slums: Safe Drinking Water
• Between 1990 and 2002, some 1.1 billion people were able to access safe drinking water, a global rise in coverage from 77% to 83%.
• But the number of people without access to improved water will double between 1990 and 2010 from 108 million to 215 million.
• Only two-thirds of the global urban population gets water from a tap – Latin America and the Caribbean (89.3%)ranks top and Sub-Saharan Africa (38.3) at the bottom.
• Per capita consumption varies widely between rich nations (500-800 litres a day) and poor nations (60-150 litres a day).
• Access to good water often varies greatly within a city even though UN statistics state that 95% of the world’s urban residents have “improved” water which is why in India 65% of hospital in-patients are treated for waterborne diseases.
Slums: Safe Drinking Water
• Sub-Saharan Africans spend at least one-third of their incomes on curing water-related disease such as malaria and diarrhoea.
• Water is usually more expensive than the average city rate and often not easily available.
• In the Kenyan port of Mombasa, water was available for an average of 3 hours a day, a study showed.
• UN-HABITAT’s Monitoring Urban Inequities Programme discovered that in the Ethiopian capital of Addis Ababa only 21.3% of urban residents enjoyed an improved water supply when defined by ease of access, sufficient quantity, affordability and time required for collection.
0
10
20
30
40
50
60
70
80
90
1997 2002 2003 2004 2005 2006 2007*
World
Developed Economiesand European Union
East Asia
South-East Asia &Pacific
South Asia
Latin America &Caribbean
Middle East
North Africa
Sub Saharan Africa
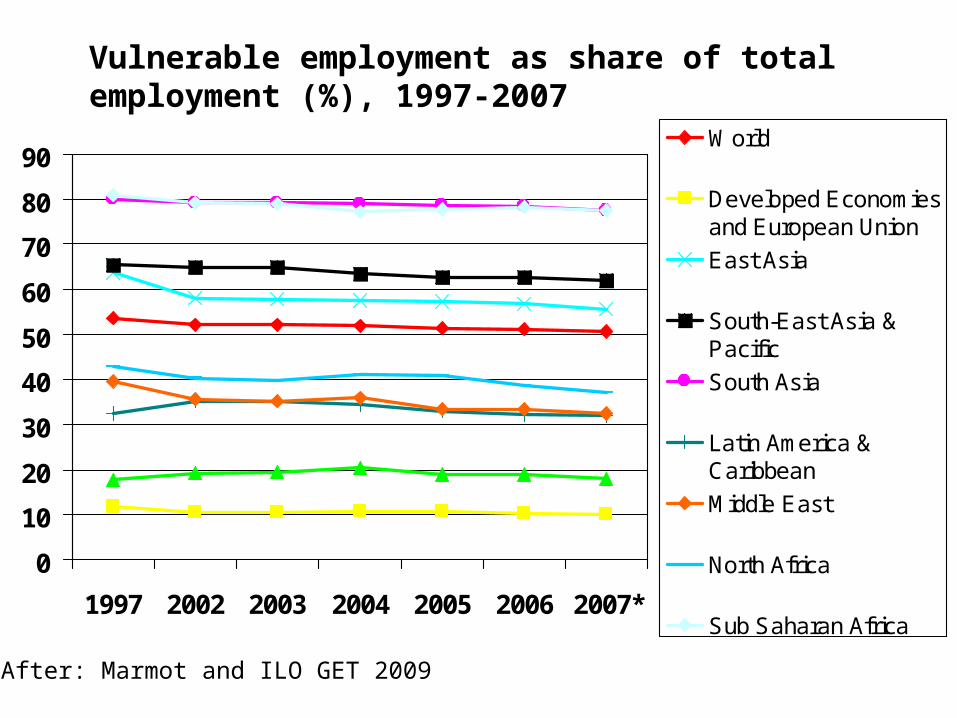
Vulnerable employment as share of total employment (%), 1997-2007
After: Marmot and ILO GET 2009
POVERTY AND ASSETACCUMULATION
A LONGTERM PROJECT
SANPSHOT VS.
LONGITUDINAL VIEW
POOR
• REMAIN POOR– STAGNENT
• WHO GETS OUT OF POVERTY– MOBILE
• WHO FALLS BACK INTO POVERTY– VENURABLE
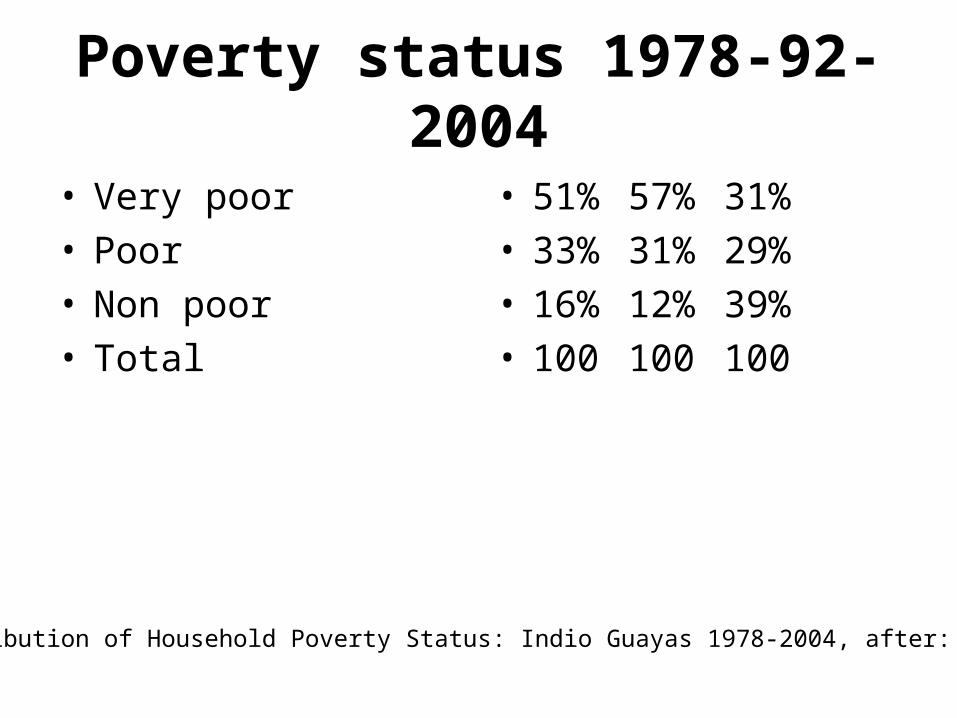
Poverty status 1978-92-2004
• Very poor• Poor• Non poor• Total
• 51% 57% 31%• 33% 31% 29%• 16% 12% 39%• 100 100 100
Distribution of Household Poverty Status: Indio Guayas 1978-2004, after:Moser
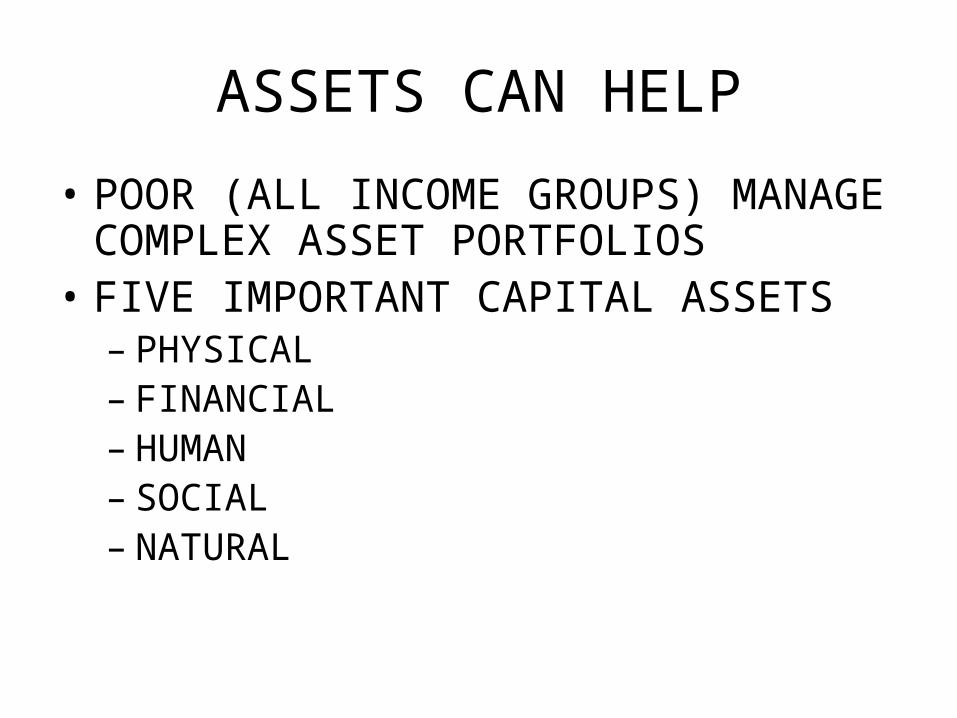
ASSETS CAN HELP
• POOR (ALL INCOME GROUPS) MANAGE COMPLEX ASSET PORTFOLIOS
• FIVE IMPORTANT CAPITAL ASSETS– PHYSICAL– FINANCIAL– HUMAN– SOCIAL– NATURAL
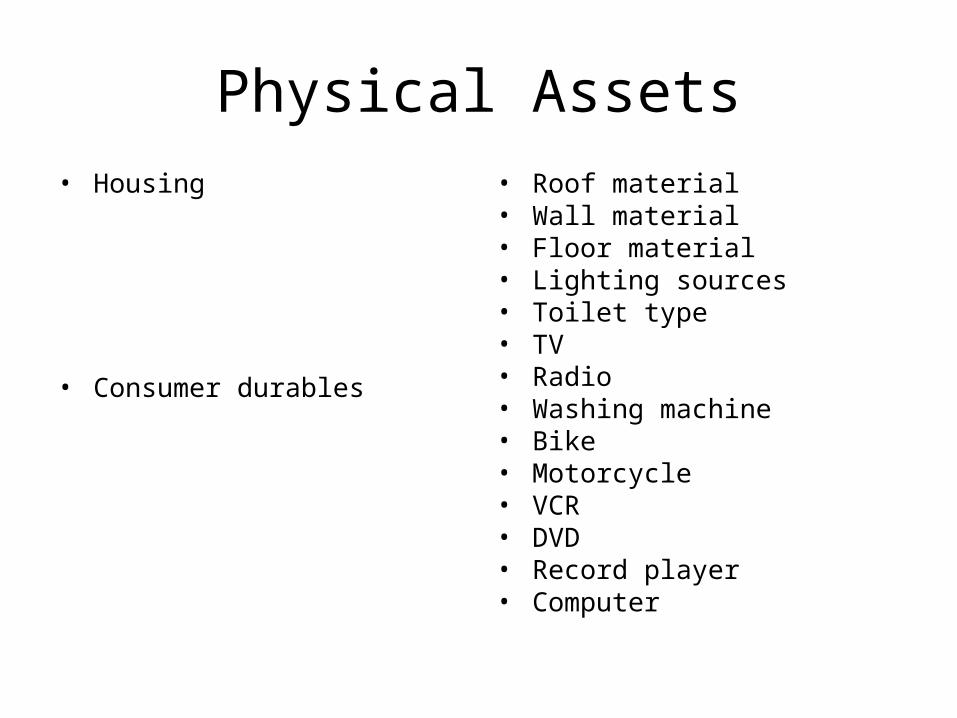
Physical Assets• Housing
• Consumer durables
• Roof material• Wall material• Floor material• Lighting sources• Toilet type• TV• Radio• Washing machine• Bike• Motorcycle• VCR• DVD• Record player• Computer
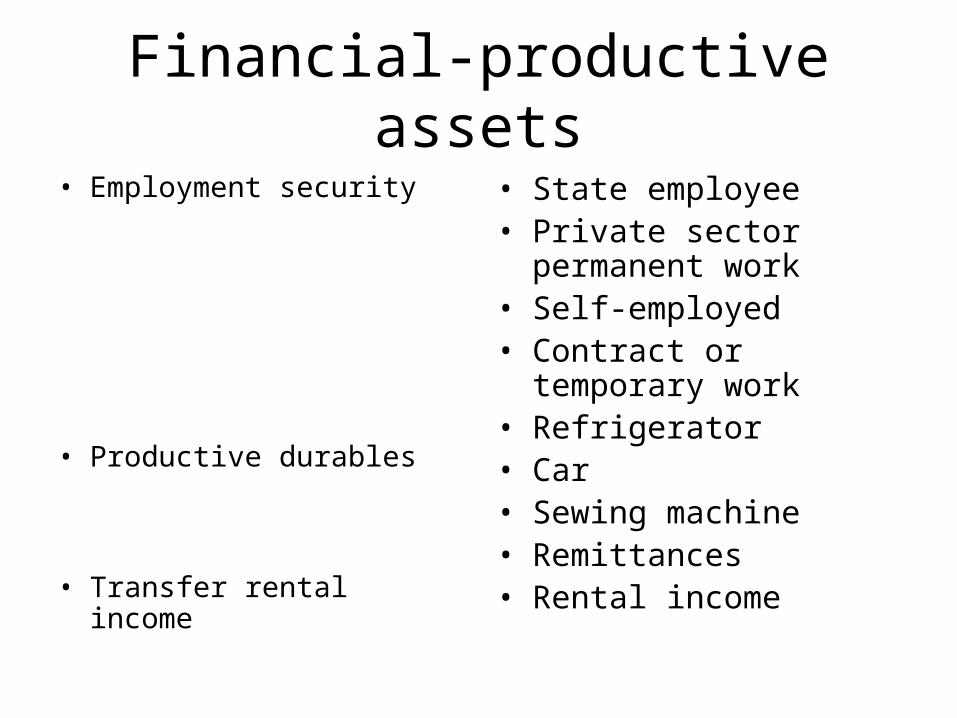
Financial-productive assets
• Employment security
• Productive durables
• Transfer rental income
• State employee• Private sector permanent
work• Self-employed• Contract or temporary
work• Refrigerator• Car• Sewing machine• Remittances• Rental income
Human Assets
• Education • Level of education– Illiterate– Some primary school– Completed primary– Secondary or technical– Some tertiary
education
Social assets
• Household
• Community
• Jointly headed household• Other household on plot• “Hidden” female-headed
household• Whether someone on the
plot:– Attends church– Plays in sports group– Participates in community
groups