Embed Size (px)
Citation preview
© Roach Ag Marketing, Ltd.
2013-14 Grain Market Outlook and
Strategies for
UrbanaPresented by: John Roach
8/21/13
© Roach Ag Marketing, Ltd.
Disclaimer:Futures/options trading involves substantial risk of loss and trading may not be suitable for all investors. You should fully understand those risks prior to trading. Past financial results are not necessarily indicative of future performance.
This material should be construed as the solicitation of an offer to sell or the solicitation of an offer to buy the derivative(s) noted in any jurisdiction where such an offer or solicitation would be legal.These materials have been created for a select group of individuals, and are intended to be presented with the proper context and guidance. Information contained herein was obtained from sources believed to be reliable, but is not guaranteed as to its accuracy. These materials represent the opinions and viewpoints of the author, and do not necessarily reflect the viewpoints and trading strategies employed by Roach Ag Marketing, Ltd.
Roach Ag. Marketing is not responsible for any redistribution of this material by third parties, or any trading decisions taken by persons not intended to view this material. Information contained herein was obtained from sources believed to be reliable, but is not guaranteed as to its accuracy. Contact Roach Ag. Marketing designated personnel for specific trading advice to meet your trading preferences. These materials represent the opinions and viewpoints of the author, and do not necessarily reflect the viewpoints and trading strategies employed by Roach Ag. Marketing.
© Roach Ag Marketing, Ltd.
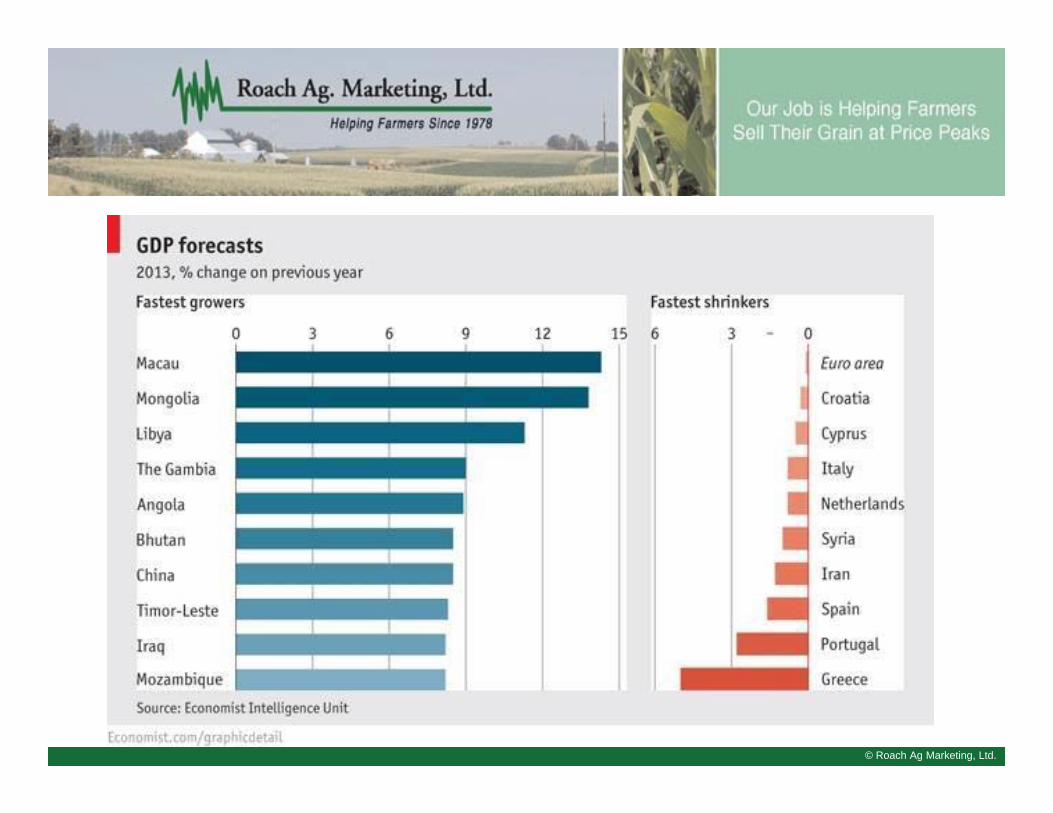
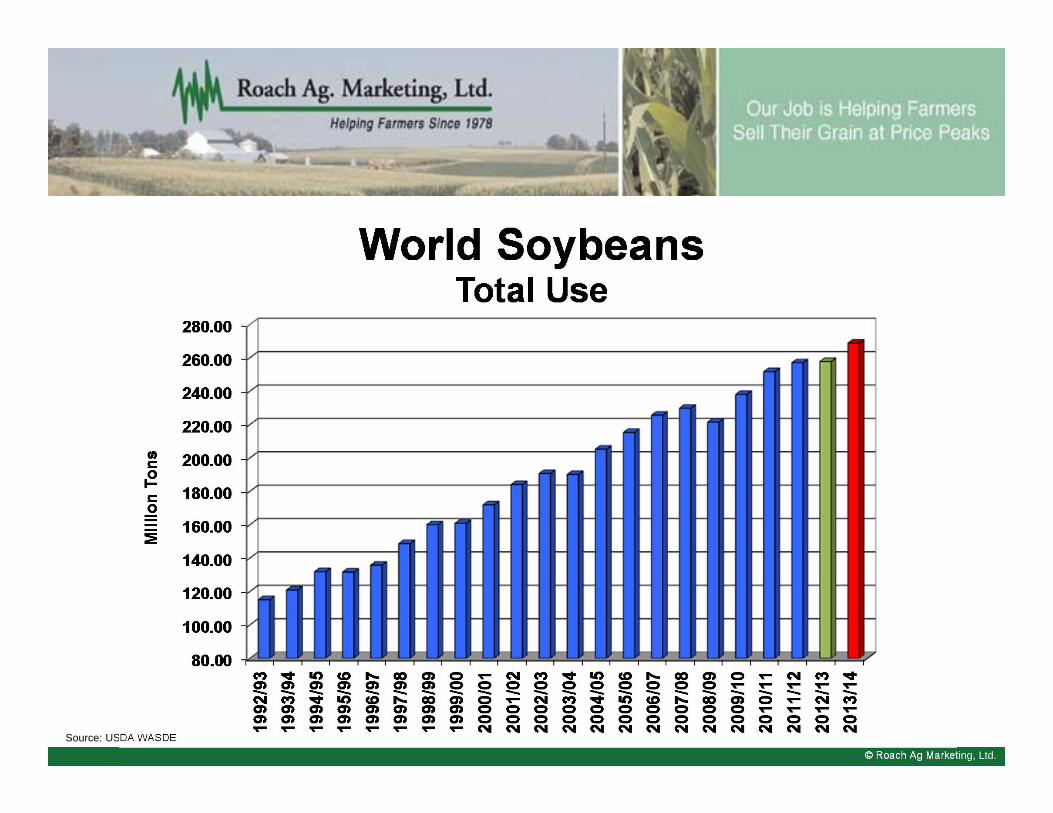
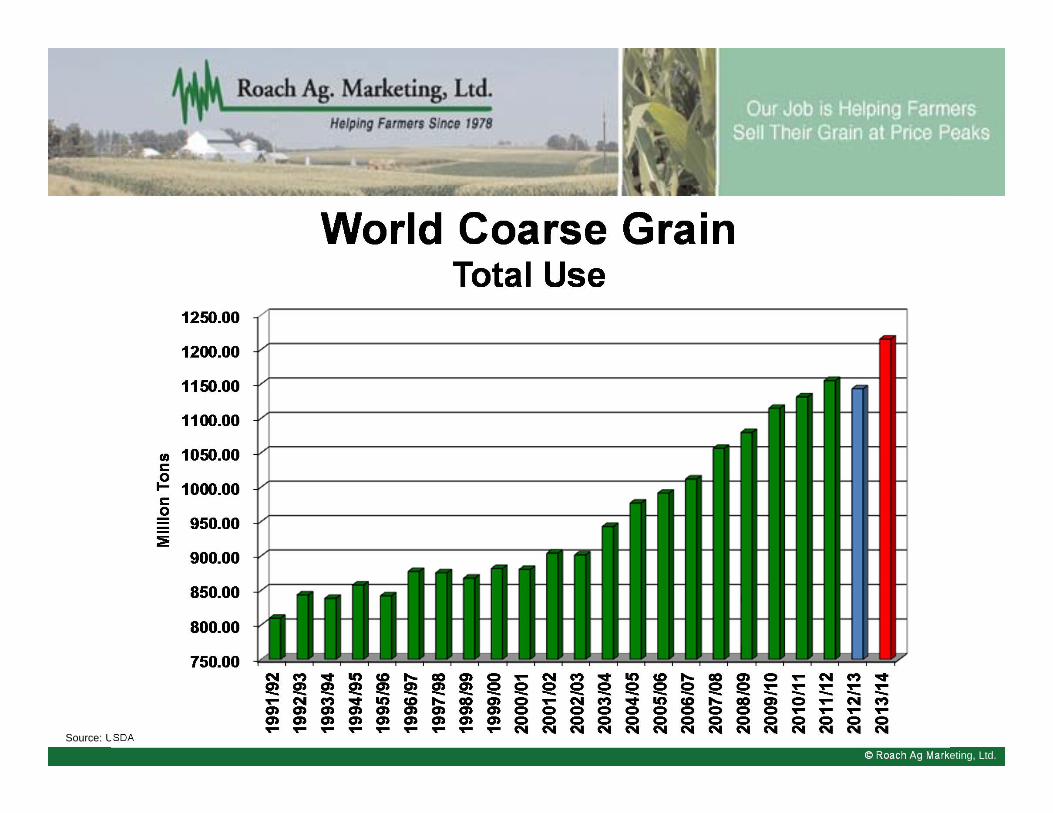
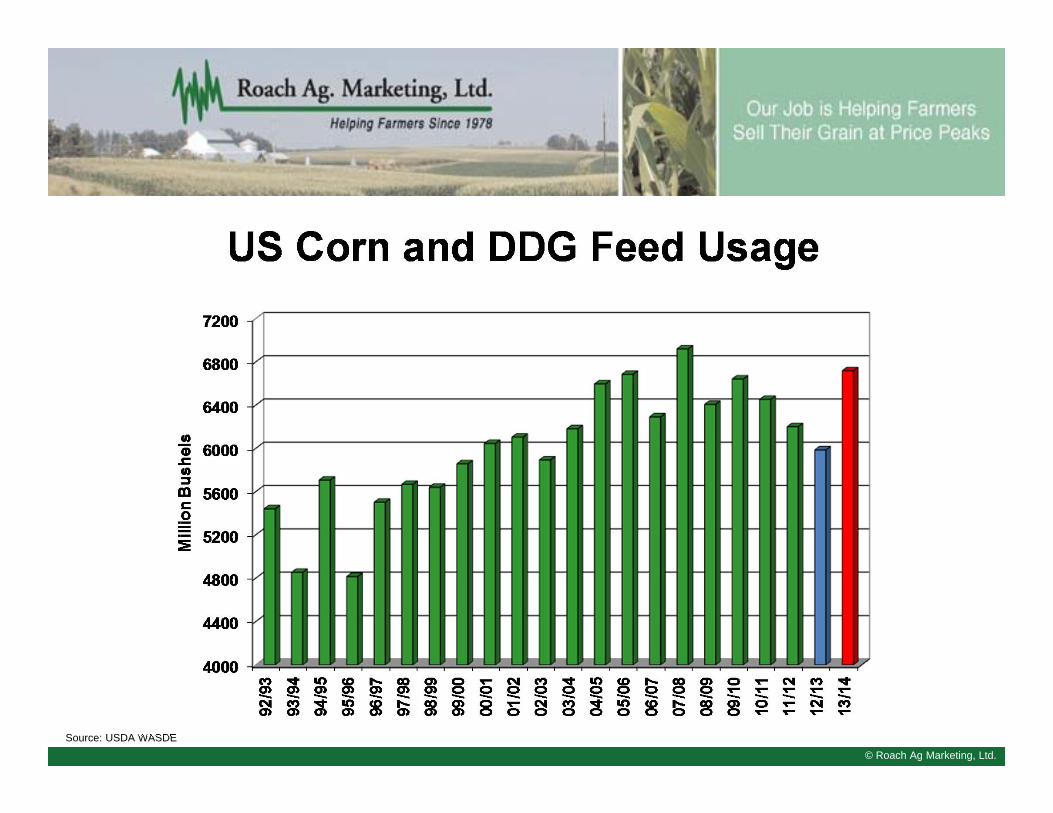
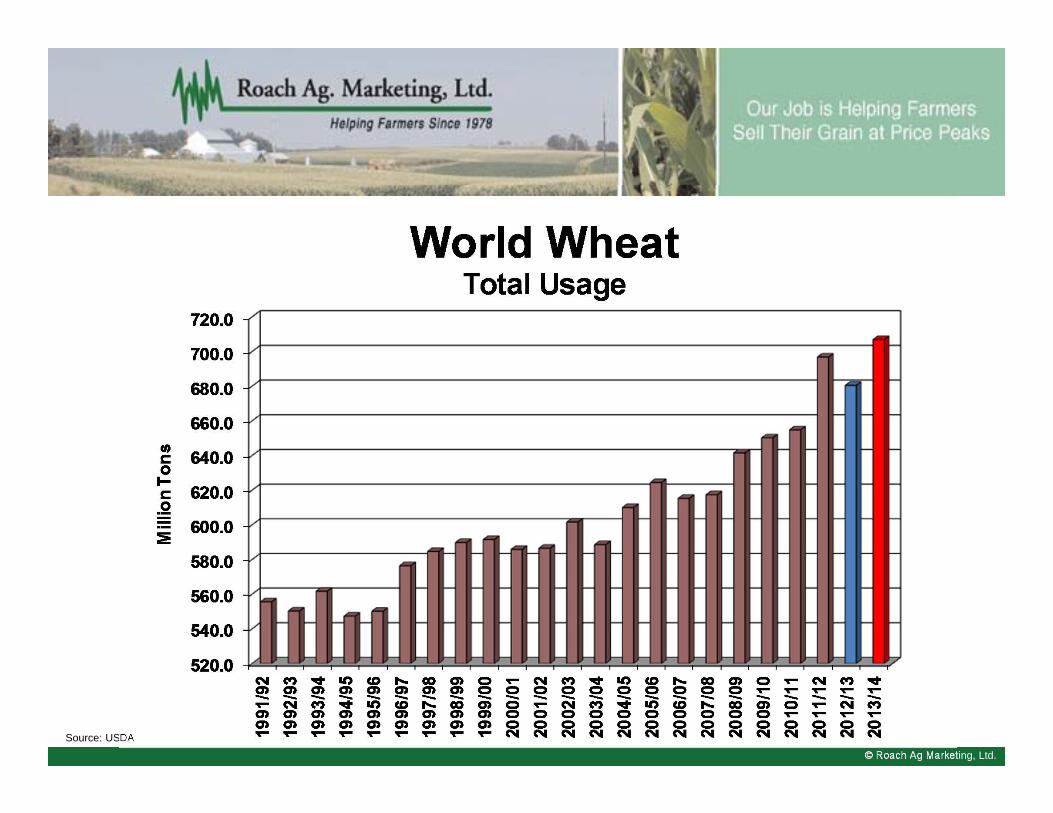
World grain and oilseed demand has increased, even during recentperiods of economic problems and
high to record high grain prices.Average usage growth has been 2.5% per year over past 5 years.
© Roach Ag Marketing, Ltd.Source: USDA WASDE
© Roach Ag Marketing, Ltd.
© Roach Ag Marketing, Ltd.
© Roach Ag Marketing, Ltd.
© Roach Ag Marketing, Ltd.
© Roach Ag Marketing, Ltd.Source: USDA WASDE
© Roach Ag Marketing, Ltd.Source: USDA WASDE
© Roach Ag Marketing, Ltd.Source: USDA WASDE
© Roach Ag Marketing, Ltd.Source: USDA WASDE
30.0
40.0
50.0
60.0
70.0
80.0
90.0
100.0
110.0
2004
/05
2005
/06
2006
/07
2007
/08
2008
/09
2009
/10
2010
/11
2011
/12
2012
/13
2013
/14
Day
s of
Sup
ply
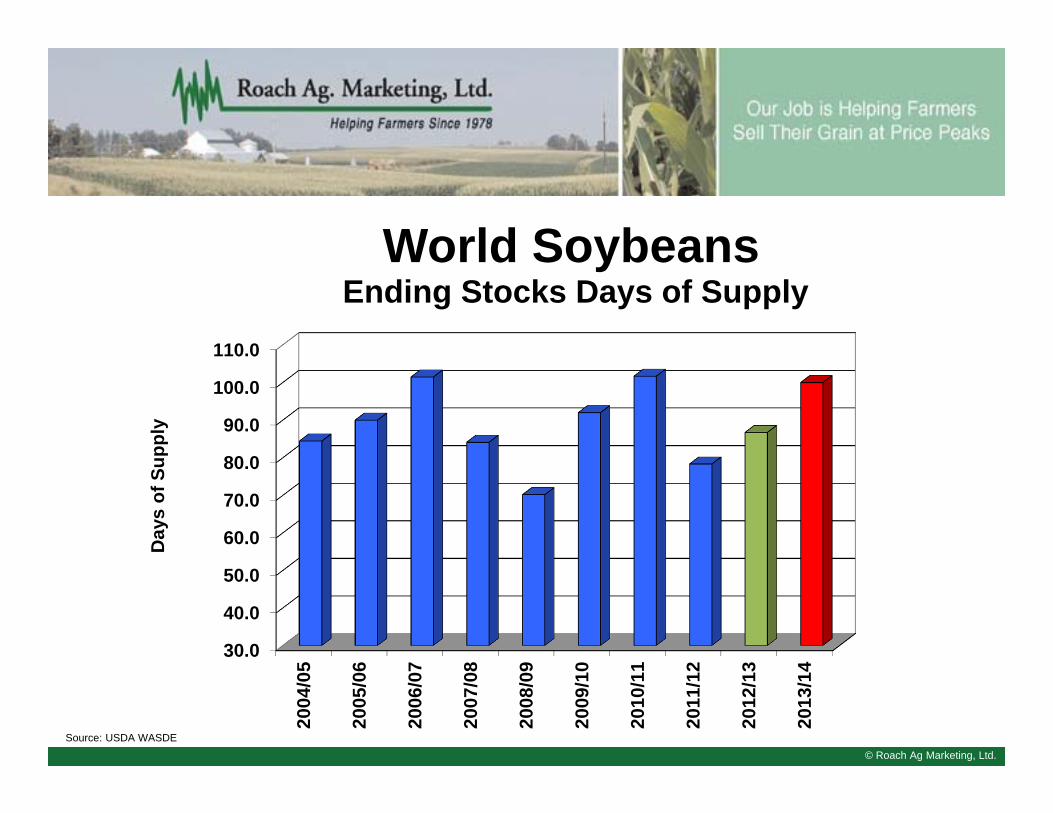
World SoybeansEnding Stocks Days of Supply
© Roach Ag Marketing, Ltd.Source: USDA WASDE
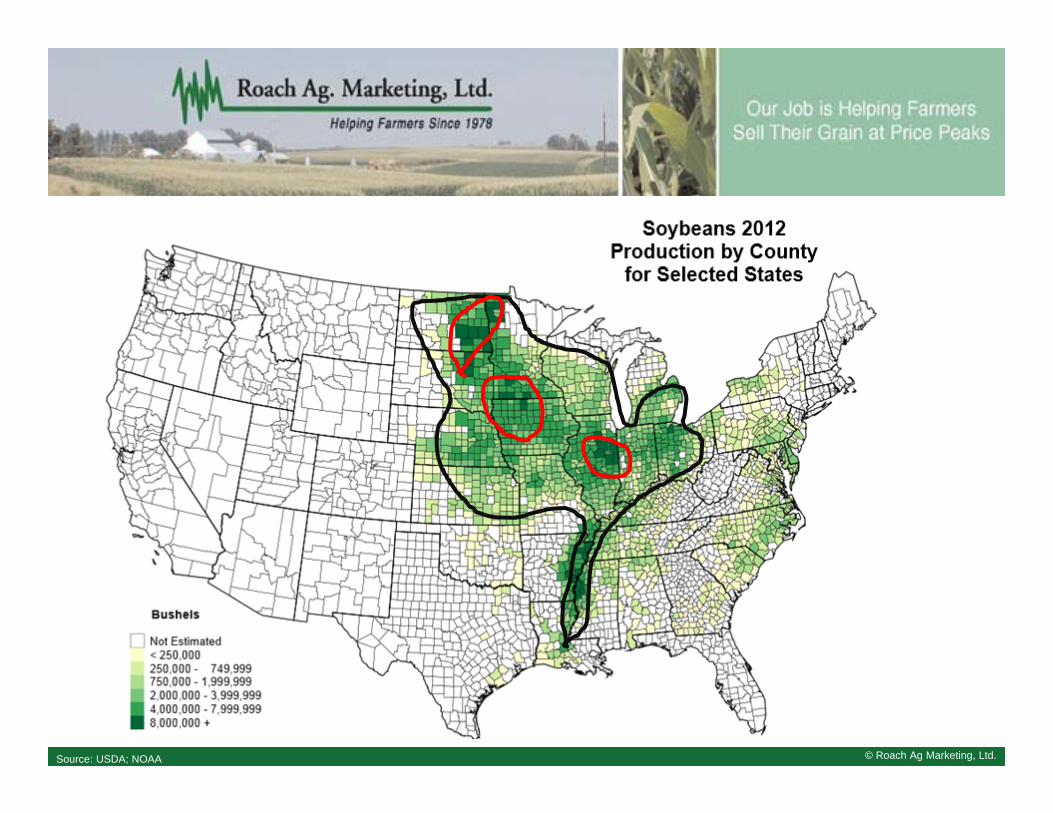
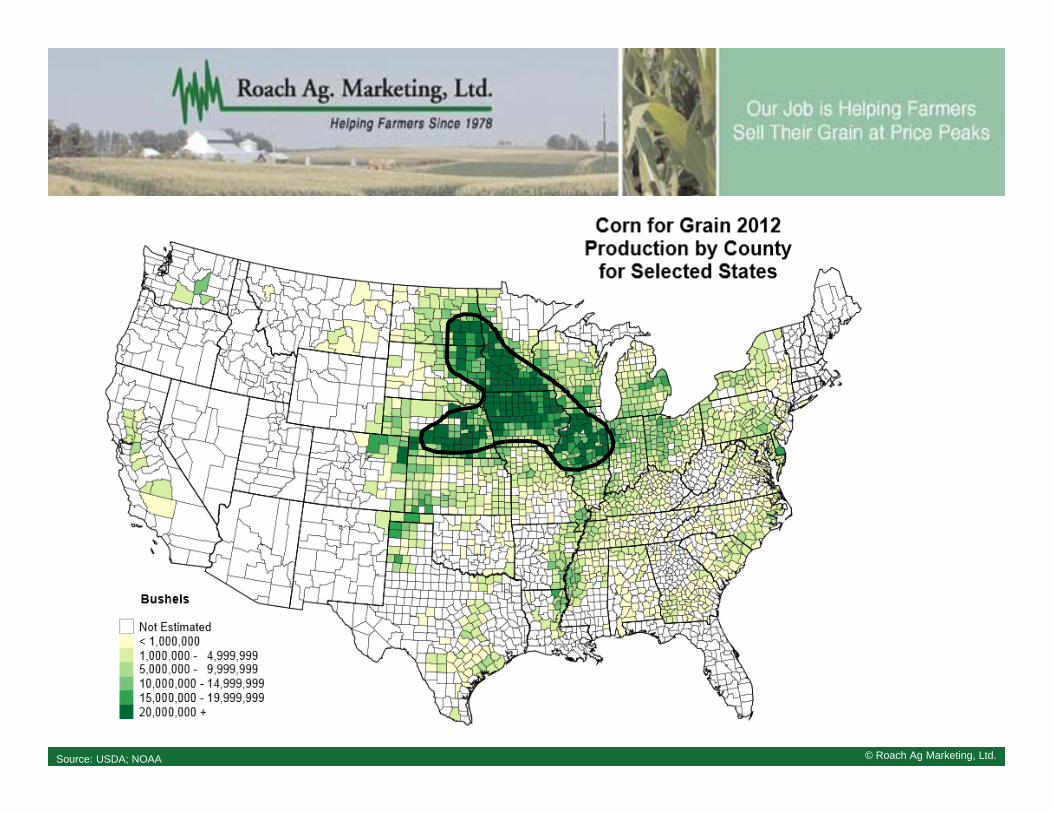
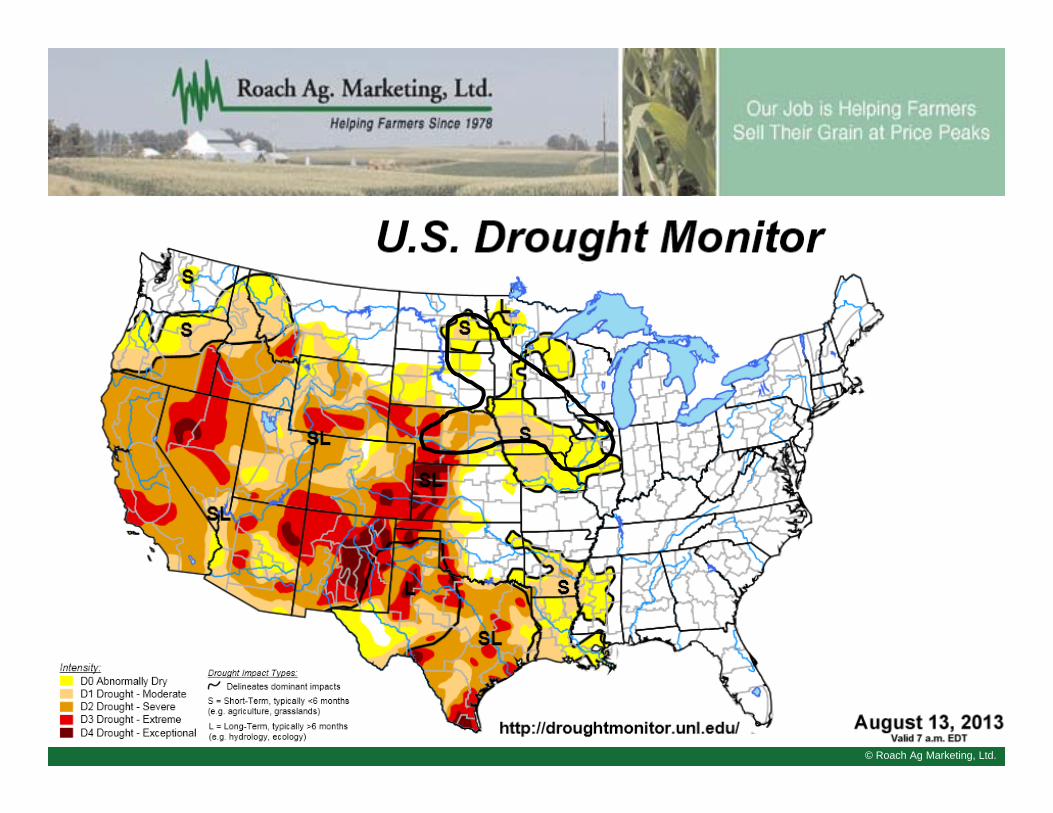
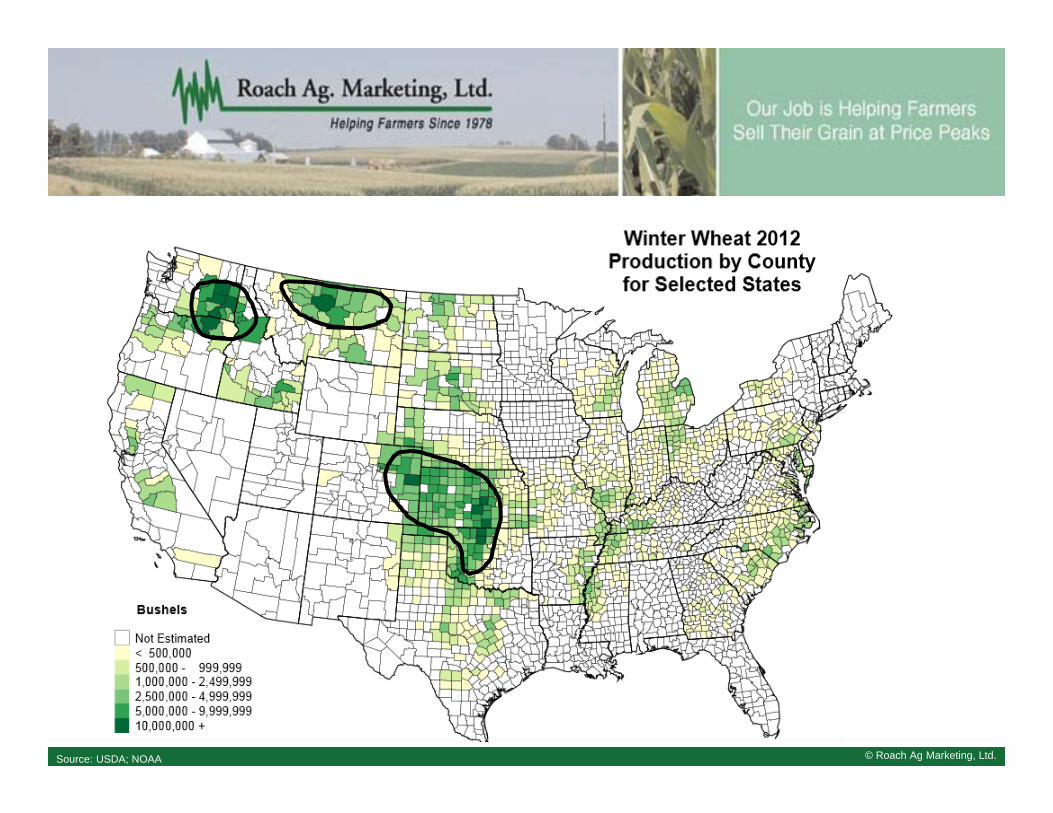
© Roach Ag Marketing, Ltd.Source: USDA; NOAA

© Roach Ag Marketing, Ltd.
© Roach Ag Marketing, Ltd.

© Roach Ag Marketing, Ltd.Source: NOAA
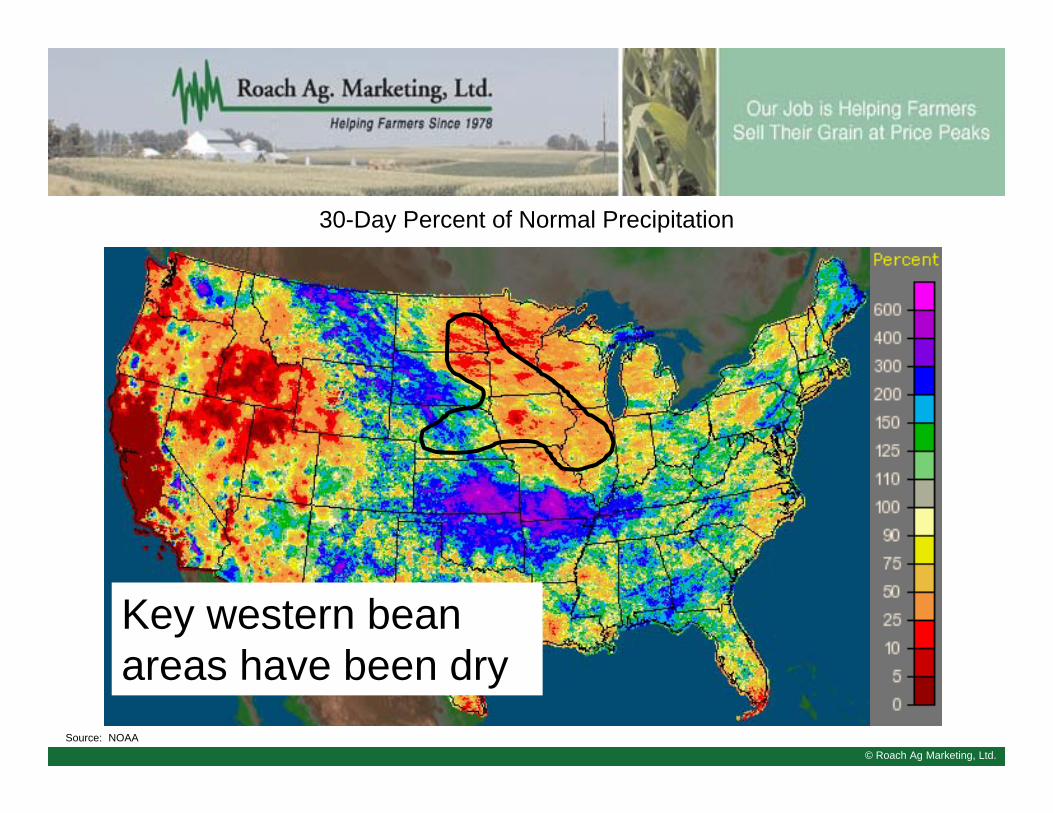
30-Day Percent of Normal Precipitation
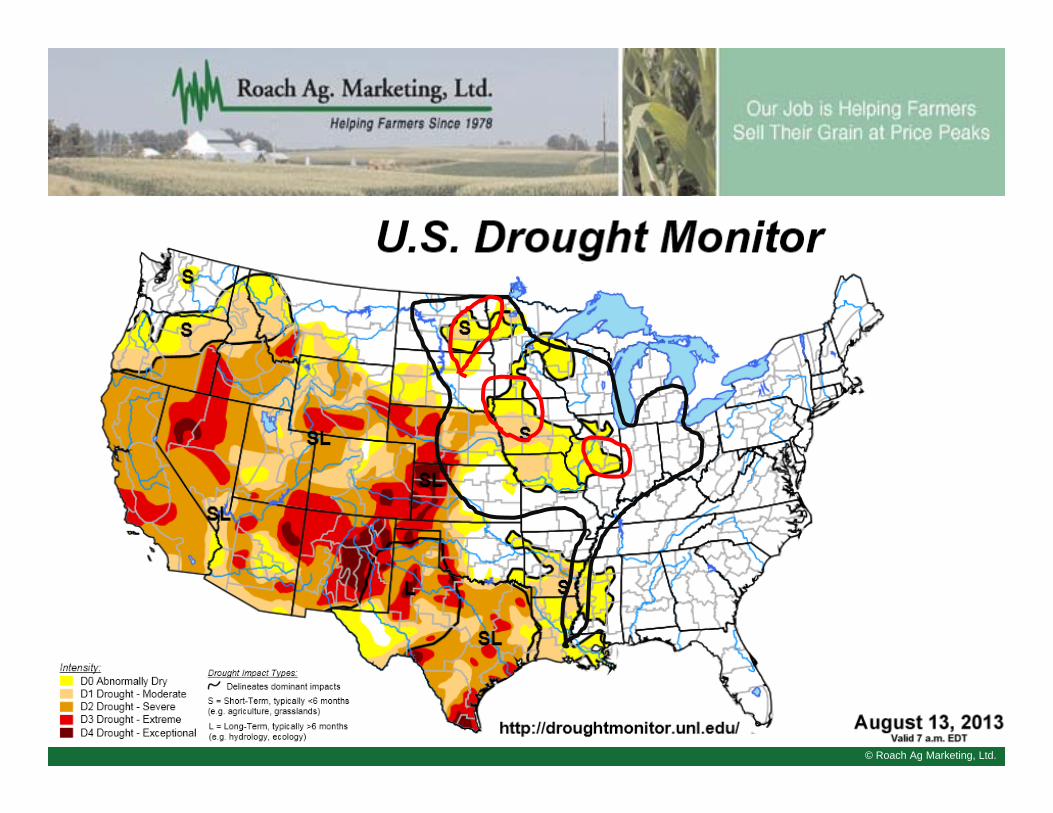
Key western bean areas have been dry
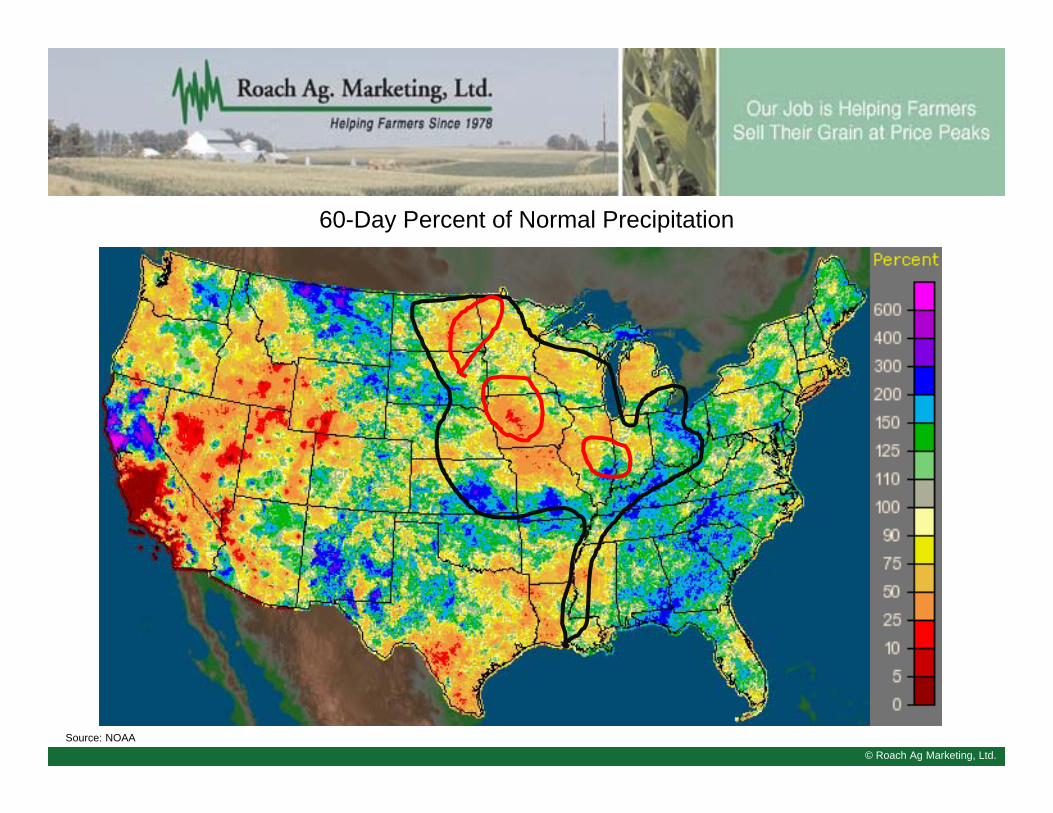
© Roach Ag Marketing, Ltd.Source: NOAA
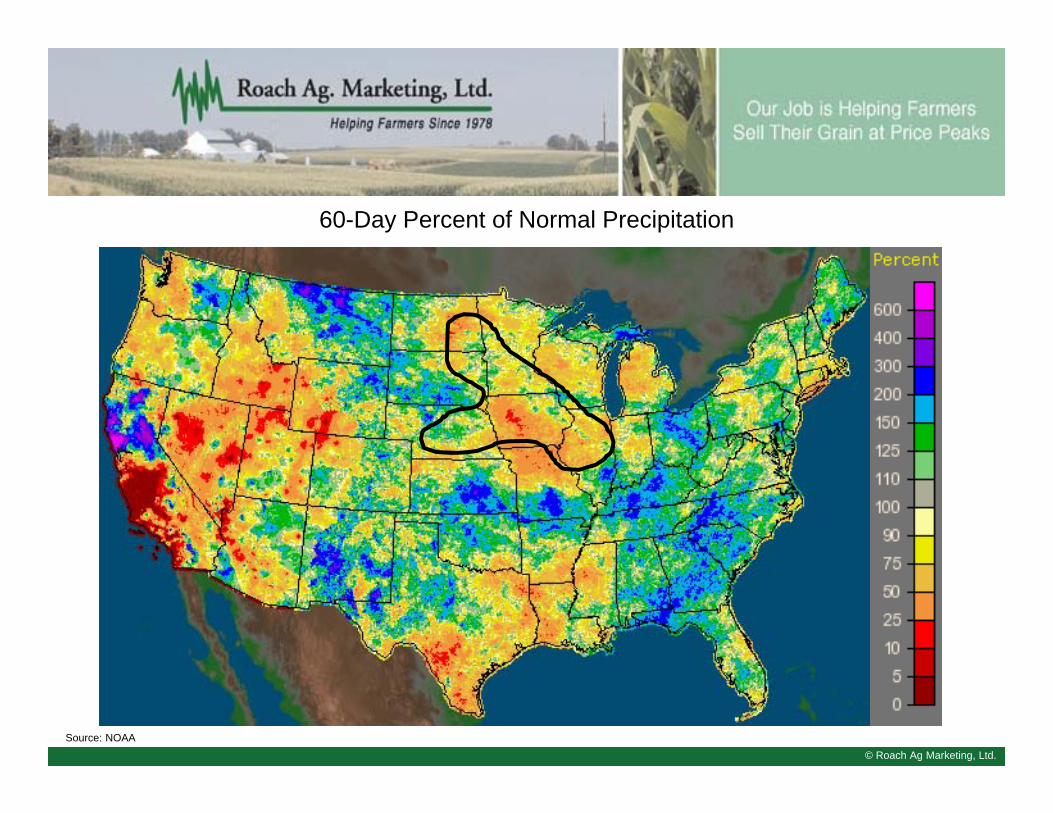
60-Day Percent of Normal Precipitation
© Roach Ag Marketing, Ltd.
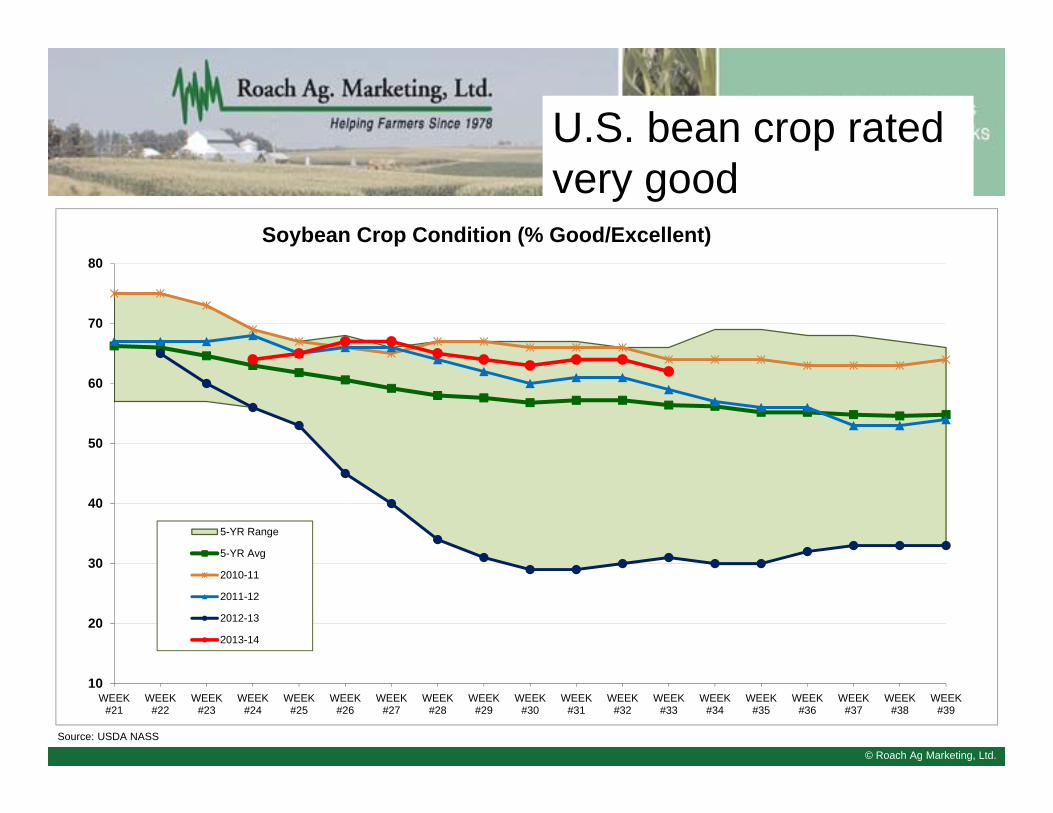
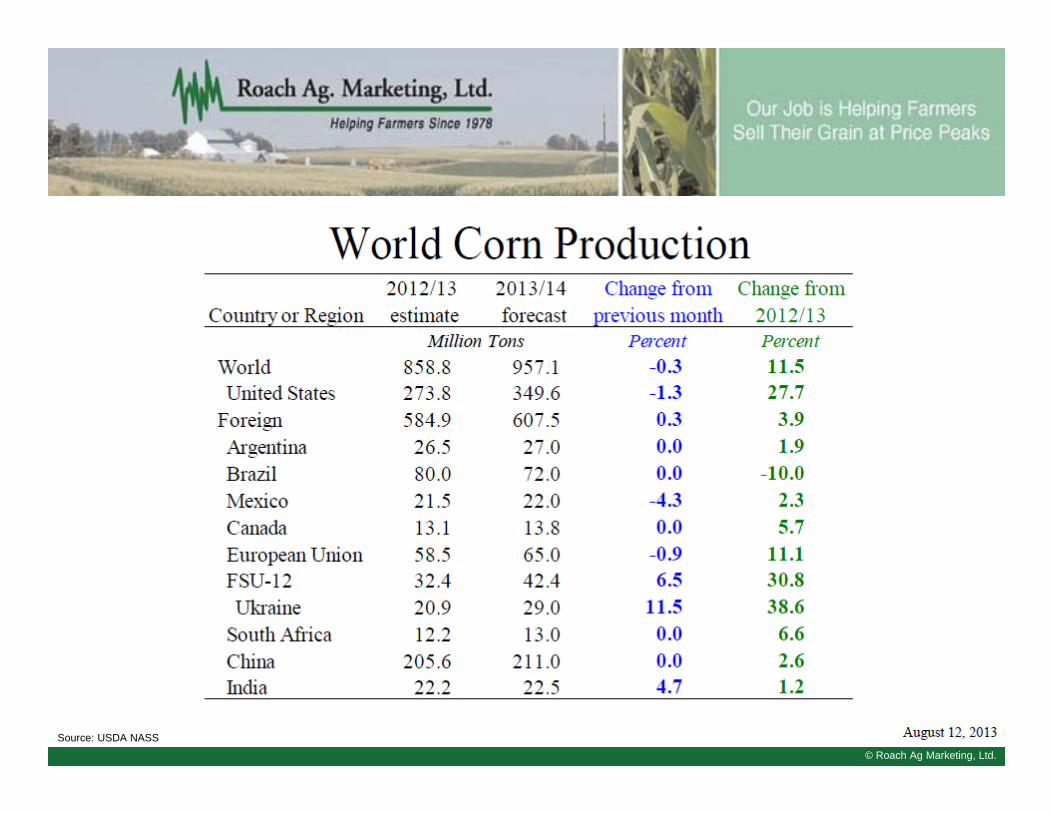
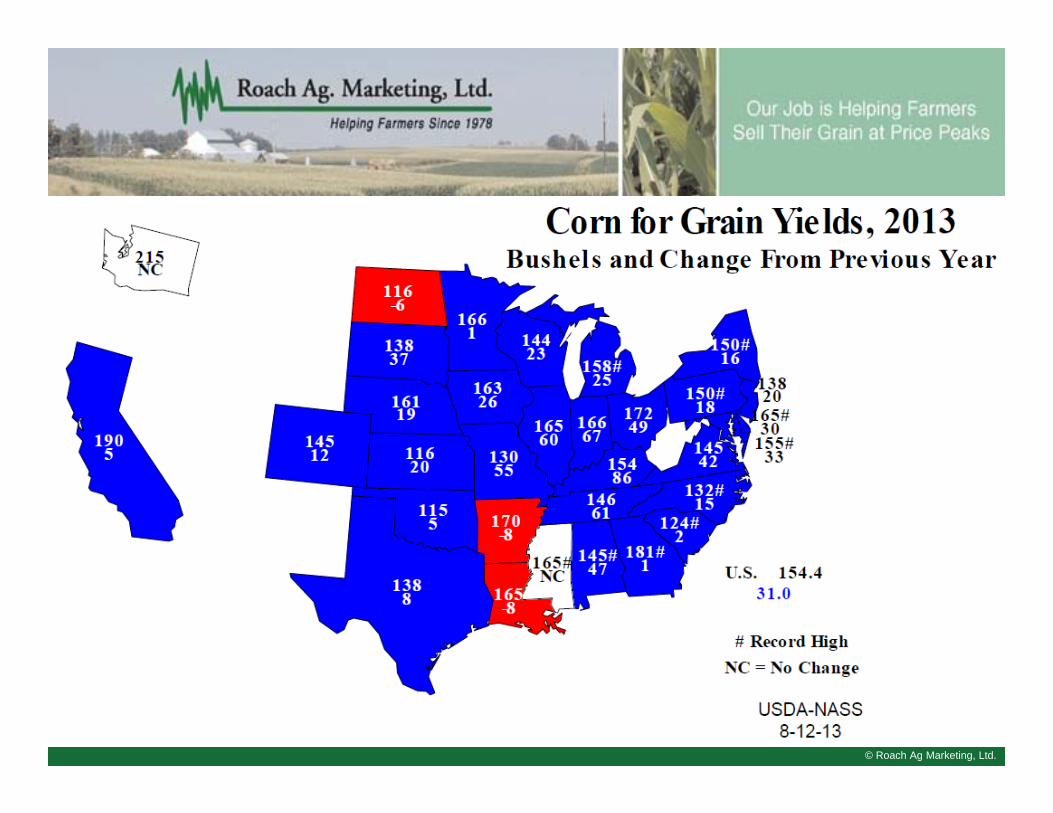
Source: USDA NASS
U.S. bean crop rated very good
10
20
30
40
50
60
70
80
WEEK#21
WEEK#22
WEEK#23
WEEK#24
WEEK#25
WEEK#26
WEEK#27
WEEK#28
WEEK#29
WEEK#30
WEEK#31
WEEK#32
WEEK#33
WEEK#34
WEEK#35
WEEK#36
WEEK#37
WEEK#38
WEEK#39
Soybean Crop Condition (% Good/Excellent)
5-YR Range
5-YR Avg
2010-11
2011-12
2012-13
2013-14
© Roach Ag Marketing, Ltd.Source: USDA WASDE
© Roach Ag Marketing, Ltd.
© Roach Ag Marketing, Ltd.
© Roach Ag Marketing, Ltd.
© Roach Ag Marketing, Ltd.
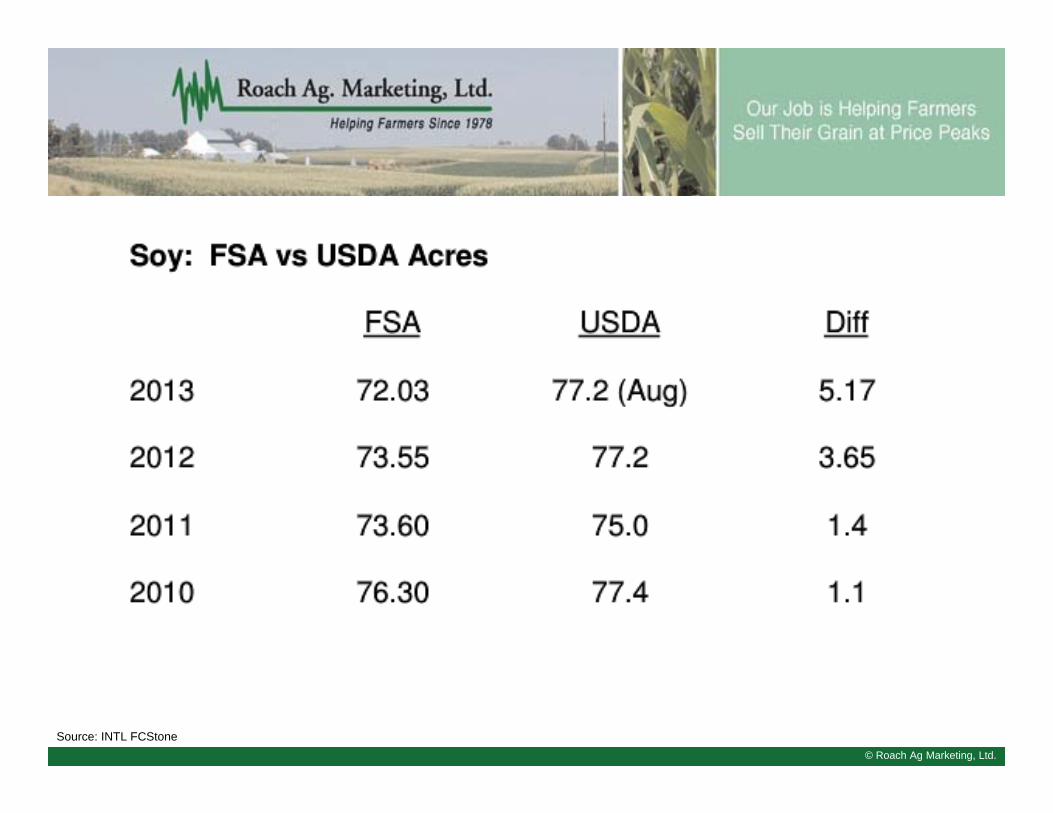
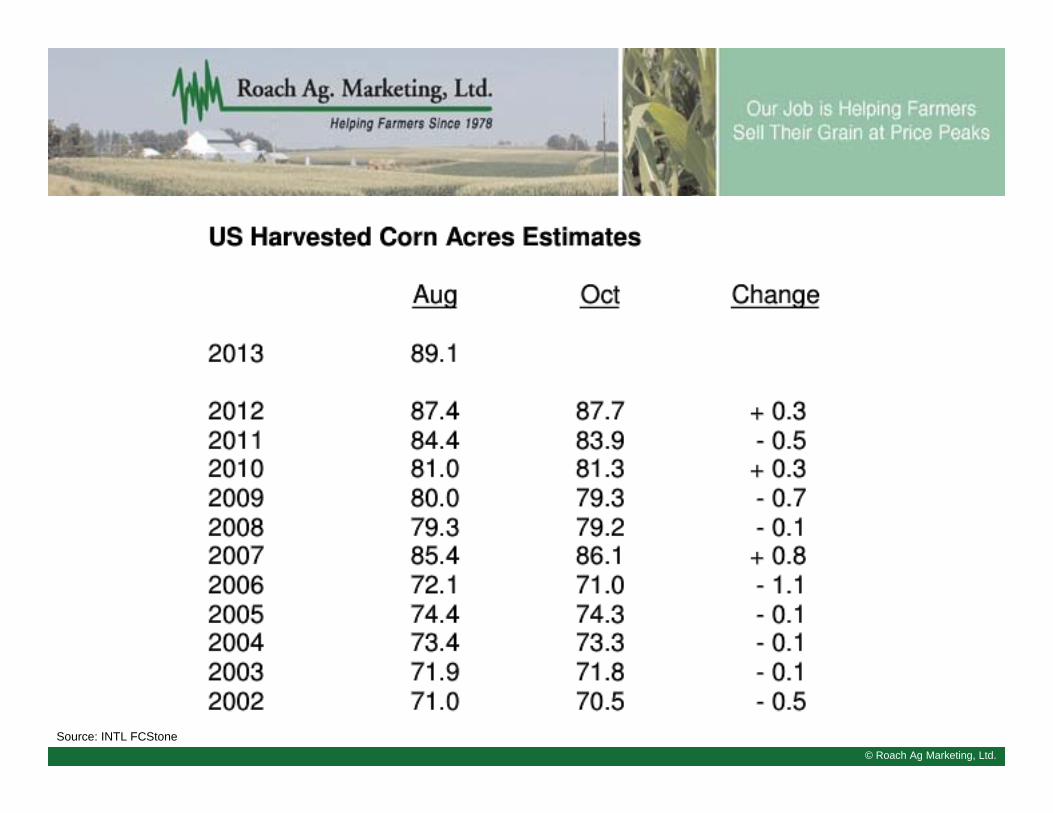
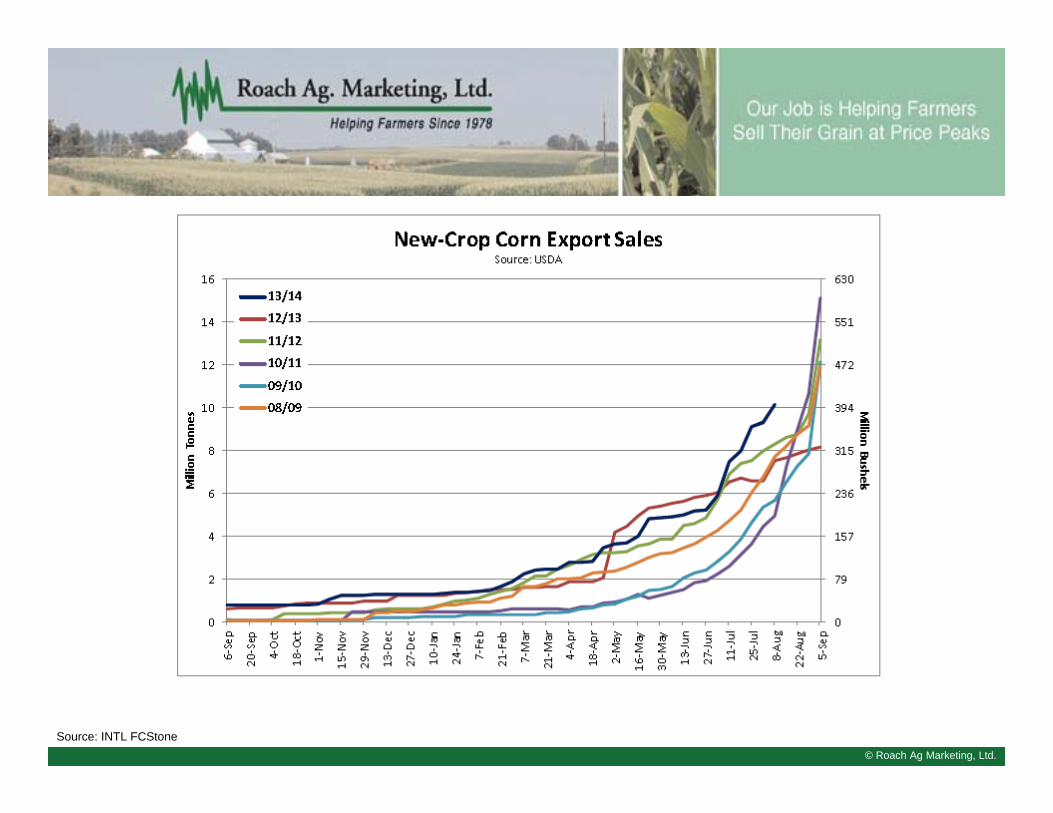
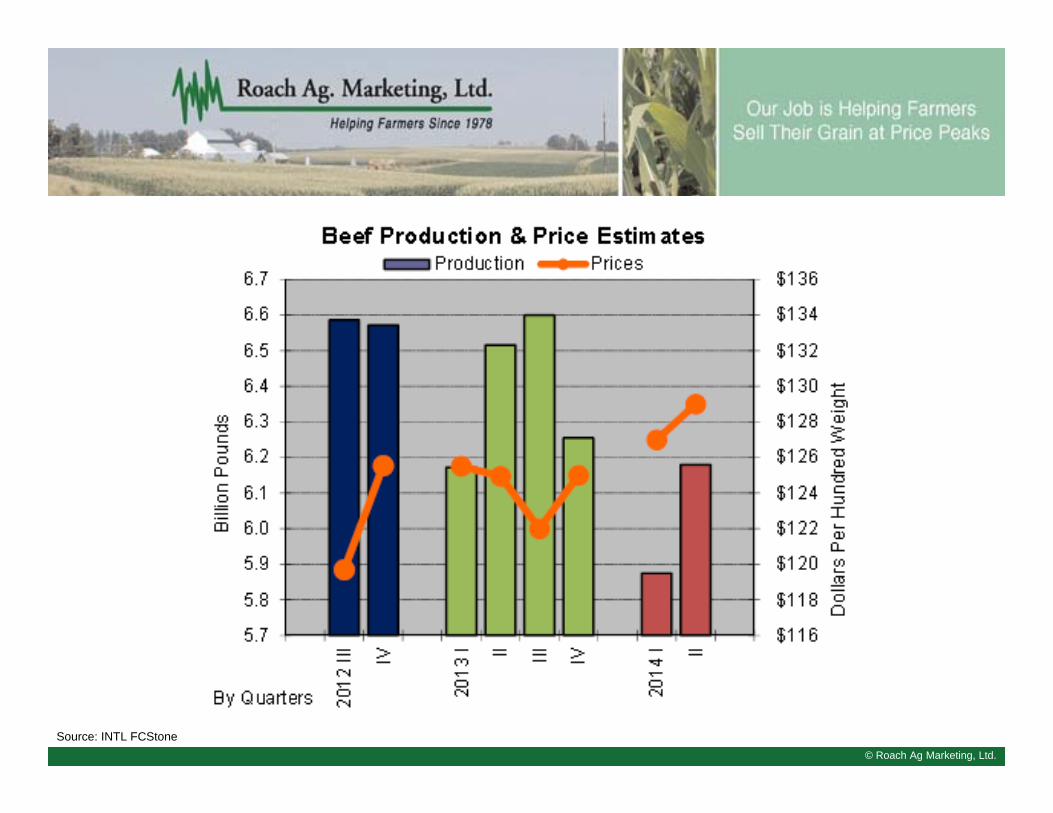
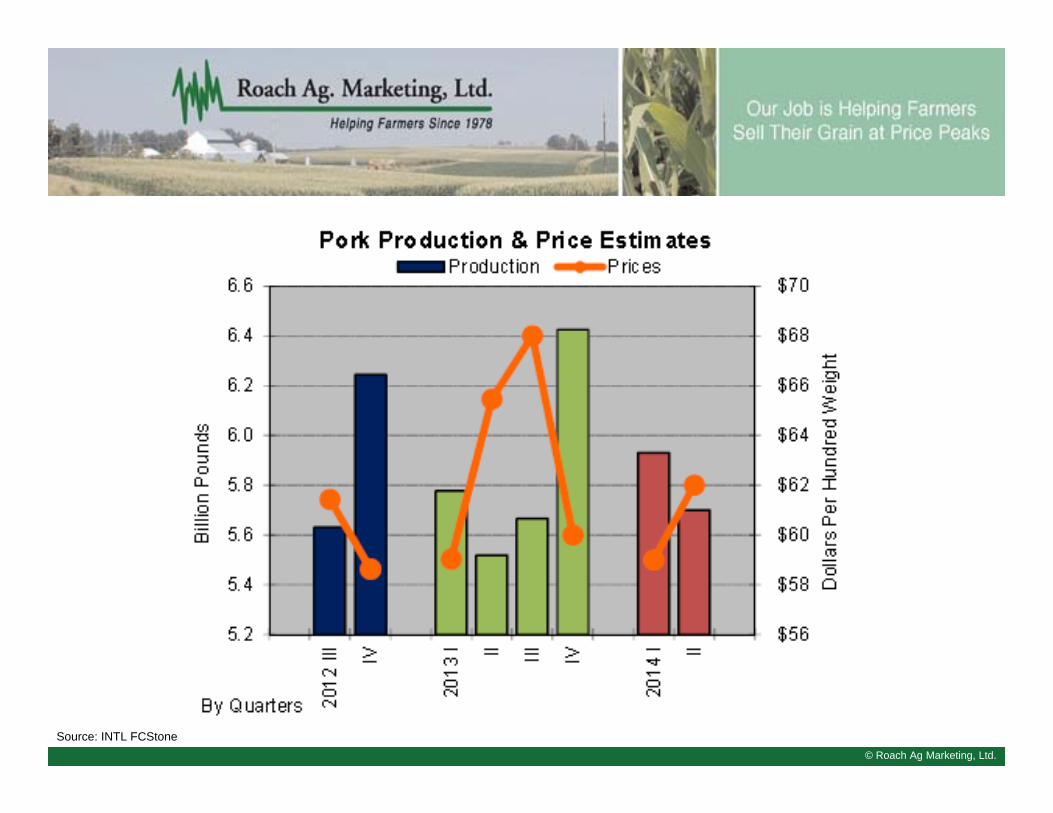
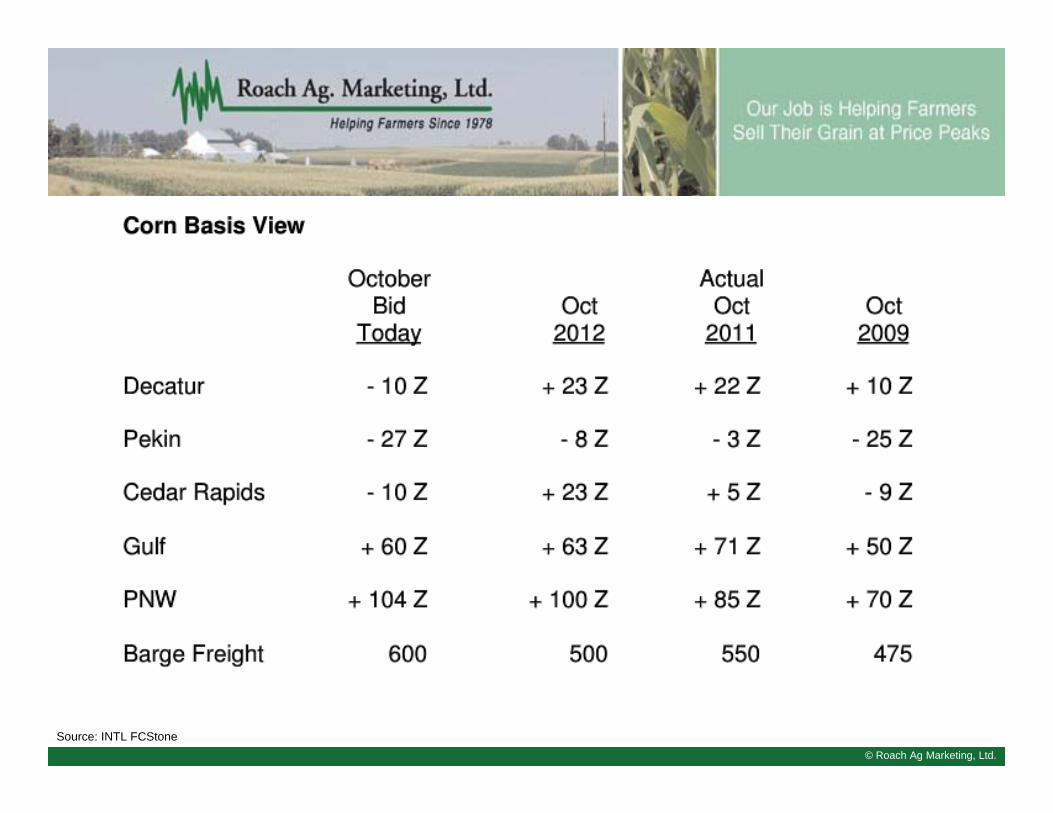
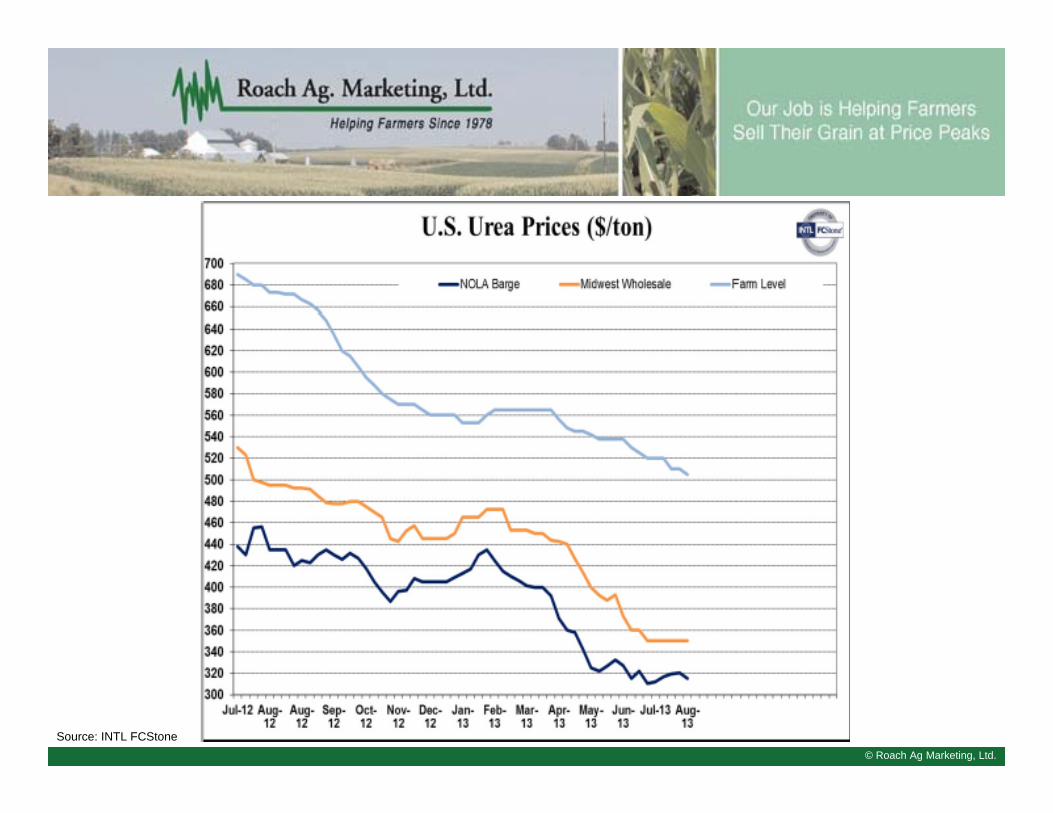
Source: INTL FCStone
© Roach Ag Marketing, Ltd.Source: USDA WASDE
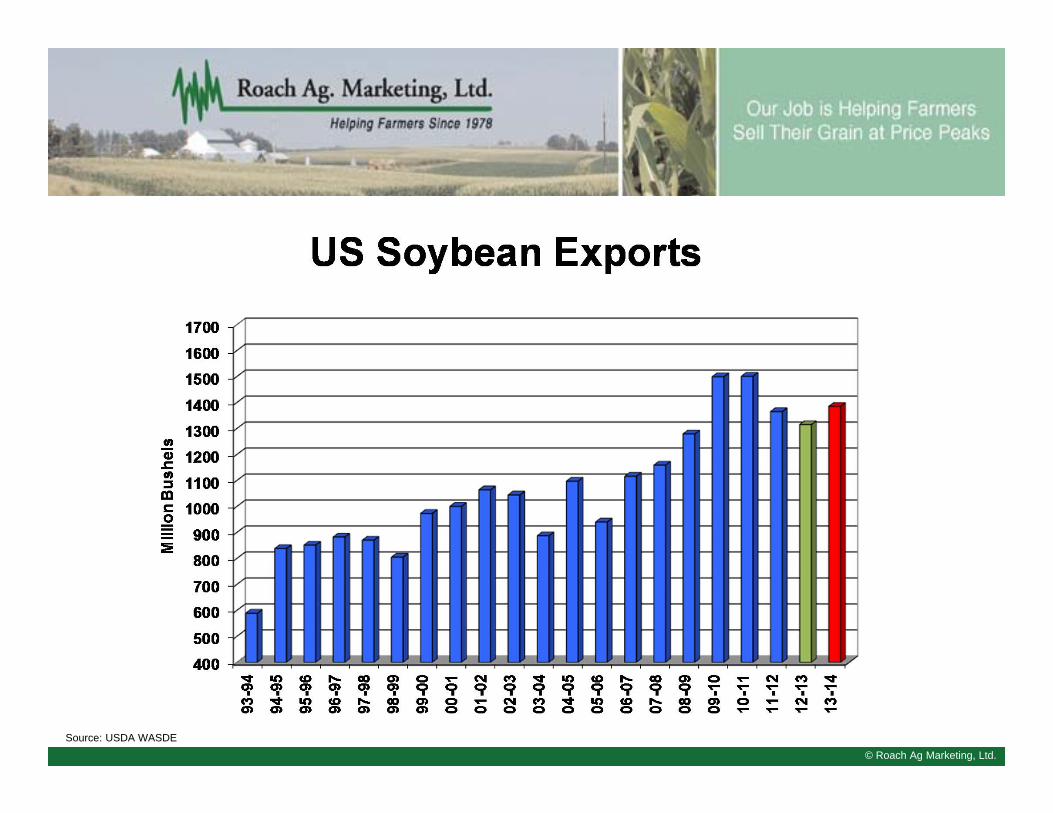
© Roach Ag Marketing, Ltd.Source: USDA WASDE
© Roach Ag Marketing, Ltd.
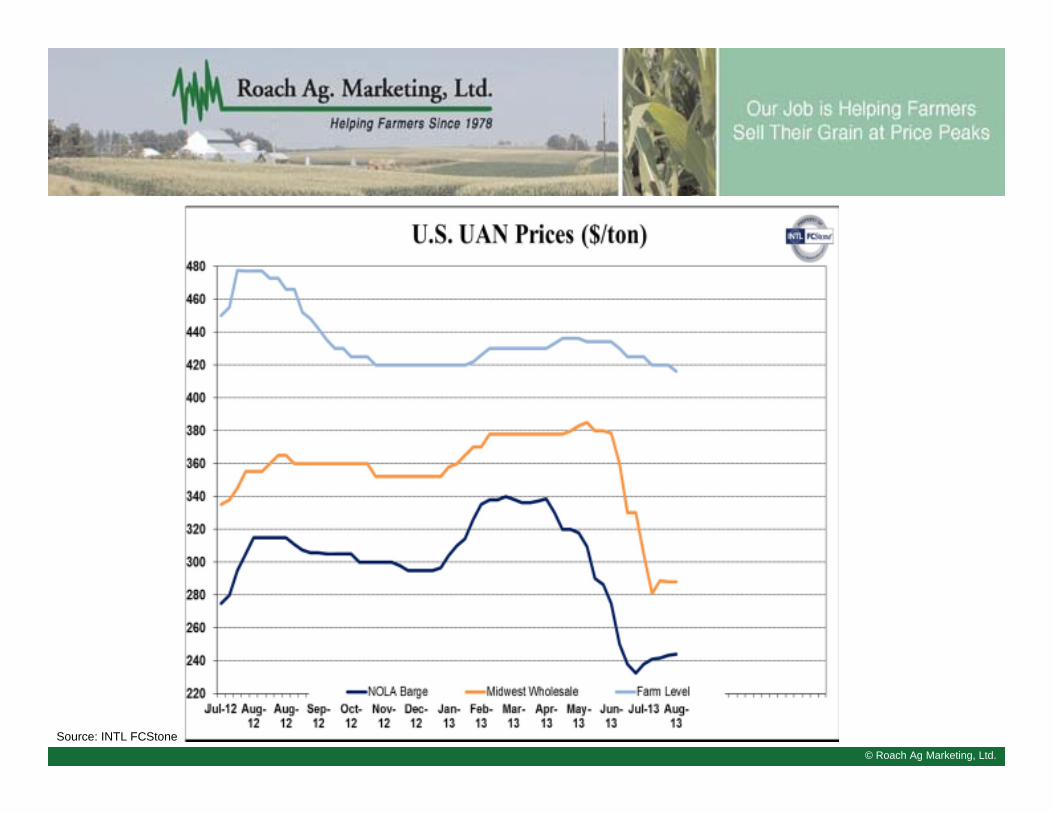
Source: INTL FCStone
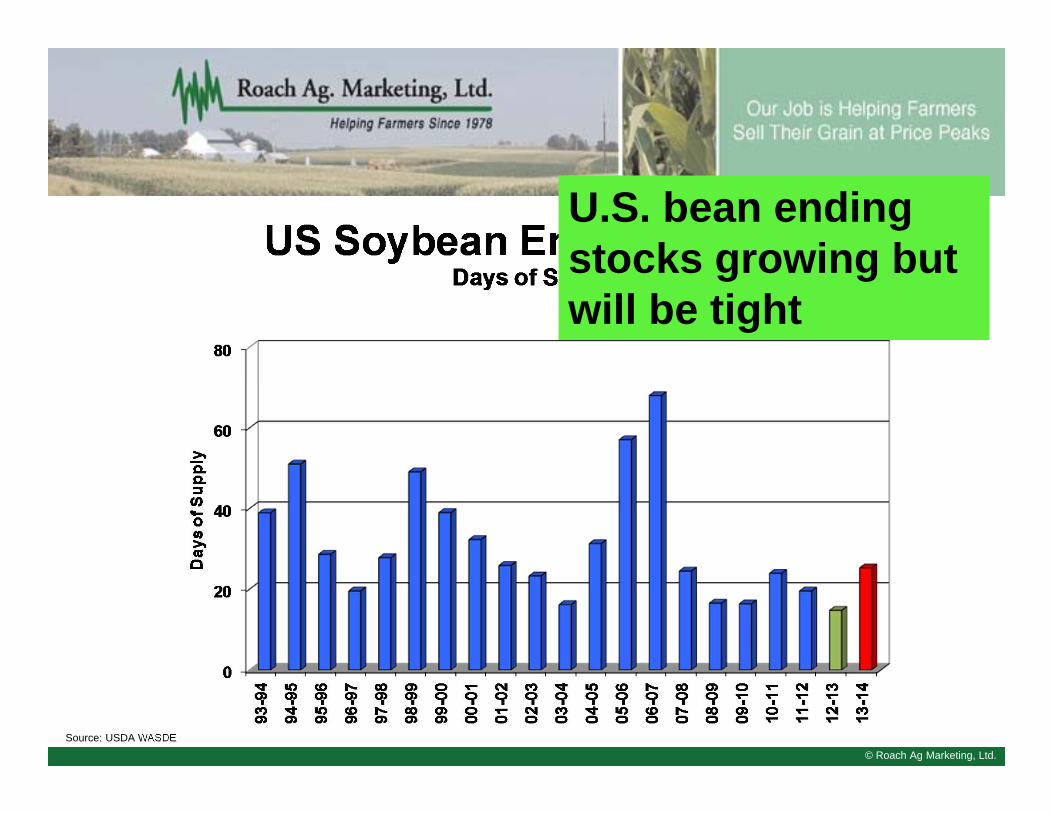
© Roach Ag Marketing, Ltd.Source: USDA WASDE
U.S. bean ending stocks growing but will be tight
© Roach Ag Marketing, Ltd.
© Roach Ag Marketing, Ltd.
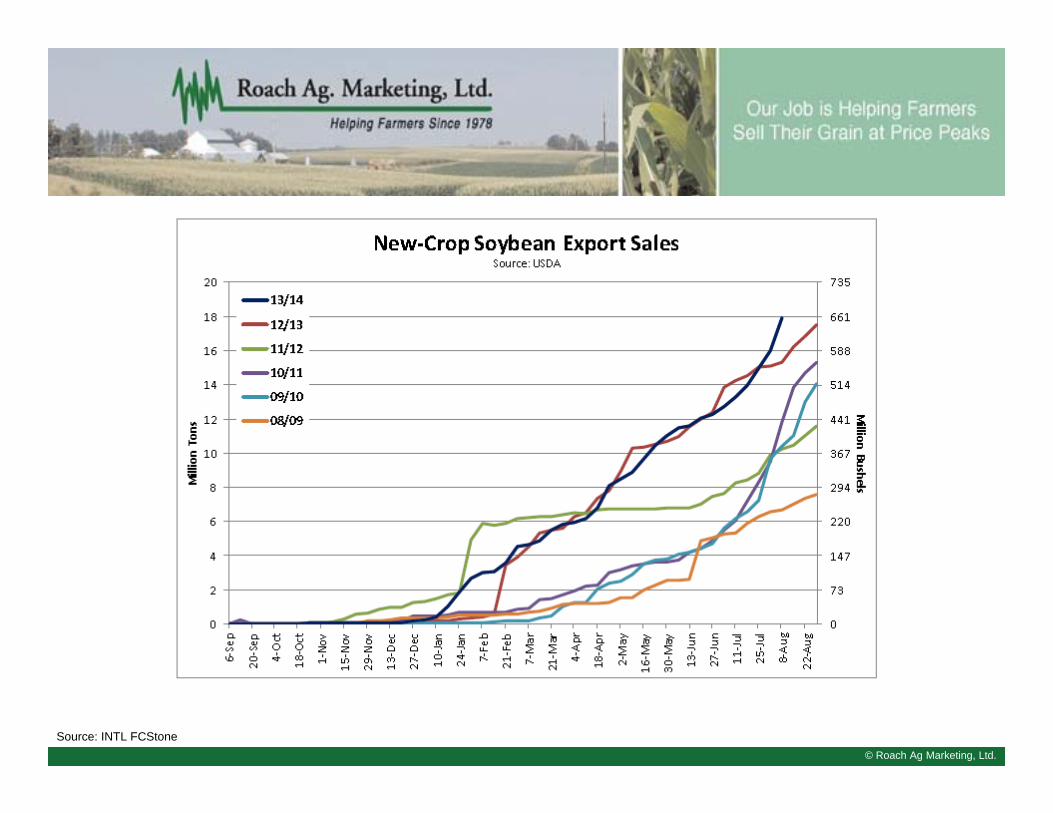
© Roach Ag Marketing, Ltd.Source: USDA
© Roach Ag Marketing, Ltd.Source: USDA WASDE
© Roach Ag Marketing, Ltd.Source: USDA NASS
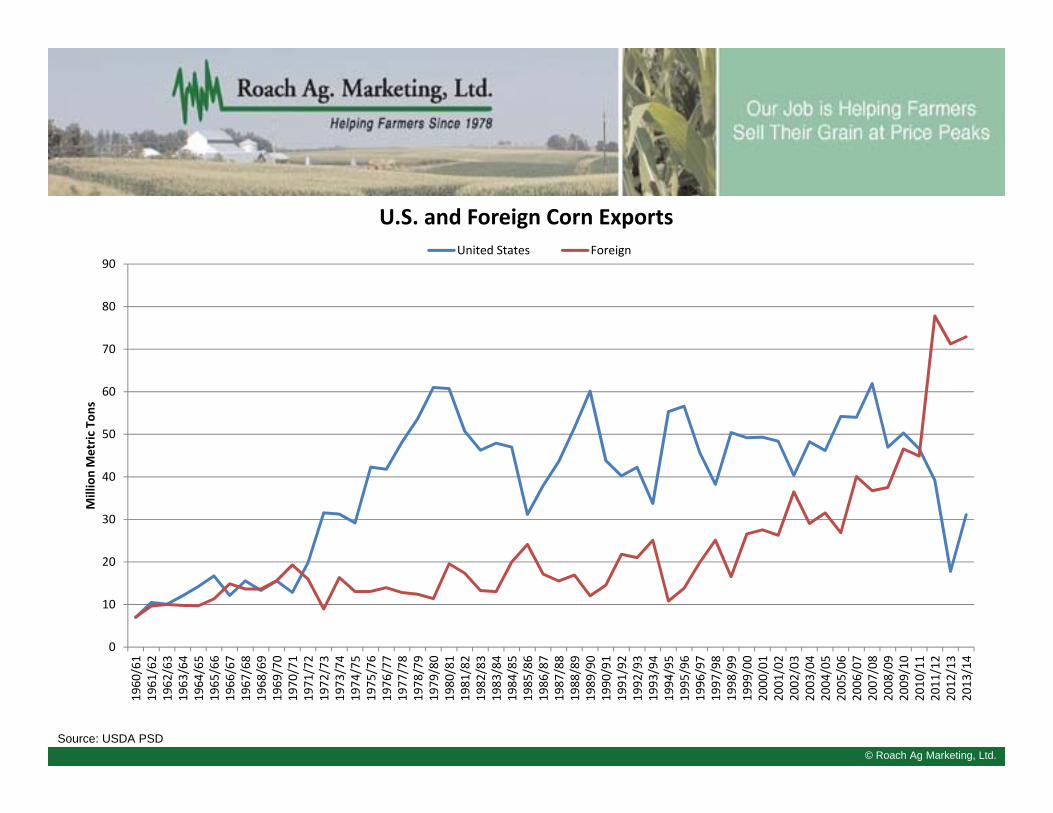
© Roach Ag Marketing, Ltd.Source: USDA PSD
0
10
20
30
40
50
60
70
80
90
1960/61
1961/62
1962/63
1963/64
1964/65
1965/66
1966/67
1967/68
1968/69
1969/70
1970/71
1971/72
1972/73
1973/74
1974/75
1975/76
1976/77
1977/78
1978/79
1979/80
1980/81
1981/82
1982/83
1983/84
1984/85
1985/86
1986/87
1987/88
1988/89
1989/90
1990/91
1991/92
1992/93
1993/94
1994/95
1995/96
1996/97
1997/98
1998/99
1999/00
2000/01
2001/02
2002/03
2003/04
2004/05
2005/06
2006/07
2007/08
2008/09
2009/10
2010/11
2011/12
2012/13
2013/14
Million Metric
Ton
s
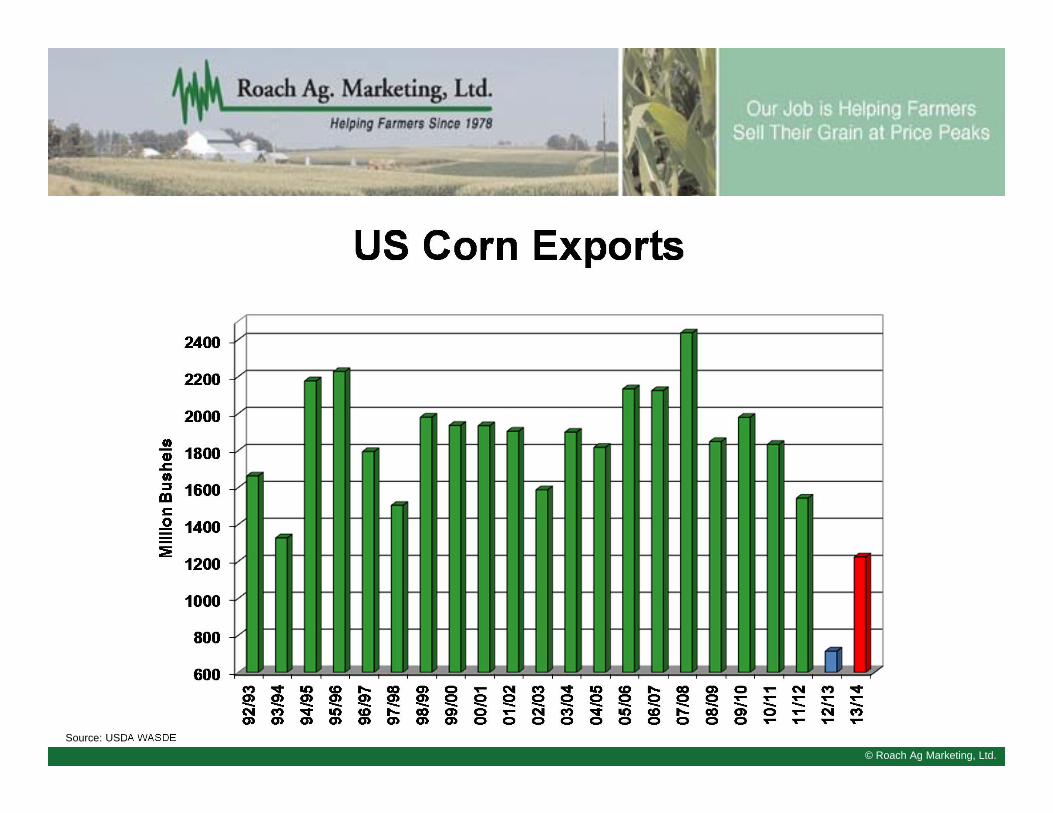
U.S. and Foreign Corn ExportsUnited States Foreign
© Roach Ag Marketing, Ltd.Source: USDA WASDE
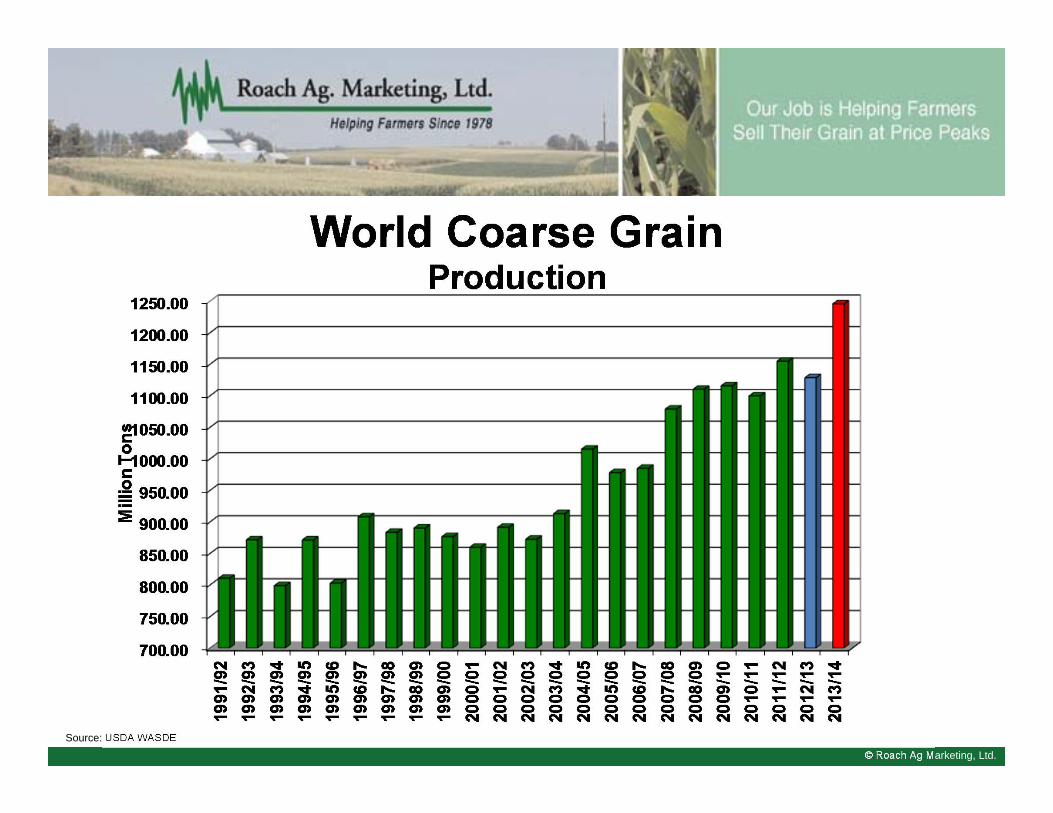
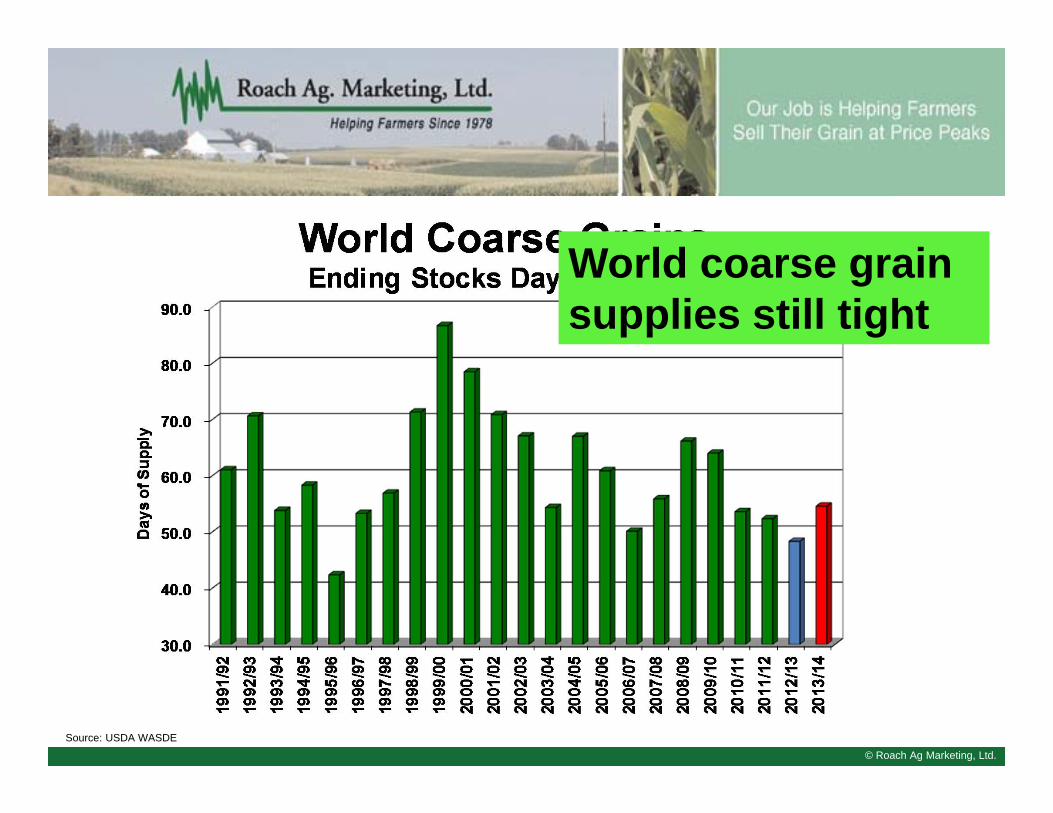
World coarse grain supplies still tight
© Roach Ag Marketing, Ltd.Source: USDA WASDE
© Roach Ag Marketing, Ltd.
© Roach Ag Marketing, Ltd.
© Roach Ag Marketing, Ltd.
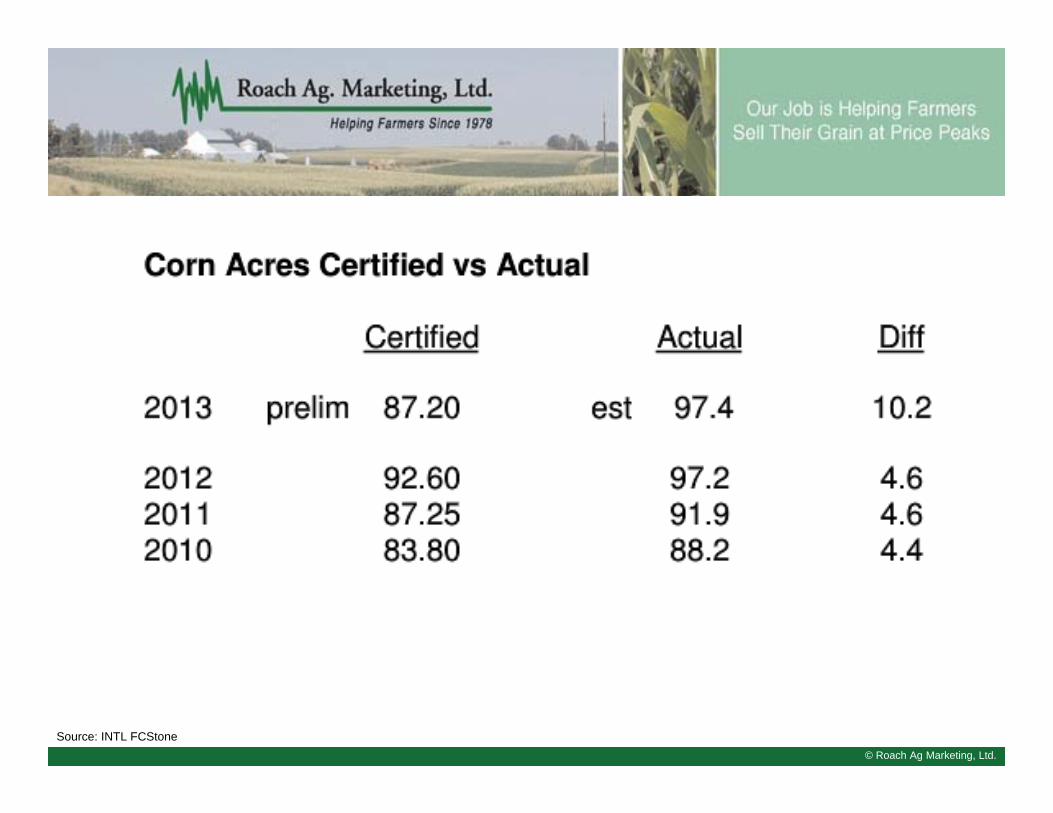
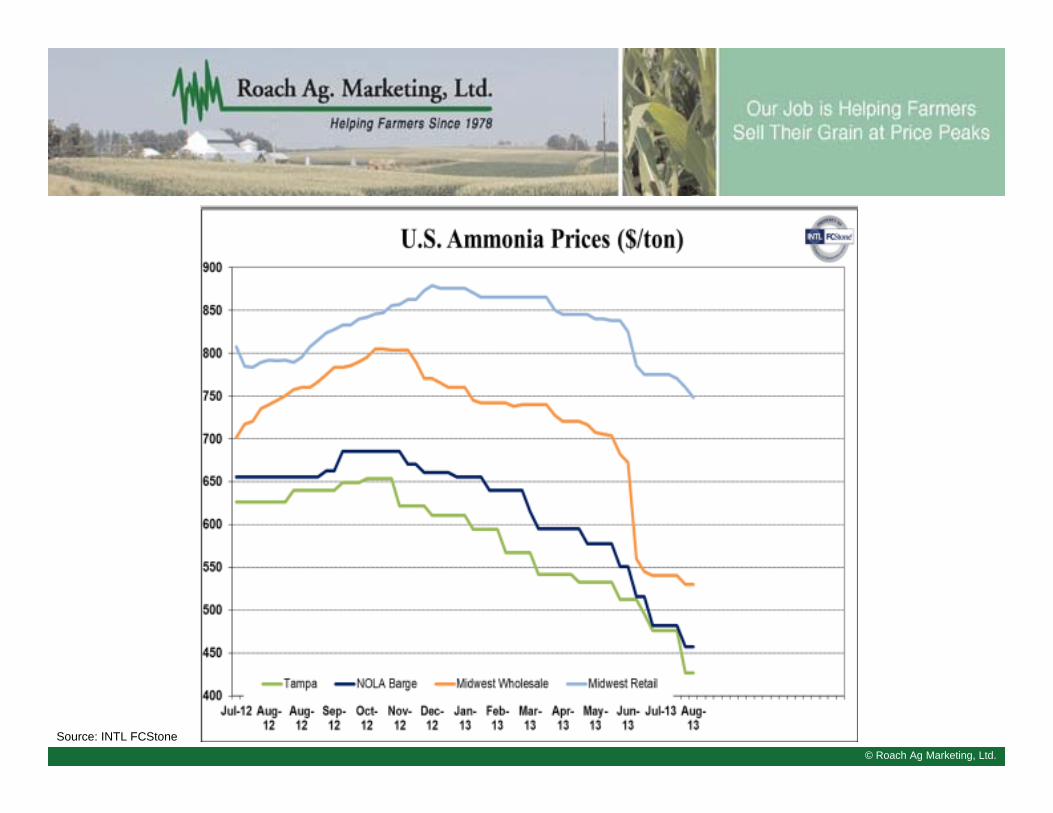
Source: INTL FCStone
© Roach Ag Marketing, Ltd.
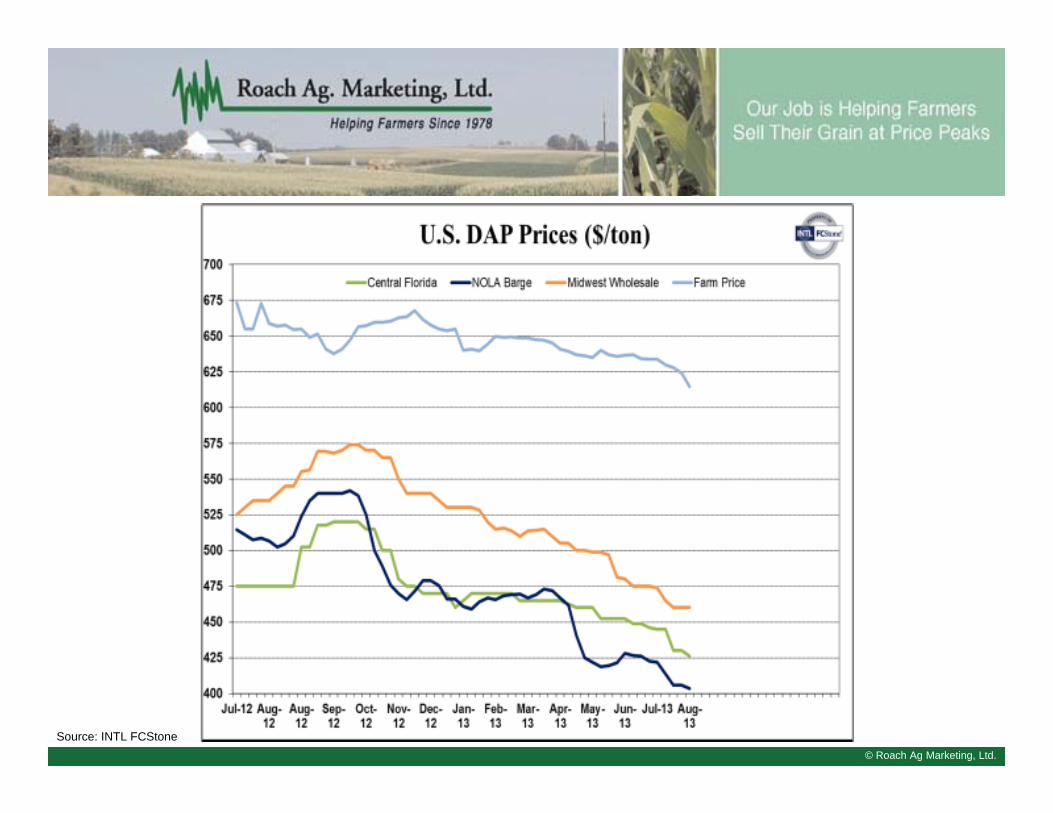
Source: INTL FCStone
© Roach Ag Marketing, Ltd.
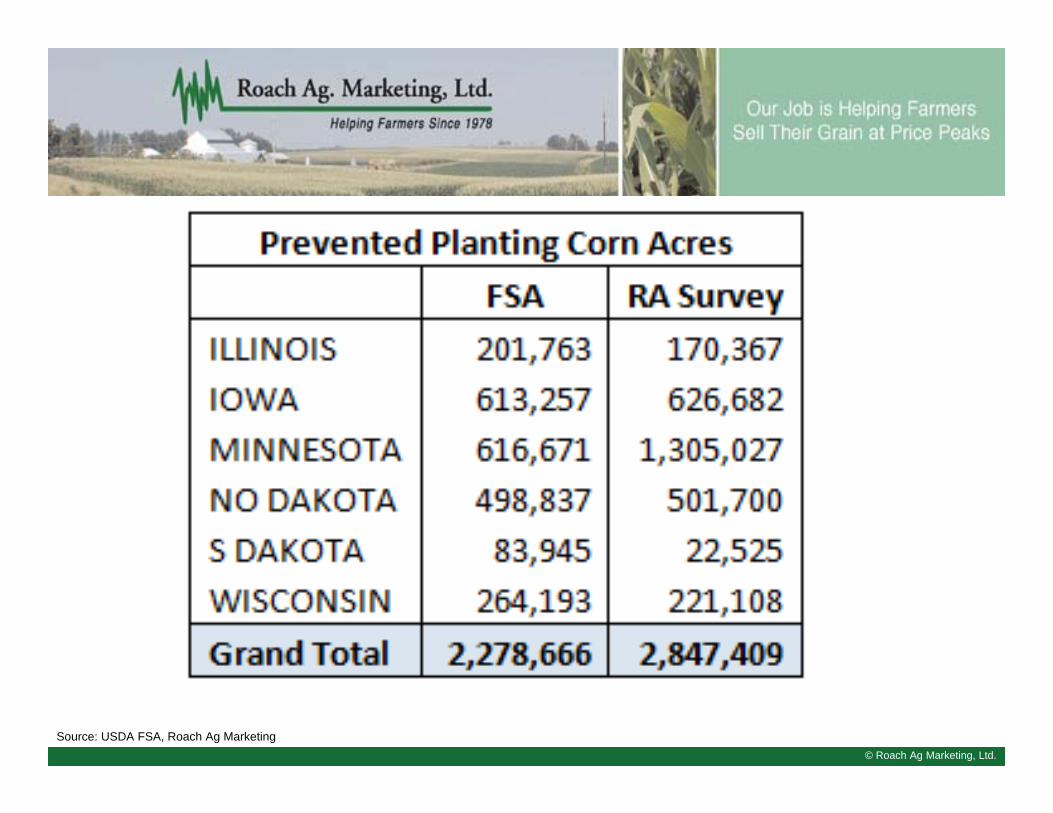
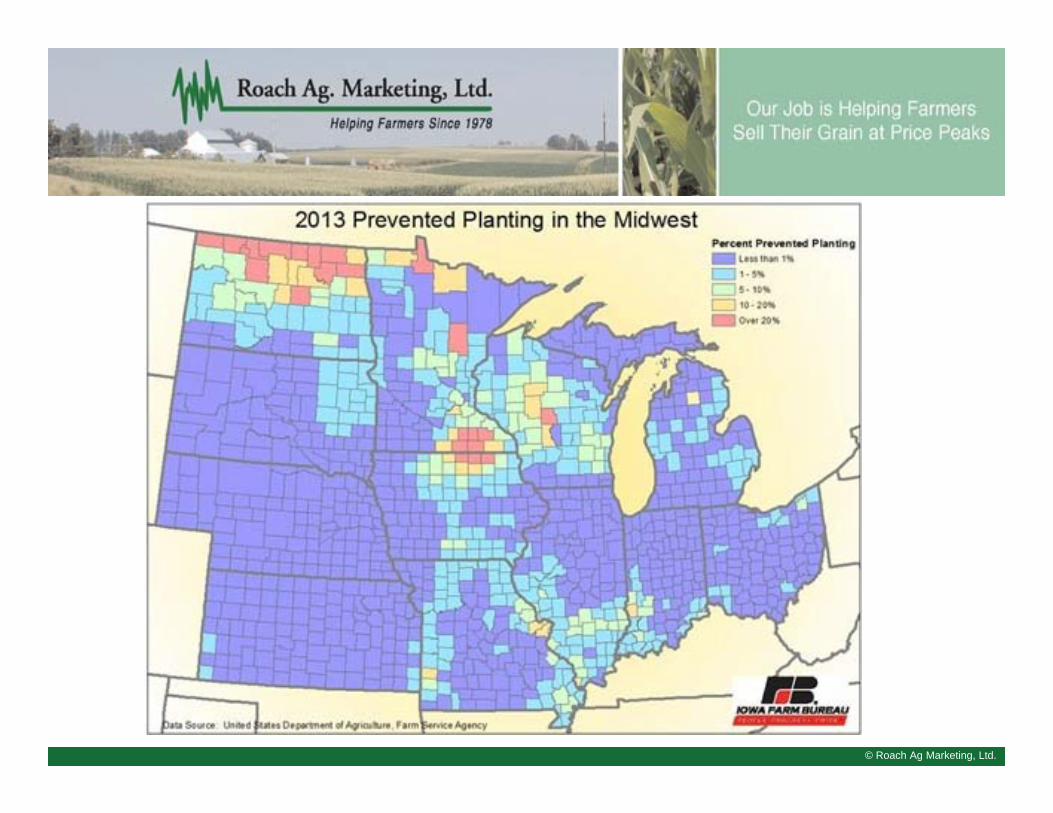
Source: USDA FSA, Roach Ag Marketing
© Roach Ag Marketing, Ltd.Source: USDA; NOAA
© Roach Ag Marketing, Ltd.
© Roach Ag Marketing, Ltd.Source: NOAA
30-Day Percent of Normal Precipitation
Key western bean areas have been dry
© Roach Ag Marketing, Ltd.Source: NOAA
60-Day Percent of Normal Precipitation
© Roach Ag Marketing, Ltd.
10
20
30
40
50
60
70
80
90
WEEK#20
WEEK#21
WEEK#22
WEEK#23
WEEK#24
WEEK#25
WEEK#26
WEEK#27
WEEK#28
WEEK#29
WEEK#30
WEEK#31
WEEK#32
WEEK#33
WEEK#34
WEEK#35
WEEK#36
WEEK#37
WEEK#38
WEEK#39
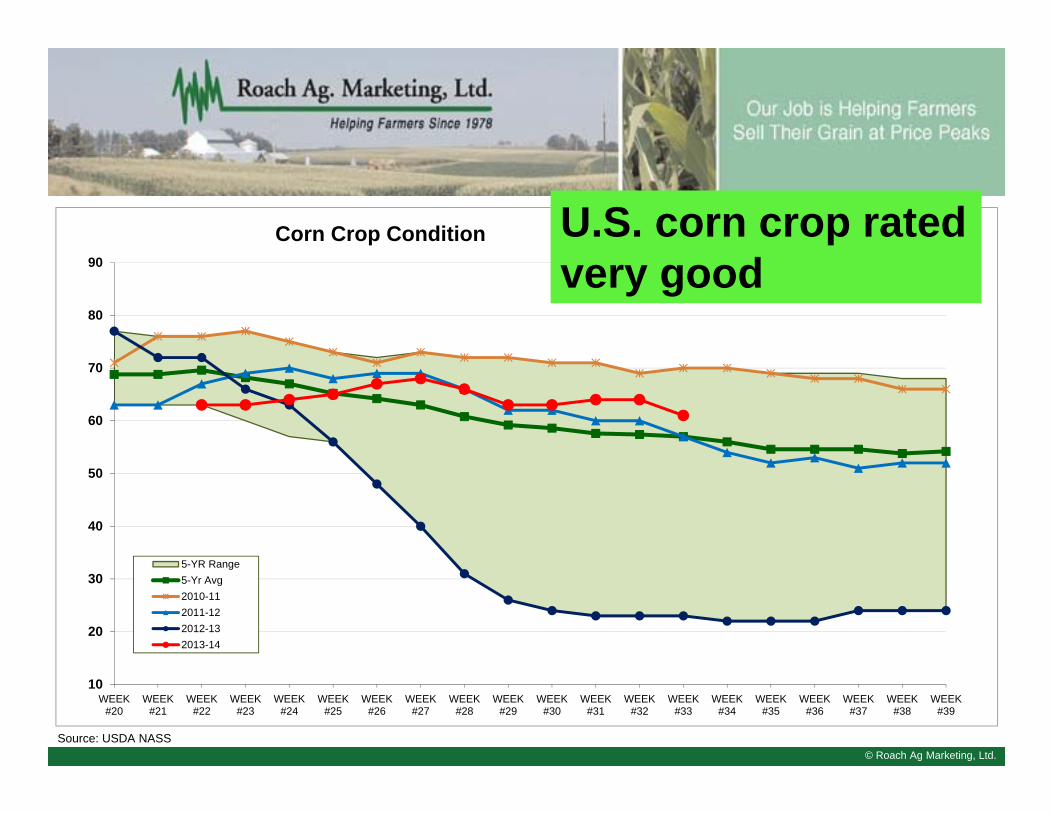
Corn Crop Condition
5-YR Range5-Yr Avg2010-112011-122012-132013-14
© Roach Ag Marketing, Ltd.Source: USDA NASS
U.S. corn crop rated very good
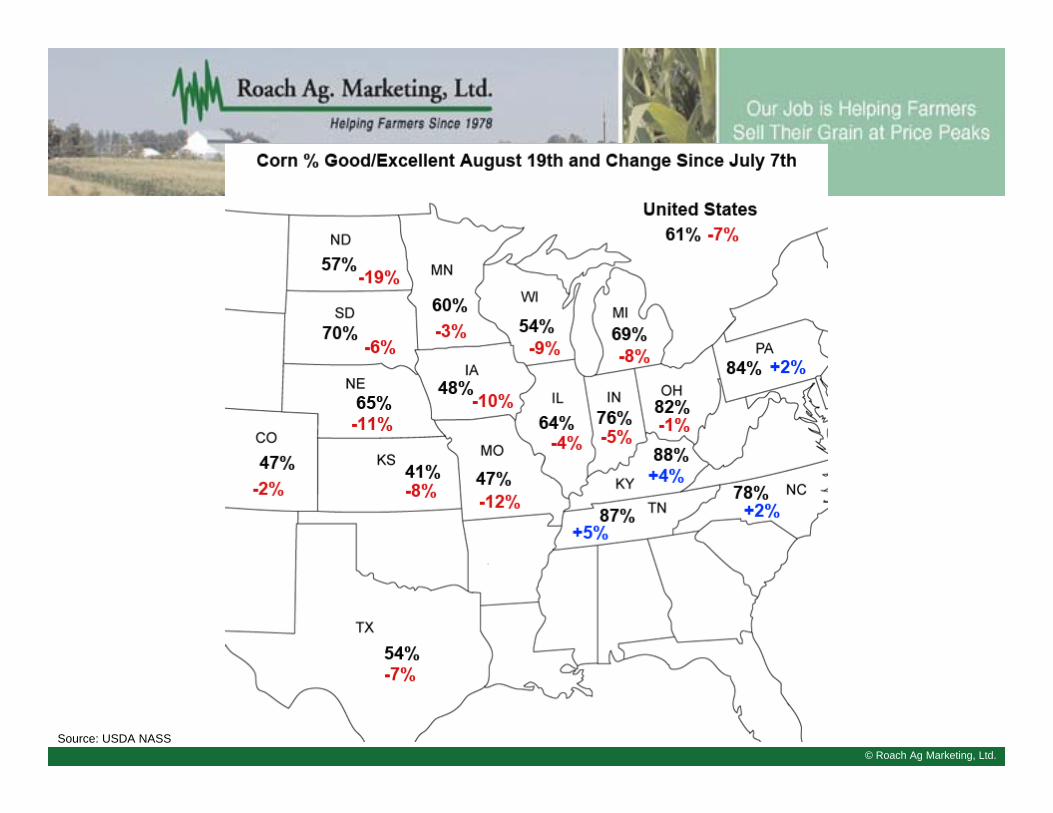
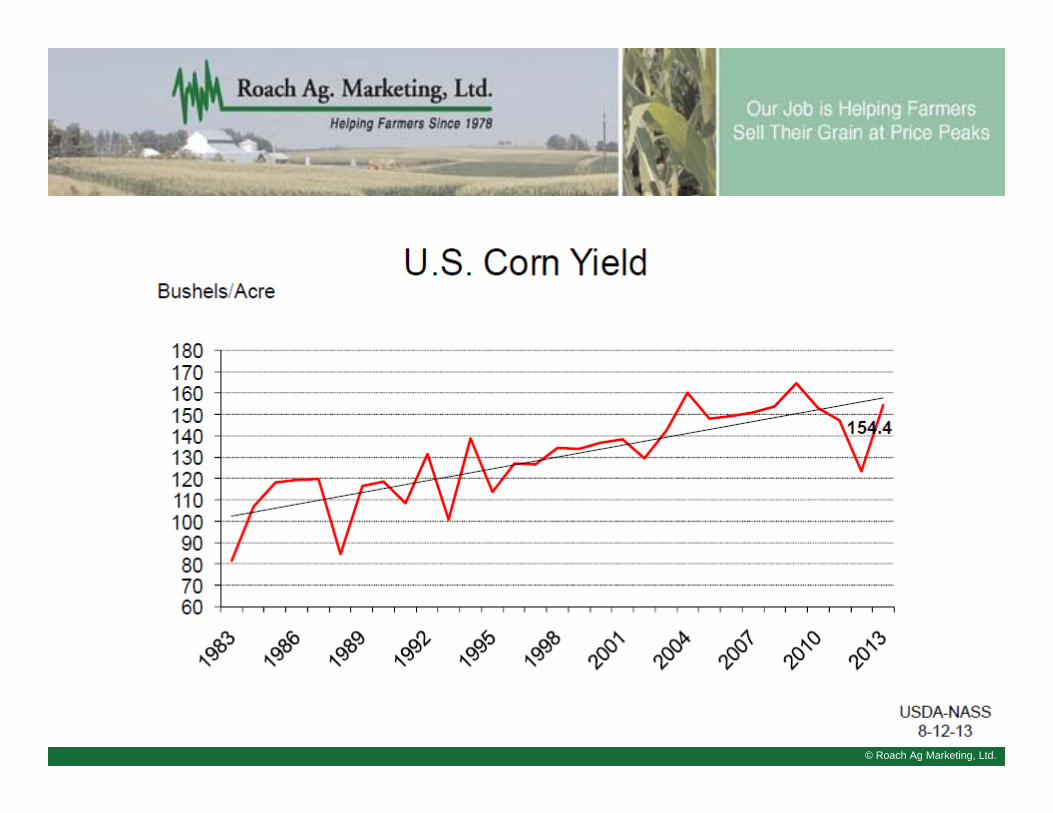
© Roach Ag Marketing, Ltd.Source: USDA NASS
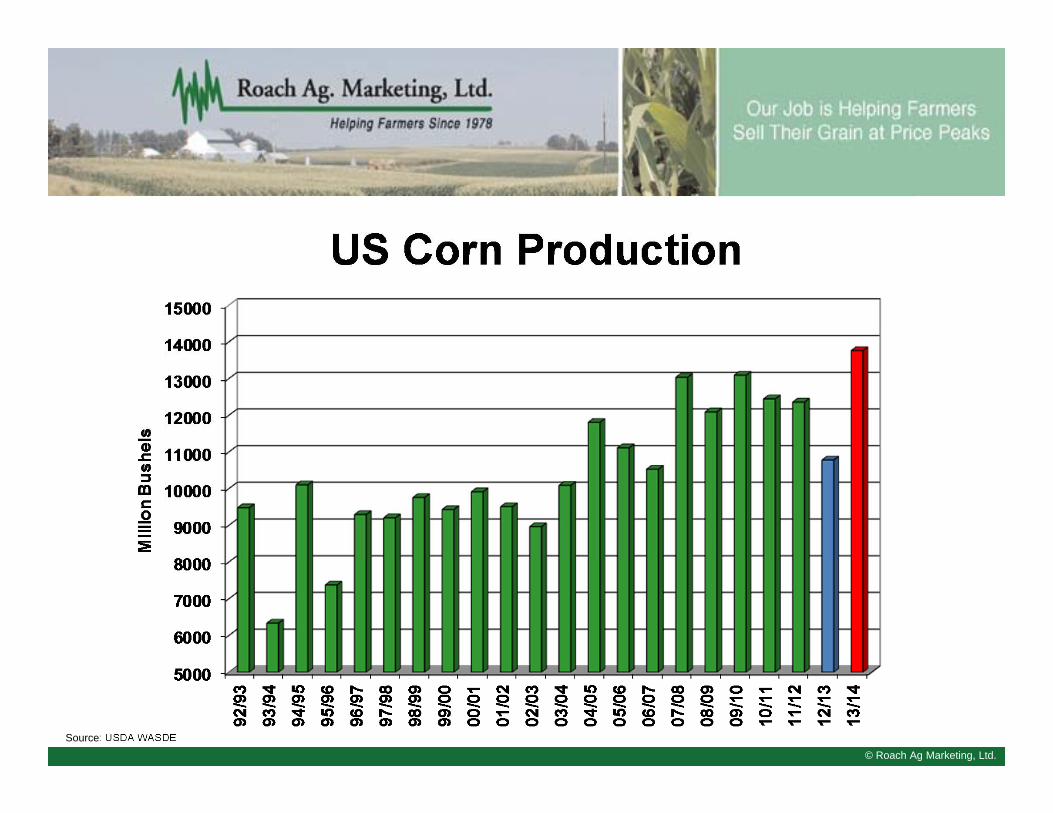
© Roach Ag Marketing, Ltd.Source: USDA WASDE
© Roach Ag Marketing, Ltd.
Source: INTL FCStone
© Roach Ag Marketing, Ltd.
Source: INTL FCStone
© Roach Ag Marketing, Ltd.
Source: INTL FCStone
© Roach Ag Marketing, Ltd.Source: USDA WASDE
© Roach Ag Marketing, Ltd.Source: USDA WASDE
© Roach Ag Marketing, Ltd.Source: USDA WASDE
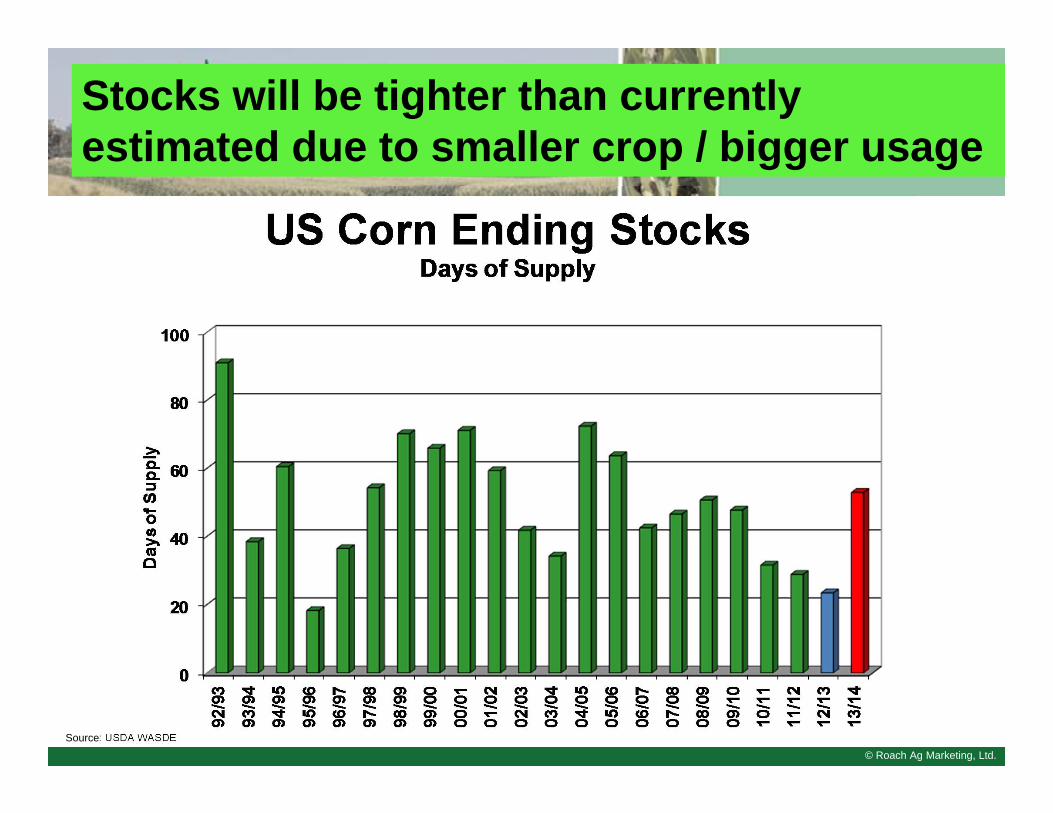
Stocks will be tighter than currently estimated due to smaller crop / bigger usage
© Roach Ag Marketing, Ltd.
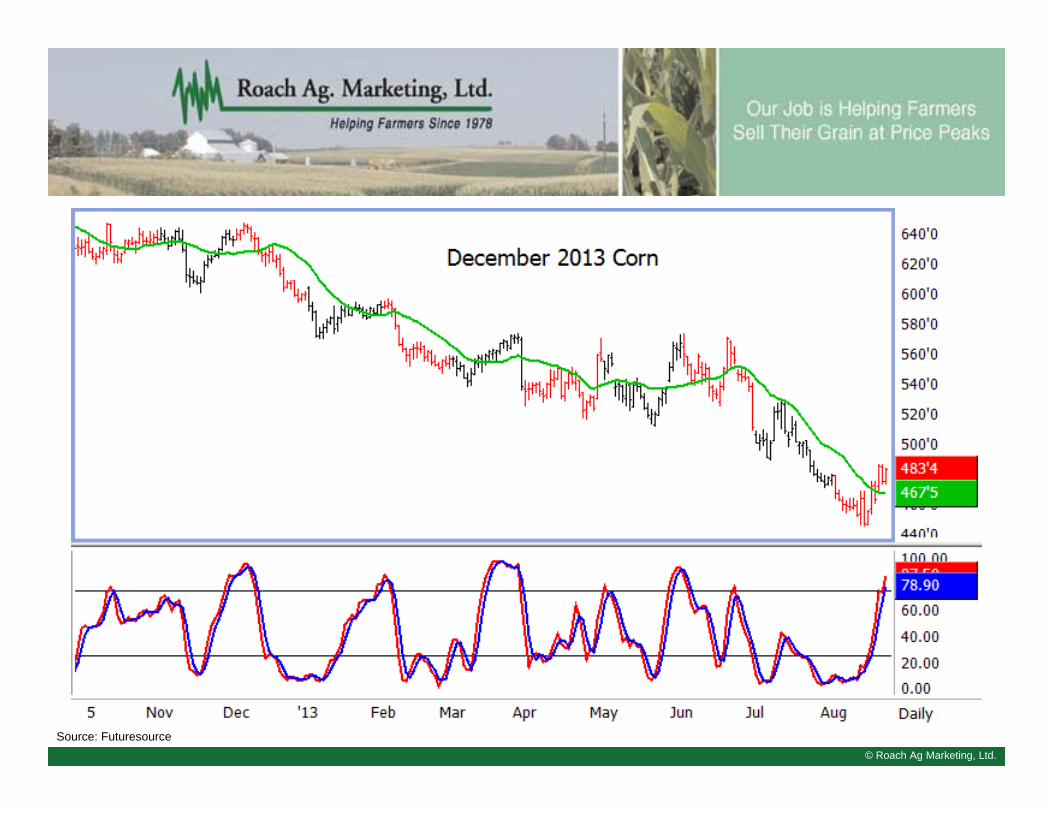
Source: Futuresource
© Roach Ag Marketing, Ltd.
Source: INTL FCStone
© Roach Ag Marketing, Ltd.
Source: INTL FCStone
© Roach Ag Marketing, Ltd.
Source: INTL FCStone
© Roach Ag Marketing, Ltd.
Source: INTL FCStone
© Roach Ag Marketing, Ltd.
Source: INTL FCStone
© Roach Ag Marketing, Ltd.Source: USDA
© Roach Ag Marketing, Ltd.Source: USDA WASDE
500.0
525.0
550.0
575.0
600.0
625.0
650.0
675.0
700.0
1991
/92
1992
/93
1993
/94
1994
/95
1995
/96
1996
/97
1997
/98
1998
/99
1999
/00
2000
/01
2001
/02
2002
/03
2003
/04
2004
/05
2005
/06
2006
/07
2007
/08
2008
/09
2009
/10
2010
/11
2011
/12
2012
/13
2013
/14
Mill
ion
Tons
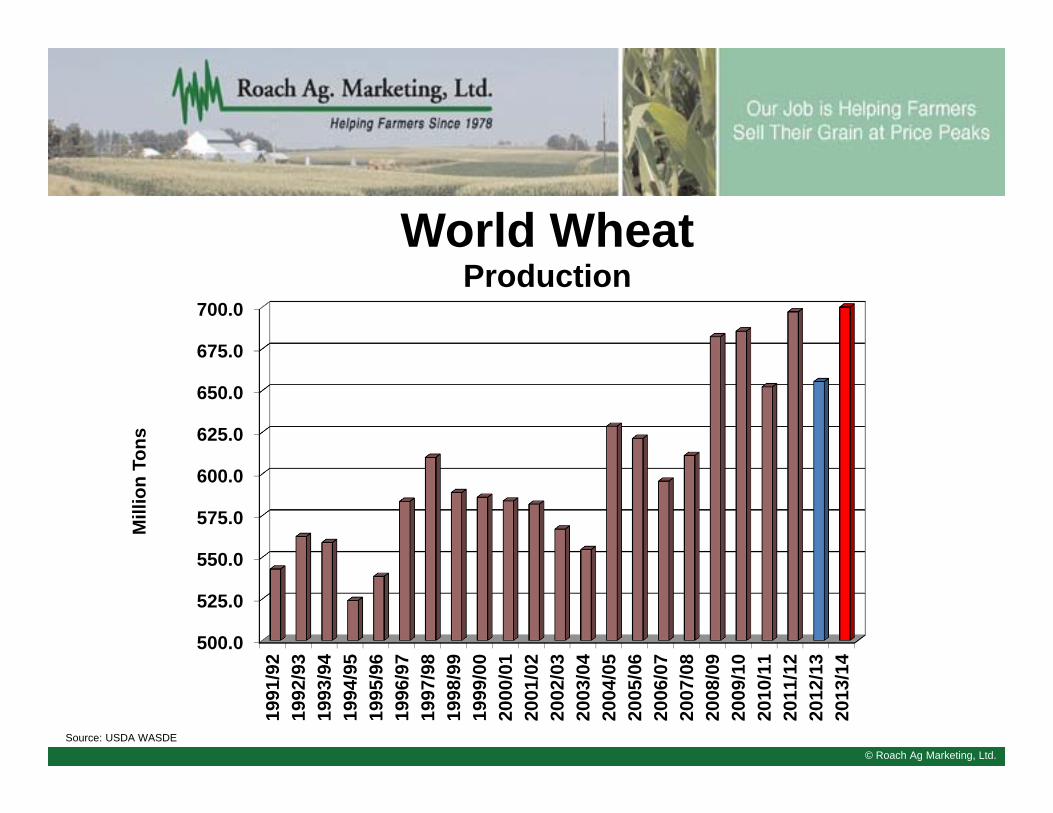
World WheatProduction
© Roach Ag Marketing, Ltd.Source: USDA NASS
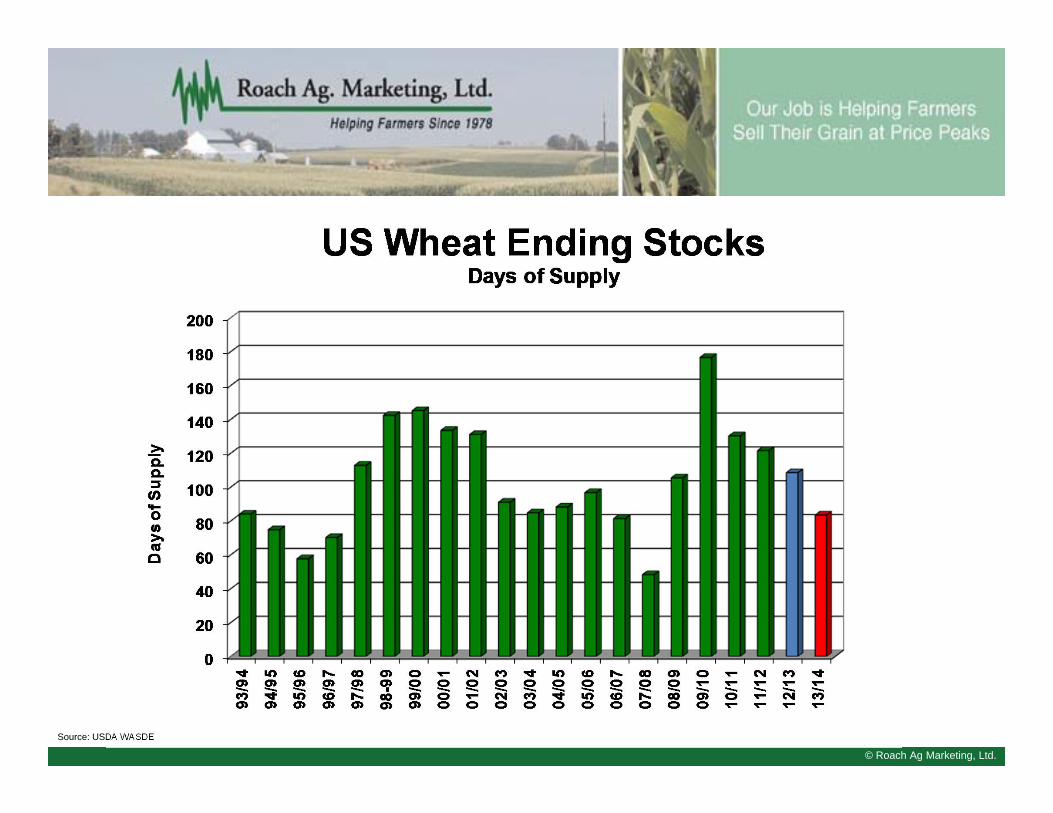
Source: USDA WASDE
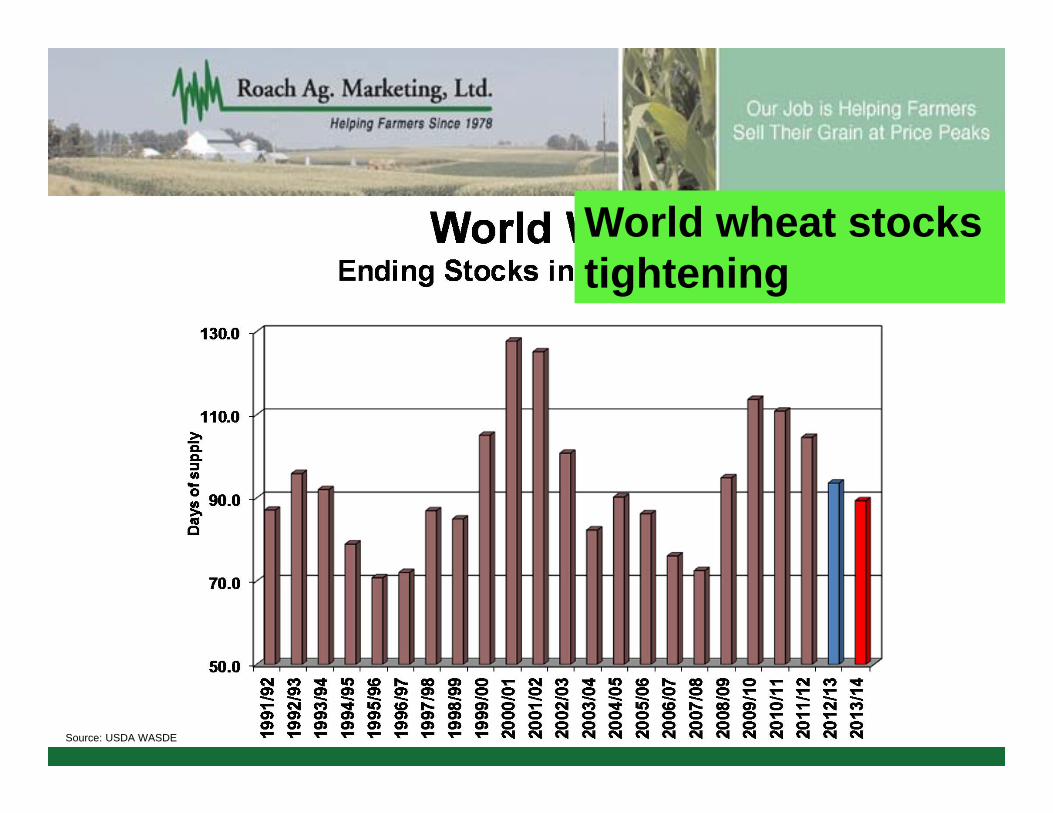
World wheat stocks tightening
© Roach Ag Marketing, Ltd.Source: USDA WASDE
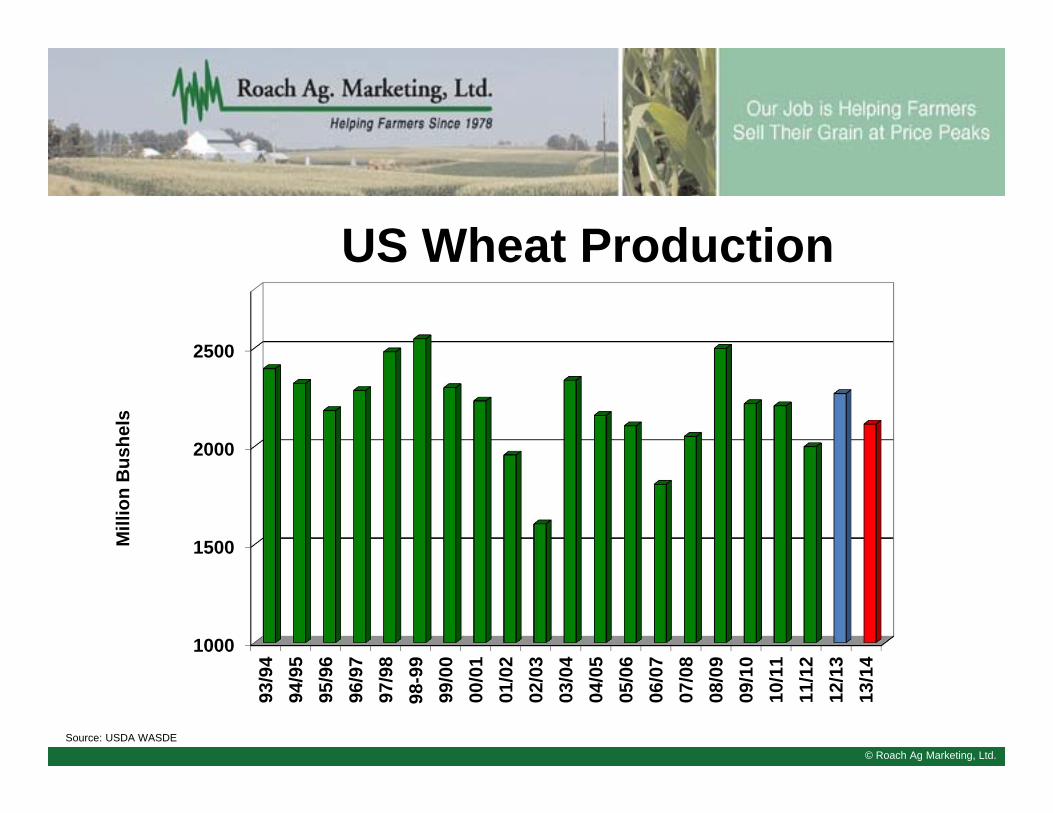
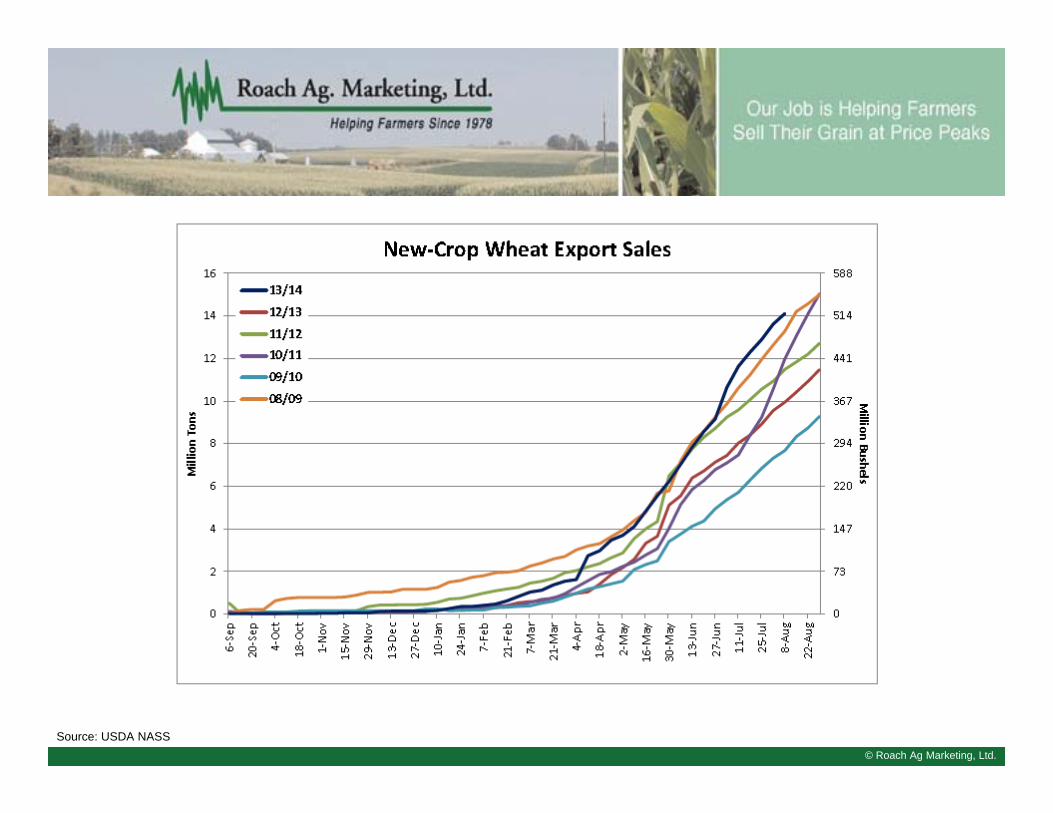
1000
1500
2000
2500
93/9
494
/95
95/9
696
/97
97/9
898
-99
99/0
000
/01
01/0
202
/03
03/0
404
/05
05/0
606
/07
07/0
808
/09
09/1
010
/11
11/1
212
/13
13/1
4
Mill
ion
Bus
hels
US Wheat Production
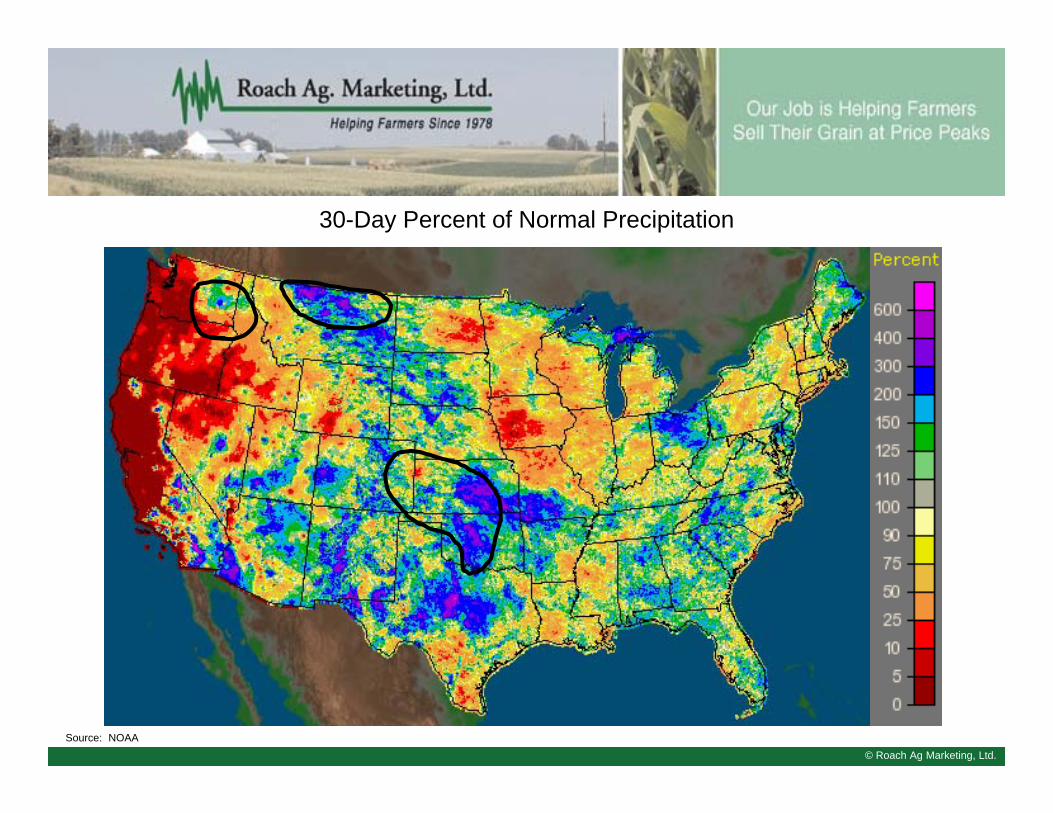
© Roach Ag Marketing, Ltd.Source: USDA; NOAA
© Roach Ag Marketing, Ltd.Source: NOAA
30-Day Percent of Normal Precipitation

© Roach Ag Marketing, Ltd.Source: NOAA
60-Day Percent of Normal Precipitation
© Roach Ag Marketing, Ltd.
Source: USDA WASDE
© Roach Ag Marketing, Ltd.
Source: USDA NASS
Source: USDA WASDE
© Roach Ag Marketing, Ltd.
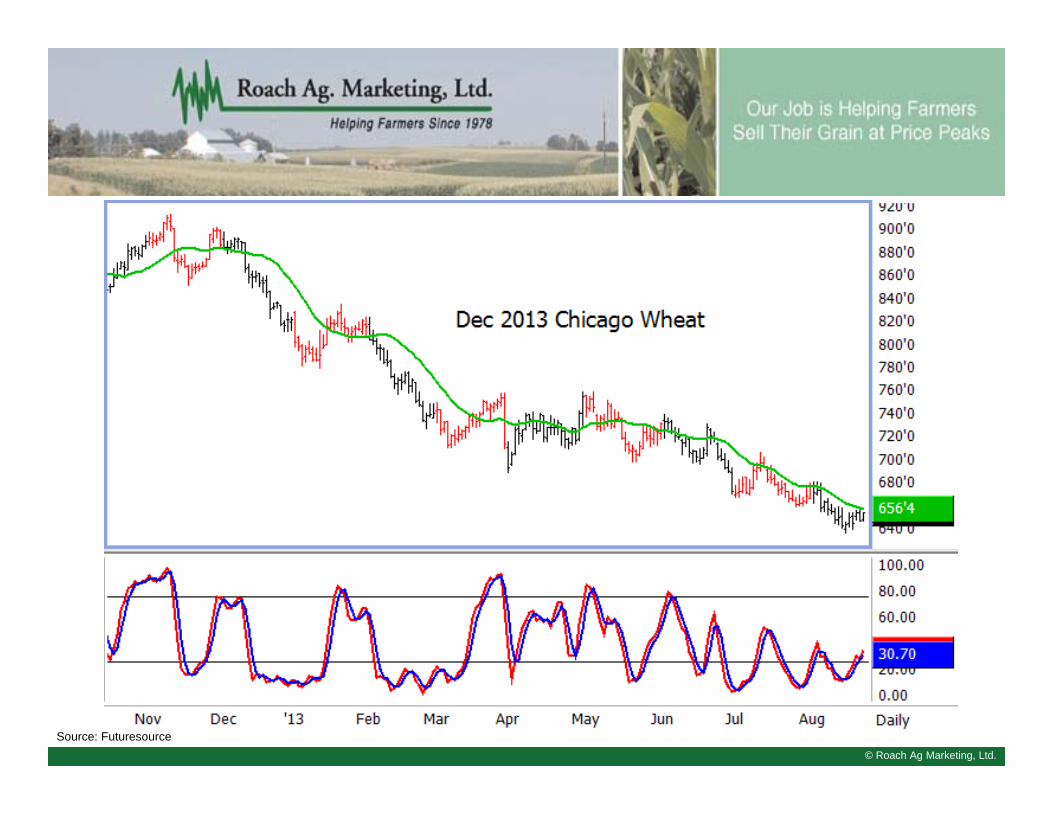
© Roach Ag Marketing, Ltd.
Source: Futuresource
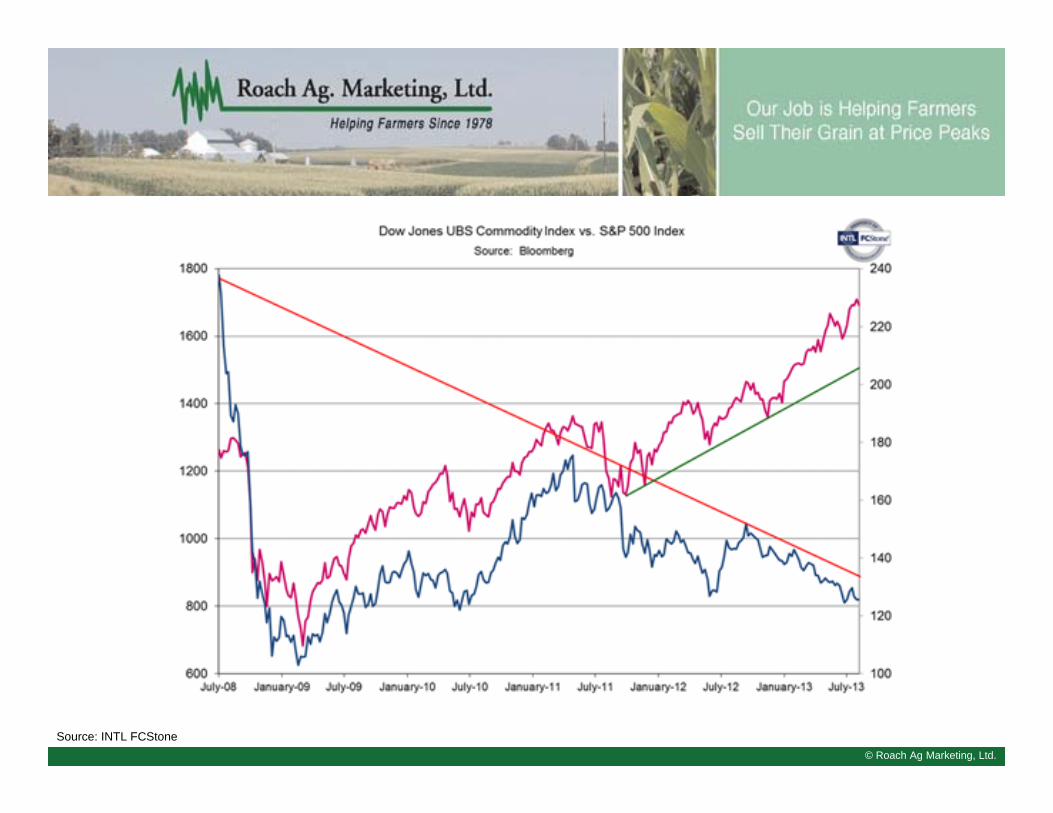
Money Flow has been“Negative Grains”
© Roach Ag Marketing, Ltd.
© Roach Ag Marketing, Ltd.
Source: INTL FCStone
© Roach Ag Marketing, Ltd.
How Should U.S. Farmers Market Their Crops in
2013 - 14
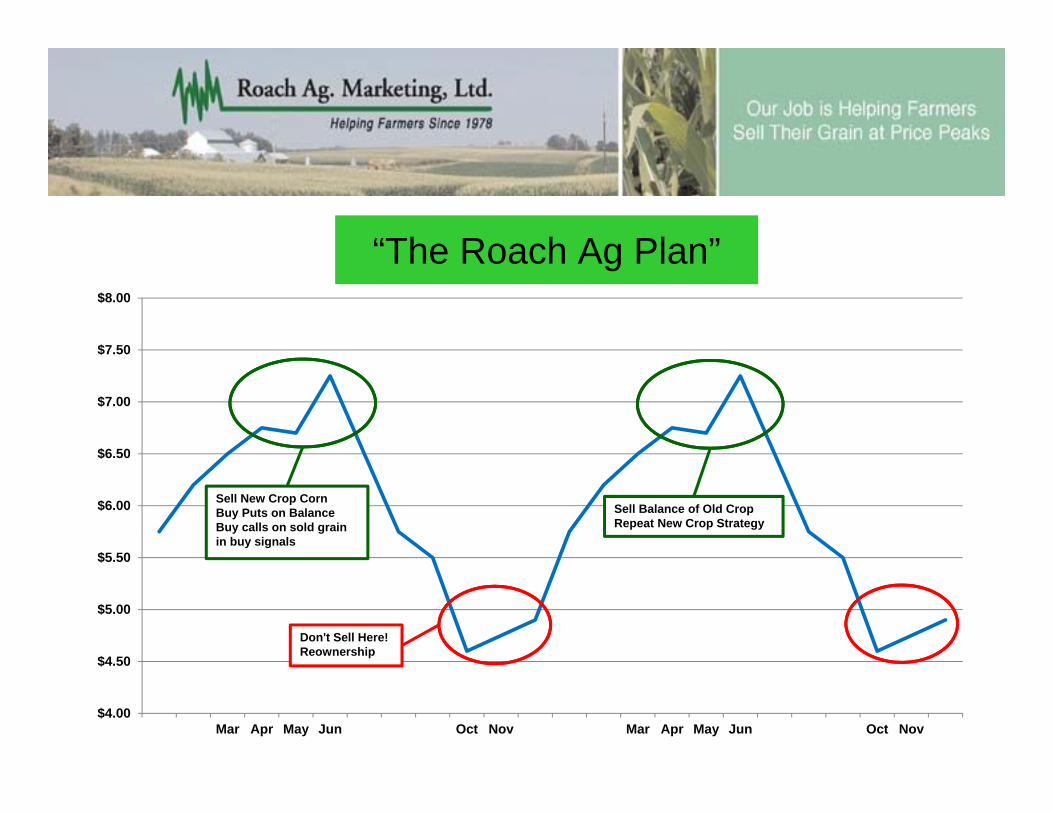
“The Roach Ag Plan”
$4.00
$4.50
$5.00
$5.50
$6.00
$6.50
$7.00
$7.50
$8.00
Mar Apr May Jun Oct Nov Mar Apr May Jun Oct Nov
Sell New Crop CornBuy Puts on BalanceBuy calls on sold grain in buy signals
Sell Balance of Old CropRepeat New Crop Strategy
Don't Sell Here!Reownership
© Roach Ag Marketing, Ltd.
•Focus the majority of sales in the 1st half of the year
•Best Prices Usually Occur in March to June

© Roach Ag Marketing, Ltd.
Sell only when markets are giving us a Roach Ag Sell Signal
© Roach Ag Marketing, Ltd.
Roach Ag Marketing, Ltd.
568 East Yamato RoadSuite 200
Boca Raton, FL 33431
+1-561-994-9394
[email protected]://www.roachag.com