Embed Size (px)
Citation preview
EXECUTIVE SUMMARY
APRIL 2016
URBAN WORLD: THE GLOBAL CONSUMERS TO WATCH
Copyright © McKinsey & Company 2016
In the 25 years since its founding, the McKinsey Global Institute (MGI) has sought to develop a deeper understanding of the evolving global economy. As the business and economics research arm of McKinsey & Company, MGI aims to provide leaders in the commercial, public, and social sectors with the facts and insights on which to base management and policy decisions. The Lauder Institute at the University of Pennsylvania ranked MGI the world’s number-one private-sector think tank in its 2015 Global Think Tank Index.
MGI research combines the disciplines of economics and management, employing the analytical tools of economics with the insights of business leaders. Our “micro-to-macro” methodology examines microeconomic industry trends to better understand the broad macroeconomic forces affecting business strategy and public policy. MGI’s in-depth reports have covered more than 20 countries and 30 industries. Current research focuses on six themes: productivity and growth, natural resources, labor markets, the evolution of global financial markets, the economic impact of technology and innovation, and urbanization.
Recent reports have assessed the economic benefits of tackling gender inequality, a new era of global competition, Chinese innovation, and digital globalization.
MGI is led by three McKinsey & Company directors: Jacques Bughin, James Manyika, and Jonathan Woetzel. Michael Chui, Susan Lund, Anu Madgavkar, and Jaana Remes serve as MGI partners. Project teams are led by the MGI partners and a group of senior fellows, and include consultants from McKinsey & Company’s offices around the world. These teams draw on McKinsey & Company’s global network of partners and industry and management experts. In addition, leading economists, including Nobel laureates, act as research advisers.
The partners of McKinsey & Company fund MGI’s research; it is not commissioned by any business, government, or other institution. For further information about MGI and to download reports, please visit www.mckinsey.com/mgi.
Richard Dobbs | London
Jaana Remes | San Francisco
James Manyika | San Francisco
Jonathan Woetzel | Shanghai
Jesko Perrey | Düsseldorf
Greg Kelly | Atlanta
Kanaka Pattabiraman | Silicon Valley
Hemant Sharma | San Francisco
APRIL 2016
URBAN WORLD: THE GLOBAL CONSUMERS TO WATCH
IN BRIEF
URBAN WORLD: THE GLOBAL CONSUMERS TO WATCH As world population growth slows, global consumption growth—the demand that fuels much of the world’s economic expansion—will depend heavily on how much each individual spends. Knowing which consumers are likely to be spending robustly, where they are, and what products and services they prefer to purchase becomes even more important for companies, policy makers, and investors.
� Until the turn of the century, more than half of global consumption growth came from an expanding number of consumers in the world. In the period to 2030, population growth will generate only 25 percent of global consumption growth with the rest coming from rising per capita consumption. For decades, companies serving consumer markets could rely on expanding numbers in most segments—but no longer.
� Nine groups of urban consumers are projected to generate three-quarters of global urban consumption growth from 2015 to 2030—and just three groups about half of that growth:
— Developed retiring and elderly (60-plus years in developed regions). This group will grow by more than one-third, from 164 million in 2015 to 222 million in 2030. It will generate 51 percent of urban consumption growth in developed countries, and 19 percent of global urban consumption growth.
— China’s working-age consumers (15 to 59 years). Their number will expand by 20 percent—an additional 100 million people. Their per capita consumption is expected to more than double. By 2030, they will spend 12 cents of every $1 of worldwide urban consumption.
— North America’s working-age consumers (15 to 59 years). The already large numbers and per capita consumption of this group will grow modestly by 7 percent and 24 percent, respectively, from 2015 to 2030. Many younger consumers are under income pressure and are cost conscious in their spending.
� Consumption is shifting toward services, reflecting two trends: heavy spending on health care among aging consumers in developed regions, and increasing spending by consumers in emerging economies as their incomes rise to thresholds where consumption of services such as communications, transport, restaurants, and catering takes off.
� Cities matter. By 2030, consumers in large cities will account for 81 percent of global consumption and generate 91 percent of global consumption growth from 2015 to 2030. Global urban consumption is extraordinarily concentrated—just 32 cities are likely to generate one-quarter of the $23 trillion in urban consumption growth projected from 2015 to 2030, and 100 cities will be responsible for 45 percent of that growth.
� Consumption and growth are now coming under pressure in many cities as population growth slows and urbanization plateaus in many countries. Six percent of large cities—most of them in developed regions—are already experiencing declining populations. However, others, particularly in emerging economies, continue to grow, and will be home to rising numbers of consumers to watch. Roughly 700 large cities in China alone will account for $7 trillion, or 30 percent, of global urban consumption growth to 2030.
� Companies need to understand how shifting demographics impact their organization’s footprint. If that footprint doesn’t match the most promising consumer markets, they may need to adjust their strategy. Knowing which cities—and even neighborhoods within cities—are home to key consumers of the future will matter. Companies need to navigate their way through arguably the most diverse consumer markets in history, managing parallel products and channels for increasingly disparate consumer groups. And, finally, the growing importance of services needs to be factored into the thinking of all consumer-facing businesses.
TAKEAWAYS Footprint matters in a shifting consumer landscape.
Companies with the skills to manage increasing complexity can prosper.
Look closely at services as they grow in importance.
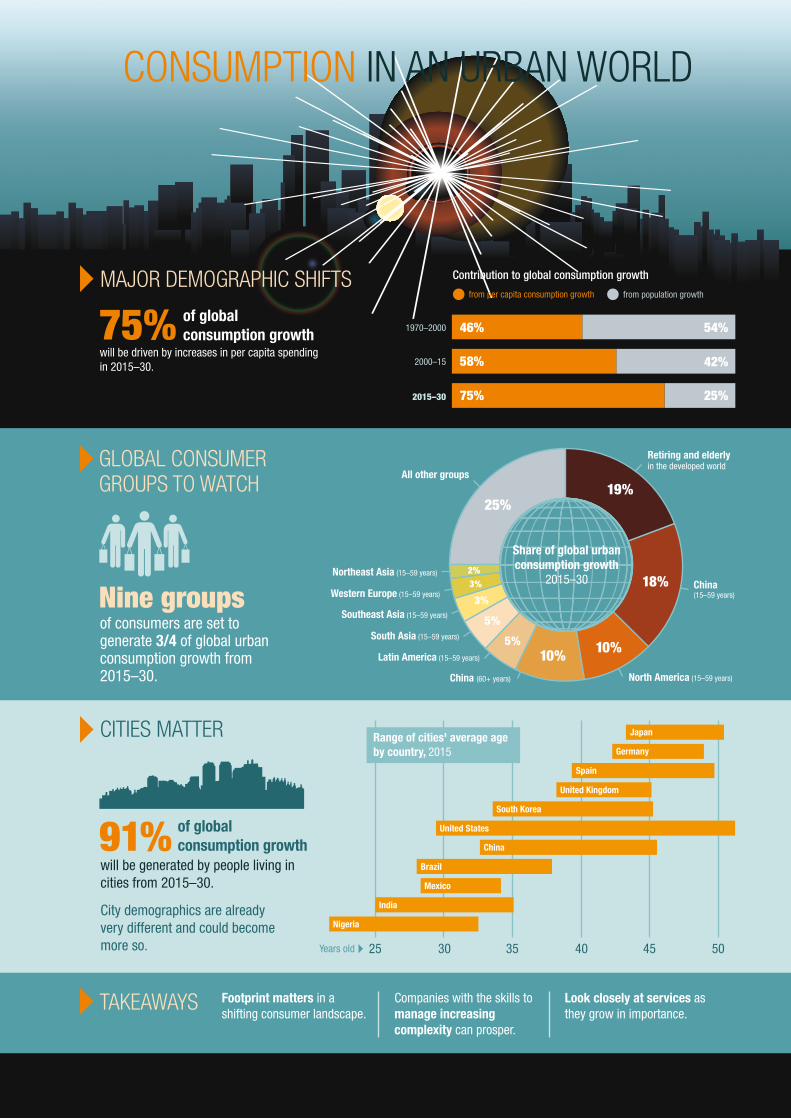
Nigeria
India
Mexico
Brazil
China
United States
South Korea
Spain
United Kingdom
Germany
Japan
25Years old 30 35 40 45 50
Range of cities' average age by country, 2015
City demographics are already very different and could become more so.
will be generated by people living in cities from 2015–30.
CITIES MATTER
of globalconsumption growth 91%
25%19%
18%
10%10%5%
5%
3%
3%2%
Retiring and elderly in the developed world
All other groups
China(15–59 years)
China (60+ years)
South Asia (15–59 years)
Latin America (15–59 years)
Southeast Asia (15–59 years)
Western Europe (15–59 years)
Northeast Asia (15–59 years)
North America (15–59 years)
Share of global urban consumption growth
2015–30
of consumers are set to generate 3/4 of global urban consumption growth from 2015–30.
GLOBAL CONSUMER GROUPS TO WATCH
Nine groups
from per capita consumption growth from population growth
Contribution to global consumption growth
1970–2000
2000–15
2015–30
42%
54%
25%
58%
46%
75%
of globalconsumption growth
will be driven by increases in per capita spending in 2015–30.
MAJOR DEMOGRAPHIC SHIFTS
75%
CONSUMPTION IN AN URBAN WORLD

viii McKinsey Global Institute
© Getty Images
EXECUTIVE SUMMARY
Shifting demographics are causing a major rebalancing of the engines of global consumption. In the past, an expanding population was a main driver of consumption growth, but now the pace of the world’s population growth is waning. That means that consumption growth in the period to 2030 will depend overwhelmingly on individuals spending more. It is now even more important to know which consumers will have the purchasing power and the inclination to spend, where they are, and what they want to buy.
This research finds that just nine groups of “consumers to watch” are projected to generate three-quarters of global urban consumption growth from 2015 to 2030. Of these, just three groups have the scale and spending power to reshape global demand and the world economy. Together, the 60-plus age group in developed economies; those of working age in China, an age group that, by 2030, will consist of those born and raised since China reformed and opened up its economy; and the working-age population of North America, are expected to generate half of urban consumption growth to 2030.
The urban world is overwhelmingly where consumption takes place. By 2030, consumers in large cities—accounting for 50 percent of the global population in 2030—will generate 81 percent of global consumption and 91 percent of global consumption growth.1 However, the demographic profiles and therefore growth prospects of cities are now diverging. Some cities are continuing to expand their populations and can expect robust consumption growth while others are already experiencing declining populations—6 percent of all large cities—potentially putting their consumption under pressure. Over the next 15 years, 17 percent of cities in developed regions will be in this situation, and 8 percent of cities globally. Over half of the world’s large cities will have fewer young adults (15- to 29-year-olds) than they have today.
Patterns of consumption are becoming more varied and complex—there is no such thing, if there ever was, as an average consumer in an average market. Emerging economies with richly varied incomes, cultures, and spending habits are becoming ever more prominent features on the global consumption landscape as incomes rise. At the same time, income inequality is rising in many countries, which means that companies face the challenge of attracting customers at very different price points. The weight of global consumption is shifting toward services, reflecting the aging of key consumer segments in developed economies and rising incomes in emerging economies. And cities, already very different in their consumer profiles, could diverge even further from one another as population growth slows.
In the face of this ferment of change, companies need to arm themselves with deep knowledge about the geography of consumers as well as the structural drivers of their spending, from ethnic and income trends to the changing timing of major life decisions such as getting married and having children. In North America, for instance, the median age at which a first marriage takes place has moved from the age of 22 for the generation born between 1940 and 1954 to 28 for those born after 1985. This shift alone explains much of the decline in house ownership among young adults.
1 We define cities as broader metropolitan areas that include both a core city and surrounding metropolitan regions integrated into a connected urban region. Large cities include metropolitan areas with 150,000 or more inhabitants in developed regions, and 200,000 or more inhabitants in developing regions.
2 McKinsey Global Institute Executive summary
This report draws on a new global consumer model incorporated into McKinsey Global Institute’s Cityscope database to map the evolution of global urban consumption from 2015 to 2030. Using both projections for population growth among different age segments and age-specific consumption patterns at a country level, we compare large consumer groups across the globe across age groups, countries, and cities and describe the major consumption shifts to watch in the next 15 years.2
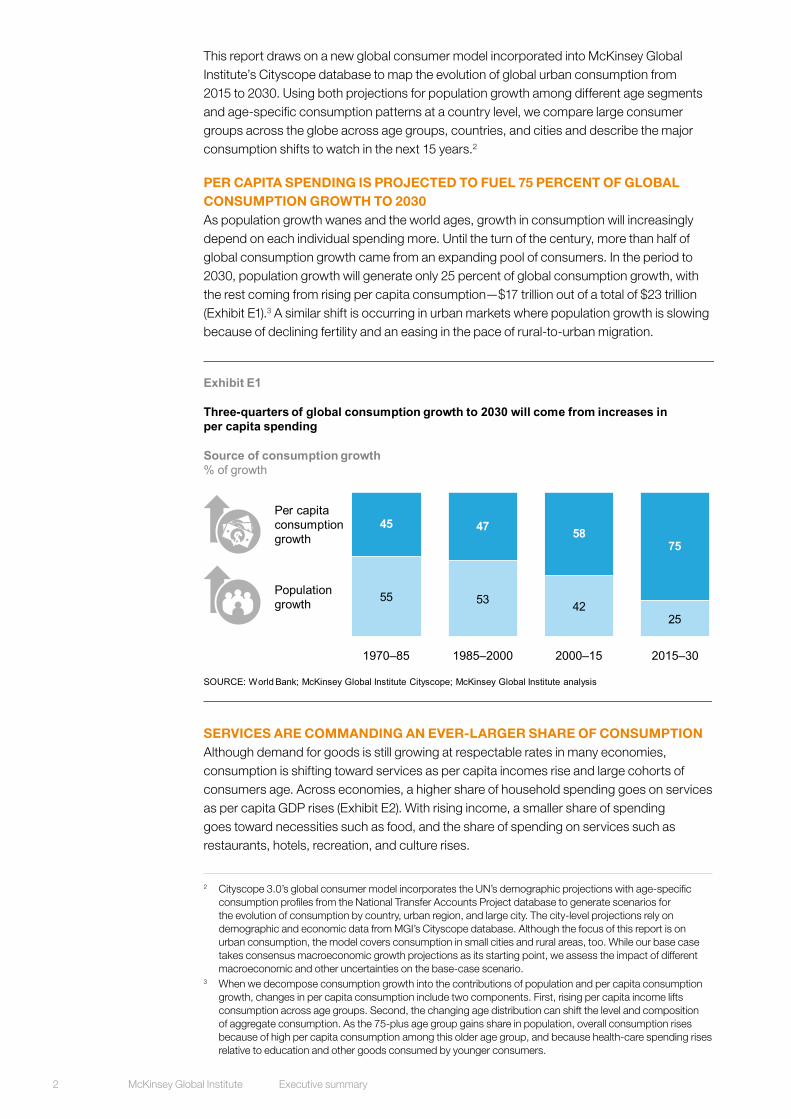
PER CAPITA SPENDING IS PROJECTED TO FUEL 75 PERCENT OF GLOBAL CONSUMPTION GROWTH TO 2030 As population growth wanes and the world ages, growth in consumption will increasingly depend on each individual spending more. Until the turn of the century, more than half of global consumption growth came from an expanding pool of consumers. In the period to 2030, population growth will generate only 25 percent of global consumption growth, with the rest coming from rising per capita consumption—$17 trillion out of a total of $23 trillion (Exhibit E1).3 A similar shift is occurring in urban markets where population growth is slowing because of declining fertility and an easing in the pace of rural-to-urban migration.
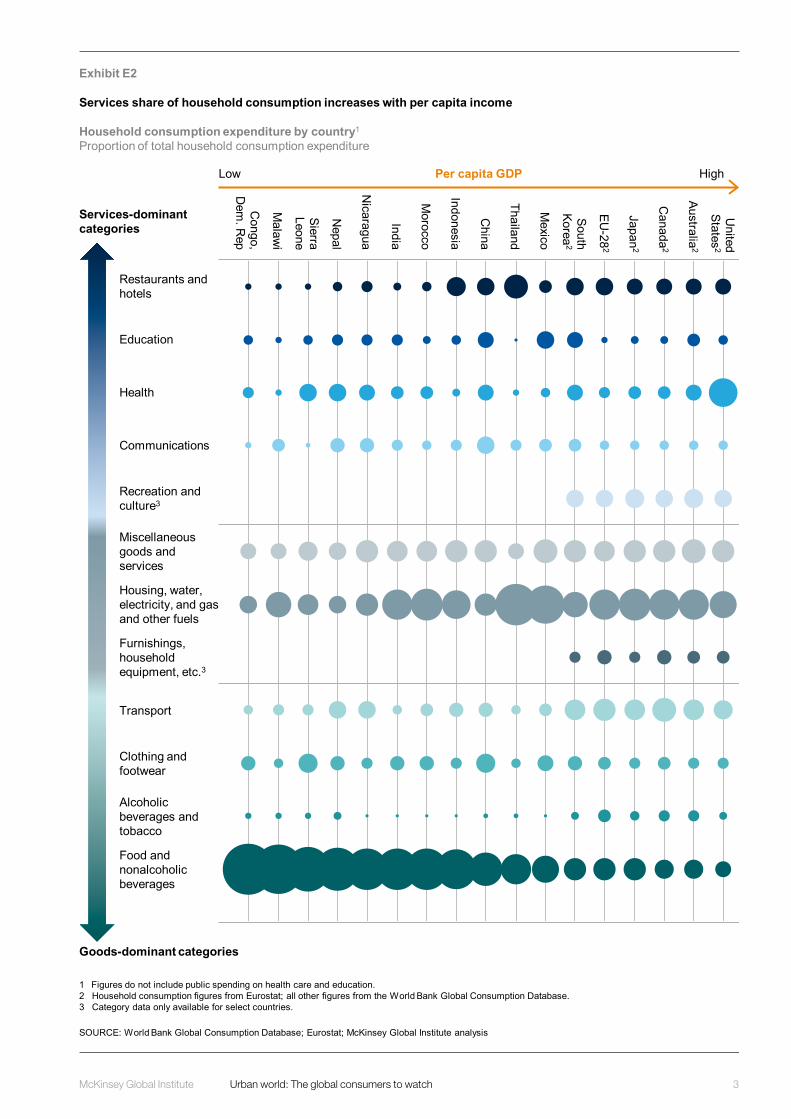
SERVICES ARE COMMANDING AN EVER-LARGER SHARE OF CONSUMPTIONAlthough demand for goods is still growing at respectable rates in many economies, consumption is shifting toward services as per capita incomes rise and large cohorts of consumers age. Across economies, a higher share of household spending goes on services as per capita GDP rises (Exhibit E2). With rising income, a smaller share of spending goes toward necessities such as food, and the share of spending on services such as restaurants, hotels, recreation, and culture rises.
2 Cityscope 3.0’s global consumer model incorporates the UN’s demographic projections with age-specific consumption profiles from the National Transfer Accounts Project database to generate scenarios for the evolution of consumption by country, urban region, and large city. The city-level projections rely on demographic and economic data from MGI’s Cityscope database. Although the focus of this report is on urban consumption, the model covers consumption in small cities and rural areas, too. While our base case takes consensus macroeconomic growth projections as its starting point, we assess the impact of different macroeconomic and other uncertainties on the base-case scenario.
3 When we decompose consumption growth into the contributions of population and per capita consumption growth, changes in per capita consumption include two components. First, rising per capita income lifts consumption across age groups. Second, the changing age distribution can shift the level and composition of aggregate consumption. As the 75-plus age group gains share in population, overall consumption rises because of high per capita consumption among this older age group, and because health-care spending rises relative to education and other goods consumed by younger consumers.
Exhibit E1
Urban world 4Executive summarypw 0329
SOURCE: World Bank; McKinsey Global Institute Cityscope; McKinsey Global Institute analysis
Three-quarters of global consumption growth to 2030 will come from increases in per capita spending
55 53 4225
45 47 5875
Per capitaconsumptiongrowth
Populationgrowth
2015–302000–151985–20001970–85
Source of consumption growth% of growth
REPEATS in report
3McKinsey Global Institute Urban world: The global consumers to watch
Exhibit E2
Services share of household consumption increases with per capita income
SOURCE: World Bank Global Consumption Database; Eurostat; McKinsey Global Institute analysis
1 Figures do not include public spending on health care and education.2 Household consumption figures from Eurostat; all other figures from the World Bank Global Consumption Database.3 Category data only available for select countries.
Household consumption expenditure by country1
Proportion of total household consumption expenditure
Services-dominant categories
Goods-dominant categories
Per capita GDPLow High
Restaurants and hotels
Education
Health
Communications
Recreation and culture3
Miscellaneous goods and services
Housing, water, electricity, and gas and other fuels
Furnishings, household equipment, etc.3
Clothing and footwear
Alcoholic beverages and tobacco
Food and nonalcoholic beverages
Congo,
Dem
. Rep
Malaw
i
Sierra Leone
Nepal
Nicaragua
India
Morocco
Indonesia
China
Thailand
Mexico
South Korea
2
EU-28
2
Japan2
Canada
2
Australia2
United
States2
Transport
4 McKinsey Global Institute Executive summary
The share of consumption devoted to services is growing across all groups of urban consumers to watch. However, the underlying reasons vary depending on the consumer group. Across developed regions, the heath-care spending of those aged 60 plus is rising rapidly even as the rest of their consumption tends to plateau or decline. Today, average per capita public and private health-care expenditure increases from about $8,200 at age 60 to $35,000 at age 90-plus in developed regions. Across emerging markets, an expanding consuming class is fueling demand for cinemas, restaurants, and banking services. In China, $1.25 of every $10 of consumption growth between 2015 and 2030 is expected to be in education as the young and working invest heavily in the next generation.
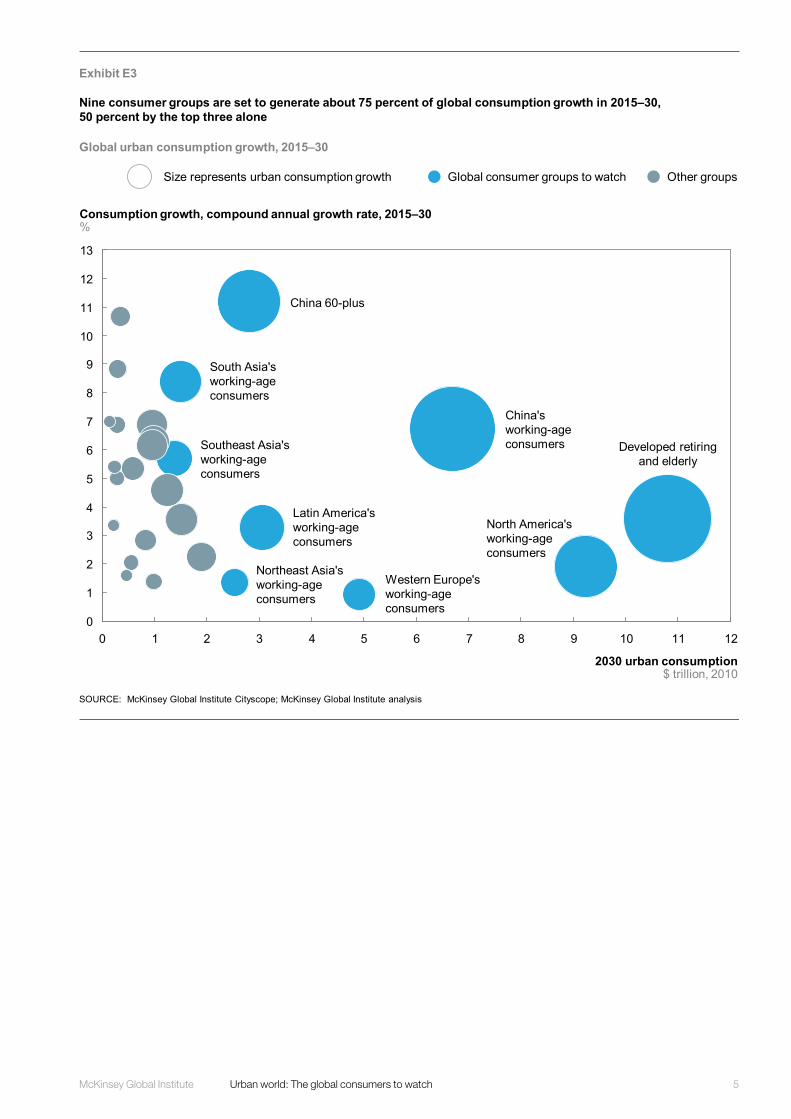
NINE GROUPS OF CONSUMERS ARE SET TO GENERATE THREE-QUARTERS OF GLOBAL URBAN CONSUMPTION GROWTH Global urban consumption is expected to grow by $23 trillion between 2015 and 2030—a 3.6 percent compound annual growth rate. MGI’s projections suggest that just nine groups of urban consumers to watch will generate three-quarters of this urban consumption growth (Exhibit E3 and Box E1, “Methodology for identifying global consumer groups to watch”). Of these, just three groups have the scale and spending power to reshape global demand and the world economy. They are the retiring and elderly in developed countries (aged 60-plus); those of working age in China (aged 15 to 59); and the working-age population of North America (also aged 15 to 59). These three are expected to generate $11 trillion—48 percent—of global urban consumption growth from 2015 to 2030. An additional 28 percent is projected to come from six groups that are either large but no longer growing in their numbers—the working-age populations of Western Europe and Northeast Asia (which includes Japan and South Korea)—or small but growing very rapidly, namely Chinese consumers aged 60-plus, and the working-age populations of South Asia, Southeast Asia, and Latin America.
Companies seeking to serve these groups successfully need to disentangle the drivers of their consumption. It is tempting to explain changes in consumption by pointing to shifting preferences and taste, as many commentators have done to explain the behavior of millennials.4 However, structural factors, which are easier to measure and anticipate than shifting consumer preferences, can explain many of these changes in consumption. Our analysis of key urban consumers to watch looks at the full range of factors driving consumption.
4 We define millennials as those born between 1985 and 2000; see the technical appendix for details.
The share of consumption devoted to services is growing across all groups of urban consumers to watch.
$23TGlobal urban consumption growth 2015–30
5McKinsey Global Institute Urban world: The global consumers to watch
Exhibit E3
SOURCE: McKinsey Global Institute Cityscope; McKinsey Global Institute analysis
Nine consumer groups are set to generate about 75 percent of global consumption growth in 2015–30, 50 percent by the top three alone
Global urban consumption growth, 2015–30
Size represents urban consumption growth
REPEATS in report
Developed retiring and elderly
China's working-age consumers
North America's working-age consumers
China 60-plus
Latin America's working-age consumers
South Asia's working-age consumers
Southeast Asia's working-age consumers
Western Europe's working-age consumers
Northeast Asia's working-age consumers
Global consumer groups to watch Other groups
0
1
2
3
4
5
6
7
8
9
10
11
12
13
129 11103 6 741 50 82
Consumption growth, compound annual growth rate, 2015–30%
2030 urban consumption$ trillion, 2010
6 McKinsey Global Institute Executive summary
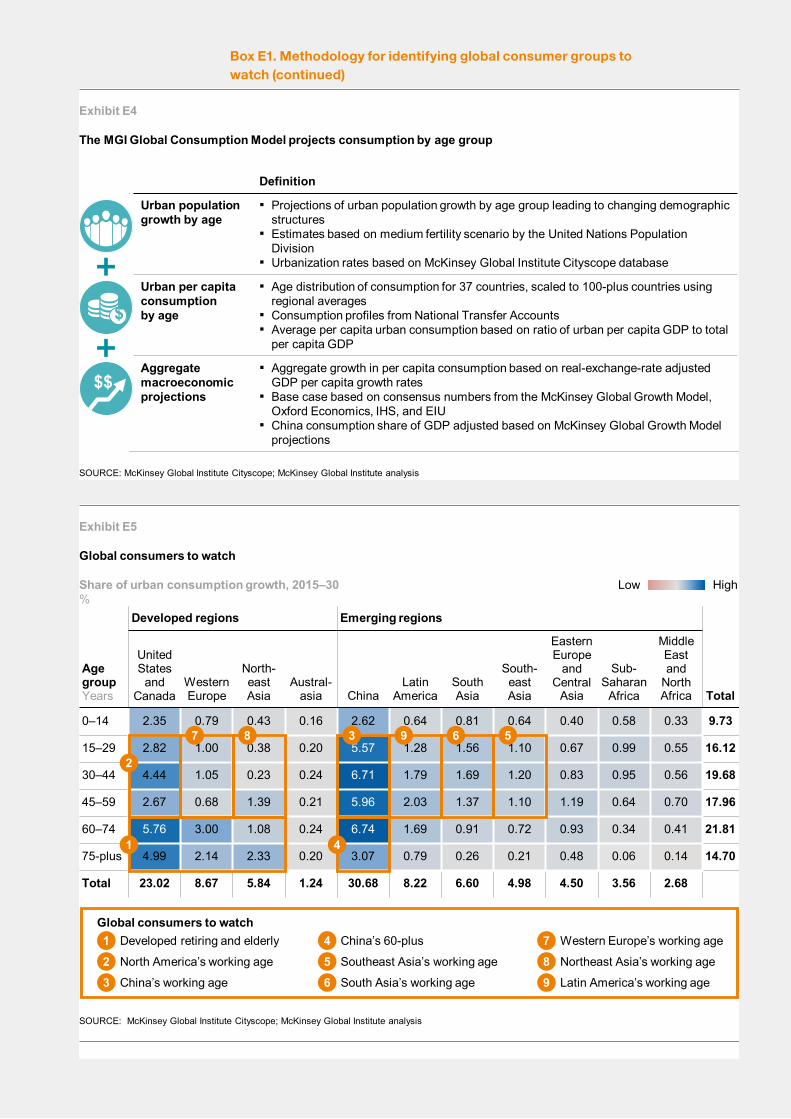
Box E1. Methodology for identifying global consumer groups to watch MGI’s analysis of the impact of demographic trends on global consumption growth between 2015 and 2030 uses a combination of urban population projections by age, per capita consumption by age, and macroeconomic forecasts of per capita GDP and the consumption share of GDP (Exhibit E4). Throughout this report, consumption includes private consumption, public education consumption, and public health-care consumption.1 Some figures rely on household surveys that include private household expenditure only; these are footnoted.
We use our global consumer model to analyze urban consumption for six groups: age ranges 0 to 14, 15 to 29, 30 to 44, 45 to 59, 60 to 74, and 75-plus. For the global consumers to watch, we combined three age categories to make a working-age group aged 15 to 59, and we combined two other age groups to create the retiring and elderly who are aged 60 and older. The reason we took this approach is that consumption behavior changes in systematic ways as people proceed through life. There are notable consumption shifts that start around age 15 and age 60. Children’s consumption is lower than that of other age groups except for publicly and privately funded education (estimated private and public spending on their behalf, as it were). Given their similar demographic trends and total per capita consumption patterns, we have combined the 60-plus age group across developed regions. The numbers of retiring and elderly consumers are rising and their consumption per capita is high largely due to rising health-care expenditure.2 Within these large groupings are different consumer segments and shifts in consumption patterns.
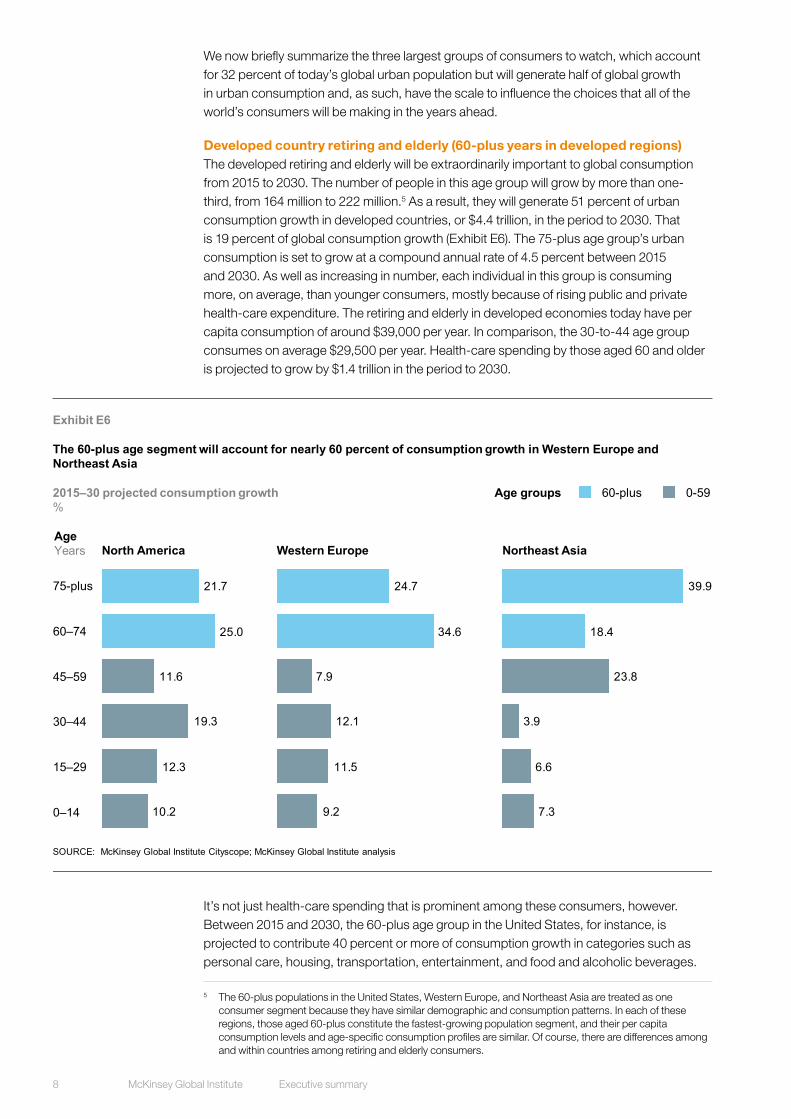
Based on these projections, we identified which regional consumer age groups contributed most to consumption growth from 2015 to 2030 and had the highest share of consumption in 2030 (Exhibit E5). Each of the nine urban consumer groups to watch contributes at least 4 percent of global consumption growth or represent at least 3 percent of global consumption in 2030. In the case of the top three groups, each is projected to generate more than 10 percent of global consumption in 2030.3
1 For the underlying data on consumption by age, and more information on the National Transfer Accounts project and methodology, see the National Transfer Accounts website at ntaccounts.org.
2 In contrast, the number of working-age consumers is declining in Western Europe and Japan, while continuing to rise in North America.
3 The nine consumer groups account for 68 percent of the world’s urban population, and the three consumer groups 32 percent.
7McKinsey Global Institute Urban world: The global consumers to watch
Box E1. Methodology for identifying global consumer groups to watch (continued)
Exhibit E4
The MGI Global Consumption Model projects consumption by age group
SOURCE: McKinsey Global Institute Cityscope; McKinsey Global Institute analysis
Definition
Urban population growth by age
▪ Projections of urban population growth by age group leading to changing demographic structures
▪ Estimates based on medium fertility scenario by the United Nations Population Division
▪ Urbanization rates based on McKinsey Global Institute Cityscope database
Urban per capita consumption by age
▪ Age distribution of consumption for 37 countries, scaled to 100-plus countries using regional averages
▪ Consumption profiles from National Transfer Accounts▪ Average per capita urban consumption based on ratio of urban per capita GDP to total
per capita GDP
Aggregate macroeconomic projections
▪ Aggregate growth in per capita consumption based on real-exchange-rate adjusted GDP per capita growth rates
▪ Base case based on consensus numbers from the McKinsey Global Growth Model, Oxford Economics, IHS, and EIU
▪ China consumption share of GDP adjusted based on McKinsey Global Growth Model projections
$
$$
Box E1Exhibit E5
AgegroupYears
Developed regions Emerging regions
Total
UnitedStates
and Canada
Western Europe
North-eastAsia
Austral-asia China
Latin America
South Asia
South-eastAsia
Eastern Europe
and Central
Asia
Sub-Saharan
Africa
MiddleEast and
North Africa
0–14 2.35 0.79 0.43 0.16 2.62 0.64 0.81 0.64 0.40 0.58 0.33 9.73
15–29 2.82 1.00 0.38 0.20 5.57 1.28 1.56 1.10 0.67 0.99 0.55 16.12
30–44 4.44 1.05 0.23 0.24 6.71 1.79 1.69 1.20 0.83 0.95 0.56 19.68
45–59 2.67 0.68 1.39 0.21 5.96 2.03 1.37 1.10 1.19 0.64 0.70 17.96
60–74 5.76 3.00 1.08 0.24 6.74 1.69 0.91 0.72 0.93 0.34 0.41 21.81
75-plus 4.99 2.14 2.33 0.20 3.07 0.79 0.26 0.21 0.48 0.06 0.14 14.70
Total 23.02 8.67 5.84 1.24 30.68 8.22 6.60 4.98 4.50 3.56 2.68
Global consumers to watch
SOURCE: McKinsey Global Institute Cityscope; McKinsey Global Institute analysis
Share of urban consumption growth, 2015–30%
Low High
Global consumers to watchDeveloped retiring and elderly1North America’s working age2China’s working age3
China’s 60-plus4Southeast Asia’s working age5South Asia’s working age6
Northeast Asia’s working age
Western Europe’s working age78
Latin America’s working age9
1
2
3
4
567 8 9
Box E1
8 McKinsey Global Institute Executive summary
We now briefly summarize the three largest groups of consumers to watch, which account for 32 percent of today’s global urban population but will generate half of global growth in urban consumption and, as such, have the scale to influence the choices that all of the world’s consumers will be making in the years ahead.
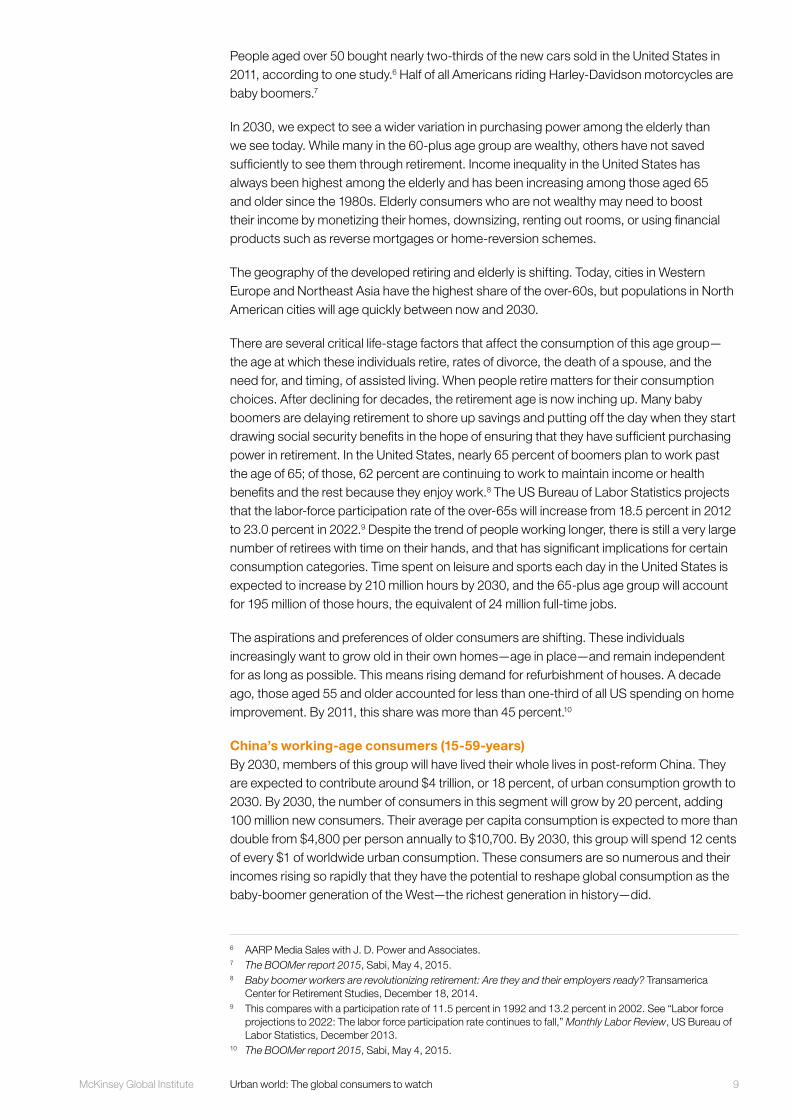
Developed country retiring and elderly (60-plus years in developed regions) The developed retiring and elderly will be extraordinarily important to global consumption from 2015 to 2030. The number of people in this age group will grow by more than one-third, from 164 million to 222 million.5 As a result, they will generate 51 percent of urban consumption growth in developed countries, or $4.4 trillion, in the period to 2030. That is 19 percent of global consumption growth (Exhibit E6). The 75-plus age group’s urban consumption is set to grow at a compound annual rate of 4.5 percent between 2015 and 2030. As well as increasing in number, each individual in this group is consuming more, on average, than younger consumers, mostly because of rising public and private health-care expenditure. The retiring and elderly in developed economies today have per capita consumption of around $39,000 per year. In comparison, the 30-to-44 age group consumes on average $29,500 per year. Health-care spending by those aged 60 and older is projected to grow by $1.4 trillion in the period to 2030.
It’s not just health-care spending that is prominent among these consumers, however. Between 2015 and 2030, the 60-plus age group in the United States, for instance, is projected to contribute 40 percent or more of consumption growth in categories such as personal care, housing, transportation, entertainment, and food and alcoholic beverages.
5 The 60-plus populations in the United States, Western Europe, and Northeast Asia are treated as one consumer segment because they have similar demographic and consumption patterns. In each of these regions, those aged 60-plus constitute the fastest-growing population segment, and their per capita consumption levels and age-specific consumption profiles are similar. Of course, there are differences among and within countries among retiring and elderly consumers.
Exhibit E6
10.2
12.3
19.3
11.6
25.0
21.7
0–14
15–29
30–44
60–74
45–59
75-plus
The 60-plus age segment will account for nearly 60 percent of consumption growth in Western Europe and Northeast Asia
2015–30 projected consumption growth%
SOURCE: McKinsey Global Institute Cityscope; McKinsey Global Institute analysis
9.2
11.5
12.1
7.9
34.6
24.7
7.3
6.6
3.9
23.8
18.4
39.9
AgeYears Northeast AsiaWestern EuropeNorth America
0-5960-plusAge groups
REPEATS in report
9McKinsey Global Institute Urban world: The global consumers to watch
People aged over 50 bought nearly two-thirds of the new cars sold in the United States in 2011, according to one study.6 Half of all Americans riding Harley-Davidson motorcycles are baby boomers.7
In 2030, we expect to see a wider variation in purchasing power among the elderly than we see today. While many in the 60-plus age group are wealthy, others have not saved sufficiently to see them through retirement. Income inequality in the United States has always been highest among the elderly and has been increasing among those aged 65 and older since the 1980s. Elderly consumers who are not wealthy may need to boost their income by monetizing their homes, downsizing, renting out rooms, or using financial products such as reverse mortgages or home-reversion schemes.
The geography of the developed retiring and elderly is shifting. Today, cities in Western Europe and Northeast Asia have the highest share of the over-60s, but populations in North American cities will age quickly between now and 2030.
There are several critical life-stage factors that affect the consumption of this age group—the age at which these individuals retire, rates of divorce, the death of a spouse, and the need for, and timing, of assisted living. When people retire matters for their consumption choices. After declining for decades, the retirement age is now inching up. Many baby boomers are delaying retirement to shore up savings and putting off the day when they start drawing social security benefits in the hope of ensuring that they have sufficient purchasing power in retirement. In the United States, nearly 65 percent of boomers plan to work past the age of 65; of those, 62 percent are continuing to work to maintain income or health benefits and the rest because they enjoy work.8 The US Bureau of Labor Statistics projects that the labor-force participation rate of the over-65s will increase from 18.5 percent in 2012 to 23.0 percent in 2022.9 Despite the trend of people working longer, there is still a very large number of retirees with time on their hands, and that has significant implications for certain consumption categories. Time spent on leisure and sports each day in the United States is expected to increase by 210 million hours by 2030, and the 65-plus age group will account for 195 million of those hours, the equivalent of 24 million full-time jobs.
The aspirations and preferences of older consumers are shifting. These individuals increasingly want to grow old in their own homes—age in place—and remain independent for as long as possible. This means rising demand for refurbishment of houses. A decade ago, those aged 55 and older accounted for less than one-third of all US spending on home improvement. By 2011, this share was more than 45 percent.10
China’s working-age consumers (15-59-years) By 2030, members of this group will have lived their whole lives in post-reform China. They are expected to contribute around $4 trillion, or 18 percent, of urban consumption growth to 2030. By 2030, the number of consumers in this segment will grow by 20 percent, adding 100 million new consumers. Their average per capita consumption is expected to more than double from $4,800 per person annually to $10,700. By 2030, this group will spend 12 cents of every $1 of worldwide urban consumption. These consumers are so numerous and their incomes rising so rapidly that they have the potential to reshape global consumption as the baby-boomer generation of the West—the richest generation in history—did.
6 AARP Media Sales with J. D. Power and Associates.7 The BOOMer report 2015, Sabi, May 4, 2015. 8 Baby boomer workers are revolutionizing retirement: Are they and their employers ready? Transamerica
Center for Retirement Studies, December 18, 2014. 9 This compares with a participation rate of 11.5 percent in 1992 and 13.2 percent in 2002. See “Labor force
projections to 2022: The labor force participation rate continues to fall,” Monthly Labor Review, US Bureau of Labor Statistics, December 2013.
10 The BOOMer report 2015, Sabi, May 4, 2015.
10 McKinsey Global Institute Executive summary
One of the key drivers for this consumption growth is the large number of Chinese households that will reach comfortable middle class. The total share of Chinese urban working-age consumers achieving disposable monthly household incomes upward of $2,100 is expected to soar from around 4 percent in 2010 to over 50 percent by 2030, more than a tenfold increase.11
Reflecting their rising incomes, consumption by those of working age in China will be fueled by higher per capita spending. The group’s average per capita consumption is expected to more than double, from $4,800 annually to $10,700. Higher disposable income and a willingness to spend is fueling spending. Annual household spending on personal products is set to more than double, from around $300 per household to about $770. Similarly, annual household spending on dining out is set to more than double, resulting in an additional $720 spent per household. The Chinese are increasingly interested in traveling abroad. According to the China Outbound Tourism Research Institute, an additional 100 million Chinese are expected to travel overseas by 2020.12
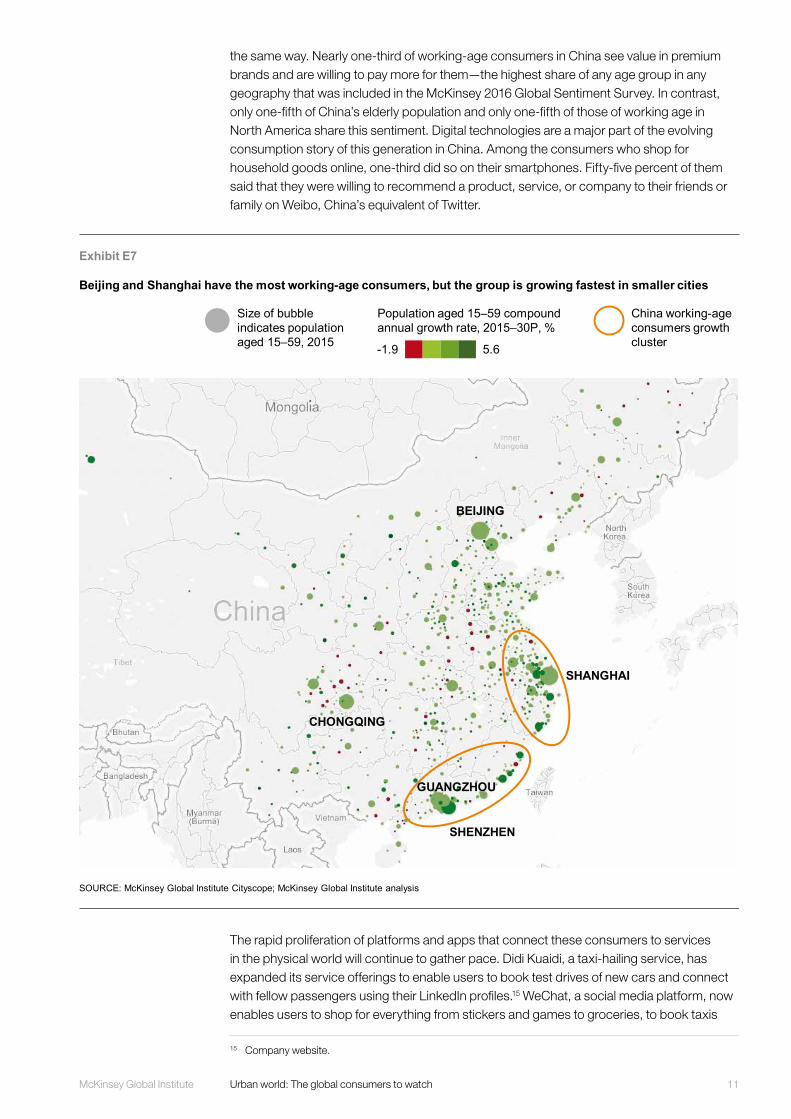
In China, 18.4 million individuals of working age live in Shanghai alone, and 16.6 million live in Beijing. Yet the highest shares of these consumers are not in China’s largest cities but in Dongguan, Foshan, Shantou, Shenzhen, and Xiamen and other manufacturing powerhouses (Exhibit E7). Beijing and Shanghai have both the largest and the fastest-growing numbers of people of working age, but beyond these two megacities it is China’s smaller cities that will experience the highest growth rates in the number of people of working age.
China’s young people are spending more years in school than their predecessors, and China’s education spending is growing quickly. Between 2015 and 2030, China is expected to spend 12.5 percent of overall consumption growth on education, virtually the same as Sweden’s 12.6 percent. These shares are by far the highest of all the countries in our sample.
This group is marrying and having children later for both social and economic reasons. The fact that Chinese citizens are spending longer in education is one reason many people are delaying marriage. Chinese citizens with a tertiary education are likely to marry later.13 The increased economic opportunities available to women in China are also contributing to decisions to marry later, consistent with experience in other countries. The share of young women aged 25 to 29 who are unmarried has quadrupled since 1980 to stand at 22 percent in 2014.14
These consumers have grown up in a very different China from their parents, and their consumption choices reflect this. They are more optimistic about their financial future and more willing than previous generations to spend a greater share of their disposable income. In 2012, McKinsey’s 2005–12 Annual Chinese Consumer Survey found that 61 percent of China’s working-age group believed that their household income would increase significantly over the next five years compared with 50 percent of older consumers who felt
11 To differentiate among Chinese households on the basis of their income levels, we use poor, mass middle class, upper middle class, and affluent segments. By 2030, around 46 percent of Chinese urban households will move out of the mass middle class category into the upper middle class and affluent classes. Using figures from 2012, poor households have monthly incomes of less than 3,333 renminbi, or $520; mass middle-class households, between 3,334 and 13,490 renminbi ($520 to $2,100); upper-middle-class households, between 13,500 and 19,999 renminbi ($2,100 to $3,100); and affluent households, more than 20,000 renminbi, or $3,100. Upper-middle-class households are able to afford goods such as laptops, digital cameras, and luxury products. See Dominic Barton, Yougang Chen, and Amy Jin, “Mapping China’s middle class,” McKinsey Quarterly, June 2013.
12 Chinese outbound travel a multi-decade growth trend, Credit Lyonnais Securities Asia, 2015.13 World Bank education statistics; China Annual Population Change Survey (1986, 1994, and 2008); China
One-percent Population Sample Survey, 2005. 14 Wang Feng, “What will happen if China adopts a two-child policy?” New Scientist, March 19, 2014.
2XIncrease in average per capita consumption by China’s working-age consumers 2015–30
11McKinsey Global Institute Urban world: The global consumers to watch
the same way. Nearly one-third of working-age consumers in China see value in premium brands and are willing to pay more for them—the highest share of any age group in any geography that was included in the McKinsey 2016 Global Sentiment Survey. In contrast, only one-fifth of China’s elderly population and only one-fifth of those of working age in North America share this sentiment. Digital technologies are a major part of the evolving consumption story of this generation in China. Among the consumers who shop for household goods online, one-third did so on their smartphones. Fifty-five percent of them said that they were willing to recommend a product, service, or company to their friends or family on Weibo, China’s equivalent of Twitter.
The rapid proliferation of platforms and apps that connect these consumers to services in the physical world will continue to gather pace. Didi Kuaidi, a taxi-hailing service, has expanded its service offerings to enable users to book test drives of new cars and connect with fellow passengers using their LinkedIn profiles.15 WeChat, a social media platform, now enables users to shop for everything from stickers and games to groceries, to book taxis
15 Company website.
Exhibit E7
Beijing and Shanghai have the most working-age consumers, but the group is growing fastest in smaller cities
SOURCE: McKinsey Global Institute Cityscope; McKinsey Global Institute analysis
BEIJING
SHANGHAI
CHONGQING
SHENZHEN
GUANGZHOU
Population aged 15–59 compound annual growth rate, 2015–30P, %
-1.9 5.6
China working-age consumers growth cluster
Size of bubble indicates population aged 15–59, 2015
REPEATS in report
12 McKinsey Global Institute Executive summary
and flights, and to make mobile payments. The company allows subscribers to set up online stores. The rapid pace of change—and the willingness of these consumers to innovate—makes this segment a market to watch.
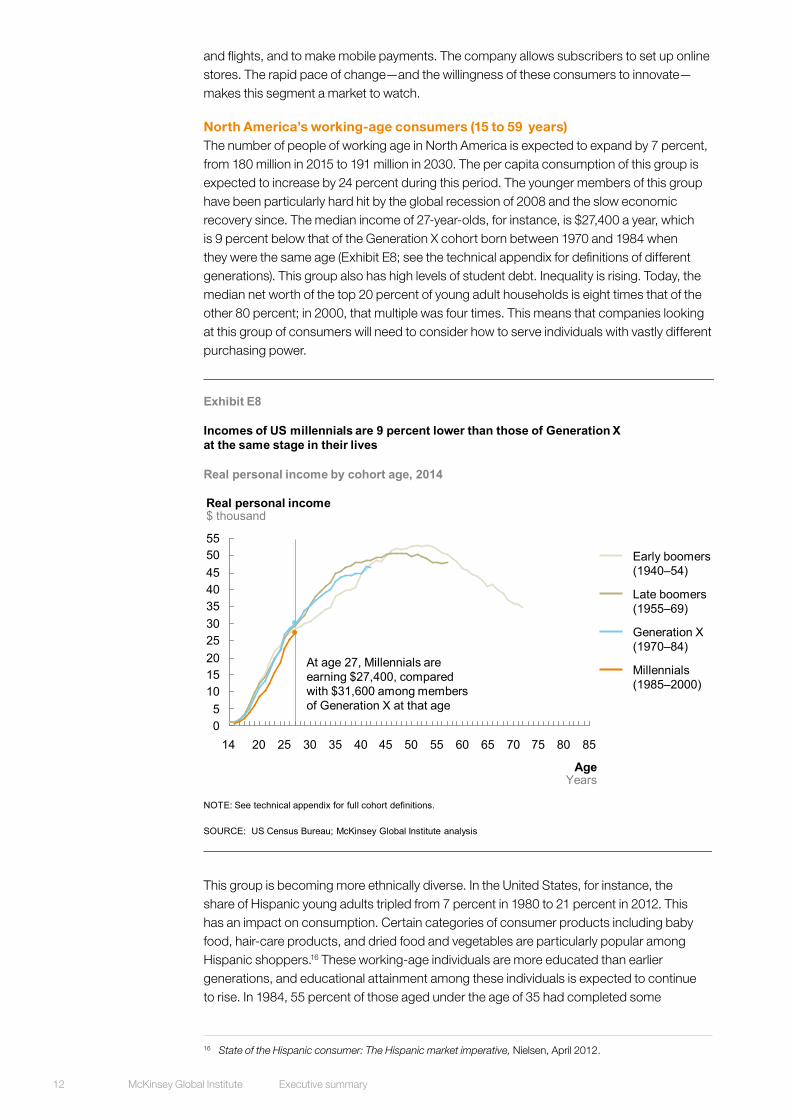
North America’s working-age consumers (15 to 59 years) The number of people of working age in North America is expected to expand by 7 percent, from 180 million in 2015 to 191 million in 2030. The per capita consumption of this group is expected to increase by 24 percent during this period. The younger members of this group have been particularly hard hit by the global recession of 2008 and the slow economic recovery since. The median income of 27-year-olds, for instance, is $27,400 a year, which is 9 percent below that of the Generation X cohort born between 1970 and 1984 when they were the same age (Exhibit E8; see the technical appendix for definitions of different generations). This group also has high levels of student debt. Inequality is rising. Today, the median net worth of the top 20 percent of young adult households is eight times that of the other 80 percent; in 2000, that multiple was four times. This means that companies looking at this group of consumers will need to consider how to serve individuals with vastly different purchasing power.
This group is becoming more ethnically diverse. In the United States, for instance, the share of Hispanic young adults tripled from 7 percent in 1980 to 21 percent in 2012. This has an impact on consumption. Certain categories of consumer products including baby food, hair-care products, and dried food and vegetables are particularly popular among Hispanic shoppers.16 These working-age individuals are more educated than earlier generations, and educational attainment among these individuals is expected to continue to rise. In 1984, 55 percent of those aged under the age of 35 had completed some
16 State of the Hispanic consumer: The Hispanic market imperative, Nielsen, April 2012.
Exhibit E8
0
105
15
25
55
30
4550
4035
20
2520 30 755535 70656045 5040 8580
AgeYears
Real personal income $ thousand
14
Real personal income by cohort age, 2014
SOURCE: US Census Bureau; McKinsey Global Institute analysis
Incomes of US millennials are 9 percent lower than those of Generation X at the same stage in their lives
NOTE: See technical appendix for full cohort definitions.
Millennials(1985–2000)
Late boomers(1955–69)
Early boomers(1940–54)
Generation X(1970–84)
At age 27, Millennials are earning $27,400, compared with $31,600 among members of Generation X at that age
REPEATS in report
13McKinsey Global Institute Urban world: The global consumers to watch
postsecondary education. By 2013, that share had increased to 69 percent. By 2030, the largest populations of working-age people in North America will be found in large US cities including Chicago, Illinois; Los Angeles, California; Miami, Florida; New York, New York; and Washington, DC, and in fast-growing cities in southern states including Atlanta, Georgia, Dallas and Houston in Texas, and the southwestern state of Phoenix, Arizona.
North America’s working-age population is going through key life stages such as finishing education, having a first child, getting married, or buying a first home later than earlier cohorts did. This has an impact on consumption patterns. The share of married young adult households has fallen from 54 percent in 1982 to 36 percent in 2014. Since homeownership rates among young adults in married households is 30 percentage points higher than among those in other living arrangements, we estimate that this trend alone could be responsible for a 5 percentage point fall in the rate of homeownership between 1982 and 2014—enough to fully explain the actual decline. At the same time, the share of young adults living with their parents has risen from 30 percent to 36 percent, a change that is likely to reflect economic realities rather than changes in preferences.
There appear to be two broad shifts of attitude among these consumers. One is a propensity to trust their peers when judging whether a good or service is worth buying, rather than relying on information from the companies and organizations that provide them.17 There is also evidence that younger people of working age in North America have less trust in traditional firms and investment advisers and are willing to patronize alternative forms of money management.18 They are very likely to shop around for financial services and buy online. The second attitude is that this group of consumers prefers goods and services to be delivered instantaneously—or at least as quickly as possible. They have more choices than previous generations. Millennials grew up with the Internet and digital technologies. These consumers prefer on-demand television and other entertainment content. Millennial North Americans are 10 percent less likely to take out a cable subscription than older consumers, and are four to five times as likely to purchase goods and services using their mobile phones. Even in health care, they tend to use retail or urgent-care clinics more than earlier generations because they want to avoid long waits for a primary-care physician.
WHAT FACTORS ARE MOST LIKELY TO SWING GLOBAL CONSUMPTION FROM THE BASE-CASE PROJECTIONS? While the broad patterns of consumption growth among the global consumers to watch are robust to a range of underlying assumptions, there are uncertainties to watch for. The future trajectory of China’s per capita consumption growth, expected to expand by 5.4 percent per year between 2015 and 2030, is subject to the widest band of uncertainty. If per capita income grows more slowly than consensus estimates—say at a 4.1 percent rate instead of the 6.1 percent expected real-exchange-rate adjusted growth rate—China’s consumption growth would be $2.4 trillion lower. However, if China were to move faster toward a consumption-driven growth path—with the share of consumption in GDP rising from 41 percent (our projected 2030 baseline) to 50 percent of GDP by 2030, the aggregate consumption of China’s urban consumers could expand by $2.0 trillion more than projected. In developed economies, the consumption of the retiring and elderly in developed economies may not prove sustainable. Paying for pensions and health care will be challenging: neither private savings nor public finances are sufficiently well funded for future costs. Another source of uncertainty is the timing of retirement. We estimate that a three-year delay in retirement would boost consumption growth in developed economies by $155 billion by 2030. There are uncertainties about the trajectory of consumption by North America’s working-age consumers. For instance, we estimate that a three-year delay in key
17 Talking to strangers: Millennials trust people over brands, Bazaarvoice, January 2012.18 The Microsoft Millennials in financial services survey, conducted by KRC Research of Washington, DC, 2009.
36%2014 share of married young adult households, down from
54%in 1982
14 McKinsey Global Institute Executive summary
life-stage decisions would reduce non-health-care consumption growth by $260 billion in North America and Europe, and a five-year delay by $440 billion.
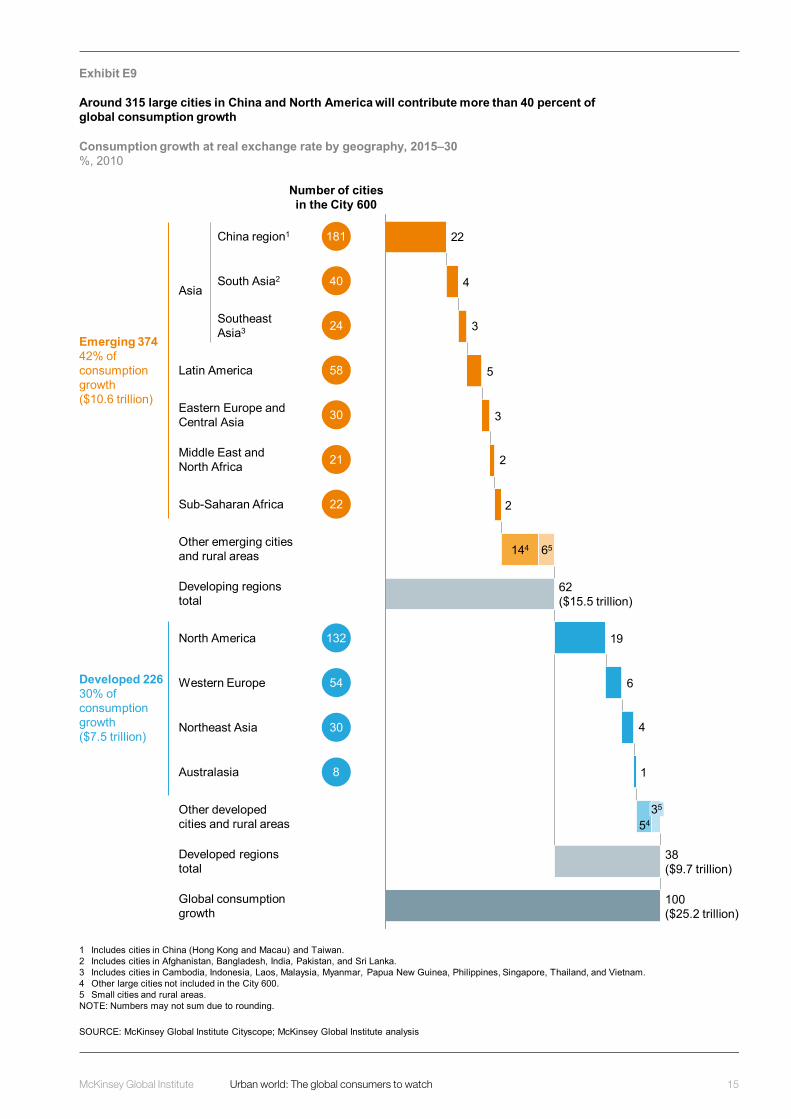
CITIES MATTER, BUT THEIR DEMOGRAPHICS—AND CONSUMPTION PROSPECTS—ARE DIVERGING Worldwide consumption is extraordinarily concentrated; just 32 cities are likely to generate one-quarter of total urban consumption growth between 2015 and 2030, and 100 cities will account for 45 percent of that growth.19 Cities in North America, a region that features prominently for two of the key groups of consumers to watch—the developed retiring and elderly, and North America’s working-age population—continue to be important in the consumption landscape. But the weight of consumption is shifting rapidly toward the cities of emerging economies, including China, whose working-age population is the third key consumer group to watch. In 2030, just 315 large cities in China and North America are likely to contribute more than 40 percent of global consumption growth (Exhibit E9).
The 20 metropolitan areas with the most consumption growth between 2015 and 2030 include seven cities in the United States and six in China. London—the only European city in the top 20—is projected to have the highest consumption growth. By 2030, ten of the 20 top cities for consumption will be in the United States. Western Europe and Japan are projected to have three cities each in the top 20, and China will have two—up from zero today (Exhibit E10).
How cities fare in the face of major demographic shifts will matter for consumption. The urban world faces a double threat to growth: global population growth is slowing and rural-to-urban migration or urbanization is plateauing in many countries. These two factors matter because expanding populations have been the key driver of urban growth, contributing almost 60 percent of urban GDP growth between 2000 and 2012. Globally, more than half of the deviation of individual cities’ GDP growth from the national average of their countries has been due to differences in population growth rather than higher (or lower) per capita GDP growth.20
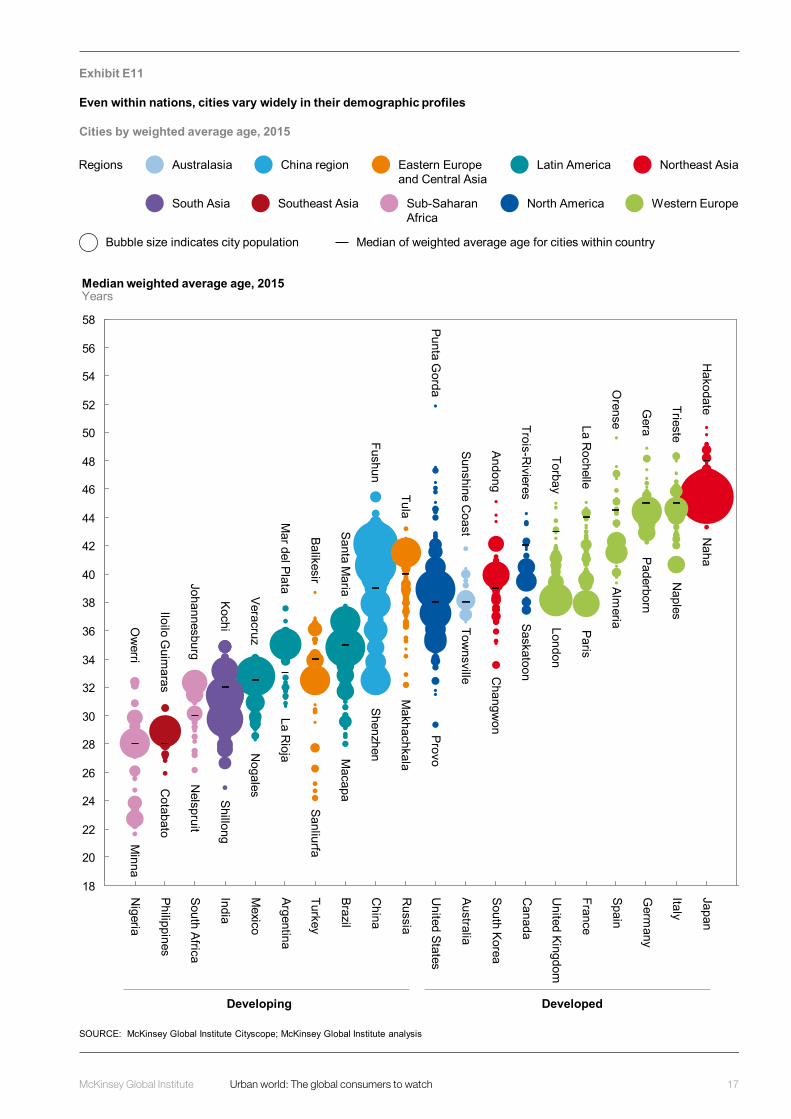
Demographic variations among cities—and therefore their growth and consumption prospects—are already surprisingly large. In our sample of cities, the average age ranges from 22 years in the Nigerian city of Minna to 52 years in Punta Gorda in the US state of Florida. Even within countries, there are large variations in cities’ demographic profiles. In 2012, the median age varied by a decade in the cities in South Korea and Spain with the oldest and youngest populations, and by more than 20 years in the United States (Exhibit E11).
19 These 32 cities are 12 cities in the China region (Beijing, Chengdu, Chongqing, Guangzhou, Hangzhou, Hong Kong, Nanjing, Shanghai, Shenyang, Shenzhen, Tianjin, and Wuhan); 11 cities in the United States (Atlanta, Georgia; Boston, Massachusetts; Chicago, Illinois; Dallas, Texas; Houston, Texas; Los Angeles, California; Miami, Florida; New York, New York; Phoenix, Arizona; San Francisco, California; and Washington, DC); two cities each in Northeast Asia (Osaka and Tokyo, both in Japan), Latin America (Mexico City, Mexico, and São Paulo, Brazil), and South Asia (Delhi and Mumbai, both in India); and one city each in Western Europe (London in the United Kingdom), the Eastern Europe and Central Asia region (Istanbul, Turkey), and Southeast Asia (Jakarta, Indonesia).
20 We analyzed urban GDP growth between 2000 and 2012 for 943 cities with 500,000 or more inhabitants in 145 countries using the Canback global income distribution database (C-GIDD). Among developed regions, differences in population growth rates contributed two-thirds of the GDP growth differences of individual cities from the national city average, and per capita income growth accounted for the rest. In developing regions, there was wider variance across regions. China and South Asia were the two regions where per capita GDP growth differences contributed more than half of the deviation, at 58 percent and 56 percent, respectively. Also see Urban America: US cities in the world economy, McKinsey Global Institute, April 2012. This research shows in more detail how the US cities that grew faster than their peers over the past 30 years did so because of higher population growth rather than higher growth in per capita income.
315large cities in China and North America to contribute
40%+of global consumption growth
15McKinsey Global Institute Urban world: The global consumers to watch
Exhibit E9
1
4
6
19
2
2
3
5
3
4
22
38($9.7 trillion)
35
65
54
62($15.5 trillion)
144
100($25.2 trillion)
SOURCE: McKinsey Global Institute Cityscope; McKinsey Global Institute analysis
1 Includes cities in China (Hong Kong and Macau) and Taiwan.2 Includes cities in Afghanistan, Bangladesh, India, Pakistan, and Sri Lanka.3 Includes cities in Cambodia, Indonesia, Laos, Malaysia, Myanmar, Papua New Guinea, Philippines, Singapore, Thailand, and Vietnam.4 Other large cities not included in the City 600.5 Small cities and rural areas.NOTE: Numbers may not sum due to rounding.
Around 315 large cities in China and North America will contribute more than 40 percent of global consumption growth
Consumption growth at real exchange rate by geography, 2015–30%, 2010
Emerging 37442% of consumption growth($10.6 trillion)
Developed 22630% of consumption growth($7.5 trillion)
China region1
South Asia2
Southeast Asia3
Latin America
Eastern Europe and Central Asia
Middle East and North Africa
Sub-Saharan Africa
Other emerging cities and rural areas
Developing regions total
North America
Western Europe
Northeast Asia
Australasia
Other developed cities and rural areas
Developed regions total
Global consumption growth
Asia
Number of cities in the City 600
181
40
24
58
30
21
22
132
54
30
8

16 McKinsey Global Institute Executive summary
Exhibit E10
Top cities by absolute consumption and consumption growth
SOURCE: McKinsey Global Institute Cityscope; McKinsey Global Institute analysis
Philadelphia,United States
Paris,France
São Paulo,Brazil
Atlanta,United States
Rhein-Ruhr,Germany
Shanghai,China
San Francisco,United States
336
368
379
384
384
356
Los Angeles,United States
New York,United States
Tokyo,Japan
503
1,386
1,644
Chicago,United States
Osaka,Japan
Nagoya,Japan
Mexico City,Mexico
430
398
Boston,United States
Washington, DC,United States 467
429
Beijing,China
445
406
538
601
735
1,037
861
Dallas,United States
Houston,United States
London,United Kingdom
Wuhan,China
Mexico City,Mexico
Guangzhou,China
Washington, DC,United States
Osaka,Japan
Chicago,United States
Jakarta,Indonesia
Istanbul,Turkey
133
Atlanta,United States
Tianjin,China
135
Tokyo,Japan
137
152
Beijing,China
138
166
300
230
London,United Kingdom
Chongqing,China
Dallas,United States
197
Houston,United States
203
145
367
Mumbai,India
142
167
Shanghai,China
Los Angeles,United States
178
New York,United States
259
277
235
351
354
Top cities by
San Francisco,United States
Los Angeles,United States
Nagoya,Japan
211
210
London,United Kingdom
New York,United States
253
256
Washington, DC,United States
260
266
231
Hong Kong,China
300
312
315
315
342
200
625
1,035
1,291
569
356
670
Chicago,United States
Mexico City,Mexico
Dallas,United States
Houston,United States
Osaka,Japan
Atlanta,United States
Boston,United States
Miami,United States
Tokyo,Japan
Philadelphia,United States
São Paulo,Brazil
Paris,France
Rhein-Ruhr,Germany
405
Emerging countryDeveloped country
2030 consumption2015–30 consumption growth2015 consumption
$ billion, 2010
REPEATS in report
17McKinsey Global Institute Urban world: The global consumers to watch
Exhibit E11
Even within nations, cities vary widely in their demographic profiles
SOURCE: McKinsey Global Institute Cityscope; McKinsey Global Institute analysis
Cities by weighted average age, 2015
18
20
22
24
26
28
30
32
34
36
38
40
42
44
46
48
50
52
54
56
58
United Kingdom
Australia
China
Argentina
Germ
any
South Korea
United States
Italy
Japan
Spain
France
Canada
Russia
Turkey
Brazil
Mexico
India
South Africa
Philippines
Nigeria
Median weighted average age, 2015Years
Median of weighted average age for cities within countryBubble size indicates city population
Australasia China region Eastern Europe and Central Asia
Latin America Northeast Asia
South Asia Southeast Asia Sub-Saharan Africa
North America Western Europe
Regions
Developing Developed
Ow
erri
Iloilo Guim
aras
Johannesburg
Kochi
Veracruz
Mar del Plata
Balikesir
Santa Maria
Fushun
Tula
Punta Gorda
Sunshine Coast
Andong
Trois-Rivieres
Torbay
La Rochelle
Orense
Gera
Trieste
Hakodate
Minna
Cotabato
Nelspruit
Shillong
Nogales
La Rioja
Sanliurfa
Macapa
Shenzhen
Makhachkala
Provo
Townsville C
hangwon
Saskatoon
London
Paris
Almeria
Paderborn
Naples
Naha
18 McKinsey Global Institute Executive summary
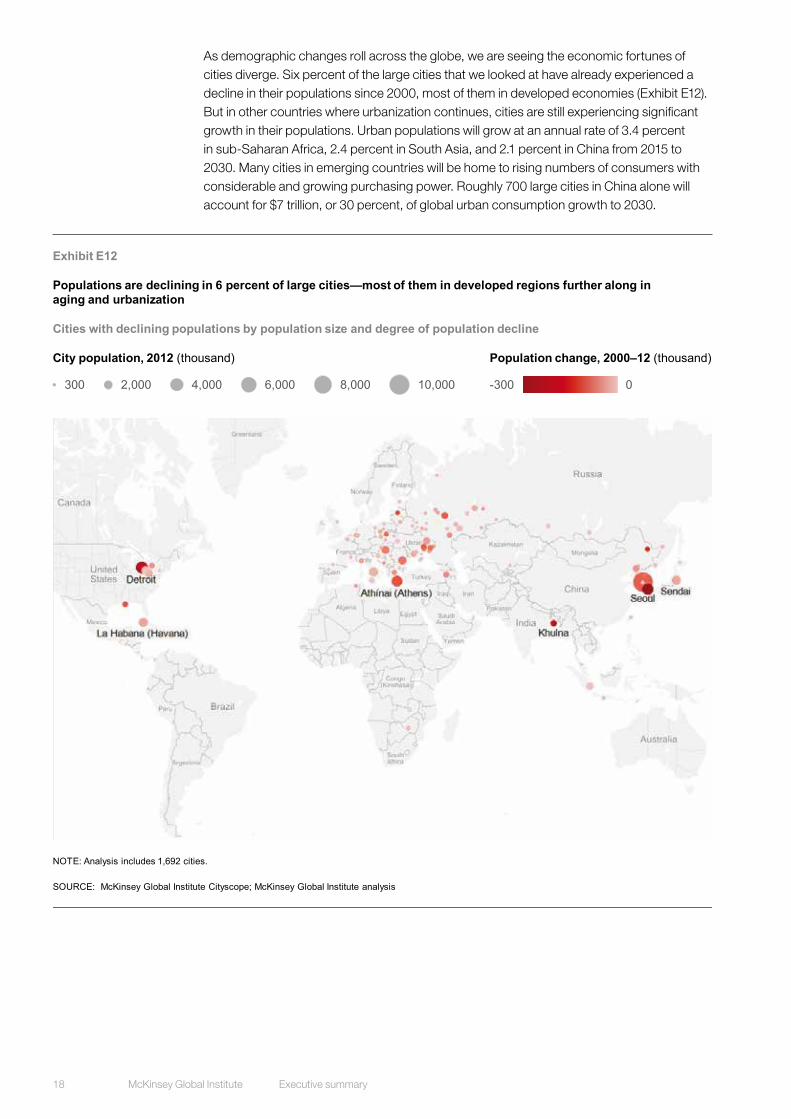
As demographic changes roll across the globe, we are seeing the economic fortunes of cities diverge. Six percent of the large cities that we looked at have already experienced a decline in their populations since 2000, most of them in developed economies (Exhibit E12). But in other countries where urbanization continues, cities are still experiencing significant growth in their populations. Urban populations will grow at an annual rate of 3.4 percent in sub-Saharan Africa, 2.4 percent in South Asia, and 2.1 percent in China from 2015 to 2030. Many cities in emerging countries will be home to rising numbers of consumers with considerable and growing purchasing power. Roughly 700 large cities in China alone will account for $7 trillion, or 30 percent, of global urban consumption growth to 2030.
Exhibit E12
Populations are declining in 6 percent of large cities—most of them in developed regions further along in aging and urbanization
SOURCE: McKinsey Global Institute Cityscope; McKinsey Global Institute analysis
Cities with declining populations by population size and degree of population decline
NOTE: Analysis includes 1,692 cities.
Population change, 2000–12 (thousand)
-300 0
City population, 2012 (thousand)
300 2,000 4,000 6,000 8,000 10,000
REPEATS in report
19McKinsey Global Institute Urban world: The global consumers to watch
COMPANIES NEED TO WORK EVEN HARDER TO THRIVE IN CONSUMER MARKETS THAT ARE FRAGMENTING AND DIVERSIFYING The shifts we are seeing in global consumption are significant. For decades, companies serving consumer markets could rely on expanding numbers in most segments—but no longer. Three-quarters of consumption growth to 2030 will depend on each individual spending more. So, more than ever, companies need to know which consumers are likely to sustain robust spending, where they live, and what products and services they want to buy. Add to this arguably unprecedented variety in consumer markets, and the challenge deepens. To compete for the purchasing power of varied and highly dispersed pockets, three aspects of the challenge are worth considering:
� Footprint matters for success in a shifting consumer landscape. With consumption shifting, footprint matters. Companies also need to adapt continuously to the evolving demographics and consumption patterns of cities—and even neighborhoods within cities.
� Companies with the skills to develop tailored products and services to meet the needs of an increasingly complex consumer landscape can prosper. It is not just a question of matching footprint to growth markets. The variety of consumers that companies can serve has arguably never been more rich and diverse, both across regions and within them. Those companies that have the skill to manage multispeed, multifaceted, and increasingly diverse markets are more likely to succeed. In many markets, companies may need to strengthen their skills in managing overlapping products and brands.
� Look closely at services as they grow in importance. The growing share of services in overall consumption will, directly or indirectly, have an impact on all consumer-facing businesses. Services are growing faster than overall consumption as consumers spend a rising share of their income on, for example, travel and health care in aging developed markets and education in China’s cities. At the same time, many traditional products incorporate complementary digital or physical services, and some products are being replaced by services.
•••
The era of slowing population growth and aging is already having a profound impact on patterns of consumption. Whereas in the past rising numbers of consumers fueled growth in demand, it will be per capita consumption that drives it to 2030. This means that companies need to work harder to carve out profitable markets. They need to know which consumer segments are likely to be spending more vigorously, where they are, and what they are likely to devote their hard-earned money to. Those companies that gather deep intelligence on the evolving consumption landscape can thrive even in an aging world.

20 McKinsey Global Institute Executive summary
© Getty Images
RELATED MGIAND MCKINSEY RESEARCH
No ordinary disruption: The four global forces breaking all the trends (May 2015) In the Industrial Revolution of the late 18th and early 19th centuries, one new force changed everything. Today our world is undergoing an even more dramatic transition due to the confluence of four fundamental disruptive forces—any of which would rank among the greatest changes the global economy has ever seen.
Global growth: Can productivity save the day in an aging world? (January 2015) Without action, global economic growth will almost halve in the next 50 years. Global employment growth has been slowing for more than two decades, leaving the onus on accelerating productivity growth to power the world’s economic engine.
Urban world: The shifting global business landscape (October 2013) By 2025, almost half of the world’s biggest companies will probably be based in emerging markets, profoundly altering global competitive dynamics.
Urban world tablet app (May 2013) An unprecedented wave of urbanization is driving the most significant economic transformation in history, as the center of economic gravity shifts decisively east. MGI’s new app offers an intuitive sense of this new urban world, showcasing GDP, population, and income levels for more than 2,600 cities worldwide in 2010 and 2025. Available for iPad, iPhone, and Android, from all major app stores.
Urban world: Cities and the rise of the consuming class (June 2012) The speed and scale of urban growth today is astounding. MGI explores the urbanization phenomenon and the impact of the one billion people in rapidly growing emerging-market cities who will become consumers by 2025.
Urban world: Mapping the economic power of cities (March 2011) Six hundred cities—the City 600—are projected to generate more than 60 percent of global growth to 2025. Within this group, companies need to adjust their strategy to include the 577 fast-growing “middleweight cities.”
www.mckinsey.com/mgi
E-book versions of selected MGI reports are available at MGI’s website, Amazon’s Kindle bookstore, and Apple’s iBooks Store.
Download and listen to MGI podcasts on iTunes or at www.mckinsey.com/mgi/publications/multimedia/
Cover image: © Getty Images.

McKinsey Global InstituteApril 2016 Copyright © McKinsey & Company www.mckinsey.com/mgi
@McKinsey_MGI McKinseyGlobalInstitute