Embed Size (px)
Citation preview

Urban Vacant Land Assessment Protocol
EPA 832-R-15-013 July 2016
2014 GREEN INFRASTRUCTURE TECHNICAL ASSISTANCE PROGRAM Buffalo Sewer Authority and University of Buffalo
Buffalo, New York

ii
About the Green Infrastructure Technical Assistance Program
Stormwater runoff is a major cause of water pollution in urban areas. When rain falls in undeveloped areas, soil and plants absorb and filter the water. When rain falls on our roofs, streets, and parking lots, however, the water cannot soak into the ground. In most urban areas, stormwater is drained through engineered collection systems (storm sewers) and discharged into nearby water bodies. The stormwater carries trash, bacteria, heavy metals, and other pollutants from the urban landscape, polluting the receiving waters. Higher flows also can cause erosion and flooding in urban streams, damaging habitat, property, and infrastructure.
Green infrastructure uses vegetation, soils, and natural processes to manage water and create healthier urban environments. At the scale of a city or county, green infrastructure refers to the patchwork of natural areas that provides habitat, flood protection, cleaner air, and cleaner water. At the scale of a neighborhood or site, green infrastructure refers to stormwater management systems that mimic nature by soaking up and storing water. Green infrastructure can be a cost-effective approach for improving water quality and helping communities stretch their infrastructure investments further by providing multiple environmental, economic, and community benefits. This multi-benefit approach creates sustainable and resilient water infrastructure that supports and revitalizes urban communities.
The U.S. Environmental Protection Agency (EPA) encourages communities to use green infrastructure to help manage stormwater runoff, reduce sewer overflows, and improve water quality. EPA recognizes the value of working collaboratively with communities to support broader adoption of green infrastructure approaches. Technical assistance is a key component to accelerating the implementation of green infrastructure across the nation and aligns with EPA’s commitment to provide community focused outreach and support in the President’s Priority Agenda Enhancing the Climate Resilience of America’s Natural Resources. Creating more resilient systems will become increasingly important in the face of climate change. As more intense weather events or dwindling water supplies stress the performance of the nation’s water infrastructure, green infrastructure offers an approach to increase resiliency and adaptability.
For more information about Green Infrastructure, visit http://www.epa.gov/greeninfrastructure.

iii
Acknowledgements
Principal USEPA Team Christopher Kloss, U.S. EPA Headquarters Jamie Piziali, U.S. EPA Headquarters William Shuster, U.S. EPA National Risk Management Research Laboratory
Key Buffalo Area Stakeholders Julie Barrett-O’Neill, Esq., Buffalo Sewer Authority Professor Sean Burkholder, University of Buffalo
Consultant Team John Kosco, Tetra Tech Bill Sharkey, Tetra Tech Mathew Mombrea, Cypress North Jonathan Nalewajek, Cypress North
This report was developed under EPA Contract No. EP-C-11-009 as part of the 2014 EPA Green Infrastructure Technical Assistance Program.
Cover photo credit: The National Map, U.S. Geological Survey

iv
Contents
About the Green Infrastructure Technical Assistance Program ................................................................... ii
Acknowledgements ...................................................................................................................................... iii Executive Summary ....................................................................................................................................... v 1 Introduction ........................................................................................................................................ 1
1.1 Project Setting .............................................................................................................................. 1 1.2 Project Purpose ............................................................................................................................ 1
2 Buffalo Sewer Authority Green Infrastructure Program ..................................................................... 2 3 Project Goals ....................................................................................................................................... 2 4 Urban Vacant Land Assessment Protocol ........................................................................................... 3
4.1 SOP1 – General Site Information Protocol ................................................................................... 3 4.2 SOP2 – Elevation, Transects, and Station Point Protocol ............................................................. 5 4.3 SOP3 – Vegetation Information Protocol ..................................................................................... 9 4.4 SOP4 – Waste and Debris Information Protocol .......................................................................... 9
4.5 SOP5 – Pervious/Impervious Surfaces Protocol ......................................................................... 10 5 Technical Application ........................................................................................................................ 10 6 Protocol Implementation Considerations ......................................................................................... 11
6.1 Variability of Data ....................................................................................................................... 11
6.2 Lessons Learned .......................................................................................................................... 12 6.3 Opportunities for Further Analysis ............................................................................................. 12
7 Conclusion ......................................................................................................................................... 12 8 References ......................................................................................................................................... 13 Appendix A – Urban Vacant Land Assessment Protocol Standard Operating Procedures
Appendix B – Urban Vacant Land Assessment Protocol Checklist
Figures
Figure 1. Vacant house, pre-demolition, in Buffalo. ..................................................................................... 1 Figure 2. Potential green infrastructure. ...................................................................................................... 2 Figure 3. Generic site layout design. ............................................................................................................. 4 Figure 4. The field crew lays out transects. .................................................................................................. 5 Figure 5. The field crew performs a penetration test using a single mass penetrometer. .......................... 5 Figure 6. Obtaining a soil core ...................................................................................................................... 6 Figure 7. Identifying soil texture by feel. ...................................................................................................... 7 Figure 8. Soil textural triangle. ...................................................................................................................... 8 Figure 9. A stand of Phragmites australis. .................................................................................................... 9 Figure 10. Stained soil located on a property. .............................................................................................. 9 Figure 11. The field crew performs an infiltration test using a tension infiltrometer. ............................... 10 Figure 12. Screen capture of Soil Type entry screen for App ..................................................................... 11 Figure 13. Screen shot of Review screen on the mobile application. ......................................................... 11
v
Executive Summary
Since 1950, the population of the City of Buffalo has decreased approximately 40 percent due to the combination of suburbanization and the loss of a large portion of the city’s industrial base. Through state and federal grants, the City of Buffalo undertook a demolition program to remove and discard dilapidated buildings. As of April 2015, the city has demolished more than 5,000 vacant or abandoned buildings, with many more scheduled for demolition.
The vacant lots left after the demolition program present an opportunity to provide ecological benefits such as green space and stormwater runoff retention. The U.S. Environmental Protection Agency (EPA) assisted the Buffalo Sewer Authority (BSA) in developing a method to systematically assess the effectiveness of vacant land in urban areas to retain stormwater runoff. The assessment included collection of relevant information on general site conditions, elevations, vegetation, waste, impervious areas, soil type(s), and soil hydrology. The vacant lot assessments take approximately 1-2 hours per lot, depending on the number of field staff involved. The short time spent on-site results in a large amount of data that can be used to assess and analyze impacts of these vacant lots.
The EPA project team developed the Urban Vacant Land Assessment protocol (Protocol) to support the post-construction monitoring goals associated with BSA’s combined sewer overflow (CSO) Long Term Control Plan. In addition, the protocol may serve as a model for similar communities needing to assess the infiltration capacity of post-demolition vacant lots.
The protocol is divided into five assessment areas:
1) General site information.2) Elevation, transects, and station points.3) Vegetation.4) Wastes.5) Pervious/impervious surfaces.
The project team developed standard operating procedures (SOPs) to specify the on-site activities and data collection required for each of these five assessment areas. The SOPs are included as Appendix A to this report, along with a checklist (Appendix B) that can be used to collect data on each site assessed. The SOPs and checklist provide communities a step-by-step process for field data collection.
To accompany the Protocol, the project team also designed and developed a Buffalo-specific database and mobile tablet-based web application to provide data entry and storage of site information (see Section 5). The application included an electronic form, accessed by an authenticated Internet-connected tablet device, used in the field during demolition assessments.
The results of completed vacant lot assessments could be used to calculate the amount of stormwater that may be retained on different properties. The Protocol could serve as a model for similar communities that need to assess the stormwater and green infrastructure performance of post-demolition vacant lots.

1
1 Introduction
1.1 Project Setting
Since 1950, the population of the City of Buffalo has decreased approximately 40 percent as a result of suburbanization and decline in its local industrial base. This decline in population has resulted in many properties becoming vacant and abandoned (Figure 1). In 2000, 15.7 percent of housing units in the city were vacant (City of Buffalo Comprehensive Plan, Section 2.4.19). As the vacant properties aged, the dilapidated conditions led to health and safety concerns associated with structural stability, fire risks, and lead-based paint and asbestos releases. Additionally, these abandoned properties became a general blight on the city scape.
Through state and federal grants, the city has undertaken a demolition program to remove and discard dangerous and dilapidated buildings. As of April 2015, the City of Buffalo had demolished more than 5,000 vacant or abandoned buildings.
The U.S. Environmental Protection Agency (EPA) has investigated methods to assess soils and soil hydrology in vacant urban lands (Shuster et al. 2014). Vacant lots present an opportunity to provide ecological benefits, such as green space and stormwater runoff retention using passive infiltration. A method to systematically assess the urban vacant land by collecting and analyzing relevant information on site condition, elevation, vegetation, debris, impervious areas, soil types, soil compaction, and soil hydrology could be used to assess the effectiveness of these vacant lots for stormwater runoff retention.
Photo credit: Tetra Tech
Figure 1. Vacant house, pre-demolition, in Buffalo.
1.2 Project Purpose
The purpose of this project was to develop an urban vacant land protocol and mobile (i.e., tablet-based) technical application with which the Buffalo Sewer Authority’s (BSA’s) Green Infrastructure Program could assess systematically the potential for stormwater runoff retention in vacant lots.

2
2 Buffalo Sewer Authority Green Infrastructure Program
In conjunction with its 2014 Combined Sewer Overflow (CSO) Long Term Control Plan (LTCP) Update, BSA submitted a Green Infrastructure Master Plan to EPA and New York State Department of Environmental Conservation in 2014. In the Green Infrastructure Master Plan, BSA proposed to partner with the City of Buffalo to capitalize on the large number of completed and forecasted demolitions, which reduce impervious surfaces within the BSA’s system capture area (Figure 2). The plan identified the addresses of more than 5,300 completed demolitions since the date of the last CSO model calibration and at least 700 planned demolitions. The plan also estimated changes in impervious surface resulting from demolitions and the associated reduction in stormwater runoff into the combined sewer system.
Source: City of Buffalo Comprehensive Plan (Figure 37)
Figure 2. Potential green infrastructure.
3 Project Goals
This project had two goals: the development of an Urban Vacant Land Assessment protocol, and creation of a mobile technical application to capture data in the field while following the protocol.
The primary goal of the project was to develop a systematic protocol to assess the environmental performance of an urban vacant lot that is the product of an intentional demolition process. EPA has developed a tool and report, On the Road to Reuse: Residential Demolition Bid Specification Development Tool (EPA 2013a), that highlights environmental issues associated with residential demolitions and provides examples of bid specification language.
This protocol guides staff on how to assess the potential for stormwater retention on a vacant property, including gathering information on site grading, existing vegetation, evidence of dumping or trash, impervious areas, soil types, soil compaction, and soil hydrology. The protocol is described in section 4 below and in SOPs in Appendix A. The protocol is based, in part, on work completed by Shuster et al. (2014) for EPA to assess vacant lots in Cleveland, Ohio. A checklist to record information collected in the field is also included in Appendix B.

3
In order to facilitate capture, storage, and processing of protocol information, a secondary goal of the project was to develop a Buffalo-specific portable application/database architecture and web application. The required data elements outlined in the protocol served as the basis for the associated tablet-based, electronic form that was used by BSA in the field during urban vacant land assessments.
4 Urban Vacant Land Assessment Protocol
The project team developed a post-demolition Protocol to assess more easily the large number of properties as part of the post-construction monitoring goals associated with BSA’s CSO Long Term Control Plan. The protocol serves as guidance on the assessment of demolished properties located throughout the City of Buffalo.
The protocol (Appendix A) is divided into the following five assessment areas:
1) General site information (SOP1).2) Elevation, transects, and station points (SOP2).3) Vegetation (SOP3).4) Waste and debris (SOP4).5) Pervious/impervious surfaces (SOP5).
For each assessment area, the project team developed an SOP to specify the on-site activities and data needs required to complete the assessment. These SOPs are included as Appendix A to this document and provide a step-by-step process to collect data in the field. In addition to being a resource for the City of Buffalo, the protocol can serve as a model for similar communities needing to assess the stormwater potential of post-demolition vacant lots.
4.1 SOP1 – General Site Information Protocol
SOP1, General Site Information, guides the user through the collection of data related to the condition of a property, adjacent property land use, presence of standing water, and other general property characteristics (e.g., address, demolition date). The data are entered on the protocol checklist in the field while at the subject property.
A generic site layout figure was created to allow assessors to have a standardized way to describe the orientation and location of the properties (Figure 3). This generic site layout is used in each of the SOPs to provide information about the location where specific data elements are collected. The layout below uses the road as a base reference point, with the station points (SP1, SP2, etc.) and quadrants described in relation to the road.

4
Figure 3. Generic site layout design.

5
4.2 SOP2 – Elevation, Transects, and Station Point Protocol
SOP2, Elevation, Transects, and Station Points, guides the user through the collection of data on elevation and soils. Users begin by laying out the transects and station points (See Figure 4). Once the site layout is complete, users determine the elevation change and slope of the property and describe the condition of the area (e.g., grass, other vegetation, bare earth, sealed soil/pavement/structure). Users complete a penetrometer test (soil penetration resistance test – see Figure 5) and collect soil cores to determine soil classification. Users should take photos of the area with measuring tapes in place as well as photos of the soil cores obtained.
Photo credit: Tetra Tech
Figure 4. The field crew lays out transects. Photo credit: Tetra Tech
Figure 5. The field crew performs a penetration test using a single mass penetrometer.
6
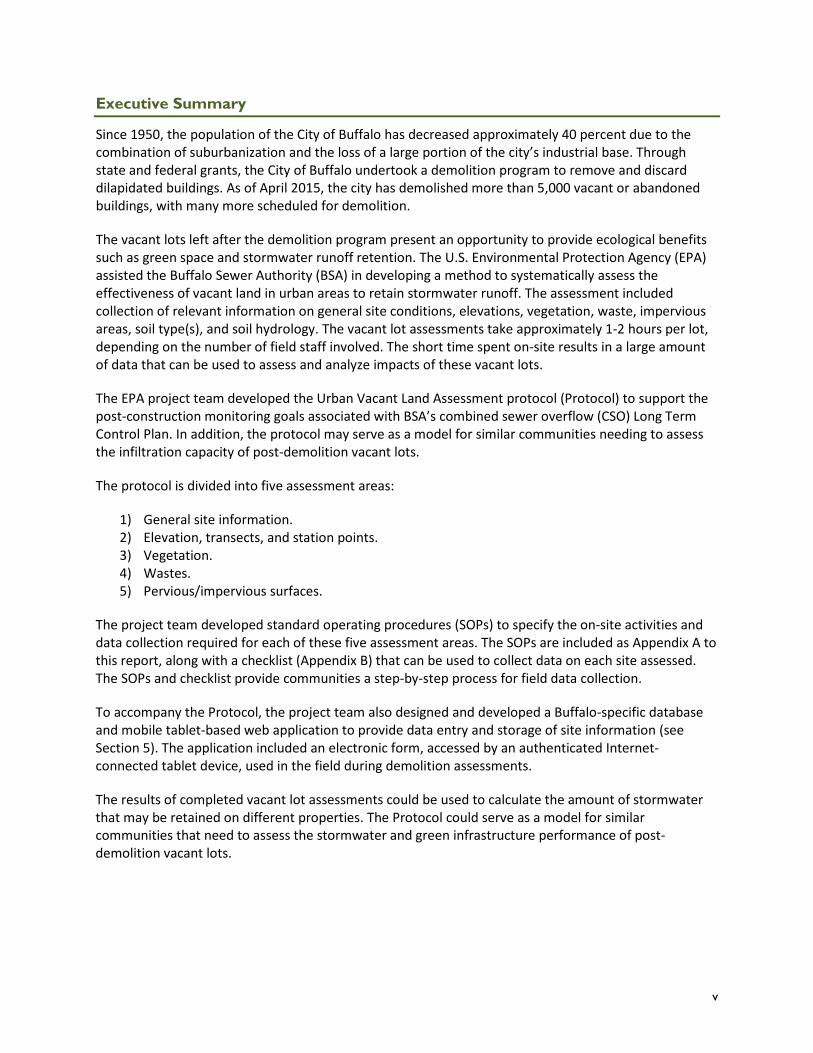
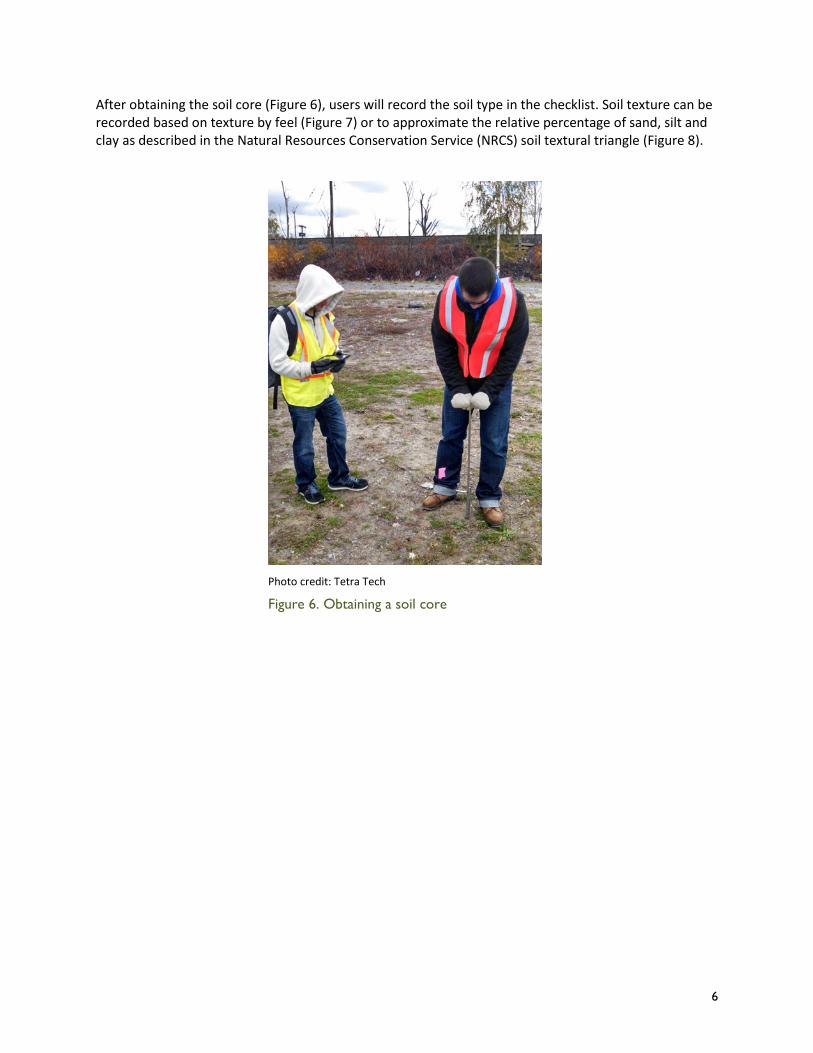
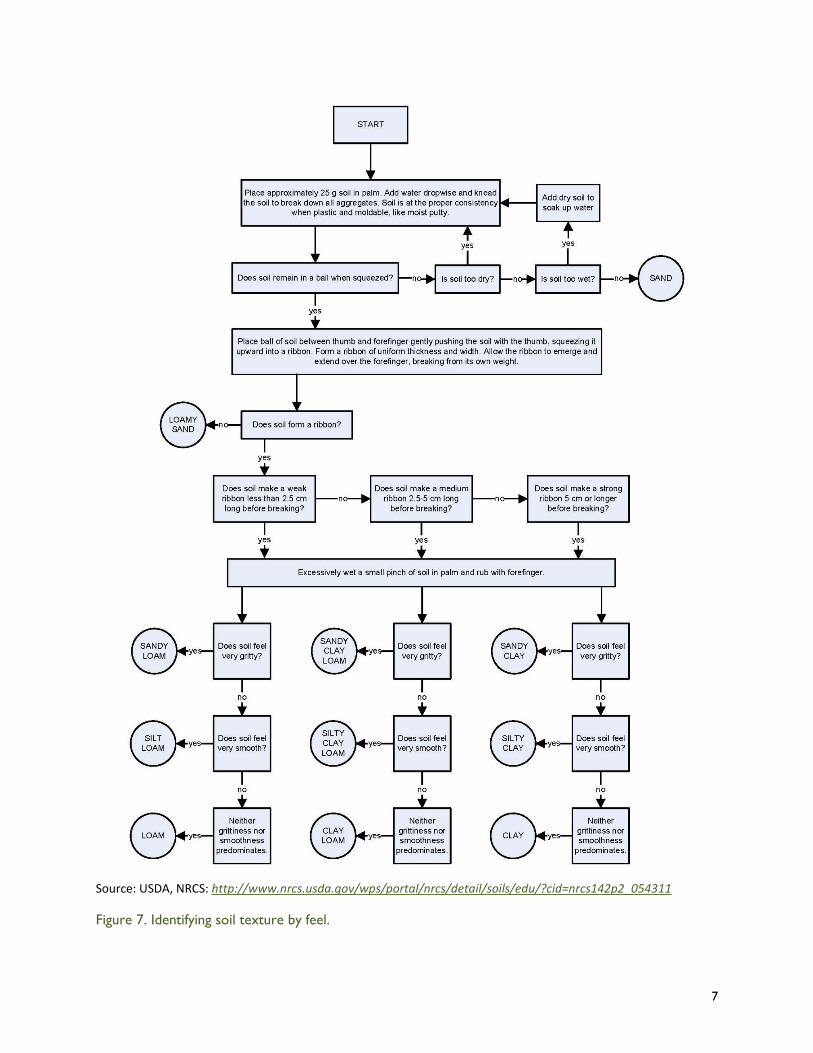
After obtaining the soil core (Figure 6), users will record the soil type in the checklist. Soil texture can be recorded based on texture by feel (Figure 7) or to approximate the relative percentage of sand, silt and clay as described in the Natural Resources Conservation Service (NRCS) soil textural triangle (Figure 8).
Photo credit: Tetra Tech
Figure 6. Obtaining a soil core
7
Source: USDA, NRCS: http://www.nrcs.usda.gov/wps/portal/nrcs/detail/soils/edu/?cid=nrcs142p2_054311
Figure 7. Identifying soil texture by feel.
8
Source: USDA, NRCS: http://www.nrcs.usda.gov/wps/portal/nrcs/detail/soils/edu/?cid=nrcs142p2_054311
Figure 8. Soil textural triangle.

9
4.3 SOP3 – Vegetation Information Protocol
SOP3, Vegetation Information, guides the user through the collection of data on vegetation. Information collected includes the percentage of the site covered in vegetation, the type of vegetation (e.g., grass, brush), the presence and extent of trees at the site, and presence and extent of invasive species.
This protocol includes information on four invasive species in the Buffalo region:
• Phragmites (Figure 9)• Japanese Knotweed• Garlic Mustard• Loosestrife
Users should consult with NRCS’s Invasive Species Information Center (https://www.invasivespeciesinfo.gov/index.shtml) to include invasive species that are specific to their area.
Users should take photos of all types of vegetation present at the site.
Source: http://www.nps.gov/plants/alien/fact/phau1.htm
Figure 9. A stand of Phragmites australis.
4.4 SOP4 – Waste and Debris Information Protocol
SOP4, Waste and Debris Information, guides the user through the collection of data for wastes and debris located on the property. Users collect information on a variety of waste materials, including construction debris, brush piles, metal debris, and stained soils (Figure 10). These data could be used to indicate soil contamination at the property where stormwater should not be infiltrated. Users should take photos of waste and debris materials present at the site. If potential contamination is suspected at a property, one resource to assess whether stormwater infiltration is feasible is the EPA guidance Implementing Stormwater Infiltration Practices at Vacant Parcels and Brownfield Sites (EPA 2013b, http://water.epa.gov/infrastructure/greeninfrastructure/upload/brownfield_infiltration_decision_tool.pdf).
Photo credit: Tetra Tech
Figure 10. Stained soil located on a property.

10
4.5 SOP5 – Pervious/Impervious Surfaces Protocol
SOP5, Pervious/Impervious Surfaces, guides the user through the collection of data on pervious and impervious areas located on the property. Information collected includes the percentage of the site that is pervious and impervious, description of the impervious areas (e.g., concrete, asphalt, other), and the presence of stormwater structures and gutters. Users also perform an infiltration test using a tension infiltrometer (Figure 11). Users should take photos of impervious areas.
Photo credit: Tetra Tech
Figure 11. The field crew performs an infiltration test using a tension infiltrometer.
5 Technical Application
The project team designed a database and web application to accompany the protocol for BSA staff. The Buffalo-specific database and web application allow a user to enter collected data into the database, including site information, grading, existing vegetation, on-site stormwater retention, impervious surfaces, and evidence of dumping or trash. These data are stored in the database and can be accessed anytime via a computer.
The project team also developed the application programming interface (API) to allow for communication between mobile devices and the core web-based application (Figures 12 and 13). The API was developed to be flexible and allow for future additions. The team simultaneously developed a mobile technical application and a web-based management tool so that the web-based application is accessible from any authenticated, Internet-connected device. The mobile application, which can be uploaded to a mobile device (e.g., a tablet) and used in the field, operates over both WiFi and cellular networks. Users can enter

11
data directly into the application, take photos with the mobile device, and submit those with an assessment. The mobile application makes use of GPS where applicable (for example, site search by proximity).
Photo credit: Tetra Tech
Figure 12. Screen capture of Soil Type entry screen for App
Photo credit: Tetra Tech
Figure 13. Screen shot of Review screen on the mobile application.
6 Protocol Implementation Considerations
Implementation of the protocol will involve careful consideration of issues such as data variability, field staff logistics, and soil variables at urban sites.
6.1 Variability of Data
There are several considerations that may impact the effectiveness of stormwater retention on a property. At one time it was common for demolition debris to be buried on site, but more recent demolitions conducted by the city follow a set of specifications to avoid this practice. It is anticipated

12
that unconsolidated demolition debris would affect a property’s ability to retain stormwater. For this reason, assessors should consider the age of the demolition when assessing the property.
In addition, the former location of the foundation and driveway could impact soil infiltration capacity. Penetration tests could be used in these areas to confirm assumptions about soil compaction and indicate whether construction debris is still present at the site.
Differing soil textures have different hydraulic characteristics affecting stormwater retention rates and quantities. The soil classification required in the protocol will indicate the soil textures on the property. The infiltration test will indicate how permeable to water the landscape is. Two infiltration measurements are completed in the interest of time efficiency and to compare results.
6.2 Lessons Learned
After conducting several dozen urban vacant land assessments, BSA and the University of Buffalo noted several lessons learned:
1. Soil conductivity tests take the most time compared to all other assessment tasks.
2. Soil variability has proven to be quite high, and significant time should be dedicated to assuring soil texture by feel tests are conducted properly (see Figure 7).
3. Penetrometer tests can be noisy and distracting to residents and should be conducted at times when they are the least disruptive.
4. Developing methodologies to account for underground obstructions and the refusal of equipment such as the penetrometer and soil sampler must be put in place on urban sites.
5. Due to the larger number of sites, a system of data checking and oversight of the assessment process needs to be in place to ensure quality results.
6.3 Opportunities for Further Analysis
The results of the penetration test will aid in determining where and to what extent debris is buried on the property. The penetration test results could also be compared to the infiltration test and soil textures to identify areas for potential green infrastructure practices. Additionally, the results of the penetration test could be used to develop “typical” locations for former structure and driveway locations, aiding in the assessment of a neighborhood or community with similar urban characteristics.
Results of the infiltration tests can be used to estimate the hydraulic conductivity (K) specific to each property. This value could be compared to the anticipated values for the soil types encountered on the site to look for anomalies or compacted soil conditions. The K could be used to estimate the ability of the vacant lot to detain stormwater runoff volume (see Shuster et al. 2014 for more information).
7 Conclusion
The project team successfully prepared a Protocol and an associated technical application to assess property information, site grading, existing vegetation, evidence of dumping or trash, impervious areas, soil texture, soil compaction, and soil hydrology for the vacant lots located in the City of Buffalo.

13
The results of vacant lot assessments can be used to assess large numbers of parcels for stormwater infiltration potential and to target resources to the sites that provide the largest benefit in terms of stormwater retention. The vacant lot assessments should take approximately 1-2 hours per lot, depending on the number of field staff involved. The short time spent on site results in a large amount of data that can be used to assess and analyze impacts of these vacant lots.
As vacant properties are assessed and data are entered into the technical application, BSA will be better able to evaluate the effectiveness of the vacant lots as stormwater runoff retention areas. This protocol and technical application could serve as a model for similar communities needing to assess the stormwater and green infrastructure performance of post-demolition vacant lots.
There are a number of additional resources that readers may want to consider. A similar vacant lot assessment was conducted in Cleveland, Ohio, and described in Shuster et al. 2014. EPA’s On the Road to Reuse: Residential Demolition Bid Specification Development Tool (EPA 2013a) includes a menu of bid specification development tools for municipalities involved in residential demolition operations. EPA has also developed a guidance document to help assess infiltration potential at vacant lots (EPA 2013b).
8 References
EPA. 2013a. On the Road to Reuse: Residential Demolition Bid Specification Development Tool. EPA 560-K-12-002. http://www2.epa.gov/large-scale-residential-demolition/road-reuse-residential-demolition-bid-specification-development.
EPA. 2013b. Stormwater Infiltration Practices at Vacant Parcels and Brownfield Sites. EPA 905-F-13-001. http://water.epa.gov/infrastructure/greeninfrastructure/upload/brownfield_infiltration_decision_tool.pdf.
Shuster, W.D., S. Dadio, P. Drohan, R. Losco, and J. Shaffer. 2014. Residential demolition and its impact on vacant lot hydrology: Implications for the management of stormwater and sewer system overflows. Landscape and Urban Planning 125:48–56.

Appendix A – Urban Vacant Land Assessment Protocol Standard Operating Procedures

Appendix A – Vacant Land Assessment Protocol Standard Operating Procedures (SOPs)
A-1
1 Equipment and Preparation ............................................................................................................ A-1
2 SOP 1 – General Site Information Protocol ..................................................................................... A-3
3 SOP 2 – Elevation, Transects, and Station Point Data ..................................................................... A-5
4 SOP 3 – Vegetation Data ............................................................................................................... A-11
5 SOP 4 – Waste and Debris Data .................................................................................................... A-14
6 SOP 5 – Pervious/Impervious Surface Data .................................................................................. A-16
1 Equipment and Preparation
Before starting any vacant land assessments, each field team must ensure it has the proper equipment and is prepared to conduct the assessments.
1.1 Equipment and Materials
Each team should have the following equipment available to them as they conduct the vacant land assessment:
• Badges/permits/right of entry • Safety traffic vest and steel toed shoes • Map of subject properties • Field notebook • SOPs, protocol, maps, site sketches • Field camera/photographic documentation • Field in containing:
– Pencils/pens – 5 gallon bucket lid – String – Pin flags – Survey stakes – 2 tape measures – Hammer – Gloves – Trash bag – Emergency first aid kit – Safety traffic vest(s) – Safety glasses – Hardhat (if overhead hazards are present)
• Cell phone – Cell phone car charger

Appendix A – Vacant Land Assessment Protocol Standard Operating Procedures (SOPs)
A-2
1.2 Badges/Permits/Right of Entry
Obtain proper badges for identification in the field in case there are questions from an authority (e.g., police) or inquisitive neighbors. The City may want to conduct outreach to residents explaining the purpose of the Vacant Land Assessment and explaining that field crews will be in their neighborhood. A brief letter from the City describing the vacant land assessment protocol purpose and who to contact with any questions may be helpful (the field team should have multiple copies of this letter to hand out). Ensure any special access requirements have been addressed prior to field visit to eliminate wait time or having to visit a site more than once.
1.3 Map of Subject Properties
Identify all properties in inspector’s given cluster/s. Verify the address to a location on the map. Devise a route to visit each subject property in the cluster to save time and mileage.
1.4 SOPs, Protocol, Checklist, Site Sketches
All field personnel must have a copy of the Urban Vacant Land Assessment Protocol and associated SOPs with them at all times. The Protocol Checklist must be completed before leaving each site to ensure the checklist was filled out accurately and completely.
The Protocol Checklist will be used to document all field operations and will contain sufficient data and information to reconstruct field activities for a specific day. At a minimum, the Checklist will contain:
• Date and time the field work started and completed • Names and titles of field personnel and those present onsite • Location and description of the property site • Meteorological conditions at the start of field work and changes in these conditions • A sketch of the subject property to be scanned at the end of the day and stored with the site
data • Data collected in accordance with the SOPs • Any deviations from the Urban Vacant Land Assessment Protocol or SOP(s)
1.5 Camera/Photographic Documentation
Photographs will be taken throughout the field work to further document the environmental setting and conditions and to record remarkable or noteworthy visual characteristics of site features. Photo documentation will include photographs of the study site, physical setting, and any remarkable observations.
Photographs should be organized by site. Assessors can help organize photos by making sure the first photo at each site includes the site address and/or tax ID number (take a picture of the checklist with this information filled out).
1.6 Safety
Field personnel may be working in areas with elevated crime rates. For this reasons, a safety program may be useful to support the field staff conducting assessments. The safety program could provide an

Appendix A – Vacant Land Assessment Protocol Standard Operating Procedures (SOPs)
A-3
emergency protocol detailing the step-by-step notifications required in the event of an emergency and include the locations of hospitals or medical clinics. Communities planning for this kind of effort may want to coordinate with the local police department as well as conduct a general public education and outreach campaign to make citizens aware of the project’s purpose and goals.
All field crews should have a working, charged cell phone with them at all times for communication.
2 SOP 1 – General Site Information Protocol
2.1 General site data collection
The assessor should complete the general site information section of the Protocol Checklist. This section includes basic information about the property being assessed, including address, tax ID number, and site size as well as the date of the assessment and the beginning/ending times of the assessment.
The assessor should orient themselves to the subject property along the street front facing the property as indicated in Figure 1. Figure 1 also provides information on defining the station points, quadrants, and adjacent property numbering system.
Site Characteristics (Checklist items II.1 to II.5 and V.7)
II.1. Is there a standing structure on site? Yes/No. If no, what year was the structure demolished?
II.2. Is there standing water on the property? Yes/No. If yes, where? (which quadrant(s) – 1, 2, 3, 4, or N/A). If yes, was the last precipitation event in the last 48 hours? What was the amount? Enter date and time last precipitation event ended. Enter amount of last precipitation event.
II.3. Are there curb cuts present? Yes/No
II.4. Are there any gutters or down spouts on or facing the property? Yes/No
II.5. What are the conditions/land uses of the nearby properties? Refer to Figure 1. Document the condition for Adjacent Properties 1, 2, and 3 as well as the opposite parcel. Typical conditions/land uses include:
• BSR – Boarded Structure Residential • BSC – Boarded Structure Commercial • VSR – Vacant Structure Residential • VSC – Vacant Structure Commercial • VP – Vacant Parcel • OS – Occupied Home / Structure • MG – Managed Green Space • OT – Other (Describe)
V.7. Are there any dumping, downed wires, or other unsafe conditions that would require rapid inspection and clean-up from the city? Yes/No

Appendix A – Vacant Land Assessment Protocol Standard Operating Procedures (SOPs)
A-4
2.2 Final Checks
• Obtain proper badges and all required permits (if needed). • Bring field notebook and all documentation (protocol, maps, SOPs, etc.). • Bring field bin with all items including an emergency first aid kit. • Employ the buddy system and remember field work has its hazards.
Figure 1. Site Assessment Layout
Appendix A – Vacant Land Assessment Protocol Standard Operating Procedures (SOPs)
A-5
3 SOP 2 – Elevation, Transects, and Station Point Data
3.1 Overview
The vacant land assessment will require the collection of elevation, transect, and station point information. A step-by-step protocol has been developed and should be followed closely by field personnel. Natural Resources Conservation Service (NRCS) representatives should be used to train the inspectors on the soil feel test and soil classification. Soil education from NRCS is available at http://www.nrcs.usda.gov/wps/portal/nrcs/main/soils/edu/.
3.2 Site Transect Protocol
1. Place pin flags or pound survey stakes into the ground at Station Points SP1, SP2, SP3, and SP4. 2. String measuring tapes from Station Points SP1-SP3 and SP4-SP2 to create two transects using
level to establish baseline. 3. Locate SP9 at intersection of tapes. 4. Locate 4 points along each transect tape by dividing length of transect by 4 to determine mid-
points. 5. Flag all 9 Station Points.
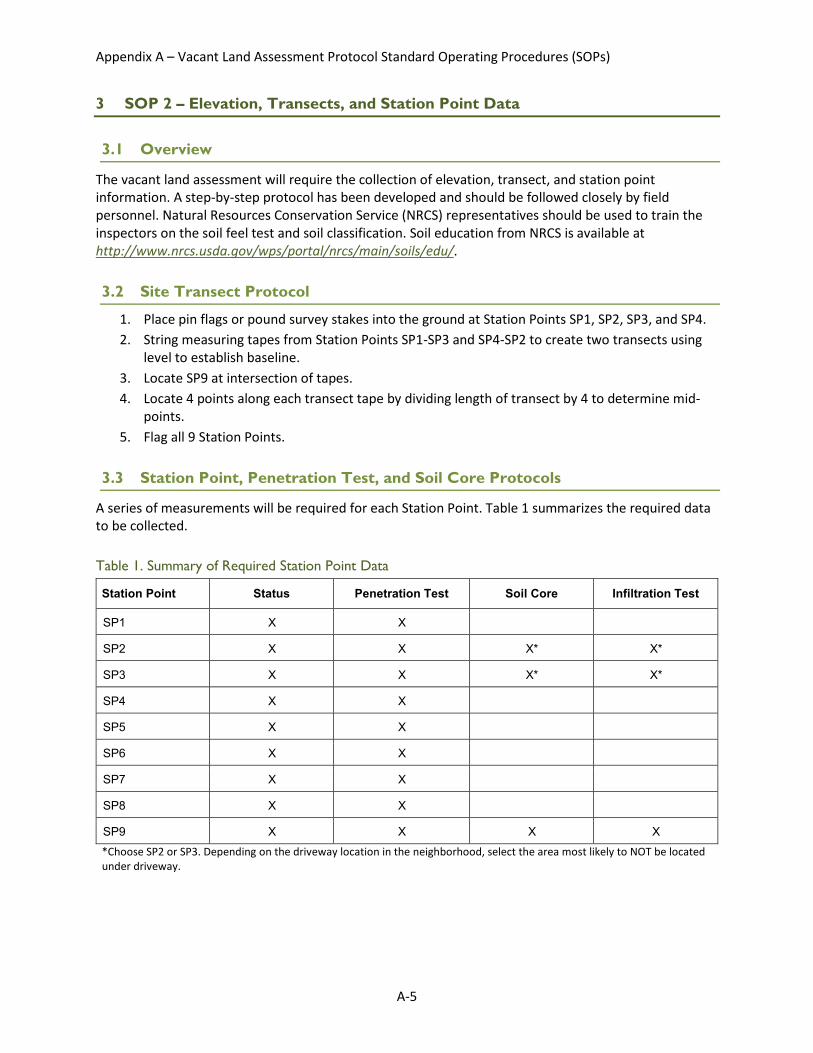
3.3 Station Point, Penetration Test, and Soil Core Protocols
A series of measurements will be required for each Station Point. Table 1 summarizes the required data to be collected.
Table 1. Summary of Required Station Point Data
Station Point Status Penetration Test Soil Core Infiltration Test
SP1 X X
SP2 X X X* X*
SP3 X X X* X*
SP4 X X
SP5 X X
SP6 X X
SP7 X X
SP8 X X
SP9 X X X X *Choose SP2 or SP3. Depending on the driveway location in the neighborhood, select the area most likely to NOT be located under driveway.

Appendix A – Vacant Land Assessment Protocol Standard Operating Procedures (SOPs)
A-6
Station Point Status Protocol
1. Describe the 2’ diameter area at each SP using the 5-gallon bucket lid to demark area. Options include: vegetated grass, vegetated other, bare earth, sealed soil/pavement/structure.
2. Take photographs while tapes are still in place. 3. Measure the following elevations:
What is the elevation change from SP9 to SP1 x.x ft
What is the elevation change from SP9 to SP2 x.x ft
What is the elevation change from SP9 to SP3 x.x ft
What is the elevation change from SP9 to SP4 x.x ft
Penetration Test Protocol
It is recommended that the assessors perform penetration tests at all nine (9) station points, however penetration test data can be collected from less than all nine (9) station points.
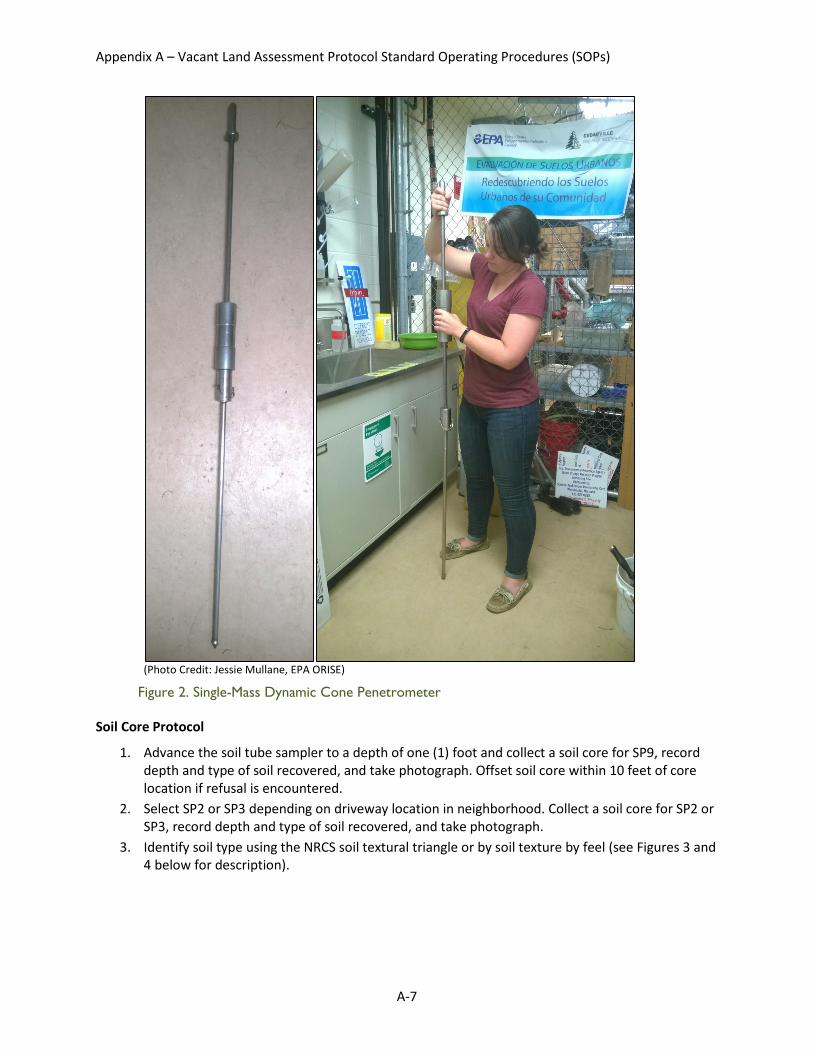
1. Drive the single mass dynamic cone penetrometer (Figure 2) or equivalent at all station points. A typical penetrometer design is shown below.
2. Record the number of blows to 2 inches (one increment), 4 inches (two increments), and 6 inches (three increments) or to refusal depth, and for a maximum of 30 blows.
Appendix A – Vacant Land Assessment Protocol Standard Operating Procedures (SOPs)
A-7
(Photo Credit: Jessie Mullane, EPA ORISE)
Figure 2. Single-Mass Dynamic Cone Penetrometer
Soil Core Protocol
1. Advance the soil tube sampler to a depth of one (1) foot and collect a soil core for SP9, record depth and type of soil recovered, and take photograph. Offset soil core within 10 feet of core location if refusal is encountered.
2. Select SP2 or SP3 depending on driveway location in neighborhood. Collect a soil core for SP2 or SP3, record depth and type of soil recovered, and take photograph.
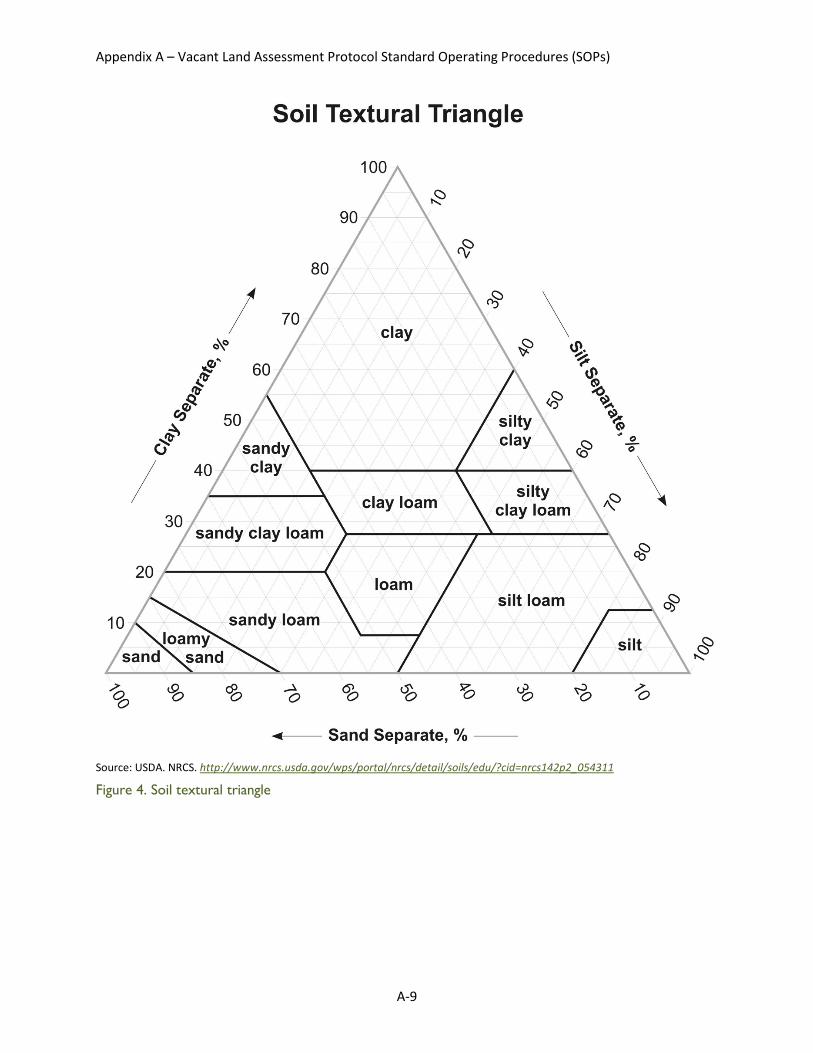
3. Identify soil type using the NRCS soil textural triangle or by soil texture by feel (see Figures 3 and 4 below for description).

Appendix A – Vacant Land Assessment Protocol Standard Operating Procedures (SOPs)
A-8
Source: USDA, NRCS. http://www.nrcs.usda.gov/wps/portal/nrcs/detail/soils/edu/?cid=nrcs142p2_054311
Figure 3. Identifying soil texture by feel.
Appendix A – Vacant Land Assessment Protocol Standard Operating Procedures (SOPs)
A-9
Source: USDA. NRCS. http://www.nrcs.usda.gov/wps/portal/nrcs/detail/soils/edu/?cid=nrcs142p2_054311
Figure 4. Soil textural triangle

Appendix A – Vacant Land Assessment Protocol Standard Operating Procedures (SOPs)
A-10
3.4 Elevation, Transects, and Station Point Information Data Collection
The step-by-step sequence for populating the Elevation, Transects, and Station Point Information in the checklist is described below:
Station Point Status (checklist items III.1 to III.7)
III.1. What is the general slope of the property? Enter the general slope such as slopes front to back or slopes east to west
III.2. Is there a depression on the site? If yes, where (which quadrant(s))? Select from: 1, 2, 3, 4, or N/A
III.3. Is there a high point on the site? If yes, where (which quadrant(s))? Select from: 1, 2, 3, 4, or N/A
III.4. What is the elevation change from SP9 to SP1?
III.5. What is the elevation change from SP9 to SP2?
III.6. What is the elevation change from SP9 to SP3?
III.7. What is the elevation change from SP9 to SP4?
Penetration Test Results (checklist items III.8 to III.16)
For each of the station points where the penetration test was conducted, enter the penetration results. For Status, choose from VG- Vegetated Grass, VO- Vegetated Other, BE- Bare Earth, or SS- Sealed Soil/Pavement/Structure. Enter number of penetrometer blows for the 2-inch, 4-inch, and 6-inch intervals.
Soil Test (checklist items III.17 to III.18)
III.17. What is the SP9 soil depth and type?
III.18. What is the SP2/SP3 soil depth and type? Indicate whether soil depth was taken from SP2 or SP3.
3.5 Final Checks
• Confirm all required elevation, transect, and station point data has been collected. • Confirm photographic documentation has been collected while the measuring tapes are still in
place. • Collect photographs of soil cores.

Appendix A – Vacant Land Assessment Protocol Standard Operating Procedures (SOPs)
A-11
4 SOP 3 – Vegetation Data
4.1 Overview
The urban vacant land assessment will require the identification of vegetation including grass, brush, and trees, along with invasive species. This protocol includes invasive species specific to Buffalo. NRCS’s Invasive Species Information Center (https://www.invasivespeciesinfo.gov/index.shtml) has information on invasive species that are specific to different areas around the country.
Invasive species in Buffalo include phragmites, Japanese knotweed, garlic mustard, and loosestrife. Assessors are required to identify these species at the subject properties. To aid in this effort, example photographs have been included in this SOP in section 4.3. If assessors are not comfortable identifying these species, then the assessor should be paired with an assessor that is capable of identifying the vegetation. Additional training on species identification should also be considered.
4.2 Populating the Vegetation Site Information Data
The step-by-step sequence for populating the Vegetation Site Information in the data entry form is described below:
Vegetation (checklist items IV.1 to IV.7)
IV. What percentage of the site is covered with vegetation?
IV.1. Are there trees present on site? If yes, what percentage of the site is covered with trees?
IV.2. Is there significant grass on site? If yes, what percentage of the site is covered with grass?
IV.3. Is there significant brush vegetation on site? This is referring to plants that could be mowed over and not grass. If yes, what percentage of the site is covered with brush?
IV.4. Is there Phragmites on site? See Section 4.3 for photographic examples of Phragmites. If yes, where (which quadrant(s))? See Figure 1 for site orientation/layout.
IV.5. Is there Knotweed on site? See Section 4.3 for photographic examples of Knotweed. If yes, where (which quadrant(s))?
IV.6. Is there Garlic Mustard on site? See Section 4.3 for photographic examples of Garlic Mustard. If yes, where (which quadrant(s))?
IV.7. Is there Loosestrife on site? See Section 4.3 for photographic examples of Loostrife. If yes, where (which quadrant(s))?
Appendix A – Vacant Land Assessment Protocol Standard Operating Procedures (SOPs)
A-12
4.3 Vegetation Examples
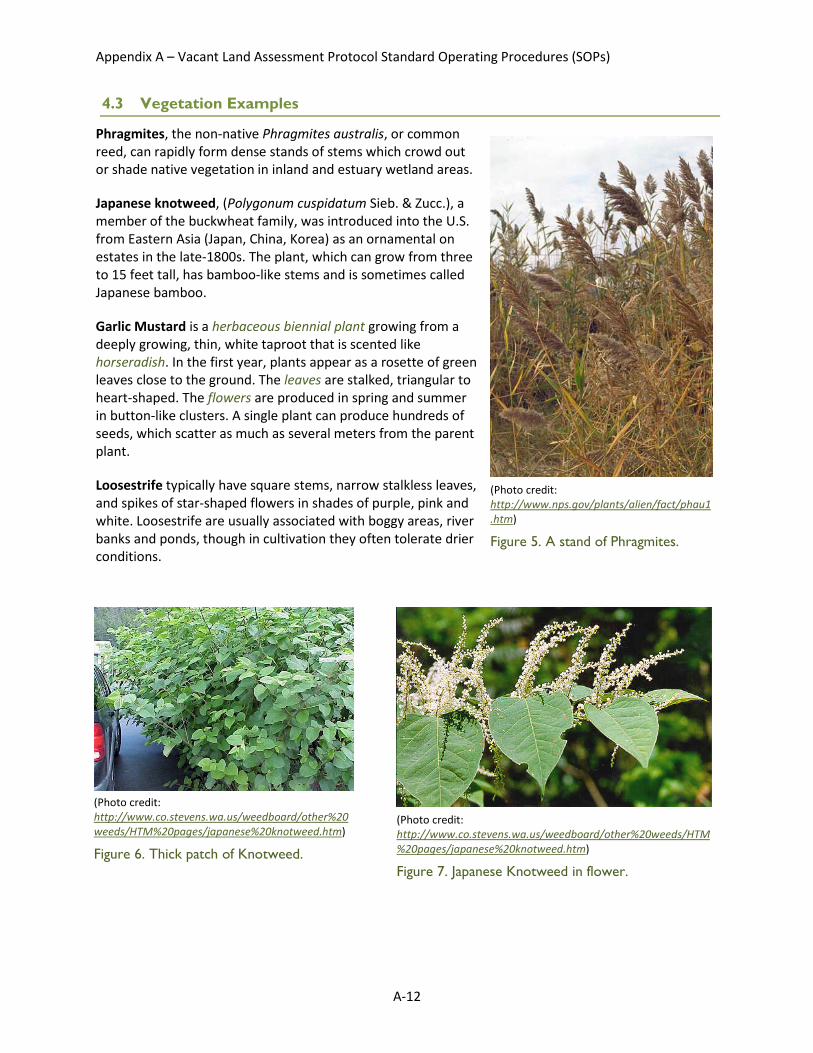
Phragmites, the non-native Phragmites australis, or common reed, can rapidly form dense stands of stems which crowd out or shade native vegetation in inland and estuary wetland areas.
Japanese knotweed, (Polygonum cuspidatum Sieb. & Zucc.), a member of the buckwheat family, was introduced into the U.S. from Eastern Asia (Japan, China, Korea) as an ornamental on estates in the late-1800s. The plant, which can grow from three to 15 feet tall, has bamboo-like stems and is sometimes called Japanese bamboo.
Garlic Mustard is a herbaceous biennial plant growing from a deeply growing, thin, white taproot that is scented like horseradish. In the first year, plants appear as a rosette of green leaves close to the ground. The leaves are stalked, triangular to heart-shaped. The flowers are produced in spring and summer in button-like clusters. A single plant can produce hundreds of seeds, which scatter as much as several meters from the parent plant.
Loosestrife typically have square stems, narrow stalkless leaves, and spikes of star-shaped flowers in shades of purple, pink and white. Loosestrife are usually associated with boggy areas, river banks and ponds, though in cultivation they often tolerate drier conditions.
(Photo credit: http://www.nps.gov/plants/alien/fact/phau1.htm)
Figure 5. A stand of Phragmites.
(Photo credit: http://www.co.stevens.wa.us/weedboard/other%20weeds/HTM%20pages/japanese%20knotweed.htm)
Figure 6. Thick patch of Knotweed.
(Photo credit: http://www.co.stevens.wa.us/weedboard/other%20weeds/HTM%20pages/japanese%20knotweed.htm)
Figure 7. Japanese Knotweed in flower.

Appendix A – Vacant Land Assessment Protocol Standard Operating Procedures (SOPs)
A-13
(Photo credit: http://www.nps.gov/plants/alien/fact/alpe1.htm)
Figure 8. Garlic Mustard.
Photo credit: http://www.nps.gov/plants/alien/fact/lysa1.htm
Figure 9. Loosestrife.
4.4 Final Checks
• Remember to take picture of vegetative species, particularly phragmites and Japanese knotweed.
• Confirm all required Vegetative Information Data has been collected.
Appendix A – Vacant Land Assessment Protocol Standard Operating Procedures (SOPs)
A-14
5 SOP 4 – Waste and Debris Data
5.1 Overview
The vacant land assessment will require the identification of waste items located on the subject properties. Waste items anticipated to be observed on site are:
• Refuse • Automotive debris • Brush debris • Metal debris • Construction debris • Presence of stained soil
Section 5.3 has more information on the various types of waste expected to be observed. Additional training on waste identification should also be considered if the assessors are having difficulties identifying waste items.
5.2 Populating the Waste Data
The following is the step-by-step sequence for populating the Waste Information in the data entry form:
Waste and Debris (checklist items V.1 to V.7)
V.1. Is there trash on the property? If yes, where (which quadrant(s))? See Figure 1 for site orientation/layout.
V.2. Is there automotive waste on the property? If yes, where (which quadrant(s))?
V.3. Is there brush debris on the property? If yes, where (which quadrant(s))?
V.4. Is there metal debris on the property? If yes, where (which quadrant(s))?
V.5. Is there construction debris on the property? If yes, where (which quadrant(s))?
V.6. Is there stained soil on the property? If yes, where (which quadrant(s))?
VII. Include in the Notes section any information on waste and debris at the site that is not captured in the above questions.
Ensure all data fields associated with the waste data information have been completely filled in. Document any waste observed with photographs.

Appendix A – Vacant Land Assessment Protocol Standard Operating Procedures (SOPs)
A-15
5.3 Debris examples
(photo credit: Tetra Tech) Figure 10. Example of Metal Debris
(photo credit: Tetra Tech) Figure 11. Example of Construction Debris
(photo credit: Tetra Tech) Figure 12. Example of stained soil
5.4 Final Checks
• Remember to take pictures of waste observed onsite. • Confirm all required Waste Information Data has been collected.

Appendix A – Vacant Land Assessment Protocol Standard Operating Procedures (SOPs)
A-16
6 SOP 5 – Pervious/Impervious Surface Data
6.1 Infiltration Test Procedures
Follow the procedures below to determine the infiltration rate for a location at the site: 1. Locate two test locations in the center of the property free of debris. Mark the location of each
infiltration test on the site sketch. 2. Fill Mini Disc Portable Tension Infiltrometers with tap water. Adjust the air tube so that it is 2 cm
(two increments below the water surface in the top compartment). (The instrument is illustrated below.)
3. Place a thin 1-2 cm thick layer of #550 sand or equivalent at test locations. 4. Place the first Mini Disc Portable Tension Infiltrometer at the test location 1. 5. Record 0.5-, 1-, 2-, 3-, 4-, 5-, 10-, 15-, and 20-minute interval water levels. 6. Place the second Mini Disc Portable Tension Infiltrometer at the test location 2 approximately
one foot away from test location 1. 7. Record 0.5-, 1-, 2-, 3-, 4-, 5-, 10-, 15-, 20-minute interval water levels. 8. Allow the test to run until equilibrated, typically 20-30 minutes. 9. Calculate steady-state inflow rate in milliliters per minute (ml/min); see example below.

Appendix A – Vacant Land Assessment Protocol Standard Operating Procedures (SOPs)
A-17
Source: Jessie Mullane, EPA ORISE
Figure 13. Mini Disc Portable Tension Infiltrometer
Steady-State Inflow Rate Example
An example of the infiltrometer results, where you are looking for three equal drops in water level over three equal time intervals, follows:
Appendix A – Vacant Land Assessment Protocol Standard Operating Procedures (SOPs)
A-18
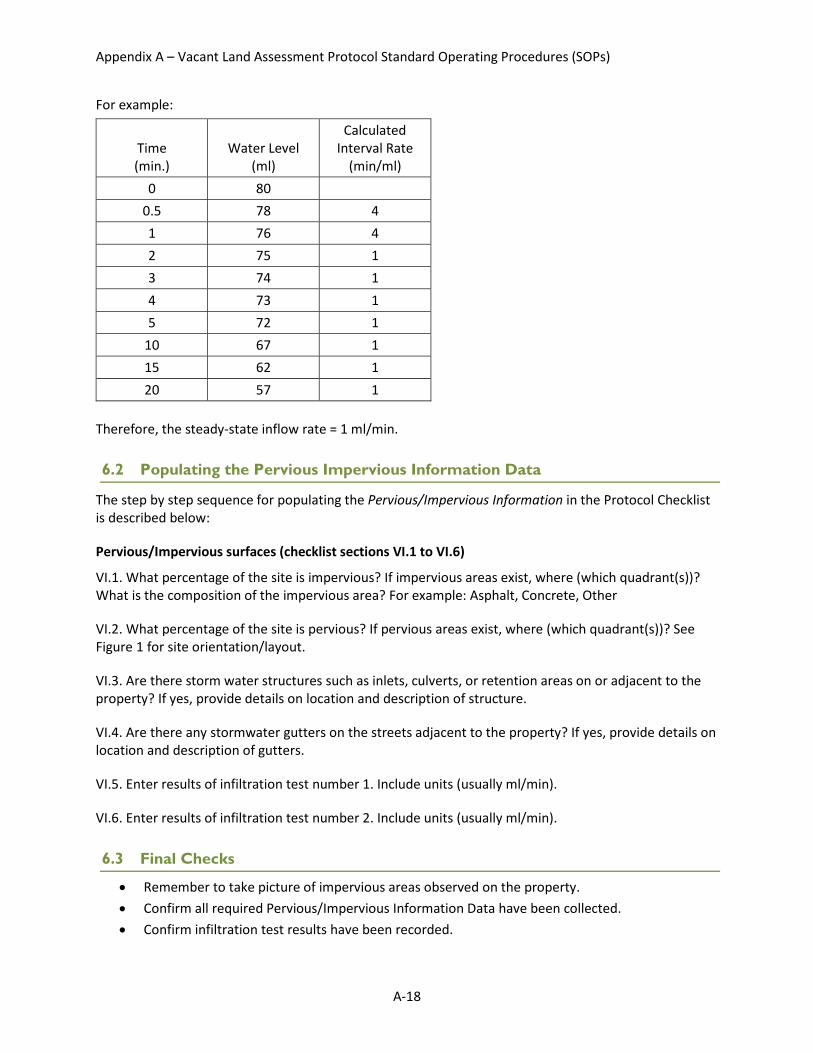
For example:
Time (min.)
Water Level (ml)
Calculated Interval Rate
(min/ml) 0 80
0.5 78 4 1 76 4 2 75 1 3 74 1 4 73 1 5 72 1
10 67 1 15 62 1 20 57 1
Therefore, the steady-state inflow rate = 1 ml/min.
6.2 Populating the Pervious Impervious Information Data
The step by step sequence for populating the Pervious/Impervious Information in the Protocol Checklist is described below:
Pervious/Impervious surfaces (checklist sections VI.1 to VI.6)
VI.1. What percentage of the site is impervious? If impervious areas exist, where (which quadrant(s))? What is the composition of the impervious area? For example: Asphalt, Concrete, Other
VI.2. What percentage of the site is pervious? If pervious areas exist, where (which quadrant(s))? See Figure 1 for site orientation/layout.
VI.3. Are there storm water structures such as inlets, culverts, or retention areas on or adjacent to the property? If yes, provide details on location and description of structure.
VI.4. Are there any stormwater gutters on the streets adjacent to the property? If yes, provide details on location and description of gutters.
VI.5. Enter results of infiltration test number 1. Include units (usually ml/min).
VI.6. Enter results of infiltration test number 2. Include units (usually ml/min).
6.3 Final Checks
• Remember to take picture of impervious areas observed on the property. • Confirm all required Pervious/Impervious Information Data have been collected. • Confirm infiltration test results have been recorded.

Appendix B – Urban Vacant Land Assessment Protocol Checklist

Urban Vacant Land Assessment Protocol Checklist I. General Site Information
Site Address
Tax ID Number
Site owner (if available) Date of Assessment Field staff
Time Began
Time Completed
Weather during assessment
Site size (ft2)
Latitude of SP1 (see Fig. 1)
Longitude of SP1
Figure 1. Guide for identifying site features
II. Site Characteristics1.) Is there a standing structure on site? Y/N If no, what year was the structure demolished? 2.) Is there standing water on the
property? Y/N If yes, in which quadrant(s)?
Was the last precipitation event in the last 48 hrs? What was the amount?
3.) Are there curb cuts present? Y/N 4.) Are there any gutters or down spouts
on or facing the property? Y/N If yes, describe.
5.) What are the conditions or land uses of the nearby properties? (Refer to Figure 1.)
Land use Adjacent Parcel 1
Adjacent Parcel 2
Adjacent Parcel 3 Opposite Parcel
Boarded Structure Residential (BSR) Boarded Structure Commercial (BSC) Vacant Structure Residential (VSR) Vacant Structure Commercial (VSC) Vacant Parcel (VP) Occupied Home / Structure (OS) Managed Green Space (MG) Other (OT) Describe:
*See Figure 1 for a description of how to identify the layout and features of the site. 1
*See Figure 1 for a description of how to identify the layout and features of the site. 2
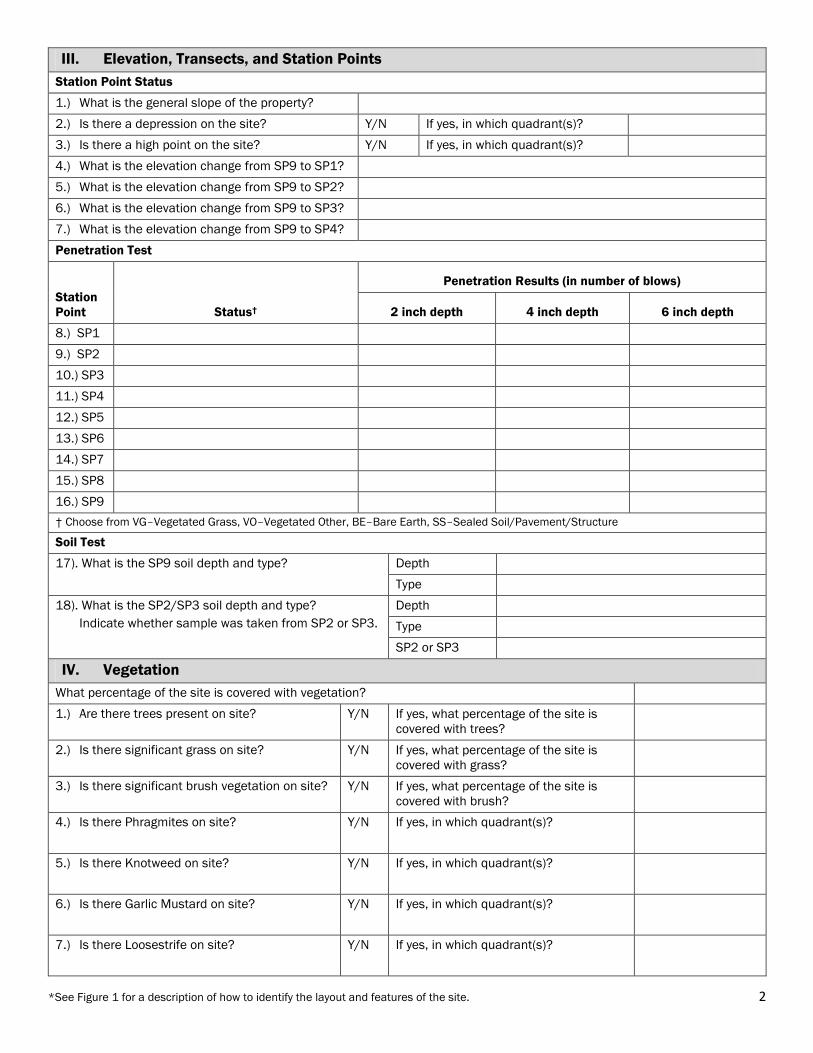
III. Elevation, Transects, and Station PointsStation Point Status 1.) What is the general slope of the property? 2.) Is there a depression on the site? Y/N If yes, in which quadrant(s)? 3.) Is there a high point on the site? Y/N If yes, in which quadrant(s)? 4.) What is the elevation change from SP9 to SP1? 5.) What is the elevation change from SP9 to SP2? 6.) What is the elevation change from SP9 to SP3? 7.) What is the elevation change from SP9 to SP4? Penetration Test
Station Point Status†
Penetration Results (in number of blows)
2 inch depth 4 inch depth 6 inch depth
8.) SP1 9.) SP2 10.) SP3 11.) SP4 12.) SP5 13.) SP6 14.) SP7 15.) SP8 16.) SP9 † Choose from VG–Vegetated Grass, VO–Vegetated Other, BE–Bare Earth, SS–Sealed Soil/Pavement/Structure
Soil Test 17). What is the SP9 soil depth and type? Depth
Type 18). What is the SP2/SP3 soil depth and type?
Indicate whether sample was taken from SP2 or SP3. Depth Type SP2 or SP3
IV. VegetationWhat percentage of the site is covered with vegetation? 1.) Are there trees present on site? Y/N If yes, what percentage of the site is
covered with trees? 2.) Is there significant grass on site? Y/N If yes, what percentage of the site is
covered with grass? 3.) Is there significant brush vegetation on site? Y/N If yes, what percentage of the site is
covered with brush? 4.) Is there Phragmites on site? Y/N If yes, in which quadrant(s)?
5.) Is there Knotweed on site? Y/N If yes, in which quadrant(s)?
6.) Is there Garlic Mustard on site? Y/N If yes, in which quadrant(s)?
7.) Is there Loosestrife on site? Y/N If yes, in which quadrant(s)?

*See Figure 1 for a description of how to identify the layout and features of the site. 3
V. Waste and Debris 1.) Is there trash on the property? Y/N If yes, in which quadrant(s)?
2.) Is there automotive waste on the property? Y/N If yes, in which quadrant(s)?
3.) Is there brush debris on the property? Y/N If yes, in which quadrant(s)?
4.) Is there metal debris on the property? Y/N If yes, in which quadrant(s)?
5.) Is there construction debris on the property? Y/N If yes, in which quadrant(s)?
6.) Is there stained soil on the property? Y/N If yes, in which quadrant(s)?
7.) Are there any unsafe conditions (e.g., excessive dumping, downed wires) that would require rapid inspection and clean-up from the city?
Y/N If yes, describe.
VI. Pervious/Impervious Surfaces1.) What percentage of the site is impervious? If pervious areas exist, in which
quadrant(s are they)? 2.) What percentage of the site is pervious? If impervious areas exist, in which
quadrant(s) are they? What is the composition of the impervious area?
3.) Are there storm water structures such as inlets, culverts, or retention areas on or adjacent to the property?
Y/N If yes, provide details on the location and a description of structure.
4.) Are there any storm water gutters on the streets adjacent to the property?
Y/N If yes, provide details on the location and a description of gutters.
5.) Enter results of infiltration test number 1. Location of infiltration test number 1:
6.) Enter results of infiltration test number 2. Location of infiltration test number 2:
VII. Notes

*See Figure 1 for a description of how to identify the layout and features of the site. 4
VII. Sketch of the SiteUse this space to sketch the site or to provide any other important details.