Embed Size (px)
Citation preview
1
Urban Trees and People’s Yards Mitigate Extreme
Heat in Western Adelaide
FINAL SUMMARY REPORT
Dr Alessandro Ossola, Leigh Staas, Dist. Prof. Michelle Leishman Centre for Smart Green Cities, Macquarie University, Sydney, Australia

2
TABLE OF CONTENTS
TABLE OF CONTENTS ………………………………………….. 2
EXECUTIVE SUMMARY ………………………………………… 3
STUDY BACKGROUND …………………………………………. 4
PURPOSE OF THE STUDY ……………………………………... 5
METHODOLOGICAL APPROACH …………………………… 7
STUDY FINDINGS …………………………………………………. 15
IMPLICATIONS AND WAYS FORWARD …………………. 21
REFERENCES ………………………………………………………… 24
This technical report is a deliverable of the project “Investigating the Role of Yards and Trees in Mitigating Western Adelaide’s Urban Heat”, a collaboration between the Centre for Smart Green Cities at Macquarie University and the Cities of West Torrens, Port Adelaide – Enfield and Charles Sturt under the AdaptWest Consortium. Jeremy Miller, Jerusha Beresford, Leanne Hodge, Scott Robinson, Steffen Helgerod, Dr Andrew McGrath, Dr Anthony Manea and Dr Samiya Tabassum are kindly acknowledged for their support.
Macquarie University acknowledges the Traditional Custodians of the land, the Wattamattagal clan of the Darug nation, whose cultures and customs have nurtured, and continue to nurture, this land since the Dreamtime. We pay our respects to Elders past, present and emerging; to the Ancestors; and to the Land and Water, its knowledges, Dreaming and culture – embodied within and throughout this Country.
SUGGESTED CITATION: Ossola, A., Staas, L., Leishman, M.R., 2020. Urban Trees and People’s Yards Mitigate Extreme Heat in Western Adelaide. Macquarie University, North Ryde, Sydney, Australia. https://doi.org/10.25949/5df2ef1637124
This work is distributed under a Creative Commons Attribution- NonCommercial-NoDerivatives 4.0 International License.
Cover image courtesy of Egor Kamelev (pxhere.com). Version 1.6 – last update 28.01.2020
3
EXECUTIVE SUMMARY
Extreme heat in cities poses a significant threat to public health and urban livability. More frequent, prolonged and intense heatwaves are predicted under future climate change, posing unprecedented challenges for Australia’s urban systems. Urban green infrastructure, forests and nature-based solutions have been suggested as inexpensive and effective strategies for climate change adaptation in cities. Urban trees in particular can significantly decrease land surface temperature across entire suburbs and cities. However, little knowledge exists on the more localised cooling benefits that trees might provide, particularly where these are needed the most ˗ the residential landscapes where people live.
This study assessed the effects of trees and other vegetation in people’s yards at reducing day time and night time heat during an extreme heatwave event in Western Adelaide. Despite covering about 20% of urban land, people’s yards contained more than 40% of the total tree cover and 30% of herbaceous (grass) cover. The number of private gardens, as well as the percentage of vegetation cover within these gardens, both contributed significantly in providing widespread cooling benefits across the Western Adelaide region with localised reductions in land surface temperatures of up to 5-6˚C compared to non-vegetated areas and land parcels. Vegetated cover overall provided the greatest day time cooling benefits further away from the coastline.
Findings suggest that the vegetation in people’s yards is of utmost importance for decreasing urban land surface temperature during extreme heat. Ambitious canopy cover targets (e.g., doubling of the current canopy cover from 13.5% to 27%) will require significant greening interventions across both the public and private realms. Private spaces offer significant untapped opportunities for urban greening and cooling, particularly in suburbs with lower vegetation cover. Where possible, urban development and densification must be carefully planned and performed to ensure that vegetation is retained and possibly expanded over time.

4
STUDY BACKGROUND
Urban heat is a critical issue across all urban areas. Increasing urbanization, urban consolidation and densification coupled with climate change exacerbate risks for human health, urban environments and the local economy due to increased heat exposure. This is particularly evident during extreme weather events such as heatwaves and hot spells.
South Australia, more so than any other Australian state or territory, is likely to experience extreme temperature events triggered by climatic changes, as suggested by recent climatic trends that show a consistent positive temperature anomaly since the mid 90’s (Fig. 1a, b).
Figure 1a. Annual maximum temperature anomaly in South Australia (1910-2017)
To address this issue, during the austral summer in 2017, the cities of Charles Sturt, West Torrens, and Port Adelaide – Enfield, under the AdaptWest Consortium, undertook a high-resolution urban heat mapping project across the Western Adelaide region, in order to;

5
1) measure how the structure of the urban environment affects heat distribution and urban riskscapes across a very urbanised landscape, and
2) devise, prioritise and enact mitigation and adaptation strategies that can be incorporated into current and future urban planning, regulatory and policy frameworks.
This urban heat mapping effort highlighted several vulnerabilities across the Western Adelaide Region during a heatwave event in February 2017 that are related to urban hot spots (e.g., infrastructure), land use covers (e.g., grey infrastructure) and building materials (e.g., asphalt) with high thermal irradiance (Seed Consulting, 2017). These early findings suggest that urban form (e.g., low vs high density) has an important effect on mitigating urban heat. However, the role of urban private yards and their vegetation in mitigating urban heat has not been fully quantified to date. This is despite the importance of privately managed green spaces for creating sustainable and resilient cities and towns (Ossola and Hopton, 2018 a, b).
PURPOSE OF THE STUDY
The present study aims at using high-resolution heat distribution data collected during a heatwave event in the austral summer 2017 to predict the amount of land surface temperature mitigation that can be achieved by using green infrastructure, as well as understand the role of vegetation in residential yards at reducing urban heat (Fig. 2).
The overarching research questions posed are:
1. What is the relationship between urban greening and urban heat mitigation across the Western Adelaide region?
2. What is the role of people’s residential yards in decreasing urban heat during a heatwave?
3. What are the key implications for urban greening efforts, urban planning and urban design?

6
Figure 1b. Historical trends in mean maximum annual temperature anomalies of selected Australian cities (redrawn from BOM data). Since the year 2000, Adelaide had one of the
steepest rates of maximum temperature increase among Australia’s cities and towns.

7
METHODOLOGICAL APPROACH
This study made use of heat mapping data collected during a heatwave event in the 2017 austral summer (Airborne Research Australia, Seed Consulting, 2017) to predict the amount of land surface temperature (LST) mitigation that can be achieved by the current urban green infrastructure. In addition, it provides an insight into the role of woody and herbaceous vegetation in private and public land in reducing heat during heatwaves. To exclude the effects of elevation on LST, geospatial and statistical analyses were conducted within the 90 local suburbs that make up most of Western Adelaide’s coastal plain (0-25 m a.s.l.). The “Adelaide airport” suburb was excluded as it only contains the airport grounds. Overall, the study area has a population exceeding 300 thousand inhabitants with a relatively high population density (~1,600 people km-2). The detailed methodological approach and validation are reported in Ossola et al. (under review).
LAND USE CHARACTERISATION
A high-resolution land use map was produced from cadastral data obtained from the AdaptWest’s City Councils to i) locate and identify all residential yards (backyards, front yards and corner yards) across the urban landscape and ii) to identify the most widespread land uses in the study area (Figure 3a, 3b). Recent evidence suggests that most of the tree canopy cover across cities is contained in private residential yards (Ossola & Hopton, 2018a, b). In particular, backyards have been shown to have significantly higher canopy cover and taller trees as compared to the respective front yards or other urban land uses (Ossola et al., 2019, 2020). This suggests the great importance of these private spaces for urban forestry and greening. However, the contribution of yards and the private greening therein at reducing urban heat, particularly during extreme weather events such as heatwaves, is currently unknown.
All yards in Western Adelaide were located and classified in backyards, front- and corner yards by using a semi-automatic GIS algorithm (Ossola et al., 2019). Briefly, the algorithm locates all largest buildings within a residential parcel (i.e., house), calculates the house centroid and fits a split line that is later used to divide each

8
parcel in two, assigning the front yard to the parcel side closer to the road centerline, and the backyard to the side furthest from the road centerline. As it is not possible to attribute back- and front yard to parcels located at the intersection of two or more streets, these are classified as corner yards when they fell within 15m from a street intersection. The accuracy of the assessment of the yard classification algorithm in Western Adelaide exceeded 98% (Ossola et al., under review). All land use analyses and vegetation analyses were performed in ArcGIS Desktop 10.6.0.8321 (ESRI, Redlands, CA, USA).
Figure 3a. The land use map of the city of West Torrens, Port Adelaide – Enfield and Charles Sturt.

9
Fig 3b. Detail of the land use map highlighting the distribution of back, front and corner yards and other residential land use (i.e., condominiums, apartment blocks, etc.).
VEGETATION COVER CHARACTERISATION
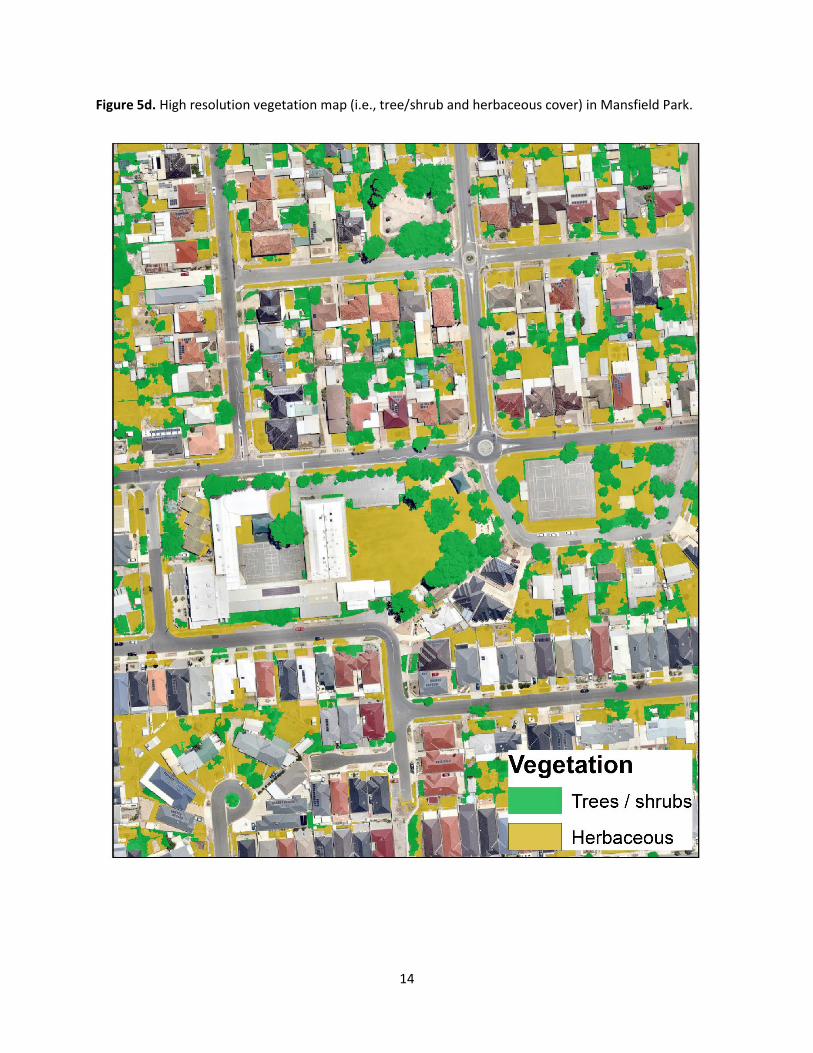
A vegetation cover map (i.e., tree/shrub and herbaceous cover) was produced by using a segmentation and classification approach based on vegetation spectral and structural variables (Ossola et al., under review). Briefly, a high-resolution image of the study area (30 cm) was segmented in ArcGIS (Fig. 4). The Normalised Difference Vegetation Index (NDVI) was obtained from the imagery (red and near-infrared bands) collected during the day time flight used to measure land surface temperature (see next section). A digital surface model (DSM) indicating the height from the ground of all features in the urban landscape (i.e., trees, buildings, etc.), was calculated from a LiDAR point cloud data (average point spacing = 0.8 pts m-2) obtained from ELVIS (Geoscience Australia, 2013).
More than 8,000 image segments were visually checked and manually digitised by a single assessor (AO) to train a support vector machine classifier and produce a i) tree/shrub canopy cover map and ii) an herbaceous cover map based on the NDVI and DSM models (Fig. 4, 5d).

10
Figure 4. Workflow for producing a tree/shrub and herbaceous cover map of western Adelaide. Accuracy of classification exceeds 94%.
Tree/shrub
Herbaceous
11
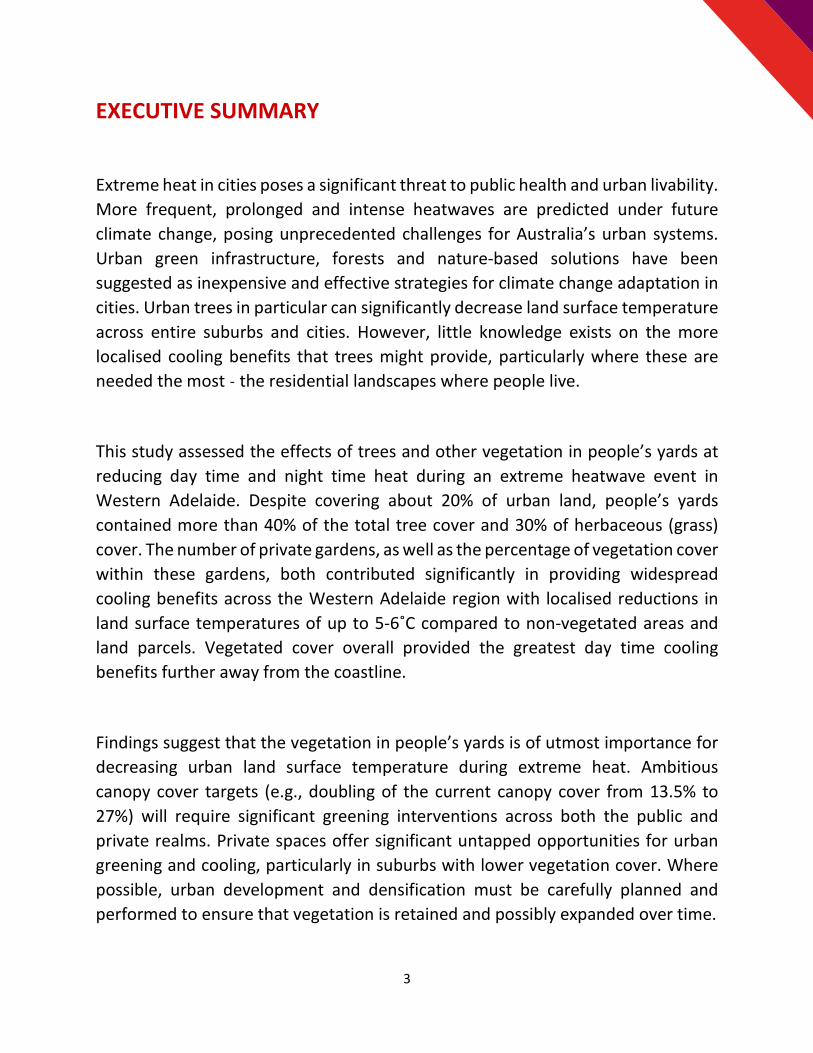
LAND SURFACE TEMPERATURE CHARACTERISATION
Day time and night time land surface temperatures (LSTday, LSTngt) were measured by Airborne Research Australia over two dedicated flights during a heatwave on 9-10th February 2017 (Fig. 5a, b). These were the fourth hottest day (39.2˚C) and the second hottest night (25.2˚C) recorded during the 2016/2017 austral summer (details are provided in Seed Consulting, 2017). LST was recorded over the study area by using an A615 thermal imager (FLIR Systems, Inc., Wilsonville, OR, USA) fitted on a Diamond HK36TTC ECO-Dimonas aircraft.
Figure 5a. Land surface temperatures recorded during the day time (LSTday) in the suburb of Mansfield Park.

12
Figure 5b. Land surface temperatures recorded during the night time (LSTnight) in the suburb of Mansfield Park.
13
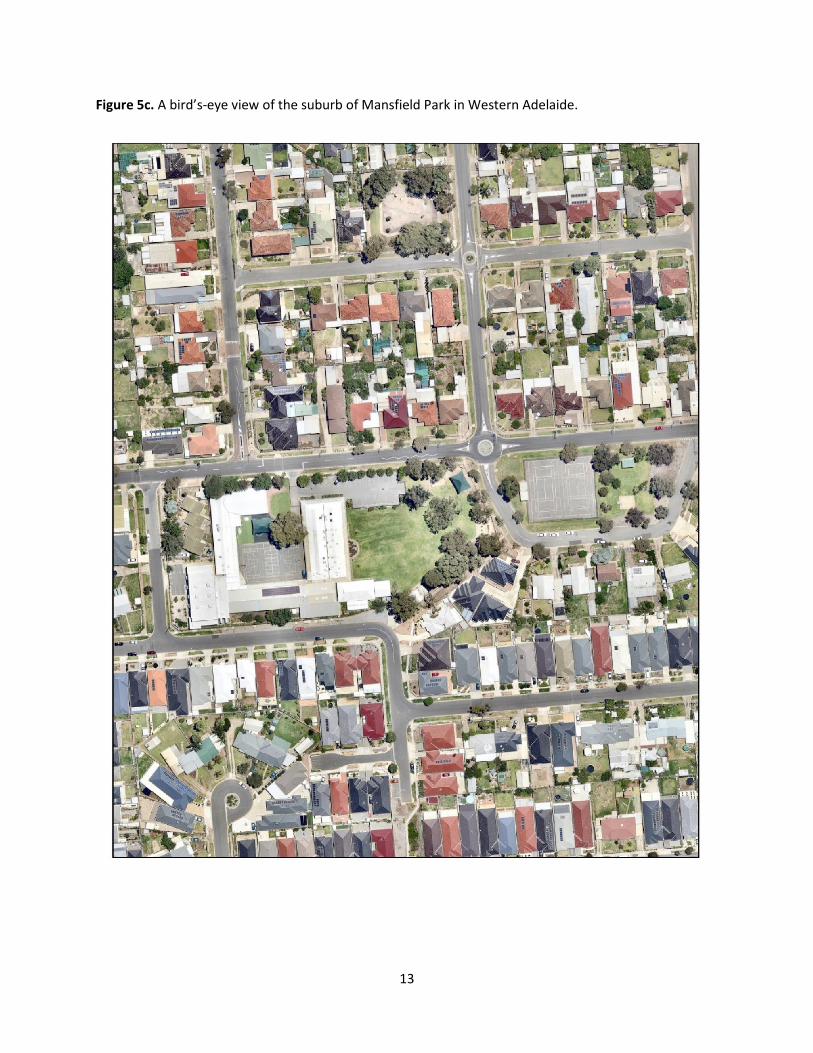
Figure 5c. A bird’s-eye view of the suburb of Mansfield Park in Western Adelaide.
14
Figure 5d. High resolution vegetation map (i.e., tree/shrub and herbaceous cover) in Mansfield Park.

15
STUDY FINDINGS
LAND USE AND VEGETATION COVER DISTRIBUTION
Despite covering about a fifth of urban land, residential yards contained more than 40% of the tree/shrub canopy and more than 30% of the herbaceous cover, respectively (Table 1). Backyards were the most widespread green space class across the study area (n=64,926) and they had significantly higher tree canopy cover (~33%) than open spaces and urban parks (~20%, n=1,923). On the other hand, herbaceous cover represented more than 45% of public green spaces and parks (Table 1). Building cover represented almost a quarter of land cover across the study area (Table 1), confirming that relatively high-density of urbanisation that has occurred in Western Adelaide since its settlement.
Overall, tree canopy cover across the entire study area is relatively low (~13%), and slightly smaller than the herbaceous cover (~16%). At the suburb level, however, these figures change dramatically as several suburbs in the north-west quadrant have tree canopy covers as low as 3-5%, whereas several suburbs in the south have a cover that exceed 20% cover. Similarly, herbaceous cover is the lowest in the north-west and south-east suburbs (1-7%), and the highest in the south-west and north-east suburbs (23-35%) which are characterised by larger public green spaces, such as parks and golf courses (Fig. 6).
Non-vegetated land cover is the greatest in the northern suburbs of the study area that are characterised by extensive industrial land, vacant lots or infrastructures (Fig. 6). For this reason, coupled with the relatively small cover of residential land, these suburbs are also characterised by the lowest vegetated cover overall.

16
Table 1. Land use and vegetation coverage across 90 suburbs in Western Adelaide. Fields highlighted in light grey represent residential land use. “Other residential” comprises of high-density residential lots such as condominiums ad apartment blocks that generally lack a defined back-, front- or corner yards.
Land
uni
t cla
ss
N.
land
un
its
%
land
un
its
Tota
l are
a la
nd u
nits
(m2 )
Perc
ent
cove
r un
it cla
ss
(%)
Tree
ca
nopy
ar
ea (m
2 )
Her
bace
ous
area
(m2 )
Tree
cano
py
cove
r (%
la
nd u
nit
class
)
Her
bace
ous
cove
r (%
la
nd u
nit
class
) Op
en sp
ace
1923
0.6
2 14
4808
73
10.07
28
9015
9 65
7055
7 19
.96
45.37
Ba
ckya
rd
6492
6 20
.92
1351
2690
9.3
9 45
1261
8 38
0325
9 33
.40
28.15
Co
rner
yard
15
065
4.86
4477
077
3.11
1317
747
1251
686
29.43
27
.96
Fron
t yar
d 64
654
20.84
91
2703
4 6.3
5 21
8499
8 24
1189
9 23
.94
26.43
Ot
her
resid
entia
l 17
152
5.53
3260
290
2.27
7340
37
6433
63
22.51
19
.73
Build
ing
1265
94
40.80
33
8048
77
23.50
44
243
3253
7 0.1
3 0.1
0 Co
mmer
cial
5996
1.9
3 70
1130
5 4.8
7 64
9437
46
5067
9.2
6 6.6
3 In
dustr
ial
1681
0.5
4 42
3205
4 2.9
4 32
8886
27
0908
7.7
7 6.4
0 In
frastr
uctu
re
2468
0.8
0 35
5553
75
24.72
46
7225
3 41
2076
3 13
.14
11.59
M
ixed u
se
1145
0.3
7 33
4704
4 2.3
3 63
4790
99
9583
18
.97
29.86
Ot
her l
and
use
5982
1.9
3 66
8753
2 4.6
5 91
9195
96
0454
13
.74
14.36
Vaca
nt
2712
0.8
7 80
1320
3 5.5
7 51
4591
15
9114
9 6.4
2 19
.86
Tota
l 31
0298
10
0.00
1435
0935
4 99
.77
1940
2955
23
1212
26
13.52
16
.11

17
Figure 6. Distribution of tree/shrub canopy cover, herbaceous, non-vegetated and yard cover across the 90 suburbs investigated in the study in Western Adelaide.

18
EXTREME TEMPERATURE CHANGE ACROSS THE LANDSCAPE
Open spaces and parks had the lowest mean LSTday during the heatwave event (Fig. 7). However, due to their limited number and relatively low coverage, their effect at reducing LSTday is extremely localised within the landscape. On the other hand, back, front and corner yards were among the five coolest land use areas and had a relatively high land cover and widespread distribution due to their large number. Furthermore, backyards were the vegetated space with the lowest LSTnight, being, on average, lower than open spaces and parks (Fig. 7).
Overall, this suggests that significant reductions in LST, as those moderated by private green spaces such as yards and gardens and the vegetation therein, can be achieved right next to the places where cooling benefits are likely needed the most – people’s houses and residential landscapes.
Figure 7. Statistical distribution of land surface temperature during day (left) and night time (right) among the most frequent land use classes in Western Adelaide. Residential yards are highlighted in red.

19
Furthermore, it is important to note that a significant coastal effect was present during the heatwave event in February 2017 (Fig. 8). LSTday, in fact, progressively increased from the coastal suburbs located along the maritime coastline to peak in the more eastern suburbs located at 6-8 kilometers from the shore.
This effect, however, was only significant during day time and LSTnight changed little during measurement based on the geographic position of suburbs in relation to the coast (Fig. 8).
Figure 8. The distance of suburbs from the coast has a significant effect on increasing land surface temperature during day time (LSTday, upper panel) but not during night time (LSTngt, lower panel). Please note that temperature ranges on the vertical axes are different. Each point is a suburb-level average value.
This suggests that vegetation, trees and grass cover, as well as private and public green spaces (i.e., yards and parks) might have a different impact on LSTday in different suburbs located along the coastal gradient, with their effect on LSTday increasing as you move away from the coastline (Ossola et al., under review).

20
Figure 9. Effect of vegetated and non-vegetated cover on LSTday calculated by fitting generalised linear mixed models (GLMMs) on a subset of 120,000 land use units and by using “suburb” as a random effect to account for local effects on LST due to distance from the coast as well as autocorrelation of vegetation distribution within suburbs (i.e., more affluent suburbs are often leafier than less affluent ones).
Further statistical models accounting for local effects on LST based on the distance from coast and the autocorrelation of vegetation characteristics within suburbs highlighted that planting tree and grass in non-vegetated parcels could determine local LST reductions to up to 5-6°C and 3-4°C, respectively (Fig. 9). On the other hand, the removal of vegetation from the landscape due to further urbanization, infill and densification could increase LST during extreme heatwaves by up to 4-5 °C (Fig. 9).
Grass cover

21
IMPLICATIONS AND WAYS FORWARD
This study highlights the importance of preserving and increasing vegetation coverage across urban landscapes to mitigate thermal impacts during extreme events, which are likely to increase in their frequency because of climate change. This study focused on changes in urban land surface temperature (LST) and not air temperature per se. The latter is most likely to affect human thermal comfort and distress during extreme heat. However, LST can significantly affect air temperature due to surface-air heat transmission, convection and irradiance. While air temperature was not assessed in the present study, further investigation on this micrometeorological parameter is vital to further highlight the role of urban greening and people’s yards in cooling urban thermal landscapes during heatwaves.
This study highlights that planning and regulatory interventions should be prioritised based on the overall landscape and city structure. Suburbs further away from the coastline will most likely benefit the most from greening interventions and planning policies aimed at preserving yard coverage while promoting sustainable urban densification (e.g., medium and high-rise development). As planting space for trees and vegetation is the major driver for achieving high levels of green cover in our cities (Ossola et al., 2019), its preservation and enhancement is of utmost importance for cooling urban landscapes during heatwaves and to devising effective climate change adaptation and mitigation strategies with nature-based solutions (Fig. 10).
On the other hand, where urban development and densification completely obliterates green cover, significant increases in LST, up to several degrees Celsius, are to be expected. This will add to the already negative effects that urban infrastructure is having on the urban environment, public health and local communities. A changing urban morphology is a critical aspect not only in Western Adelaide but across all cities and towns in Australia, whereby building footprints are increasing in size while land lots are shrinking (Hall, 2010). This is the main cause of why new developments generally have smaller yards and private gardens, causing a reduction in vegetation cover in urban landscapes.

22
As an urban forest takes decades to grow to maturity, it is a priority to significantly increase the vegetated cover across the Western Adelaide region now. Ad interim solutions aimed at quickly and effectively increase the herbaceous cover within suburbs could provide a fast and inexpensive transition to scenarios with full canopy cover (e.g., a realistic target of 25%), while providing much needed mitigation of extreme temperatures during extreme weather events. However, the increase in herbaceous cover should be carefully designed to ensure that unintended effects are avoided or minimised (e.g., excessive irrigation and water use, pesticide use) and sustainability goals are maintained and improved.
Figure 10. Relationship between tree/shrub canopy cover and residential yard cover among the 90 suburbs in Western Adelaide. With more than 145,000 units, residential yards are the most common and widespread vegetated land use in the study area. Herbaceous and grass cover increases with the extent of open space and public parks.

23
Similarly, increases in urban tree canopy cover should prioritise fast-growing tree species able to survive recurrent extreme heat and drought events. Recent evidence suggests that, among the most commonly planted species in Australian cities, several of these might not survive future climatic change without significant investments for their maintenance and care (e.g., emergency watering) (Burley et al., (2019).
In this way, the careful selection of climate-ready species should be prioritised to ensure a fast and effective achievement of realistic canopy cover and greening targets (see http://whichplantwhere.com.au/). As confirmed in this study, however, ambitious canopy cover targets able to significantly mitigate extreme heat and provide numerous other benefits to cities will not likely be met without interventions that comprise large tracts of the private realm and people’s yards and gardens. Planning and executing large greening interventions across the private realm will be critical to meet ambitious targets such as those set by local Councils as well as state-level greening initiatives such as the new Green Adelaide strategy (www.environment.sa.gov.au/topics/green-adelaide).

24
REFERENCES
Burley, H., Beaumont, L., Ossola, A., Baumgartner, J., Gallagher, R., Laffan, S., Esperon-Rodriguez, M., Manea, A., Leishman, M., 2019. Substantial declines in urban tree habitat predicted under climate change. Science of the Total Environment, 685: 451-462. doi: 10.1016/j.scitotenv.2019.05.287
Hall, T., 2010. The Life and Death of the Australian Backyard. ISBN: 9780643098176, CSIRO Publishing.
Ossola, A., Hopton, M., 2018a. Measuring tree loss dynamics across residential landscapes. Science of the Total Environment, 612:940-949. doi: 10.1016/j.scitotenv.2017.08.103.
Ossola, A., Hopton, M., 2018b. Climate differentiates forest structure across a residential macrosystem. Science of the Total Environment, 639:1164-1174. doi: 10.1016/j.scitotenv.2018.05.237.
Ossola, A., Locke, D., Lin, B., Minor, E., 2019. Greening in style: Urban form, architecture and the structure of back- and front-yard vegetation. Landscape and Urban Planning 185, 141-157.
Ossola, A., Locke, D., Lin, B., Minor, E., 2019. Yards increase forest connectivity in urban landscapes. Landscape Ecology, DOI: 10.1007/s10980-019-00923-7.
Ossola, A., McGrath, A., Chow, W., Jenerette, G.D., Hughes, L., Leishman, M.R., 2020. Trees locally mitigate daytime urban land temperature during a heatwave. (under revision).
Seed Consulting, 2017. Western Adelaide Urban Heat Mapping Project Report, prepared for the Cities of West Torrens, Charles Sturt and Port Adelaide Enfield, and the Adelaide Mount Lofty Ranges Natural Resources Management Board.
Western Adelaide Region Climate Change Adaptation Plan, 2016. URPS, SEED Consulting, AECOM.

25