Embed Size (px)
Citation preview
Urban SustainabilityIndicators
EUROPEAN FOUNDATIONfor the Improvement of Living and Working Conditions
Urban SustainabilityIndicators
Urban sustainability indicators are important instruments for assessing the performance of cities. They
include environmental, economic and social indicators designed to identify progress in meeting the
objectives of socio-economic and environmental sustainability.
Many European cities work with specific sets of indicators which enable them to measure their success in
attaining their targets and communicating with their citizens. The Foundation created a common
framework of urban sustainability indicators for cities according to the Charter of European Sustainable
Cities and Towns, the European version of Local Agenda 21.
OFFICE FOR OFFICIAL PUBLICATIONS OF THE EUROPEAN COMMUNITIES
L- 2985 Luxembourg
9 789282 846698
ISBN 92-828-4669-5
145
SX-17-98-346-EN
-C

Urban Sustainability Indicators

The European Foundation for the Improvement of Living and Working Conditions is an autonomous body of theEuropean Union, created to assist the formulation of future policy on social and work-related matters. Furtherinformation can be found at the Foundation web site: http//www.eurofound.ie/
UrbanSustainability
Indicators
EUROPEAN FOUNDATIONfor the Improvement of Living and Working Conditions
Wyattville Road, Loughlinstown, Co. Dublin, Ireland. Tel: +353 1 204 3100 Fax: +353 1 282 6456/282 4209 E-mail: [email protected]
Voula Mega
and
Jørn Pedersen
Cataloguing data can be found at the end of this publication
Luxembourg: Office for Official Publications of the European Communities, 1998
ISBN 92-828-4669-5
© European Foundation for the Improvement of Living and Working Conditions, 1998
For rights of translation or reproduction, applications should be made to the Director, European Foundation for theImprovement of Living and Working Conditions, Wyattville Road, Loughlinstown, Co. Dublin, Ireland.
Printed in Ireland
The paper used in this publication is chlorine free and comes from managed forests in Northern Europe. For every tree felled, at least one new tree is planted.
FOREWORD
The Foundation’s work on urban sustainability indicators started in 1994 when Voula Mega
proposed a first set of indicators based upon The Charter of European Sustainable Cities and
Towns, issued in Aalborg in May 1994. These proposals were discussed at a workshop on urban
innovations and medium-sized cities, held in Oviedo in September 1994. The framework was
subsequently tested by the cities participating in the research network of medium-sized cities. The
full results can be found in the Foundation’s publications “What Future for Urban Environments
in Europe?”, prepared for HABITAT II, and “Medium-Sized Cities in Europe”.
This publication presents the urban sustainability indicators framework in the context of the
Foundation’s programme on socio-economic aspects of sustainable development.
Clive Purkiss Eric Verborgh
Director Deputy Director
v

vi
A. EUROPEAN CHALLENGES FOR CITIES AT THE DAWNOF THE 21ST CENTURY: THE URBAN SUSTAINABILITYQUESTION
Europe is first and foremost urban. It consists of an archipelago with some of the most splendid
cities humanity ever created. Braudel called these cities “greenhouses of civilisation”, and Levi-
Strauss “objects of nature and subjects of culture”. Twenty-five centuries ago, Aristotle defined
the city as “Built Politics”. In the 1990s, cities emerge as the most complex and dynamic
ecosystems, the only human ones, open, dependent and vulnerable. From the traditional city, with
its physical, institutional and sociological entity, and the mid-20th century metropolis, dominated
by a centre-periphery morphology, we moved to a new World city, a network of networks in a
universal network. They are all “built politics”, but politics confront even dynamic, shifting
challenges (EF 1997a, b; EC 1996a).
At the dawn of the 21st century, cities appear stronger on the European scene and seem decided
to remain the main centres of economic activity, innovation and culture. They establish brown,
green and grey agendas to meet the three-fold challenge of globalisation, sustainability and
cohesion. However, environmental problems and social shock waves cannot be absorbed in many
cities, which become increasingly fragmented, far removed from the European urban archetype or
the great urban utopias. Unemployment scars their face. The “Balkanisation” of the urban fabric
– cities torn to pieces – and the cumulative spiral leading to exclusion become obstacles to the
creation and (class and intergenerational) distribution of urban wealth. This unequal sharing has
draining effects on the vitality of urban activities and is a source both of unsustainable lifestyles
and obstacles to cultural change. New forms of poverty (“fuel poverty” etc.) become an overriding
concern. Expressions like the “Martyr City”, symbol of distressed urbanity, or even “Urban
Genocide” are significant (EF 1997b; EC 1997b).
Cities crystallise hopes for a better tomorrow, which will be much less like yesterday. The global
economy gives the opportunity to many more cities to become world players, but the global
conglomeration might have strong central quarters and weak, peripheral ones (Sassen 1994).
Globalisation may trigger processes of change which cannot be influenced by local communities,
but which can reshape them against their will. Shifts may be swift, but lethal. D. Harvey, in a paper
entitled “From Place to Space and Back Again”, suggests the strengthening of the social place as
the best way of meeting the new challenges emerging with globalisation (1991). Cities are the
political institutions most able to create new democratic spaces between the world economic
macro-regulations and the micro-regulations of the local community (EF 1997b).
The challenge of sustainable development raised awareness of the need for a new equilibrium
between the Scylla of rising poverty and the Charybdis of overconsumption (EC 1997b).
1
Sustainability is equity and harmony extended into the future, a careful journey without an end-
point, a continuous striving for the harmonious co-evolution of environmental, economic and
socio-cultural goals. A sustainable city is one which succeeds in balancing economic,
environmental and socio-cultural progress through processes of active citizen participation. All
cities are now confronted with the challenge of considering economic, social and environmental
issues simultaneously and constantly readjusting the balance. An unusual definition for
sustainability is that sustainability is a striving for eternal youth. It is a continuous invention of
new opportunities, resembling youth itself, a capacity for innovation which is a non-depletable
resource, a permanent thirst for the unknown, the search for something better. All these issues
were at the very heart of HABITAT II, the UN Summit on Cities (June 1996).
HABITAT II was an extraordinary event, representing the culmination of decades of effort
(HABITAT 1996). The HABITAT agenda was based on principles of equality, eradication of
poverty, sustainable development, liveability and diversity, family, civic engagement and
government responsibility, partnerships, solidarity and international co-operation and co-
ordination. It set out recommendations and concepts, it laid down a basis for substantive input
from local authorities, the public and private sectors, NGOs and professional bodies; it
emphasised the important role of private individuals and market forces. Several key points of
consensus emerged: the economic, social, political and environmental futures of the Earth will
depend on how urban issues are addressed; the roles of government decentralisation and of non-
public actors are of increasing importance; local and national institutional and financial capacities
have to be strengthened to address urban issues; most financial and technical resources have to
originate from countries, cities and communities themselves. Finally, best practices and indicators
were highlighted as the most innovative instruments towards urban sustainability.
“Innovation is a creative destruction” (Schumpeter 1976). It includes the invention of new
concepts, products or ideas, the coalitions for their implementation and the transformation that
they bring. An old world of obsolete ideas, principles and practices dies while a new one emerges.
According to A. Einstein, “the world we have created today as a result of our thinking thus far has
problems which cannot be solved by thinking the way we thought when we created them”.
Indicators appear to be a rediscovered issue, linked to the urgency of adopting a new measure of
progress. They have high potential for those cities wishing not simply to adapt to but to initiate the
desired transformation. For cities are the only places where people concentrate at a level beyond
which they produce not simply additional but synergetic effects. Innovation is a product of the
“disorderly order of human interaction” (Jacobs 1969). The structure of coalitions to achieve
political support is critical in order to reap the rewards of the transformation, because vested
interests will always be resistant to change (EF 1993a, 1996c). Indicators offer a powerful
instrument in addressing change.
Two-thirds of the actions proposed by the Rio Conference and Agenda 21 require the active
involvement of local authorities, while Chapter 28 specifically addresses local government and
calls for a consensus of local authorities on a Local Agenda 21. The EC's review of the Fifth
2
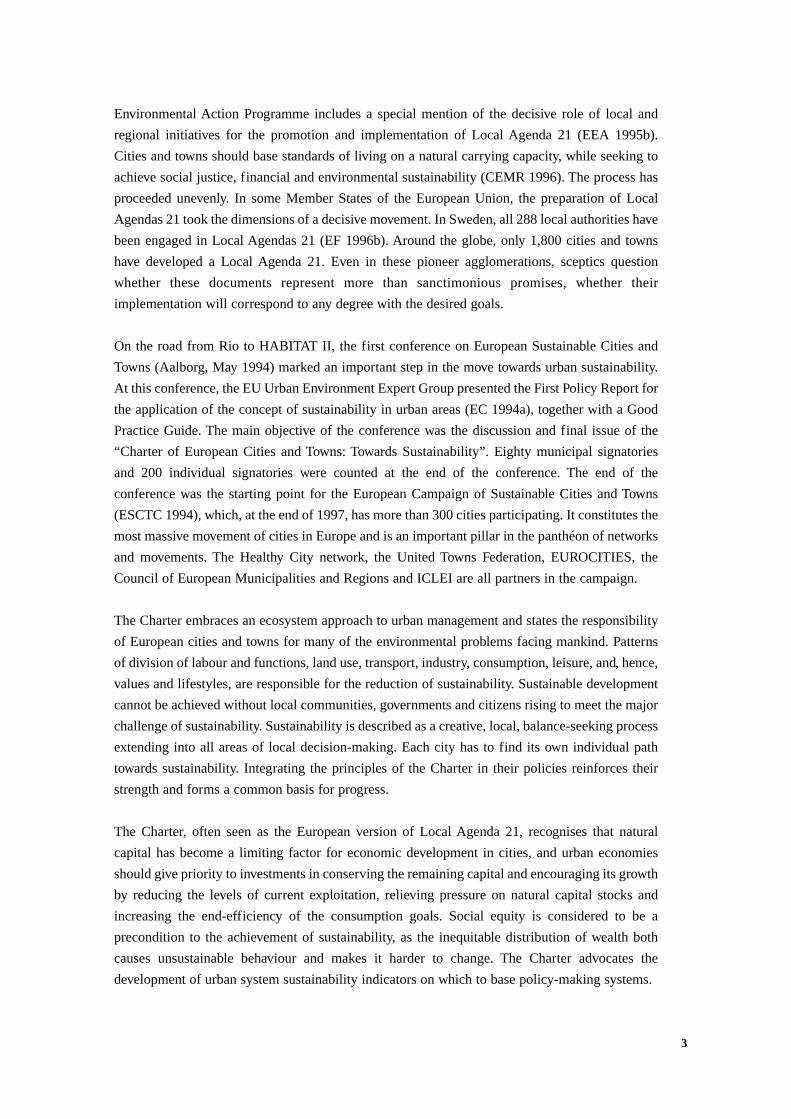
Environmental Action Programme includes a special mention of the decisive role of local and
regional initiatives for the promotion and implementation of Local Agenda 21 (EEA 1995b).
Cities and towns should base standards of living on a natural carrying capacity, while seeking to
achieve social justice, financial and environmental sustainability (CEMR 1996). The process has
proceeded unevenly. In some Member States of the European Union, the preparation of Local
Agendas 21 took the dimensions of a decisive movement. In Sweden, all 288 local authorities have
been engaged in Local Agendas 21 (EF 1996b). Around the globe, only 1,800 cities and towns
have developed a Local Agenda 21. Even in these pioneer agglomerations, sceptics question
whether these documents represent more than sanctimonious promises, whether their
implementation will correspond to any degree with the desired goals.
On the road from Rio to HABITAT II, the first conference on European Sustainable Cities and
Towns (Aalborg, May 1994) marked an important step in the move towards urban sustainability.
At this conference, the EU Urban Environment Expert Group presented the First Policy Report for
the application of the concept of sustainability in urban areas (EC 1994a), together with a Good
Practice Guide. The main objective of the conference was the discussion and final issue of the
“Charter of European Cities and Towns: Towards Sustainability”. Eighty municipal signatories
and 200 individual signatories were counted at the end of the conference. The end of the
conference was the starting point for the European Campaign of Sustainable Cities and Towns
(ESCTC 1994), which, at the end of 1997, has more than 300 cities participating. It constitutes the
most massive movement of cities in Europe and is an important pillar in the panthéon of networks
and movements. The Healthy City network, the United Towns Federation, EUROCITIES, the
Council of European Municipalities and Regions and ICLEI are all partners in the campaign.
The Charter embraces an ecosystem approach to urban management and states the responsibility
of European cities and towns for many of the environmental problems facing mankind. Patterns
of division of labour and functions, land use, transport, industry, consumption, leisure, and, hence,
values and lifestyles, are responsible for the reduction of sustainability. Sustainable development
cannot be achieved without local communities, governments and citizens rising to meet the major
challenge of sustainability. Sustainability is described as a creative, local, balance-seeking process
extending into all areas of local decision-making. Each city has to find its own individual path
towards sustainability. Integrating the principles of the Charter in their policies reinforces their
strength and forms a common basis for progress.
The Charter, often seen as the European version of Local Agenda 21, recognises that natural
capital has become a limiting factor for economic development in cities, and urban economies
should give priority to investments in conserving the remaining capital and encouraging its growth
by reducing the levels of current exploitation, relieving pressure on natural capital stocks and
increasing the end-efficiency of the consumption goals. Social equity is considered to be a
precondition to the achievement of sustainability, as the inequitable distribution of wealth both
causes unsustainable behaviour and makes it harder to change. The Charter advocates the
development of urban system sustainability indicators on which to base policy-making systems.
3
Urban sustainability is synonymous with a stream of at least non-declining output and seems
inextricably linked to a non-declining urban capital (natural, physical and human). Urban
metabolism can be perceived as the economic or production process which leads from flows of
input (materials, products, energy, labour) to flows of output (products, services). A steady flow
of output requires steady flows of input and maintenance of the urban metabolism. The output
constitutes primarily the consumption basket for citizens, while a part is used for the maintenance
of the production process (Hartwick 1994). We will need a reduction in consumption by moving
from quantity to quality. According to the Charter, declining levels of per capita consumption
might be quixotic, but it is of the highest importance at least to stabilise the consumption levels
(currently increasing continuously in the northern hemisphere, even though technology often
increases efficiency in the use of resources) through changes in lifestyles and consumption
patterns.
City and town signatories of the Charter recognise that they cannot export problems into the larger
environment or the future and seek equitable regional interdependencies. Priority is also given to
ecologically sound means of transport and the decrease of enforced mobility. Emphasis is placed
on the stabilisation and reduction of greenhouse gases into the atmosphere and the prevention of
ecosystem toxification. The local authority signatories of the Charter are prepared to reorganise
cities and towns for sustainability and ask for sufficient powers and a solid financial base. When
developing Local Agenda 21 plans, cities commit themselves to working together with citizens.
4

B. TOWARDS THE DEVELOPMENT OF A SET OFSIGNIFICANT URBAN INDICATORS
The Commission's European Sustainable Cities Report (EC 1996a) recognises the need for
sustainability indicators as tools for quantifying sustainability performance. If sustainability is a
coherent policy goal, it must be possible to measure whether we are moving towards it. The World
Bank defines indicators as performance measures that aggregate information into a usable form,
highlighting, however, the unresolved issues of fluctuation, intertemporal variations and
uncertainty. All organisations involved in indicator construction seem to agree that indicators
provide a useful tool for policy making (prospective) and for assessing policy implementation
(retrospective indictors), but they stress their limitations (World Resources Institute 1994).
The magnitude and significance of sustainability indicators has received much attention in recent
years, but their real use in measuring urban sustainability performance is at an initial stage.
Descriptive indicators, illustrating the status of the environment and based on real, concrete
physical measures, are more easy to establish and interpret by judging them against specified
benchwork and thresholds. Performance indicators are based on policy principles and goals.
Indicators are meaningless without specified objectives and they cannot contribute to the
improvement of the urban quality of life if there is not a policy framework, based on a diagnosis
of the current situation, recognising that some facts should change and giving directions for
change and objectives (and, if possible, ultimate targets) to be attained.
All organisations involved in the development of indicators seem to agree that the significance of
indicators extends beyond that which is directly obtained from observations and that they should
be clear, simple, scientifically sound, verifiable and reproducible. Urban indicators cannot include
solely environmental indicators, as environmental performance is not the only factor in achieving
a city's sustainability. Socio-economic issues play a critical role and socio-economic indicators are
necessary. This was the very first conclusion of the Dublin National Forum on Indicators (UCD
1996) and the Rennes Conference, where more than 40 representatives from city networks and
international organisations came together with 200 researchers and decision-makers to discuss the
use of indicators in urban policies (OECD 1997).
The pressure-state-response model is a widely accepted framework for the compilation of
sustainability performance indicators and has been adopted by the OECD and referred to by the
World Bank. The model links the causes of environmental changes (pressure) to their effects
(state) and finally to the projects, actions and policies (response) designed and undertaken to
tackle these changes (Fig. 1). Indicators should tell us in what fields the city is doing better than
in others and according to its specific goals. A single sustainability index should tell us whether
or not the city is becoming more sustainable. The passage from thematic indicators to an index of
5
sustainability policy performance for cities is a complex task as indicators have to be weighted by
contribution to sustainability levels and all the previous levels of aggregation have to be taken into
account. A special effort must be made to avoid multiple counting of individual sustainability
pressures which are taken into account in the composition of the thematic indicators (Fig. 2).
The required properties of indicators are that they should be significant, should aid in comparison,
evaluation and prediction, and should help to construct and harmonise data banks, and decision-
making at various levels to promote local information, empowerment and democracy. They should
also contribute to making the city more visible and transparent and have, if possible, a symbolic
role. They should embrace all sectors and neighbourhoods contributing to the co-evolutionary
process of sustainable development. As with all innovations, the development of indicators is
strengthened by the existence of a permanent innovative milieu. Seattle, in the USA, is often
quoted as a classic example of a dynamic city with a coherent set of indicators.
The development of indicators for urban policies can be an important instrument fostering citizen
participation. From information to active involvement, dynamic citizen participation is a
precondition for the construction of the political identity of the European Union. There is a
unanimously recognised trend: city dwellers are increasingly invited to act as partners rather than
protesters. Scenario workshops try to bring together, on “neutral grounds” and on “equal terms”,
various traditionally opposed local groups in order to formulate a consensus on a vision of a
sustainable city. Enlightened consensus-building requires art and science from thinkers and doers;
it needs decision-makers striving to become change-makers. It also needs instruments to establish
equitable communication.
Indicators can more precisely measure pressure, state or policy, but in a dynamic situation what
really matters is the “ultimate state”. A policy, no matter how good or sustainability-oriented, will
not be efficient if the result is far from the goal (owing, that is, to the initial state or an unrealistic
target). Indicators can measure the success of one course of action and even stimulate action, but
they do not indicate what kind of action. Decision-makers, citizens and inhabitants have at their
disposal a large choice of instruments for urban intervention and good practice guides can inspire
them. Targets for thematic indicators may be defined at the city level, according to the priorities
of each city. The performance of a city at a national or supranational level should therefore be
judged according to both its targets and the progress achieved in this respect.
The “Charter of European Cities and Towns: Towards Sustainability” can serve as a valuable
common policy framework for the development of performance indicators based on the policy
principles and orientations of the Charter. The European Foundation made a first attempt to
develop a set of sustainability indicators in the framework of its project on medium-sized cities
(Mega 1994b). Efforts and achievements were extensively discussed at workshops organised by
the Foundation, and indicators were subsequently developed for Alicante, Toledo, Evora, Coïmbra,
Perugia, Siena, Freiburg, Dessau, Nîmes, Bastia, Parma, Kavala and Rhodes.
6
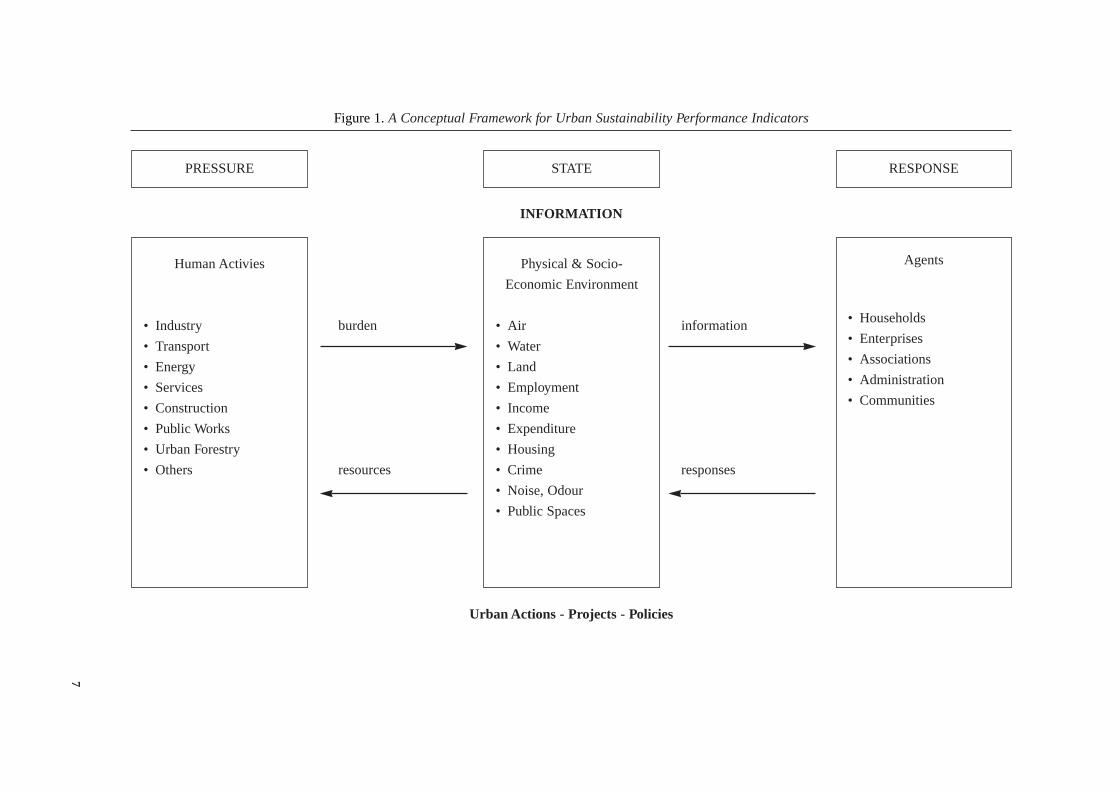
Figure 1. A Conceptual Framework for Urban Sustainability Performance Indicators
INFORMATION
burden information
resources responses
Urban Actions - Projects - Policies
7
RESPONSE
Agents
• Households
• Enterprises
• Associations
• Administration
• Communities
Physical & Socio-
Economic Environment
• Air
• Water
• Land
• Employment
• Income
• Expenditure
• Housing
• Crime
• Noise, Odour
• Public Spaces
Human Activies
• Industry
• Transport
• Energy
• Services
• Construction
• Public Works
• Urban Forestry
• Others
STATEPRESSURE
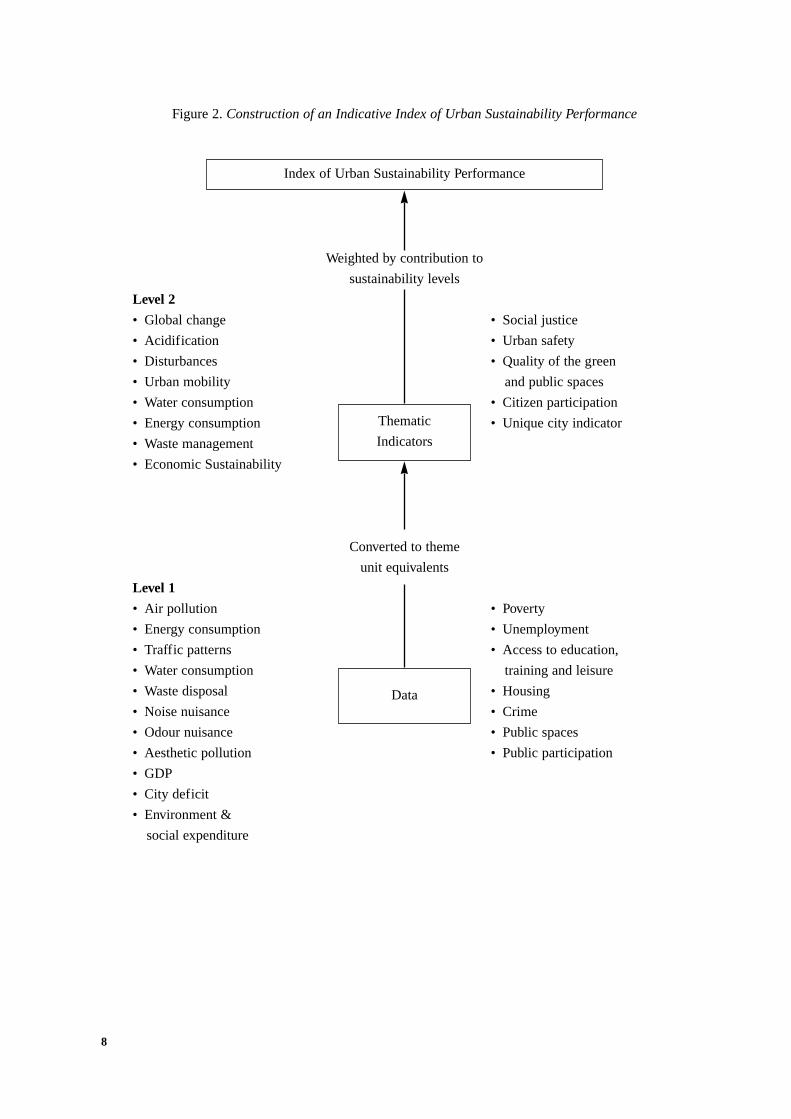
Figure 2. Construction of an Indicative Index of Urban Sustainability Performance
Weighted by contribution to
sustainability levels
Level 2
• Global change • Social justice
• Acidification • Urban safety
• Disturbances • Quality of the green
• Urban mobility and public spaces
• Water consumption • Citizen participation
• Energy consumption • Unique city indicator
• Waste management
• Economic Sustainability
Converted to theme
unit equivalents
Level 1
• Air pollution • Poverty
• Energy consumption • Unemployment
• Traffic patterns • Access to education,
• Water consumption training and leisure
• Waste disposal • Housing
• Noise nuisance • Crime
• Odour nuisance • Public spaces
• Aesthetic pollution • Public participation
• GDP
• City deficit
• Environment &
social expenditure
8
Index of Urban Sustainability Performance
Thematic
Indicators
Data
The policy fields emerging from the European Charter of Sustainable Cities and Towns constitute
our basic framework for the development of indicators (Fig. 3). An indicator can be a priori
assigned for each policy theme. The variety in nature and scale of the policy themes dictates the
variety of the indicators to be suggested. The composed indicators should assert whether a city
follows the directions for change declared in the Charter.
The suggested set of indicators includes nine environmental indicators. The indicators for the
themes Responsibility for Global Climate, Acidification of the Environment, Toxification of
Ecosystems and Local Disturbances follow the directions of the Dutch set, with its limitations and
its potential (Adriaanse 1993). They express, together with the energy and water consumption
indicators, with the exception of the local disturbances indicator, the responsibility of a city for
the global environment. The local disturbances indicator, together with the air quality indicator,
the urban mobility and the waste management indicators, expresses important aspects of the local
quality of life linked to global considerations (Mega 1994b).
The indicators of social justice, housing, urban safety and citizen participation have been chosen
to express some of the key social elements of sustainability. Next to these, the quality of green,
heritage and public space indicator serves as a measure of the quality of spaces promoting public
health, social life and cultural identity (Council of Europe 1992). Finally, for each city we thought
it useful to assign a unique sustainability indicator representing the contribution of unique assets,
characteristics or events to the sustainability of the city.
The scale for the development of each indicator is very much dependent on its nature: global
climate, acidification, ecosystems, toxification or economic sustainability indicators are relevant
at the city level. The remaining indicators are most relevant at neighbourhood level, if they are to
reflect the various paces of development within the same city. The degree of diversity and
heterogeneity within a city defines the territorial frameworks for the development of local
significant indicators.
9
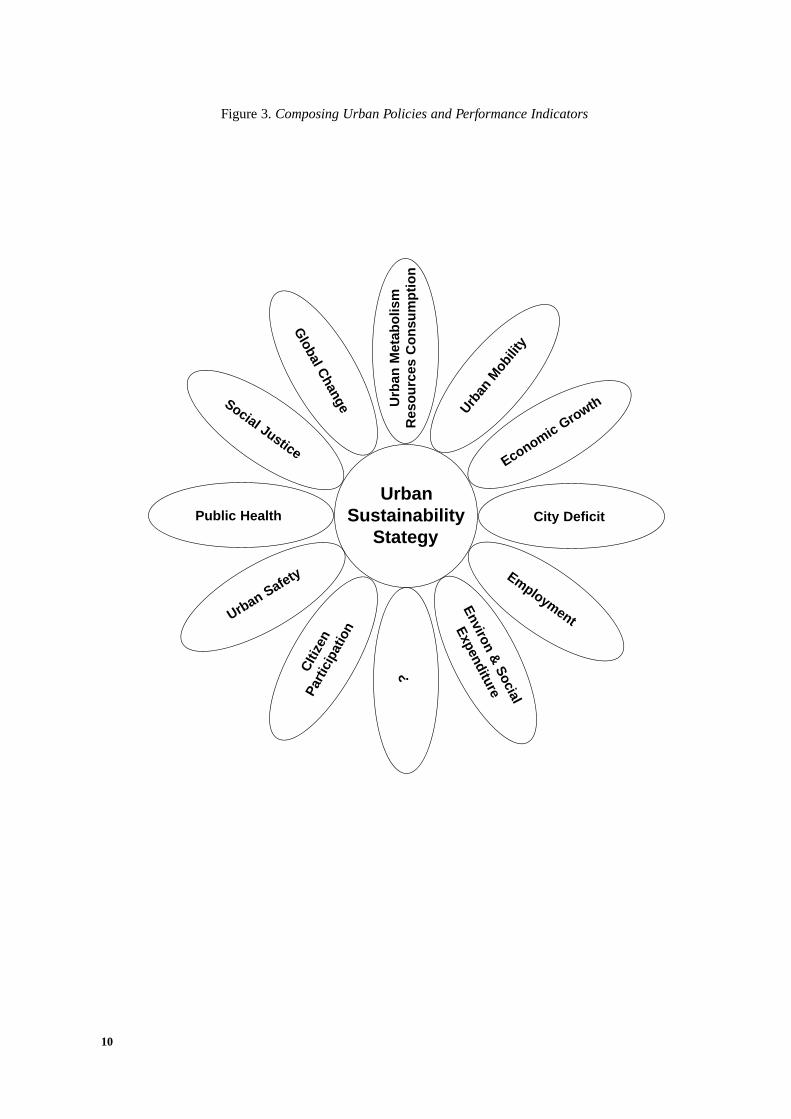
Figure 3. Composing Urban Policies and Performance Indicators
10
UrbanSustainability
Stategy
?U
rban
Met
abo
lism
Res
ou
rces
Co
nsu
mp
tio
n
Global C
hangeSocial Justice
Environ & Social
Expenditure
Employment
Urban
Mob
ility
Economic Growth
CIti
zen
Part
icip
atio
n
Urban Safety
City DeficitPublic Health

C. The Framework of Indicators-Revelators proposed by theEuropean Foundation
(A) GLOBAL CLIMATE INDICATOR (GCI)
Definition: The contribution of cities to the change in the global
climate.
Measure: Global Climate equivalent (GCeq) = total greenhouse gases
(CO2, CH4, N2O and CFCs).
Policy Direction: Decrease in the discharge of greenhouse gases.
Subindicators / Components Data: Emitted total CO2, CH4, N2O and CFCs and halons.
Composition of the Indicator: The warming potential of the greenhouse gases in the
troposphere is taken to weigh the constituent components.
The degree (N) to which each greenhouse gas contributes to
the global warming process depends on its concentration in
the troposphere and on its ability to absorb the heat radiated
by the earth.
Gceq = NCO2 x GCCO2eq + NCH4 x GCCH4eq + NN20 x
GN20eq + NCFC-11 x GCFC-11eq (if NCO2 = 1, NCH4 = 1/12,
NN20 = 1/290, NCFC-11 = 1/3500)
Note: The target has to be fixed as a composition of the targets for
the emissions of each one of the constituent greenhouse
gases. The Protocol of Montreal, stipulating world-wide
termination of the production and use of CFCs and halons
by the year 2000, dictates that the target for these substances
should be zero. These substances disintegrate ozone when
entering the stratosphere and deplete the ozone layer.
11
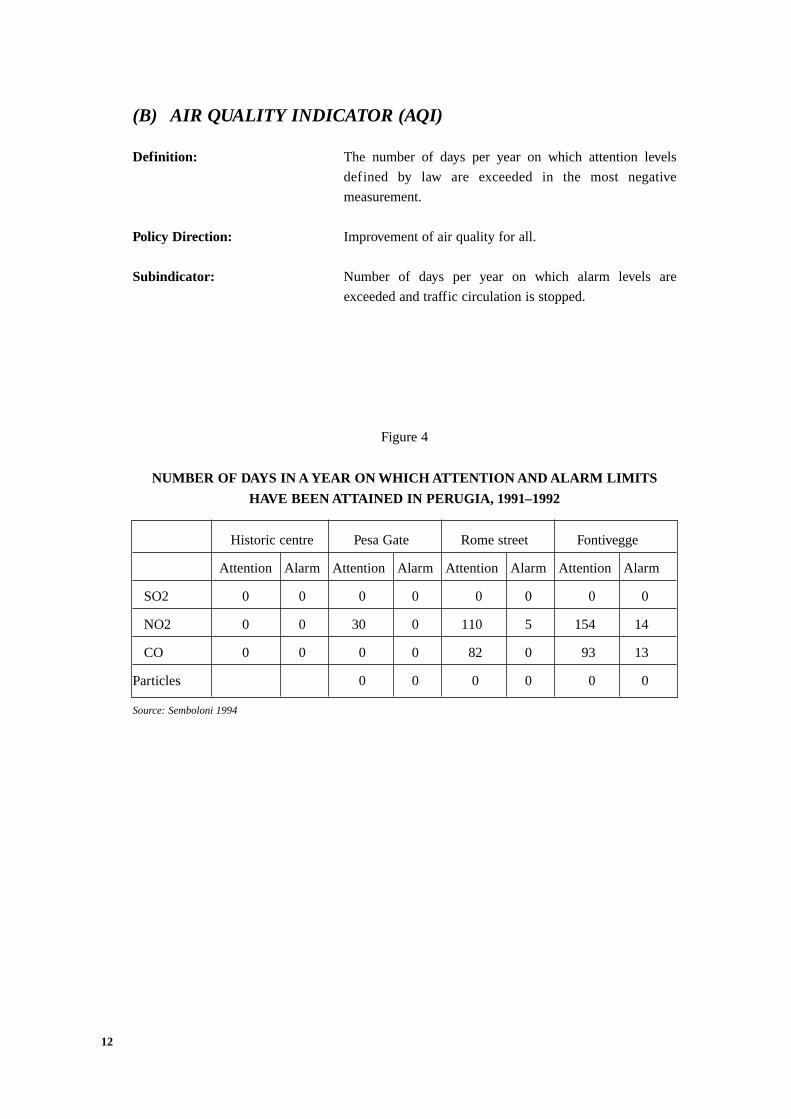
(B) AIR QUALITY INDICATOR (AQI)
Definition: The number of days per year on which attention levels
defined by law are exceeded in the most negative
measurement.
Policy Direction: Improvement of air quality for all.
Subindicator: Number of days per year on which alarm levels are
exceeded and traffic circulation is stopped.
Figure 4
NUMBER OF DAYS IN A YEAR ON WHICH ATTENTION AND ALARM LIMITS
HAVE BEEN ATTAINED IN PERUGIA, 1991–1992
Historic centre Pesa Gate Rome street Fontivegge
Attention Alarm Attention Alarm Attention Alarm Attention Alarm
SO2 0 0 0 0 0 0 0 0
NO2 0 0 30 0 110 5 154 14
CO 0 0 0 0 82 0 93 13
Particles 0 0 0 0 0 0
Source: Semboloni 1994
12
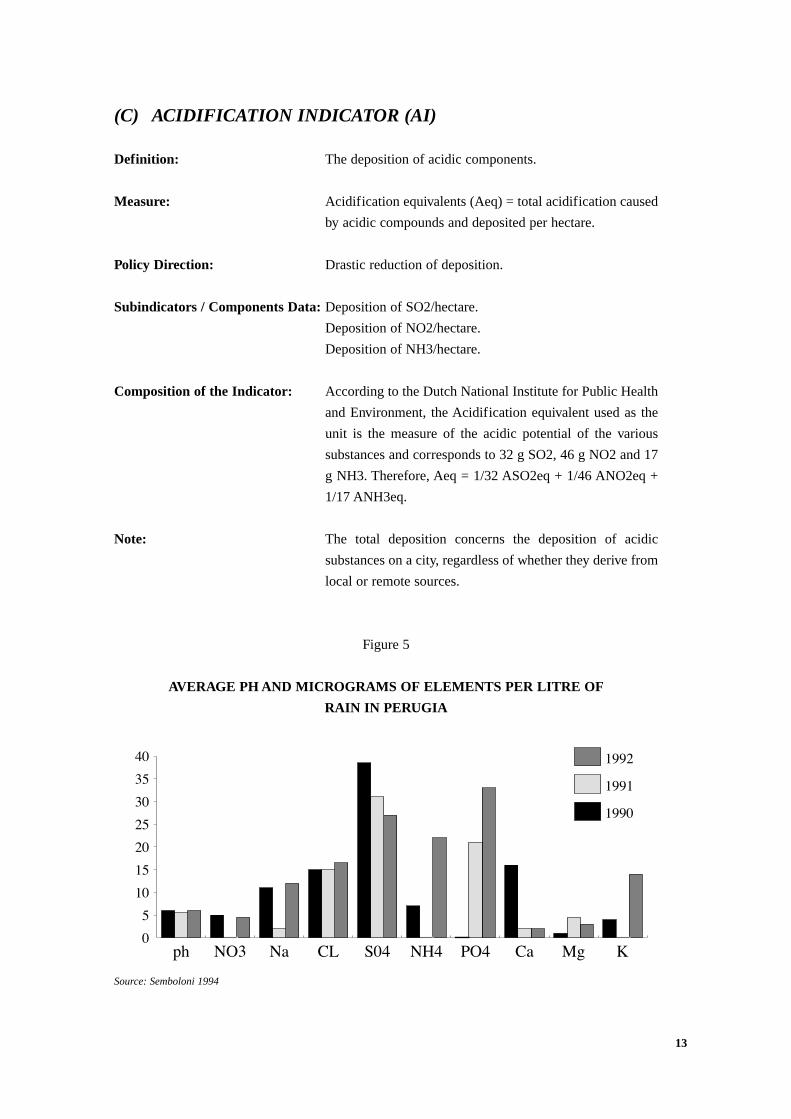
(C) ACIDIFICATION INDICATOR (AI)
Definition: The deposition of acidic components.
Measure: Acidification equivalents (Aeq) = total acidification caused
by acidic compounds and deposited per hectare.
Policy Direction: Drastic reduction of deposition.
Subindicators / Components Data: Deposition of SO2/hectare.
Deposition of NO2/hectare.
Deposition of NH3/hectare.
Composition of the Indicator: According to the Dutch National Institute for Public Health
and Environment, the Acidification equivalent used as the
unit is the measure of the acidic potential of the various
substances and corresponds to 32 g SO2, 46 g NO2 and 17
g NH3. Therefore, Aeq = 1/32 ASO2eq + 1/46 ANO2eq +
1/17 ANH3eq.
Note: The total deposition concerns the deposition of acidic
substances on a city, regardless of whether they derive from
local or remote sources.
Figure 5
AVERAGE PH AND MICROGRAMS OF ELEMENTS PER LITRE OF
RAIN IN PERUGIA
Source: Semboloni 1994
13
0
5
10
15
20
25
30
35
40 1992
1991
1990
KMgCaPO4NH4S04CLNaNO3ph
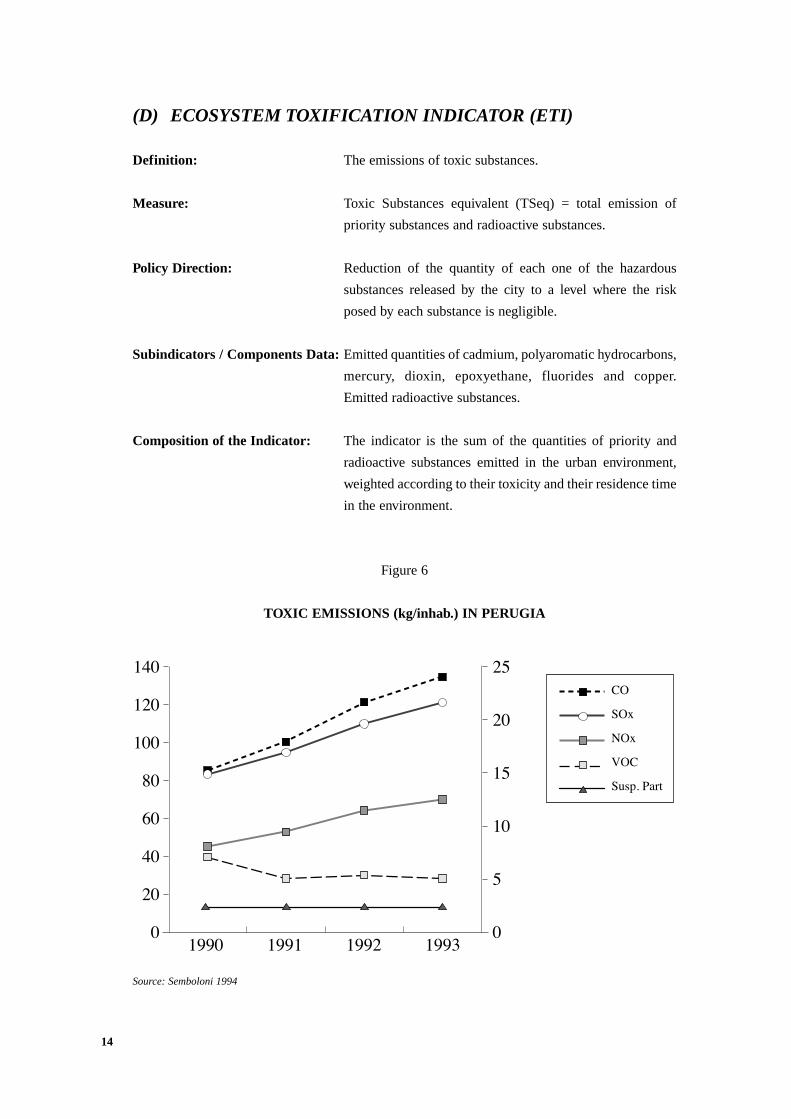
(D) ECOSYSTEM TOXIFICATION INDICATOR (ETI)
Definition: The emissions of toxic substances.
Measure: Toxic Substances equivalent (TSeq) = total emission of
priority substances and radioactive substances.
Policy Direction: Reduction of the quantity of each one of the hazardous
substances released by the city to a level where the risk
posed by each substance is negligible.
Subindicators / Components Data: Emitted quantities of cadmium, polyaromatic hydrocarbons,
mercury, dioxin, epoxyethane, fluorides and copper.
Emitted radioactive substances.
Composition of the Indicator: The indicator is the sum of the quantities of priority and
radioactive substances emitted in the urban environment,
weighted according to their toxicity and their residence time
in the environment.
Figure 6
TOXIC EMISSIONS (kg/inhab.) IN PERUGIA
Source: Semboloni 1994
14
140
120
100
80
60
40
20
0
25
20
15
10
5
01990 1991 1992 1993
CO
SOx
NOx
VOC
Susp. Part
(E) URBAN MOBILITY INDICATOR (UMI) OR CLEANTRANSPORTATION INDICATOR
Definition: The use of environment-friendly means of transport, especially for
enforced mobility, defined as mobility for commuting and basic needs.
Measure: Urban Mobility equivalent (Umeq) = total number of passenger
kilometres by non-environment-friendly means (private car) per inhabitant
and per year. (If passenger kilometres cannot be estimated, trips can be
used). Enforced Umeq (EUMeq) = total number of passenger kilometres
– passenger kilometres by foot and bicycle – passenger kilometres by
public transport, per inhabitant and for basic needs each year.
Policy Direction: Reduction of unnecessary use of motor vehicles, reduction of enforced
mobility and improvement of accessibility. The EC's study on Car-Free
Cities (EC 1992) indicates that there is a maximum number of private cars
that cities can afford.
Subindicators: Enforced Urban Mobility Indicator (EUMeq, mainly for commuting).
Relevant subindicators may be developed according to trip purposes
(tourism, work and study, leisure, business, freight) and according to
transport means.
Components Data: Total number of trips (and their length) by private car and number of trips
(and their length) for commuting and basic needs/inhabitant/year.
Remarks: The increase/decrease in the length of pedestrian areas and cycle paths
over time is also a useful indication of the city's policy to promote less
unsustainable mobility.
15

Figure 7
MODAL SPLIT IN SIENA
Trips per inhabitant and per year in Siena, 1991
Walking Bike Public Transport Car Motorbike Total
Workers 58 1 35 116 14 223
Students 19 0 27 16 4 66
Total 77 1 62 132 18 289
Source: Population census, 1991
Trips per inhabitant per year in Siena.
Year Walking Bike Public Transport Car Motorbike Total
1981 58 1 35 116 14 223
1991 77 1 62 132 18 289
Source: Population census, 1981-1991
Source: Semboloni 1995
16
140
120
100
80
60
40
20
0Walking Bike Public
transportCar Motorbike
1981
1991
Trips per inhabitant per year in Siena
(F) WASTE MANAGEMENT INDICATOR (WMI)
Definition: The total volume of waste disposed of.
Measure: Disposal equivalent (Deq) expressed in tonnes per inhabitant and per year.
Policy Direction: Primary goal: waste minimisation, i.e. prevention and avoidance,
followed by reuse and recycling;
drastic reduction of waste for disposal.
Subindicators: Waste disposed of by incineration or in controlled landfills and in
uncontrolled landfills; waste reused or recycled.
Components Data: Building and demolition waste.
Industrial waste.
Domestic waste.
Retail and service waste.
Composition of the Following the principles of the Dutch system of indicators, the Disposal
Indicator: Indicator is the sum of all waste streams as they all end up at the same
landfill sites (with toxic waste transported to special landfills) and, as with
the actual practice of landfill, there is no adequate separation of the
various types of waste.
Remarks: The indicator considers only solid waste. Liquid waste can be
distinguished by degree of treatment. Possible overlapping with ecosystem
toxification has to be considered.
17
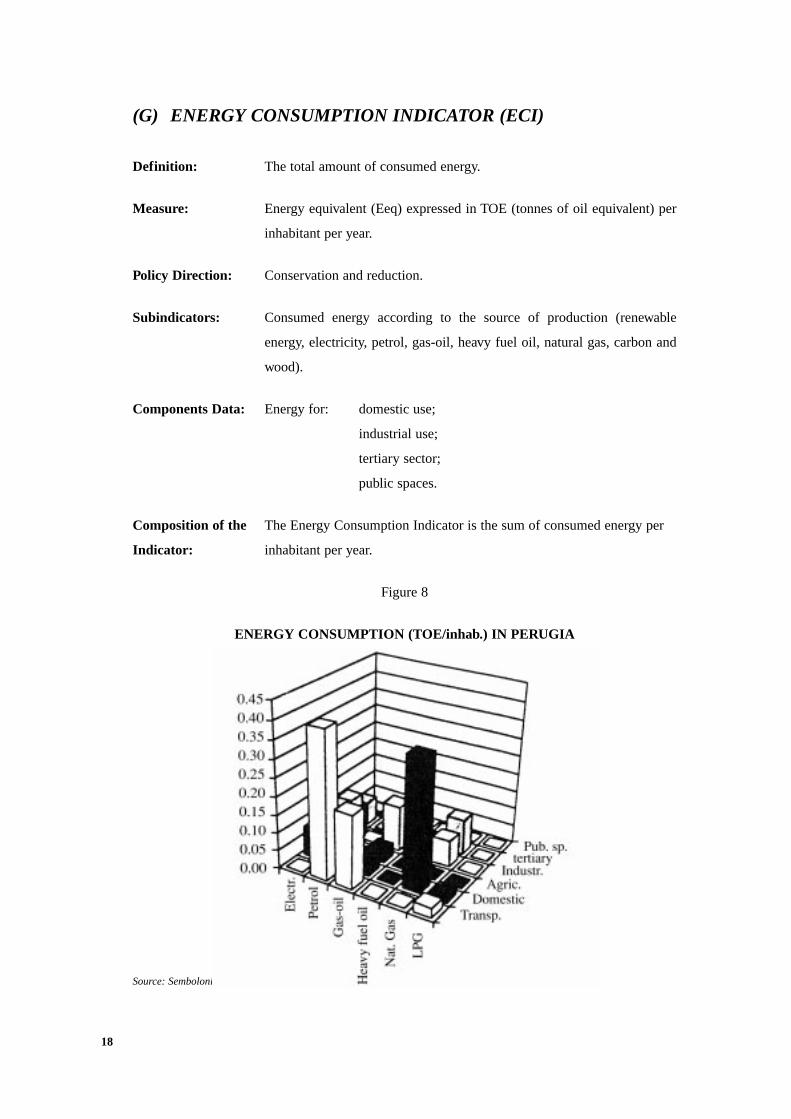
(G) ENERGY CONSUMPTION INDICATOR (ECI)
Definition: The total amount of consumed energy.
Measure: Energy equivalent (Eeq) expressed in TOE (tonnes of oil equivalent) per
inhabitant per year.
Policy Direction: Conservation and reduction.
Subindicators: Consumed energy according to the source of production (renewable
energy, electricity, petrol, gas-oil, heavy fuel oil, natural gas, carbon and
wood).
Components Data: Energy for: domestic use;
industrial use;
tertiary sector;
public spaces.
Composition of the The Energy Consumption Indicator is the sum of consumed energy per
Indicator: inhabitant per year.
Figure 8
ENERGY CONSUMPTION (TOE/inhab.) IN PERUGIA
Source: Semboloni 1994
18
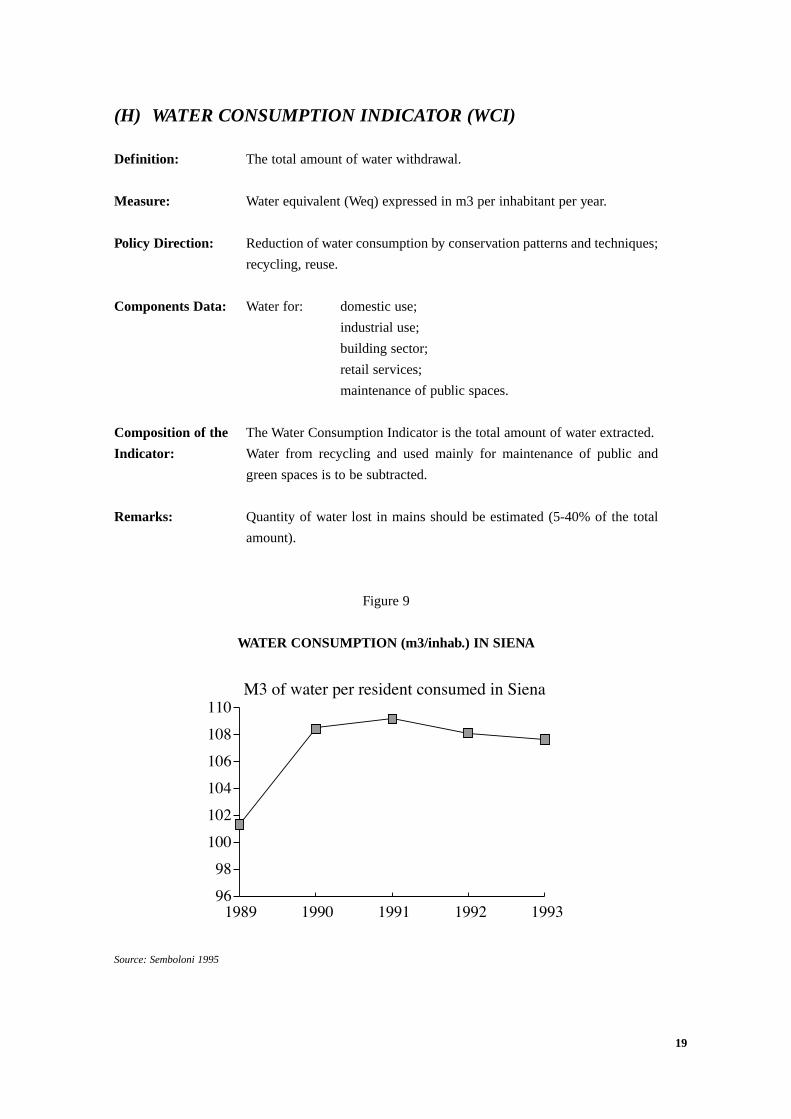
(H) WATER CONSUMPTION INDICATOR (WCI)
Definition: The total amount of water withdrawal.
Measure: Water equivalent (Weq) expressed in m3 per inhabitant per year.
Policy Direction: Reduction of water consumption by conservation patterns and techniques;
recycling, reuse.
Components Data: Water for: domestic use;
industrial use;
building sector;
retail services;
maintenance of public spaces.
Composition of the The Water Consumption Indicator is the total amount of water extracted.
Indicator: Water from recycling and used mainly for maintenance of public and
green spaces is to be subtracted.
Remarks: Quantity of water lost in mains should be estimated (5-40% of the total
amount).
Figure 9
WATER CONSUMPTION (m3/inhab.) IN SIENA
Source: Semboloni 1995
19
110
108
106
104
102
100
98
961989 1990 1991 1992 1993
M3 of water per resident consumed in Siena
(I) NUISANCE INDICATOR (DI)
Definition: Nuisances created by noise, odour or visual pollution.
Measure: Nuisance equivalent (Neq) = percentage of the population affected by
noise, odour or visual pollution.
Policy Direction: Improvement of local environments by reduction of odour, noise or visual
pollution (Dutch target for odour or noise: 41 Neq by 2000).
Subindicator: It is essential to have a subindicator for the percentage of the population
seriously affected by one of the above factors.
Components Data: Percentage of the population adversely affected by:
noise;
odour;
visual pollution (i.e. graffiti).
Composition of the Noise nuisance results from air, road and rail traffic and industry.
Indicator: Odour nuisance is mainly caused by traffic, industry and services.
Visual pollution is mainly caused by derelict land and social degradation.
The total number of people affected is the sum of the people affected by
any one of these sources after correction is made to avoid overlaps within
the area of nuisances, as simultaneous exposure to different sources or
different types of nuisance may occur.
Remarks: The complaints registered by source of nuisances are an indication of the
seriousness of the problem. Regarding noise in particular, the number of
days per year where measurements exceed norms is also a good indication
and may serve as an alternative indicator.
20

(J) SOCIAL JUSTICE INDICATOR (SJI)
Definition: The degree of social sustainability of a city.
Measure: Social Justice equivalent (Sjeq) expressed by the percentage of people
affected by poverty, unemployment, lack of access to education,
information, training and leisure.
Policy Direction: Reduction (ideally elimination) of the percentage of the excluded and
marginalised population.
Subindicators: It is essential to have a subindicator for the percentage of the population
seriously affected by one of the above components. It is also essential to
have subindicators for vulnerable groups of population (youth, women,
the handicapped and long-term unemployed).
Components Data: Percentage of the population affected by poverty, unemployment, lack of
access to education, information, training and leisure.
Composition of the The total percentage of people affected by lack of social justice is the sum
Indicator: of the percentages affected by any one of the above factors. A corrective
factor has to adjust the percentage of the population affected by more than
one factor.
Figure 10
COMPOSITION OF UNEMPLOYED IN PERUGIA
Source: Semboloni 1994
21
45.040.035.030.025.020.015.05.00.0
Men long term unempl.
12.6
20.0
29.524.2
14.7
25.0
43.2
32.5
Men lookingfor first job
Women long term unempl.
Women lookingfor first job
1981
1991
(K) HOUSING QUALITY INDICATOR (HQI)
Definition: The degree to which inhabitants suffer from poor housing conditions.
Measure: Housing Quality equivalent (HQeq) = percentage of people affected by
lack of housing or poor housing environments.
Policy Direction: Offering all inhabitants good housing conditions.
Subindicator: The number of homeless in percentage of the inhabitants and of those who
might become homeless.
Components Data: Percentage of the homeless population; percentage of the population
threatened by loss of housing; percentage of the population in poor
housing conditions.
Composition of The percentage of inhabitants without good housing.
the Indicator:
Remarks: The number of registered demands for good housing is a good indication
of the actual needs and may serve as an alternative indicator.
22

(L) URBAN SAFETY INDICATOR (USI)
Definition: The degree to which people suffer from lack of urban safety.
Measure: Urban Safety equivalent (USeq) = total percentage of the population
affected seriously by crime or traffic accidents.
Policy Direction: Fostering of urban safety. Decrease in, ideally elimination of, attacks and
incidents.
Subindicator: It is essential to have a subindicator for the total percentage of irreversible
long-term injuries.
Components Data: Percentage of people attacked. Percentage of people affected by road
accidents.
Composition of the The total percentage of the population affected by the previous two
Indicator: factors.
Figure 11
CRIME INCIDENTS (per 1,000) IN SIENA
Source: Semboloni 1995
23
1.80
1.60
1.40
1.20
1.00
0.80
0.60
0.40
0.20
0.00
25.00
20.00
15.00
10.00
5.00
0.001985 1986 1987 1988 1989 1990 1991 1992 1993
Publ. safety Drug pushingonly
Thefts
(M) ECONOMIC URBAN SUSTAINABILITY INDICATOR (ESI)
Definition: The viability of the urban economy.
Measure: Economic Sustainability equivalent (ESeq) = city income - city fiscal
deficit - environmental expenditure - pollution damage per inhabitant per
year.
Policy Direction: Increase of economic sustainability with increase of city income and city
budget and reduction of pollution damage.
Components Data: City income (total individual incomes).
City fiscal deficit (–) (city budget – taxes).
Environmental expenditure (for waste collection, sewage, transport, water
management).
Pollution damage (air, water, land).
Composition of the ESeq = [CI – CFD – EE – PD]/population.
Indicator:
Remarks: The city environmental expenditure per inhabitant per year is a good
indicator of the city's environmental behaviour, and the city expenditure
per inhabitant per year is an expression of the city's financial capacity.
They can both serve as valid subindicators.
24
(N) GREEN, PUBLIC SPACE AND HERITAGE INDICATOR (GPI)
Definition: The improvements needed for green, public spaces and heritage.
Measure: Green, Public Space and Heritage equivalent (GPSeq) = percentage of the
green or public spaces and local heritage in need of improvement.
Policy Direction: Improvement of green and public spaces, restoring sites, forging the
identity of cities.
Subindicators: It is important for urban quality of life to have the surface of green spaces
per inhabitant, the surface of heritage spaces per inhabitant and the surface
of public spaces per inhabitant. They are suggested as alternative
indicators.
Components Data: Percentage of green spaces needing improvement/total surface of green
space. Percentage of heritage spaces in need of improvement/total surface
of heritage space. Percentage of public spaces (including heritage sites) in
need of improvement/total surface of public space.
Composition of the The percentage of green, heritage and public (including historic) spaces to
Indicator: be improved is the sum of the three percentages.
25

(O) CITIZEN PARTICIPATION INDICATOR (CPI)
Definition: The degree to which the local population participates in the decision-
making and improvement of the local quality of life.
Measure: Citizen Participation equivalent (CPeq) = total percentage of the
population participating in local elections or as active members in
associations for urban improvement and quality of life.
Policy Direction: Co-management of cities with citizens, urban governance with all actors.
Components Data: Percentage of people participating in local elections.
Percentage of people being active members of environmental, public
health and cultural associations.
Composition of the The total percentage of the population active in local elections and
Indicator: participating in associative life.
Remark: It is important when assessing the participation in local elections to know
if participation in the elections is obligatory or not.
26
(P) UNIQUE SUSTAINABILITY INDICATOR (USI)
Definition: Indicator to be defined by each city according to its uniqueness (i.e.
unique climatic and local conditions) or the planning of a unique once-in-
a-lifetime event such as the organisation of the Olympic Games or a
universal exhibition. This indicator should represent the degree to which
unique factors or events lead to urban sustainability with its
environmental, social and economic dimensions.
It is worth highlighting in this respect the Tourism Sustainability
Indicators developed in Venice by the Eni Enrico Mattei Foundation, as a
model of its kind.
27
D. TOWARDS THE DEVELOPMENT OF AN INDEX OFURBAN SUSTAINABILITY PERFORMANCE
Indicators are not simply relevant data or statistics. The definition of indicators is a complex
procedure which will have to be checked and updated whenever required. The degree of
complexity increases with the creation of a unique sustainability index, as indicators have to be
weighted by their contribution to urban sustainability levels. The method we suggest for defining
a unique urban sustainability index is based on a survey measuring the theoretical degree of
interest shown by the citizens of a given city. The theoretical degree of interest is the individual's
true value, true probability of accepting an offer and true ranking of alternatives.
The design of the survey should include the assessment of the survey instruments (and scenaria,
to see if all known sources of bias have been removed or avoided) and the empirical analysis of
responses to check their consistency. For urban policies, it is essential to know how citizens value
the different fields of action and intervention. Their willingness to pay for achieving sustainability
goals is most important when decisions are to be taken for the provision of a public good or an
increase in the level of an environmental amenity. For the given set of sustainability goals, the
survey should be based on the following principles:
1) All the citizens included in the sample representing the city population should have full
information on all sustainability goals and fields. There is, in general, much more information
on local environment and quality of life issues than on those concerning the national and
global level.
2) The basic question is how the citizens divide the whole budget available for improvement of
the environment and quality of life (i.e. total taxes) into the following categories:
• Reduction of the city's contribution to the global climate
• Improving air quality
• Cleaning-up of the acidic deposits
• Preventing ecosystems toxification
• Reinforcing clean transportation
• Reducing waste disposal
• Reducing energy consumption
• Reducing water consumption
• Reducing levels of local nuisances
• Improving social justice
• Improving housing conditions
• Improving urban safety
28
• Improving local heritage, green and public spaces, or
• Improving a specific local condition or investing in the creation of a unique project
(to be specified for each city)
3) Systematic errors or bias into the value measures should be avoided by:
• Adequate provision of information to make the context of the question fully understood
by the respondent, in order to avoid mis-specification;
• Provision of information in a way not to predispose the respondent;
• The questions and information should not provide any incentive to the respondent to
misrepresent his or her values.
4) In the set of fields of action suggested above, we did not include the economic elements of
sustainability and the citizen participation goals. The economic urban sustainability indicator,
with the composition suggested here, is, in fact, an index as it includes economic, social and
environmental considerations and may be used as a reference to measure the economic and
environmental improvements. However, this indicator depends on the budget allocated to the
city by the central government and cannot be used as an absolute indicator for the
performance of the city. It depends also on the level of local taxes, a fact which might induce
respondents to misrepresent their true values. The survey should consider the degree of the
respondent's participation in local improvements, mainly because a citizen involved in local
policies is better informed and more aware.
5) The analysis of the survey results would conclude with the degree of preference of citizens,
expressing the weight citizens give to each sustainability goal and field of urban intervention.
This weight is what citizens perceive as contribution of each goal to the achievement of
sustainability in their city. The thematic indicators, weighted by their contribution to
sustainability levels, compose the index of Urban Sustainability Performance.
6) The survey should be done periodically to identify changes in preferences of the same
respondents.
The above methodology leads to an index of sustainability independent of finances provided to
the city. The Charter states that for the achievement of the sustainability goals it is essential that
local authorities are given a solid financial base. The city may allocate its budget to projects
according to citizens intensity of priorities, without achieving significant improvements in each
field.
29
E. HIGHLIGHTS AND PERSPECTIVES
Many more indicators could also enrich the set of suggested indicators. It is, however, essential to
have the shortest, most significant set. Income per capita, provision of housing units, socio-
economic composition reveal much about a city and its quarters. The natural space urbanised each
year is a valuable indicator of sustainability. It has been suggested to have separate sets of
indicators for residential population and tourists who, in cities like Rhodes, represent two different
social entities. Seasonal fluctuation is also very important for tourist cities. Indicators of social
conflicts (hosts-tourists) or indicators of cultural sustainability (i.e. evolution of spoken languages
etc.) could also be envisaged. Data are often missing, but the problem mainly concerns their
quality and significance rather than their quantity.
In the Foundation's project on medium-sized cities, the exercise only reached the stage of the
development of thematic indicators. A discussion on the progress towards the sustainability index
remains to be undertaken. As a general rule, the cities studied possess too little information on
problems linked to the global environment and much more on the local environment. This can
possibly be explained by the fact that global concerns have been the most recent ones to be
included in the urban agenda. The only measured gas contributing to the global climate change is
CO2. Concerning air quality, we have been surprised to see that even in medium-sized cities,
attention and alarm limits, especially for NO2, are often exceeded. This indicator can be totally
insignificant if the attention or alarm levels are not exceeded (as is the case of Kavala or Rhodes).
One of the most interesting indicators for all cities has been the one concerning urban mobility.
The evolution of modal split is very important for changing environmental models and lifestyles.
In an attempt to compare cities we distinguish two outstanding exceptions, both from Germany.
The first, Freiburg, is the secret capital of ecology, and the other, Dessau, is in a maelstrom of
problems, challenges and changes. Freiburg is one of the few cities witnessing an increase in the
use of public transport and this only after 1989 (the boom in public transport use was registered
in 1991 with the introduction of the “Environment Pass”). In Dessau, the use of public transport
has decreased continuously since 1972 (16%) and fell, from 1990 to 1991, from 12% to 6%. On
the other hand, the private car, used by 25% of the inhabitants in 1990, still conquered 37% of
them in 1991. It is also interesting to see that cities' efforts in restricting the access of private cars
to their historic centres, like Perugia, did not succeed in a total decrease in private car use.
The indicator of energy consumption seems quite coherent with the increase in the use of the
private car. Water consumption is slightly increasing with a dramatic amount lost in water mains
(in some cases up to 40% of the quantity provided). As to local nuisances, noise pollution is
becoming a serious problem, even in medium-sized cities. There is very little information on
olfactory nuisances and almost nothing on visual and aesthetic pollution. The perceived
30

cleanliness of local environments may also lead to the formation of a valuable indicator. In
Rhodes, a Ministry of the Environment survey insisted on citizens' perception of the quality of
beaches and sea water. The indicators on waste management reveal an insignificant rate of reuse
and recycling in most cases (zero for the city of Kavala and around zero for a number of other
cities), and even in cities that have introduced pioneering recycling schemes, like Parma, the
quantity recycled represents only 0.1% of the quantity produced.
The social justice indicator reveals that in all the cities included, 10% of the population, on
average, suffers from various degrees of exclusion, even though the homeless population is not
registered. However, Freiburg (which, along with Parma belongs to well-developed regions of the
European Union) has registered 1% of the population as homeless, 2.8% of the population as
threatened by loss of housing and 8.3% of the population as living in low-standard social housing.
Concerning unemployment, Alicante has a rate of 16% and Dessau more than 20%. In 1991,
Parma was the only city with an unemployment rate lower than the EU average. However, after a
rapid increase, it reached this average in 1994. The same city also registers the lowest percentage
of bad housing (5% in 1991), but this indicator is mainly formed from the number of square
metres per inhabitant. Less than 1% of the urban population appeared to have been victims of
social insecurity in the cities studied and this conforms quite well to the peaceful and serene image
of medium-sized cities (EF 1997d).
Our case studies did not define extremely vulnerable social groups, but the study on Alicante
revealed that, in 1991, 2.65% of the population was illiterate, which is a very high percentage for
an urban population in Europe. The development of an economic sustainability indicator led to the
study of the varied composition of municipal budgets, but it did not succeed in revealing whether
a city has the means to pay for its search for sustainability. The development of the indicator of
local heritage, green and public spaces was made difficult by the many different definitions of
such spaces, which in some cities even include forests which are within the administrative
boundaries. The indicator on citizen participation in local elections cannot have much significance
in countries where voting is compulsory. Citizens' participation in cultural associations seems
more significant and the indicator reveals that more than 10% of the inhabitants of the cities
studied participate in such associations.
At the turn of this century, building Eutopia (Doxiadis 1975a) depends on the art of co-governing
cities by and with the help of all actors. Institutional innovations and indicators are needed to
provide fertile ground for socio-economic improvements and creativity. All actors have a major
role to play in this process. It involves establishing a sense of urgency, developing a vision and
strategy, communicating the vision of change and proposing new measures for evaluating
progress. They must proceed with empowering people for broad-based action, generating short-
term wins, consolidating gains, producing more change and anchoring new changes in culture.
Cities need paradigm shifts towards a new economic, political and socio-environmental
equilibrium.
31

32

BIBLIOGRAPHY
Abbott, J. 1996. Sharing the City: Community Participation in Urban Management. London:
Earthscan.
Adriaanse, A. 1993. Environmental Policy Performance Indicators. Dutch Ministry of Housing,
Physical Planning and Environment, The Hague.
Alberti, M., Solera, G. & Tsetsi, V. 1994. La Città sostenibile. Milano: Franco Angeli.
ALFOZ. 1995. La Ciudad accessible. No. 109. Madrid.
Ambiente Italia. 1993. Per une Mobilitá urbana sostenible. Milano.
Ansay, P. & Schoonbrodt, R. 1989. Penser la ville. Brussels: AAM.
Ascher, F. 1995. Metapolis ou l’ avenir des villes. Paris: Ed. Odile Jacob.
Australian Commonwealth Department of Housing and Regional Development. 1995. Urban
Futures. Canberra.
Breheny, M.J. (ed). 1993. Sustainable Development and Urban Forms. In European Research in
Regional Sciences, 2, 138-159. London: Pion.
Burtenshaw, D. et al. 1991. The European City (A Western Perspective). London: D. Fulton.
Burwitz et al. 1991. Vier Wochen ohne Auto. Bericht über ein freiwilliges städtisches Abenteuer.
University of Bremen.
Calvet, L.J. 1994. Voix de la ville. Paris: Payot.
Car-Free Cities Club. 1994. Car-Free Cities Charter. Brussels.
Castells, M. & Hall, P. 1994. Technopoles of the World. The Making of Twenty-first Century
Industrial Complexes. London: Routledge.
CEMR. 1996. Local Agenda 21. In Documents of XXth General Assembly. Thessaloniki.
Council of Europe. 1992. The European Urban Charter. Standing Conference of Local and
Regional Authorities of Europe. Strasbourg.
Delfan, G. 1994. Le retour du citoyen, démocratie et territoire. La Tour d’Aigues, DATAR. Paris:
Editions de l’Aube.
Delft Institute of Technology. 1992. European Cities: Growth and Decline. Conference papers.
DIV. 1990. Les Villes contre la délinquance. Paris.
DIV. 1995. Territoires urbains et exclusion sociale. Paris.
Doxiadis, C. 1974. Anthropopolis. Athens Publishing Centre.
Doxiadis, C. 1975a. Building Eutopia. Athens Publishing Centre.
Doxiadis, C. 1975b. Action for Human Settlements. Athens Publishing Centre.
Doxiadis, C. & Papaioannou, J. 1974. Ecumenopolis, The Inevitable City of the Future. Athens
Publishing Centre.
Economist (The). 1995. Survey on Cities: Turn on the Lights. 29 July.
Elkin, T. & McLaren, D. 1991. Reviving the City. London: Friends of the Earth.
ENA Recherche. 1996. La Ville et ses usagers. Paris: La documentation française.
European Commission, DG XI. 1990. Green Paper on the Urban Environment. Brussels.
33

European Commission, DG XII. FAST Programme. 1991. Europerspectives Conference.
Working documents. Namur.
European Commission, DG XI. 1992a. The Car-Free City. Rome: Tecnoser.
European Commission, DG VII. 1992b. Green Paper on Transport (Sustainable Mobility).
Brussels.
European Commission, DG XI. 1992c. Towards a Sustainable Development. Brussels.
European Commission, DG XVI. 1992d. Europe 2000. Brussels.
European Commission, DG XI. 1993a. Towards a New Development Approach. Conference
papers. Brussels.
European Commission. 1993b. White Paper on Growth, Employment and Competitiveness.
Brussels.
European Commission, DG XI. 1994a. First Report on the Sustainable City. Brussels.
European Commission, DG XI. 1994b. For a New Development Approach. Workshop papers.
Brussels.
European Commission, DG XVI. 1994c. Competitiveness and Cohesion, Trends in the Regions.
Brussels.
European Commission, DG XVI. 1995a. Europe 2000+. Brussels.
European Commission. 1995b. Local Development and Employment Initiatives. Brussels.
European Commission, DG XI. 1996a. European Sustainable Cities. Brussels.
European Commission, DG XVII. 1996b. European Energy to 2020. Brussels.
European Commission. 1997a. L’Europe des villes. Brussels.
European Commission. 1997b. The Future of North-South Relations. Cahiers of the Forward
Studies Unit 1. Brussels.
European Environment Agency. 1995a. Europe’s Environment: The Dôbris Assessment.
Copenhagen.
European Environment Agency. 1995b. Environment in the European Union 1995. Copenhagen.
European Foundation for the Improvement of Living and Working Conditions. 1993.
Innovations for the Improvement of the Urban Environment. A European Overview. Dublin.
European Foundation for the Improvement of Living and Working Conditions. 1994a.
European Conference on Urban Innovations. Reports. Dublin.
European Foundation for the Improvement of Living and Working Conditions. 1994b.
Visions and Actions for Medium-sized Cities. Dublin.
European Foundation for the Improvement of Living and Working Conditions. 1994c. Urban
Innovation and Employment Generation. Dublin.
European Foundation for the Improvement of Living and Working Conditions. 1995a. Urban
Eco-auditing and Local Authorities in Europe. Dublin.
European Foundation for the Improvement of Living and Working Conditions. 1995b. Le
PMEs dans la revitalisation de la ville européenne. Dublin.
European Foundation for the Improvement of Living and Working Conditions. 1995c.
Transport and Public Spaces: the Connective Tissue of the Sustainable City. Dublin.
European Foundation for the Improvement of Living and Working Conditions. 1995d.
Esthétique, fonctionnalité et désirabilité de la ville durable. Dublin.
34
European Foundation for the Improvement of Living and Working Conditions. 1996a.
Intermediate Cities in Search of Sustainability. Dublin.
European Foundation for the Improvement of Living and Working Conditions. 1996b. What
Future for the Urban Environment in Europe: Contribution to HABITAT II. Dublin.
European Foundation for the Improvement of Living and Working Conditions. 1996c.
Innovations for the Improvement of the Urban Environment: Austria – Finland – Sweden.
Dublin.
European Foundation for the Improvement of Living and Working Conditions. 1997a.
Perceiving, Conceiving, Achieving the Sustainable City. Dublin.
European Foundation for the Improvement of Living and Working Conditions. 1997b.
European Cities in search of Sustainability. Dublin.
European Foundation for the Improvement of Living and Working Conditions. 1997c.
Utopias and Realities of Sustainable Urban Development. Dublin.
European Foundation for the Improvement of Living and Working Conditions. 1997d.
Medium-Sized Cities in Europe. Dublin.
European Sustainable Cities and Towns Campaign. 1994. Charter of European Cities and
Towns: Towards Sustainability. Brussels.
EUROSTAT. 1997. L’offre et la demande en matière de statistiques urbaines. Luxembourg.
Friends of the Earth. 1995. Towards a Sustainable Europe. Amsterdam.
Garreau, J. 1991. Edge City. Life on the New Frontier. New York: Doubleday.
Gelford, P., Jaedicke, W., Winkler, B. & Wollmann, H. 1992. Ökologie in den Städten. Basle-
Boston-Berlin: Birkhäuser Verlag.
Gillo, B. & Solera, G. (ed.). 1997. Sviluppo Sostenibile e Città. Napoli: Clean Edizioni.
Girardet, H. 1992. Cities: New Directions for Sustainable Urban Living. London: Gaia Books
Limited.
Grund, I. E. 1991. Venedig-Vorbild: Eine Autofreie Stadt. Münich: Technical University of
Münich.
HABITAT II. 1996. An Urbanizing World, Global Report on Human Settlements. Oxford: Oxford
University Press.
Hahn, E. 1991. Ecological Urban Restructuring. WSB (Science Centre Berlin), Paper FS II 91-
402.
Hall, P. 1988. Cities of Tomorrow. Oxford: Basil Blackwell.
Hall, P. 1992. Urban and Regional Planning. (Third Ed.) London and New York: Routledge.
Hall, P. 1993. Forces Shaping Urban Europe. In Urban Studies 30, 883-898.
Hall, P. 1993. Planning in the 1990s: An International Agenda. In European Planning Studies, 1,
1.
Hall, P. 1995. The European City: Past and Future. In The European City: Sustaining Urban
Quality. Conference papers. Copenhagen.
Hartwick, J. 1994. The Economics of Sustainability. Conference paper in HIID, Harvard
University.
Harvey, D. 1983. Social Justice and the City. London.
Harvey, D. 1991. From Place to Space and Back Again. Lecture held on 17 April 1991 in Milan.
35

Healey, P. 1997. Collaborative Planning: Shaping Places in Fragmented Societies. London:
Macmillan.
ICLEI. 1995. Towards Sustainable Cities and Towns. Report of the First European Conference on
Sustainable Cities and Towns. Aalborg.
IFHP. 1993. Cities for Tomorrow. Working papers of the 80th International Congress. Helsinki.
Indovina, F. 1993. La Città occasionale. Milano: Franco Angeli.
INTA. 1995. Strategies for Cities of the 21st Century. Working papers. Vienna.
International Institute of the Urban Environment. 1995. Environmental Awareness Workshops.
The Hague.
Jacobs, J. 1969. The Economy of Cities. London: Penguin.
Jacobs, J. 1985. La Ville et la richesse des nations. Réflexions sur la vie économique. Quebec:
Boréal.
Jacobs, J. 1992. Systems of Survival. New York: Random House.
Jacquier, C. 1991. Voyage dans 10 quartiers européens en crise.
Koolhas, R. 1995. What Ever Happened to Urbanism?. S.M.L.XL. Rotterdam: 010 Publishers.
Landry, C. & Bianchini, F. 1995. The Creative City. London: Demos/Comedia.
La Ville. 1994a. Six Interviews with Architects. Paris: Le Moniteur.
La Ville. 1994b. Catalogue d’Exposition. Paris: Centre Georges Pompidou.
Martinotti, G. 1993. Metropoli: la nuova morfologia sociale. Bologna: Il Mulino.
Masser, I. et al. 1992. The Geography of Europe’s Futures. London: Belhaven Press.
Mastrantonio, C. (ed.) 1991. La Città amica. Rapporto sulle esperienze più avanzate di gestione
dei servizi municipali. Suppl., La Nuova Ecologia 84, Roma.
Mega, V. 1993. Innovations for the Improvement of the Urban Environment: A European
Overview. In European Planning Studies, Vol. 1, No. 4.
Mega, V. 1994a. Les Fronts de l’innovation urbaine en Europe. In Urbanisme. No. 276-277. Paris
Studies, Vol. 1, No. 4.
Mega, V. 1994b. Sustainability Indicators for European Cities. Harvard Institute for International
Development.
Mega,V. 1995a. City and Innovation: The European Challenge. In Sociedade e territ—rio, No. 22.
Lisbon.
Mega, V. 1995b. En Quête de la Ville Durable. In Les Petites Affiches, No. 96, Paris.
Mega, V. 1996. Innovazioni per il Miglioramento dell’Ambiente Urbano: Una panoramica
europea. In La città sostenibile. University of Parma.
METROPOLIS. 1996. Metropolis for the People. Conference documents. Tokyo.
Ministère de l’Environnement. 1993. Chartes pour l’environnement (écologie urbaine et rurale,
qualité de la vie, territoires). Paris.
MIT. 1997. Summer Seminar on Promoting Innovation. Working Papers. Cambridge, MA.
MOPTMA. 1992. Una Politica para las Ciudades. In Revista Estudios Territoriales 39. Madrid.
MOPTMA. 1995. City: Place of Problems and Opportunities. Working papers. Madrid.
Mumford, L. 1961. La Cité à travers l’histoire. Ed. Française. Paris: Le Seuil 1964.
Municipality of Amsterdam. 1994. Car-Free Cities? Working papers.
Municipality of Athens. 1994. From the Organic City to the City of Citizens. Athens.
Nijkamp, P. & Perrels, A. 1994. Sustainable Cities in Europe. London: Earthscan.
36

OECD. 1994a. Cities for the 21st Century. Paris.
OECD. 1994b. Urban Energy Handbook. Paris.
OECD. 1996a. Stratégies pour le logement et l’intégration sociale dans les villes. Paris.
OECD. 1996b. Innovative Policies for Sustainable Urban Development. The Ecological City.
Paris.
OECD. 1997. Indicators for Urban Policies. Paris.
OECD-ECMT. 1994. Urban Travel and Sustainable Development. Paris.
OECD-Sweden. 1995. Urban Policies for an Environmentally Sustainable World. Stockholm:
Swedish Council for Planning and Co-ordination of Research.
Prince of Wales Institute of Architecture. 1993. The Sustainable City. Report on the 1993
Summer School. London.
Prince of Wales Institute of Architecture. 1996. Action Planning. London.
Putnam, R. et al. 1993. Making Democracy Work: Civic Traditions in Modern Italy. New York,
London, Tokyo: Princeton University Press.
Rautsi, J. 1993. The European City Today. The Helsinki Round Table on Urban Improvement
Strategies. Helsinki: Ministry of Environment.
Rodwin, L. & Holuster, R. 1984. Cities of the Mind. New York: Plenum Press.
Roullier, J.E. 1989. 25 Ans de Villes Nouvelles en France. Paris: Economica.
Rueda, S. 1995. Ecologia Urbana. Barcelona: Beta Editorial.
Sansot, P. 1973. La poétique de la ville. Paris: Klincksieck.
Sassen, S. 1991. The Global City: New York, London, Tokyo. Princeton University Press.
Sassen, S. 1994. Cities in a World Economy. London, New Delhi: Pine Forge Press.
Schmidt-Eichstaedt, G. 1993. Schwabach, Modell-Stadt-Ökologie. TU Berlin: Institut für Stadt
und Regionalplannung.
Schumpeter. 1976. Capitalism, Socialism and Democracy. New York: Harper and Row.
Schoonbrodt, R. 1987. Essai sur la destruction des villes et des campagnes. Liège: Pierre
Mardaga.
Semboloni, F. 1994. Case Study on Perugia. Working Paper EFILWC. Dublin.
Semboloni, F. 1995. Case Study on Siena. Working Paper EFILWC. Dublin.
Short, J. 1989. The Humane City. Oxford: Basil Blackwell.
Sterner, T. (ed.) 1994. Economic Policies for Sustainable Development Dordrecht: Kluwer
Academic Publishers.
Tagliaventi, G. & O’Connor, L. 1992. A Vision of Europe. Firenze: Alinea.
Touraine, A. 1997. Pourrons-nous vivre ensemble? (Egaux et Différents). Paris: Fayard.
UCD. 1996. Assessing Sustainability in Ireland. Dublin.
UITP. 1991. Green Light for Towns. Brussels.
UNESCO. 1988. MAB. Towards the Sustainable City? Paris.
UNESCO. 1995. Les Libertés de la ville. Passages. Paris.
WHO-OECD. 1996. Our Cities, Our Future. First International Congress on Healthy and
Ecological Cities. Copenhagen.
World Bank. 1994. Making Development Sustainable; From Concepts to Actions. Washington
DC.
World Bank. 1995a. The Human Face of the Urban Environment. Washington DC.
37

World Bank. 1995b. The Business of the Sustainable Development. Washington DC.
World Resources Institute. 1994. Developing Environmental Indicators. A report on the
workshop on Global Environmental Indicators. Washington DC, 7-8 December 1992.
38

European Foundation for the Improvement of Living and Working Conditions
Urban Sustainability Indicators
Luxembourg: Office for Official Publications of the European Communities
1998 Ð 40 p. Ð 21 x 29,7 cm
ISBN 92-828-4669-5
39

40

EF/98/07/EN
Urban SustainabilityIndicators
EUROPEAN FOUNDATIONfor the Improvement of Living and Working Conditions
Urban SustainabilityIndicators
Urban sustainability indicators are important instruments for assessing the performance of cities. They
include environmental, economic and social indicators designed to identify progress in meeting the
objectives of socio-economic and environmental sustainability.
Many European cities work with specific sets of indicators which enable them to measure their success in
attaining their targets and communicating with their citizens. The Foundation created a common
framework of urban sustainability indicators for cities according to the Charter of European Sustainable
Cities and Towns, the European version of Local Agenda 21.
OFFICE FOR OFFICIAL PUBLICATIONS OF THE EUROPEAN COMMUNITIES
L- 2985 Luxembourg
9 789282 846698
ISBN 92-828-4669-5
145
SX-17-98-346-EN
-C