Embed Size (px)
Citation preview
Urban Poverty Issues and Antipoverty programs
Urban Poverty Issues and Antipoverty programs
Prof. David E. ClarkProf. David E. Clark
Weeks #11-12Weeks #11-12
Why Study Poverty in Urban Economics?Why Study Poverty in Urban Economics?
Spatial concentrationSpatial concentration Urban vs. RuralUrban vs. Rural Central city vs. suburbanCentral city vs. suburban
The correct policy recommendation The correct policy recommendation depends on a correct analysis of the depends on a correct analysis of the problem.problem.
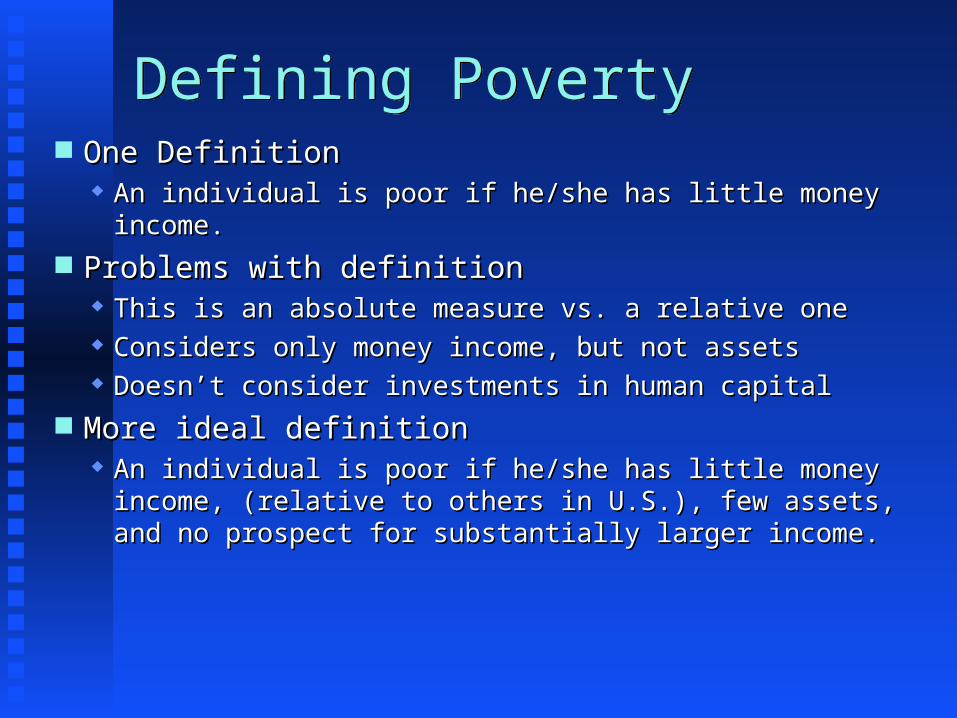
Defining PovertyDefining Poverty One DefinitionOne Definition
An individual is poor if he/she has little money income.An individual is poor if he/she has little money income. Problems with definitionProblems with definition
This is an absolute measure vs. a relative oneThis is an absolute measure vs. a relative one Considers only money income, but not assetsConsiders only money income, but not assets Doesn’t consider investments in human capitalDoesn’t consider investments in human capital
More ideal definitionMore ideal definition An individual is poor if he/she has little money income, (relative An individual is poor if he/she has little money income, (relative
to others in U.S.), few assets, and no prospect for substantially to others in U.S.), few assets, and no prospect for substantially larger income.larger income.
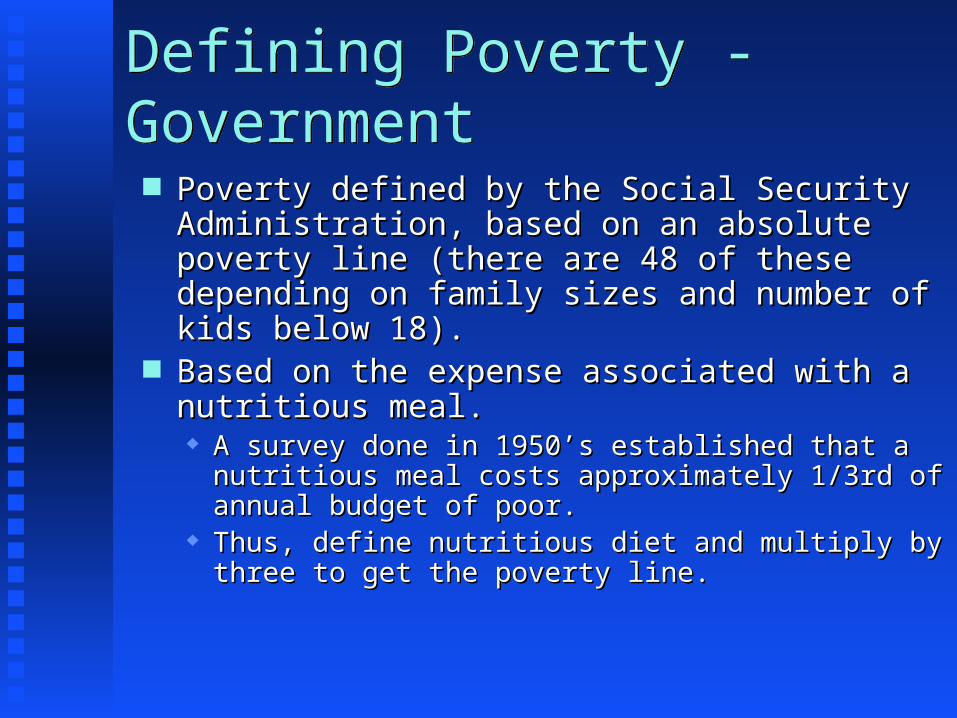
Defining Poverty - GovernmentDefining Poverty - Government
Poverty defined by the Social Security Poverty defined by the Social Security Administration, based on an absolute poverty line Administration, based on an absolute poverty line (there are 48 of these depending on family sizes (there are 48 of these depending on family sizes and number of kids below 18).and number of kids below 18).
Based on the expense associated with a nutritious Based on the expense associated with a nutritious meal.meal. A survey done in 1950’s established that a nutritious A survey done in 1950’s established that a nutritious
meal costs approximately 1/3rd of annual budget of meal costs approximately 1/3rd of annual budget of poor.poor.
Thus, define nutritious diet and multiply by three to get Thus, define nutritious diet and multiply by three to get the poverty line.the poverty line.
Defining Poverty - GovernmentDefining Poverty - Government
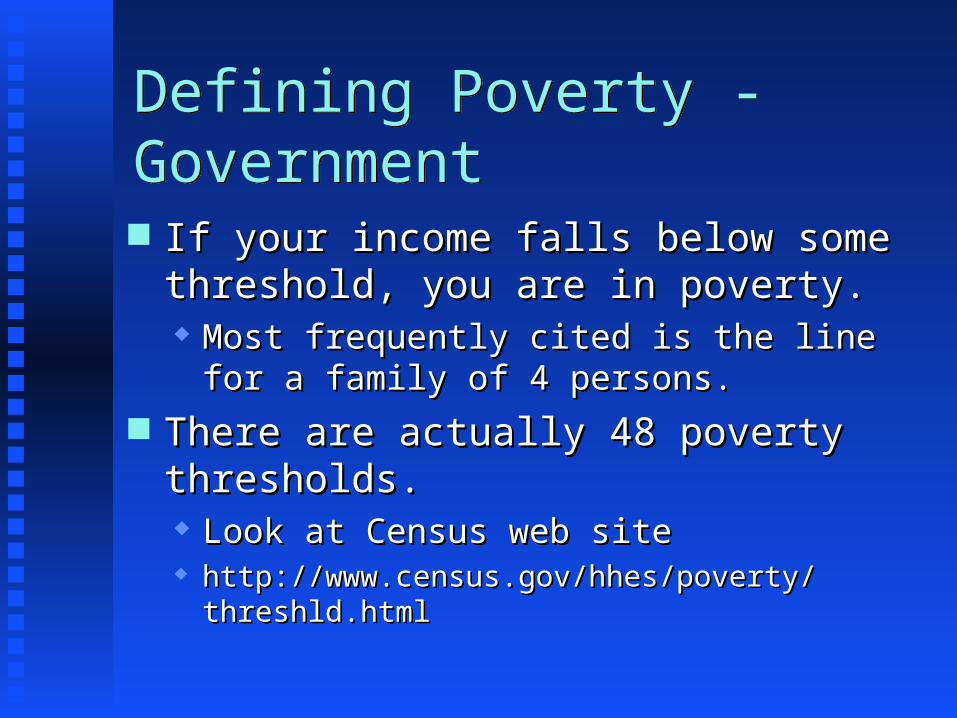
If your income falls below some threshold, If your income falls below some threshold, you are in poverty. you are in poverty. Most frequently cited is the line for a family of Most frequently cited is the line for a family of
4 persons.4 persons. There are actually 48 poverty thresholds.There are actually 48 poverty thresholds.
Look at Census web siteLook at Census web site http://www.census.gov/hhes/poverty/threshld.htmlhttp://www.census.gov/hhes/poverty/threshld.html
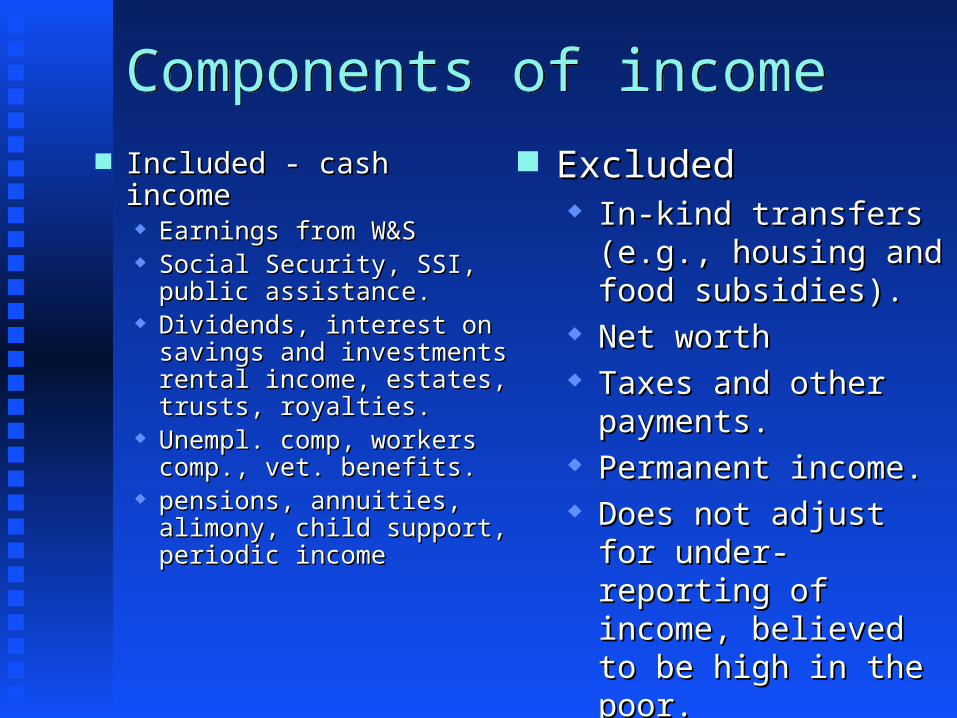
Components of incomeComponents of income Included - cash incomeIncluded - cash income
Earnings from W&SEarnings from W&S Social Security, SSI, public Social Security, SSI, public
assistance.assistance. Dividends, interest on savings Dividends, interest on savings
and investments rental and investments rental income, estates, trusts, income, estates, trusts, royalties.royalties.
Unempl. comp, workers Unempl. comp, workers comp., vet. benefits.comp., vet. benefits.
pensions, annuities, alimony, pensions, annuities, alimony, child support, periodic child support, periodic incomeincome
ExcludedExcluded In-kind transfers (e.g., In-kind transfers (e.g.,
housing and food housing and food subsidies).subsidies).
Net worthNet worth Taxes and other payments.Taxes and other payments. Permanent income.Permanent income. Does not adjust for under-Does not adjust for under-
reporting of income, reporting of income, believed to be high in the believed to be high in the poor.poor.
No regional variation in No regional variation in prices.prices.
Inflationary IndexingInflationary Indexing
Since 1969, the poverty line has been indexed by the CPI.Since 1969, the poverty line has been indexed by the CPI.
CPI overstates inflation. Why?CPI overstates inflation. Why?
Implications for measurement of level of poverty?Implications for measurement of level of poverty?
Who are the poor and where do they live?
Who are the poor and where do they live?
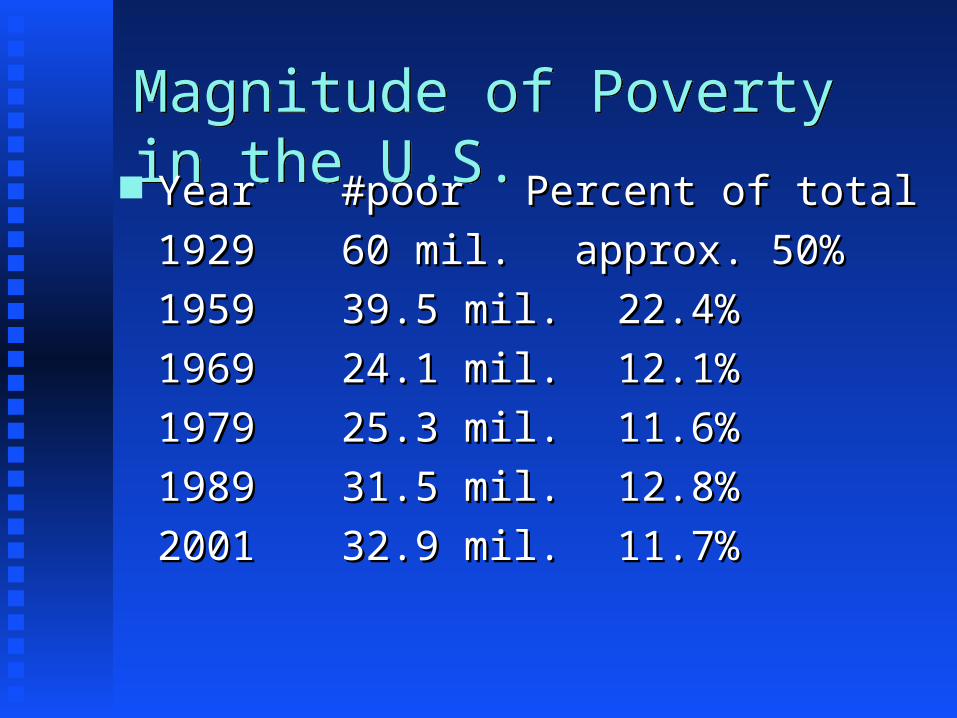
Magnitude of Poverty in the U.S.Magnitude of Poverty in the U.S. YearYear #poor#poor Percent of totalPercent of total
19291929 60 mil.60 mil. approx. 50% approx. 50%
19591959 39.5 mil.39.5 mil. 22.4%22.4%
19691969 24.1 mil.24.1 mil. 12.1%12.1%
19791979 25.3 mil.25.3 mil. 11.6%11.6%
19891989 31.5 mil.31.5 mil. 12.8%12.8%
20012001 32.9 mil.32.9 mil. 11.7%11.7%
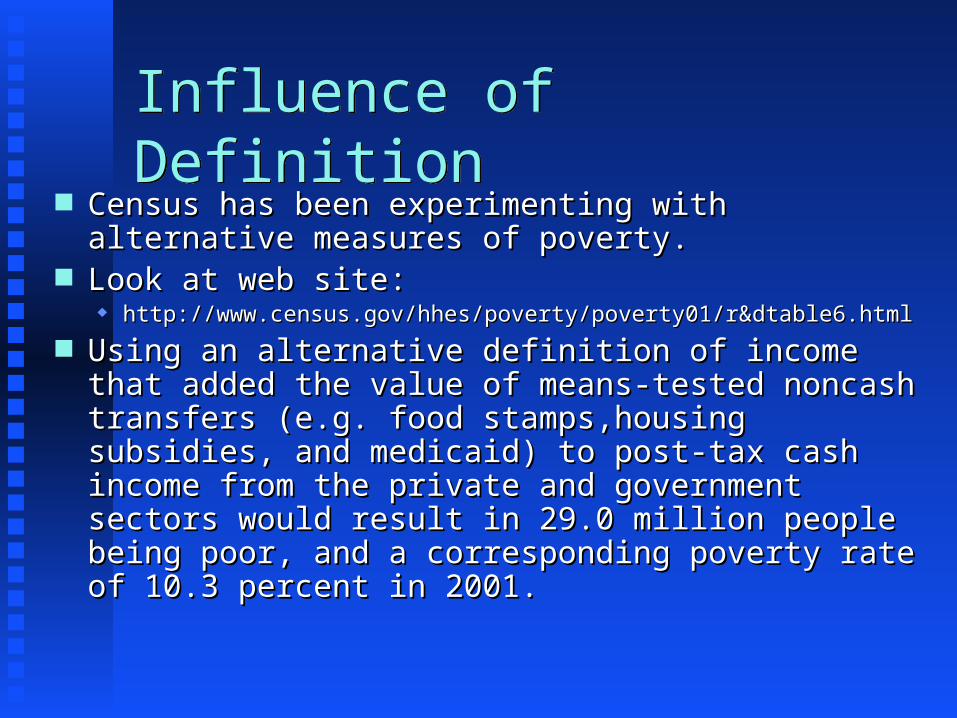
Influence of DefinitionInfluence of Definition Census has been experimenting with alternative Census has been experimenting with alternative
measures of poverty.measures of poverty. Look at web site:Look at web site:
http://www.census.gov/hhes/poverty/poverty01/r&dtable6.htmlhttp://www.census.gov/hhes/poverty/poverty01/r&dtable6.html
Using an alternative definition of income that added the Using an alternative definition of income that added the value of means-tested noncash transfers (e.g. food value of means-tested noncash transfers (e.g. food stamps,housing subsidies, and medicaid) to post-tax stamps,housing subsidies, and medicaid) to post-tax cash income from the private and government sectors cash income from the private and government sectors would result in 29.0 million people being poor, and a would result in 29.0 million people being poor, and a corresponding poverty rate of 10.3 percent in 2001.corresponding poverty rate of 10.3 percent in 2001.
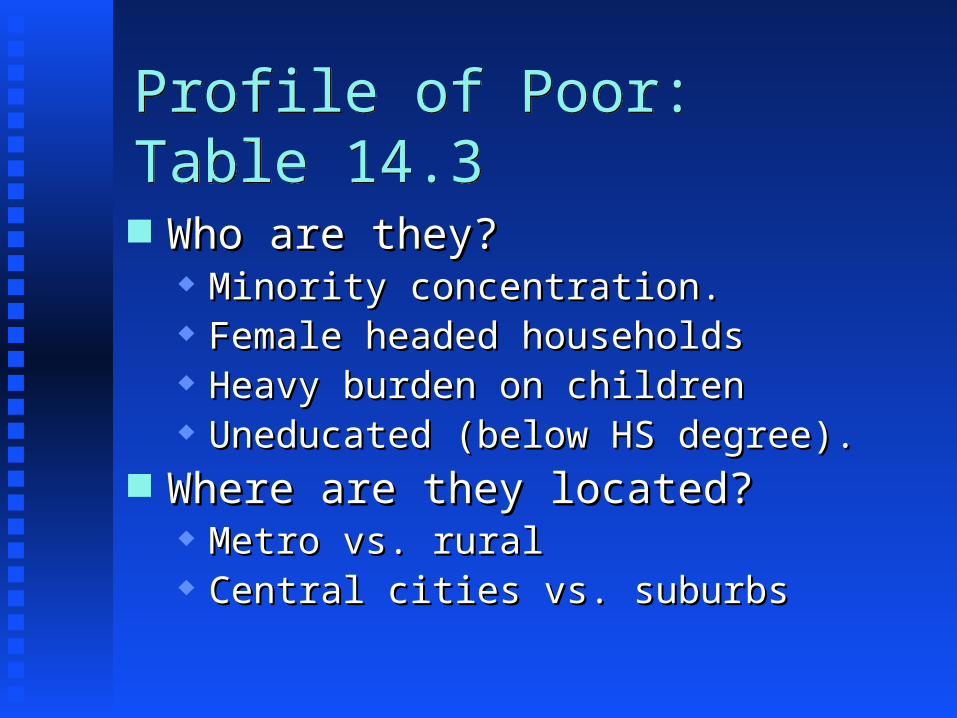
Profile of Poor: Table 14.3Profile of Poor: Table 14.3
Who are they?Who are they? Minority concentration.Minority concentration. Female headed householdsFemale headed households Heavy burden on childrenHeavy burden on children Uneducated (below HS degree).Uneducated (below HS degree).
Where are they located?Where are they located? Metro vs. ruralMetro vs. rural Central cities vs. suburbsCentral cities vs. suburbs
Look at Underlying Causes of PovertyLook at Underlying Causes of Poverty
Causality necessary to identify Causality necessary to identify appropriate public policy to mitigate appropriate public policy to mitigate
problem.problem.
Macro and regional economic stagnationMacro and regional economic stagnation
Evidence suggests that urban unemployment is Evidence suggests that urban unemployment is heavily influenced by economic growth.heavily influenced by economic growth.
Recessions are increasingly regional in nature.Recessions are increasingly regional in nature. Minorities suffer most during slow growth periods?Minorities suffer most during slow growth periods?
Earnings disparity between blacks and whites increases.Earnings disparity between blacks and whites increases.
Expansionary macro policy can be used.Expansionary macro policy can be used. Imprecise policy tool.Imprecise policy tool. Potential tradeoff with inflation.Potential tradeoff with inflation.
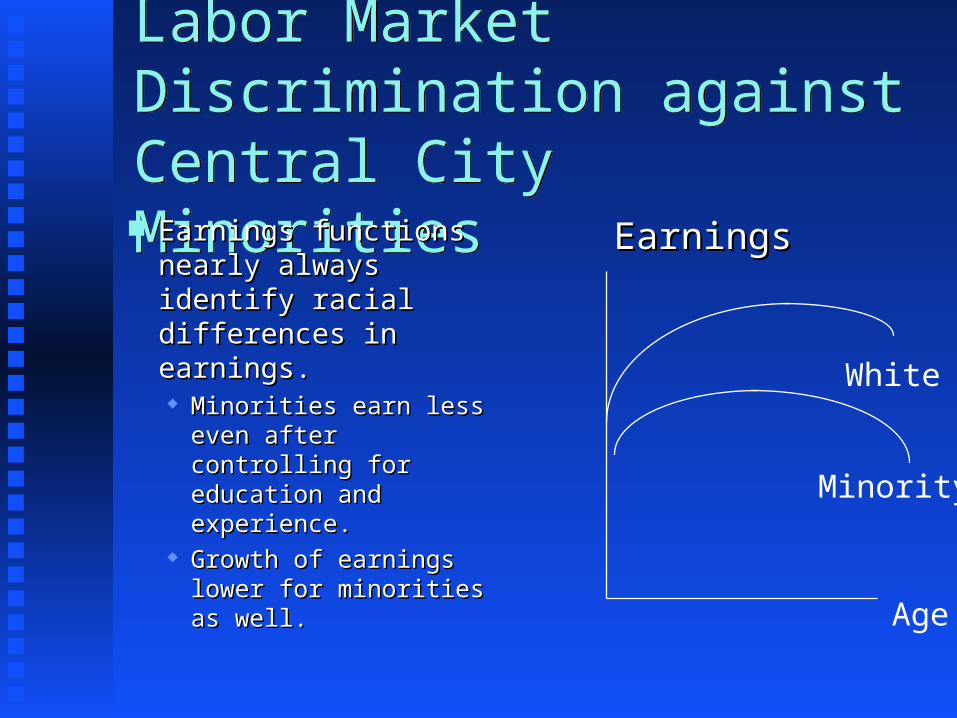
Labor Market Discrimination against Central City MinoritiesLabor Market Discrimination against Central City Minorities Earnings functions Earnings functions
nearly always identify nearly always identify racial differences in racial differences in earnings.earnings. Minorities earn less even Minorities earn less even
after controlling for after controlling for education and education and experience.experience.
Growth of earnings Growth of earnings lower for minorities as lower for minorities as well.well.
EarningsEarnings
Age
Minority
White
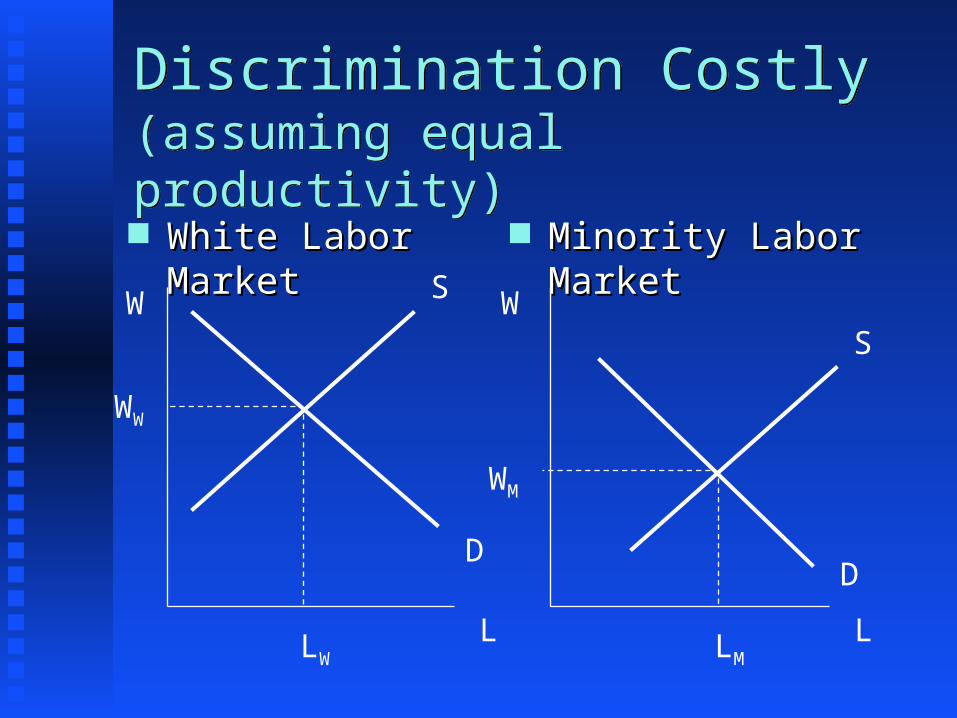
Discrimination Costly (assuming equal productivity)Discrimination Costly (assuming equal productivity) White Labor MarketWhite Labor Market Minority Labor MarketMinority Labor Market
S
D
W
L
W
L
S
D
WW
LW
WM
LM
Potential explanationsPotential explanations Is all else equal?Is all else equal?
Measuring educational qualityMeasuring educational quality Measuring effortMeasuring effort
Statistical discriminationStatistical discrimination Race or ethnicity is used as a signal.Race or ethnicity is used as a signal. Signal may be efficient.Signal may be efficient. Use of approach is clearly inequitable.Use of approach is clearly inequitable.
Demographic ExplanationsDemographic Explanations Female headed households are more likely to be Female headed households are more likely to be
living in poverty. living in poverty. Reasons:Reasons:
Most are single-parent households so full-time work Most are single-parent households so full-time work frequently not possible.frequently not possible.
Female wages lower than male wagesFemale wages lower than male wages Only about 1/3 of single mothers receive child support.Only about 1/3 of single mothers receive child support.
What has been happening to this over time?What has been happening to this over time? Very strong growthVery strong growth
Spatial Mismatch between Jobs and EmploymentSpatial Mismatch between Jobs and Employment Poor are concentrated in cities.Poor are concentrated in cities.
McKinney and Schnare (1989 McKinney and Schnare (1989 Journal of Urban Journal of Urban Economics)Economics) find that overall patterns of find that overall patterns of integregation have improved slightly over period integregation have improved slightly over period 1960-1980.1960-1980. Primarily due to mobility of black households into higher Primarily due to mobility of black households into higher
income neighborhood strata where exposure to whites is income neighborhood strata where exposure to whites is greater.greater.
Within neighborhood income strata, no change.Within neighborhood income strata, no change.
Jobs increasingly decentralizing.Jobs increasingly decentralizing.
Income constraintsIncome constraints
However, look at evidence from Margo However, look at evidence from Margo article.article. Holding constant other factors, nonwhites more Holding constant other factors, nonwhites more
likely to live in central city.likely to live in central city. Study by Kain (1985) showed that if Study by Kain (1985) showed that if
location choices were exclusively by location choices were exclusively by nonracial factors, we would expect twice as nonracial factors, we would expect twice as many blacks living in suburbs.many blacks living in suburbs.
Prejudice and DiscriminationPrejudice and Discrimination
Prejudice is an attitude based on race; Prejudice is an attitude based on race; Discrimination is an action where people Discrimination is an action where people treated differently based on race.treated differently based on race.
Question:Question: If blacks prefer to live near whites, even if whites If blacks prefer to live near whites, even if whites
don’t prefer to live near blacks, why don’t we don’t prefer to live near blacks, why don’t we observe leap-frogging behavior?observe leap-frogging behavior?
Possibly tied to discrimination in housing Possibly tied to discrimination in housing markets.markets.
Evidence on Housing Discrimination?Evidence on Housing Discrimination? Some evidence that white buyers, renters, Some evidence that white buyers, renters,
borrowers have been treated differently borrowers have been treated differently historically than black counterparts, although historically than black counterparts, although improvements have been noted.improvements have been noted. Fair housing audits are used for real estate agents, Fair housing audits are used for real estate agents,
landlords, lenders.landlords, lenders. Steering behavior by real estate agents may be based Steering behavior by real estate agents may be based
on using race as a proxy for preferences of individuals on using race as a proxy for preferences of individuals (i.e., statistical discrimination).(i.e., statistical discrimination).
Again, discrimination is costly to seller, landlord, Again, discrimination is costly to seller, landlord, lending institution.lending institution.
Exclusionary ZoningExclusionary Zoning Exclusionary zoning has also had an effect on Exclusionary zoning has also had an effect on
residential land use.residential land use. Although it has been argued that this is used to Although it has been argued that this is used to
protect home owners from incompatible land uses protect home owners from incompatible land uses and fiscal free-riding, it keeps minorities out.and fiscal free-riding, it keeps minorities out.
Techniques:Techniques: Minimal square footage, minimum lot size, Minimal square footage, minimum lot size,
minimum frontage, etc. excludes low income from minimum frontage, etc. excludes low income from neighborhoods.neighborhoods.
Regardless of cause, segregation exists.
Regardless of cause, segregation exists.
Look at the consequences!Look at the consequences!
Does spatial mismatch explain poverty?Does spatial mismatch explain poverty? Evidence has been mixed.Evidence has been mixed. Some (e.g., Ellwood) point to racial factors Some (e.g., Ellwood) point to racial factors
as alternative factors.as alternative factors. Others Ihlanfeldt, Sjoquist, Leonard suggest Others Ihlanfeldt, Sjoquist, Leonard suggest
that it is an important influence.that it is an important influence. Next time, we look at Ihlanfeldt article. Next time, we look at Ihlanfeldt article.
Public PolicyPublic Policy Since the Great Society, spending on anti-Since the Great Society, spending on anti-
poverty policies has increased dramatically, and poverty policies has increased dramatically, and its level in 1987 was over $100 billion.its level in 1987 was over $100 billion. There are many anti-poverty programs, and we cannot There are many anti-poverty programs, and we cannot
do justice to the literature in a short presentation.do justice to the literature in a short presentation. We examine just a few actual policies.We examine just a few actual policies.
Focus is on understanding broad economic Focus is on understanding broad economic issues.issues.
Macroeconomic PolicyMacroeconomic Policy Goal is stimulate the demand side of the local Goal is stimulate the demand side of the local
labor marketlabor market Low income households (especially minorities) suffer Low income households (especially minorities) suffer
relatively more during recessions.relatively more during recessions.
Macroeconomic expansionary policy is too broad Macroeconomic expansionary policy is too broad a brush to apply to specific geographic regions.a brush to apply to specific geographic regions. May conflict with other macroeconomic goals.May conflict with other macroeconomic goals.
General policy direction - avoid deep national General policy direction - avoid deep national recessions.recessions.
Stimulating Local Job GrowthStimulating Local Job Growth Alternatively, local policy makers can stimulate Alternatively, local policy makers can stimulate
local demand for labor.local demand for labor. Bartik (1993) “Who Benefits from Local Job Bartik (1993) “Who Benefits from Local Job
Growth: Migrants or the Original Residents” Growth: Migrants or the Original Residents” Regional Studies, Regional Studies, 1993, Vol. 27(4), 297-311.1993, Vol. 27(4), 297-311. Approximately 1/4 of new jobs from local growth Approximately 1/4 of new jobs from local growth
increases the labor force participation rates of local increases the labor force participation rates of local residents. residents.
Minorities benefit most from growth.Minorities benefit most from growth. Higher wage industries provide greater employment Higher wage industries provide greater employment
benefits for local residents.benefits for local residents.
Hysteresis EffectHysteresis Effect Bartik argues that job growth has LR effects Bartik argues that job growth has LR effects
on unemployment and participation rates on unemployment and participation rates due to hysteresis effects.due to hysteresis effects.
SR job experience increases human capital SR job experience increases human capital for local residents.for local residents. Acquired skills increase self-confidence and Acquired skills increase self-confidence and
reputation from employers.reputation from employers. Local residents more employable in LR. Local residents more employable in LR.
Training ProgramsTraining Programs This type of program is aimed at the supply side of This type of program is aimed at the supply side of
the labor market.the labor market. Goal is to develop skills that increase earning Goal is to develop skills that increase earning
capacity of the poor.capacity of the poor. Predominating notion during the 1960’s.Predominating notion during the 1960’s. Strong growth in 1960’s, moderate growth in 1970’s, Strong growth in 1960’s, moderate growth in 1970’s,
decline during 1980’s and 1990’s.decline during 1980’s and 1990’s.
Some welfare reforms give limited training to Some welfare reforms give limited training to current welfare recipients.current welfare recipients.
Ashenfelter (1978)Ashenfelter (1978) Orley Ashenfelter wrote a paper which Orley Ashenfelter wrote a paper which
appeared in appeared in Review of Economics and Review of Economics and StatisticsStatistics, in 1978., in 1978.
Examined workers completing government-Examined workers completing government-sponsored job training course in 1964. sponsored job training course in 1964.
Examined panel data to analyze the incomes Examined panel data to analyze the incomes earned through a 5 year post-training earned through a 5 year post-training period. period.
FindingsFindings Compared trainees with a control groupCompared trainees with a control group Findings:Findings:
Courses produced increase in the earnings of all Courses produced increase in the earnings of all trainee groups in period immediately following trainee groups in period immediately following course completion.course completion.
Increase for both white and black women was Increase for both white and black women was $300-$600 per year (in about 1970), and did not $300-$600 per year (in about 1970), and did not decrease in 5 years after training.decrease in 5 years after training.
Increase for men was similar, but fell by 50% Increase for men was similar, but fell by 50% over the 5 year period.over the 5 year period.
Other insights in literatureOther insights in literature Primary success is on programs which Primary success is on programs which
target youth.target youth. Some success in raising earnings for Some success in raising earnings for
women. women. Less success with men.Less success with men.
Earnings (wage*hours) increased by Earnings (wage*hours) increased by increasing hours.increasing hours.
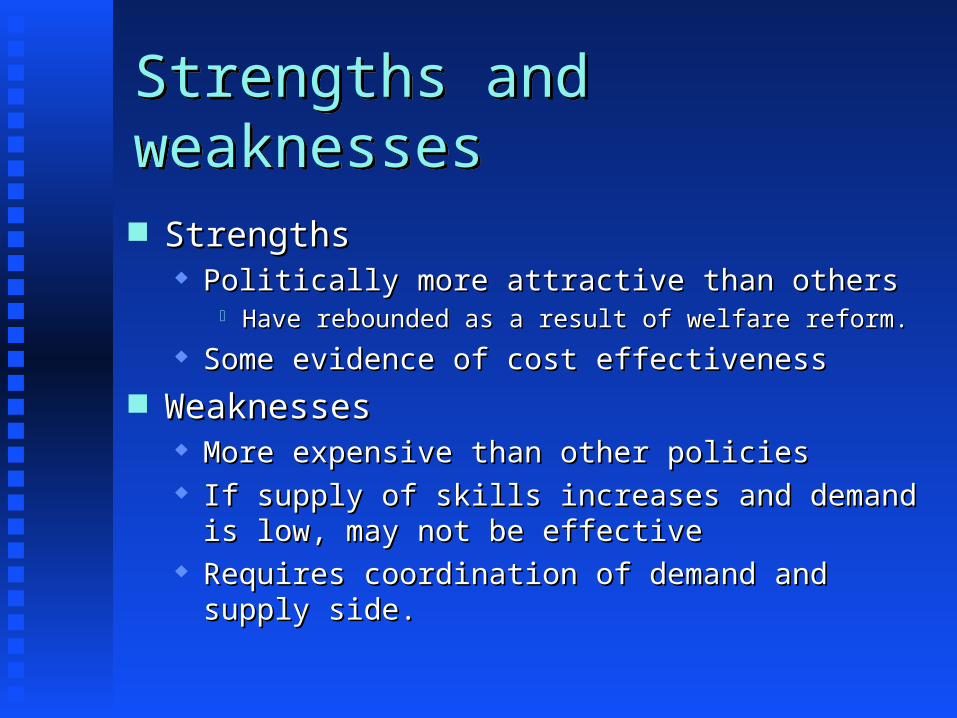
Strengths and weaknessesStrengths and weaknesses StrengthsStrengths
Politically more attractive than othersPolitically more attractive than others Have rebounded as a result of welfare reform.Have rebounded as a result of welfare reform.
Some evidence of cost effectivenessSome evidence of cost effectiveness
WeaknessesWeaknesses More expensive than other policiesMore expensive than other policies If supply of skills increases and demand is low, may not If supply of skills increases and demand is low, may not
be effectivebe effective Requires coordination of demand and supply side.Requires coordination of demand and supply side.
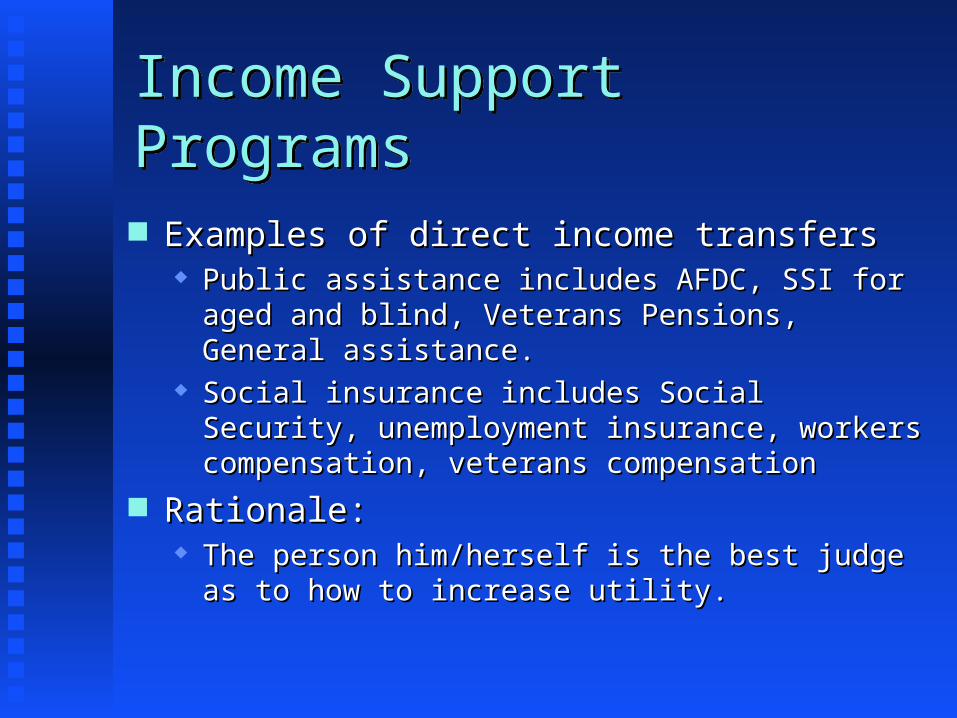
Income Support ProgramsIncome Support Programs Examples of direct income transfersExamples of direct income transfers
Public assistance includes AFDC, SSI for aged and Public assistance includes AFDC, SSI for aged and blind, Veterans Pensions, General assistance.blind, Veterans Pensions, General assistance.
Social insurance includes Social Security, Social insurance includes Social Security, unemployment insurance, workers compensation, unemployment insurance, workers compensation, veterans compensationveterans compensation
Rationale: Rationale: The person him/herself is the best judge as to how to The person him/herself is the best judge as to how to
increase utility.increase utility.
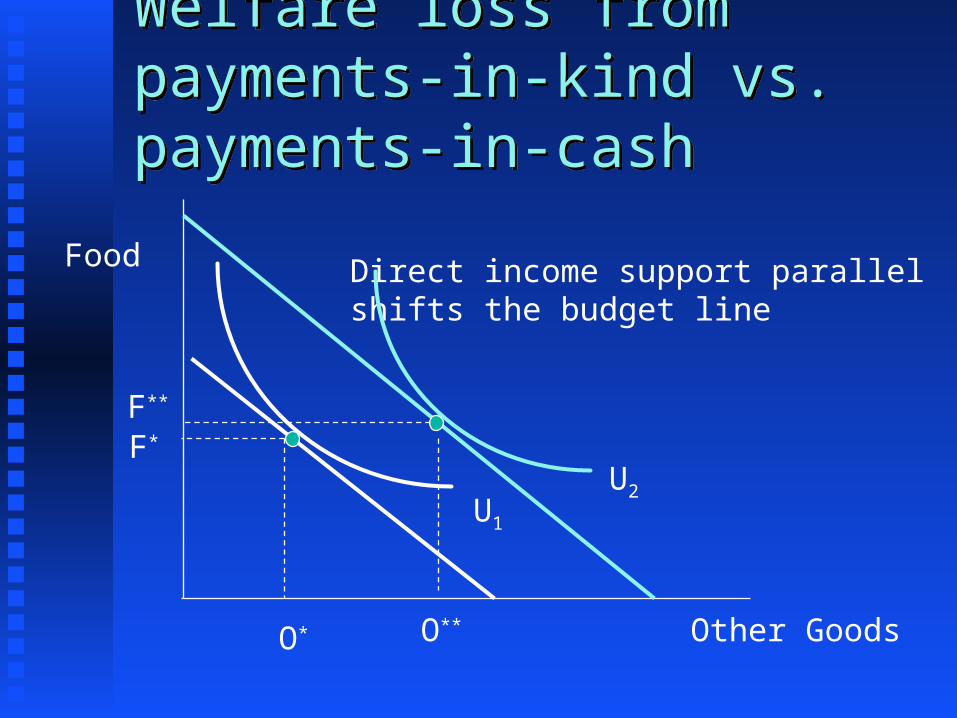
Welfare loss from payments-in-kind vs. payments-in-cashWelfare loss from payments-in-kind vs. payments-in-cash
Food
Other Goods
F*
O*
Direct income support parallel shifts the budget line
F**
O**
U1
U2
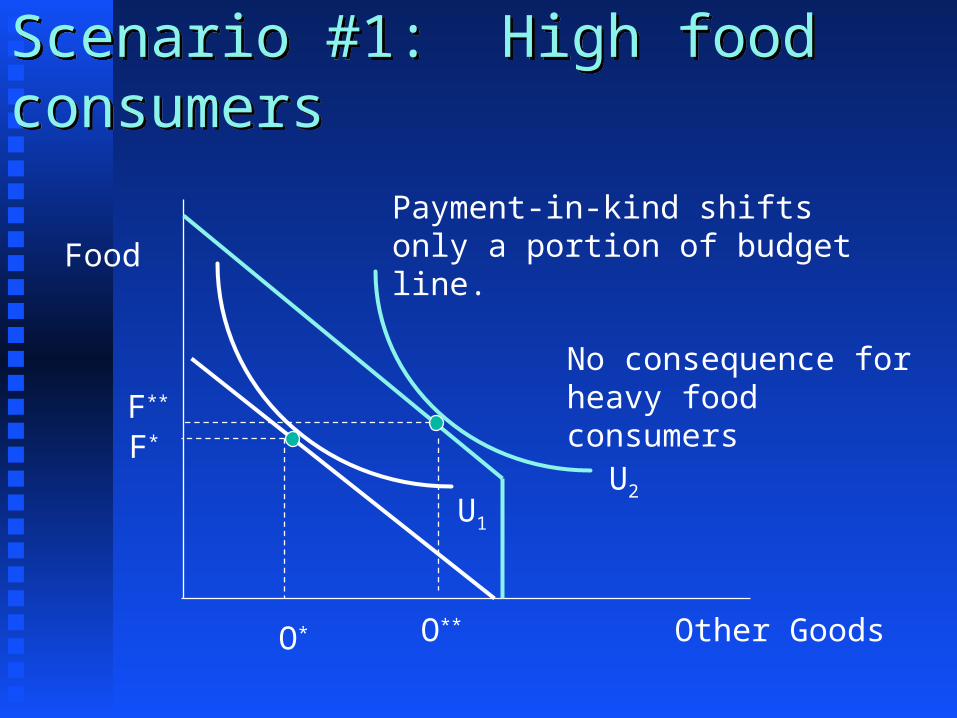
Scenario #1: High food consumersScenario #1: High food consumers
Food
Other Goods
F*
O*
Payment-in-kind shifts only a portion of budgetline.
F**
O**
U1
U2
No consequence for heavy food consumers
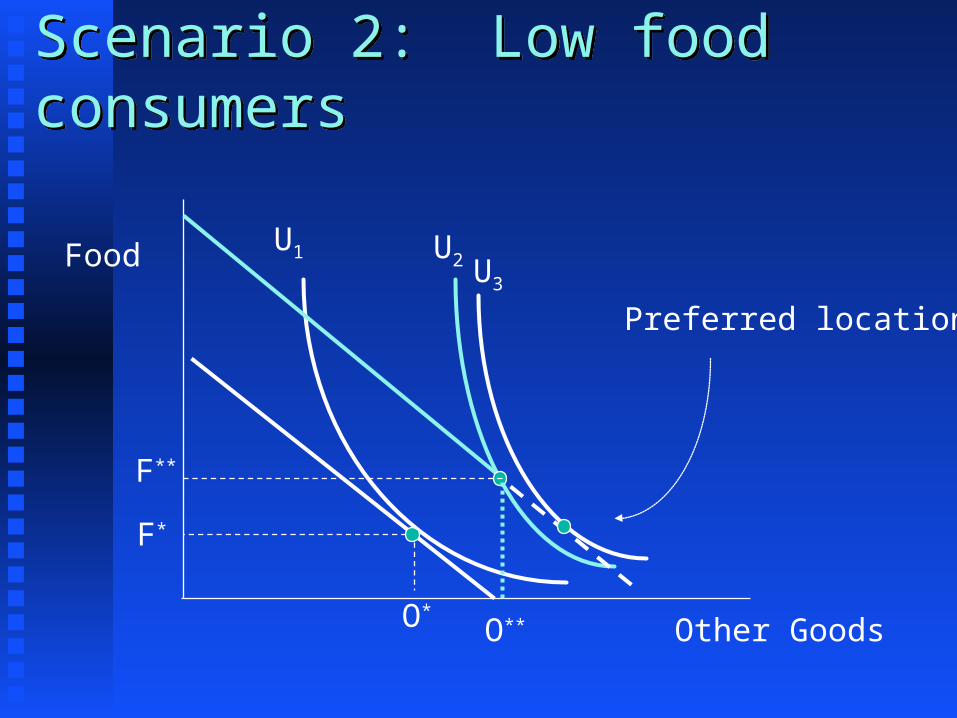
Scenario 2: Low food consumersScenario 2: Low food consumers
Food
Other Goods
F*
O*
F**
O**
U1 U2 U3
Preferred location
There is some empirical support for Scenario #2
There is some empirical support for Scenario #2
Smeeding (1982) found each dollar of Smeeding (1982) found each dollar of foodstamps was worth $0.97 to recipients.foodstamps was worth $0.97 to recipients.
Blanchard et. al. (1982) found replacement of Blanchard et. al. (1982) found replacement of food stamps with cash transfers did not effect food stamps with cash transfers did not effect
food consumption.food consumption.
Public WelfarePublic Welfare AFDC is probably the most publicly visible AFDC is probably the most publicly visible
income support program.income support program. Means testedMeans tested Payment made by federal government.Payment made by federal government. Can be augmented by state governmentCan be augmented by state government
Average payments vary substantially between states. Average payments vary substantially between states. e.g., in a year when Calif. average payments were e.g., in a year when Calif. average payments were $553/month, Alabama awarded $114/month.$553/month, Alabama awarded $114/month.
ConsequencesConsequences Purported welfare migration between statesPurported welfare migration between states Destabilizes familiesDestabilizes families
Benefits are removed when earnings reach a Benefits are removed when earnings reach a particular level.particular level.
Disincentive to workDisincentive to work
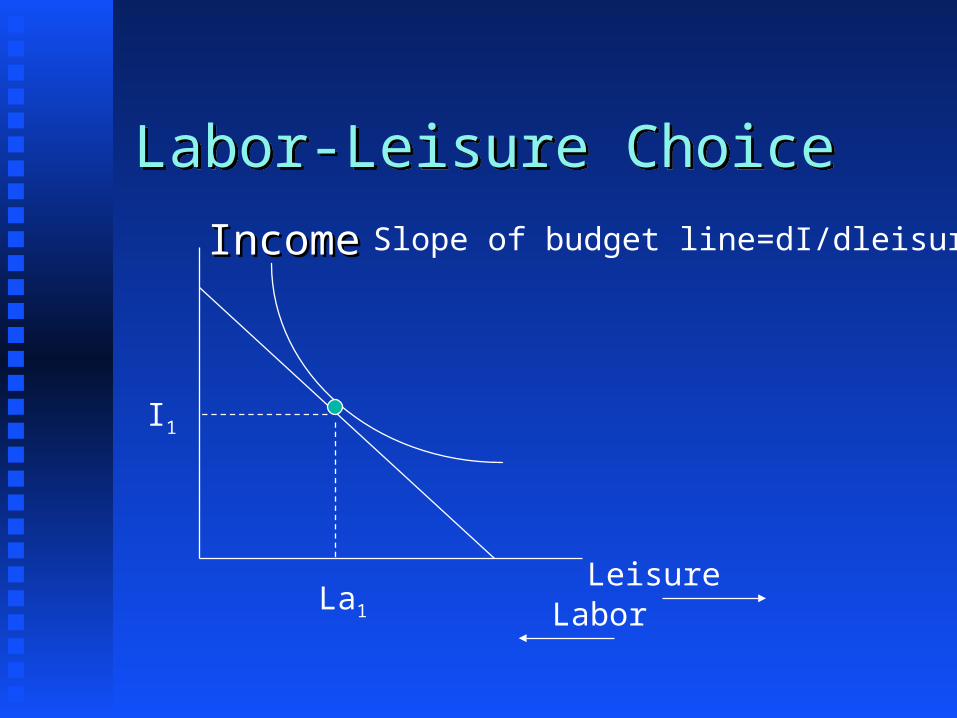
Labor-Leisure ChoiceLabor-Leisure Choice
IncomeIncome
Leisure Labor
I1
La1
Slope of budget line=dI/dleisure
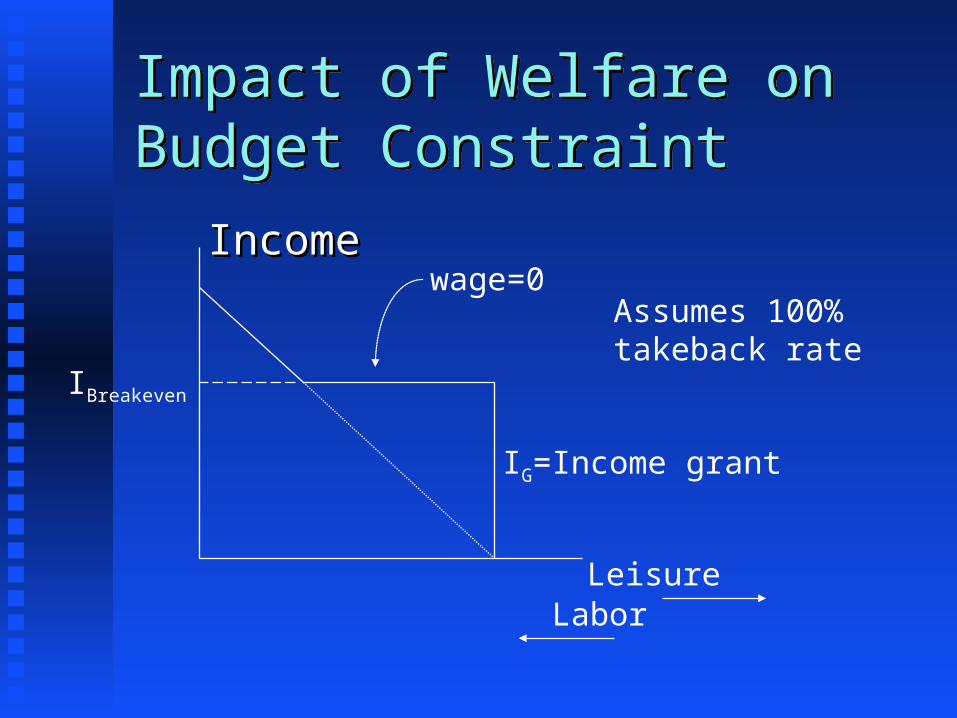
Impact of Welfare on Budget ConstraintImpact of Welfare on Budget Constraint
IncomeIncome
Leisure Labor
IG=Income grant
Assumes 100% takeback rate
IBreakeven
wage=0
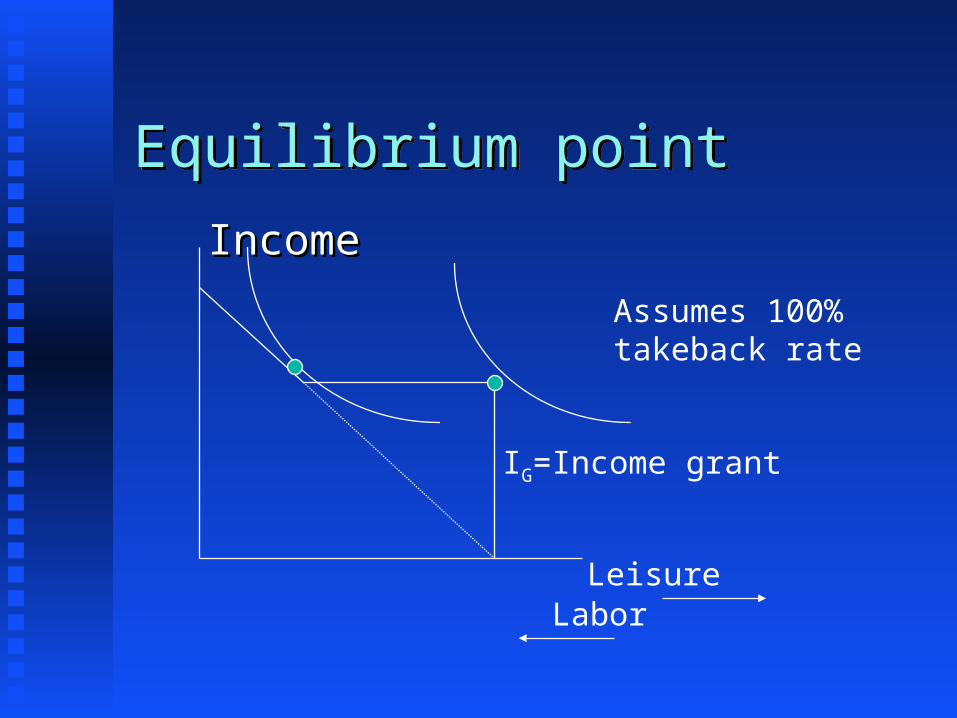
Equilibrium pointEquilibrium point
IncomeIncome
Leisure Labor
IG=Income grant
Assumes 100% takeback rate
Are those who don’t work lazy?Are those who don’t work lazy?
Why not simply reduce takeback rate?
Why not simply reduce takeback rate?
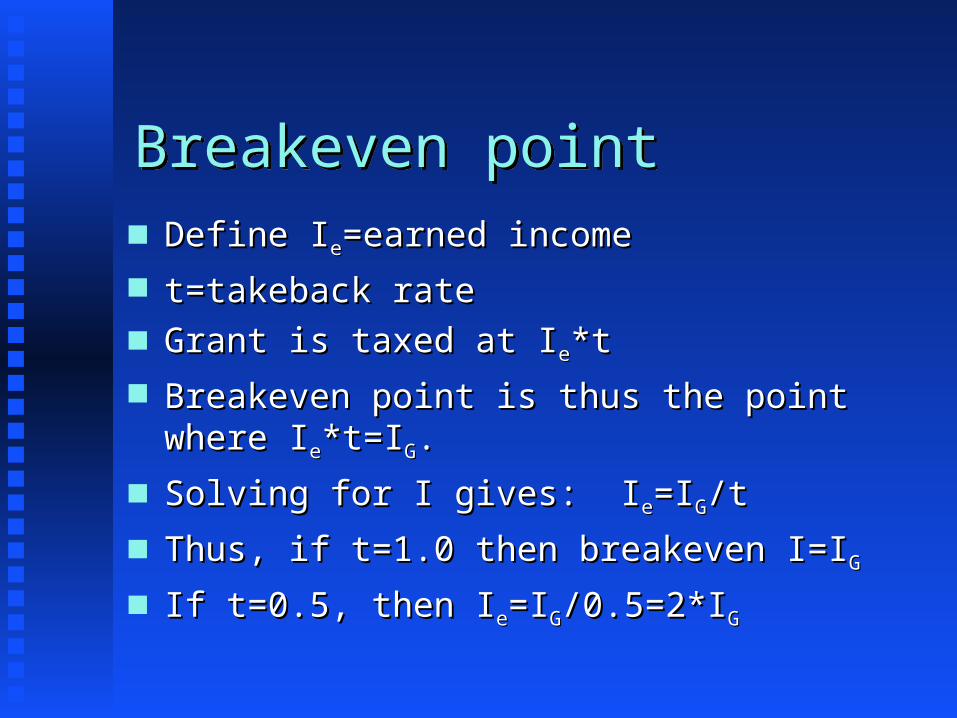
Breakeven pointBreakeven point Define IDefine Iee=earned income=earned income
t=takeback ratet=takeback rate Grant is taxed at IGrant is taxed at Iee*t*t
Breakeven point is thus the point where IBreakeven point is thus the point where Iee*t=I*t=IGG..
Solving for I gives: ISolving for I gives: Iee=I=IGG/t/t
Thus, if t=1.0 then breakeven I=IThus, if t=1.0 then breakeven I=IGG
If t=0.5, then IIf t=0.5, then Iee=I=IGG/0.5=2*I/0.5=2*IGG
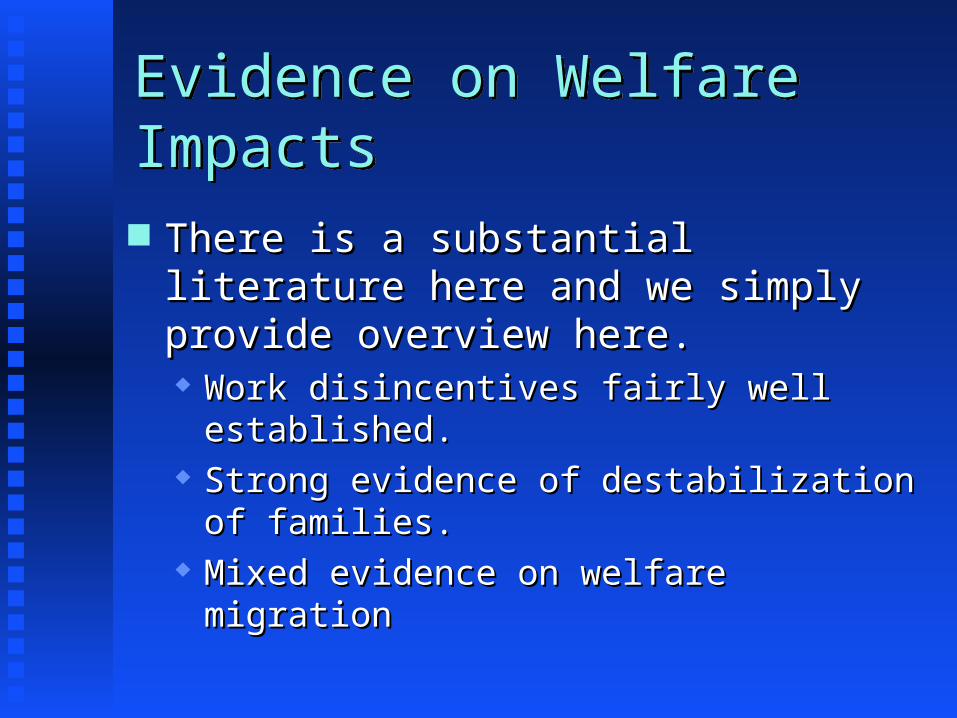
Evidence on Welfare ImpactsEvidence on Welfare Impacts There is a substantial literature here and we There is a substantial literature here and we
simply provide overview here.simply provide overview here. Work disincentives fairly well established.Work disincentives fairly well established. Strong evidence of destabilization of families.Strong evidence of destabilization of families. Mixed evidence on welfare migrationMixed evidence on welfare migration
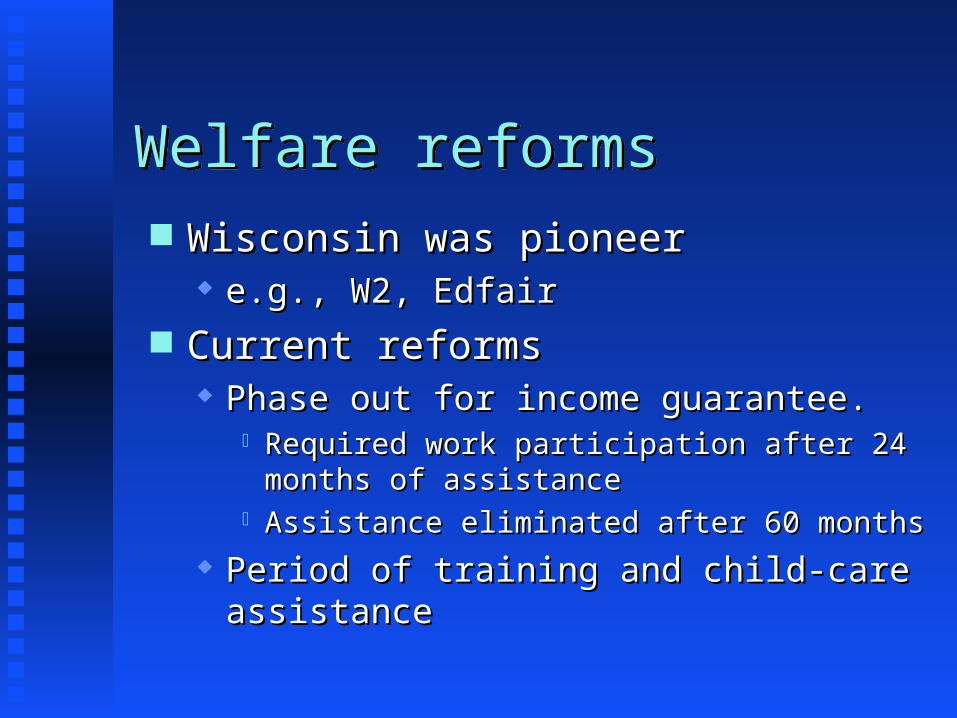
Welfare reformsWelfare reforms Wisconsin was pioneerWisconsin was pioneer
e.g., W2, Edfaire.g., W2, Edfair Current reformsCurrent reforms
Phase out for income guarantee.Phase out for income guarantee. Required work participation after 24 months of Required work participation after 24 months of
assistanceassistance Assistance eliminated after 60 monthsAssistance eliminated after 60 months
Period of training and child-care assistancePeriod of training and child-care assistance
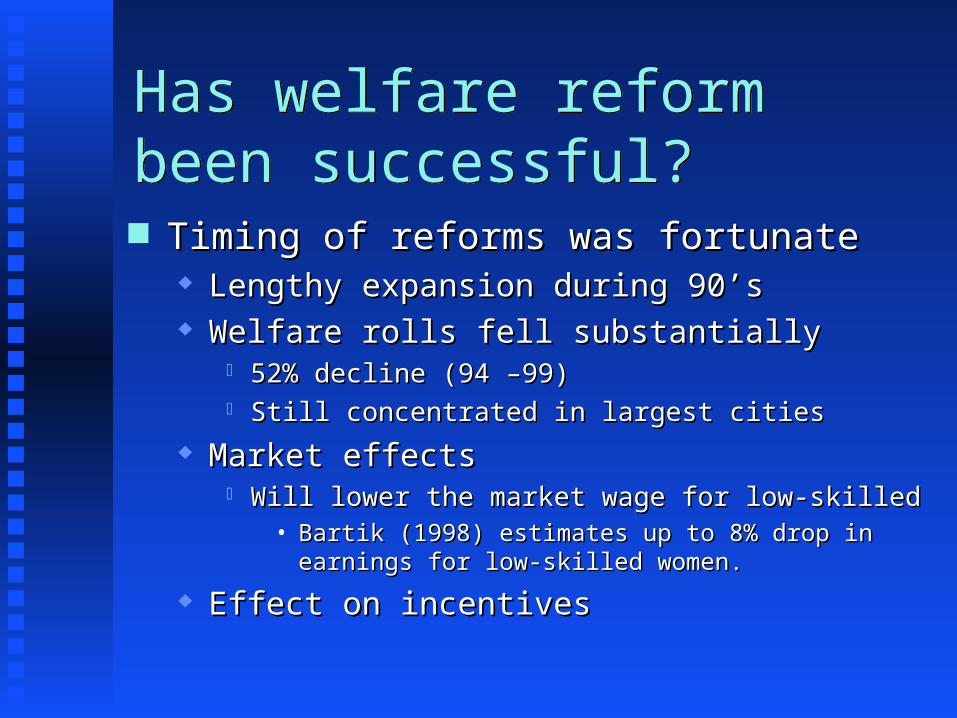
Has welfare reform been successful?Has welfare reform been successful? Timing of reforms was fortunateTiming of reforms was fortunate
Lengthy expansion during 90’sLengthy expansion during 90’s Welfare rolls fell substantiallyWelfare rolls fell substantially
52% decline (94 –99)52% decline (94 –99) Still concentrated in largest citiesStill concentrated in largest cities
Market effects Market effects Will lower the market wage for low-skilledWill lower the market wage for low-skilled
• Bartik (1998) estimates up to 8% drop in earnings for low-skilled Bartik (1998) estimates up to 8% drop in earnings for low-skilled women.women.
Effect on incentivesEffect on incentives
Problem of Urban GhettosProblem of Urban Ghettos
Two policies have been suggestedTwo policies have been suggested Dispersal Dispersal Development Development
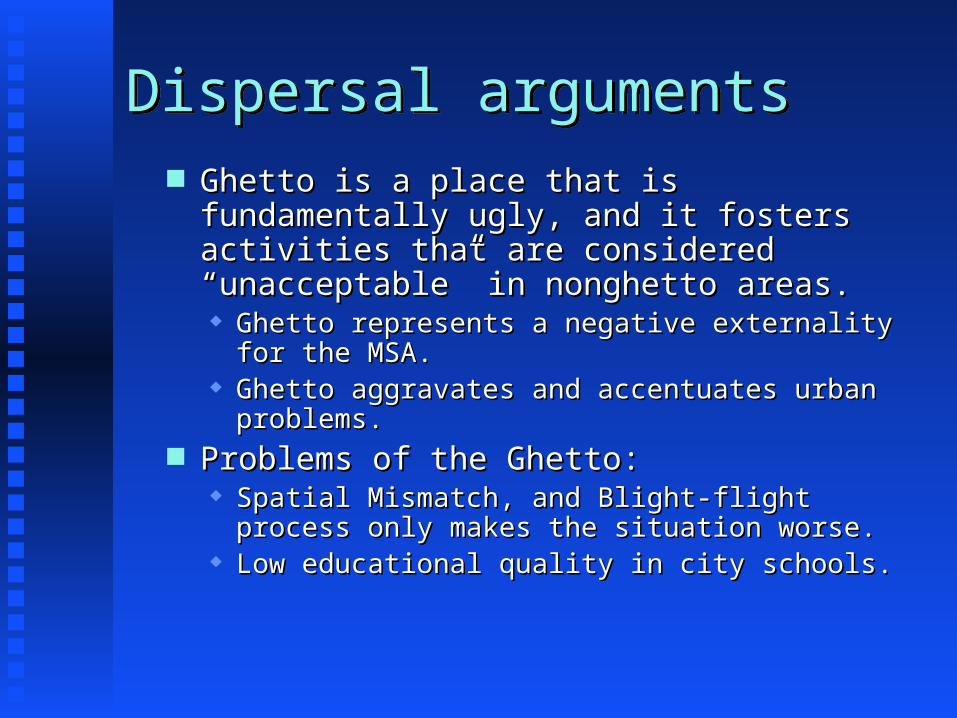
Dispersal argumentsDispersal arguments Ghetto is a place that is fundamentally ugly, and Ghetto is a place that is fundamentally ugly, and
it fosters activities that are considered it fosters activities that are considered “unacceptable” in nonghetto areas.“unacceptable” in nonghetto areas. Ghetto represents a negative externality for the Ghetto represents a negative externality for the
MSA.MSA. Ghetto aggravates and accentuates urban problems.Ghetto aggravates and accentuates urban problems.
Problems of the Ghetto:Problems of the Ghetto: Spatial Mismatch, and Blight-flight process only Spatial Mismatch, and Blight-flight process only
makes the situation worse.makes the situation worse. Low educational quality in city schools.Low educational quality in city schools.
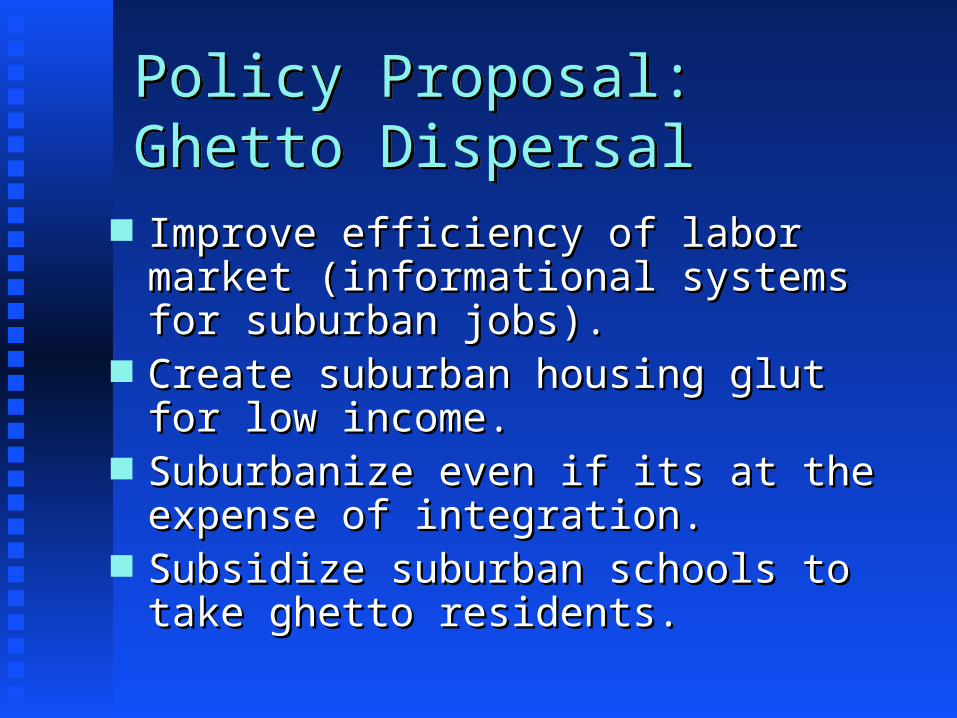
Policy Proposal: Ghetto DispersalPolicy Proposal: Ghetto Dispersal
Improve efficiency of labor market Improve efficiency of labor market (informational systems for suburban jobs).(informational systems for suburban jobs).
Create suburban housing glut for low Create suburban housing glut for low income.income.
Suburbanize even if its at the expense of Suburbanize even if its at the expense of integration.integration.
Subsidize suburban schools to take ghetto Subsidize suburban schools to take ghetto residents.residents.
Counter-argumentsCounter-arguments Dispersal is not feasible.Dispersal is not feasible.
Disruptive to integration goals.Disruptive to integration goals. Creating mini-ghettos will only create new Creating mini-ghettos will only create new
pockets of poverty in the suburbs.pockets of poverty in the suburbs. Development of ghetto is preferable.Development of ghetto is preferable.
Case for Development: EconomicCase for Development: Economic Multiplier effects.Multiplier effects. External agglomeration economiesExternal agglomeration economies
One success lowers costs to others in region.One success lowers costs to others in region. Demonstration effectsDemonstration effects Leadership effectsLeadership effects
Keep your most talented and ambitions in the Keep your most talented and ambitions in the community.community.
Political Case for DevelopmentPolitical Case for Development Source of leadership for political struggles.Source of leadership for political struggles. Foster interaction between races. Foster interaction between races.
Less likely to have backlash.Less likely to have backlash. Politically more feasible.Politically more feasible.
Viewed as self-help.Viewed as self-help.
Development TechniquesDevelopment Techniques Greenhouse industriesGreenhouse industries Pool resources in CDC’s. Pool resources in CDC’s. Enterprise ZonesEnterprise Zones
Cutler and Glaeser ArticleCutler and Glaeser Article
““Are Ghetto’s good or Bad?”Are Ghetto’s good or Bad?”
Quarterly Journal of Economics, Quarterly Journal of Economics, 1997, p. 827 -8721997, p. 827 -872