Embed Size (px)
Citation preview
RESEARCH
REPORT
Urban Livelihoodsand Food and
Nutrition Securityin Greater Accra,
Ghana
Daniel Maxwell
Carol Levin
Margaret Armar-Klemesu
Marie Ruel
Saul Morris
Clement Ahiadeke
INTERNATIONAL FOOD POLICY RESEARCH INSTITUTE
in col labo ra tion with
NOGUCHI ME MO RIAL IN STI TUTE FOR MEDI CAL RE SEARCH
WORLD HEALTH OR GANI ZA TION
IFPRI Board of Trustees2000
Geoff Miller, Chair, Aus tra lia
Re beca Grynspan Ma yufis, Vice Chair, Costa Rica
Isher Judge Ahluwalia, India
Baba Di oum, Sene gal
Wenche Barth Eide, Nor way
Arie Kuyvenhoven, Netherlands
Susumu Matsuoka, Japan
Solita Collas Mon sod, Phil ip pines
Benno Ndulu, Tan za nia
Sylvia Ostry, Canada
G. Ed ward Schuh, U.S.A.
Wen Simei, China
Per Pinstrup- Andersen, Di rec tor Gen eral, Ex Of fi cio, Den mark
The In ter na tional Food Pol icy Re search Institute is a mem ber of the Con sul -ta tive Group on In ter na tional Ag ri cul tural Re search and re ceives sup port
from the Asian Development Bank, Australia, Belgium, Brazil, Canada, CARE,China, Colombia, Denmark, the European Commission, the Food and AgricultureOrganization of the United Nations, the Ford Foundation, France, the GermanAgency for Technical Cooperation, the German Federal Ministry for EconomicCooperation and Development, Honduras, India, the Inter-American DevelopmentBank, the International Fund for Agricultural Development, Ireland, Italy, Japan,Malawi, Mexico, Mozambique, the Netherlands, the Neys-Van HoogstratenFoundation, Norway, the Philippines, the Rockefeller Foundation, South Africa,Spain, Sweden, Switzerland, Tunisia, the United Kingdom, the United NationsDevelopment Programme, the United Nations Sub-Committee on Nutrition,the United States, Venezuela, the World Bank, the World Resources Institute,and World Vision.
IFPRI Research ReportsPublications Review Committee
2000
Mark Rosegrant, Chair
Howarth Bouis
John Hoddinott
Mylène Kherallah
Nicholas Minot
John Pender
Emmanuel Skoufias
Donald Lippincott (ex officio)
David Gately, Secretary
Recent IFPRI Research Reports
111 Ex plain ing Child Mal nu tri tion in De vel op ing Coun tries: A Cross- CountryAnaly sis, by Lisa C. Smith and Law rence Had dad, 2000
110 Link ages be tween Gov ern ment Spend ing, Growth, and Pov erty in Ru ralIn dia, by Shenggen Fan, Peter Hazell, and Sukhadeo Thorat, 1999
109 Ag ri cul tural Re search and Pro duc tiv ity Growth in In dia, by Rob ert E.Even son, Carl E. Pray, and Mark W. Rosegrant, 1999
108 Gender Equality and Investments in Adolescents in the Rural Phil ip pines,by Howarth E. Bouis, Marilou Palabrica-Costello, Orville Solon, DanielWestbrook, and Azucena B. Limbo, 1998
107 Ag ri cul tural Growth Link ages in Sub- Saharan Af rica, by Chris to pher L.Del gado, Jane Hop kins, Vale rie A. Kelly, with Pe ter Ha zell, Anna A.McKenna, Pe ter Gruhn, Beh jat Ho jjati, Jay ashree Sil, and Claude Cour -bois, 1998
106 Wheat Pro duc tion in Bang la desh: Tech no logi cal, Eco nomic, and Pol icyIs sues, by Mi chael L. Mor ris, Nuimud din Chowd hury, and Craig Meis -ner, 1997
105 Ground wa ter Mar kets in Paki stan: Par tici pa tion and Pro ductivity, byRuth Meinzen- Dick, 1996
104 Role of Farm- Level Di ver si fi ca tion in the Adop tion of Mod ern Tech nol -ogy in Brazil, by Marc Ner love, Ste phen Vosti, and Wesley Basel, 1996
The In ter na tional Food Pol icy Re search In sti tute (IFPRI) wases tab lished in 1975 to iden tify and ana lyze al ter na tive na -
tional and in ter na tional strate gies and poli cies for meet ing foodneeds of the de vel op ing world on a sus tain able ba sis, with par ticu -lar em pha sis on low- income coun tries and on the poorer groups inthose coun tries. While the re search ef fort is geared to the pre ciseob jec tive of con trib ut ing to the re duc tion of hun ger and mal nu tri -tion, the fac tors in volved are many and wide- ranging, re quir inganaly sis of un der ly ing pro cesses and ex tend ing be yond a nar rowlyde fined food sec tor. The In sti tute’s re search pro gram re flects world -wide col labo ra tion with gov ern ments and pri vate and pub lic in sti -tu tions in ter ested in in creas ing food pro duc tion and im prov ing theeq uity of its dis tri bu tion. Re search re sults are dis semi nated to policy -makers, opin ion form ers, ad min is tra tors, pol icy ana lysts, re search -ers, and oth ers con cerned with na tional and in ter na tional food andag ri cul tural pol icy.
All manu scripts sub mit ted for pub li ca tion as IFPRI Re searchRe ports un dergo ex ten sive ex ter nal and in ter nal re views.
Prior to sub mis sion to the Pub li ca tions Re view Com mit tee, eachmanu script is cir cu lated in for mally among the author’s col leagues,pre sented in a for mal semi nar, and re viewed by an IFPRI re viewer.Fol low ing sub mis sion of the manu script to the Com mit tee, threead di tional re view ers—at least two ex ter nal to IFPRI and one fromthe Com mit tee—are se lected to re view the manu script. Re view ersare cho sen for their fa mili ar ity with the coun try set ting. The Com -mit tee pro vides the author its re ac tion to the re view ers’ com ments.Af ter re vis ing as nec es sary, the author re sub mits the manu script tothe Com mit tee with a writ ten re sponse to the re view ers’ and Com -mit tee’s com ments. The Com mit tee then makes its rec om men da -tions on pub li ca tion of the manu script to the Di rec tor Gen eral ofIFPRI. With the Di rec tor Gen er al’s ap proval, the manu script be comespart of the IFPRI Re search Re port se ries, which be gan in 1977.
IFPRI is a mem ber of theCon sul ta tive Group on In ter na tional Ag ri cul tural Re search
(CGIAR)
INTERNATIONAL FOOD POLICY RESEARCH INSTITUTE2033 K STREET, N.W., WASHINGTON, D.C. 20006-1002 U.S.A.
PHONE: 1-202-862-5600 • FAX: 1-202- 467-4439 E-MAIL: [email protected] • WEB: www.ifpri.org
DOWNLOAD/ORDER: www.cgiar.org/ifpri/pubs/pubs.htm#rreport
Urban Livelihoodsand Food and
Nutrition Securityin Greater Accra,
GhanaDaniel Maxwell
Carol Levin
Margaret Armar-Klemesu
Marie Ruel
Saul Morris
Clement Ahiadeke
In ter na tional Food Pol icy Re search In sti tuteNoguchi Me mo rial In sti tute for Medi cal Re search
World Health Or gani za tion
Copyright 2000 International Food Policy ResearchInstitute
All r ights reserved. Sections of this report may bereproduced without the express permission of but withacknowledgment to the International Food PolicyResearch Institute.
Libr ary of Congress Cataloging-in-Publication Data
Urban livelihoods and food and nutrition security inGreater Accra,Ghana / Daniel Maxwell . . . [et al.].
p. cm. — (Rearch report ; 112)“The International Food Policy Research Institute; In collaboration with the Noguchi Memorial Insti-tute for Medical Research and The World HealthOrganization.”“April 2000.”Includes bibliographical references.ISBN 0-89629-115-41. Nutrition surveys—Ghana. I. Maxwell, Daniel.
II. Research report (International Food Policy ResearchInstitute); 112.
TX360.G4 U73 2000363.8'09667—dc21 99-087101
maxwell front 5/9/0 8:32 PM Page ii
Contents
List of Tables ivList of Figures viiForeword viiiAcknowledgments ixSummary xi1. Urban Poverty: A New Priority 12. Design and Methodology of the Study 123. Accra’s Households and Communities 174. Urban Livelihoods:Activities, Income, Shocks,and Coping 265. Household Spending, Consumption,and Food Security 526. Nutrition and Health of Women and Children 817. Caregiving Behaviors and Resources 918. Spatial Clustering of Outcomes 1059. Multivariate Determinants of Food Security, Health,Care,
and Nutritional Status 11010. Urban Livelihood Security: Assets,Vulnerability, Trade-offs,
and Coping 13811. Conclusions and Policy Recommendations 146Appendix: Indicators of Urban Vulnerability and Food
and Nutrition Insecurity 153References 156
iii
maxwell front 5/9/0 8:32 PM Page iii
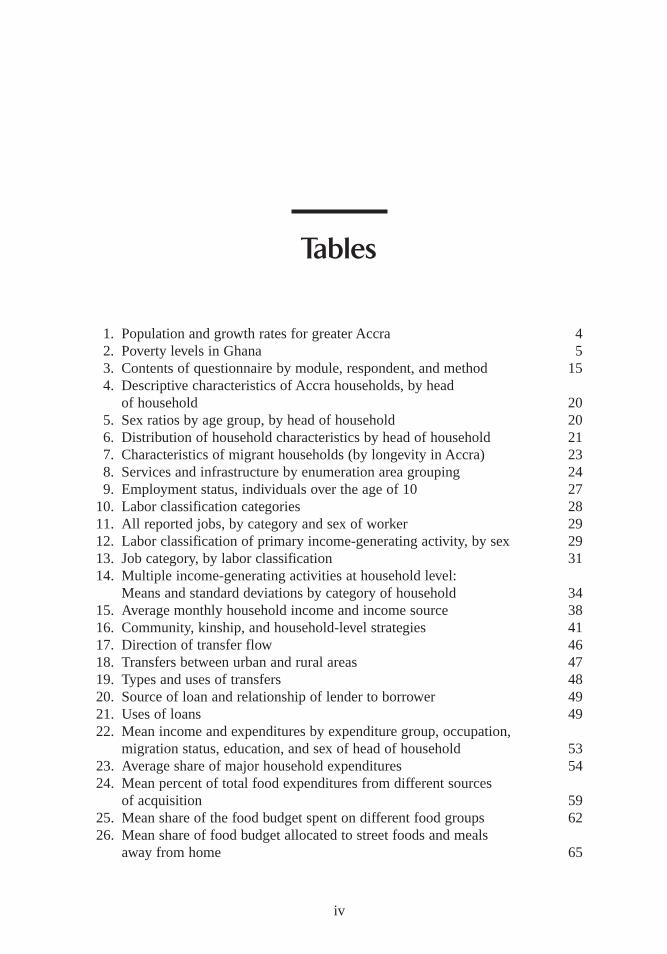
Tables
1. Population and growth rates for greater Accra 42. Poverty levels in Ghana 53. Contents of questionnaire by module, respondent,and method 154. Descriptive characteristics of Accra households,by head
of household 205. Sex ratios by age group,by head of household 206. Distribution of household characteristics by head of household 217. Characteristics of migrant households (by longevity in Accra) 238. Services and infrastructure by enumeration area grouping 249. Employment status,individuals over the age of 10 27
10. Labor classification categories 2811. All r eported jobs,by category and sex of worker 2912. Labor classification of primary income-generating activity, by sex 2913. Job category, by labor classification 3114. Multiple income-generating activities at household level:
Means and standard deviations by category of household 3415. Average monthly household income and income source 3816. Community, kinship,and household-level strategies 4117. Direction of transfer flow 4618. Transfers between urban and rural areas 4719. Types and uses of transfers 4820. Source of loan and relationship of lender to borrower 4921. Uses of loans 4922. Mean income and expenditures by expenditure group,occupation,
migration status,education, and sex of head of household 5323. Average share of major household expenditures 5424. Mean percent of total food expenditures from different sources
of acquisition 5925. Mean share of the food budget spent on different food groups 6226. Mean share of food budget allocated to street foods and meals
away from home 65
iv
maxwell front 5/9/0 8:32 PM Page iv
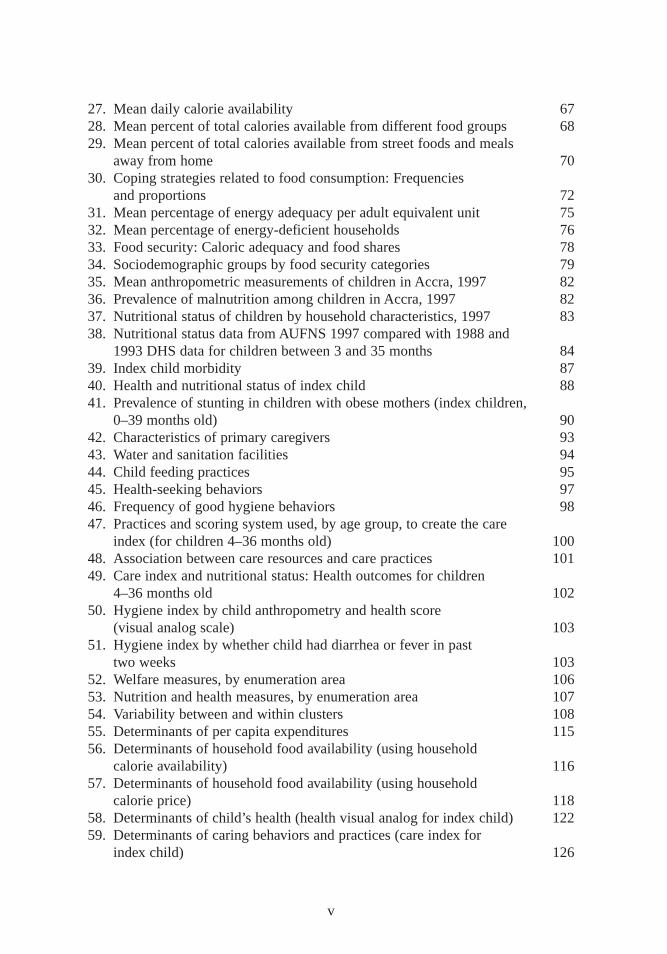
27. Mean daily calorie availability 6728. Mean percent of total calories available from different food groups 6829. Mean percent of total calories available from street foods and meals
away from home 7030. Coping strategies related to food consumption:Frequencies
and proportions 7231. Mean percentage of energy adequacy per adult equivalent unit 7532. Mean percentage of energy-deficient households 7633. Food security: Caloric adequacy and food shares 7834. Sociodemographic groups by food security categories 7935. Mean anthropometric measurements of children in Accra,1997 8236. Prevalence of malnutrition among children in Accra,1997 8237. Nutritional status of children by household characteristics,1997 8338. Nutritional status data from AUFNS 1997 compared with 1988 and
1993 DHS data for children between 3 and 35 months 8439. Index child morbidity 8740. Health and nutritional status of index child 8841. Prevalence of stunting in children with obese mothers (index children,
0–39 months old) 9042. Characteristics of primary caregivers 9343. Water and sanitation facilities 9444. Child feeding practices 9545. Health-seeking behaviors 9746. Frequency of good hygiene behaviors 9847. Practices and scoring system used, by age group,to create the care
index (for children 4–36 months old) 10048. Association between care resources and care practices 10149. Care index and nutritional status:Health outcomes for children
4–36 months old 10250. Hygiene index by child anthropometry and health score
(visual analog scale) 10351. Hygiene index by whether child had diarrhea or fever in past
two weeks 10352. Welfare measures,by enumeration area 10653. Nutrition and health measures,by enumeration area 10754. Variability between and within clusters 10855. Determinants of per capita expenditures 11556. Determinants of household food availability (using household
calorie availability) 11657. Determinants of household food availability (using household
calorie price) 11858. Determinants of child’s health (health visual analog for index child) 12259. Determinants of caring behaviors and practices (care index for
index child) 126
v
maxwell front 5/9/0 8:32 PM Page v
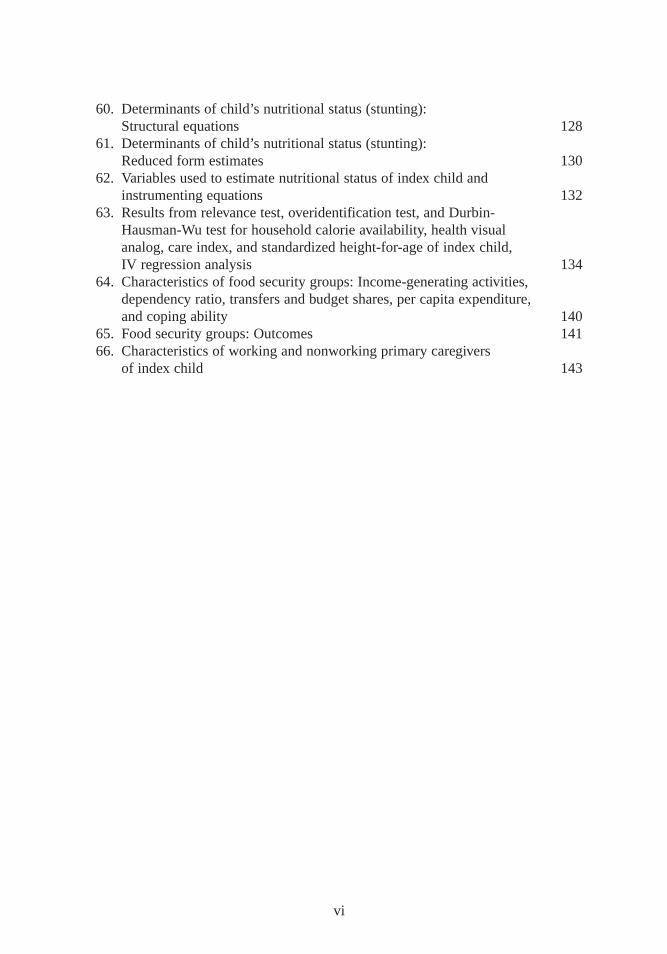
60. Determinants of child’s nutritional status (stunting):Structural equations 128
61. Determinants of child’s nutritional status (stunting):Reduced form estimates 130
62. Variables used to estimate nutritional status of index child and instrumenting equations 132
63. Results from relevance test,overidentification test,and Durbin-Hausman-Wu test for household calorie availability, health visual analog, care index, and standardized height-for-age of index child,IV regression analysis 134
64. Characteristics of food security groups:Income-generating activities,dependency ratio, transfers and budget shares,per capita expenditure,and coping ability 140
65. Food security groups:Outcomes 14166. Characteristics of working and nonworking primary caregivers
of index child 143
vi
maxwell front 5/9/0 8:32 PM Page vi
Figures
1. Livelihood security at the household level 82. Conceptual framework for analyzing nutritional status 103. Research activities,by quarter, 1996–98 134. Average share of total budget allocated to food, by per capita
expenditure quintile 585. Distribution of the budget share for snacks and prepared foods
purchased away from home 646. Share of food expenditures spent on street foods and meals away
from home, by expenditure group 667. Changes in anthropometry (mean Z-scores),1988,1993,and
1997 surveys 858. Changes in prevalence of malnutrition, 1988,1993,and
1997 surveys 869. The association between maternal care practices (terciles) and
malnutrition prevalence 10210. A participatory analysis of the causes of child malnutrition 136
vii
maxwell front 5/9/0 8:32 PM Page vii
Foreword
The population of the developing world is becoming more urban,with the urbanpopulation projected to double from 1.7 billion in 1995 to 3.4 billion in 2020.
Although malnutrition and poverty are still more prevalent in rural areas today, risingdeprivation in urban areas now presents a serious challenge in developing countries—not simply a concern for the future.
In 1996,IFPRI started a program of research on urban challenges to food andnutrition security to better understand trends in urban poverty, food insecurity, andmalnutrition and their determinants and interrelationships. A component of this work,which uses available literature and empirical data on poverty and children’s nutri-tional status shows that in fact the locus of poverty and malnutrition is shifting fromrural to urban areas. The absolute number of poor as well as the urban share of thepoor and malnourished is increasing in many countries. To better understand the is-sues,IFPRI implemented several research projects to explore the interactions betweenurban livelihoods,poverty, food security, and health and nutrition outcomes.
The results,the first to emerge from this research program,provide importantinsights into the challenges that urban households face. Based on the evidence pre-sented here, policymakers and urban planners should act now to address problemsof urban food insecurity and malnutrition. The authors present a number of policyand program recommendations that have wide applications for the many countriesfacing rapid urban population growth and the accompanying problems of food in-security and malnutrition among the poor.
Per Pinstrup-AndersenDirector General
viii
maxwell front 5/9/0 8:32 PM Page viii
Acknowledgments
This study is a collaborative effort of the Noguchi Memorial Institute for Med-ical Research (NMIMR) of the University if Ghana,the International Food
Policy Research Institute (IFPRI),and the World Health Organization (WHO), incollaboration with Ghanaian nongovernmental organizations (NGOs) on variousaspects of the study. A companion report will be published by WHO in early 2000(WHOMulti-Country Study on Improving Household Food and Nutrition Securityfor the Vulnerable: Ghana. Achieving Urban Food and Nutrition Security for the Vul-nerable in Greater Accra. Geneva:WHO, 2000. WHO/NHD/00.2).
Additional financial support was provided by several organizations,including theRockefeller Foundation, the International Development Research Centre (IDRC),and the Canadian International Development Agency (CIDA). We thank ChizuruNishida of WHO, Luc Mougeot of IDRC,and Anne Lavender and Richard Beattieof CIDA for their interest in and support of the study.
Many institutions collaborated on some elements of the study. These include theAccra Metropolitan Assembly (AMA), the Tema Municipal Assembly, the Ga Dis-trict Assembly, the National Development Planning Commission,the Institute forStatistical Social and Economic Research (University of Ghana),the Lands Com-mission,the Accra Sustainable Programme, the Environmental Protection Agency,the Ministry of Food and Agriculture, CENCOSAD, May Day Rural Project,the LaFarmer’s Association, the Greater Accra Vegetable Grower’s Association, and CAREInternational. We thank each of these collaborating institutions for their contribu-tions to the study.
There are too many individuals in this list of institutions to name them all,butspecial thanks go to Nat Nunoo-Amarteifio, chief executive of the AMA; James An-norbah Sarpei of CENCOSAD; Ken Williams of the United Nations Children’sFund (UNICEF); Rosanna Agble of the Ministry of Health; Rosetta Tetebo of theMinistry of Food and Agriculture; Dr. Twum-Baah and Mr. Bannerman of the GhanaStatistical Service; Odame Larbi of the Lands Commission; Ben Doe and DorisTetteh of the Accra Sustainable Programme; Samual Anku of the EnvironmentalProtection Agency; S. N. A. Attoh, the Ga District agricultural officer; E. O. Laryeaof May Day Project; and many other public and NGO officials.
ix
maxwell front 5/9/0 8:32 PM Page ix
At Noguchi Memorial Institute for Medical Research, we specifically thank thedirector, Francis Nkrumah,for his unflagging support of the study, as well as LucyBrakohiapa,Anna Mills, Gloria Folson,and members of the staff of the nutritionunit, and Patience Akpedonu of the bacteriology unit.
At the International Food Policy Research Institute, we thank the director of theFood Consumption and Nutrition Division, Lawrence Haddad, for all his contribu-tions of time, effort (and core funds) to the study, as well as Lynette Aspillera,JamesGarrett, Jay Willis, Haydee Lemus,and other staff members of the Food Cosump-tion and Nutrition Division. We thank John Hoddinott of IFPRI,Jane Pryer of theLondon School of Hygiene and Tropical Medicine, and Stacy Gage of USAID forreviewing the manuscript.
The field staff of the project are too many to name individually, but we especiallythank the long-term research support staff, including Charlotte Mensah,SawudatuZakariah,Grace Mary Lamptey, and Godfred Egbi. Mercy Krow, Frederick Vuvor,and John Yeyie were field supervisors for the survey. Emmanuel Amokwandoh ledthe data entry team. The entire survey field team consisted of some 35 people, in-cluding the supervisors just named, enumerators,anthropometry teams,and drivers.We are grateful to each of them.
Each of us thanks our families for their understanding and support, and for put-ting up with occasional excessive absence from familial duties,due to the long hoursdevoted to the study. And last but not least,we thank the thousands of individualAccra residents who spared us the time answer our seemingly endless questions. Wehope the study will be of benefit to them.
x
maxwell front 5/9/0 8:32 PM Page x
Summary
The dramatic growth of cities in the developing world has brought with it a newchallenge—widespread and increasing urban poverty. However, efforts to ad-
dress the unique problems of urban poverty lag far behind the growth of the prob-lems themselves. Antipoverty initiatives have traditionally targeted rural areas,whichwere presumed to have been worse off than urban areas. But the problems of poorcity dwellers have become more pressing, including the issues of how the urbanpoor earn their livelihoods and the ways in which this affects key indicators ofhuman welfare, such as food security and nutrition, especially of children.
This report examines the nature of urban poverty and how it relates to food in-security and malnutrition in Accra,Ghana. By exploring the major determinants offood security and nutritional status,it develops indicators that are appropriate in anurban context, identifies vulnerable groups within the city, and suggests policiesand programs to improve the lives of the urban poor.
The Accra Urban Food and Nutrition Study was a collaborative effort of theInternational Food Policy Research Institute, the Noguchi Memorial Institute ofMedical Research, located in Accra,and the World Health Organization. The 1996–97study included participatory community studies,household case studies,a house-hold survey, and follow-up interviews and focus groups. The analysis of the informa-tion gleaned from these activities is based on a blend of two conceptual frameworks—one for livelihood security and one for child nutritional status. Children’s nutritionalstatus is determined by their food intake, health,and the care they receive. This re-port seeks to determine how the strategies employed by the urban poor to securetheir livelihoods affect the household’s food security; the care of household members,especially children; and the resulting health and nutrition outcomes. Household foodconsumption data collected include the “street foods”purchased from vendors. Thehygiene behaviors practiced, the local sanitation conditions,and behaviors relatedto feeding and caring for children are all studied to determine their contributions tothe high rates of malnutrition.
Urban livelihoods are complex and not easily characterized. Urban householdsrely heavily on their labor for income. Men’s and women’s activities are very differ-ent,however. Men are likely to be involved in skilled or unskilled labor—sometimes
xi
maxwell front 5/9/0 8:32 PM Page xi
self-employed, sometimes as wage laborers—and some have clerical or professionaljobs. Women are more likely to engage in petty trade or street food vending, wherethey earn far less than men. Because households headed by males have more re-sources for earning income and fewer dependents,they tend to have higher percapita incomes than female-headed households.
Both individuals and households strive to diversify their income sources. Forthe survey sample as a whole, the mean number of income-generating activities perhousehold was found to be only 1.9, and it was significantly lower for female-headed households. The research team observed much more income diversificationthan the survey results indicate, but many of these income resources were short termin nature.
Urban agriculture does not play as large a role in household livelihood strategieswithin the city of Accra as in some other Afr ican cities,but it is of critical impor-tance in the peri-urban areas around the city. Agriculture as a source of livelihoodis increasingly vulnerable as the city physically expands,destroying farmland.
The people of Accra are heavily reliant on the urban market for access to food.More than 90 percent of all food consumed is purchased for cash,about 6 percentcomes from gifts, 1 percent is given to a worker in lieu of wages,and 1 percent ishome-produced. Even among households engaged in urban agriculture, only about7 percent of food (in value terms) is home-produced. Overall, 32 percent of the foodbudget is spent on prepared foods,but the poor spend nearly 40 percent of theirfood budget on street foods. A correspondingly high proportion of calories—roughly30 percent for the entire sample—comes from street foods.
Interhousehold transfers of money play a crucial role in livelihood strategies,especially for low-income households,indigenous communities,and for female-headed households. Most of this transfer income is spent on personal and householdconsumption needs.
Urban households spend more than half of their budgets on food, but nearly one-fifth of the households spend more than 70 percent of their income on food. Hous-ing takes up a surprisingly small share of the total household budget because manyof the people surveyed live in family compounds that they neither own nor rent.
Based on the calories available to household members per day (2,640 kilocalo-ries per adult equivalent unit),about 40 percent of households in the sample arefood-insecure. When the measure of food insecurity takes into consideration boththe number of calories available and the share of the total household budget devotedto food, 24 percent are classified as food insecure and 40 percent as vulnerable;these are mostly among the lowest income groups. People who live in female-headedhouseholds consume more calories,but larger shares of the household budgets goto acquire food. Therefore, female-headed households and individuals in occupa-tions that are predominantly female, such as petty trading and food vending, are themost vulnerable to food price rises or income shocks.
From 1988 to 1993 the nutritional status of children generally improved, butfrom 1993 to 1997 it again deteriorated. Among children 3 to 36 months old, the
xii
maxwell front 5/9/0 8:32 PM Page xii
prevalence of stunting (low height-for-age) was 17.6 percent in the latter period.The prevalence of wasting (low weight-for-height) was 5.3 percent.
Lif e in urban areas presents special challenges for the provision of adequatecare. The trade-offs women face between their productive and reproductive roles arelikely to be more acute in urban than in rural areas. In Accra,about two-thirds of allprimary caregivers of young children (usually their mothers) engage in some kindof income-generating activity. Most caregivers work away from home and workvery long hours. Nevertheless,among those who work, more than half still lookafter their children full time, taking them to the marketplace or wherever they work.Mothers of young children perceive that their ability to care for their children maybe adversely affected while working, but they also know that they must earn an in-come to provide for their children. Results here suggest that many working womenare able to cope, avoiding adverse effects on their children.
According to the survey, child feeding practices are less than ideal in Accra. Al -though breast feeding is the norm, use of prelacteal feeds and complementary foodsand liquids during the first four months is widespread. Use of health services for im-munization and growth monitoring, however, is high,probably a reflection of theavailability and promotion of these services in the city. As expected, children fromhouseholds with higher incomes have access to more and better quality food andhave better health.
Care practices and behaviors are not significantly improved in higher-incomehouseholds,however. Maternal schooling is the determinant most strongly associ-ated with good care. This study finds that mother’s education clearly matters. Moreeducation for women is associated with higher levels of household food availabil-ity, higher quality diets,better care practices and behaviors, and better nutritionaloutcomes.
Despite clear differences in the appearance and composition of urban neighbor-hoods,the variations in income and human welfare between the areas surveyed areless significant than those within an area. For programs aimed at reducing urbanpoverty and increasing food and nutrition security, this implies that simple geo-graphic targeting is not sufficient. Virtually all the variation is at the household level,not the community level. To effectively intervene, at-risk households and individualswill have to be identified through means other than their neighborhood; targetingstrategies will be needed to identify vulnerable groups wherever they are located.
The findings of this study have important policy implications for reducing urbanpoverty and vulnerability. But to do so several preconditions must be met. Govern-ments must accept that rapid urban growth is a reality in Sub-Saharan Afr ica. Al -though poverty is predominantly a rural problem in Ghana,urban poverty must berecognized. National policies must address the needs of different categories of vul-nerable groups,such as female-headed households. Education of girls is a good in-vestment for reducing poverty in the future. For other livelihood groups,vulnera-bility stems from poor employment opportunities,lack of access to credit, and theregulatory environment,which inhibits the activities of the urban self-employed.
xiii
maxwell front 5/9/0 8:32 PM Page xiii

The rapid proliferation of traders and vendors of street foods will require new ap-proaches by municipal authorities, emphasizing participation and collaborationrather than control. Strengthening trader or street food vendor associations wouldhelp to develop self-regulatory mechanisms and give a political voice to small-scaleentrepreneurs.
xiv
maxwell front 5/9/0 8:32 PM Page xiv
CHAPTER 1
Urban Poverty: A New Priority
Poverty, food insecurity, and malnutrition in Africa were for decades viewed aslargely—if not entirely—rural problems. At the end of the twentieth century,
however, rapid urbanization in Sub-Saharan Africa has resulted in urban poverty se-vere enough to jeopardize livelihoods and food and nutrition security. The urbanpopulation, a tiny fraction of the region’s residents in 1950, is now approaching40 percent of the total and is expected to exceed 50 percent early in the twenty-firstcentury (UNCHS 1996). This urban growth has brought with it a host of problems,including unemployment and underemployment, a burgeoning informal sector,deteriorating infrastructure and service delivery capacity, overcrowding and envi-ronmental degradation, and an acute housing shortage (Stren, White, and Whitney1992; Mabogunje 1994; Becker, Jamer, and Morrison 1994; UNCHS 1996).
These issues have been broadly reviewed in the 1990s (Ruel et al. 1998; vonBraun et al. 1993; Atkinson 1992). Only a few empirical studies have undertakena comprehensive analysis in an urban context, however (Tabatabai 1993; Gebre1993). Recent research has made urban poverty a priority on the political agendaof donors and national government (Amis 1995; OECD 1995; Moser 1996; Stren,White, and Whitney 1992; de Haan 1997; Ruel et al. 1998). Recent analyses haveshown, for instance, that urban poverty is not only growing rapidly but has tendedto be underestimated in the past (Haddad, Ruel, and Garrett 1999; Satterthwaite1995).
Specific policy attention to issues of urban poverty such as food security and nu-trition has lagged behind the research, despite the demonstrated need. Earlier re-search showed that 60–80 percent of the total household budget of the urban pooris spent on food (Tabatabai 1993; Gebre 1993). This finding makes it likely thaturban poverty will be manifested at least in part as a food insecurity problem.Within the West African region, urban food security—and the dearth of research onthe topic—has been recognized as a growing problem (Onibokun 1994).
Urban poverty is unique. The valuable policy and programmatic lessons gener-ated by decades of work in rural Africa may not be directly applicable to cities, forseveral reasons. First, urban life has a different effect on all the major determinantsof nutritional status than rural life does, including livelihoods, food access, dietary
1
maxwell chap01 5/9/0 8:32 PM Page 1
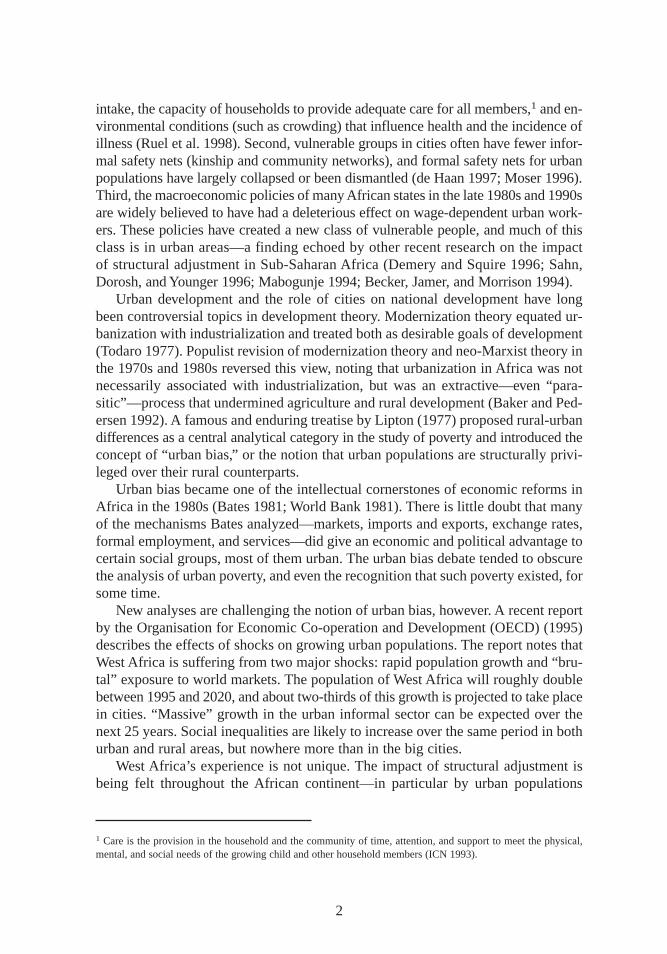
intake, the capacity of households to provide adequate care for all members,1 and en-vironmental conditions (such as crowding) that influence health and the incidence ofillness (Ruel et al. 1998). Second, vulnerable groups in cities often have fewer infor-mal safety nets (kinship and community networks),and formal safety nets for urbanpopulations have largely collapsed or been dismantled (de Haan 1997; Moser 1996).Third, the macroeconomic policies of many Afr ican states in the late 1980s and 1990sare widely believed to have had a deleterious effect on wage-dependent urban work-ers. These policies have created a new class of vulnerable people, and much of thisclass is in urban areas—a finding echoed by other recent research on the impactof structural adjustment in Sub-Saharan Afr ica (Demery and Squire 1996; Sahn,Dorosh,and Younger 1996; Mabogunje 1994; Becker, Jamer, and Morrison 1994).
Urban development and the role of cities on national development have longbeen controversial topics in development theory. Modernization theory equated ur-banization with industrialization and treated both as desirable goals of development(Todaro 1977). Populist revision of modernization theory and neo-Marxist theory inthe 1970s and 1980s reversed this view, noting that urbanization in Afr ica was notnecessarily associated with industrialization, but was an extractive—even “para-sitic”—process that undermined agriculture and rural development (Baker and Ped-ersen 1992). A famous and enduring treatise by Lipton (1977) proposed rural-urbandifferences as a central analytical category in the study of poverty and introduced theconcept of “urban bias,” or the notion that urban populations are structurally privi-leged over their rural counterparts.
Urban bias became one of the intellectual cornerstones of economic reforms inAfr ica in the 1980s (Bates 1981; World Bank 1981). There is little doubt that manyof the mechanisms Bates analyzed—markets,imports and exports, exchange rates,formal employment,and services—did give an economic and political advantage tocertain social groups,most of them urban. The urban bias debate tended to obscurethe analysis of urban poverty, and even the recognition that such poverty existed, forsome time.
New analyses are challenging the notion of urban bias,however. A recent reportby the Organisation for Economic Co-operation and Development (OECD) (1995)describes the effects of shocks on growing urban populations. The report notes thatWest Afr ica is suffering from two major shocks: rapid population growth and “bru-tal” exposure to world markets. The population of West Afr ica will roughly doublebetween 1995 and 2020,and about two-thirds of this growth is projected to take placein cities. “Massive” growth in the urban informal sector can be expected over thenext 25 years. Social inequalities are likely to increase over the same period in bothurban and rural areas,but nowhere more than in the big cities.
West Afr ica’s experience is not unique. The impact of structural adjustment isbeing felt throughout the Afr ican continent—in particular by urban populations
2
1 Care is the provision in the household and the community of time, attention,and support to meet the physical,mental,and social needs of the growing child and other household members (ICN 1993).
maxwell chap01 5/9/0 8:32 PM Page 2
(OECD 1995). According to the OECD, the effects of structural adjustment onurban areas include
• higher food prices,the result of liberalized agricultural output markets andthe lifting of subsidies and state control over grains and other food products;
• higher prices for imported goodscaused by the liberalization of imports andexports;
• growing joblessness among middle-class residents,many of whom have beenpushed out by the privatization and downsizing of the civil service;
• lower wages,the result of increasingly competitive labor markets; and• reductions in basic health,education, and other social servicesas govern-
ments reduce expenditures.Most of these reforms have been necessary. They are designed to stimulate agri-
cultural productivity, lay the foundation for renewed growth, and, ironically, reduceurban bias. But structural adjustment has also created a new class of vulnerablepeople, many of them in urban areas. Other recent research on the impacts of struc-tural adjustment in Sub-Saharan Afr ica echo these findings (Demery and Squire1996; Sahn,Dorosh,and Younger 1996). Research also suggests that while structuraladjustment policies have improved agricultural incentives, they have not signifi-cantly altered the pattern of rural-urban migration (OECD 1995; Becker, Jamer, andMorrison 1994).
Greater Accra, Ghana: A Case Study in Urban Poverty
Accra offers a compelling case study of the contemporary impact of urban life onthe livelihoods,food security, and nutritional status of its people. The Accra UrbanFood and Nutrition Study was a collaborative effort between IFPRI,the NoguchiInstitute of Medical Research, and the World Health Organization to assess the na-ture of urban poverty and the relationship between urban poverty and food insecurityor malnutrition in Accra,Ghana,in 1996–97. By exploring the major determinantsof food security and nutrition status,the study develops indicators of food and liveli-hood security that are appropriate for an urban setting. The study consists of par-ticipatory community studies,household case studies,a household survey carriedout in 19 areas of Greater Accra Metropolitan Area,and follow-up interviews andfocus groups.
The Economic Context
Ghana’s economy underwent a long period of decline from 1965 to 1983. In manyways this decline was a classic example of the failure of development policy, com-plete with falling production,decaying infrastructure, overvalued exchange rates (andtherefore implicit taxes on exports), and declining investment and high inflation.Food prices increased steadily and standards of living declined. In several instances,urban dwellers experienced severe food shortages (Kraus 1988; Commander, How-ell, and Seini 1989). Political protests against food shortages and price hikes were
3
maxwell chap01 5/9/0 8:32 PM Page 3
linked to at least two coups,although many protests were directed at food tradersrather than the government. This situation came to a head in 1982–83,when a severenationwide drought drastically reduced harvests and triggered massive food short-ages. The country avoided widespread famine, but Ghanaians’nutritional status de-clined severely nationwide (Tabatabai 1988).
The Economic Recovery Programme, Ghana’s structural adjustment program,began in 1983. The program has been widely perceived as successful (Alderman1994),although inflation has been high since 1992,undermining much of the re-covery effort (ISSER 1997). Agricultural production increased quickly, despite vari-ances in annual production (which have persisted since 1984) and steep seasonalprice fluctuations. Overall GDP growth in the 1990s has ranged between 4 and 5 per-cent (ISSER 1997). But many groups have yet to benefit significantly from the re-covery, and few have been able to recover their precrisis standard of living.
Population
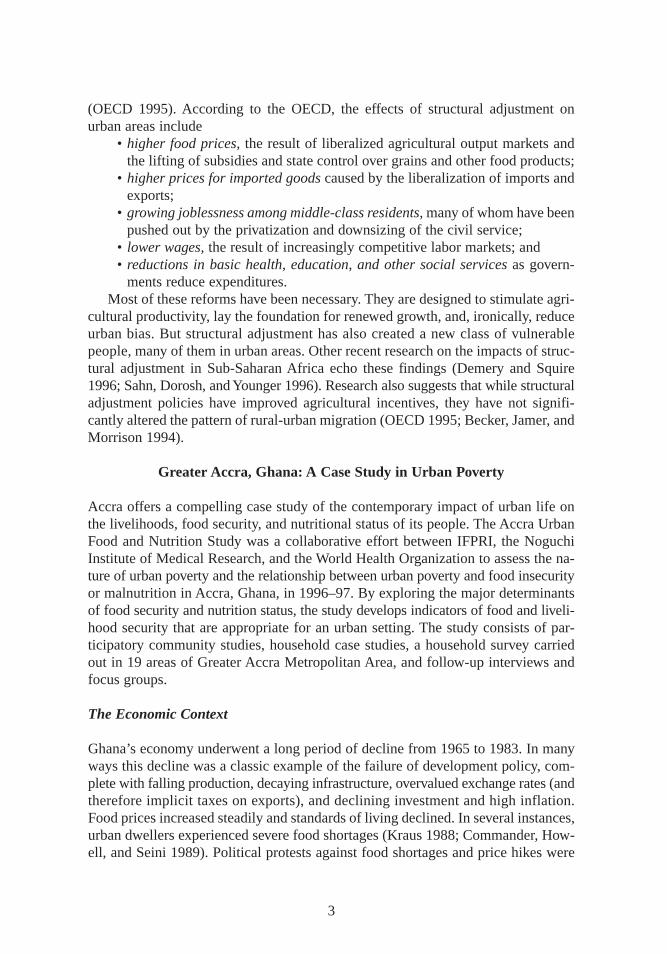
In 1997 the population of greater Accra was estimated to be roughly 2.3–2.4 millionpeople. The projected overall population growth rate in the study area at the timeof the study was roughly 4.7 percent per year (Table 1). Accra itself covers 17,362.4hectares,so that its mean population density at the time of the survey was 100 peopleper hectare. Actual population densities vary from as few as 20 people per hectare inthe new high-income areas to as many as 500 people per hectare in the most denselypopulated low-income neighborhoods (Ghana-MLG 1992).
4
Table 1—Population and growth rates for greater Accra
Location 1960 1970 1984 1995a 2000a
(thousands)
PopulationAccra 388 637 969 1,513 1,843Tema 27 102 191 350 459Ga District 34 66 133 262 348
Total 449 805 1,293 2,216 2,650
(percent)Growth rate
Accra … 5.1 3.1 4.0 4.1Tema … 14.2 4.5 5.8 5.9Ga District … 6.9 5.3 5.8 6.0
Total … 6.0 3.5 4.6 4.7
Sources: Ghana-MLG 1992,based on population census reports,and the “medium” growth rate predictionsfor 1995 and 2000.
Notes: Information is provided for greater Accra’s three districts. Some of the most rural areas of GaDistrict were excluded from the survey sampling frame.
a Projections.
maxwell chap01 5/9/0 8:32 PM Page 4
Poverty in Accra
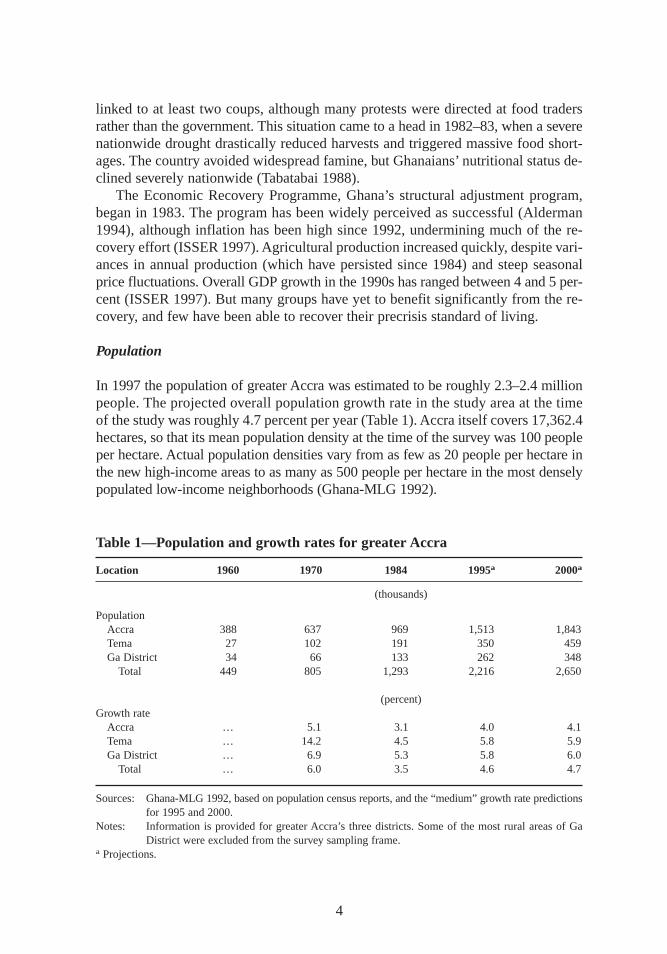
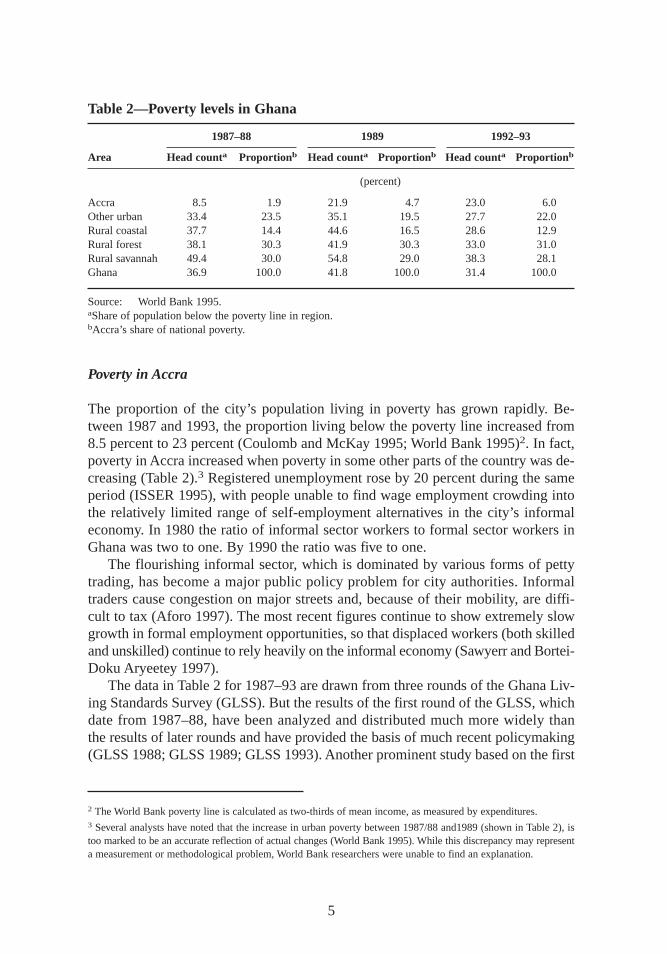
The proportion of the city’s population living in poverty has grown rapidly. Be-tween 1987 and 1993,the proportion living below the poverty line increased from8.5 percent to 23 percent (Coulomb and McKay 1995; World Bank 1995)2. In fact,poverty in Accra increased when poverty in some other parts of the country was de-creasing (Table 2).3 Registered unemployment rose by 20 percent during the sameperiod (ISSER 1995),with people unable to find wage employment crowding intothe relatively limited range of self-employment alternatives in the city’s informaleconomy. In 1980 the ratio of informal sector workers to formal sector workers inGhana was two to one. By 1990 the ratio was five to one.
The flourishing informal sector, which is dominated by various forms of pettytrading, has become a major public policy problem for city authorities. Informaltraders cause congestion on major streets and, because of their mobility, are diffi-cult to tax (Aforo 1997). The most recent figures continue to show extremely slowgrowth in formal employment opportunities,so that displaced workers (both skilledand unskilled) continue to rely heavily on the informal economy (Sawyerr and Bortei-Doku Aryeetey 1997).
The data in Table 2 for 1987–93 are drawn from three rounds of the Ghana Liv-ing Standards Survey (GLSS). But the results of the first round of the GLSS, whichdate from 1987–88,have been analyzed and distributed much more widely thanthe results of later rounds and have provided the basis of much recent policymaking(GLSS 1988; GLSS 1989; GLSS 1993). Another prominent study based on the first
5
Table 2—Poverty levels in Ghana
1987–88 1989 1992–93
Ar ea Head counta Proportionb Head counta Proportionb Head counta Proportionb
(percent)
Accra 8.5 1.9 21.9 4.7 23.0 6.0Other urban 33.4 23.5 35.1 19.5 27.7 22.0Rural coastal 37.7 14.4 44.6 16.5 28.6 12.9Rural forest 38.1 30.3 41.9 30.3 33.0 31.0Rural savannah 49.4 30.0 54.8 29.0 38.3 28.1Ghana 36.9 100.0 41.8 100.0 31.4 100.0
Source: World Bank 1995.aShare of population below the poverty line in region.bAccra’s share of national poverty.
2 The World Bank poverty line is calculated as two-thirds of mean income, as measured by expenditures.3 Several analysts have noted that the increase in urban poverty between 1987/88 and1989 (shown in Table 2), istoo marked to be an accurate reflection of actual changes (World Bank 1995). While this discrepancy may representa measurement or methodological problem,World Bank researchers were unable to find an explanation.
maxwell chap01 5/9/0 8:32 PM Page 5
round of GLSS, noted that “poverty in Ghana is an overwhelmingly rural phenom-enon .. . ” (Boateng et al. 1992,56). In part because of the emphasis on rural poverty,urban poverty, food insecurity, and malnutrition have tended to receive relatively littleattention from policymakers in Ghana.
A recent World Bank (1995) report on poverty in Ghana finds the decline in liv-ing standards in Accra worrisome in light of the country’s economic recovery andgrowth. The evidence on income inequality is mixed, however. The World Bankstudy concludes that real mean income in Accra fell between 1987 and 1992 but thatincome distribution narrowed, suggesting a reduction in income inequality. Thedecline in living standards was greatest among the middle class,but the poverty gapwidened in Accra in 1992 (World Bank 1995). Although the real average monthlyearnings per employed worker climbed by 20 percent in 1987–92,the proportion ofthe population living below the poverty line increased from less than 1 in 10 to al-most 1 in 4 (ISSER 1995; World Bank 1995). The Gini coefficient for income dataon households in Accra was 0.43 for the 1987–88 round of the GLSS and 0.50 forthe 1992 round. These facts suggest that inequality actually increased. The greaterAccra area still has the lowest overall incidence of poverty of any of the regions forwhich data were disaggregated. However, the data also indicate both an increase inthe absolute number of people in poverty in Accra and a narrowing of the rural–urban gap in terms of real income.
Goals of the Study
The Accra Urban Food and Nutrition Study aims to provide an understanding of thenature of urban poverty and the relationship between urban poverty and food insecu-rity (or malnutrition) in Accra. It sets up a framework for determining these relation-ships and offers decisionmakers policy options they can use to address the underly-ing causes of urban poverty. These policy options include interventions to supportlivelihoods,promote food and nutrition security, and create an enabling environmentfor community-based informal safety nets in areas where governments cannot affordto provide formal services.
Specifically, the study undertakes to• identify ways that constraints to livelihoods,income, women’s labor, and
child care practices affect food and nutritional security in a major urban cen-ter in Afr ica;
• understand the strategies urban dwellers use to cope with poverty (includinginformal safety nets) and identify vulnerable groups;
• develop indicators of livelihood and food security that are appropriate forurban contexts;
• identify policies and programs to reduce urban poverty, food insecurity, andmalnutrition; and
• provide high-quality information to policymakers in national and local gov-ernments,nongovernmental organizations (NGOs),and community-basedorganizations.
6
maxwell chap01 5/9/0 8:32 PM Page 6
The policy recommendations are intended to complement policies and programsdesigned to alleviate rural poverty. The same report that brought the issue of grow-ing urban poverty to the attention of Ghanaian policymakers notes that while ruralpoverty is declining, it is still at higher levels than poverty in Accra (World Bank1995). Further, the most recent national data also show that the prevalence of mal-nutrition is generally lower in Accra than in the rest of Ghana (Ghana Statistical Ser-vices 1993). Clearly, alleviating both rural and urban poverty is essential to Ghana’sdevelopment.
In terms of the national political economy, two facts are important to this analy-sis. First, given Ghana’s current economic and demographic trends,the problemshighlighted here will continue to worsen faster in Accra than in rural areas. Second,groups of urban dwellers already exist that are as badly off as certain rural groups interms of the kinds of indicators this study uses—particularly for income, food secu-rity, health,and nutritional status. So,another major purpose of this study is to iden-tify these groups and the constraints to their livelihood and welfare, in order to rec-ommend policy and programmatic interventions that make sense in specifically urbansettings. Given the constraints to resources and the likelihood that priority will con-tinue to be given to rural development policy, policymakers must be armed withcurrent status of urban populations and low-cost tools to identify vulnerable urbangroups,to intervene to support livelihoods,to promote food and nutrition security,and to create an enabling environment for community-based informal safety netswhere governments cannot afford to provide adequate formal support programs.
Creating an Analytical Framework
One aim of the study is to provide an overall framework for analyzing the linkagesbetween livelihood security and nutritional security and factors such as income,women’s labor, and child care practices. Several distinctly different conceptual lit-eratures provide the background for this framework.
The Livelihood Security Approach
Household decisionmakers must decide how to use their limited resources to meettheir minimum needs and other obligations. The livelihood security approach offersa holistic framework for assessing the resources and assets that are available, andanalyzing how these are linked to the strategies that are used to reach desired out-comes. The notion of “li velihoods”as an organizing principle for the study of in-come and access to food and the basic welfare needs draws on Sen’s (1981) traditionof analyzing entitlements. Entitlements are the legal means by which an individualor household gains access to their needs. These include exchange (most commonlylabor for money), production using resources and labor, and transfers and inheri-tance. More recent work looks not only at sources of entitlement,but also demandsmade on entitlements including obligations to kin outside the immediate household,or indebtedness (Swift 1989; Davies 1996). Because people have to make choices
7
maxwell chap01 5/9/0 8:32 PM Page 7
among competing needs and limited resources,the notion of “li velihood security”has come to be a more all-embracing term for analysis of household resources,as-sets,production and exchange activities, needs,and consumption than “f ood se-curity,” even though food is almost without exception the most important con-sumption item.
Some analysts define livelihood security in terms of outcomes—particularlysustainable access to sufficient income (Frankenberger 1996). Chambers and Con-way (1992,6–7) define sustainable livelihoods in terms of capacities and activities:
A livelihood comprises the capabilities, assets (stores,resources,claims andaccess) and activities required for means of [earning a] living: a livelihood issustainable which can cope with and recover from stress and shocks,maintainor enhance its capabilities and assets,and provide . . . opportunities for thenext generation.
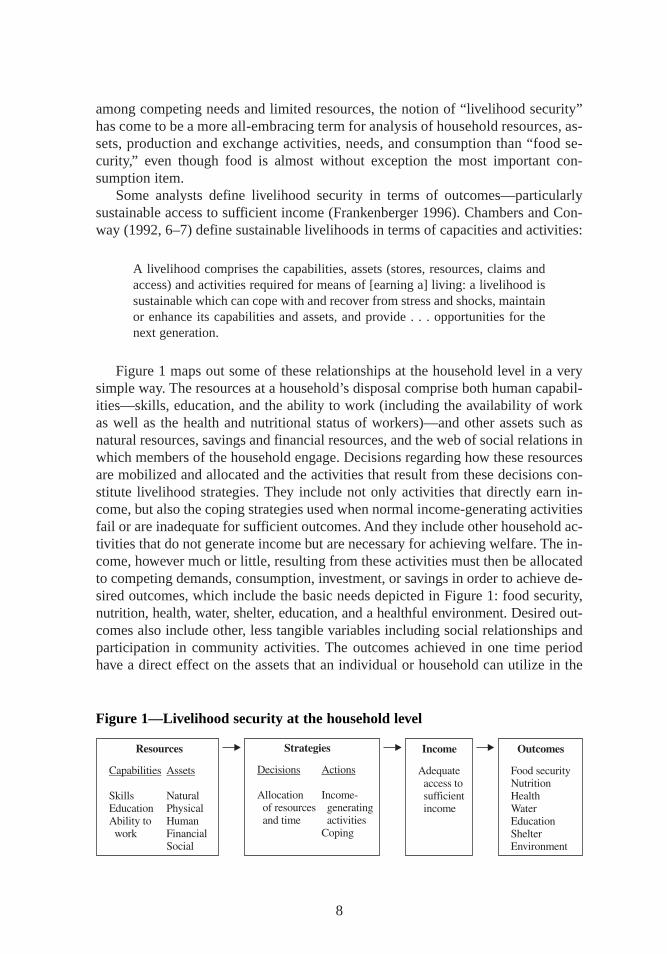
Figure 1 maps out some of these relationships at the household level in a verysimple way. The resources at a household’s disposal comprise both human capabil-ities—skills,education, and the ability to work (including the availability of workas well as the health and nutritional status of workers)—and other assets such asnatural resources,savings and financial resources,and the web of social relations inwhich members of the household engage. Decisions regarding how these resourcesare mobilized and allocated and the activities that result from these decisions con-stitute livelihood strategies. They include not only activities that directly earn in-come, but also the coping strategies used when normal income-generating activitiesfail or are inadequate for sufficient outcomes. And they include other household ac-tivities that do not generate income but are necessary for achieving welfare. The in-come, however much or little, resulting from these activities must then be allocatedto competing demands,consumption,investment,or savings in order to achieve de-sired outcomes,which include the basic needs depicted in Figure 1: food security,nutrition, health,water, shelter, education, and a healthful environment. Desired out-comes also include other, less tangible variables including social relationships andparticipation in community activities. The outcomes achieved in one time periodhave a direct effect on the assets that an individual or household can utilize in the
8
Figure 1—Livelihood security at the household level
maxwell chap01 5/9/0 8:32 PM Page 8
next time period: for example, sacrif icing consumption to achieve improved out-comes in terms of savings or investment will result in improved financial assets butdeteriorated human capabilities, and vice versa.
The assets,strategies,and outcomes at the household level must be understoodin context, and the major contextual factors to consider are those that increase ordecrease vulnerability—the political, economic, social,and institutional contextin which the household is situated. Current status indicators—such as those listedunder “outcomes”in Figure 1—describe poverty, malnutrition, poor health,andother outcomes in the current time frame. Vulnerability is a measure of the risk thatone of these will occur at some point in the future. Vulnerability and poverty are notthe same thing (Lipton and Maxwell 1992). People may move in and out of povertyover time; vulnerability is a major determinant of whether people actually do fallinto poverty.
Vulnerability is a difficult term to define operationally. At root, vulnerability isa combination of exposure and risk and of the ability of households and individualsto cope with those risks and to recover from a shock or deterioration of current sta-tus (Chambers,1988; Watts and Bohle, 1993). Vulnerability and the ability of an in-dividual or household to recover from shocks is linked to the resources or assets thatan individual or household holds:in general, the greater the level and diversity ofassets held, the less vulnerable the household. Thus the relationships of vulnerabil-ity, assets,and livelihoods to poverty, food insecurity, and malnutrition are impor-tant to understand.
In brief, a livelihood approach helps to focus analytically on several questions:In view of known obligations and risks,how do households and individual decision-makers within households organize and manage their labor-based, income-generatingactivities and other forms of income and assets? What are the various means of cop-ing with shocks: formal safety nets,kinship networks, or household-based mecha-nisms? How do they protect both their future ability to earn a livelihood and ensurefood and nutrition security and their access to other basic necessities? This appliesto both the individuals within the household and the household as a unit.These arethe overarching questions addressed from a livelihoods perspective.
A Conceptual Framework for Nutritional Status
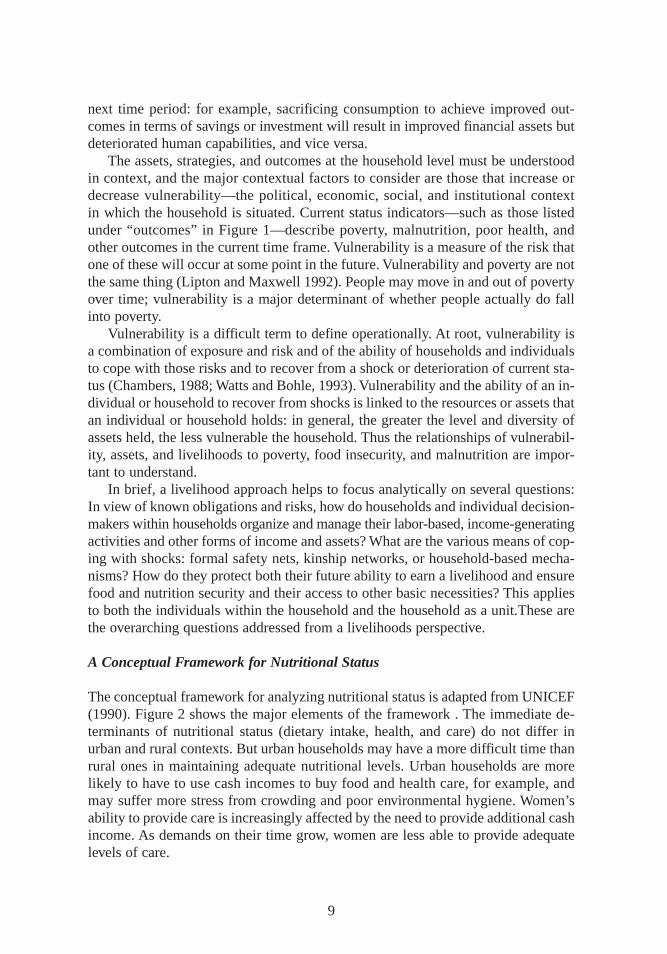
The conceptual framework for analyzing nutritional status is adapted from UNICEF(1990). Figure 2 shows the major elements of the framework . The immediate de-terminants of nutritional status (dietary intake, health,and care) do not differ inurban and rural contexts. But urban households may have a more difficult time thanrural ones in maintaining adequate nutritional levels. Urban households are morelikely to have to use cash incomes to buy food and health care, for example, andmay suffer more stress from crowding and poor environmental hygiene. Women’sability to provide care is increasingly affected by the need to provide additional cashincome. As demands on their time grow, women are less able to provide adequatelevels of care.
9
maxwell chap01 5/9/0 8:32 PM Page 9
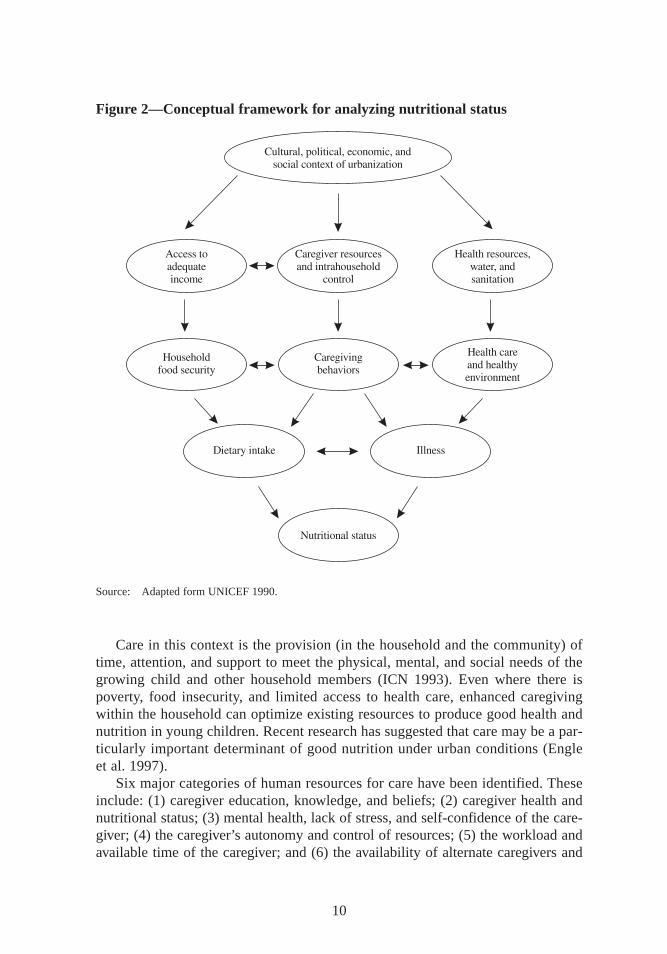
Care in this context is the provision (in the household and the community) oftime, attention,and support to meet the physical,mental,and social needs of thegrowing child and other household members (ICN 1993). Even where there ispoverty, food insecurity, and limited access to health care, enhanced caregivingwithin the household can optimize existing resources to produce good health andnutrition in young children. Recent research has suggested that care may be a par-ticularly important determinant of good nutrition under urban conditions (Engleet al. 1997).
Six major categories of human resources for care have been identified. Theseinclude: (1) caregiver education, knowledge, and beliefs; (2) caregiver health andnutritional status; (3) mental health,lack of stress,and self-confidence of the care-giver; (4) the caregiver’s autonomy and control of resources; (5) the workload andavailable time of the caregiver; and (6) the availability of alternate caregivers and
10
Figure 2—Conceptual fr amework for analyzing nutr itional status
Source: Adapted form UNICEF 1990.
maxwell chap01 5/9/0 8:32 PM Page 10
social support from family and community (Jonsson 1995; Engle, Menon,and Had-dad 1996). The household’s economic resources and organizational resources at thecommunity level interact with the human resources described above, and togetherwill inf luence the set of caregiving behaviors observed within the household. Last,care is also influenced by policies and ideologies that support or undermine ahousehold’s ability to provide care, including wage policies,health care policies,and the promotion of breast-feeding.
The UNICEF conceptual framework has helped to motivate the inclusion of careas a determinant of child malnutrition; however, relatively few studies have exploredthe interactions between care, food security, health,and nutritional status. Part ofthe problem was a lack of consensus on the components of care. More recently, re-searchers have developed a conceptual framework for the constituents of care(Engel 1992). Once the concept of care was developed, additional research exploreda set of indicators to measure care and to differentiate between care resources andcare behaviors and practices. This study builds on previous research and constructsan indicator to measure care and evaluate its impact on children’s nutritional statusin an urban environment. The need to analyze food security, health,and nutritionalstatus in light of the resources and behaviors affecting care is urgent. Appropriateinformation can give decisionmakers the tools they need to devise policies and pro-grams to support the provision of adequate care in urban households.
Combining Livelihoods with Nutritional Status
Livelihoods—the capabilities, assets,and strategies which individuals and house-holds bring to bear in the process of living—highlight some of the more distal deter-minants of nutritional status in the UNICEF framework. The UNICEF frameworkhighlights several of the outcomes (food security and health) and some of the activi-ties (care) that appear in the livelihood framework. The livelihood framework takesnote of some of the trade-offs that households and caregivers are forced to make,both in terms of how they allocate their time and resources,among the different out-comes that can be achieved with limited income.
The analytical approach in this study, therefore, is to begin with an in-depthexamination of urban livelihoods strategies,revealed by household income sourcesand expenditure patterns,before proceeding to a consideration of livelihood outcomesthat include household food availability and distribution,health and care practices,and nutritional status.
11
maxwell chap01 5/9/0 8:32 PM Page 11
CHAPTER 2
Design and Methodology of the Study
The study took place in four stages (Figure 3). An initial roundtable seminar inAccra brought together all parties with a stake in the outcome: researchers, city
managers, policymakers, government representatives, nongovernmental organiza-tions (NGO), program staff, community leaders and activists, and representativesof international organizations and donor agencies. The seminar’s purpose was to iden-tify information gaps that hinder the formulation of effective food and nutritionpolicy and programs and limit the basic understanding of urban food and nutrition se-curity in Accra.
The second stage involved participatory rapid appraisal studies in two communi-ties in the greater Accra area—one in a densely populated city center, the other in arapidly growing peri-urban location. During the third and fourth stages researchersundertook a series of qualitative citywide household case studies and an integratedhousehold survey that covered 559 households in 16 enumeration areas. Follow-upqualitative investigations helped in interpreting survey findings.
The study also investigated food production and other types of urban and peri-urban agriculture, relying partly on the household survey and partly on participatorymethodology.4 Researchers interviewed respondents, conducted feedback sessionsin each enumeration area or survey site, and organized a national seminar to presentresults. The research design and methodology of the survey are described in detailin Annex 1 of Accra Study Team (1998).
Qualitative Data Collection
Many of the research methods used in this study were adapted from rural studies,including the participatory rural appraisal (PRA) approach and household surveymethodologies. To ensure that these methods would be applicable in an urban set-ting, researchers devoted considerable effort to adapting and testing them in differentlocations in Accra (D. Maxwell 1996). An interdisciplinary research team of econ-
12
4 Results of these studies are summarized in Maxwell et al. 1998.
maxwell chap02 5/9/0 8:31 PM Page 12
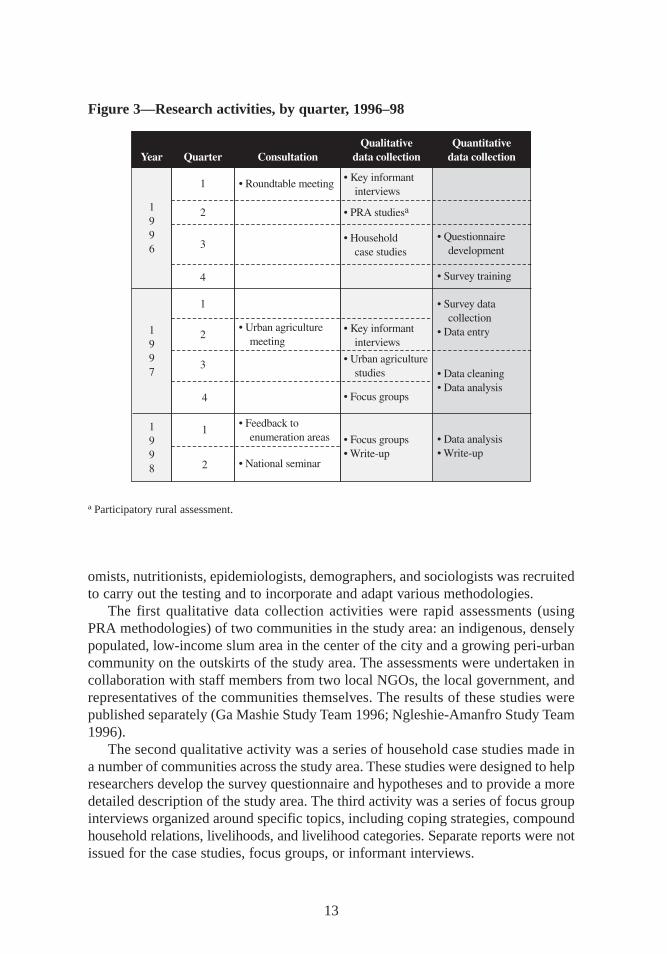
omists,nutritionists,epidemiologists,demographers,and sociologists was recruitedto carry out the testing and to incorporate and adapt various methodologies.
The first qualitative data collection activities were rapid assessments (usingPRA methodologies) of two communities in the study area:an indigenous,denselypopulated, low-income slum area in the center of the city and a growing peri-urbancommunity on the outskirts of the study area. The assessments were undertaken incollaboration with staff members from two local NGOs,the local government,andrepresentatives of the communities themselves. The results of these studies werepublished separately (Ga Mashie Study Team 1996; Ngleshie-Amanfro Study Team1996).
The second qualitative activity was a series of household case studies made ina number of communities across the study area. These studies were designed to helpresearchers develop the survey questionnaire and hypotheses and to provide a moredetailed description of the study area. The third activity was a series of focus groupinterviews organized around specific topics,including coping strategies,compoundhousehold relations,livelihoods,and livelihood categories. Separate reports were notissued for the case studies,focus groups,or informant interviews.
13
Figure 3—Research activities, by quarter, 1996–98
a Participatory rural assessment.
maxwell chap02 5/9/0 8:31 PM Page 13
These qualitative activities allowed researchers to develop a survey instrumentand hypotheses,adapt rural research methods to an urban context, and form a pictureof the study area. The activities had other benefits as well. They proved invaluablein developing a definition of the term householdthat would be specific to Accra.They helped in interpreting unexpected findings and in identifying appropriate fol-low-up activities. They brought extreme cases (particularly of highly vulnerablegroups) missed by the survey sampling strategy, to the attention of researchers.Finally, they provided researchers with an understanding of residents’perceptionsof the study.
Data Collection
The basic sampling units for the survey were households with children under theage of three.5 However, no information was available about the number of house-holds with children in this age group in the study area. This information, therefore,had to be ascertained by conducting a complete census of the selected neighbor-hoods involving the enumeration of all resident households and their demographiccomposition.
Survey Sampling Strategy and Sample Size
The study team adopted a two-stage sampling strategy, and the Ghana StatisticalService (GSS) mapped out enumeration areas for primary sampling units in thegreater Accra area. These enumeration areas were mapped in 1981–84 and had notbeen updated at the time of the survey, so total population estimates had to be ad-justed by mean growth rates at the district level. The sampling frame included 879urban and 33 peri-urban enumeration areas within the Accra,Ga,and Tema districts.Sixteen numeration areas were selected using a systematic sample from a randomstart.
The two-stage cluster sampling strategy required taking into account the designeffect—the extra component of the total variance that arises because observationswithin clusters are more similar than observations from different clusters. Becauseof this homogeneity, cluster sampling requires a larger sample size than a simplerandom sampling. The design effect was calculated on the basis of the interclustercorrections in mean height-for-age Z-scores in previous Demographics and HealthSurvey data on children in Accra (GSS 1994). In order to detect statistically signif-icant differences of 0.5 Z-scores with 90 percent power, researchers calculated the
14
5 There is a growing consensus among nutritionists that the appropriate age group for measurements is childrenunder three, not the under-five group that has often been measured. While growth curves are applicable to chil-dren under five, the risk of mortality from malnutrition decreases dramatically after age three. Because stuntingmay be purely a reflection of past malnutrition, interpreting stunting data accurately thus becomes difficult. Thisstudy conforms to these new trends in nutritional measurement (GSS 1994; Beaton 1993).
maxwell chap02 5/9/0 8:31 PM Page 14
minimum required sample size as 36 households in 16 enumeration areas,for a totalof 576 households. The same sample size was adequate to estimate the prevalenceof malnutrition with a precision of plus or minus 3 percent.
No listings of households were available for the enumeration areas,so the studyteam conducted a census of all households within selected blocks. The final samplesize was 559 households distributed among 16 primary sampling units. For manyvariables,however, only 556 observations were available, and this value was takenas the final sample size.
Conducting the Study
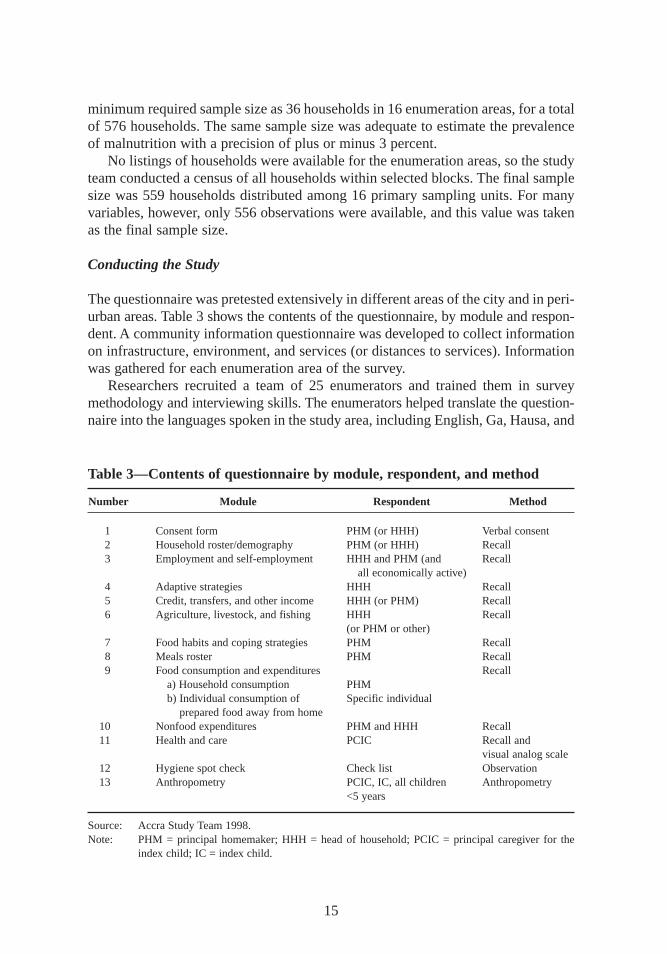
The questionnaire was pretested extensively in different areas of the city and in peri-urban areas. Table 3 shows the contents of the questionnaire, by module and respon-dent. A community information questionnaire was developed to collect informationon infrastructure, environment,and services (or distances to services). Informationwas gathered for each enumeration area of the survey.
Researchers recruited a team of 25 enumerators and trained them in surveymethodology and interviewing skills. The enumerators helped translate the question-naire into the languages spoken in the study area,including English,Ga,Hausa,and
15
Table 3—Contents of questionnaire by module, respondent,and method
Number Module Respondent Method
1 Consent form PHM (or HHH) Verbal consent2 Household roster/demography PHM (or HHH) Recall3 Employment and self-employment HHH and PHM (and Recall
all economically active)4 Adaptive strategies HHH Recall5 Credit, transfers,and other income HHH (or PHM) Recall6 Agriculture, livestock, and fishing HHH Recall
(or PHM or other)7 Food habits and coping strategies PHM Recall8 Meals roster PHM Recall9 Food consumption and expenditures Recall
a) Household consumption PHMb) Individual consumption of Specific individual
prepared food away from home10 Nonfood expenditures PHM and HHH Recall11 Health and care PCIC Recall and
visual analog scale12 Hygiene spot check Check list Observation13 Anthropometry PCIC,IC, all children Anthropometry
<5 years
Source: Accra Study Team 1998.Note: PHM = principal homemaker; HHH = head of household; PCIC = principal caregiver for the
index child; IC = index child.
maxwell chap02 5/9/0 8:31 PM Page 15
Twi. Five enumerators were selected for specialized training in anthropometricmeasurement. All were standardized to a common reference and supervised by a guestresearcher who was herself standardized to an international reference.
Training for the enumerators and pretesting for the questionnaire took place dur-ing an eight-week period in late 1996. The survey was carried out between Januaryand April 1997 (Figure 3). Questionnaires were field checked, first by the immedi-ate supervisor and subsequently by the field manager. Supervisors made randomspot checks on all enumerators each week. A double-entry system was used to min-imize data entry errors, and all discrepancies were corrected by reference to thequestionnaire.
Limita tions of the Study
The survey sample is representative of those who live in households with childrenunder three years of age. One child in each household in the 0–36 month age groupwas designated as the index child.6 As a result,the descriptive statistics reported inthis study are not necessarily representative of all households in Accra. The surveysample also did not include urban residents who do not live in households—that is,street children or the homeless population. These groups were included in the qual-itative elements of this study. Other researchers have studied most of these groups(Apt Van Ham,Blavo, and Opoku 1991).
Determining how households allocate their resources was not a major objectiveof the study. Some individual-level and gender-disaggregated data were collected,including data on gender-specific expenditure items. But a complete intrahouseholdanalysis was beyond the scope of this study and should be recognized as one of itslimitations. Likewise, given the emphasis on women as primary care providers, thisstudy provides relatively little information on the role of men.
The limited number of enumeration areas suggests that the results of the survey,while statistically representative of the city, have probably not captured its extremesof wealth and poverty. Case study results,particularly among the most vulnerablegroups,confirmed this observation. Interpretation of the survey results is limited bythe fact that these data are cross-sectional,resulting from a single round of data col-lection. The survey was timed to fall between the immediate postharvest period,when food prices are traditionally at their lowest,and the rainy season,when pricesare at their highest. Because of the timing, the consumption data represent an “av-erage” picture, but the survey results do not capture seasonality. Future surveys maybe able to capture seasonal differences in food and nutrition security, quantify therate at which income-generating activities change, and determine the seasonal im-portance of labor migration strategies.
16
6 If there was more than one child in the household under the age of three, the one whose first name is first in al-phabetical order became the index child. All children in the survey households were measured anthropometrically,but information on feeding and care practice was only collected for the index child—one per household.
maxwell chap02 5/9/0 8:31 PM Page 16
CHAPTER 3
Accra’s Households and Communities
Urban areas include a diversity of peoples, and Accra is no exception. Undersuch circumstances, households may be organized in a number of ways, and
defining the term householdcan be difficult. The classic definition of householdused for survey research in Ghana involves coresidence and consumption “from acommon pot.” This definition applies to a portion of Accra households, particularlythose in middle-class or migrant neighborhoods. However, the indigenous people ofAccra, the Ga, have a unique form of household organization. For this group, withits compound households and complex living units, researchers created a new defi-nition of household.
Ga Living Units
Despite being a small group in the overall national population, the Ga make upabout one-third of the population of the city—32 percent of the sample of this study.Kilson (1974) notes that Ga men and women traditionally live in separate houses,even after marriage, and that marriage itself is a very weak institution. Men tradi-tionally live with kinsmen from the father’s side and women with kinswomen fromthe mother’s side. In this system, children are raised in the mother’s house, and malechildren are sent to live with their fathers around the age of 10. Households (shia)“are not stable groups—they are specific to particular individuals in particularsocial contexts” (Kilson 1974, 20). Among more educated Ga, married couplescohabit. But contemporary households in low-income indigenous areas of the cityshow evidence of the same pattern Kilson noted in the 1960s (Robertson 1984; Fay-orsey 1995; Ga Mashie Study Team 1996). Fayorsey (1995, 92) notes, “The char-acteristic principle underlying Ga residential patterns is that Ga men do not livewith their wives.”
Many forces in the Ga community—some of them traditional, such as separatemale and female residences, and others contemporary, such as high male unemploy-ment and migration out of the community—have combined to create large com-pound houses in low-income indigenous communities. These households, labeled
17
maxwell chap03 5/9/0 8:30 PM Page 17
“compound matricomplexes” by Fayorsey (1995),are often headed by an elderlywoman.7
They consist mostly of adult women and their children,although some adult menmay live in a mother’s residence. A typical compound household noted during oneof the community studies consisted of 55 people sharing a compound of 8 roomswith a total area of around 350 square feet. The matriach, a Ga in her late sixties,described the basic composition of the compound:“I have children,and all my sis-ters have children,their children also have children,and our grandchildren also havedelivered, and all this constitutes our household.”
Most of the adult women in the compound shared the same income-generatingactivity—the preparation and sale of kenkey (the local staple food made of fer-mented maize dough). Both polygyny and women with children by more than oneman (although never polyandry) were noted. Men as old as 40 years live in thehouse, but only because it is their mother’s house and they have nowhere else to go.The women stated that their male children usually go to live with their fathers some-time between the ages of 8 and 15 (Ga Mashie Study Team 1996).
Income generation,consumption,and residential patterns in these households donot conform to patterns observed in households made up of nuclear families—thekind of households that predominate in Accra’s migrant communities. Smaller sub-units exist within these large compound houses,usually an adult woman and herdependent children. Sometimes these smaller units include the adult woman’shusband or partner, who might eat with this group even if he does not live with thewoman. But often the husband or partner is not considered part of the group. Whilecoresidence does not define these smaller units,shared consumption usually does.Shared consumption usually includes not only food made and eaten at home but theallocation of money for the purchase of street foods or foods prepared outside thehousehold.
The smaller units in compound households became the basis of the definitionof a Ga household for the survey, since they were defined largely in terms of con-sumption and were comparable in terms of composition to households in other areasof the city. The definition therefore became a group of people who eat from the samepot when food is prepared at home and who get money for street food from the samesource. Researchers arrived at this definition only after exploring the unique char-acteristics of these subunits.
First, while these households rely heavily on reciprocity and thus seem to havea built-in safety net within the compound, they are in many cases the locus of themost severe poverty in the city (Bortei-Doku Aryeetey and Aryeetey 1996). Second,overcrowding means that some people, while not accurately categorized as “home-less”in the usual sense of the word, do not have a permanent place where they sleep.They may sleep in shifts,and people who are part of a household may not sleep with
18
7 The result of this study confirms Fayorsey’s (1995) observations and has implications for understanding not onlythe nature of the household but also the nature of child care.
maxwell chap03 5/9/0 8:30 PM Page 18
that household at all (Ga Mashie Study Team 1996; Fayorsey 1995). For this rea-son,coresidence does not define these households.
Third, because of the heavy reliance on street foods,consumption from a com-mon pot alone is not an adequate definition of the household. This situation is fur-ther complicated by the fact that children in these households often eat somewhereother than with their mothers.8 Substantial amounts of food, money, and services(such as shared childcare) are transferred among these households. Fayorsey (1995,106) notes that
Current urban Ga households are characterized by a group of individuals en-gaged in productive activities together, but they retain the fruits of their labor[individually]. Such households are characterized by exchange rather than bya pooling together of [income]. There is,however, a great deal of reciprocity.As members of the matricomplexes,urban Ga women are expected to feed andcare for any child belonging to the matricomplex when the children’s mothersare not around. . . .
Fourth, given the very loose attachment adult men have to these households,theproportion of households headed by women is often very high. Thus women oftenhave considerable autonomy over their own activities,both productive and reproduc-tive (Fayorsey 1995; Robertson 1984). Relationships between men and women in Gasociety have changed gradually in the last half of the 20th century, largely because ofthe loss of land and the decline of traditional male livelihoods. While these changeshave given women greater independence, the situation has not necessarily improvedtheir standard of living. As has been noted, their households are among the mosteconomically disadvantaged in the city (Bortei-Doku Aryeetey and Aryeetey 1996).
What accounts for some of the differences between this category of householdand households elsewhere in Accra that conform to a more standard definition?To address this issue, researchers included questions regarding compound house-holds,migration status,and headship into the survey questionnaire. These questionspermitted researchers to analyze this category separately and to control for house-hold type in multivariate analysis.
Characteristics of Sample Households
Tables 4 through 6 provide the basic demographic characteristics of the householdsin the survey sample. A total of 196 households,or 35.1 percent of the total sample,were headed by women. Though female-headed households are only slightly smallerin size than households headed by males,they have a significantly higher depend-ency ratio, and the head herself has significantly less formal education (Table 4).Chapter 7 provides more detailed information on women’s education.
19
8 Compound houses consisting of patrilineally related kin are also common in migrant areas of Accra, especiallyin areas with large concentrations of migrants from the north of Ghana.
maxwell chap03 5/9/0 8:30 PM Page 19
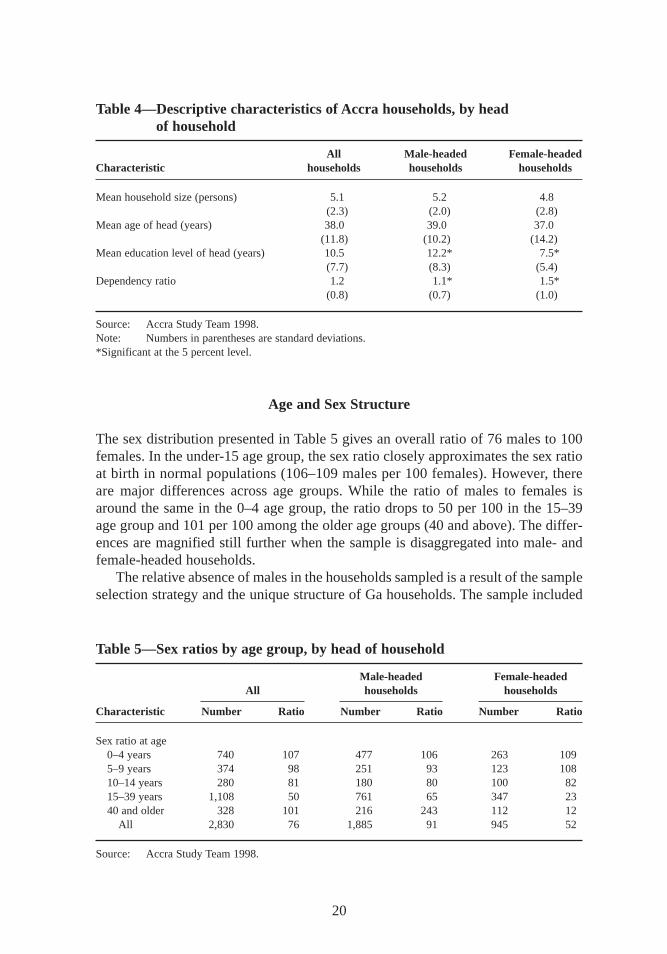
Age and Sex Structure
The sex distribution presented in Table 5 gives an overall ratio of 76 males to 100females. In the under-15 age group,the sex ratio closely approximates the sex ratioat birth in normal populations (106–109 males per 100 females). However, thereare major differences across age groups. While the ratio of males to females isaround the same in the 0–4 age group, the ratio drops to 50 per 100 in the 15–39age group and 101 per 100 among the older age groups (40 and above). The differ-ences are magnified still further when the sample is disaggregated into male- andfemale-headed households.
The relative absence of males in the households sampled is a result of the sampleselection strategy and the unique structure of Ga households. The sample included
20
Table 4—Descripti ve characteristics of Accra households,by head of household
All Male-headed Female-headedCharacteristic households households households
Mean household size (persons) 5.1 5.2 4.8(2.3) (2.0) (2.8)
Mean age of head (years) 38.0 39.0 37.0(11.8) (10.2) (14.2)
Mean education level of head (years) 10.5 12.2* 7.5*(7.7) (8.3) (5.4)
Dependency ratio 1.2 1.1* 1.5*(0.8) (0.7) (1.0)
Source: Accra Study Team 1998.Note: Numbers in parentheses are standard deviations.*Significant at the 5 percent level.
Table 5—Sex ratios by age group, by head of household
Male-headed Female-headedAll households households
Characteristic Number Ratio Number Ratio Number Ratio
Sex ratio at age0–4 years 740 107 477 106 263 1095–9 years 374 98 251 93 123 10810–14 years 280 81 180 80 100 8215–39 years 1,108 50 761 65 347 2340 and older 328 101 216 243 112 12
All 2,830 76 1,885 91 945 52
Source: Accra Study Team 1998.
maxwell chap03 5/9/0 8:30 PM Page 20
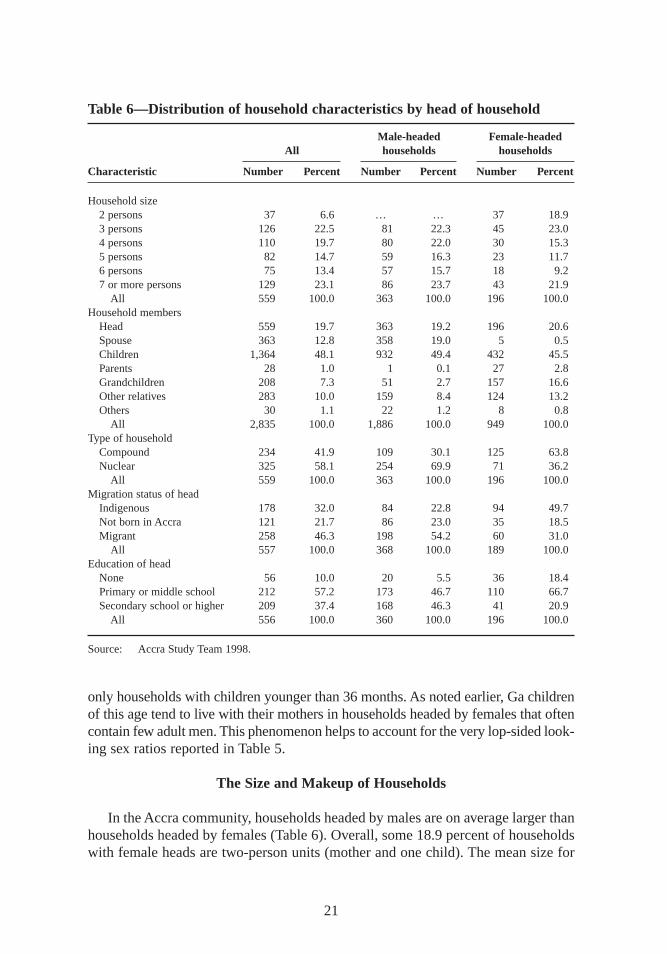
only households with children younger than 36 months. As noted earlier, Ga childrenof this age tend to live with their mothers in households headed by females that oftencontain few adult men. This phenomenon helps to account for the very lop-sided look-ing sex ratios reported in Table 5.
The Size and Makeup of Households
In the Accra community, households headed by males are on average larger thanhouseholds headed by females (Table 6). Overall, some 18.9 percent of householdswith female heads are two-person units (mother and one child). The mean size for
21
Table 6—Distribution of household characteristics by head of household
Male-headed Female-headedAll households households
Characteristic Number Percent Number Percent Number Percent
Household size2 persons 37 6.6 … … 37 18.93 persons 126 22.5 81 22.3 45 23.04 persons 110 19.7 80 22.0 30 15.35 persons 82 14.7 59 16.3 23 11.76 persons 75 13.4 57 15.7 18 9.27 or more persons 129 23.1 86 23.7 43 21.9
All 559 100.0 363 100.0 196 100.0Household members
Head 559 19.7 363 19.2 196 20.6Spouse 363 12.8 358 19.0 5 0.5Children 1,364 48.1 932 49.4 432 45.5Parents 28 1.0 1 0.1 27 2.8Grandchildren 208 7.3 51 2.7 157 16.6Other relatives 283 10.0 159 8.4 124 13.2Others 30 1.1 22 1.2 8 0.8
All 2,835 100.0 1,886 100.0 949 100.0Type of household
Compound 234 41.9 109 30.1 125 63.8Nuclear 325 58.1 254 69.9 71 36.2
All 559 100.0 363 100.0 196 100.0Migration status of head
Indigenous 178 32.0 84 22.8 94 49.7Not born in Accra 121 21.7 86 23.0 35 18.5Migrant 258 46.3 198 54.2 60 31.0
All 557 100.0 368 100.0 189 100.0Education of head
None 56 10.0 20 5.5 36 18.4Primary or middle school 212 57.2 173 46.7 110 66.7Secondary school or higher 209 37.4 168 46.3 41 20.9
All 556 100.0 360 100.0 196 100.0
Source: Accra Study Team 1998.
maxwell chap03 5/9/0 8:30 PM Page 21
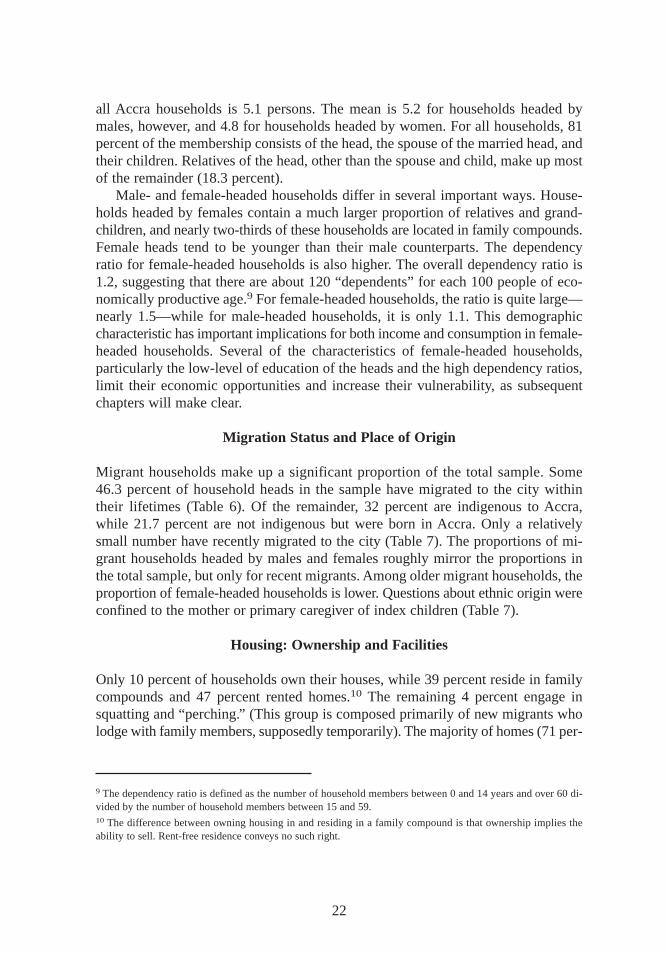
all Accra households is 5.1 persons. The mean is 5.2 for households headed bymales,however, and 4.8 for households headed by women. For all households,81percent of the membership consists of the head, the spouse of the married head, andtheir children. Relatives of the head, other than the spouse and child, make up mostof the remainder (18.3 percent).
Male- and female-headed households differ in several important ways. House-holds headed by females contain a much larger proportion of relatives and grand-children,and nearly two-thirds of these households are located in family compounds.Female heads tend to be younger than their male counterparts. The dependencyratio for female-headed households is also higher. The overall dependency ratio is1.2, suggesting that there are about 120 “dependents”for each 100 people of eco-nomically productive age.9 For female-headed households,the ratio is quite large—nearly 1.5—while for male-headed households,it is only 1.1. This demographiccharacteristic has important implications for both income and consumption in female-headed households. Several of the characteristics of female-headed households,particularly the low-level of education of the heads and the high dependency ratios,limit their economic opportunities and increase their vulnerability, as subsequentchapters will make clear.
Migration Status and Place of Origin
Migrant households make up a significant proportion of the total sample. Some46.3 percent of household heads in the sample have migrated to the city withintheir lif etimes (Table 6). Of the remainder, 32 percent are indigenous to Accra,while 21.7 percent are not indigenous but were born in Accra. Only a relativelysmall number have recently migrated to the city (Table 7). The proportions of mi-grant households headed by males and females roughly mirror the proportions inthe total sample, but only for recent migrants. Among older migrant households,theproportion of female-headed households is lower. Questions about ethnic origin wereconfined to the mother or primary caregiver of index children (Table 7).
Housing: Ownership and Facilities
Only 10 percent of households own their houses,while 39 percent reside in familycompounds and 47 percent rented homes.10 The remaining 4 percent engage insquatting and “perching.” (This group is composed primarily of new migrants wholodge with family members,supposedly temporarily). The majority of homes (71 per-
22
9 The dependency ratio is defined as the number of household members between 0 and 14 years and over 60 di-vided by the number of household members between 15 and 59.10 The difference between owning housing in and residing in a family compound is that ownership implies theability to sell. Rent-free residence conveys no such right.
maxwell chap03 5/9/0 8:30 PM Page 22
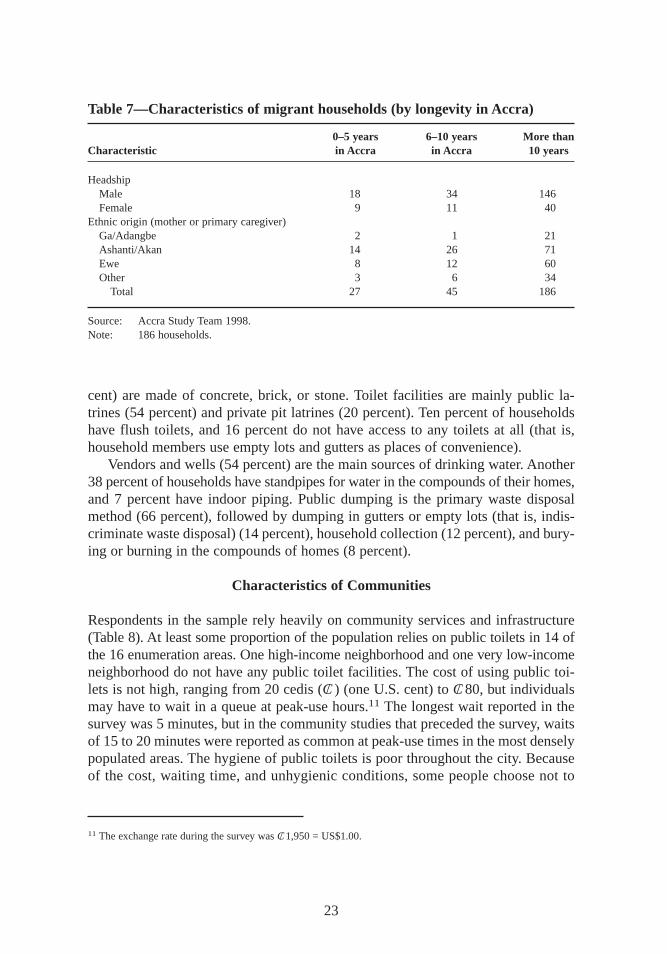
cent) are made of concrete, brick, or stone. Toilet facilities are mainly public la-trines (54 percent) and private pit latrines (20 percent). Ten percent of householdshave flush toilets,and 16 percent do not have access to any toilets at all (that is,household members use empty lots and gutters as places of convenience).
Vendors and wells (54 percent) are the main sources of drinking water. Another38 percent of households have standpipes for water in the compounds of their homes,and 7 percent have indoor piping. Public dumping is the primary waste disposalmethod (66 percent),followed by dumping in gutters or empty lots (that is, indis-criminate waste disposal) (14 percent),household collection (12 percent),and bury-ing or burning in the compounds of homes (8 percent).
Characteristics of Communities
Respondents in the sample rely heavily on community services and infrastructure(Table 8). At least some proportion of the population relies on public toilets in 14 ofthe 16 enumeration areas. One high-income neighborhood and one very low-incomeneighborhood do not have any public toilet facilities. The cost of using public toi-lets is not high,ranging from 20 cedis (C/ ) (one U.S. cent) to C/ 80, but individualsmay have to wait in a queue at peak-use hours.11 The longest wait reported in thesurvey was 5 minutes,but in the community studies that preceded the survey, waitsof 15 to 20 minutes were reported as common at peak-use times in the most denselypopulated areas. The hygiene of public toilets is poor throughout the city. Becauseof the cost,waiting time, and unhygienic conditions,some people choose not to
23
Table 7—Characteristics of migrant households (by longevity in Accra)
0–5 years 6–10 years Mor e thanCharacteristic in Accra in Accra 10 years
HeadshipMale 18 34 146Female 9 11 40
Ethnic origin (mother or primary caregiver)Ga/Adangbe 2 1 21Ashanti/Akan 14 26 71Ewe 8 12 60Other 3 6 34
Total 27 45 186
Source: Accra Study Team 1998.Note: 186 households.
11 The exchange rate during the survey was C/ 1,950 = US$1.00.
maxwell chap03 5/9/0 8:30 PM Page 23
use public facilities and defecate in the open. This phenomenon was reported in 9of 16 enumeration areas.
Refuse was removed regularly in only about half the enumeration areas,and inall cases,the municipality or local authority was responsible for collecting and dis-posing of the refuse. Indiscriminate dumping of solid waste was noted in 12 enu-meration areas. The surface drains were clogged with solid waste and other refusein 8 locations. Even though the survey was carried out during the dry season,whenAccra experiences only minor showers,researchers noted stagnant standing surfacewater in 9 enumeration areas.
Piped water was available in all except the peri-urban location. There, peopleeither had to rely on rain or well water or have water brought from Accra by tanker.Even though piped water was available in other areas,its cost varied from as low asC/ 20 per bucket to as much as C/ 100 per bucket. The cost in the peri-urban area wasC/ 200 per bucket. The distance to a government clinic varied from a few hundredmeters to 7 kilometers.
In general, low-income, high-density neighborhoods have poorer services andinfrastructure than neighborhoods with higher incomes,but the pattern is highlyvariable (Table 8). For the two middle-income quartiles, infrastructure and theprovision of services (as well as median income) vary little. The cost of water is
24
Table 8—Services and infrastructure by enumeration area grouping
Number of Number of public Distance toEnumeration enumerator toilets within a Cost of a bucket governmentarea grouping areas 10-minute walk of water polyclinic
(cedis) (kilometers)
Income quartilea
1 4 1.5 79 3.02 4 2.5 23 0.83 4 2.0 36 0.84 3 2.3 30 2.3
Population densityLow 1 2.0 200 0.5Medium 3 1.0 35 2.8High 11 2.4 30 1.5
Predominant populationIndigenous 5 2.0 34 1.4Mixed 5 2.2 62 1.6Migrant 5 2.0 31 2.0
Entire sample 15 2.1 42 1.7
Source: Accra Study Team 1998.Note: Information for one enumeration area,an upper-income quartile residential estate, is not included
in this table, because much of it was not applicable. The area does not have public toilets,noris water sold by the bucket. Refuse is regularly removed, and the nearest government polyclinicis roughly 4 kilometers away.
a Quartiles are based on median household income for the entire enumeration area.
maxwell chap03 5/9/0 8:30 PM Page 24

skewed strongly by the high price in the peri-urban enumeration area,where nopipe-borne water is available because the area is so remote. Discounting this onearea makes the cost of water much more homogeneous across all categories. Andwhile there are more public toilets in low-income, high-density neighborhoods,thepopulation relying on these facilities is much larger.
These are the conditions that residents of these areas of Accra face every day.The next chapter shows how they conduct their lives under these conditions.
25
maxwell chap03 5/9/0 8:30 PM Page 25
CHAPTER 4
Urban Livelihoods: Activities,Income, Shocks, and Coping
Livelihoods in African cities no longer revolve primarily around wage-earningjobs in the formal or government and parastatal sectors of the economy. In-
creasingly people earn their living from informal wage labor or self-employment(ILO 1990a; 1990b). Livelihoods in Accra are limited to a fairly narrow range ofactivities, but these activities may be combined in complex ways and are sometimesshort lived. For this reason, characterizing livelihood “systems” at the householdlevel can be difficult, except with reference to the primary activity of the main in-come earner.
The livelihoods described in this study are largely labor based. While labor isundoubtedly the most important livelihood asset, several factors enhance its useful-ness: education and skills, health and the ability to work, and social relations. Otherdemands on labor, particularly the domestic duties of women, force a trade-off be-tween the amount of time that can be devoted to income-generating activities andthe time required for other responsibilities. Reciprocal exchange (of cash and in-kindgoods and services) plays an important role in supplementing and even replacinglabor-based income-generating activities. Other social relations (the extended family,social networks, and so forth), play important roles, both in finding and maintainingemployment and in coping with crises.
The economic crisis of the 1970s and structural adjustment policies in the 1980shave steadily eroded real income from wage labor and made finding wage employ-ment difficult (Alderman and Shively 1996). The decline in real urban wages re-mained roughly the same from 1977 to 1983 in the formal private, public, and in-formal sectors. But wages rebounded more quickly in the formal and public sectorsonce structural reforms began in 1983. Informal sector wages and returns to self-employment increased briefly in the late 1980s, then dropped again in real terms inthe early 1990s (Sarris 1993). Low financial assets and a lack of access to credit alsolimit the self-employment opportunities and small business activities. Householdsand individuals have responded by diversifying their income sources as much aspossible (Bortei-Doku Aryeetey and Aryeetey 1996; Brydon and Legge 1996; Ga
26
maxwell chap04 5/9/0 8:30 PM Page 26
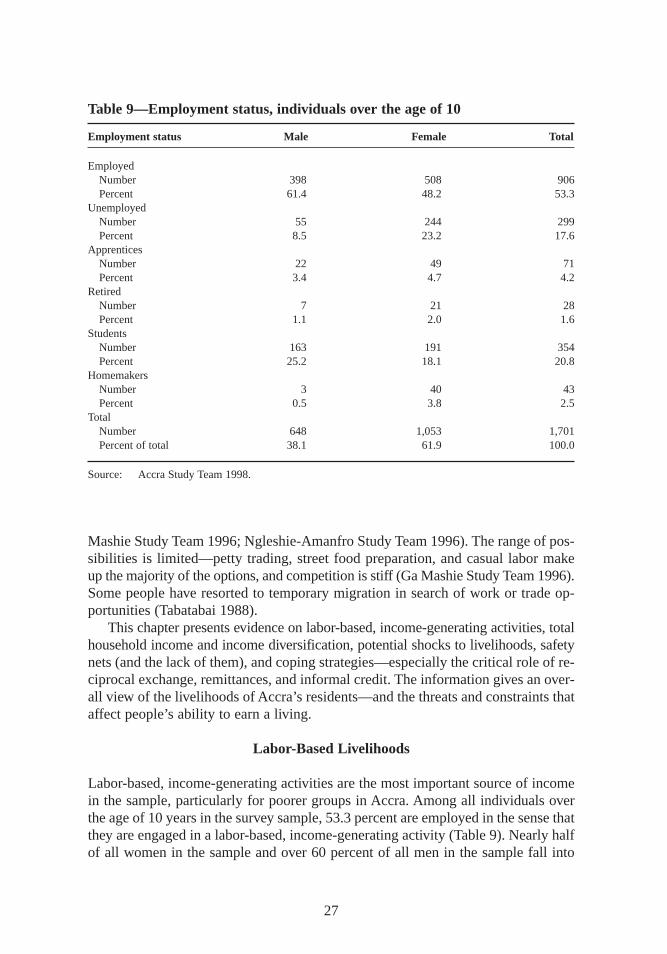
Mashie Study Team 1996; Ngleshie-Amanfro Study Team 1996). The range of pos-sibilities is limited—petty trading, street food preparation, and casual labor makeup the majority of the options,and competition is stiff (Ga Mashie Study Team 1996).Some people have resorted to temporary migration in search of work or trade op-portunities (Tabatabai 1988).
This chapter presents evidence on labor-based, income-generating activities, totalhousehold income and income diversification, potential shocks to livelihoods,safetynets (and the lack of them),and coping strategies—especially the critical role of re-ciprocal exchange, remittances,and informal credit. The information gives an over-all view of the livelihoods of Accra’s residents—and the threats and constraints thataffect people’s ability to earn a living.
Labor-Based Livelihoods
Labor-based, income-generating activities are the most important source of incomein the sample, particularly for poorer groups in Accra. Among all individuals overthe age of 10 years in the survey sample, 53.3 percent are employed in the sense thatthey are engaged in a labor-based, income-generating activity (Table 9). Nearly halfof all women in the sample and over 60 percent of all men in the sample fall into
27
Table 9—Employment status, individuals over the age of 10
Employment status Male Female Total
EmployedNumber 398 508 906Percent 61.4 48.2 53.3
UnemployedNumber 55 244 299Percent 8.5 23.2 17.6
ApprenticesNumber 22 49 71Percent 3.4 4.7 4.2
RetiredNumber 7 21 28Percent 1.1 2.0 1.6
StudentsNumber 163 191 354Percent 25.2 18.1 20.8
HomemakersNumber 3 40 43Percent 0.5 3.8 2.5
TotalNumber 648 1,053 1,701Percent of total 38.1 61.9 100.0
Source: Accra Study Team 1998.
maxwell chap04 5/9/0 8:30 PM Page 27
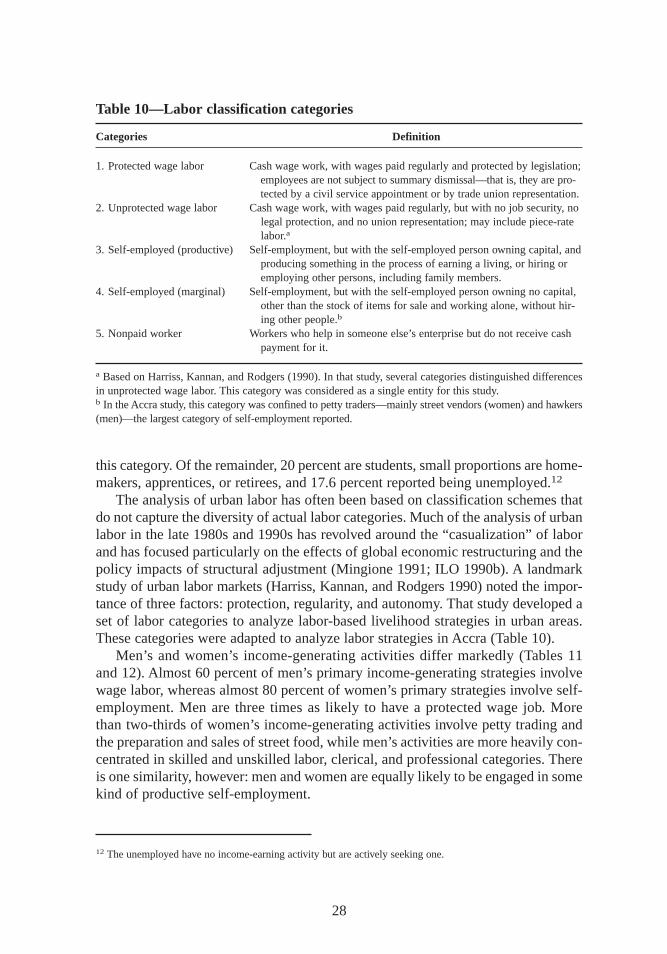
this category. Of the remainder, 20 percent are students,small proportions are home-makers,apprentices,or retirees,and 17.6 percent reported being unemployed.12
The analysis of urban labor has often been based on classification schemes thatdo not capture the diversity of actual labor categories. Much of the analysis of urbanlabor in the late 1980s and 1990s has revolved around the “casualization” of laborand has focused particularly on the effects of global economic restructuring and thepolicy impacts of structural adjustment (Mingione 1991; ILO 1990b). A landmarkstudy of urban labor markets (Harriss,Kannan,and Rodgers 1990) noted the impor-tance of three factors: protection,regularity, and autonomy. That study developed aset of labor categories to analyze labor-based livelihood strategies in urban areas.These categories were adapted to analyze labor strategies in Accra (Table 10).
Men’s and women’s income-generating activities differ markedly (Tables 11and 12). Almost 60 percent of men’s primary income-generating strategies involvewage labor, whereas almost 80 percent of women’s primary strategies involve self-employment. Men are three times as likely to have a protected wage job. Morethan two-thirds of women’s income-generating activities involve petty trading andthe preparation and sales of street food, while men’s activities are more heavily con-centrated in skilled and unskilled labor, clerical, and professional categories. Thereis one similarity, however:men and women are equally likely to be engaged in somekind of productive self-employment.
28
Table 10—Labor classification categories
Categories Definition
1. Protected wage labor Cash wage work, with wages paid regularly and protected by legislation;employees are not subject to summary dismissal—that is, they are pro-tected by a civil service appointment or by trade union representation.
2. Unprotected wage labor Cash wage work, with wages paid regularly, but with no job security, nolegal protection,and no union representation; may include piece-ratelabor.a
3. Self-employed (productive) Self-employment,but with the self-employed person owning capital, andproducing something in the process of earning a living, or hiring oremploying other persons,including family members.
4. Self-employed (marginal) Self-employment,but with the self-employed person owning no capital,other than the stock of items for sale and working alone, without hir-ing other people.b
5. Nonpaid worker Workers who help in someone else’s enterprise but do not receive cash payment for it.
a Based on Harriss,Kannan,and Rodgers (1990). In that study, several categories distinguished differencesin unprotected wage labor. This category was considered as a single entity for this study.b In the Accra study, this category was confined to petty traders—mainly street vendors (women) and hawkers(men)—the largest category of self-employment reported.
12 The unemployed have no income-earning activity but are actively seeking one.
maxwell chap04 5/9/0 8:30 PM Page 28
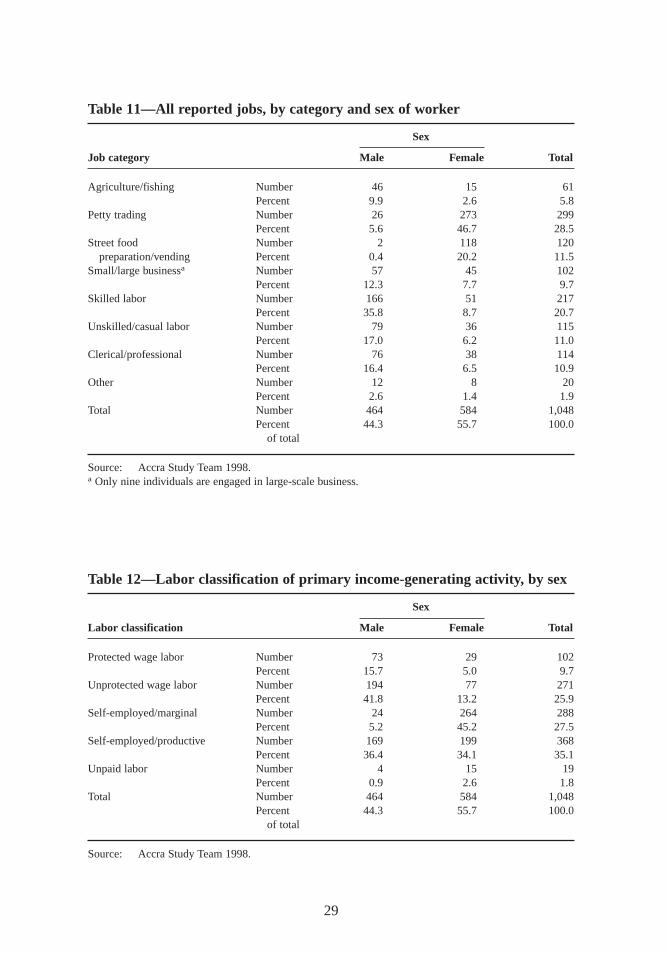
29
Table 11—All reported jobs,by category and sex of worker
Sex
Job category Male Female Total
Agriculture/fishing Number 46 15 61Percent 9.9 2.6 5.8
Petty trading Number 26 273 299Percent 5.6 46.7 28.5
Street food Number 2 118 120preparation/vending Percent 0.4 20.2 11.5
Small/large businessa Number 57 45 102Percent 12.3 7.7 9.7
Skilled labor Number 166 51 217Percent 35.8 8.7 20.7
Unskilled/casual labor Number 79 36 115Percent 17.0 6.2 11.0
Clerical/professional Number 76 38 114Percent 16.4 6.5 10.9
Other Number 12 8 20Percent 2.6 1.4 1.9
Total Number 464 584 1,048Percent 44.3 55.7 100.0
of total
Source: Accra Study Team 1998.a Only nine individuals are engaged in large-scale business.
Table 12—Labor classification of pr imary income-generating activity, by sex
Sex
Labor classification Male Female Total
Protected wage labor Number 73 29 102Percent 15.7 5.0 9.7
Unprotected wage labor Number 194 77 271Percent 41.8 13.2 25.9
Self-employed/marginal Number 24 264 288Percent 5.2 45.2 27.5
Self-employed/productive Number 169 199 368Percent 36.4 34.1 35.1
Unpaid labor Number 4 15 19Percent 0.9 2.6 1.8
Total Number 464 584 1,048Percent 44.3 55.7 100.0
of total
Source: Accra Study Team 1998.
maxwell chap04 5/9/0 8:30 PM Page 29
Data from Table 13 can be used to calculate the proportions of people engagedin informal and formal work, providing a means of verifying the growing trend to-ward informal sector employment noted in Chapter 1.13 The calculations assumethat large-scale businesses fall in the formal sector and small-scale businesses in theinformal sector, so that the ratio of informal to formal workers in this sample isroughly seven to one.14 Thus the study confirms the trend toward informal economicactivities noted in Chapter 1.
Urban and Peri-Urban Agricultural Livelihoods
Much of the recent literature on food and livelihood security in Afr ican cities andthe determinants of urban malnutrition has been concerned with the question of urbanagriculture (Smit,Nasr, and Ratta 1996; Maxwell 1995; Mougeot 1994; Rogerson1993; Sawio 1993). This literature notes that surprisingly high proportions of urbanpopulations—20 to 50 percent in some cases—engage in farming and keep live-stock in the city. Women do most of this agricultural work and receive most of thefinancial benefits from it (Sawio 1993; Freeman 1991). Recent research in Afr icancities has shown a positive association between urban farming and both householdfood security (Mwangi 1995) and the nutritional status of preschool children (Max-well, Levin, and Csete 1999).
In Accra itself, fewer than 6 percent of individuals (or about 15 percent of house-holds) engage in any kind of agricultural production. When they do,they generallykeep a few animals as a form of liquefiable assets,not for subsistence consumptionor to provide a regular flow of cash income. While both men and women keep live-stock, men dominate most other forms of farming in Accra. Urban production is re-sponsible for a substantial proportion of the city’s fresh vegetables,but it is mainlythe wealthier classes that benefit from this production (CENCOSAD 1994).15
In the peri-urban area,a much higher proportion of the population depends onagriculture (Ngleshie-Amanfro Study Team 1996; Maxwell et al. 1998). But the
30
13 The term informal sectoris used here only as a general descriptive term, not as an analytical category. Much de-bate has gone into the definition of the informal sector or economy. Most of the resulting definitions revolve aroundthe extent to which the state is able to tax and regulate such activities (ILO 1972; Leys 1975; O’Connor 1983;Portes,Castells,and Benton 1989). In the late 1980s and early 1990s,many of these activities eluded regulation,and some of them still do. But regulation and taxation do little to improve working conditions,protect labor, helpenterprises grow and become sustainable, or improve access to production credit—other defining characteristics.For the purposes of this study, labor categories will be analyzed according to the classification scheme in Table 10and without reference to any formal definition of the informal economy.14 In 1980 the ratio was two to one, and by 1990 it was five to one (ISSER 1995). This ratio was calculated by tak-ing all the labor in the protected wage class,large-scale business as well as persons self-employed in clerical andprofessional work, and considering this group as formal sector labor, or the denominator of the above ratio. Every-one else was counted in the numerator. However, this somewhat arbitrary designation of one classification to theformal sector and others to the informal sector points out the deficiency of using the informal sector as an analyt-ical category.15 For a more complete picture of urban agriculture in Accra, see Armar-Klemesu and Maxwell (1998). For a de-tailed analysis of the impact of urbanization on peri-urban agriculture, see Maxwell et al. (1998).
maxwell chap04 5/9/0 8:30 PM Page 30
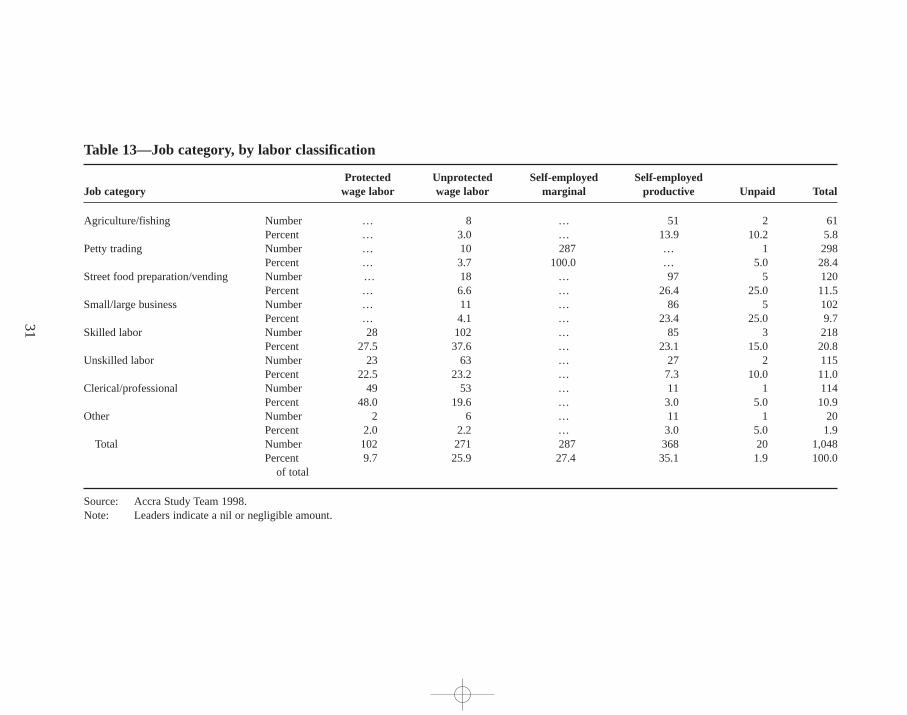
31
Table 13—Job category, by labor classification
Protected Unprotected Self-employed Self-employedJob category wage labor wage labor marginal productive Unpaid Total
Agriculture/fishing Number … 8 … 51 2 61Percent … 3.0 … 13.9 10.2 5.8
Petty trading Number … 10 287 … 1 298Percent … 3.7 100.0 … 5.0 28.4
Street food preparation/vending Number … 18 … 97 5 120Percent … 6.6 … 26.4 25.0 11.5
Small/large business Number … 11 … 86 5 102Percent … 4.1 … 23.4 25.0 9.7
Skilled labor Number 28 102 … 85 3 218Percent 27.5 37.6 … 23.1 15.0 20.8
Unskilled labor Number 23 63 … 27 2 115Percent 22.5 23.2 … 7.3 10.0 11.0
Clerical/professional Number 49 53 … 11 1 114Percent 48.0 19.6 … 3.0 5.0 10.9
Other Number 2 6 … 11 1 20Percent 2.0 2.2 … 3.0 5.0 1.9
Total Number 102 271 287 368 20 1,048Percent 9.7 25.9 27.4 35.1 1.9 100.0
of total
Source: Accra Study Team 1998.Note: Leaders indicate a nil or negligible amount.
maxw
ell ch
ap04 5
/9/0
8:3
0 P
M P
age 3
1
amount of land available for farming is rapidly being lost as the city expands. Some2,000 to 3,000 hectares are lost each year in the Ga District alone (Larbi 1995). Thedestruction of large swathes of land in the Ga District, where sand and stone aremined for construction,further reduces available farmland in Accra. The authoritiescondone some of this sand mining and quarrying because it provides employment,at least in the short term. However, in the long term, it destroys the resource base ofthe dominant livelihood in peri-urban areas (Maxwell et al. 1998). While womenand men are equally likely to lose land for agricultural production as a result of thisprocess,women have fewer livelihood alternatives and thus are more likely to losetheir primary income source when farmland is destroyed.
Multiple Income-Generating Activities
Qualitative and case study findings emphasize the importance of diversifying in-come sources at both the individual and household level in order to reduce risk inthe urban economic environment. A relatively small proportion of individuals in thesurvey sample had engaged in multiple income-generating activities in the 30 daysprior to the survey. A total of 124 individuals had engaged in at least two income-generating activities,and 10 had engaged in three such activities. Approximately thesame number of men and women engaged in secondary activities, but the smallgroup engaging in three activities was mostly women.
However, these findings include only activities from the 30 days prior to the sur-vey. Qualitative information from case studies shows that an individual may engagein as many as seven or eight different income-generating activities a year. In gen-eral individuals pursue wage labor strategies when possible but engage in petty trad-ing or other activities when circumstances permit (or require) it. Young single menare most likely to engage in multiple income-generating activities throughout theyear, probably because they have the flexibility to be able to exploit multiple op-portunities. Women with children have a much more difficult time pursuing such astrategy.
Despite their attempts to diversify income sources,individuals had only limitedsuccess in doing so within the last 30 days. Again,however, these data reflect only a30-day recall,and qualitative evidence indicates greater diversification over a longerperiod. Further, these activities are not the only source of income.
At the household level, there is more evidence of multiple income-generatingactivities,and multiple activities at this level are more important to income diversi-fication and protection against the risk of losing an income source. Roughly two-thirds of households in the sample reported that members had engaged in at leasttwo types of income-generating activities in the previous 30 days.
In 37 households,no members had engaged in any income-generating activitiesin the recall period, and virtually all of these (33) were female-headed households.While this finding could be interpreted as an indication of extremely dire circum-stances in other places,in Accra it is partially a result of the household structure of
32
maxwell chap04 5/9/0 8:30 PM Page 32
indigenous communities. The majority (22) of these households are headed bywomen indigenous to Accra,and their main source of income is through remittances,not labor. A complete reliance on remittance income, while not necessarily an indi-cator of poverty, is certainly an indicator of income vulnerability, given the highincidence of unemployment among men in the indigenous communities and thesometimes erratic support they are able to provide (Ga Mashie Study Team 1996).In about three-quarters of households,however, a woman is engaged in at least oneof the income-generating, labor-based activities.
The average number of income-generating activities per household for the wholesample is 1.87 (Table 14). Female-headed households have a significantly lower num-ber of income-generating activities (1.49) than male-headed households (2.08).Male-headed households utilize the labor they have more completely than female-headed households. Migrant households have a significantly higher number ofincome-generating activities than indigenous households.
Livelihoods under Threat
Livelihoods in the greater Accra area have been under pressure from various sources.First, the traditional livelihoods of the indigenous people—farming and fishing—have been in decline for years as the city expands into farmland and motorizedtrawler fleets from Tema deplete coastal fish stocks. In peri-urban areas,agricultureis declining rapidly owing to the competition for land use mentioned earlier andto environmental degradation and climatic changes (Ngleshie-Amanfro Study Team1996).
Second, macroeconomic policies have affected urban livelihoods in several ways.Since the late 1980s,the redeployment of civil servants has put 60,000 middle-income government employees—and an unspecified number in the parastatal sec-tor—out of work.16 Not all of these redeployments have been in Accra,and not allthose who lived in Accra at the time they were redeployed stayed there. But thisgroup is still believed to be large in the city (Bortei-Doku Aryeetey and Aryeetey1996). The sustained high rate of inflation—the result of policy failure—makes ac-cess to formal credit difficult. Lack of credit in turn constrains the development andgrowth of the small enterprises on which the vast majority of Accra’s residents de-pend (ISSER 1997). Presurvey focus groups repeatedly mentioned lack of access tocredit as a major constraint to livelihood activities but reported widespread use ofinformal credit.
Third, rapid population growth (particularly the migration of people of econom-ically active ages) has meant that the number of people seeking jobs is expandingmuch faster than growth in the labor market. As a result,people have few options
33
16 Redeploymentmeans involuntary retirements and layoffs in the civil service or parastatals. The redeploymentexercise finally came to an end in early 1998.
maxwell chap04 5/9/0 8:30 PM Page 33
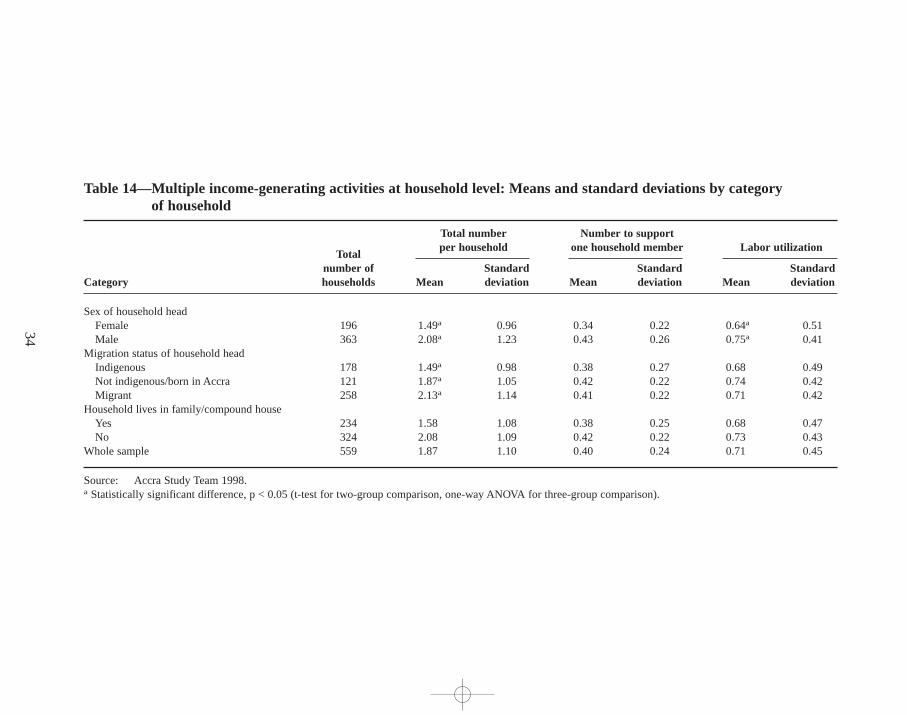
34
Table 14—Multiple income-generating activities at household level: Means and standard deviations by category of household
Total number Number to supportper household one household member Labor utiliza tion
Totalnumber of Standard Standard Standard
Category households Mean deviation Mean deviation Mean deviation
Sex of household headFemale 196 1.49a 0.96 0.34 0.22 0.64a 0.51Male 363 2.08a 1.23 0.43 0.26 0.75a 0.41
Migration status of household headIndigenous 178 1.49a 0.98 0.38 0.27 0.68 0.49Not indigenous/born in Accra 121 1.87a 1.05 0.42 0.22 0.74 0.42Migrant 258 2.13a 1.14 0.41 0.22 0.71 0.42
Household lives in family/compound houseYes 234 1.58 1.08 0.38 0.25 0.68 0.47No 324 2.08 1.09 0.42 0.22 0.73 0.43
Whole sample 559 1.87 1.10 0.40 0.24 0.71 0.45
Source: Accra Study Team 1998.a Statistically significant difference, p < 0.05 (t-test for two-group comparison,one-way ANOVA for three-group comparison).
maxw
ell ch
ap04 5
/9/0
8:3
0 P
M P
age 3
4
other than the limited livelihoods offered by the informal sector. This rapid growthin informal livelihoods is a double-edged sword. On the one hand, the rapid growthof the informal economy—estimated at 5.5 percent per year in the late 1980s andearly 1990s—is a sign of its strength (Baah-Nuakoh 1996). On the other hand, whilethe number of people engaged in these activities may have grown at this rate, littleevidence exists to show that the markets these activities serve have also grown. Thisasymmetry has reduced profit margins in the informal economy and forced manyentrepreneurs to scale down their enterprises (Norton et al. 1995; Ga Mashie StudyTeam 1996).
Fourth, physical crowding has led to problems with the city government,whichtries to keep streets and sidewalks in the downtown area clear of informal traders,removing traders forcibly if necessary. Petty street traders risk losing their stock—which often constitutes their entire working capital—if attacked by the municpaltask force. These operations by the municipal task force—known by the vernacularas abaieeare not a daily occurrence but are frequent enough to constitute a realthreat to informal trading, one of the most common livelihoods in the city, espe-cially in the central business district (Ga Mashie Study Team 1996). The threat hasprompted the formation of associations to protect the interests of informal traders,and some reforms have been implemented. The city has also constructed some newmarkets on the outskirts of Accra in an attempt to lure petty traders out of the con-gested downtown area. But many of the new markets are poorly situated in areaswith few customers and now stand mostly empty.
Conflicts over the presence of more and more informal activities on the streetsof the central business district of Accra—virtually all of them revolving around pettytrade—have developed into one of the most urgent policy issues facing the munic-ipal authorities. So severe has the congestion become that it has begun to block en-trances to markets and shops,creating an outcry from established market tradersand shop owners (Aforo 1997). The city’s inability to tax petty traders,despite theirproliferation on city streets,has exacerbated the situation.
Given the prevalence of petty trade, and the fact that it is the livelihood of lastresort for many low-income residents (particularly women),resolving these con-flicts through peaceful means is key to preserving this income source for many inAccra.17 But the nature of the conflicting interests among the various parties in-volved—the city, petty traders, established market vendors and shop owners, andeven the state—tends to make for a protracted problem. The city’s booming popu-lation, especially among low-income groups,only makes the situation worse. Andthe brute force the city sometimes uses to clear the streets of traders only generatesbad publicity f or the authorities.
35
17 The livelihoods of the lowest-income groups are the targets of municipal authorities in many cities, not justAccra. Further, this problem is just one the authorities face as they try to make the city more attractive for invest-ment. See, for example, Becker, Jamer, and Morrison (1994) and Hardoy and Satterthwaite (1986).
maxwell chap04 5/9/0 8:30 PM Page 35
Income Levels and Sources
For purposes of the study, income includes not only earned income but unearned in-come from the sale of property or other consumer durable goods,pensions or othergovernment transfers,net income from gifts and remittances,lottery winnings,andsavings and net borrowing or lending. Average monthly income for households inthe lowest expenditure group is less than one-third of the average monthly incomefor households in the highest expenditure group (Table 15). Households with an un-employed head report the lowest monthly incomes. Among households whose mem-bers have classified occupations, professionals have significantly higher incomesthan petty traders,street food vendors,and laborers. There are no significant differ-ences in income levels across migration status.
Average monthly income is significantly higher for male-headed households thanfor female-headed households. Previous research in Ghana has shown that house-holds headed by married women may have levels of welfare comparable to thoseof male-headed households and that households headed by divorced and widowedwomen are more disadvantaged than others (Lloyd and Gage-Brandon 1993).18 InAccra, female-headed households are a heterogenous group in terms of familystructure (Table 6), occupation (Table 11),and income level. Despite these differ-ences,female-headed households are overrepresented in the lower-income groups.While female-headed households account for 35 percent of the total sample, theyaccount for over 40 percent of households in the lowest income quintile and only23 percent of the households in the highest income quintile (Levin et al. 1999).
Total monthly household income from both small- and large-scale businesses issurprisingly low. Cases in which total household income was negative during the30-day recall period reduced these amounts (and to a lesser degree income fromstreet vending, petty trading, and professional occupations).19 These results may berelated to two phenomena associated with collecting household income data. First,relatively wealthy households may be underreporting their income.20 Of the 180households with negative net returns for one or more income source, 50 percentwere from the two quintiles with the highest expenditure. Average monthly house-hold income for these 180 households was C/ 171,229 per month,which is onlyslightly lower than the average monthly household income for the entire sample.
36
18 Unfortunately, this study was not able to look at variations in income levels by marital status of household heads,since information on marital status was collected only for the primary caregiver of the index child. However, amongcaregivers,only 6.5 percent were separated, divorced, or widowed.19A total of 180 households (32 percent of the total sample) had negative returns for one or more of the six sourcesof income listed in Table 15. Among these, 30 percent of the households were skilled laborers; 17 percent wereprofessionals; 17 percent were petty traders; and 16 percent were engaged in small- or large-scale business. Forthese households,business and labor expenses were greater than income received for the past 30 days.20 Sensitive information, such as household income, is difficult to collect for a number of social,cultural, and eco-nomic reasons (Rozelle 1991; Christiansen 1993). In this study, some respondents did not feel comfortable reveal-ing their true incomes.
maxwell chap04 5/9/0 8:30 PM Page 36
Second, households may also report negative returns because the recall period of 30days, which corresponds to a regular pay cycle for wage earners, does not capturethe income flows for self-employed households operating home-based enterprisesor engaged in petty trading or street food vending.
A third reason for negative income sources is related to the definition of house-hold income. Unearned household income includes interhousehold transfers com-prisedof net transfers of gifts and net borrowing and lending. A number of house-holds were net donors or net lenders (transfers out or the amount lent to othersexceeded transfers in or the amount borrowed) and thus had negative income for theshare of income from gifts, remittances,and loans.
Household Income Sources
The pattern of income by occupation group shows that while the largest share ofincome in most households comes from one source, it is insufficient to meet thehousehold’s total consumption requirements (Table 15). Therefore, additional in-come comes from a number of different sources,even among better-off householdsworking as professionals and skilled laborers. Households engaged in activitieswith the lowest returns—that is, unskilled labor and petty trading—have the leastdiversified income sources.
Households across all expenditure groups engage in a combination of familylabor and exchange-based activities (Table 15). Better-off households earn a sig-nificantly higher share of total income from self-employed productive activitiesthan other households. These better-off households receive almost one-third of theirincome from self-employed productive activities, more than 20 percent from un-protected wage labor, and another 15 percent from protected wage labor. Inter-household transfers through gifts and borrowing comprise 12–28 percent of totalincome, with a mean of 20 percent. Households in the lowest expenditure quintilereceive the bulk of their earned income from unprotected wage labor and self-employed marginal activities (petty trading). Almost one-third of the total incomeof these households comes from interhousehold transfers. The unemployed receive90 percent of their total income from gifts, remittances,and other transfers.
Indigenous households receive 30 percent of their total income from interhouse-hold transfers—double the amount received by migrants from that source. Female-headed households receive a significantly higher amount (43 percent) of totalincome from gifts, remittances,and net borrowing and lending than male-headedhouseholds (7.8 percent). Income from self-employment (predominantly petty trad-ing and street food vending) contributes 38 percent of income for female-headedhouseholds,while male-headed households rely more heavily on wage labor.
Education is significantly and positively associated with higher per capita in-come levels. In households where the head of the household has completed highschool or higher, the share of income from protected wage labor is significantlygreater than it is in households where the head has less formal education. House-holds whose heads have no education or only a primary education obtain almost
37
maxwell chap04 5/9/0 8:30 PM Page 37
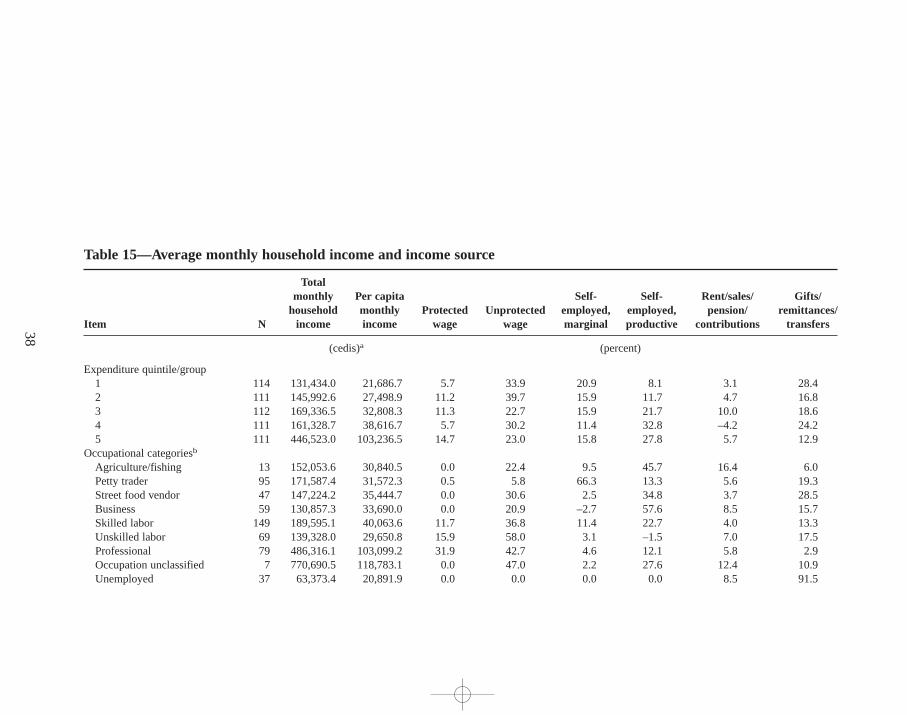
38
Table 15—Average monthly household income and income source
Totalmonthly Per capita Self- Self- Rent/sales/ Gifts/
household monthly Protected Unprotected employed, employed, pension/ remittances/Item N income income wage wage marginal productive contributions tr ansfers
(cedis)a (percent)
Expenditure quintile/group1 114 131,434.0 21,686.7 5.7 33.9 20.9 8.1 3.1 28.42 111 145,992.6 27,498.9 11.2 39.7 15.9 11.7 4.7 16.83 112 169,336.5 32,808.3 11.3 22.7 15.9 21.7 10.0 18.64 111 161,328.7 38,616.7 5.7 30.2 11.4 32.8 –4.2 24.25 111 446,523.0 103,236.5 14.7 23.0 15.8 27.8 5.7 12.9
Occupational categoriesb
Agriculture/fishing 13 152,053.6 30,840.5 0.0 22.4 9.5 45.7 16.4 6.0Petty trader 95 171,587.4 31,572.3 0.5 5.8 66.3 13.3 5.6 19.3Street food vendor 47 147,224.2 35,444.7 0.0 30.6 2.5 34.8 3.7 28.5Business 59 130,857.3 33,690.0 0.0 20.9 –2.7 57.6 8.5 15.7Skilled labor 149 189,595.1 40,063.6 11.7 36.8 11.4 22.7 4.0 13.3Unskilled labor 69 139,328.0 29,650.8 15.9 58.0 3.1 –1.5 7.0 17.5Professional 79 486,316.1 103,099.2 31.9 42.7 4.6 12.1 5.8 2.9Occupation unclassified 7 770,690.5 118,783.1 0.0 47.0 2.2 27.6 12.4 10.9Unemployed 37 63,373.4 20,891.9 0.0 0.0 0.0 0.0 8.5 91.5
maxw
ell ch
ap04 5
/9/0
8:3
0 P
M P
age 3
8
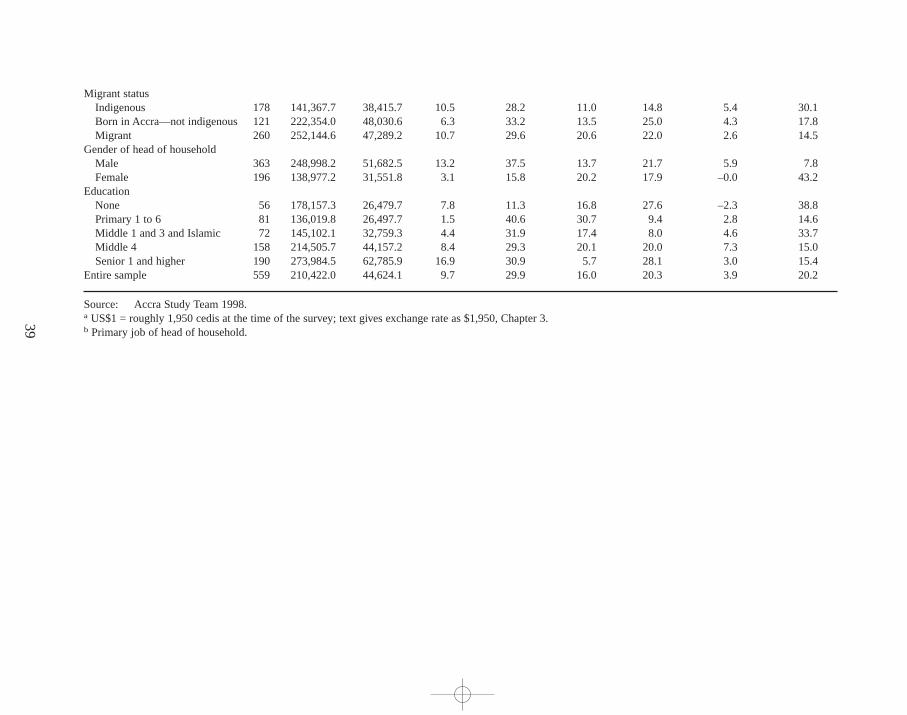
39
Migrant statusIndigenous 178 141,367.7 38,415.7 10.5 28.2 11.0 14.8 5.4 30.1Born in Accra—not indigenous 121 222,354.0 48,030.6 6.3 33.2 13.5 25.0 4.3 17.8Migrant 260 252,144.6 47,289.2 10.7 29.6 20.6 22.0 2.6 14.5
Gender of head of householdMale 363 248,998.2 51,682.5 13.2 37.5 13.7 21.7 5.9 7.8Female 196 138,977.2 31,551.8 3.1 15.8 20.2 17.9 –0.0 43.2
EducationNone 56 178,157.3 26,479.7 7.8 11.3 16.8 27.6 –2.3 38.8Primary 1 to 6 81 136,019.8 26,497.7 1.5 40.6 30.7 9.4 2.8 14.6Middle 1 and 3 and Islamic 72 145,102.1 32,759.3 4.4 31.9 17.4 8.0 4.6 33.7Middle 4 158 214,505.7 44,157.2 8.4 29.3 20.1 20.0 7.3 15.0Senior 1 and higher 190 273,984.5 62,785.9 16.9 30.9 5.7 28.1 3.0 15.4
Entire sample 559 210,422.0 44,624.1 9.7 29.9 16.0 20.3 3.9 20.2
Source: Accra Study Team 1998.a US$1 = roughly 1,950 cedis at the time of the survey; text gives exchange rate as $1,950,Chapter 3.b Primary job of head of household.
maxw
ell ch
ap04 5
/9/0
8:3
0 P
M P
age 3
9
one-third of their income from self-employed marginal activities. The share is lessthan 6 percent for households with better-educated heads,however. Reciprocal ex-change (gifts and remittances) makes up almost 40 percent of total income forhouseholds whose heads have low educational levels, while this figure is signifi-cantly lower for households with better-educated heads (15 percent of total percapita income).
Income Inequality
The Gini coefficient measure for income inequality for the entire sample is 0.43.This measure compares with figures of 0.43 and 0.50 for the 1987–88 and 1992rounds of the Ghana Living Standards Survey, respectively, using only the incomefigures for urban Accra. (In 1992 the Gini coefficient for income throughout Ghanawas 0.48.) These figures suggest that income inequality has remained fairly stableover the past decade and that income inequality is not significantly greater in Accrathan in the country as a whole.
Shocks and Safety Nets
Focus groups identified the kinds of shocks to livelihoods that are common in thecity. Primary among these is the loss of income from a primary income earner throughdeath, abandonment,illness,or accident. Other shocks include unexpected familyobligations (such as a funeral), job loss,failure of a small business (or an attack onit by municipal authorities), loss of access to credit, and loss of savings,especiallythe savings of informal lending groups (Ga Mashie Study Team 1996; Ngleshie-Amanfro Study Team 1996). Most of the shocks mentioned by focus groups tallywith survey data.
Most of the safety nets developed during the post-independence era in Ghanaeffectively came to an end with the economic crisis of the late 1970s—especiallyconsumer subsidies and transfers of food and money. The little that remained ofthese programs was scrapped in 1983 with the onset of the Economic RecoveryProgramme. Under these circumstances,households and individuals have had todevelop their own coping strategies for dealing with financial crises. Respondentshave a number of methods of dealing with shocks and income shortfalls, includingtransfers or informal credit and sales of assets (Table 16),and reduced spending.However, the sacrif ices and trade-offs involved in these methods affect people’swelfare and their productive capacity.
In the late 1980s,under pressure from various donors concerned about the se-vere poverty structural adjustment was causing, Ghana initiated an alternate ap-proach to safety nets. Known as the Programme of Action to Mitigate the SocialCosts of Adjustment (PAMSCAD), the program was aimed at enhancing the possi-bilities for self-employment among certain hard-hit segments of the population,many of them urban. Few of the formal programs begun under PAMSCAD stillexist, however.
40
maxwell chap04 5/9/0 8:30 PM Page 40
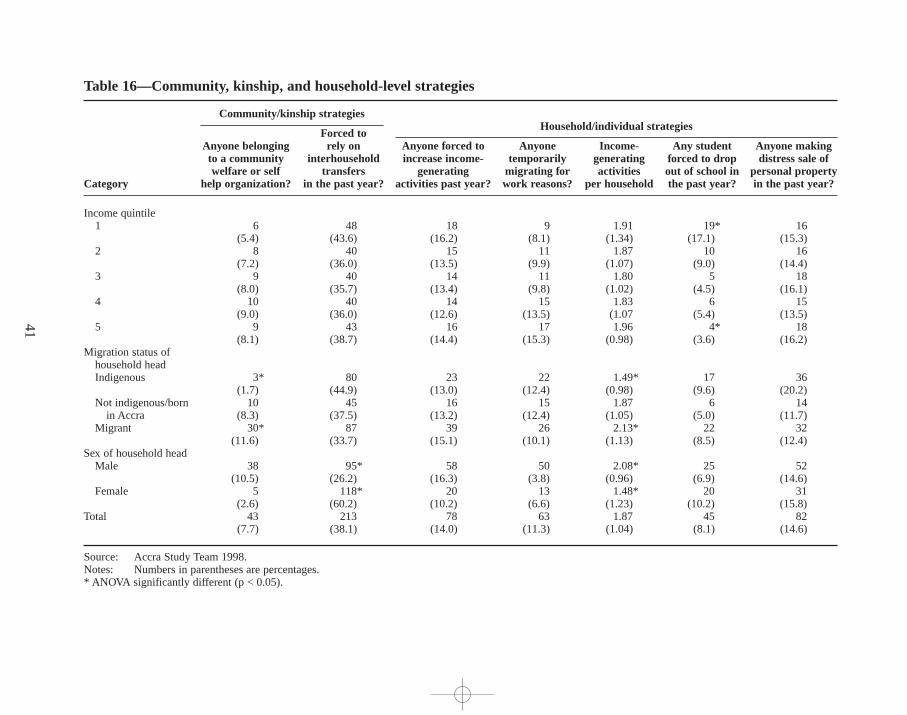
41
Table 16—Community, kinship, and household-level strategies
Community/kinship str ategiesHousehold/individual strategies
Forced toAnyone belonging rely on Anyone forced to Anyone Income- Any student Anyone makingto a community interhousehold increase income- temporarily generating forced to drop distress sale ofwelfare or self tr ansfers generating migrating for activities out of school in personal property
Category help organization? in the past year? activities past year? work reasons? per household the past year? in the past year?
Income quintile1 6 48 18 9 1.91 19* 16
(5.4) (43.6) (16.2) (8.1) (1.34) (17.1) (15.3)2 8 40 15 11 1.87 10 16
(7.2) (36.0) (13.5) (9.9) (1.07) (9.0) (14.4)3 9 40 14 11 1.80 5 18
(8.0) (35.7) (13.4) (9.8) (1.02) (4.5) (16.1)4 10 40 14 15 1.83 6 15
(9.0) (36.0) (12.6) (13.5) (1.07 (5.4) (13.5)5 9 43 16 17 1.96 4* 18
(8.1) (38.7) (14.4) (15.3) (0.98) (3.6) (16.2)Migration status of
household headIndigenous 3* 80 23 22 1.49* 17 36
(1.7) (44.9) (13.0) (12.4) (0.98) (9.6) (20.2)Not indigenous/born 10 45 16 15 1.87 6 14
in Accra (8.3) (37.5) (13.2) (12.4) (1.05) (5.0) (11.7)Migrant 30* 87 39 26 2.13* 22 32
(11.6) (33.7) (15.1) (10.1) (1.13) (8.5) (12.4)Sex of household head
Male 38 95* 58 50 2.08* 25 52(10.5) (26.2) (16.3) (3.8) (0.96) (6.9) (14.6)
Female 5 118* 20 13 1.48* 20 31(2.6) (60.2) (10.2) (6.6) (1.23) (10.2) (15.8)
Total 43 213 78 63 1.87 45 82(7.7) (38.1) (14.0) (11.3) (1.04) (8.1) (14.6)
Source: Accra Study Team 1998.Notes: Numbers in parentheses are percentages.* ANOVA significantly different (p < 0.05).
maxw
ell ch
ap04 5
/9/0
8:3
0 P
M P
age 4
1
A 1996 study of poverty in Accra found that very few formal programs aimedat either poverty alleviation or reduction were operating in the city (Bortei-DokuAryeetey and Aryeetey 1996). Researchers did find evidence of informal and kin-ship safety nets and observed numerous coping strategies at the household and in-dividual levels. The qualitative studies noted a few scattered microenterprise creditand vocational training programs,but with a few exceptions these programs hadtiny budgets and served a very limited number of beneficiaries. The only formalprogram related to food and nutrition was a nutritional rehabilitation program forseverely malnourished children run by the government polyclinics in the city (GaMashie Study Team 1996).
This survey found no one in any household in the sample who had participatedin job training programs. Seven households had received direct assistance fromformal programs intended to help the destitute (these programs were usually run byreligious organizations,both Christian and Muslim). Only five households includedsomeone who had received a loan from a microenterprise credit program. Thesenumbers are so small that it was impossible to detect any differences between ben-eficiaries and nonbeneficiaries.
Norton et al. (1995) report that the major constraint to the livelihoods of theurban poor in Accra is the lack of access to productive credit, a finding also con-firmed by survey results and qualitative field work. These very low figures for par-ticipation in formal assistance programs are largely a reflection of the absence of suchprograms in Accra. The high rate of inflation in part explains the lack of microen-terprise credit programs. Inflation averaged 55 percent in 1996,the year before thesurvey (ISSER 1997). This kind of inflation requires very high nominal interestrates,even if the interest rate is subsidized in real terms.
Coping Strategies
In the absence of formal safety nets,people rely heavily on their own strategies atthe community, household, and individual levels. During times of economic stress,these strategies are likely to be the only available options.
Community and Kinship Strategies
Kinship linkages have weakened significantly over time. But they still exist amongthe indigenous population and can be a significant source of assistance in times ofdifficulty (Kilson 1974; Fayorsey 1995). Kinship linkages are also common amongAccra’s migrant population. But because these linkages may span considerably greaterphysical distances,they are often not a ready source of support in an emergency.
Urbanization has helped to weaken kinship links. One migrant woman who wassupporting herself and her children by petty trade, with no support from either hus-band or kin,noted, “[In Accra], even close brothers may be staying together andwill not even share things. One can even die of starvation and his brother will notfeel obliged to help. Here, it is everybody for himself.”
42
maxwell chap04 5/9/0 8:30 PM Page 42
Numerous community organizations do exist, including occupational associa-tions,ethnic or “hometown” associations (mostly in migrant communities),culturaltroupes,and a variety of “fun clubs,” drinking clubs,and other social groups. Or-ganizations that often span the indigenous-migrant distinction include religious andoccupational associations,and in some cases,labor unions and worker associations.All these organizations may, in some way, help out individuals or households intimes of family crisis—particularly funerals—but they do not necessarily replacethe kinship network in terms of providing emergency assistance in a financial short-fall. In the indigenous communities of the city, “town councils”help maintain clean-liness and community cohesion,although the extent to which these councils areactive varies considerably.
Table 16 presents survey results on the frequency of a variety of strategies at boththe community–kinship and household–individual levels. The distinction betweenthese two kinds of strategies is based on their relationship to the household—that is,whether they rely on external resources (community–kinship) or internal resources(household–individual).21 Participation in community welfare or self-help organiza-tions is quite low. Subsequent focus groups revealed that this finding reflected for-mal membership more than informal participation,and that participation in many or-ganizations is very informal. Nevertheless,even these data indicate a much higherrate of participation among male-headed households than among female-headedhouseholds and among migrant as opposed to indigenous households.
Household Strategies
Table 16 notes that 38.1 percent of all households reported having to rely on trans-fers or remittances from outside the household at some point during the previousyear. In fact,survey data reveal a high degree of reliance on transfer income. House-holds that reported receiving assistance from kin or friends rely on this type of in-come for a significantly larger proportion of their total income (37.7 percent) thanother households (9.4 percent). The mean proportion of income from transfers forthe sample is about 20 percent.
Household strategies for coping with shocks fall into several categories:• Income-related strategies include diversification, temporary migration in
search of alternative income sources,and casual labor.• Income-pooling strategies involve combining money at either the household
or family compound level or through sususavings groups.22
• Expenditure-reduction strategies save money by cutting spending on con-sumption and purchases.
43
21 Reliance on remittances from family members and friends is a household strategy but is listed with communityand kinship strategies here because it relies on resources outside the household.22 Susu are informal groups where each member contributes a small sum each day for a month and once a montheach member gets to keep the full amount collected for the day.
maxwell chap04 5/9/0 8:30 PM Page 43
• Household composition strategies may include temporary or long-term mi-gration, placing children in foster care, and in extreme cases,breaking up ahousehold.
• Food consumption or rationing strategiesuse dietary changes,rationing, ma-ternal buffering,23 reduced consumption,and rationing through the purchaseof street foods to reduce expenses.
• The commercialization of ritual ceremonies involves making money throughevents such as “outdoorings” or naming ceremonies.24
• Distress sales of personal effects bring in needed cash.Within the previous year, 14 percent of the households in the sample had found
it necessary to increase the number of their income-generating activities in order tomake ends meet. Households that reported increasing income-generating activitiesin the previous year engaged in a significantly higher number of activities (2.57)than the remainder of the sample (1.76) and were making much better use of theirlabor resources. In 11.3 percent of households,people temporarily left their homesin the city and went elsewhere looking for work.
During times of severe economic stress,the most common coping mechanismsare distress sales or reductions in expenditures. Overall, nearly 15 percent of thehouseholds in the sample reported having made distress sales in the previous year.Though the money these activities generate constitute a relatively insignificant partof households’overall income, in times of stress the income is welcome. Thosehouseholds reporting distress sales in the previous year obtained roughly 13 percentof their total income from this source, compared with about 2 percent of thosehouseholds not reporting distress sales. The mean proportion for the entire sampleis 3.8 percent.
Expenditure reduction strategies are also common. Typically, householdsdelay large purchases (or do not make them at all), but in times of real economicstress people cut more important forms of expenditure. Food purchases,thelargest and most elastic element of the household expenditures,may be the firsttarget for reductions (Ga Mashie Study Team 1996).25 Under more severe stress,households may cut expenditures for health care or education. In some 8.1 per-cent of households,a student was forced to drop out of school because of thehousehold’s inability to pay school fees during an economic crisis. Of 45 house-holds reporting this strategy in the previous year, a total of 69 students had to drop
44
23 Mothers reduce their own consumption rather than cutting their children’s intake when food supplies are inadequate.24 Traditionally, friends and relatives give a small gift to the infant’s mother at outdoorings,but this practice hasbecome a major moneymaking scheme, particularly in Accra’s indigenous communities. Many teenage girls citedthis ritual as one rationale for becoming pregnant (Ga Mashie Study Team 1996). Survey data on this practice werenot collected.25 This observation comes only from the qualitative elements of the survey. The survey data are for only one roundand thus do not reflect changes in household expenditure over time. However, the perception was widespread thatfood expenditures are often the first to be sacrif iced in a cash-flow crisis.
maxwell chap04 5/9/0 8:30 PM Page 44
out of school, of whom 30 were male and 39 female. Most were the children of ahousehold head.
The case studies showed that households employ a variety of strategies relatedto food consumption at times when the available food in the household is insuffi-cient to feed all members and there is no money to buy more. In generic terms,theseinclude dietary changes,temporary measures to increase the amount of food avail-able, temporary measures to reduce the number of people who have to be fed, andrationing or somehow “managing” the shortfall in available food (see Chapter 5).
Individual Strategies
A variety of individual-level, income-related strategies also exist, such as takingup a sexual partner who can provide some financial support, commercial sex work(particularly in the case of women),petty crime (particularly in the case of men),and begging (particularly in the case of children,the elderly, and the disabled) (GaMashie Study Team 1996; Ngleshie-Amanfro Study Team 1996). Data on thesepractices were not collected during the survey. However, in situations where thesematters could be discussed anonymously, it became clear that for certain groupsunder certain circumstances,these strategies were the only alternatives.
Interhousehold Transfers
In the absence of formal safety nets,interhousehold transfers are widely used to pro-vide insurance against income fluctuations and other shocks caused by productionshortfalls, unemployment,illness,and death. In fact,the most commonly mentionedstrategy in Table 16 is reliance on transfers. Transfers have the potential to smooth in-come fluctuations, reduce inequalities in income among households,bolster invest-ments in human capital, and ease constraints on borrowing (Cox and Jimenez 1996).
Interhousehold transfers include gifts and remittances of money and in-kindgoods. They also include borrowing and lending, since the majority of credit trans-actions occur through informal channels—primarily among family members,friends,and casual business associates.26While these transfers are to some extent a daily ac-tivity, they are often a response to a financial crisis or income shortfall. They mayalso correspond to certain occasions,especially important passages in the lifecycle—births,marriages,and funerals (Ga Mashie Study Team 1996). Overall, 83percent of households in the survey sample reported that they had given or receiveda transfer in the past six months,while 79 percent reported that they had receivedor provided a loan.
45
26 Gifts are transfers based on reciprocal exchange with no formal agreement that the gift will be repaid. However,reciprocity is often implicit in these gifts. Gifts are distinguished from loans,which come with a verbal or writtenagreement that the amount borrowed will be repaid with or without interest.
maxwell chap04 5/9/0 8:30 PM Page 45
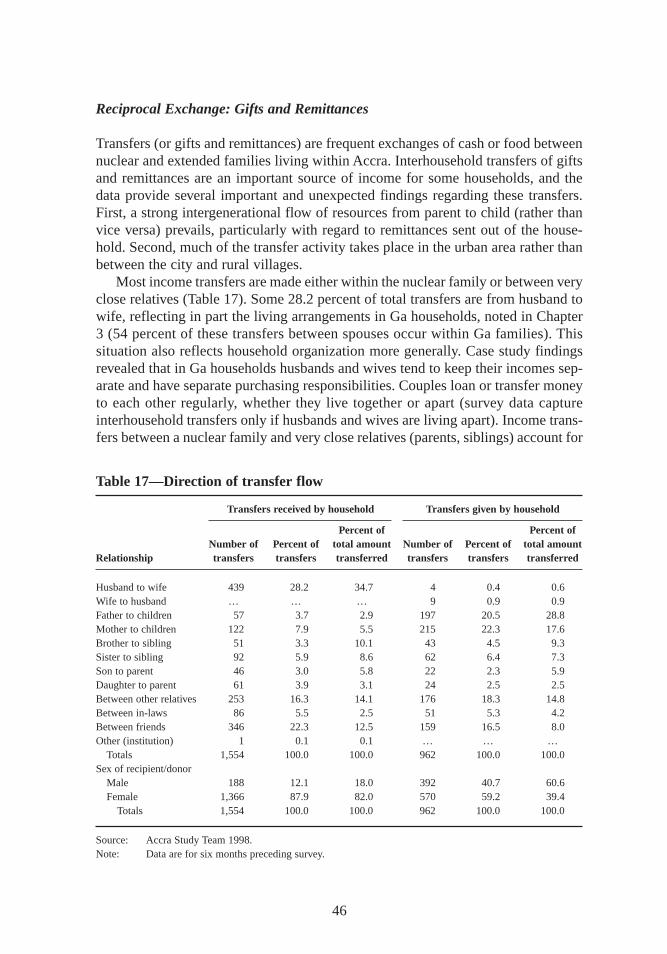
Reciprocal Exchange: Gifts and Remittances
Transfers (or gifts and remittances) are frequent exchanges of cash or food betweennuclear and extended families living within Accra. Interhousehold transfers of giftsand remittances are an important source of income for some households,and thedata provide several important and unexpected findings regarding these transfers.First, a strong intergenerational flow of resources from parent to child (rather thanvice versa) prevails, particularly with regard to remittances sent out of the house-hold. Second, much of the transfer activity takes place in the urban area rather thanbetween the city and rural villages.
Most income transfers are made either within the nuclear family or between veryclose relatives (Table 17). Some 28.2 percent of total transfers are from husband towife, reflecting in part the living arrangements in Ga households,noted in Chapter3 (54 percent of these transfers between spouses occur within Ga families). Thissituation also reflects household organization more generally. Case study findingsrevealed that in Ga households husbands and wives tend to keep their incomes sep-arate and have separate purchasing responsibilities. Couples loan or transfer moneyto each other regularly, whether they live together or apart (survey data captureinterhousehold transfers only if husbands and wives are living apart). Income trans-fers between a nuclear family and very close relatives (parents,siblings) account for
46
Table 17—Direction of transfer flow
Transfers received by household Transfers given by household
Percent of Percent ofNumber of Percent of total amount Number of Percent of total amount
Relationship tr ansfers tr ansfers tr ansferred tr ansfers tr ansfers tr ansferred
Husband to wife 439 28.2 34.7 4 0.4 0.6Wife to husband … … … 9 0.9 0.9Father to children 57 3.7 2.9 197 20.5 28.8Mother to children 122 7.9 5.5 215 22.3 17.6Brother to sibling 51 3.3 10.1 43 4.5 9.3Sister to sibling 92 5.9 8.6 62 6.4 7.3Son to parent 46 3.0 5.8 22 2.3 5.9Daughter to parent 61 3.9 3.1 24 2.5 2.5Between other relatives 253 16.3 14.1 176 18.3 14.8Between in-laws 86 5.5 2.5 51 5.3 4.2Between friends 346 22.3 12.5 159 16.5 8.0Other (institution) 1 0.1 0.1 … … …
Totals 1,554 100.0 100.0 962 100.0 100.0Sex of recipient/donor
Male 188 12.1 18.0 392 40.7 60.6Female 1,366 87.9 82.0 570 59.2 39.4
Totals 1,554 100.0 100.0 962 100.0 100.0
Source: Accra Study Team 1998.Note: Data are for six months preceding survey.
maxwell chap04 5/9/0 8:30 PM Page 46
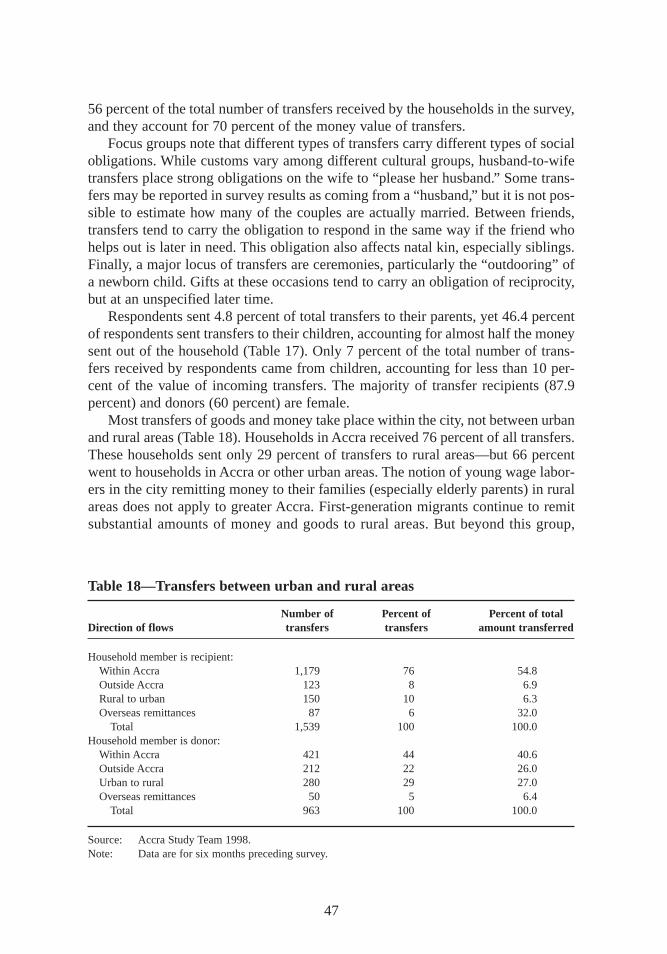
56 percent of the total number of transfers received by the households in the survey,and they account for 70 percent of the money value of transfers.
Focus groups note that different types of transfers carry different types of socialobligations. While customs vary among different cultural groups,husband-to-wifetransfers place strong obligations on the wife to “please her husband.” Some trans-fers may be reported in survey results as coming from a “husband,” but it is not pos-sible to estimate how many of the couples are actually married. Between friends,transfers tend to carry the obligation to respond in the same way if the friend whohelps out is later in need. This obligation also affects natal kin, especially siblings.Finally, a major locus of transfers are ceremonies,particularly the “outdooring” ofa newborn child. Gifts at these occasions tend to carry an obligation of reciprocity,but at an unspecified later time.
Respondents sent 4.8 percent of total transfers to their parents,yet 46.4 percentof respondents sent transfers to their children,accounting for almost half the moneysent out of the household (Table 17). Only 7 percent of the total number of trans-fers received by respondents came from children,accounting for less than 10 per-cent of the value of incoming transfers. The majority of transfer recipients (87.9percent) and donors (60 percent) are female.
Most transfers of goods and money take place within the city, not between urbanand rural areas (Table 18). Households in Accra received 76 percent of all transfers.These households sent only 29 percent of transfers to rural areas—but 66 percentwent to households in Accra or other urban areas. The notion of young wage labor-ers in the city remitting money to their families (especially elderly parents) in ruralareas does not apply to greater Accra. First-generation migrants continue to remitsubstantial amounts of money and goods to rural areas. But beyond this group,
47
Table 18—Transfers between urban and rural areas
Number of Percent of Percent of totalDir ection of flows tr ansfers tr ansfers amount transferred
Household member is recipient:Within Accra 1,179 76 54.8Outside Accra 123 8 6.9Rural to urban 150 10 6.3Overseas remittances 87 6 32.0
Total 1,539 100 100.0Household member is donor:
Within Accra 421 44 40.6Outside Accra 212 22 26.0Urban to rural 280 29 27.0Overseas remittances 50 5 6.4
Total 963 100 100.0
Source: Accra Study Team 1998.Note: Data are for six months preceding survey.
maxwell chap04 5/9/0 8:30 PM Page 47
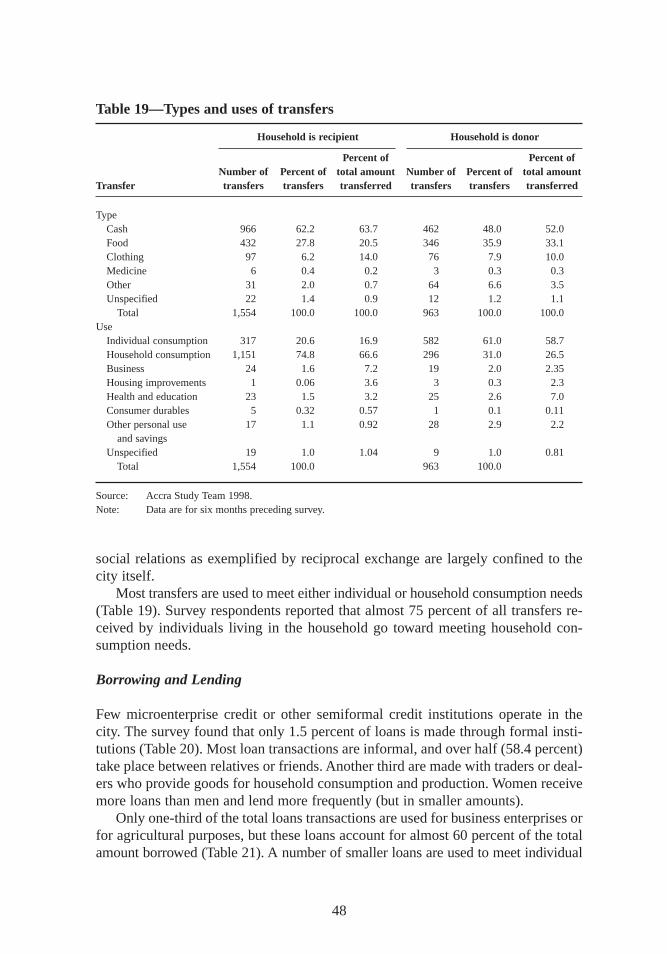
social relations as exemplified by reciprocal exchange are largely confined to thecity itself.
Most transfers are used to meet either individual or household consumption needs(Table 19). Survey respondents reported that almost 75 percent of all transfers re-ceived by individuals living in the household go toward meeting household con-sumption needs.
Borrowing and Lending
Few microenterprise credit or other semiformal credit institutions operate in thecity. The survey found that only 1.5 percent of loans is made through formal insti-tutions (Table 20). Most loan transactions are informal,and over half (58.4 percent)take place between relatives or friends. Another third are made with traders or deal-ers who provide goods for household consumption and production. Women receivemore loans than men and lend more frequently (but in smaller amounts).
Only one-third of the total loans transactions are used for business enterprises orfor agricultural purposes,but these loans account for almost 60 percent of the totalamount borrowed (Table 21). A number of smaller loans are used to meet individual
48
Table 19—Types and uses of transfers
Household is recipient Household is donor
Percent of Percent ofNumber of Percent of total amount Number of Percent of total amount
Transfer tr ansfers tr ansfers tr ansferred tr ansfers tr ansfers tr ansferred
TypeCash 966 62.2 63.7 462 48.0 52.0Food 432 27.8 20.5 346 35.9 33.1Clothing 97 6.2 14.0 76 7.9 10.0Medicine 6 0.4 0.2 3 0.3 0.3Other 31 2.0 0.7 64 6.6 3.5Unspecified 22 1.4 0.9 12 1.2 1.1
Total 1,554 100.0 100.0 963 100.0 100.0Use
Individual consumption 317 20.6 16.9 582 61.0 58.7Household consumption 1,151 74.8 66.6 296 31.0 26.5Business 24 1.6 7.2 19 2.0 2.35Housing improvements 1 0.06 3.6 3 0.3 2.3Health and education 23 1.5 3.2 25 2.6 7.0Consumer durables 5 0.32 0.57 1 0.1 0.11Other personal use 17 1.1 0.92 28 2.9 2.2
and savingsUnspecified 19 1.0 1.04 9 1.0 0.81
Total 1,554 100.0 963 100.0
Source: Accra Study Team 1998.Note: Data are for sixmonths preceding survey.
maxwell chap04 5/9/0 8:30 PM Page 48
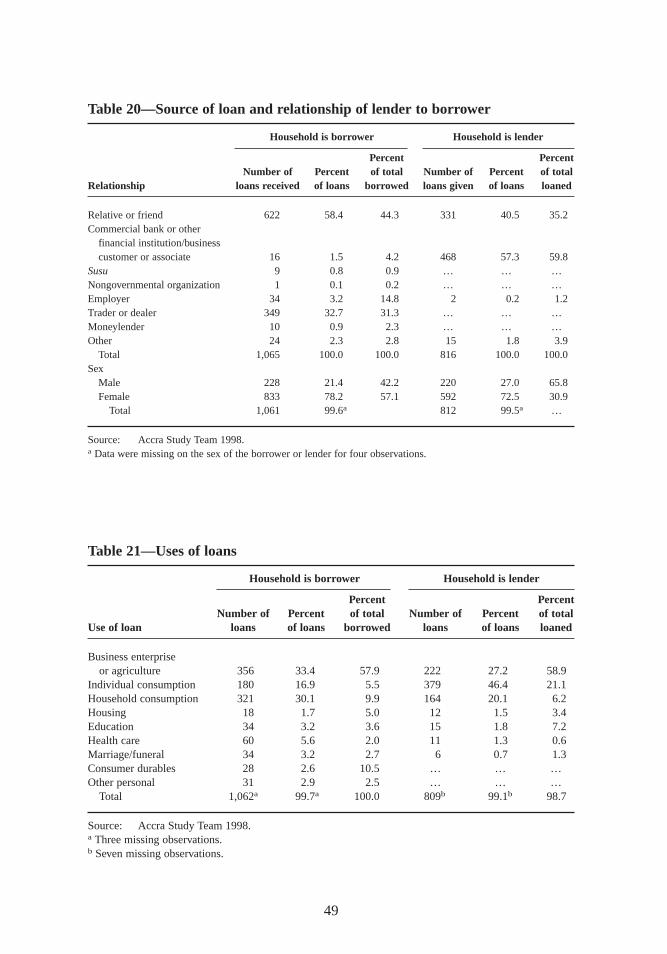
49
Table 20—Source of loan and relationship of lender to borrower
Household is borrower Household is lender
Percent PercentNumber of Percent of total Number of Percent of total
Relationship loans received of loans borrowed loans given of loans loaned
Relative or friend 622 58.4 44.3 331 40.5 35.2Commercial bank or other
financial institution/businesscustomer or associate 16 1.5 4.2 468 57.3 59.8
Susu 9 0.8 0.9 … … …Nongovernmental organization 1 0.1 0.2 … … …Employer 34 3.2 14.8 2 0.2 1.2Trader or dealer 349 32.7 31.3 … … …Moneylender 10 0.9 2.3 … … …Other 24 2.3 2.8 15 1.8 3.9
Total 1,065 100.0 100.0 816 100.0 100.0Sex
Male 228 21.4 42.2 220 27.0 65.8Female 833 78.2 57.1 592 72.5 30.9
Total 1,061 99.6a 812 99.5a …
Source: Accra Study Team 1998.a Data were missing on the sex of the borrower or lender for four observations.
Table 21—Uses of loans
Household is borrower Household is lender
Percent PercentNumber of Percent of total Number of Percent of total
Use of loan loans of loans borrowed loans of loans loaned
Business enterprise or agriculture 356 33.4 57.9 222 27.2 58.9
Individual consumption 180 16.9 5.5 379 46.4 21.1Household consumption 321 30.1 9.9 164 20.1 6.2Housing 18 1.7 5.0 12 1.5 3.4Education 34 3.2 3.6 15 1.8 7.2Health care 60 5.6 2.0 11 1.3 0.6Marriage/funeral 34 3.2 2.7 6 0.7 1.3Consumer durables 28 2.6 10.5 … … …Other personal 31 2.9 2.5 … … …
Total 1,062a 99.7a 100.0 809b 99.1b 98.7
Source: Accra Study Team 1998.a Three missing observations.b Seven missing observations.
maxwell chap04 5/9/0 8:30 PM Page 49
and household consumption needs. Almost half of all loans are used to meet con-sumption needs,but these loans only account for 15 percent of the total amountborrowed. Given that a large proportion of credit transactions are obtained from in-formal sources and used to meet individual and household consumption needs,it isnot surprising that 94 percent of these loans were interest free and that 61 percentwere obtained without any collateral.
Susu Groups
Membership in a susugroup is a common means of accumulating capital for eithera purchase or business investment. The most common form of susugroup is organ-ized by a “collector.” Members contribute a certain sum to the group every day.Once a month,each group member (including the collector) gets the full amountcontributed that day. Susugroups are a means of accumulation rather than creditper se, although susucollectors are also a source of informal credit (Table 20). Thestudy found that respondents often did not report susuincome, since over the 30-day recall period used in the study contributions and money received in this waytended to balance each other out.
Susupractices are widely mistrusted in some areas of the city because of in-creasing tendencies on the part of susucollectors to abscond with money. In nearlyhalf of all household case studies,members mentioned this problem as the reasonfor not participating in susugroups.
Clearly, a high proportion of the resources available to Accra households comefrom gifts, remittances,and loans. The sheer volume of the resources that are ex-changed suggests that transfers and loans are an essential source of needed incomeand goods. Most of these resources are used for consumption purposes,however,posing a major challenge for poverty alleviation efforts. Can these informal re-sources be channeled toward productive investments in small enterprises and skillsin order to enhance income-generating capacity in the long term? Under the currentsystem,Accra’s residents continue to face severe constraints in finding ways toimprove their livelihoods.
Fur ther Findings
Several other perceptions from the focus group discussions are worth noting. First,the majority of respondents felt that most people aim for one of two income sourcesin order to get enough income to survive in Accra. The first of these is ownershipof a small business other than petty trading or street food vending. The second,which is much more difficult to obtain,is a job with a regular salary, even if thework does not pay all that well.
Second, while having sufficient income is important to being able to provide ed-ucational opportunities for children,education is not necessarily viewed as a majorasset in terms of finding work—especially a wage-earning job. The general percep-tion is that specific skills are more important than academic education. This belief
50
maxwell chap04 5/9/0 8:30 PM Page 50
may help explain why taking children out of school is a common expenditure-reducing strategy. Results discussed in Chapters 7 and 8 suggest that education maybe valuable for more than just its potential on the job market, however.
Third, nearly all groups stressed that large families,particularly large numbersof children,are a liability. Despite the fact that roughly half of these groups weremade up of women and that the evidence from the survey data showed otherwise,there was not a widespread perception that female-headed households were worseoff than households headed by males.
Fourth, respondents offered a fairly common list of constraints to the livelihoodsof poor individuals and households. Some of these revolved around the classicexplanation for what has been called the “culture of poverty,” “laziness,” “ir respon-sibility,” men with “too many girlfr iends,” and “poor social background.” However,a second set of constraints identified through the focus groups tallies fairly closelywith those derived from survey data. These constraints include a lack of salableskills, the absence of job opportunities even for those who have skills (men),lackof access to credit with which to begin small enterprises (women),poor health ofthe primary income earner, and conflicting demands on time. Access to credit is amajor constraint to livelihoods,especially among the self-employed.
Secondary evidence confirmed other constraints that were noted in the qualita-tive work. First,high municipal taxes for formally registered activities tend to pushpeople into informal (and less remunerative) activities and to keep them there. Sec-ond, the municipal authorities tend to harass small traders trying to work in the mostlucrative areas of the city (the central business district). Third, too many people arecrowded into too few forms of self-employment,making profit margins very lowand working hours very long (Bortei-Doku Aryeetey and Aryeetey 1996). While thecross-sectional quantitative data cannot explain very much about trends in income-generating activities over time, the perception of “crowding in” to a few occupa-tional categories and of falling incomes in those categories was very strong. Unfor-tunately, people see few other options.
51
maxwell chap04 5/9/0 8:30 PM Page 51
CHAPTER 5
Household Spending,Consumption, and Food Security
How do households use their incomes to meet the basic requirements of food,shelter, water, health, and education? How successful are they in making ends
meet? This chapter analyzes household expenditure patterns, focusing first on non-food items and then turning to food.
Expenditure Patterns
Estimates from the survey suggest that household incomes are substantially less thanconsumption (Table 22). However, household consumption expenditures are con-sidered a more reliable indicator of permanent income, largely because they are lessvariable (Anand and Harris 1985). If household consumption expenditures are usedas a proxy for income, the median income for the sample is approximately US$390per person per year, roughly the average reported for all of Ghana by the WorldBank (1997).
Nonfood Expenditures
Food is by far the largest item in household budgets, accounting for 54.5 percent ofall expenditures (Table 23). After food, clothing is the second most important ex-penditure item, accounting for 8.9 percent. However, the survey was conducted nearthe time of several Christian and Muslim holidays, so that clothing expenditureswere probably higher than normal. Miscellaneous expenses,27 transportation, health,and utilities account for about 4–5 percent of total outlay each. Expenditures on in-frastructure services (fuel and lighting, utilities, transportation, health, and educa-tion) account for 20 percent of total expenditures. The study found that in general
52
27 Miscellaneous expenses include loans to others, loan repayments, remittances sent out of the household, taxes,and savings.
maxwell chap05 5/9/0 8:29 PM Page 52
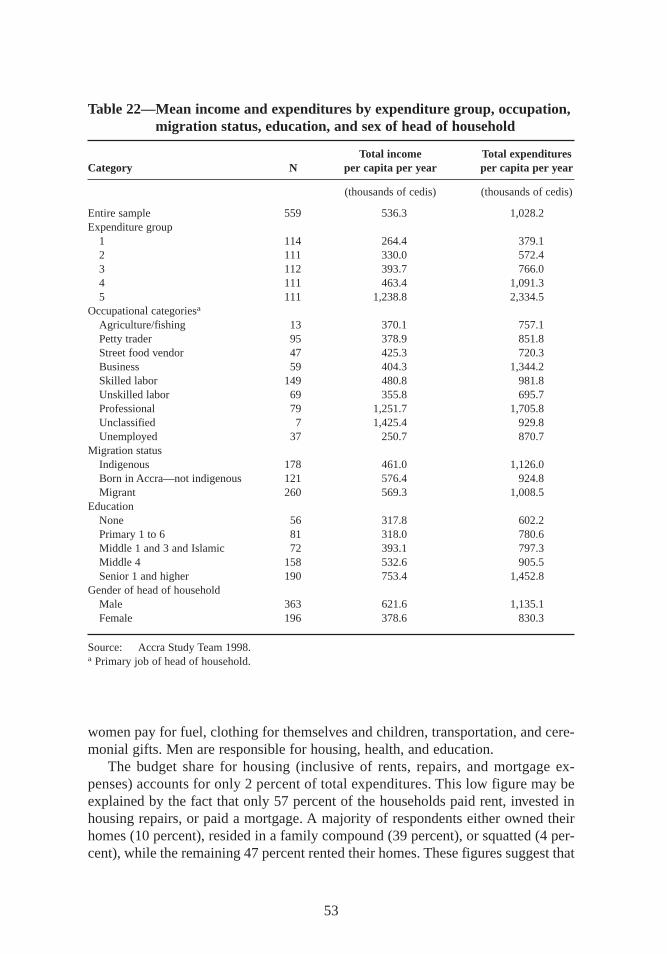
women pay for fuel,clothing for themselves and children,transportation, and cere-monial gifts. Men are responsible for housing, health,and education.
The budget share for housing (inclusive of rents,repairs, and mortgage ex-penses) accounts for only 2 percent of total expenditures. This low figure may beexplained by the fact that only 57 percent of the households paid rent, invested inhousing repairs, or paid a mortgage. A majority of respondents either owned theirhomes (10 percent),resided in a family compound (39 percent),or squatted (4 per-cent),while the remaining 47 percent rented their homes. These figures suggest that
53
Table 22—Mean income and expenditures by expenditure group, occupation,migration status, education, and sex of head of household
Total income Total expendituresCategory N per capita per year per capita per year
(thousands of cedis) (thousands of cedis)
Entire sample 559 536.3 1,028.2Expenditure group
1 114 264.4 379.12 111 330.0 572.43 112 393.7 766.04 111 463.4 1,091.35 111 1,238.8 2,334.5
Occupational categoriesa
Agriculture/fishing 13 370.1 757.1Petty trader 95 378.9 851.8Street food vendor 47 425.3 720.3Business 59 404.3 1,344.2Skilled labor 149 480.8 981.8Unskilled labor 69 355.8 695.7Professional 79 1,251.7 1,705.8Unclassified 7 1,425.4 929.8Unemployed 37 250.7 870.7
Migration statusIndigenous 178 461.0 1,126.0Born in Accra—not indigenous 121 576.4 924.8Migrant 260 569.3 1,008.5
EducationNone 56 317.8 602.2Primary 1 to 6 81 318.0 780.6Middle 1 and 3 and Islamic 72 393.1 797.3Middle 4 158 532.6 905.5Senior 1 and higher 190 753.4 1,452.8
Gender of head of householdMale 363 621.6 1,135.1Female 196 378.6 830.3
Source: Accra Study Team 1998.a Primary job of head of household.
maxwell chap05 5/9/0 8:29 PM Page 53
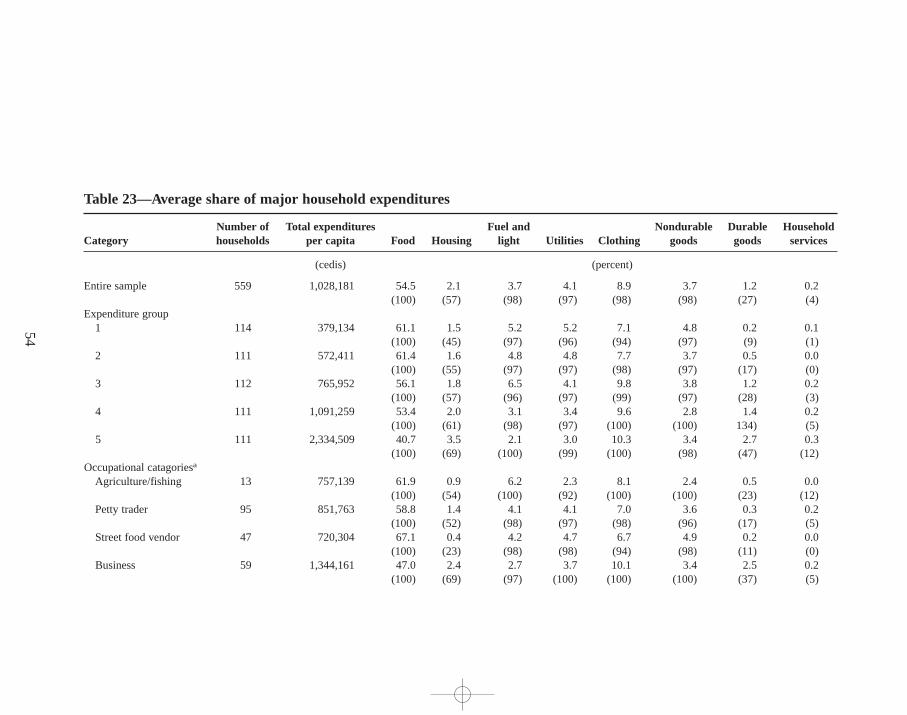
54
Table 23—Average share of major household expenditures
Number of Total expenditures Fuel and Nondurable Durable HouseholdCategory households per capita Food Housing light Utilities Clothing goods goods services
(cedis) (percent)
Entire sample 559 1,028,181 54.5 2.1 3.7 4.1 8.9 3.7 1.2 0.2(100) (57) (98) (97) (98) (98) (27) (4)
Expenditure group1 114 379,134 61.1 1.5 5.2 5.2 7.1 4.8 0.2 0.1
(100) (45) (97) (96) (94) (97) (9) (1)2 111 572,411 61.4 1.6 4.8 4.8 7.7 3.7 0.5 0.0
(100) (55) (97) (97) (98) (97) (17) (0)3 112 765,952 56.1 1.8 6.5 4.1 9.8 3.8 1.2 0.2
(100) (57) (96) (97) (99) (97) (28) (3)4 111 1,091,259 53.4 2.0 3.1 3.4 9.6 2.8 1.4 0.2
(100) (61) (98) (97) (100) (100) 134) (5)5 111 2,334,509 40.7 3.5 2.1 3.0 10.3 3.4 2.7 0.3
(100) (69) (100) (99) (100) (98) (47) (12)Occupational catagoriesa
Agriculture/fishing 13 757,139 61.9 0.9 6.2 2.3 8.1 2.4 0.5 0.0(100) (54) (100) (92) (100) (100) (23) (12)
Petty trader 95 851,763 58.8 1.4 4.1 4.1 7.0 3.6 0.3 0.2(100) (52) (98) (97) (98) (96) (17) (5)
Street food vendor 47 720,304 67.1 0.4 4.2 4.7 6.7 4.9 0.2 0.0(100) (23) (98) (98) (94) (98) (11) (0)
Business 59 1,344,161 47.0 2.4 2.7 3.7 10.1 3.4 2.5 0.2(100) (69) (97) (100) (100) (100) (37) (5)
maxw
ell ch
ap05 5
/9/0
8:2
9 P
M P
age 5
4
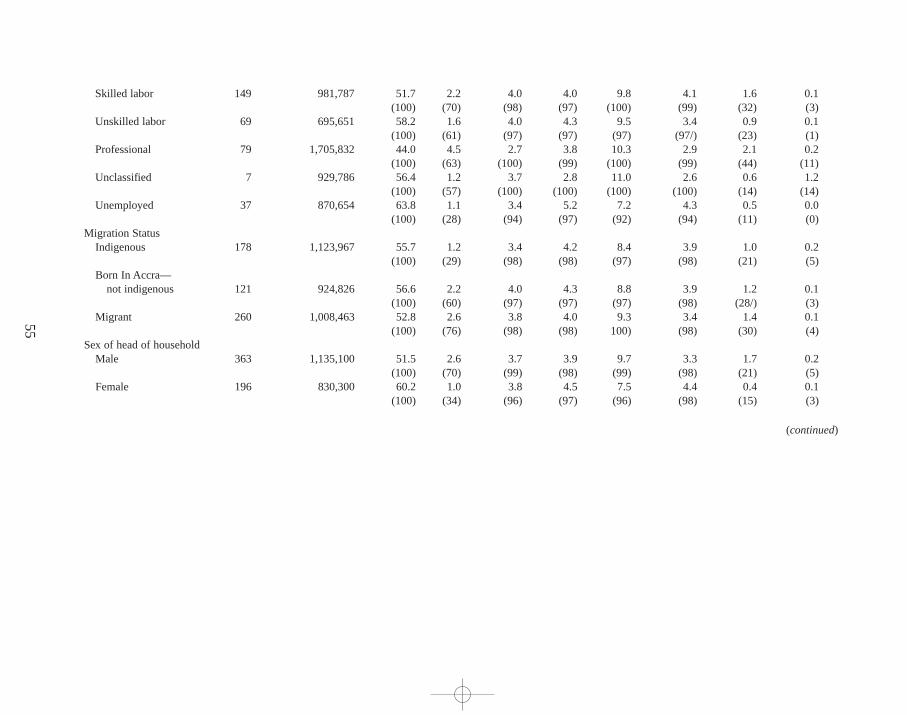
55
Skilled labor 149 981,787 51.7 2.2 4.0 4.0 9.8 4.1 1.6 0.1(100) (70) (98) (97) (100) (99) (32) (3)
Unskilled labor 69 695,651 58.2 1.6 4.0 4.3 9.5 3.4 0.9 0.1(100) (61) (97) (97) (97) (97/) (23) (1)
Professional 79 1,705,832 44.0 4.5 2.7 3.8 10.3 2.9 2.1 0.2(100) (63) (100) (99) (100) (99) (44) (11)
Unclassified 7 929,786 56.4 1.2 3.7 2.8 11.0 2.6 0.6 1.2(100) (57) (100) (100) (100) (100) (14) (14)
Unemployed 37 870,654 63.8 1.1 3.4 5.2 7.2 4.3 0.5 0.0(100) (28) (94) (97) (92) (94) (11) (0)
Migration StatusIndigenous 178 1,123,967 55.7 1.2 3.4 4.2 8.4 3.9 1.0 0.2
(100) (29) (98) (98) (97) (98) (21) (5)Born In Accra—
not indigenous 121 924,826 56.6 2.2 4.0 4.3 8.8 3.9 1.2 0.1(100) (60) (97) (97) (97) (98) (28/) (3)
Migrant 260 1,008,463 52.8 2.6 3.8 4.0 9.3 3.4 1.4 0.1(100) (76) (98) (98) 100) (98) (30) (4)
Sex of head of householdMale 363 1,135,100 51.5 2.6 3.7 3.9 9.7 3.3 1.7 0.2
(100) (70) (99) (98) (99) (98) (21) (5)Female 196 830,300 60.2 1.0 3.8 4.5 7.5 4.4 0.4 0.1
(100) (34) (96) (97) (96) (98) (15) (3)
(continued)
maxw
ell ch
ap05 5
/9/0
8:2
9 P
M P
age 5
5
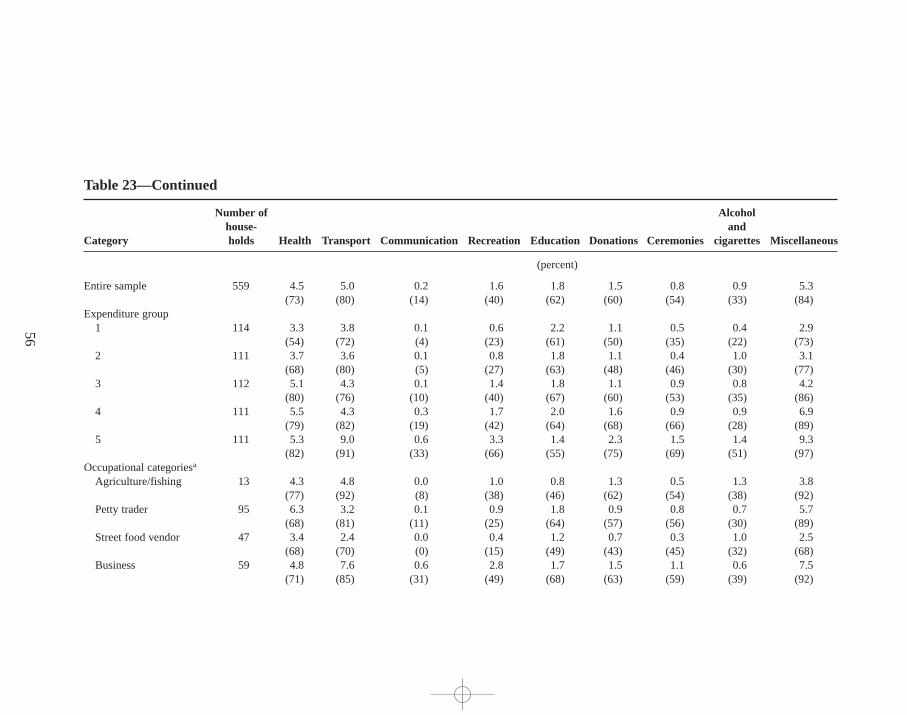
56
Table 23—Continued
Number of Alcoholhouse- and
Category holds Health Transport Communication Recreation Education Donations Ceremonies cigarettes Miscellaneous
(percent)
Entire sample 559 4.5 5.0 0.2 1.6 1.8 1.5 0.8 0.9 5.3(73) (80) (14) (40) (62) (60) (54) (33) (84)
Expenditure group1 114 3.3 3.8 0.1 0.6 2.2 1.1 0.5 0.4 2.9
(54) (72) (4) (23) (61) (50) (35) (22) (73)2 111 3.7 3.6 0.1 0.8 1.8 1.1 0.4 1.0 3.1
(68) (80) (5) (27) (63) (48) (46) (30) (77)3 112 5.1 4.3 0.1 1.4 1.8 1.1 0.9 0.8 4.2
(80) (76) (10) (40) (67) (60) (53) (35) (86)4 111 5.5 4.3 0.3 1.7 2.0 1.6 0.9 0.9 6.9
(79) (82) (19) (42) (64) (68) (66) (28) (89)5 111 5.3 9.0 0.6 3.3 1.4 2.3 1.5 1.4 9.3
(82) (91) (33) (66) (55) (75) (69) (51) (97)Occupational categoriesa
Agriculture/fishing 13 4.3 4.8 0.0 1.0 0.8 1.3 0.5 1.3 3.8(77) (92) (8) (38) (46) (62) (54) (38) (92)
Petty trader 95 6.3 3.2 0.1 0.9 1.8 0.9 0.8 0.7 5.7(68) (81) (11) (25) (64) (57) (56) (30) (89)
Street food vendor 47 3.4 2.4 0.0 0.4 1.2 0.7 0.3 1.0 2.5(68) (70) (0) (15) (49) (43) (45) (32) (68)
Business 59 4.8 7.6 0.6 2.8 1.7 1.5 1.1 0.6 7.5(71) (85) (31) (49) (68) (63) (59) (39) (92)
maxw
ell ch
ap05 5
/9/0
8:2
9 P
M P
age 5
6
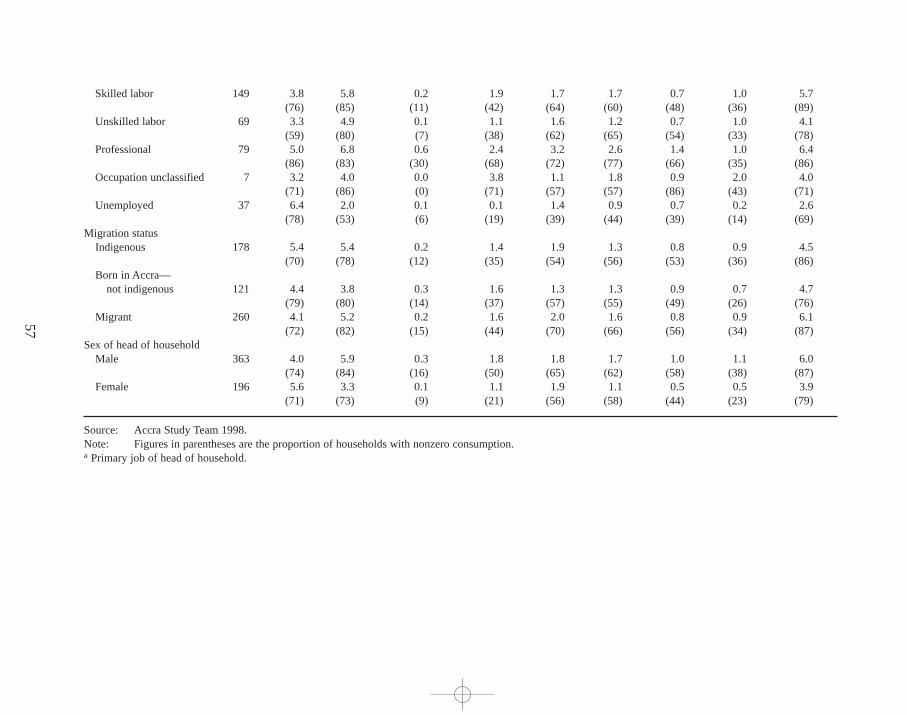
57
Skilled labor 149 3.8 5.8 0.2 1.9 1.7 1.7 0.7 1.0 5.7(76) (85) (11) (42) (64) (60) (48) (36) (89)
Unskilled labor 69 3.3 4.9 0.1 1.1 1.6 1.2 0.7 1.0 4.1(59) (80) (7) (38) (62) (65) (54) (33) (78)
Professional 79 5.0 6.8 0.6 2.4 3.2 2.6 1.4 1.0 6.4(86) (83) (30) (68) (72) (77) (66) (35) (86)
Occupation unclassified 7 3.2 4.0 0.0 3.8 1.1 1.8 0.9 2.0 4.0(71) (86) (0) (71) (57) (57) (86) (43) (71)
Unemployed 37 6.4 2.0 0.1 0.1 1.4 0.9 0.7 0.2 2.6(78) (53) (6) (19) (39) (44) (39) (14) (69)
Migration statusIndigenous 178 5.4 5.4 0.2 1.4 1.9 1.3 0.8 0.9 4.5
(70) (78) (12) (35) (54) (56) (53) (36) (86)Born in Accra—
not indigenous 121 4.4 3.8 0.3 1.6 1.3 1.3 0.9 0.7 4.7(79) (80) (14) (37) (57) (55) (49) (26) (76)
Migrant 260 4.1 5.2 0.2 1.6 2.0 1.6 0.8 0.9 6.1(72) (82) (15) (44) (70) (66) (56) (34) (87)
Sex of head of householdMale 363 4.0 5.9 0.3 1.8 1.8 1.7 1.0 1.1 6.0
(74) (84) (16) (50) (65) (62) (58) (38) (87)Female 196 5.6 3.3 0.1 1.1 1.9 1.1 0.5 0.5 3.9
(71) (73) (9) (21) (56) (58) (44) (23) (79)
Source: Accra Study Team 1998.Note: Figures in parentheses are the proportion of households with nonzero consumption.a Primary job of head of household.
maxw
ell ch
ap05 5
/9/0
8:2
9 P
M P
age 5
7
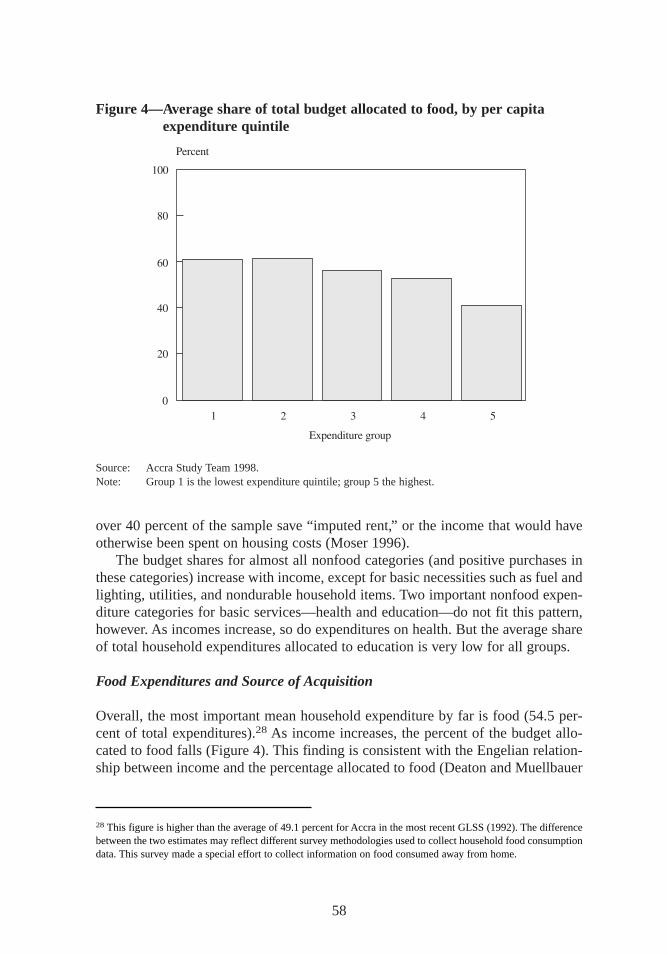
over 40 percent of the sample save “imputed rent,” or the income that would haveotherwise been spent on housing costs (Moser 1996).
The budget shares for almost all nonfood categories (and positive purchases inthese categories) increase with income, except for basic necessities such as fuel andlighting, utilities, and nondurable household items. Two important nonfood expen-diture categories for basic services—health and education—do not fit this pattern,however. As incomes increase, so do expenditures on health. But the average shareof total household expenditures allocated to education is very low for all groups.
Food Expenditures and Source of Acquisition
Overall, the most important mean household expenditure by far is food (54.5 per-cent of total expenditures).28 As income increases,the percent of the budget allo-cated to food falls (Figure 4). This finding is consistent with the Engelian relation-ship between income and the percentage allocated to food (Deaton and Muellbauer
58
Figure 4—Average share of total budget allocated to food, by per capitaexpenditure quintile
Source: Accra Study Team 1998.Note: Group 1 is the lowest expenditure quintile; group 5 the highest.
28 This figure is higher than the average of 49.1 percent for Accra in the most recent GLSS (1992). The differencebetween the two estimates may reflect different survey methodologies used to collect household food consumptiondata. This survey made a special effort to collect information on food consumed away from home.
maxwell chap05 5/9/0 8:29 PM Page 58
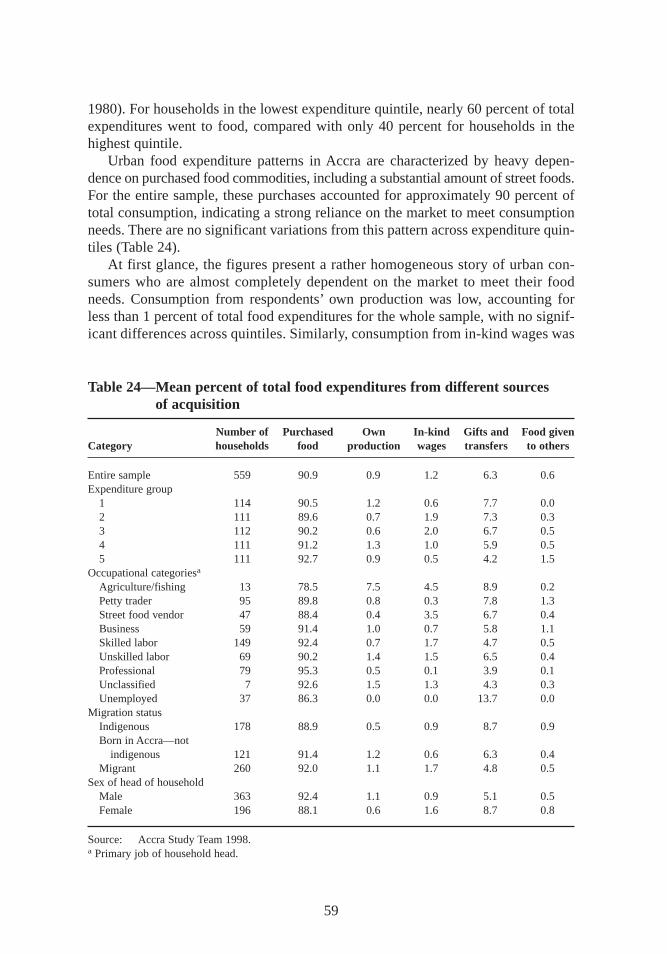
1980). For households in the lowest expenditure quintile, nearly 60 percent of totalexpenditures went to food, compared with only 40 percent for households in thehighest quintile.
Urban food expenditure patterns in Accra are characterized by heavy depen-dence on purchased food commodities,including a substantial amount of street foods.For the entire sample, these purchases accounted for approximately 90 percent oftotal consumption,indicating a strong reliance on the market to meet consumptionneeds. There are no significant variations from this pattern across expenditure quin-tiles (Table 24).
At first glance, the figures present a rather homogeneous story of urban con-sumers who are almost completely dependent on the market to meet their foodneeds. Consumption from respondents’own production was low, accounting forless than 1 percent of total food expenditures for the whole sample, with no signif-icant differences across quintiles. Similarly, consumption from in-kind wages was
59
Table 24—Mean percent of total food expenditures from different sources of acquisition
Number of Purchased Own In-kind Gifts and Food givenCategory households food production wages tr ansfers to others
Entire sample 559 90.9 0.9 1.2 6.3 0.6Expenditure group
1 114 90.5 1.2 0.6 7.7 0.02 111 89.6 0.7 1.9 7.3 0.33 112 90.2 0.6 2.0 6.7 0.54 111 91.2 1.3 1.0 5.9 0.55 111 92.7 0.9 0.5 4.2 1.5
Occupational categoriesa
Agriculture/fishing 13 78.5 7.5 4.5 8.9 0.2Petty trader 95 89.8 0.8 0.3 7.8 1.3Street food vendor 47 88.4 0.4 3.5 6.7 0.4Business 59 91.4 1.0 0.7 5.8 1.1Skilled labor 149 92.4 0.7 1.7 4.7 0.5Unskilled labor 69 90.2 1.4 1.5 6.5 0.4Professional 79 95.3 0.5 0.1 3.9 0.1Unclassified 7 92.6 1.5 1.3 4.3 0.3Unemployed 37 86.3 0.0 0.0 13.7 0.0
Migration statusIndigenous 178 88.9 0.5 0.9 8.7 0.9Born in Accra—not
indigenous 121 91.4 1.2 0.6 6.3 0.4Migrant 260 92.0 1.1 1.7 4.8 0.5
Sex of head of householdMale 363 92.4 1.1 0.9 5.1 0.5Female 196 88.1 0.6 1.6 8.7 0.8
Source: Accra Study Team 1998.a Primary job of household head.
maxwell chap05 5/9/0 8:29 PM Page 59
minimal, accounting for about 1 percent of total food expenditures. However, aslightly richer story emerges when the budget shares are explored by occupationgroups. Only 5.8 percent of the individuals interviewed in the survey had been ac-tive in agriculture, livestock, or fishing in the previous 30 days. Most individualsearned their living through petty trade, street food vending, small- and large-scaleenterprises,wage labor, or professional services in a competitive and densely pop-ulated urban environment. Even households that depend on agriculture and fishingas their main livelihood got only 7.5 percent of their total food from their own pro-duction (mainly farming) and only 4.5 percent from wages in kind (mainly fishing).
Gifts and transfers represented the second most important source of food, oraround 6 percent of total food expenditures. The share of food from gifts and trans-fers accounted for almost 8 percent of total consumption for households in the low-est quintile and was significantly higher than for households in the higher quintiles.Households engaged in agriculture relied on gifts and transfers for 8.9 percent oftotal food expenditures, petty traders for 7–8 percent, and the unemployed foralmost 14 percent. Households with income from protected wage labor and self-employment in productive activities—that is, with relatively secure incomes—reliedmore heavily on purchased food. Gifts and transfers accounted for a significantlyhigher share of food consumption in indigenous households in Accra than in migranthouseholds.29 Similarly, female-headed households relied more on transfers for food(9 percent of total food consumption) than households headed by men.
The Kinds of Foods Households Buy
Researchers collected information on more than 160 food items (grouped into 14food categories) for a seven-day period. Ten groups included unprepared purchasedfoodsand four included prepared foods. Prepared foods are already cooked andready to eat and are obtained outside the home. This category includes Accra’s streetfoods:snacks,porridges,prepared staple foods,and prepared meals consisting of astaple food item,a soup or sauce, and sometimes a piece of fish, meat, or egg.30
Cigarettes,alcoholic beverages,and nonalcoholic beverages are not included inthis definition of street foods.
Grains,cereals,roots,and tubers dominate the total food consumption basketin Ghana for both urban and rural households. According to the latest GLSS(1991–92),41.3 percent of the total food budget went toward purchasing these com-modities. In Accra,28 percent of total food outlays went toward purchasing cereals
60
29 In addition to direct receipts of food, households also receive cash transfers that are used to obtain food. Thedata on food received as gifts captures the former. Cash transfers that were used to purchase food are capturedunder “purchases.”30 Tinker’s definition of street foods includes “any minimally processed food sold on the street for immediateconsumption”and “purchased food that could be eaten on the spot but that was carried home or to the office” (Tin-ker 1997,15).
maxwell chap05 5/9/0 8:29 PM Page 60
and roots and tubers. The country’s most common staple foods are dough preparedfrom maize (banku,kenkey), millet or sorghum (tuo zaafi), and cassava, yams,andplantains (fufu, konkonte, gari). In urban centers, wheat bread and fermented por-ridge are widely consumed as breakfast foods,and rice is becoming more popular.
The mean budget share for cereals and roots and tubers is 23 percent (Table 25).Meat and fish are the next most important commodity group, accounting for 16percent of total food outlays. Vegetables,fats and oils,and eggs and dairy are alsoimportant food items,accounting for more than 18 percent of the average foodbudget. Street foods account for one-third of total food expenditures,of which morethan half goes for prepared meals.
Better-off households have a relatively diversified diet containing foods fromanimal as well as vegetable sources. Low-income households have a less diversifieddiet and are more likely to consume large amounts of staple foods. Case studies ofvery low-income households revealed that staples are the only food these house-holds can afford a good deal of the time. Within the staple foods category, grainsand cereals account for a significantly higher share of the food budget in low-incomehouseholds. However, there are no significant differences in the budget shares forroots and tubers across income groups. Households in the highest expendituregroup allocate a significantly higher share of their food budget to foods in the non-staple category, including fruits and vegetables,meat and fish, and eggs and dairyproducts,and to nonalcoholic beverages such as tea,coffee, and soft drinks.
Urban consumption patterns are less dominated by staple foods than rural con-sumption patterns. Urban households allocate more of their food budget to com-plimentary food groups such as meat and fish, vegetables, fats and oils,and dairyproducts and eggs (Alderman and Higgins 1992). Differences in incomes betweenrural and urban households are likely to influence diets,but other factors are alsoimportant. Differences in livelihood strategies and time constraints in urban areas,for instance, have increased the consumption of street foods.
Consumption of Street Foods
Urban consumers in Accra purchase a wide variety of foods away from home to meettheir needs throughout the day. The majority of these foods are found on the street,including snacks, breakfast foods such as porridge, and lunches,which generallyconsist of a prepared staple food dish and a soup or stew. Almost all households pur-chase some prepared food away from home, and a number of households are almosttotally dependent on street foods (Figure 5). Among households in the lowest ex-penditure quintile, 39 percent of the total food budget goes to purchasing snacks andmeals away from home (Table 26 and Figure 6). Households in the highest expendi-ture category spend about 25 percent of their total food budget on street foods.
Street food consumption is related not only to income but also to other factors,including whether women in the household work, the kinds of time constraints thataffect principal homemakers, income fluctuations,proximity to markets,and house-hold demographics. The high level of street food purchases may indicate that the
61
maxwell chap05 5/9/0 8:29 PM Page 61
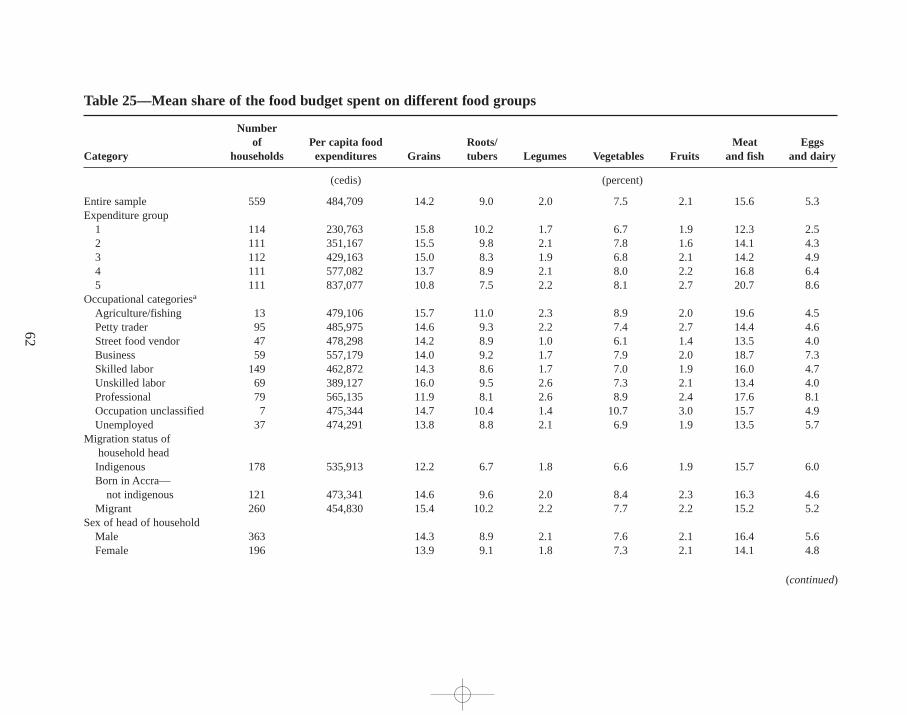
62
Table 25—Mean share of the food budget spent on different food groups
Numberof Per capita food Roots/ Meat Eggs
Category households expenditures Grains tubers Legumes Vegetables Fruits and fish and dairy
(cedis) (percent)
Entire sample 559 484,709 14.2 9.0 2.0 7.5 2.1 15.6 5.3Expenditure group
1 114 230,763 15.8 10.2 1.7 6.7 1.9 12.3 2.52 111 351,167 15.5 9.8 2.1 7.8 1.6 14.1 4.33 112 429,163 15.0 8.3 1.9 6.8 2.1 14.2 4.94 111 577,082 13.7 8.9 2.1 8.0 2.2 16.8 6.45 111 837,077 10.8 7.5 2.2 8.1 2.7 20.7 8.6
Occupational categoriesa
Agriculture/fishing 13 479,106 15.7 11.0 2.3 8.9 2.0 19.6 4.5Petty trader 95 485,975 14.6 9.3 2.2 7.4 2.7 14.4 4.6Street food vendor 47 478,298 14.2 8.9 1.0 6.1 1.4 13.5 4.0Business 59 557,179 14.0 9.2 1.7 7.9 2.0 18.7 7.3Skilled labor 149 462,872 14.3 8.6 1.7 7.0 1.9 16.0 4.7Unskilled labor 69 389,127 16.0 9.5 2.6 7.3 2.1 13.4 4.0Professional 79 565,135 11.9 8.1 2.6 8.9 2.4 17.6 8.1Occupation unclassified 7 475,344 14.7 10.4 1.4 10.7 3.0 15.7 4.9Unemployed 37 474,291 13.8 8.8 2.1 6.9 1.9 13.5 5.7
Migration status ofhousehold headIndigenous 178 535,913 12.2 6.7 1.8 6.6 1.9 15.7 6.0Born in Accra—
not indigenous 121 473,341 14.6 9.6 2.0 8.4 2.3 16.3 4.6Migrant 260 454,830 15.4 10.2 2.2 7.7 2.2 15.2 5.2
Sex of head of householdMale 363 14.3 8.9 2.1 7.6 2.1 16.4 5.6Female 196 13.9 9.1 1.8 7.3 2.1 14.1 4.8
(continued)
maxw
ell ch
ap05 5
/9/0
8:2
9 P
M P
age 6
2
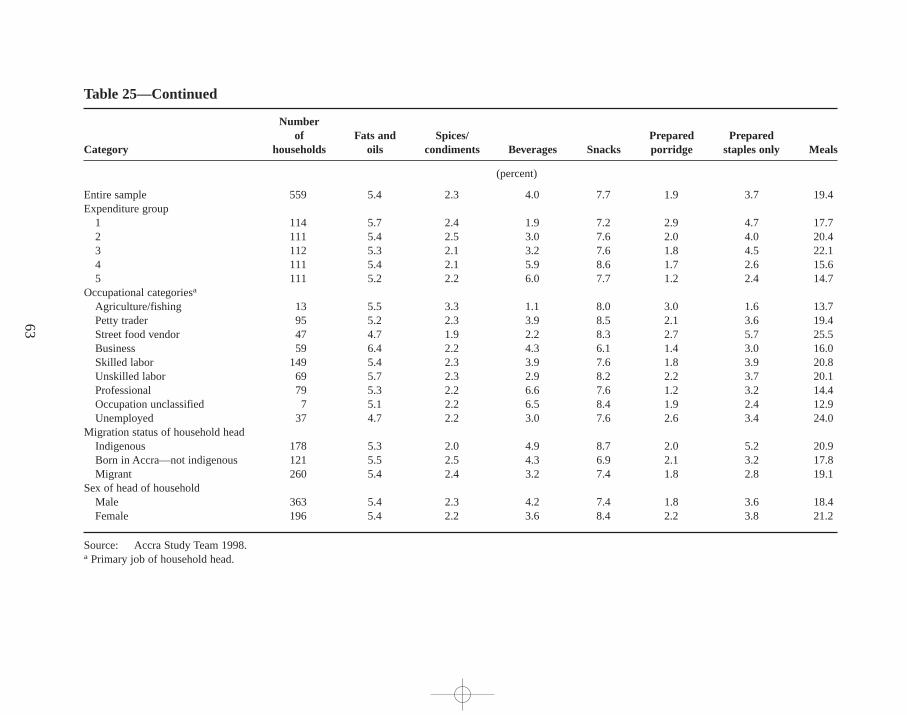
63
Table 25—Continued
Numberof Fats and Spices/ Prepared Prepared
Category households oils condiments Beverages Snacks porr idge staples only Meals
(percent)
Entire sample 559 5.4 2.3 4.0 7.7 1.9 3.7 19.4Expenditure group
1 114 5.7 2.4 1.9 7.2 2.9 4.7 17.72 111 5.4 2.5 3.0 7.6 2.0 4.0 20.43 112 5.3 2.1 3.2 7.6 1.8 4.5 22.14 111 5.4 2.1 5.9 8.6 1.7 2.6 15.65 111 5.2 2.2 6.0 7.7 1.2 2.4 14.7
Occupational categoriesa
Agriculture/fishing 13 5.5 3.3 1.1 8.0 3.0 1.6 13.7Petty trader 95 5.2 2.3 3.9 8.5 2.1 3.6 19.4Street food vendor 47 4.7 1.9 2.2 8.3 2.7 5.7 25.5Business 59 6.4 2.2 4.3 6.1 1.4 3.0 16.0Skilled labor 149 5.4 2.3 3.9 7.6 1.8 3.9 20.8Unskilled labor 69 5.7 2.3 2.9 8.2 2.2 3.7 20.1Professional 79 5.3 2.2 6.6 7.6 1.2 3.2 14.4Occupation unclassified 7 5.1 2.2 6.5 8.4 1.9 2.4 12.9Unemployed 37 4.7 2.2 3.0 7.6 2.6 3.4 24.0
Migration status of household headIndigenous 178 5.3 2.0 4.9 8.7 2.0 5.2 20.9Born in Accra—not indigenous 121 5.5 2.5 4.3 6.9 2.1 3.2 17.8Migrant 260 5.4 2.4 3.2 7.4 1.8 2.8 19.1
Sex of head of householdMale 363 5.4 2.3 4.2 7.4 1.8 3.6 18.4Female 196 5.4 2.2 3.6 8.4 2.2 3.8 21.2
Source: Accra Study Team 1998.a Primary job of household head.
maxw
ell ch
ap05 5
/9/0
8:2
9 P
M P
age 6
3
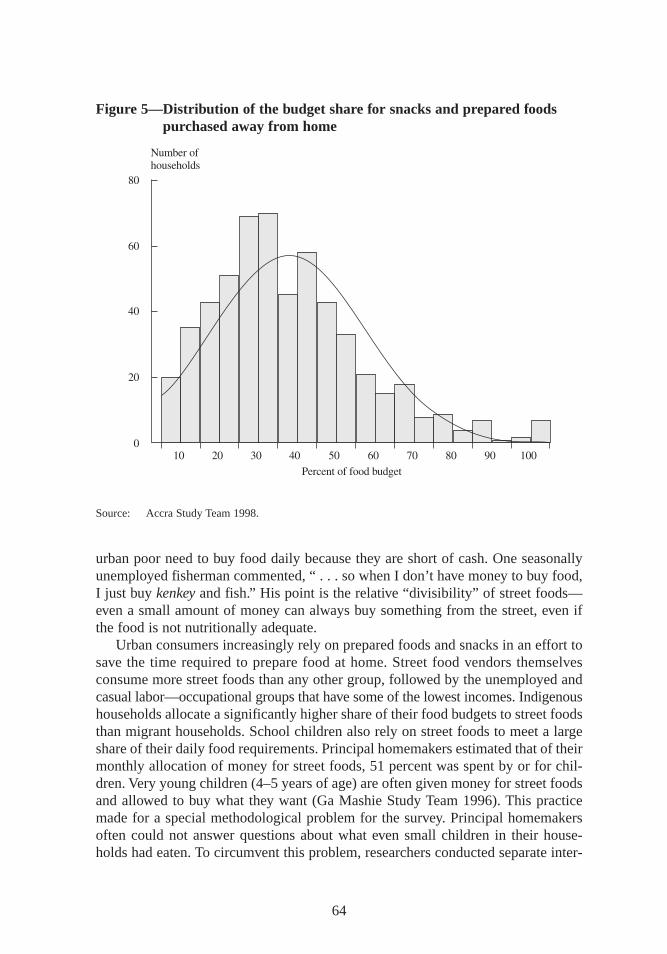
urban poor need to buy food daily because they are short of cash. One seasonallyunemployed fisherman commented, “ . . . so when I don’t have money to buy food,I just buy kenkey and fish.” His point is the relative “divisibility” of street foods—even a small amount of money can always buy something from the street,even ifthe food is not nutritionally adequate.
Urban consumers increasingly rely on prepared foods and snacks in an effort tosave the time required to prepare food at home. Street food vendors themselvesconsume more street foods than any other group,followed by the unemployed andcasual labor—occupational groups that have some of the lowest incomes. Indigenoushouseholds allocate a significantly higher share of their food budgets to street foodsthan migrant households. School children also rely on street foods to meet a largeshare of their daily food requirements. Principal homemakers estimated that of theirmonthly allocation of money for street foods,51 percent was spent by or for chil-dren. Very young children (4–5 years of age) are often given money for street foodsand allowed to buy what they want (Ga Mashie Study Team 1996). This practicemade for a special methodological problem for the survey. Principal homemakersoften could not answer questions about what even small children in their house-holds had eaten. To circumvent this problem, researchers conducted separate inter-
64
Figure 5—Distr ibution of the budget share for snacks and prepared foodspurchased away from home
Source: Accra Study Team 1998.
maxwell chap05 5/9/0 8:29 PM Page 64
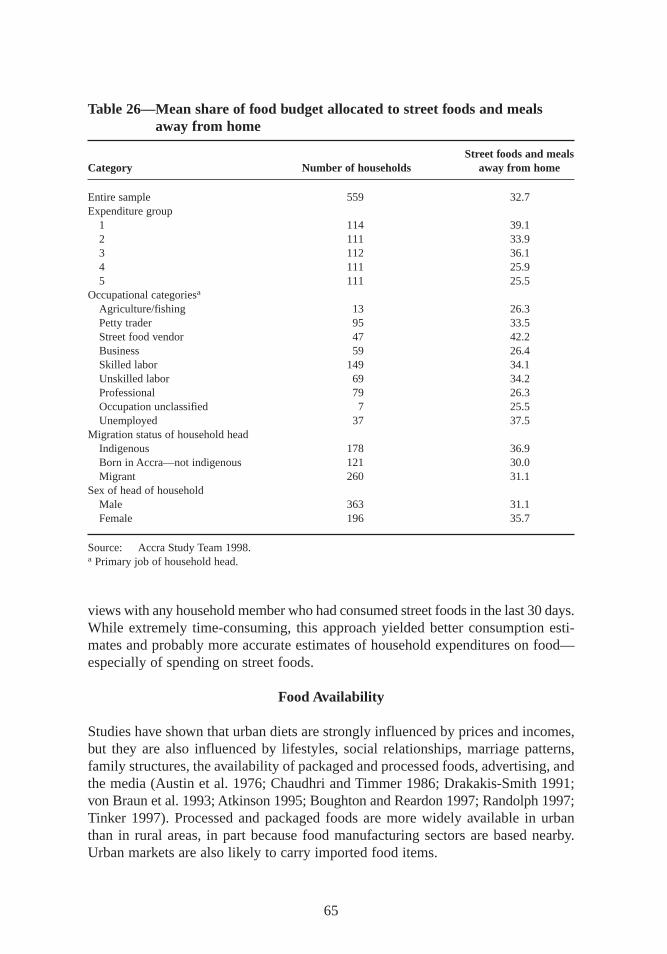
views with any household member who had consumed street foods in the last 30 days.While extremely time-consuming, this approach yielded better consumption esti-mates and probably more accurate estimates of household expenditures on food—especially of spending on street foods.
Food Availability
Studies have shown that urban diets are strongly influenced by prices and incomes,but they are also influenced by lif estyles,social relationships,marriage patterns,family structures,the availability of packaged and processed foods,advertising, andthe media (Austin et al. 1976; Chaudhri and Timmer 1986; Drakakis-Smith 1991;von Braun et al. 1993; Atkinson 1995; Boughton and Reardon 1997; Randolph 1997;Tinker 1997). Processed and packaged foods are more widely available in urbanthan in rural areas,in part because food manufacturing sectors are based nearby.Urban markets are also likely to carry imported food items.
65
Table 26—Mean share of food budget allocated to street foods and mealsaway from home
Street foods and mealsCategory Number of households away from home
Entire sample 559 32.7Expenditure group
1 114 39.12 111 33.93 112 36.14 111 25.95 111 25.5
Occupational categoriesa
Agriculture/fishing 13 26.3Petty trader 95 33.5Street food vendor 47 42.2Business 59 26.4Skilled labor 149 34.1Unskilled labor 69 34.2Professional 79 26.3Occupation unclassified 7 25.5Unemployed 37 37.5
Migration status of household headIndigenous 178 36.9Born in Accra—not indigenous 121 30.0Migrant 260 31.1
Sex of head of householdMale 363 31.1Female 196 35.7
Source: Accra Study Team 1998.a Primary job of household head.
maxwell chap05 5/9/0 8:29 PM Page 65
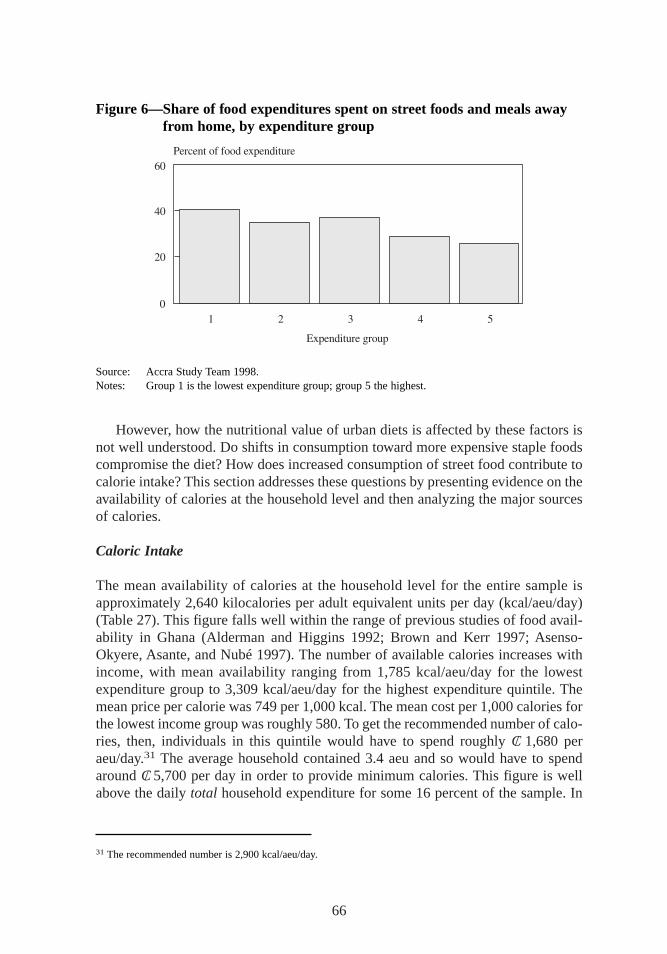
However, how the nutritional value of urban diets is affected by these factors isnot well understood. Do shifts in consumption toward more expensive staple foodscompromise the diet? How does increased consumption of street food contribute tocalorie intake? This section addresses these questions by presenting evidence on theavailability of calories at the household level and then analyzing the major sourcesof calories.
Caloric Intake
The mean availability of calories at the household level for the entire sample isapproximately 2,640 kilocalories per adult equivalent units per day (kcal/aeu/day)(Table 27). This figure falls well within the range of previous studies of food avail-ability in Ghana (Alderman and Higgins 1992; Brown and Kerr 1997; Asenso-Okyere, Asante, and Nubé 1997). The number of available calories increases withincome, with mean availability ranging from 1,785 kcal/aeu/day for the lowestexpenditure group to 3,309 kcal/aeu/day for the highest expenditure quintile. Themean price per calorie was 749 per 1,000 kcal. The mean cost per 1,000 calories forthe lowest income group was roughly 580. To get the recommended number of calo-ries, then, individuals in this quintile would have to spend roughly C/ 1,680 peraeu/day.31 The average household contained 3.4 aeu and so would have to spendaround C/ 5,700 per day in order to provide minimum calories. This figure is wellabove the daily total household expenditure for some 16 percent of the sample. In
66
Figure 6—Share of food expenditures spent on street foods and meals awayfr om home, by expenditure group
Source: Accra Study Team 1998.Notes: Group 1 is the lowest expenditure group; group 5 the highest.
31 The recommended number is 2,900 kcal/aeu/day.
maxwell chap05 5/9/0 8:29 PM Page 66
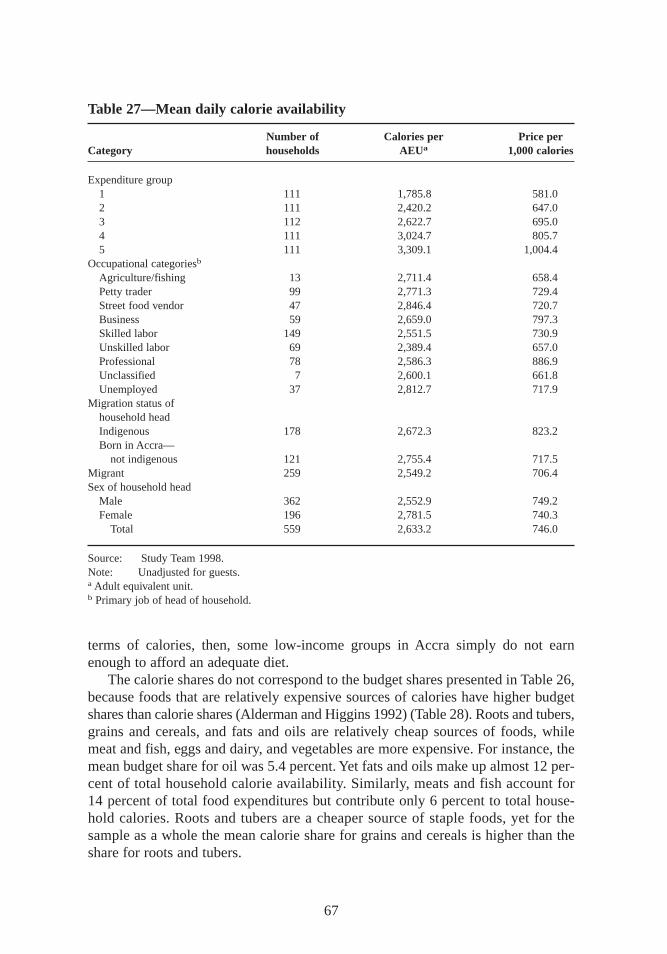
terms of calories, then, some low-income groups in Accra simply do not earnenough to afford an adequate diet.
The calorie shares do not correspond to the budget shares presented in Table 26,because foods that are relatively expensive sources of calories have higher budgetshares than calorie shares (Alderman and Higgins 1992) (Table 28). Roots and tubers,grains and cereals,and fats and oils are relatively cheap sources of foods,whilemeat and fish,eggs and dairy, and vegetables are more expensive. For instance, themean budget share for oil was 5.4 percent. Yet fats and oils make up almost 12 per-cent of total household calorie availability. Similarly, meats and fish account for14 percent of total food expenditures but contribute only 6 percent to total house-hold calories. Roots and tubers are a cheaper source of staple foods,yet for thesample as a whole the mean calorie share for grains and cereals is higher than theshare for roots and tubers.
67
Table 27—Mean daily calorie availability
Number of Calories per Price perCategory households AEUa 1,000 calories
Expenditure group1 111 1,785.8 581.02 111 2,420.2 647.03 112 2,622.7 695.04 111 3,024.7 805.75 111 3,309.1 1,004.4
Occupational categoriesb
Agriculture/fishing 13 2,711.4 658.4Petty trader 99 2,771.3 729.4Street food vendor 47 2,846.4 720.7Business 59 2,659.0 797.3Skilled labor 149 2,551.5 730.9Unskilled labor 69 2,389.4 657.0Professional 78 2,586.3 886.9Unclassified 7 2,600.1 661.8Unemployed 37 2,812.7 717.9
Migration status ofhousehold headIndigenous 178 2,672.3 823.2Born in Accra—
not indigenous 121 2,755.4 717.5Migrant 259 2,549.2 706.4Sex of household head
Male 362 2,552.9 749.2Female 196 2,781.5 740.3
Total 559 2,633.2 746.0
Source: Study Team 1998.Note: Unadjusted for guests.a Adult equivalent unit.b Primary job of head of household.
maxwell chap05 5/9/0 8:29 PM Page 67
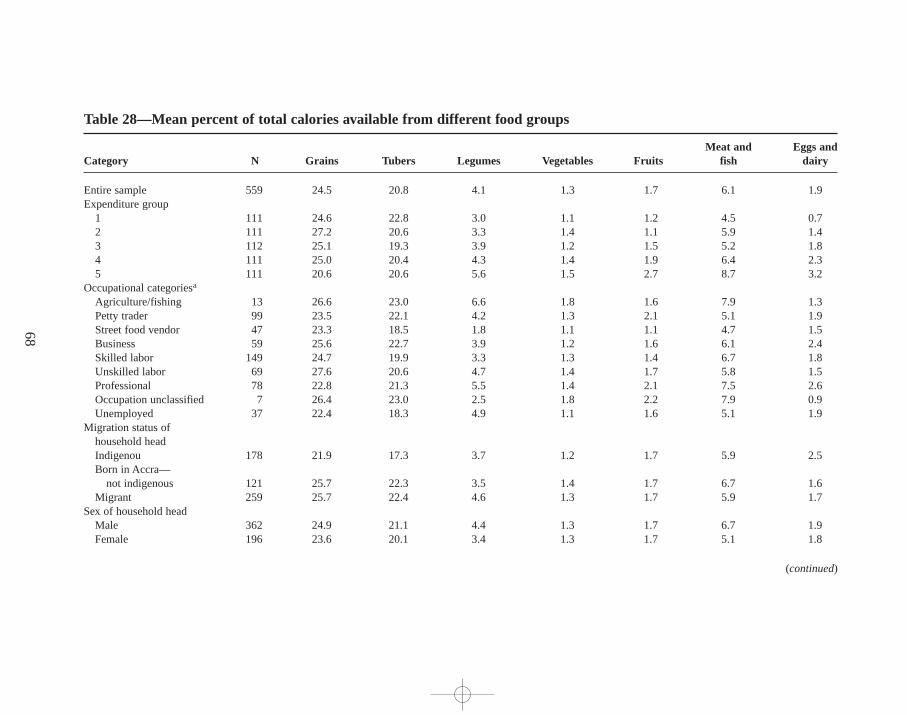
68
Table 28—Mean percent of total calories available from different food groups
Meat and Eggs and Category N Grains Tubers Legumes Vegetables Fruits fish dairy
Entire sample 559 24.5 20.8 4.1 1.3 1.7 6.1 1.9Expenditure group
1 111 24.6 22.8 3.0 1.1 1.2 4.5 0.72 111 27.2 20.6 3.3 1.4 1.1 5.9 1.43 112 25.1 19.3 3.9 1.2 1.5 5.2 1.84 111 25.0 20.4 4.3 1.4 1.9 6.4 2.35 111 20.6 20.6 5.6 1.5 2.7 8.7 3.2
Occupational categoriesa
Agriculture/fishing 13 26.6 23.0 6.6 1.8 1.6 7.9 1.3Petty trader 99 23.5 22.1 4.2 1.3 2.1 5.1 1.9Street food vendor 47 23.3 18.5 1.8 1.1 1.1 4.7 1.5Business 59 25.6 22.7 3.9 1.2 1.6 6.1 2.4Skilled labor 149 24.7 19.9 3.3 1.3 1.4 6.7 1.8Unskilled labor 69 27.6 20.6 4.7 1.4 1.7 5.8 1.5Professional 78 22.8 21.3 5.5 1.4 2.1 7.5 2.6Occupation unclassified 7 26.4 23.0 2.5 1.8 2.2 7.9 0.9Unemployed 37 22.4 18.3 4.9 1.1 1.6 5.1 1.9
Migration status ofhousehold headIndigenou 178 21.9 17.3 3.7 1.2 1.7 5.9 2.5Born in Accra—
not indigenous 121 25.7 22.3 3.5 1.4 1.7 6.7 1.6Migrant 259 25.7 22.4 4.6 1.3 1.7 5.9 1.7
Sex of household headMale 362 24.9 21.1 4.4 1.3 1.7 6.7 1.9Female 196 23.6 20.1 3.4 1.3 1.7 5.1 1.8
(continued)
maxw
ell ch
ap05 5
/9/0
8:2
9 P
M P
age 6
8
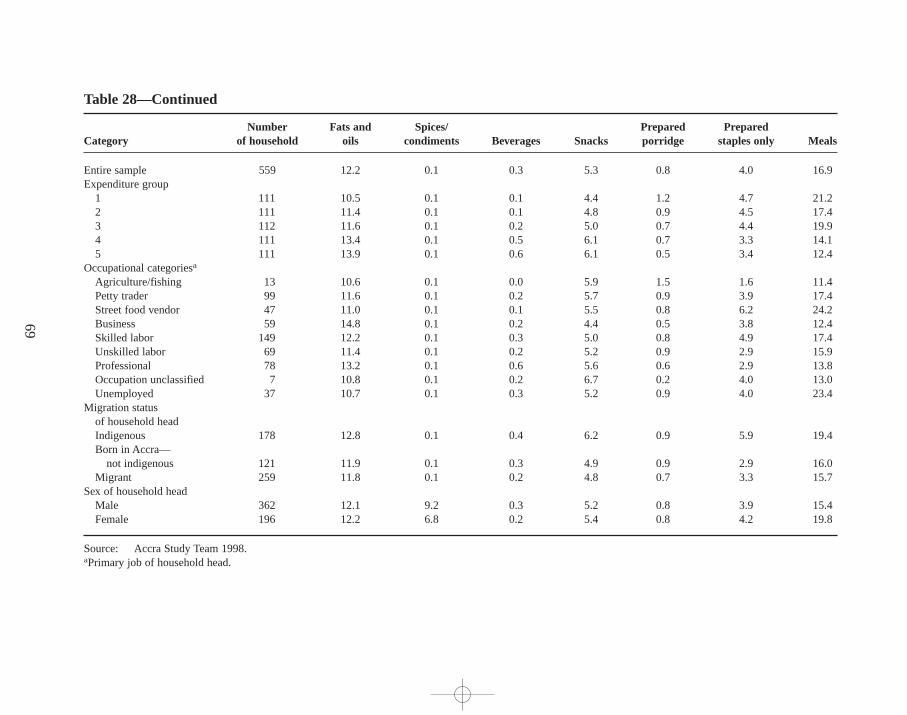
69
Table 28—Continued
Number Fats and Spices/ Prepared Prepared Category of household oils condiments Beverages Snacks porr idge staples only Meals
Entire sample 559 12.2 0.1 0.3 5.3 0.8 4.0 16.9Expenditure group
1 111 10.5 0.1 0.1 4.4 1.2 4.7 21.22 111 11.4 0.1 0.1 4.8 0.9 4.5 17.43 112 11.6 0.1 0.2 5.0 0.7 4.4 19.94 111 13.4 0.1 0.5 6.1 0.7 3.3 14.15 111 13.9 0.1 0.6 6.1 0.5 3.4 12.4
Occupational categoriesa
Agriculture/fishing 13 10.6 0.1 0.0 5.9 1.5 1.6 11.4Petty trader 99 11.6 0.1 0.2 5.7 0.9 3.9 17.4Street food vendor 47 11.0 0.1 0.1 5.5 0.8 6.2 24.2Business 59 14.8 0.1 0.2 4.4 0.5 3.8 12.4Skilled labor 149 12.2 0.1 0.3 5.0 0.8 4.9 17.4Unskilled labor 69 11.4 0.1 0.2 5.2 0.9 2.9 15.9Professional 78 13.2 0.1 0.6 5.6 0.6 2.9 13.8Occupation unclassified 7 10.8 0.1 0.2 6.7 0.2 4.0 13.0Unemployed 37 10.7 0.1 0.3 5.2 0.9 4.0 23.4
Migration statusof household headIndigenous 178 12.8 0.1 0.4 6.2 0.9 5.9 19.4Born in Accra—
not indigenous 121 11.9 0.1 0.3 4.9 0.9 2.9 16.0Migrant 259 11.8 0.1 0.2 4.8 0.7 3.3 15.7
Sex of household headMale 362 12.1 9.2 0.3 5.2 0.8 3.9 15.4Female 196 12.2 6.8 0.2 5.4 0.8 4.2 19.8
Source: Accra Study Team 1998.aPrimary job of household head.
maxw
ell ch
ap05 5
/9/0
8:2
9 P
M P
age 6
9
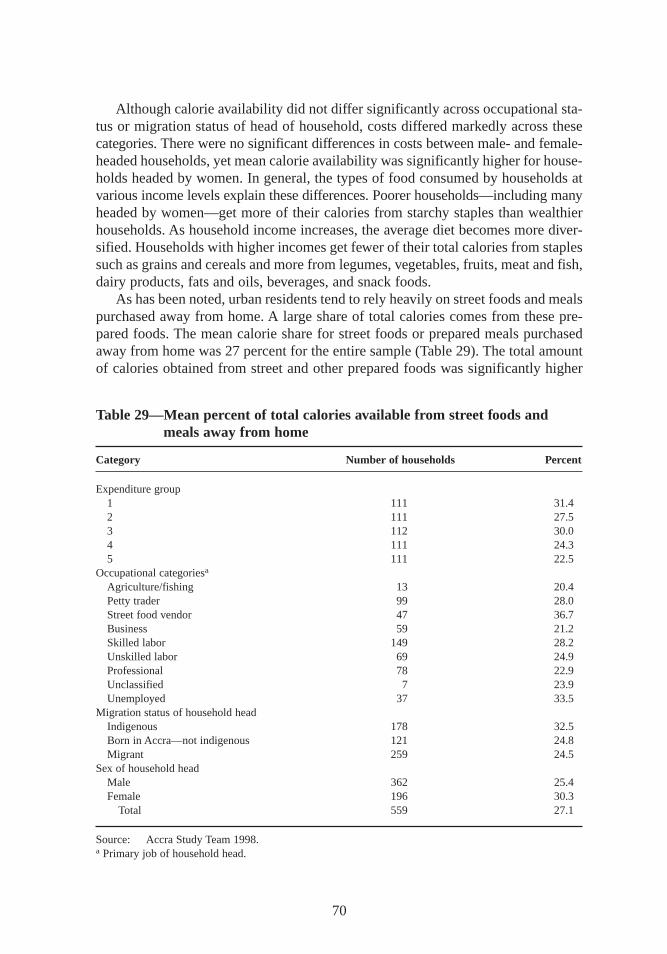
Although calorie availability did not differ significantly across occupational sta-tus or migration status of head of household, costs differed markedly across thesecategories. There were no significant differences in costs between male- and female-headed households,yet mean calorie availability was significantly higher for house-holds headed by women. In general, the types of food consumed by households atvarious income levels explain these differences. Poorer households—including manyheaded by women—get more of their calories from starchy staples than wealthierhouseholds. As household income increases,the average diet becomes more diver-sified. Households with higher incomes get fewer of their total calories from staplessuch as grains and cereals and more from legumes,vegetables,fruits,meat and fish,dairy products,fats and oils,beverages,and snack foods.
As has been noted, urban residents tend to rely heavily on street foods and mealspurchased away from home. A large share of total calories comes from these pre-pared foods. The mean calorie share for street foods or prepared meals purchasedaway from home was 27 percent for the entire sample (Table 29). The total amountof calories obtained from street and other prepared foods was significantly higher
70
Table 29—Mean percent of total calories available from street foods andmeals away from home
Category Number of households Percent
Expenditure group1 111 31.42 111 27.53 112 30.04 111 24.35 111 22.5
Occupational categoriesa
Agriculture/fishing 13 20.4Petty trader 99 28.0Street food vendor 47 36.7Business 59 21.2Skilled labor 149 28.2Unskilled labor 69 24.9Professional 78 22.9Unclassified 7 23.9Unemployed 37 33.5
Migration status of household headIndigenous 178 32.5Born in Accra—not indigenous 121 24.8Migrant 259 24.5
Sex of household headMale 362 25.4Female 196 30.3
Total 559 27.1
Source: Accra Study Team 1998.a Primary job of household head.
maxwell chap05 5/9/0 8:29 PM Page 70
for households in the lowest income group,accounting for just over 30 percent oftotal calorie availability. Indigenous households obtained significantly more of theircalories from prepared foods than migrant households,and female-headed house-holds had higher calorie shares from these foods than male-headed households.Calories from prepared meals accounted for almost 62 percent of all calories pur-chased away from home.
Food Contamination
Qualitative investigations suggest a strong link between reliance on street foods andthe prevalence of gastrointestinal infections,presumably because street foods areeasily contaminated. This connection manifested itself in complaints of diarrhea or“upset stomach,” conditions that were often blamed on poorly cooked food or thesanitary conditions under which the food was prepared or sold (Ga Mashie StudyTeam 1996). However, case study informants repeatedly mentioned that they knewwhich street food sellers were careful in preparing their foods and practiced ac-ceptable levels of cleanliness. One mother noted, “Don’t you see those women sell-ing food by the big drain [an open sewer]? Flies land on their food, and if we eat it,we get sick.” Street food vendors are aware of this problem as well. One noted, “Ifyou do not cook [the food] well, everyone will boycott you, because what you areselling is being sold by dozens of people in the same vicinity. . . . ”
Levels of contamination in street foods may indeed be high (FAO 1996). Akpe-donu (1996) reports that in general, snack foods purchased on the streets of Accraare safe from bacterial contamination. But she notes that prepared meals,and espe-cially uncooked vegetables (in salad condiments served with prepared meals,forexample),have high levels of contamination. This study did not test the relationshipbetween street food consumption and individual health outcomes. However, otherstudies on food contamination in Accra (Mensah et al. 1995) note that levels of con-tamination in foods prepared at home may also be high. Thus street foods may notbe the only cause of bacterial gastrointestinal infections.
Coping with Limited Food
As pointed out in Chapter 4,individuals and households have a variety of strategiesfor coping with financial shortfalls. Case studies noted a number of strategies house-holds employed at times when there was not enough money to buy food for allhousehold members. In generic terms,these include dietary changes such as buyingcheaper and less-preferred foods (maize and cassava, for instance),temporarymeasures to increase the amount of food available or reduce the number of peoplewho have to be fed, and rationing or somehow “managing” the shortfall in availablefood. Nine commonly practiced strategies were identified through focus groups andcase studies and included in the survey (Table 30).
The data in Table 30 show considerable differences in the frequency with whichhouseholds employ the various coping strategies. Over three-fourths of the households
71
maxwell chap05 5/9/0 8:29 PM Page 71
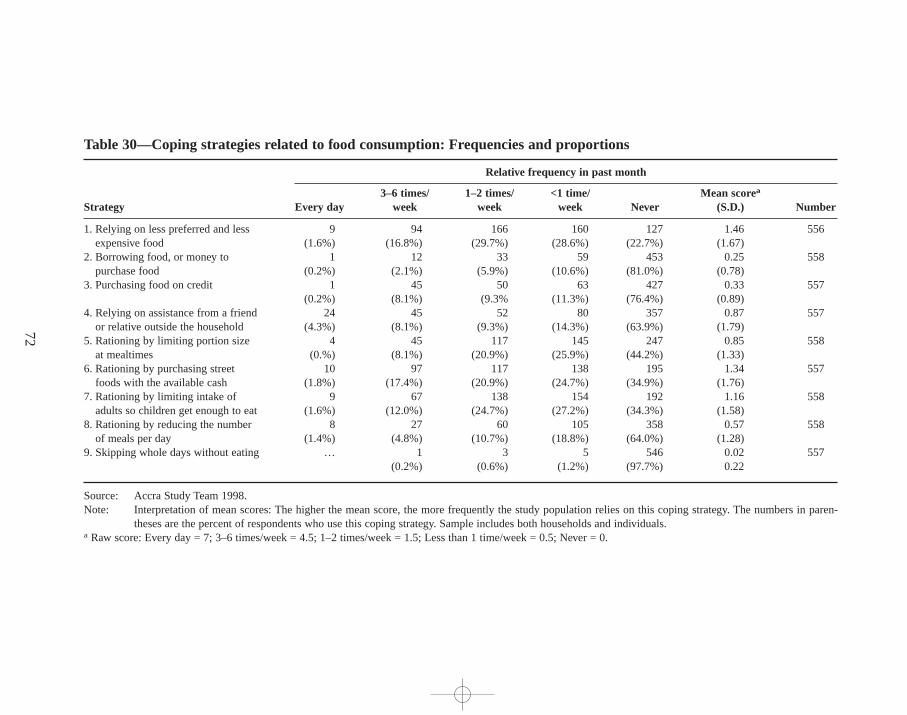
72
Table 30—Coping strategies related to food consumption:Frequencies and proportions
Relative frequency in past month
3–6 times/ 1–2 times/ <1 time/ Mean scorea
Strategy Every day week week week Never (S.D.) Number
1. Relying on less preferred and less 9 94 166 160 127 1.46 556expensive food (1.6%) (16.8%) (29.7%) (28.6%) (22.7%) (1.67)
2. Borrowing food, or money to 1 12 33 59 453 0.25 558purchase food (0.2%) (2.1%) (5.9%) (10.6%) (81.0%) (0.78)
3. Purchasing food on credit 1 45 50 63 427 0.33 557(0.2%) (8.1%) (9.3% (11.3%) (76.4%) (0.89)
4. Relying on assistance from a friend 24 45 52 80 357 0.87 557or relative outside the household (4.3%) (8.1%) (9.3%) (14.3%) (63.9%) (1.79)
5. Rationing by limiting portion size 4 45 117 145 247 0.85 558at mealtimes (0.%) (8.1%) (20.9%) (25.9%) (44.2%) (1.33)
6. Rationing by purchasing street 10 97 117 138 195 1.34 557foods with the available cash (1.8%) (17.4%) (20.9%) (24.7%) (34.9%) (1.76)
7. Rationing by limiting intake of 9 67 138 154 192 1.16 558adults so children get enough to eat (1.6%) (12.0%) (24.7%) (27.2%) (34.3%) (1.58)
8. Rationing by reducing the number 8 27 60 105 358 0.57 558of meals per day (1.4%) (4.8%) (10.7%) (18.8%) (64.0%) (1.28)
9. Skipping whole days without eating … 1 3 5 546 0.02 557(0.2%) (0.6%) (1.2%) (97.7%) 0.22
Source: Accra Study Team 1998.Note: Interpretation of mean scores:The higher the mean score, the more frequently the study population relies on this coping strategy. The numbers in paren-
theses are the percent of respondents who use this coping strategy. Sample includes both households and individuals.a Raw score: Every day = 7; 3–6 times/week = 4.5; 1–2 times/week = 1.5; Less than 1 time/week = 0.5; Never = 0.
maxw
ell ch
ap05 5
/9/0
8:2
9 P
M P
age 7
2
in the sample conserve on expenses by eating cheaper, less-preferred food. Rationingmoney for the purchase of street food is the second-most common coping strategy—a finding consistent with Norton et al. (1995).32 Households that reported relyingheavily on street foods as a coping strategy shared several characteristics. They alsoreported a significantly higher share of prepared food in total consumption thanother households,a significantly lower level of food expenditures per capita,and asignificantly higher share of expenditure on food overall.
Among this group of households,there was a strong positive linear relationshipbetween the frequency with which they used this coping strategy and the share ofprepared food in the diet. This share reached almost 60 percent of food expendituresin the group that reported using street foods as a coping strategy most frequently.And there was a strong negative linear relationship between the frequency of thecoping strategy and total expenditure on food. Total mean food expenditures in thegroup that reported using the coping strategy less than once a week were C/ 523,000per capita. But in the group that reported using this coping strategy every day, ex-penditures were only C/ 31,000 per capita. These results verify that relying on streetfoods and rationing money to buy them are important strategies in Accra for house-holds without enough money to purchase food. One unemployed man put it thisway: “The little we have just goes for kenkey and fish,or sometimes just kenkey andpepper. We just try to fill our stomachs—we have no alternative. . . . ”
Mothers and primary homemakers practiced the third most common copingstrategy: limiting their food intake in order to ensure that children had enough toeat. Skipping meals for an entire day, clearly the most drastic of any of the strate-gies mentioned, was the option practiced least frequently. In the qualitative com-munity and household case studies,respondents often spoke of having to borrowfood or money as a source of shame, and undoubtedly for that reason this strategy isthe second to last in popularity. Nevertheless,the evidence in Chapter 4 suggeststhat borrowing money is common and that the money is often spent on food. Thedifference, as expressed in follow-up focus groups,is that borrowing money is notconsidered shameful,but having to borrow food is.33 There are also strong culturaldifferences in attitudes toward borrowing.34
Household Food Security
One important objective of the study was to estimate as accurately as possible the pro-portion of households in Accra that are not able to maintain food security. Household
73
32 It should be reiterated, however, that consuming street foods does not always indicate a shortfall in food or cashat the household level. Total consumption levels of street food are much higher than reported here.33 For this reason,someone lending money may not know what it was used for or may be reluctant to say in ordernot to insult a close friend or relative.34 The coping strategies described here have also been compiled into an index according to frequency and severitythat can be used as an alternative indicator of household food security. See Maxwell et al. (1999).
maxwell chap05 5/9/0 8:29 PM Page 73
food security is defined as access by all people at all times to enough food to ensurean active, healthy lif e.35 Since only a single round of data was collected, the studydoes not shed light on certain questions. It was not able to document fluctuationsin urban food consumption throughout the year or determine whether households’experience chronic or transitory food insecurity. Qualitative results indicate thatsome predictable seasonal variations in household food availability are tied to cer-tain livelihoods—notably fishing and farming, both of which are becoming less andless common (Ga Mashie Study Team 1996; Ngleshie Amanfro Study Team 1996).However, the same results indicate that the seasonal fluctuations in food consump-tion in other households depends on unpredictable factors such as illness or injuryor loss of a job or income earner—in other words, livelihood-related factors, notseasonal changes.
Food prices vary significantly with the season and so may affect the amount offood households are able to purchase. Alderman and Shively (1996) note a differ-ence of 50 percent in the real price of maize in urban markets between June (thepreharvest season) and September (the postharvest season). Prices for other foodcommodities follow this trend, although the magnitude of the difference varies. Thesurvey took place about halfway between the postharvest and preharvest periods,when food prices were roughly average in real terms.
There is no single indicator that best measures household food security, so sev-eral are used here. One common indicator is calorie adequacy (Payne 1990; Habichtand Pelletier 1990; Maxwell and Frankenberger 1992; Haddad, Kennedy, and Sulli-van 1994; S. Maxwell 1996; Chung et al. 1997). This measure captures food suffi-ciency in terms of quantity but does not address the quality of the diet or issues ofvulnerability or sustainable access. The traditional approach to measuring householdfood security using dietary intakes has been to select an optimal caloric intake basedon a recommended daily allowance (RDA) for the equivalent of a moderately activeadult and compare it to observed household caloric intake per adult equivalent.
In order to identify households that are experiencing food insecurity, researchersused a cutoff point for caloric intake. This technique presents two problems. Thefirst is how to determine the correct cutoff point in the absence of full informationfor estimating the energy requirements of the sample.36 The second, more general
74
35 A full definition of food security includes the related concepts of access,sufficiency, vulnerability, and sustain-ability put forth in Maxwell and Frankenberger (1992).36 It is not possible to quantify energy requirements,because the study did not collect data on weights and time al-location or measure activity levels for all household members. The estimated energy requirement used for this studywas derived from the 1981 Estimated Average Requirements for the United Kingdom,Department of Health and So-cial Security, as presented in Gibson (1990). These figures were chosen for two reasons. First, the recommendationsare broken down for 30 different combinations of age, sex, activity level, and physiological status,providing a levelof detail not seen in other similar tabulations. Second, the average required intake for adult women (2,150 kilocalo-ries) closely matched the estimated requirement for Accra women in the sample based on their age, weight,and aphysical activity level factor of 1.64. Other tabulations suggested lower intakes for this population group. Since theU.K. figures did not include recommendations for infants (<1 year),these were taken from Energy and Protein Re-quirements (IDECG 1994,S33). The recommended daily allowance used for this study is 2,900 kcal/aeu/day.
maxwell chap05 5/9/0 8:29 PM Page 74
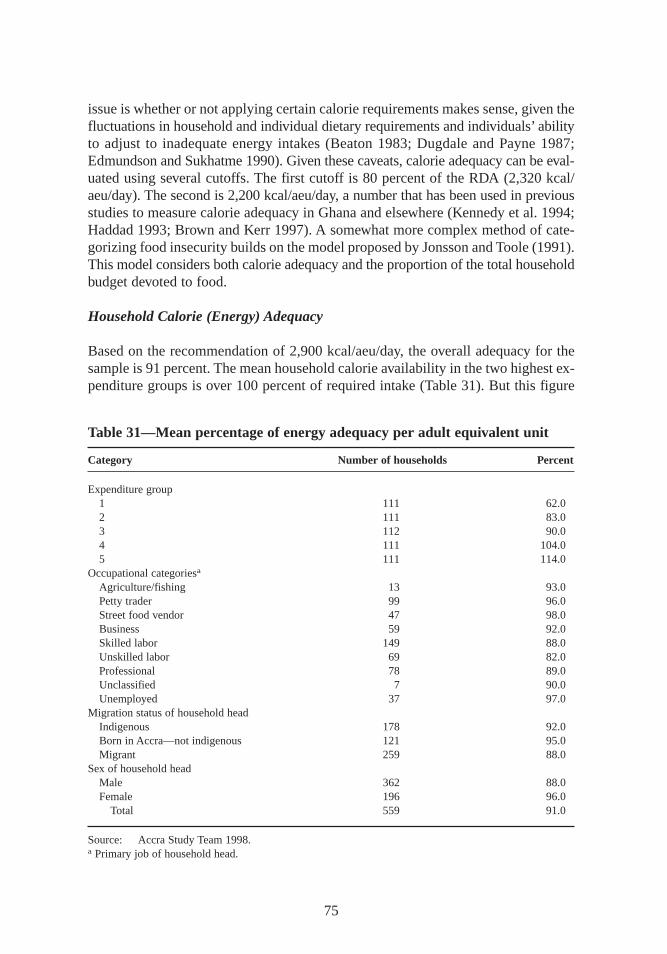
issue is whether or not applying certain calorie requirements makes sense, given thefluctuations in household and individual dietary requirements and individuals’abilityto adjust to inadequate energy intakes (Beaton 1983; Dugdale and Payne 1987;Edmundson and Sukhatme 1990). Given these caveats,calorie adequacy can be eval-uated using several cutoffs. The first cutoff is 80 percent of the RDA (2,320 kcal/aeu/day). The second is 2,200 kcal/aeu/day, a number that has been used in previousstudies to measure calorie adequacy in Ghana and elsewhere (Kennedy et al. 1994;Haddad 1993; Brown and Kerr 1997). A somewhat more complex method of cate-gorizing food insecurity builds on the model proposed by Jonsson and Toole (1991).This model considers both calorie adequacy and the proportion of the total householdbudget devoted to food.
Household Calorie (Energy) Adequacy
Based on the recommendation of 2,900 kcal/aeu/day, the overall adequacy for thesample is 91 percent. The mean household calorie availability in the two highest ex-penditure groups is over 100 percent of required intake (Table 31). But this figure
75
Table 31—Mean percentage of energy adequacy per adult equivalent unit
Category Number of households Percent
Expenditure group1 111 62.02 111 83.03 112 90.04 111 104.05 111 114.0
Occupational categoriesa
Agriculture/fishing 13 93.0Petty trader 99 96.0Street food vendor 47 98.0Business 59 92.0Skilled labor 149 88.0Unskilled labor 69 82.0Professional 78 89.0Unclassified 7 90.0Unemployed 37 97.0
Migration status of household headIndigenous 178 92.0Born in Accra—not indigenous 121 95.0Migrant 259 88.0
Sex of household headMale 362 88.0Female 196 96.0
Total 559 91.0
Source: Accra Study Team 1998.a Primary job of household head.
maxwell chap05 5/9/0 8:29 PM Page 75
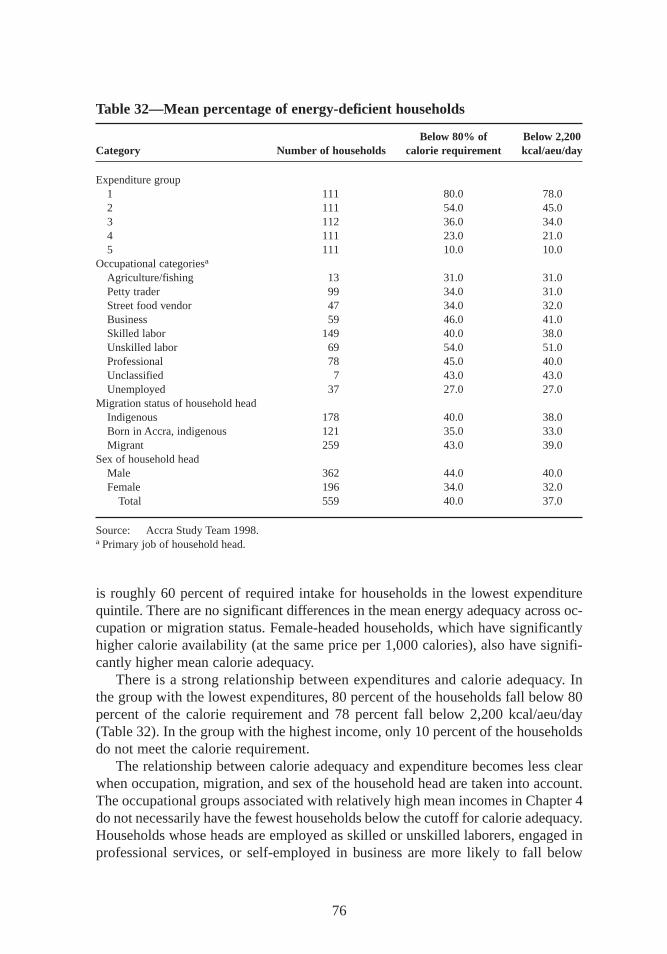
is roughly 60 percent of required intake for households in the lowest expenditurequintile. There are no significant differences in the mean energy adequacy across oc-cupation or migration status. Female-headed households,which have significantlyhigher calorie availability (at the same price per 1,000 calories),also have signifi-cantly higher mean calorie adequacy.
There is a strong relationship between expenditures and calorie adequacy. Inthe group with the lowest expenditures,80 percent of the households fall below 80percent of the calorie requirement and 78 percent fall below 2,200 kcal/aeu/day(Table 32). In the group with the highest income, only 10 percent of the householdsdo not meet the calorie requirement.
The relationship between calorie adequacy and expenditure becomes less clearwhen occupation, migration, and sex of the household head are taken into account.The occupational groups associated with relatively high mean incomes in Chapter4do not necessarily have the fewest households below the cutoff for calorie adequacy.Households whose heads are employed as skilled or unskilled laborers,engaged inprofessional services,or self-employed in business are more likely to fall below
76
Table 32—Mean percentage of energy-deficient households
Below 80% of Below 2,200Category Number of households calorie requirement kcal/aeu/day
Expenditure group1 111 80.0 78.02 111 54.0 45.03 112 36.0 34.04 111 23.0 21.05 111 10.0 10.0
Occupational categoriesa
Agriculture/fishing 13 31.0 31.0Petty trader 99 34.0 31.0Street food vendor 47 34.0 32.0Business 59 46.0 41.0Skilled labor 149 40.0 38.0Unskilled labor 69 54.0 51.0Professional 78 45.0 40.0Unclassified 7 43.0 43.0Unemployed 37 27.0 27.0
Migration status of household headIndigenous 178 40.0 38.0Born in Accra, indigenous 121 35.0 33.0Migrant 259 43.0 39.0
Sex of household headMale 362 44.0 40.0Female 196 34.0 32.0
Total 559 40.0 37.0
Source: Accra Study Team 1998.a Primary job of household head.
maxwell chap05 5/9/0 8:29 PM Page 76
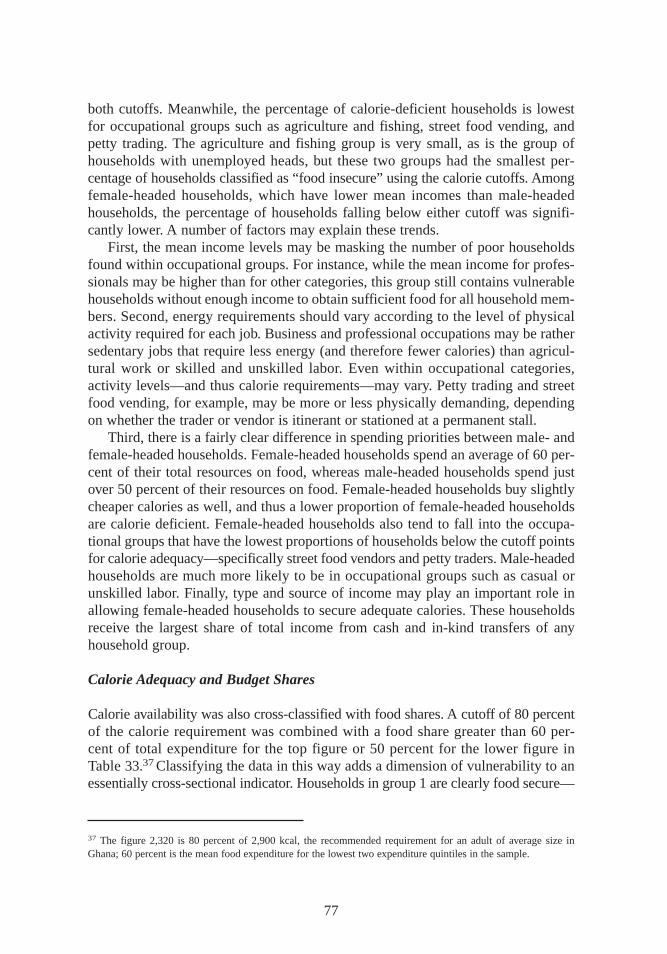
both cutoffs. Meanwhile, the percentage of calorie-deficient households is lowestfor occupational groups such as agriculture and fishing, street food vending, andpetty trading. The agriculture and fishing group is very small, as is the group ofhouseholds with unemployed heads,but these two groups had the smallest per-centage of households classified as “f ood insecure” using the calorie cutoffs. Amongfemale-headed households,which have lower mean incomes than male-headedhouseholds,the percentage of households falling below either cutoff was signifi-cantly lower. A number of factors may explain these trends.
First, the mean income levels may be masking the number of poor householdsfound within occupational groups. For instance, while the mean income for profes-sionals may be higher than for other categories,this group still contains vulnerablehouseholds without enough income to obtain sufficient food for all household mem-bers. Second, energy requirements should vary according to the level of physicalactivity required for each job. Business and professional occupations may be rathersedentary jobs that require less energy (and therefore fewer calories) than agricul-tural work or skilled and unskilled labor. Even within occupational categories,activity levels—and thus calorie requirements—may vary. Petty trading and streetfood vending, for example, may be more or less physically demanding, dependingon whether the trader or vendor is itinerant or stationed at a permanent stall.
Third, there is a fairly clear difference in spending priorities between male- andfemale-headed households. Female-headed households spend an average of 60 per-cent of their total resources on food, whereas male-headed households spend justover 50 percent of their resources on food. Female-headed households buy slightlycheaper calories as well, and thus a lower proportion of female-headed householdsare calorie deficient. Female-headed households also tend to fall into the occupa-tional groups that have the lowest proportions of households below the cutoff pointsfor calorie adequacy—specifically street food vendors and petty traders. Male-headedhouseholds are much more likely to be in occupational groups such as casual orunskilled labor. Finally, type and source of income may play an important role inallowing female-headed households to secure adequate calories. These householdsreceive the largest share of total income from cash and in-kind transfers of anyhousehold group.
Calorie Adequacy and Budget Shares
Calorie availability was also cross-classified with food shares. A cutoff of 80 percentof the calorie requirement was combined with a food share greater than 60 per-cent of total expenditure for the top figure or 50 percent for the lower figure inTable 33.37Classifying the data in this way adds a dimension of vulnerability to anessentially cross-sectional indicator. Households in group 1 are clearly food secure—
77
37 The figure 2,320 is 80 percent of 2,900 kcal,the recommended requirement for an adult of average size inGhana; 60 percent is the mean food expenditure for the lowest two expenditure quintiles in the sample.
maxwell chap05 5/9/0 8:29 PM Page 77
an indication of relative security from shocks. Their food consumption is adequateand they spend a relatively small proportion of the budget on food. Households ingroup 4 are clearly food insecure. Their consumption is inadequate, and they spenda large share of their budget on food. Group 2 might be labeled vulnerable, with cur-rent consumption adequate but a high proportion of the budget allocated to food. Arelatively small shock could lower consumption for this group. Group 3 has lowconsumption but also low food shares and is thus more difficult to explain. The find-ings could be a measurement error—that is, households could have underreportedeither food consumption or over reported nonfood expenditures. The recall periodcould simply have been unrepresentative, with unusually high nonfood expenditures.The findings could also be explained in terms of a deliberate trade-off between foodconsumption and other necessities,including savings, investment or remittances,and basic consumption needs (de Waal 1989).
In fact, all of these factors help to explain why over a quarter of the sampledhouseholds have low food consumption and devote a relatively low share of thehousehold budget to food. Lowering the food shares cutoff to 50 percent moves anadditional 56 households out of that category and into the “f ood insecure” category(Table 33). But the cutoff for food shares is then well below the sample mean of54 percent,and 93 households (17 percent of the sample) still remain in the “ques-tionable” category. Of the 93 households remaining in this category after the cutofffor food shares is lowered to 50 percent,39 households were “net remitters” send-ing money to other households. Most of these households (virtually all of which
78
Table 33—Food security: Caloric adequacy and food shares
Share of expenditure on food
Low Higha:(<60% of budget share) a:(>60% of budget share)b:(<50% of budget share) b:(>50% of budget share)
Caloric availability per 1. Food Secure 2. Vulnerableadult equivalent unitAdequate a:182 a:148(>80% of requirement) (32.8%) (26.7%)
b:115 b:219
(20.6%) (39.2%)Inadequate 3. Questionable: (Can 4. Food insecure(<80% of requirement) improve consumption,
or measurement error)a:149 a:76
(26.8%) (13.7%)b:93 b:132
(16.6%) (23.6%)
Source: Adapted from Jonsson and Toole 1991.Note: Number and percentages in each group refer to numbers of households and proportion of the total
sample.
maxwell chap05 5/9/0 8:29 PM Page 78
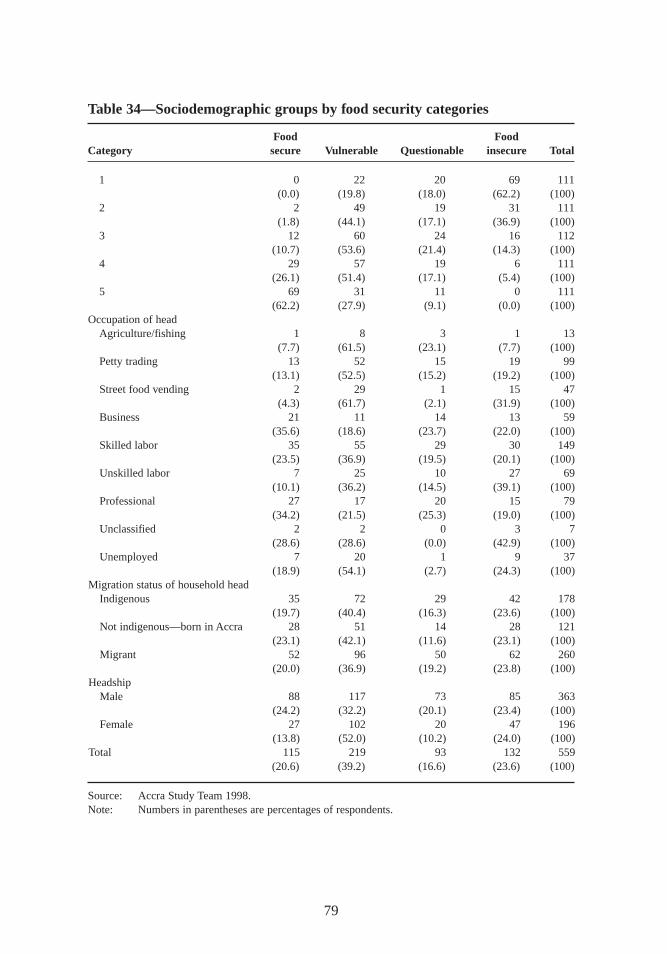
79
Table 34—Sociodemographic groups by food security categories
Food FoodCategory secure Vulnerable Questionable insecure Total
1 0 22 20 69 111(0.0) (19.8) (18.0) (62.2) (100)
2 2 49 19 31 111(1.8) (44.1) (17.1) (36.9) (100)
3 12 60 24 16 112(10.7) (53.6) (21.4) (14.3) (100)
4 29 57 19 6 111(26.1) (51.4) (17.1) (5.4) (100)
5 69 31 11 0 111(62.2) (27.9) (9.1) (0.0) (100)
Occupation of headAgriculture/fishing 1 8 3 1 13
(7.7) (61.5) (23.1) (7.7) (100)Petty trading 13 52 15 19 99
(13.1) (52.5) (15.2) (19.2) (100)Street food vending 2 29 1 15 47
(4.3) (61.7) (2.1) (31.9) (100)Business 21 11 14 13 59
(35.6) (18.6) (23.7) (22.0) (100)Skilled labor 35 55 29 30 149
(23.5) (36.9) (19.5) (20.1) (100)Unskilled labor 7 25 10 27 69
(10.1) (36.2) (14.5) (39.1) (100)Professional 27 17 20 15 79
(34.2) (21.5) (25.3) (19.0) (100)Unclassified 2 2 0 3 7
(28.6) (28.6) (0.0) (42.9) (100)Unemployed 7 20 1 9 37
(18.9) (54.1) (2.7) (24.3) (100)Migration status of household head
Indigenous 35 72 29 42 178(19.7) (40.4) (16.3) (23.6) (100)
Not indigenous—born in Accra 28 51 14 28 121(23.1) (42.1) (11.6) (23.1) (100)
Migrant 52 96 50 62 260(20.0) (36.9) (19.2) (23.8) (100)
HeadshipMale 88 117 73 85 363
(24.2) (32.2) (20.1) (23.4) (100)Female 27 102 20 47 196
(13.8) (52.0) (10.2) (24.0) (100)Total 115 219 93 132 559
(20.6) (39.2) (16.6) (23.6) (100)
Source: Accra Study Team 1998.Note: Numbers in parentheses are percentages of respondents.
maxwell chap05 5/9/0 8:29 PM Page 79
were migrant) were not receiving any remittances themselves. For this group ofhouseholds,a trade-off existed between their own consumption and the need to pro-vide money to other households (usually close relatives). Of the remaining house-holds,some were clearly underestimating consumption—the larger the household,the greater the error in the estimate. Others were clearly food insecure but had hadunusually large nonfood expenditures during the recall period that made food ex-penditure appear low when reported as a budget share. Categorizing the householdsin this group with regard to their food security status is thus very difficult.
Table 34 uses the four categories described above but gives a somewhat differ-ent picture of household food security. The expenditure quintile groups continue totell a relatively predictable story: none of the households in the lowest quintile fallsinto the “f ood secure” group,and none in the highest quintile falls into the “f oodinsecure” group. Nearly two-thirds of households in the lowest quintile are “f ood in-secure,” and exactly the same proportion of the highest quintile are in the “f ood se-cure” group. By occupational category, unskilled labor and street food vendors havethe highest proportion in the “f ood insecure” group. Agriculture, petty trading, andstreet food vending have the highest proportion in the “vulnerable” group—a ratherdifferent picture than the one based solely on calorie availability (which depictedrelatively lower proportions falling below the cutoff).
A high proportion of female-headed households have adequate calorie availabilitylevels but are more vulnerable to shocks because they spend a higher proportion oftheir disposable income to acquire the calories. In the “f ood insecure” category,there is scarcely any difference between male- and female-headed households orindigenous and migrant groups. Twice as many male-headed households fall intothe “questionable” category. A higher proportion of migrants than of indigenoushouseholds also falls into this category.
In terms of calorie availability alone, roughly 40 percent of households in thesample can be categorized as food insecure. When the measure of food insecurity in-cludes both calorie availability and the food share of the total budget,some 24 per-cent are classified as food insecure and about 40 percent as vulnerable. Female-headed households,street food vendors, and petty traders—groups that overlapconsiderably—are the most vulnerable. These are the same groups that were iden-tif ied in the previous chapter as being most vulnerable to income shortfalls. (Chap-ter 10 further analyzes the coping strategies of the various food security groupsderived here and discusses the relationship between food security and health andnutritional status).
80
maxwell chap05 5/9/0 8:29 PM Page 80
CHAPTER 6
Nutrition and Health ofWomen and Children
Previous chapters have shown how Accra’s residents earn their livelihoods anddescribed the ways households use their income and other resources to obtain
food and meet their basic needs. This chapter presents descriptive information aboutthe health and nutritional status of women and children in Accra. In examining thelinks between nutrition and health outcomes, it takes into account factors inwomen’s lives that may affect the health of their children.
Nutritional Status of Children
The study collected survey data on the nutritional status of preschool children in thehouseholds that made up the sample (Tables 35 and 36).38 One child from eachhousehold—the index child—was studied in depth. The data on childhood malnu-trition are presented using the three common anthropometric indicators: height forage, weight for age, and weight for height.39
The mean height-for-age Z-scores and weight-for-age Z-scores for all threegroups of children are in the range of –0.9 to –1.0. The mean weight-for-height Z-scores are clustered around –0.5 (Table 35). Stunting is more prevalent than wast-
81
38 These data were analyzed for three subgroups:1. Children 3 to 36 months of age, for which the sample is statistically representative of Greater Accra (n = 561);2. Index children, who, by definition, were between 0 and 36 months of age at the time of the survey but were
in practice 0 to 39 months (the maximum age was 38.37 months) (n = 556); and3. Children 0 to 59 months of age (for which the sample is not statistically representative of Greater Accra)
(n = 724).Unless otherwise indicated, results in this section are presented and discussed for the first subgroup of children(3–36 months old). Of the 559 households in the sample, anthropometric data were missing for three index chil-dren, lowering the total number of households represented to 556.39 Z-scores were derived using the reference standards developed by the U.S. Center for Disease Control (CDC),The National Center for Health Statistics (CNHS), and the World Health Organization (WHO 1979). Standardcutoff points and definitions are used for malnutrition. Stunting is defined as height-for-age Z-scores below –2.00,underweight as weight-for-age Z-scores below –2.00, and wasting as weight-for-height Z-scores below –2.00.
maxwell chap06 5/9/0 8:28 PM Page 81
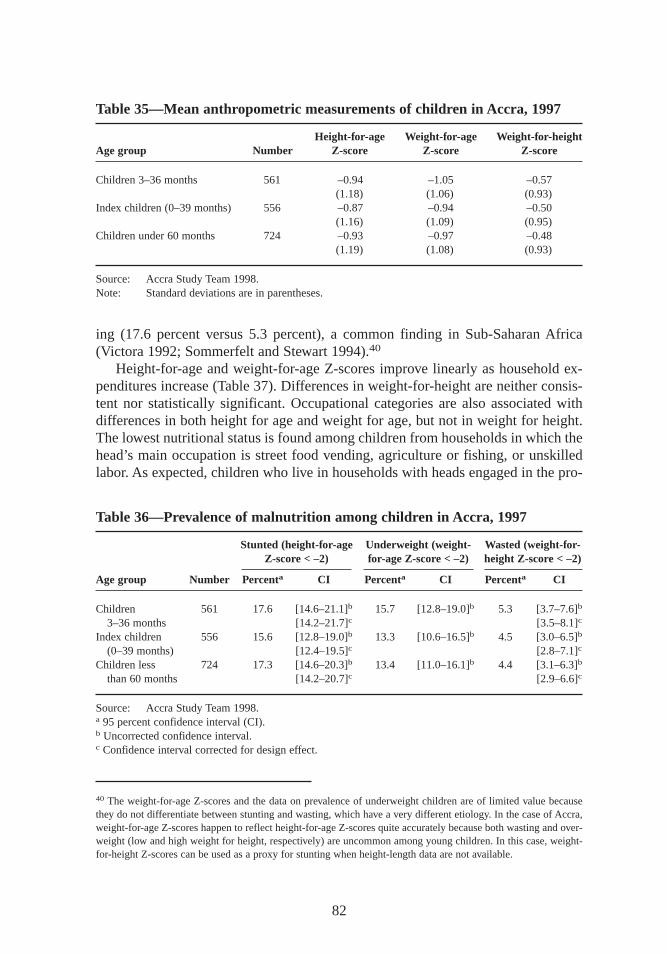
ing (17.6 percent versus 5.3 percent), a common finding in Sub-Saharan Afr ica(Victora 1992; Sommerfelt and Stewart 1994).40
Height-for-age and weight-for-age Z-scores improve linearly as household ex-penditures increase (Table 37). Differences in weight-for-height are neither consis-tent nor statistically significant. Occupational categories are also associated withdifferences in both height for age and weight for age, but not in weight for height.The lowest nutritional status is found among children from households in which thehead’s main occupation is street food vending, agriculture or fishing, or unskilledlabor. As expected, children who live in households with heads engaged in the pro-
82
Table 35—Mean anthropometric measurements of childr en in Accra, 1997
Height-for-age Weight-for-age Weight-for-heightAge group Number Z-score Z-score Z-score
Children 3–36 months 561 –0.94 –1.05 –0.57(1.18) (1.06) (0.93)
Index children (0–39 months) 556 –0.87 –0.94 –0.50(1.16) (1.09) (0.95)
Children under 60 months 724 –0.93 –0.97 –0.48(1.19) (1.08) (0.93)
Source: Accra Study Team 1998.Note: Standard deviations are in parentheses.
Table 36—Prevalence of malnutr ition among childr en in Accra, 1997
Stunted (height-for-age Underweight (weight- Wasted (weight-for-Z-score < –2) for-age Z-score < –2) height Z-score < –2)
Age group Number Percenta CI Percenta CI Percenta CI
Children 561 17.6 [14.6–21.1]b 15.7 [12.8–19.0]b 5.3 [3.7–7.6]b
3–36 months [14.2–21.7]c [3.5–8.1]c
Index children 556 15.6 [12.8–19.0]b 13.3 [10.6–16.5]b 4.5 [3.0–6.5]b
(0–39 months) [12.4–19.5]c [2.8–7.1]c
Children less 724 17.3 [14.6–20.3]b 13.4 [11.0–16.1]b 4.4 [3.1–6.3]b
than 60 months [14.2–20.7]c [2.9–6.6]c
Source: Accra Study Team 1998.a 95 percent confidence interval (CI).b Uncorrected confidence interval.c Confidence interval corrected for design effect.
40 The weight-for-age Z-scores and the data on prevalence of underweight children are of limited value becausethey do not differentiate between stunting and wasting, which have a very different etiology. In the case of Accra,weight-for-age Z-scores happen to reflect height-for-age Z-scores quite accurately because both wasting and over-weight (low and high weight for height,respectively) are uncommon among young children. In this case, weight-for-height Z-scores can be used as a proxy for stunting when height-length data are not available.
maxwell chap06 5/9/0 8:28 PM Page 82
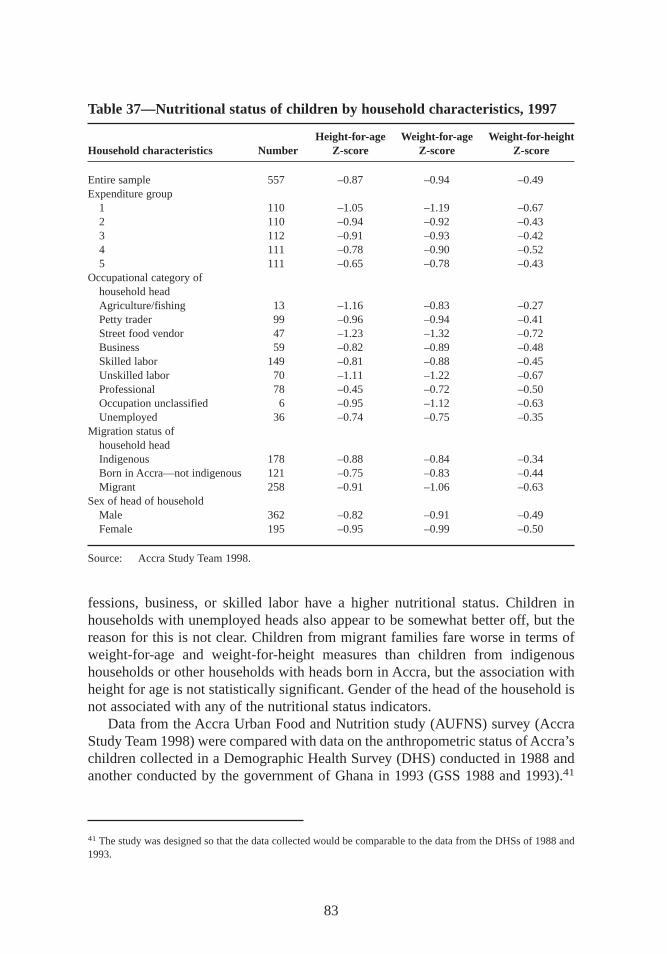
fessions,business,or skilled labor have a higher nutritional status. Children inhouseholds with unemployed heads also appear to be somewhat better off, but thereason for this is not clear. Children from migrant families fare worse in terms ofweight-for-age and weight-for-height measures than children from indigenoushouseholds or other households with heads born in Accra, but the association withheight for age is not statistically significant. Gender of the head of the household isnot associated with any of the nutritional status indicators.
Data from the Accra Urban Food and Nutrition study (AUFNS) survey (AccraStudy Team 1998) were compared with data on the anthropometric status of Accra’schildren collected in a Demographic Health Survey (DHS) conducted in 1988 andanother conducted by the government of Ghana in 1993 (GSS 1988 and 1993).41
83
Table 37—Nutritional status of childr en by household characteristics,1997
Height-for-age Weight-for-age Weight-for-heightHousehold characteristics Number Z-score Z-score Z-score
Entire sample 557 –0.87 –0.94 –0.49Expenditure group
1 110 –1.05 –1.19 –0.672 110 –0.94 –0.92 –0.433 112 –0.91 –0.93 –0.424 111 –0.78 –0.90 –0.525 111 –0.65 –0.78 –0.43
Occupational category ofhousehold headAgriculture/fishing 13 –1.16 –0.83 –0.27Petty trader 99 –0.96 –0.94 –0.41Street food vendor 47 –1.23 –1.32 –0.72Business 59 –0.82 –0.89 –0.48Skilled labor 149 –0.81 –0.88 –0.45Unskilled labor 70 –1.11 –1.22 –0.67Professional 78 –0.45 –0.72 –0.50Occupation unclassified 6 –0.95 –1.12 –0.63Unemployed 36 –0.74 –0.75 –0.35
Migration status ofhousehold headIndigenous 178 –0.88 –0.84 –0.34Born in Accra—not indigenous 121 –0.75 –0.83 –0.44Migrant 258 –0.91 –1.06 –0.63
Sex of head of householdMale 362 –0.82 –0.91 –0.49Female 195 –0.95 –0.99 –0.50
Source: Accra Study Team 1998.
41 The study was designed so that the data collected would be comparable to the data from the DHSs of 1988 and1993.
maxwell chap06 5/9/0 8:28 PM Page 83
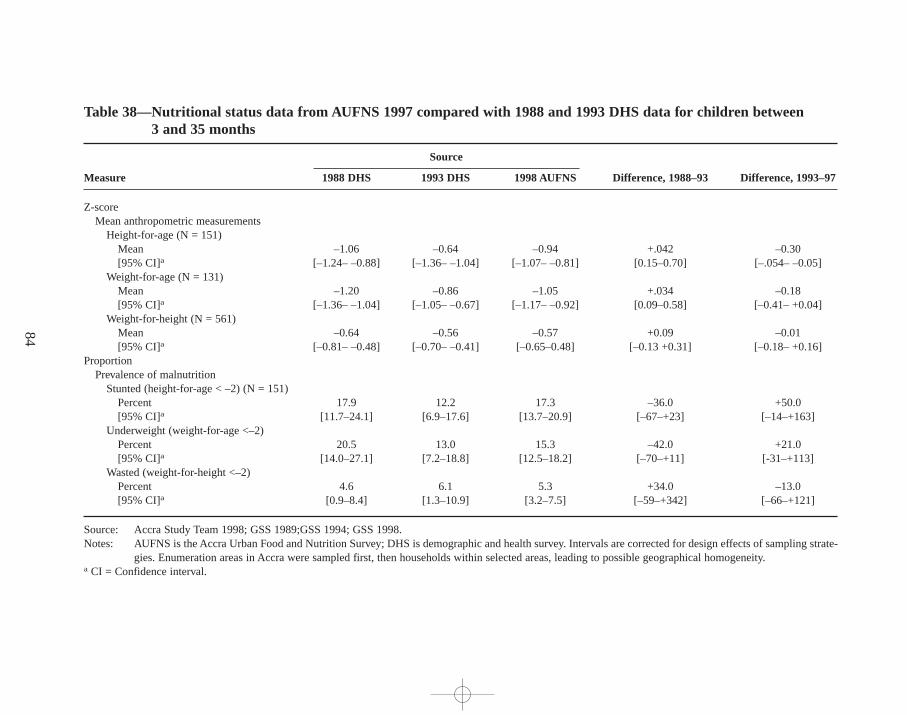
84
Table 38—Nutr itional status data from AUFNS 1997 compared with 1988 and 1993 DHS data for childr en between 3 and 35 months
Source
Measure 1988 DHS 1993 DHS 1998 AUFNS Dif ference, 1988–93 Dif ference, 1993–97
Z-scoreMean anthropometric measurements
Height-for-age (N = 151)Mean –1.06 –0.64 –0.94 +.042 –0.30[95% CI]a [–1.24– –0.88] [–1.36– –1.04] [–1.07– –0.81] [0.15–0.70] [–.054– –0.05]
Weight-for-age (N = 131)Mean –1.20 –0.86 –1.05 +.034 –0.18[95% CI]a [–1.36– –1.04] [–1.05– –0.67] [–1.17– –0.92] [0.09–0.58] [–0.41– +0.04]
Weight-for-height (N = 561)Mean –0.64 –0.56 –0.57 +0.09 –0.01[95% CI]a [–0.81– –0.48] [–0.70– –0.41] [–0.65–0.48] [–0.13 +0.31] [–0.18– +0.16]
ProportionPrevalence of malnutrition
Stunted (height-for-age < –2) (N = 151)Percent 17.9 12.2 17.3 –36.0 +50.0[95% CI]a [11.7–24.1] [6.9–17.6] [13.7–20.9] [–67–+23] [–14–+163]
Underweight (weight-for-age <–2)Percent 20.5 13.0 15.3 –42.0 +21.0[95% CI]a [14.0–27.1] [7.2–18.8] [12.5–18.2] [–70–+11] [-31–+113]
Wasted (weight-for-height <–2)Percent 4.6 6.1 5.3 +34.0 –13.0[95% CI]a [0.9–8.4] [1.3–10.9] [3.2–7.5] [–59–+342] [–66–+121]
Source: Accra Study Team 1998; GSS 1989;GSS 1994; GSS 1998.Notes: AUFNS is the Accra Urban Food and Nutrition Survey; DHS is demographic and health survey. Intervals are corrected for design effects of sampling strate-
gies. Enumeration areas in Accra were sampled first, then households within selected areas,leading to possible geographical homogeneity.a CI = Confidence interval.
maxw
ell ch
ap06 5
/9/0
8:2
8 P
M P
age 8
4
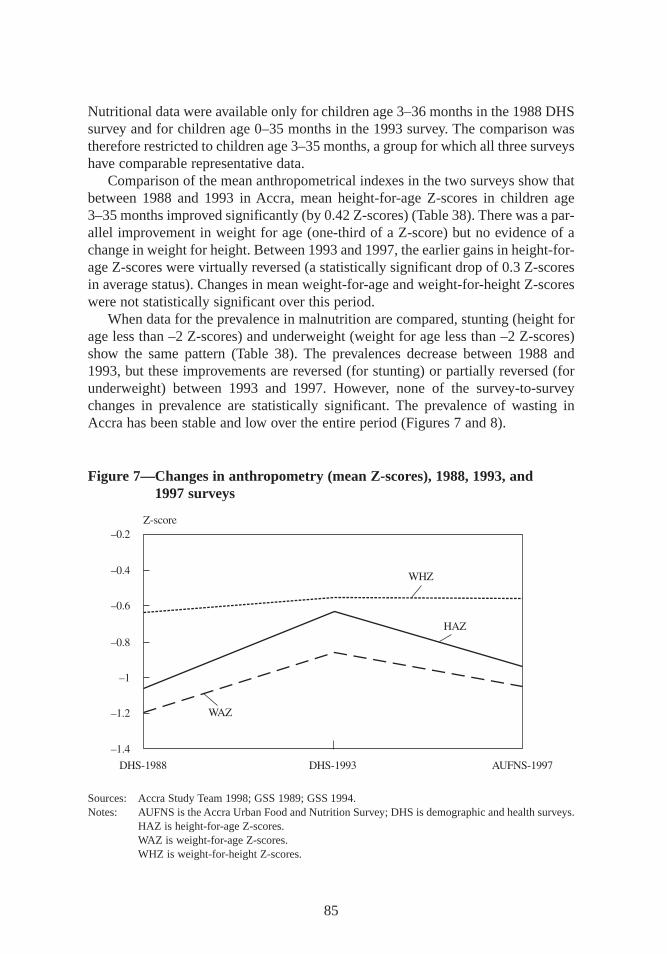
85
Nutritional data were available only for children age 3–36 months in the 1988 DHSsurvey and for children age 0–35 months in the 1993 survey. The comparison wastherefore restricted to children age 3–35 months,a group for which all three surveyshave comparable representative data.
Comparison of the mean anthropometrical indexes in the two surveys show thatbetween 1988 and 1993 in Accra, mean height-for-age Z-scores in children age3–35 months improved significantly (by 0.42 Z-scores) (Table 38). There was a par-allel improvement in weight for age (one-third of a Z-score) but no evidence of achange in weight for height. Between 1993 and 1997,the earlier gains in height-for-age Z-scores were virtually reversed (a statistically significant drop of 0.3 Z-scoresin average status). Changes in mean weight-for-age and weight-for-height Z-scoreswere not statistically significant over this period.
When data for the prevalence in malnutrition are compared, stunting (height forage less than –2 Z-scores) and underweight (weight for age less than –2 Z-scores)show the same pattern (Table 38). The prevalences decrease between 1988 and1993,but these improvements are reversed (for stunting) or partially reversed (forunderweight) between 1993 and 1997. However, none of the survey-to-surveychanges in prevalence are statistically significant. The prevalence of wasting inAccra has been stable and low over the entire period (Figures 7 and 8).
Figure 7—Changes in anthropometry (mean Z-scores),1988,1993,and 1997 surveys
Sources: Accra Study Team 1998; GSS 1989; GSS1994.Notes: AUFNS is the Accra Urban Food and Nutrition Survey; DHS is demographic and health surveys.
HAZ is height-for-age Z-scores.WAZ is weight-for-age Z-scores.WHZ is weight-for-height Z-scores.
maxwell chap06 5/9/0 8:28 PM Page 85
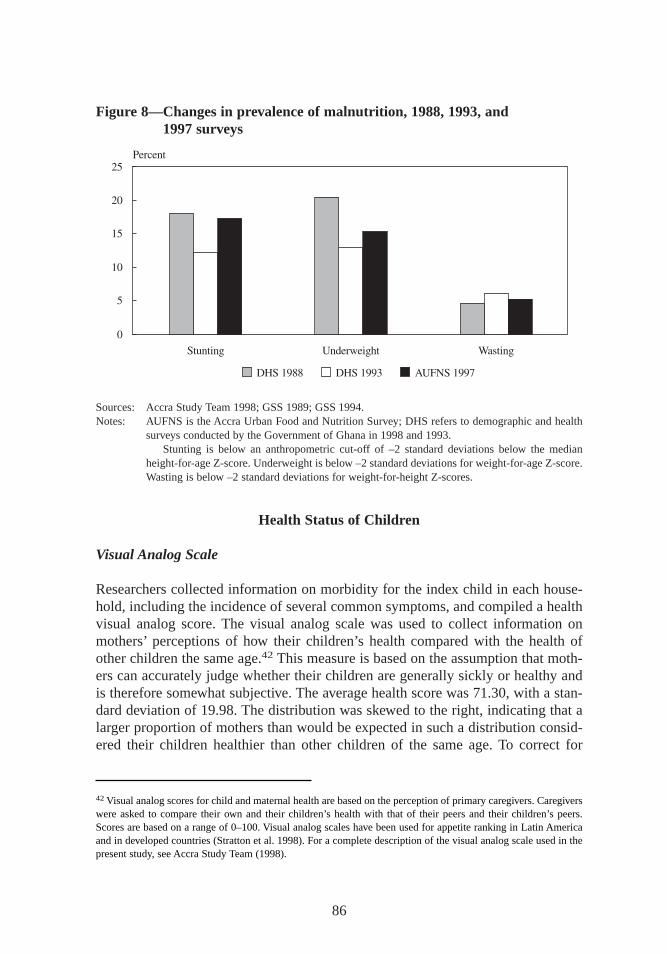
Health Status of Children
Visual Analog Scale
Researchers collected information on morbidity for the index child in each house-hold, including the incidence of several common symptoms,and compiled a healthvisual analog score. The visual analog scale was used to collect information onmothers’ perceptions of how their children’s health compared with the health ofother children the same age.42 This measure is based on the assumption that moth-ers can accurately judge whether their children are generally sickly or healthy andis therefore somewhat subjective. The average health score was 71.30,with a stan-dard deviation of 19.98. The distribution was skewed to the right, indicating that alarger proportion of mothers than would be expected in such a distribution consid-ered their children healthier than other children of the same age. To correct for
86
Figure 8—Changes in prevalence of malnutr ition, 1988,1993,and 1997 surveys
Sources: Accra Study Team 1998; GSS 1989; GSS1994.Notes: AUFNS is the Accra Urban Food and Nutrition Survey; DHS refers to demographic and health
surveys conducted by the Government of Ghana in 1998 and 1993.Stunting is below an anthropometric cut-off of –2 standard deviations below the median
height-for-age Z-score. Underweight is below –2 standard deviations for weight-for-age Z-score.Wasting is below –2 standard deviations for weight-for-height Z-scores.
42Visual analog scores for child and maternal health are based on the perception of primary caregivers. Caregiverswere asked to compare their own and their children’s health with that of their peers and their children’s peers.Scores are based on a range of 0–100. Visual analog scales have been used for appetite ranking in Latin Americaand in developed countries (Stratton et al. 1998). For a complete description of the visual analog scale used in thepresent study, see Accra Study Team (1998).
maxwell chap06 5/9/0 8:28 PM Page 86
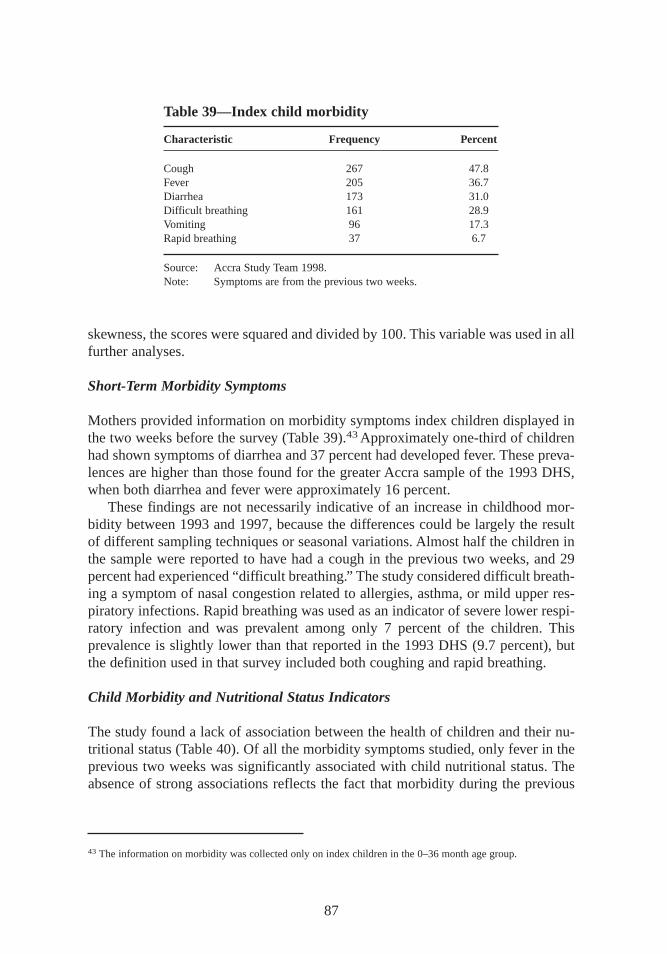
skewness,the scores were squared and divided by 100. This variable was used in allfurther analyses.
Short-Term Morbidity Symptoms
Mothers provided information on morbidity symptoms index children displayed inthe two weeks before the survey (Table 39).43Approximately one-third of childrenhad shown symptoms of diarrhea and 37 percent had developed fever. These preva-lences are higher than those found for the greater Accra sample of the 1993 DHS,when both diarrhea and fever were approximately 16 percent.
These findings are not necessarily indicative of an increase in childhood mor-bidity between 1993 and 1997,because the differences could be largely the resultof different sampling techniques or seasonal variations. Almost half the children inthe sample were reported to have had a cough in the previous two weeks,and 29percent had experienced “dif ficult breathing.” The study considered difficult breath-ing a symptom of nasal congestion related to allergies,asthma,or mild upper res-piratory infections. Rapid breathing was used as an indicator of severe lower respi-ratory infection and was prevalent among only 7 percent of the children. Thisprevalence is slightly lower than that reported in the 1993 DHS (9.7 percent),butthe definition used in that survey included both coughing and rapid breathing.
Child Morbidity and Nutritional Status Indicators
The study found a lack of association between the health of children and their nu-tritional status (Table 40). Of all the morbidity symptoms studied, only fever in theprevious two weeks was significantly associated with child nutritional status. Theabsence of strong associations reflects the fact that morbidity during the previous
87
Table 39—Index child morbidity
Characteristic Frequency Percent
Cough 267 47.8Fever 205 36.7Diarrhea 173 31.0Difficult breathing 161 28.9Vomiting 96 17.3Rapid breathing 37 6.7
Source: Accra Study Team 1998.Note: Symptoms are from the previous two weeks.
43 The information on morbidity was collected only on index children in the 0–36 month age group.
maxwell chap06 5/9/0 8:28 PM Page 87
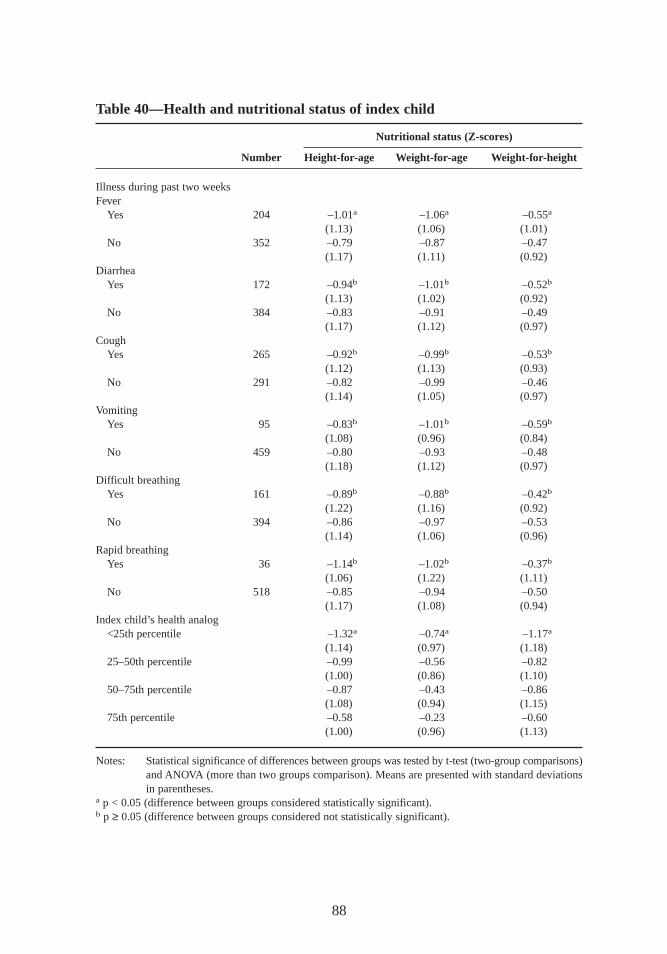
88
Table 40—Health and nutr itional status of index child
Nutr itional status (Z-scores)
Number Height-for-age Weight-for-age Weight-for-height
Illness during past two weeksFever
Yes 204 –1.01a –1.06a –0.55a
(1.13) (1.06) (1.01)No 352 –0.79 –0.87 –0.47
(1.17) (1.11) (0.92)Diarrhea
Yes 172 –0.94b –1.01b –0.52b
(1.13) (1.02) (0.92)No 384 –0.83 –0.91 –0.49
(1.17) (1.12) (0.97)Cough
Yes 265 –0.92b –0.99b –0.53b
(1.12) (1.13) (0.93)No 291 –0.82 –0.99 –0.46
(1.14) (1.05) (0.97)Vomiting
Yes 95 –0.83b –1.01b –0.59b
(1.08) (0.96) (0.84)No 459 –0.80 –0.93 –0.48
(1.18) (1.12) (0.97)Difficult breathing
Yes 161 –0.89b –0.88b –0.42b
(1.22) (1.16) (0.92)No 394 –0.86 –0.97 –0.53
(1.14) (1.06) (0.96)Rapid breathing
Yes 36 –1.14b –1.02b –0.37b
(1.06) (1.22) (1.11)No 518 –0.85 –0.94 –0.50
(1.17) (1.08) (0.94)Index child’s health analog
<25th percentile –1.32a –0.74a –1.17a
(1.14) (0.97) (1.18)25–50th percentile –0.99 –0.56 –0.82
(1.00) (0.86) (1.10)50–75th percentile –0.87 –0.43 –0.86
(1.08) (0.94) (1.15)75th percentile –0.58 –0.23 –0.60
(1.00) (0.96) (1.13)
Notes: Statistical significance of differences between groups was tested by t-test (two-group comparisons)and ANOVA (more than two groups comparison). Means are presented with standard deviationsin parentheses.
a p < 0.05 (difference between groups considered statistically significant).b p ≥ 0.05 (difference between groups considered not statistically significant).
maxwell chap06 5/9/0 8:28 PM Page 88
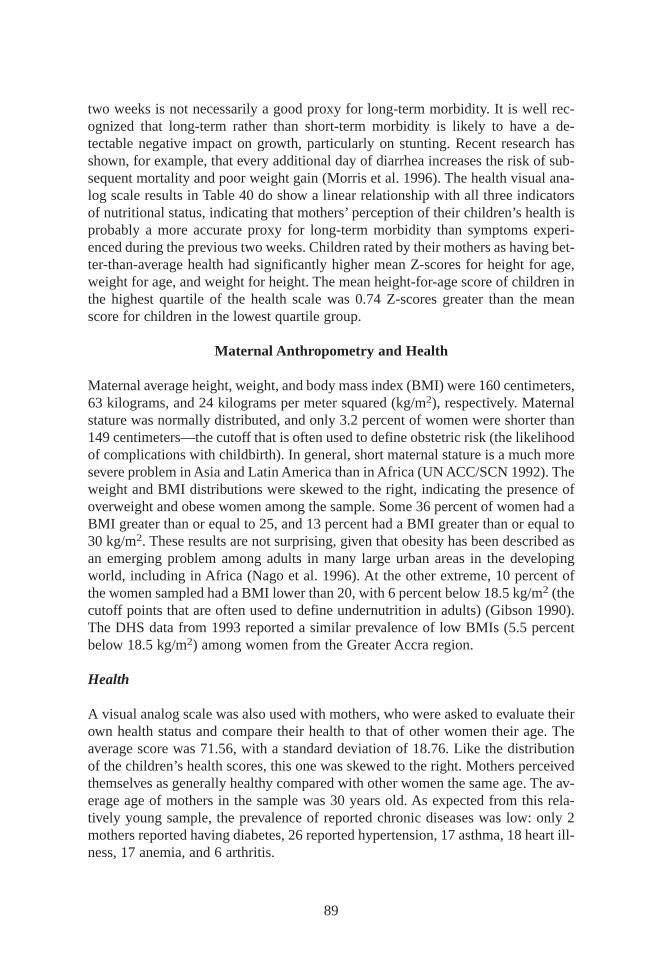
two weeks is not necessarily a good proxy for long-term morbidity. It is well rec-ognized that long-term rather than short-term morbidity is likely to have a de-tectable negative impact on growth, particularly on stunting. Recent research hasshown, for example, that every additional day of diarrhea increases the risk of sub-sequent mortality and poor weight gain (Morris et al. 1996). The health visual ana-log scale results in Table 40 do show a linear relationship with all three indicatorsof nutritional status,indicating that mothers’ perception of their children’s health isprobably a more accurate proxy for long-term morbidity than symptoms experi-enced during the previous two weeks. Children rated by their mothers as having bet-ter-than-average health had significantly higher mean Z-scores for height for age,weight for age, and weight for height. The mean height-for-age score of children inthe highest quartile of the health scale was 0.74 Z-scores greater than the meanscore for children in the lowest quartile group.
Maternal Anthr opometry and Health
Maternal average height,weight,and body mass index (BMI) were 160 centimeters,63 kilograms,and 24 kilograms per meter squared (kg/m2), respectively. Maternalstature was normally distributed, and only 3.2 percent of women were shorter than149 centimeters—the cutoff that is often used to define obstetric risk (the likelihoodof complications with childbirth). In general, short maternal stature is a much moresevere problem in Asia and Latin America than in Afr ica (UN ACC/SCN 1992). Theweight and BMI distributions were skewed to the right, indicating the presence ofoverweight and obese women among the sample. Some 36 percent of women had aBMI greater than or equal to 25,and 13 percent had a BMI greater than or equal to30 kg/m2. These results are not surprising, given that obesity has been described asan emerging problem among adults in many large urban areas in the developingworld, including in Afr ica (Nago et al. 1996). At the other extreme, 10 percent ofthe women sampled had a BMI lower than 20,with 6 percent below 18.5 kg/m2 (thecutoff points that are often used to define undernutrition in adults) (Gibson 1990).The DHS data from 1993 reported a similar prevalence of low BMIs (5.5 percentbelow 18.5 kg/m2) among women from the Greater Accra region.
Health
A visual analog scale was also used with mothers,who were asked to evaluate theirown health status and compare their health to that of other women their age. Theaverage score was 71.56,with a standard deviation of 18.76. Like the distributionof the children’s health scores,this one was skewed to the right. Mothers perceivedthemselves as generally healthy compared with other women the same age. The av-erage age of mothers in the sample was 30 years old. As expected from this rela-tively young sample, the prevalence of reported chronic diseases was low: only 2mothers reported having diabetes,26 reported hypertension,17 asthma,18 heart ill -ness,17 anemia,and 6 arthritis.
89
maxwell chap06 5/9/0 8:28 PM Page 89
Overweight Mother/Stunted Child
During the qualitative community studies,researchers noted an apparently highprevalence of obese women and undernourished children in the same households,particularly in the indigenous neighborhoods of Accra (Ga Mashie Study Team1996). In the perception of most respondents,this combination was the result of dietand livelihood activities (for the mothers) and poor childcare and inadequate foodconsumption (for the children). This phenomenon raises two important issues. Thefirst involves its root cause. Do households allocate resources poorly and have poorcaregiving practices,or is there an outright food security problem? The secondpoint relates to the association between malnutrition in utero and during early child-hood and the increased risk of chronic diseases during adult life (Barker 1994).Barker hypothesizes that a significant proportion of obese women living in poorurban areas of the developing world today were malnourished in utero and duringearly childhood. It is this group of women that may now be suffering some of thelong-term negative consequences of early malnutrition (WHO 1997). This latterpoint could not be investigated in the present study because of a lack of informationon the early childhood nutritional status of adult women in the sample.
In pursuing the first question,researchers compared the prevalence of children’sstunting among four groups,using the mothers’ BMIs (Gibson 1990). In the groupof mothers with low BMIs (less than 20 kg/m2), 17 percent of children werestunted, compared with approximately 14 percent in the group of mothers withBMIs greater than or equal to 27 kg/m2 (Table 41). There were no differences in theprevalence of childhood stunting by maternal BMI, and the prevalence of stuntingamong underweight mothers was only slightly greater (the trend test was not statis-tically significant). These findings were confirmed using more extreme cutoff val-ues (lower than 18.5 and higher than 30 kg/m2).
These findings suggest that either maternal BMI is not a good proxy for house-hold food availability in this population, or that food availability may not be themost important factor in the etiology of stunting in Accra. The next chapter will an-alyze the importance of other maternal and household factors.
90
Table 41—Prevalence of stunting in childr en with obese mothers (indexchildr en,0–39 months old)
Number of Percent of mothers Number of Percent ofMaternal BMI mothers who are obese childr en stunted childr en stunted
(kg/m2)
<20 86 15.7 15 17.420–24.9 262 47.8 41 15.625–26.9 62 11.3 9 14.5≥27 138 25.2 20 14.5
Source: Accra Study Team 1998.Note: BMI = body mass index. Obesity is BMI > 29 kg/m2.
maxwell chap06 5/9/0 8:28 PM Page 90
CHAPTER 7
Caregiving Behaviors and Resources
Along with food security, the availability of health services, and a healthy en-vironment, caregiving behaviors are one of the major determinants of good
health and nutrition in young children. The analysis of care capacity at the house-hold level takes into consideration a range of resources as well as the actual care-giving practices themselves. Care resources include human resources, as measuredby maternal and household characteristics; economic resources available at thehousehold level; and organization resources at both the household and the commu-nity level. Care behaviors are the actual practices that caregivers, households, andcommunities adopt to support the physical, mental, and social needs of the growingchild and other household members. This chapter provides a descriptive analysisof care resources,particularly the characteristics of the principal caregiver (age, ed-ucation, work status) and of the household (socioeconomic factors and the avail-ability of services) that may affect the caregivers’ ability to provide good care forthe growing child. Care behaviorsrelated specifically to child feeding, preventivehealth-seeking behavior, and hygiene are also reviewed. An analysis of the associ-ations between these care resources and behavior is then presented, followed by ananalysis of the associations between care behaviors and child nutritional status andmorbidity outcomes.
Caregiving and Urbanization
The fact that this study took place in an urban setting deserves special mention, asthe effects of urbanization may have serious consequences for care provision.Growing cities such as Accra are characterized by a deteriorating environment andphysical infrastructure, a lack of basic services, an increased exposure to environ-mental contamination and rising poverty levels. Women, who are the primary careproviders in most households, increasingly need to generate income. Nearly halfof all females older than 10 years of age in this sample were engaged in income-generating activities in addition to their household responsibilities. Under such con-ditions, households can foster good health and nutrition in young children only ifthey can maximize the efficacy of use of their scarce resources.
91
maxwell chap07 5/9/0 8:28 PM Page 91
Care Resources of Accra Households
Characteristics of Caregivers
In 96 percent of cases,the primary caregivers were the biological mothers of the indexchildren. All but three of the caregivers who were not biological mothers were grand-mothers. Data on care resources were collected on all primary caregivers, whetherthey were biological mothers or not,because personal and family characteristicsinfluence all caring behaviors.
The majority of primary caregivers in the sample (63 percent) had some basiceducation. About 12 percent had no education at all, and 25 percent had a highschool education or higher (Table 42). The predominant ethnic groups in the samplewere the Ga and Adangbe, who are indigenous to the greater Accra region. Abouttwo-thirds of the primary caregivers were married and the only wife, while another16 percent were single, either cohabiting or living alone. The majority of primarycaregivers received some financial support from the father of their children.
The majority of primary caregivers were working, either full time (55 percent)or part time (9 percent). Of those working, 49 percent were selling in the marketsor on the streets,34 percent were working from home, and only 17 percent wereeither factory or office workers or shopkeepers. The large majority of primary care-givers took care of their children at all times (65 percent),and more than half lookedafter their child while working. The majority of primary caregivers worked in pettytrading and street food vending, and many worked long hours (more than 8 hoursper day). Some part of their activities took place at home, particularly in the mostdensely populated neighborhoods. At home, particularly in compound family houses,other people would be available to help with a kiosk or other small business and tolook after the children,at least informally. On the streets or in the markets,this in-formal support would be less available. Only 35 percent of caregivers reported usingsome type of alternative childcare. Of those, the majority used a single person,12 per-cent used more than one, and 28 percent used a crèche.
Household Care Resources
Other factors that may affect quality of caregiving—especially the caregivers’ abil-ity to maintain a hygienic environment—include the availability of water and sani-tary facilities (see Chapter 3). The toilet facilities available to Accra’s population aremainly public latrines (54 percent) and private improved pit latrines (20 percent).Only 10 percent of households had flush toilets at the time of the study, and 16 per-cent did not have or use any toilets at all (that is, they used empty lots and gutters).Sources of drinking water were mainly vendors or wells (54 percent). Only 38 per-cent of households had water in the compound of their homes,and just 7 percenthad indoor piping. Waste disposal methods were mainly public dumping, dumping ingutters or empty lots,household’s collection,and burying or burning on compoundsof homes (Table 43).
92
maxwell chap07 5/9/0 8:28 PM Page 92
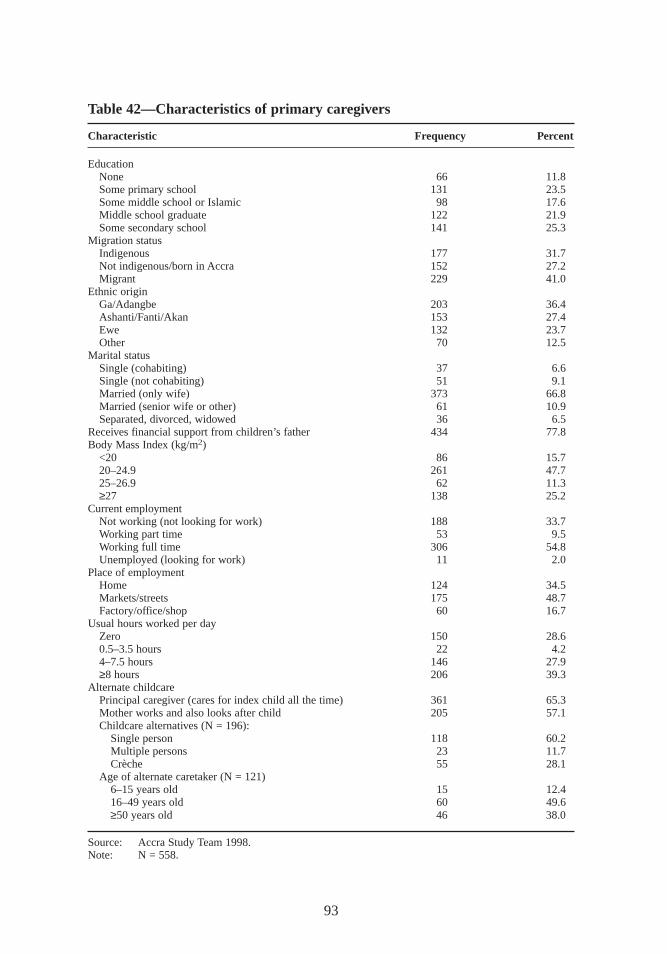
93
Table 42—Characteristics of primary caregivers
Characteristic Frequency Percent
EducationNone 66 11.8Some primary school 131 23.5Some middle school or Islamic 98 17.6Middle school graduate 122 21.9Some secondary school 141 25.3
Migration statusIndigenous 177 31.7Not indigenous/born in Accra 152 27.2Migrant 229 41.0
Ethnic originGa/Adangbe 203 36.4Ashanti/Fanti/Akan 153 27.4Ewe 132 23.7Other 70 12.5
Marital statusSingle (cohabiting) 37 6.6Single (not cohabiting) 51 9.1Married (only wife) 373 66.8Married (senior wife or other) 61 10.9Separated, divorced, widowed 36 6.5
Receives financial support from children’s father 434 77.8Body Mass Index (kg/m2)
<20 86 15.720–24.9 261 47.725–26.9 62 11.3≥27 138 25.2
Current employmentNot working (not looking for work) 188 33.7Working part time 53 9.5Working full time 306 54.8Unemployed (looking for work) 11 2.0
Place of employmentHome 124 34.5Markets/streets 175 48.7Factory/office/shop 60 16.7
Usual hours worked per dayZero 150 28.60.5–3.5 hours 22 4.24–7.5 hours 146 27.9≥8 hours 206 39.3
Alternate childcarePrincipal caregiver (cares for index child all the time) 361 65.3Mother works and also looks after child 205 57.1Childcare alternatives (N = 196):
Single person 118 60.2Multiple persons 23 11.7Crèche 55 28.1
Age of alternate caretaker (N = 121)6–15 years old 15 12.416–49 years old 60 49.6≥50 years old 46 38.0
Source: Accra Study Team 1998.Note: N = 558.
maxwell chap07 5/9/0 8:28 PM Page 93
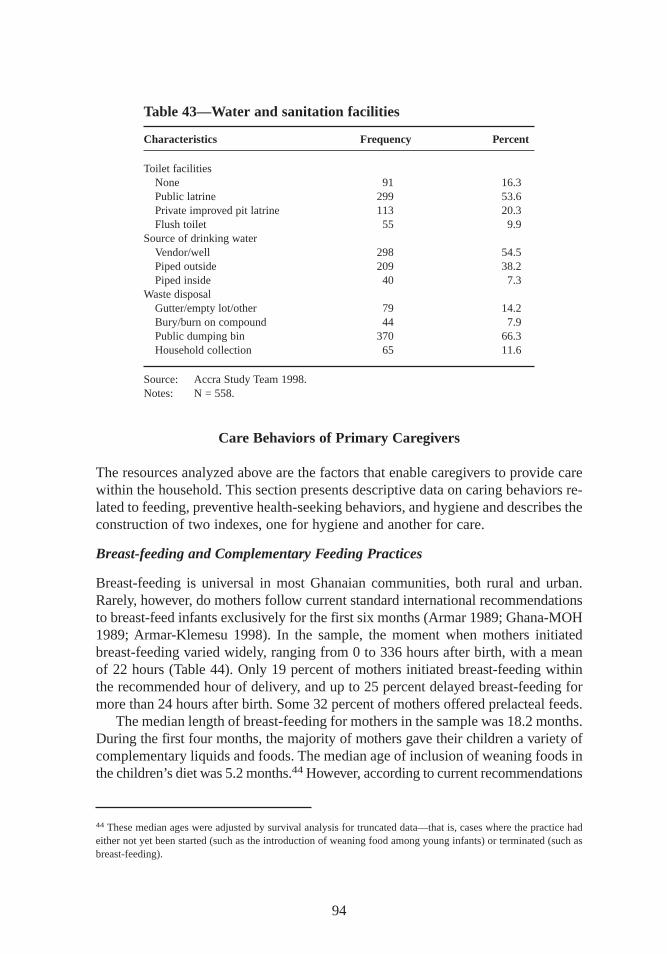
Care Behaviors of Primary Caregivers
The resources analyzed above are the factors that enable caregivers to provide carewithin the household. This section presents descriptive data on caring behaviors re-lated to feeding, preventive health-seeking behaviors,and hygiene and describes theconstruction of two indexes,one for hygiene and another for care.
Breast-feeding and Complementary Feeding Practices
Breast-feeding is universal in most Ghanaian communities,both rural and urban.Rarely, however, do mothers follow current standard international recommendationsto breast-feed infants exclusively for the first six months (Armar 1989; Ghana-MOH1989; Armar-Klemesu 1998). In the sample, the moment when mothers initiatedbreast-feeding varied widely, ranging from 0 to 336 hours after birth, with a meanof 22 hours (Table 44). Only 19 percent of mothers initiated breast-feeding withinthe recommended hour of delivery, and up to 25 percent delayed breast-feeding formore than 24 hours after birth. Some 32 percent of mothers offered prelacteal feeds.
The median length of breast-feeding for mothers in the sample was 18.2 months.During the first four months,the majority of mothers gave their children a variety ofcomplementary liquids and foods. The median age of inclusion of weaning foods inthe children’s diet was 5.2 months.44However, according to current recommendations
94
Table 43—Water and sanitation facilities
Characteristics Frequency Percent
Toilet facilitiesNone 91 16.3Public latrine 299 53.6Private improved pit latrine 113 20.3Flush toilet 55 9.9
Source of drinking waterVendor/well 298 54.5Piped outside 209 38.2Piped inside 40 7.3
Waste disposalGutter/empty lot/other 79 14.2Bury/burn on compound 44 7.9Public dumping bin 370 66.3Household collection 65 11.6
Source: Accra Study Team 1998.Notes: N = 558.
44 These median ages were adjusted by survival analysis for truncated data—that is, cases where the practice hadeither not yet been started (such as the introduction of weaning food among young infants) or terminated (such asbreast-feeding).
maxwell chap07 5/9/0 8:28 PM Page 94
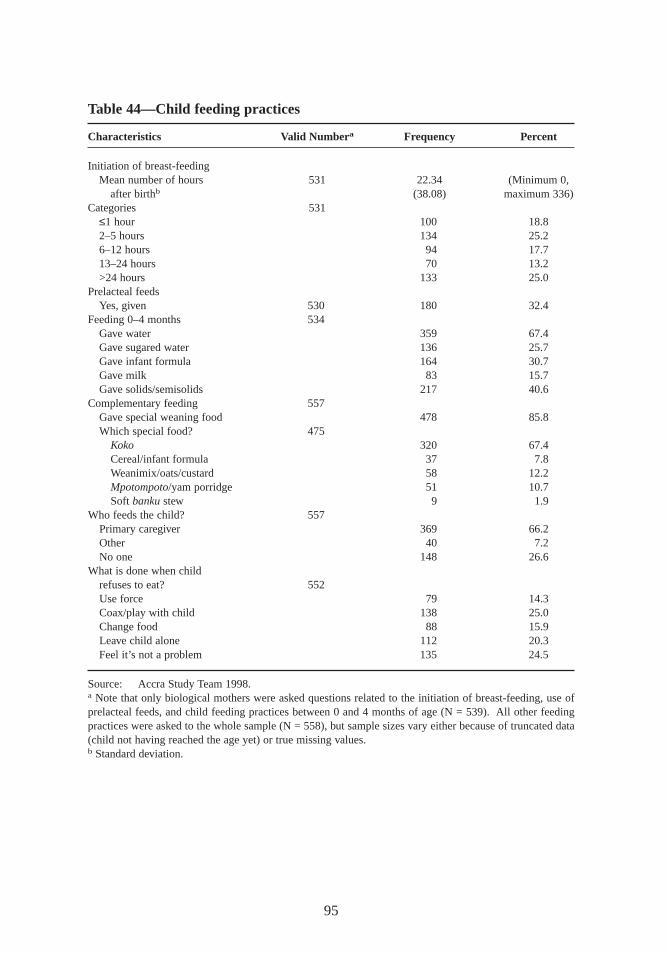
95
Table 44—Child feeding practices
Characteristics Valid Numbera Frequency Percent
Initiation of breast-feedingMean number of hours 531 22.34 (Minimum 0,
after birthb (38.08) maximum 336)Categories 531
≤1 hour 100 18.82–5 hours 134 25.26–12 hours 94 17.713–24 hours 70 13.2>24 hours 133 25.0
Prelacteal feedsYes,given 530 180 32.4
Feeding 0–4 months 534Gave water 359 67.4Gave sugared water 136 25.7Gave infant formula 164 30.7Gave milk 83 15.7Gave solids/semisolids 217 40.6
Complementary feeding 557Gave special weaning food 478 85.8Which special food? 475
Koko 320 67.4Cereal/infant formula 37 7.8Weanimix/oats/custard 58 12.2Mpotompoto/yam porridge 51 10.7Soft bankustew 9 1.9
Who feeds the child? 557Primary caregiver 369 66.2Other 40 7.2No one 148 26.6
What is done when childrefuses to eat? 552Use force 79 14.3Coax/play with child 138 25.0Change food 88 15.9Leave child alone 112 20.3Feel it’s not a problem 135 24.5
Source: Accra Study Team 1998.a Note that only biological mothers were asked questions related to the initiation of breast-feeding, use ofprelacteal feeds,and child feeding practices between 0 and 4 months of age (N = 539). All other feedingpractices were asked to the whole sample (N = 558),but sample sizes vary either because of truncated data(child not having reached the age yet) or true missing values.b Standard deviation.
maxwell chap07 5/9/0 8:28 PM Page 95
(WHO 1995; WHO 1998),complementary feeding should be introduced into chil-dren’s diets starting around the age of 6 months. Special weaning foods are alsorecommended rather than the family diet. Young infants need soft foods and, moreimportant they need foods that provide higher energy and nutrient density than mostfamily diets provide. Even traditional weaning foods are often not ideal in terms ofnutrient density (especially with regard to bioavailable vitamins and minerals). Forthis reason,many countries promote locally produced, cheap, and culturally accept-able fortif ied weaning mixtures.
In Ghana,koko, a thin,low-energy, low-nutrient porridge or gruel prepared fromfermented maize dough,remains a popular traditional weaning food for infants. Con-sumption of koko was in fact implicated in the development of protein-energy mal-nutrition among Ghanaian children (Williams 1933). Efforts to encourage mothersto enrich the porridge by adding milk, fish powder, groundnut paste, or bean flourhave been largely unsuccessful. To address this problem, since 1987 the NutritionDivision of Ghana’s Ministry of Health,with support from UNICEF, has been pro-moting and encouraging the consumption of weanimix,a locally formulated cereal-legume mixture, as an alternative to koko. Weanimixhas unfortunately not beenwidely accepted, and koko continues to be the preferred weaning food for the ma-jority of Ghanaian infants (Armar-Klemesu 1996).
Some 86 percent of primary caregivers offered special weaning foods to the indexchild. Koko was the first food offered to the majority of children (67 percent),fol-lowed by weanimix,oats,or custard (12 percent),and by a porridge called mpotom-poto(11 percent). The median age for the introduction of family food was 9.2 months.Primary caregivers fed children in 66 percent of cases,while 27 percent of childrenfed themselves and 7 percent were fed by an alternate caregiver. About 24 percentof mothers claimed that they had no problems feeding their children. But whenchildren refused to eat, 14 percent of mothers reported trying to force them to eat,25 percent tried coaxing or playing with the child, 16 percent tried another food,and 20 percent did nothing. Helping feed and stimulate children during meals is rec-ognized as an important component of psychosocial care, especially for childrenwith poor appetites (Bentley, Black, and Hurtado 1995).
Preventive Health-Seeking Behaviors
Health-seeking behaviors include both the management of illness at home—prevention,diagnosis,and treatment—and the utilization of health services. Onlythe preventive use of health services for mothers and index children were addressedin this study, however.
Almost all mothers (97 percent) had attended prenatal care at some point duringtheir pregnancies—the same results found for urban mothers in the 1993 DHS (thefigure was 84 percent in rural areas). But about half of the women in this surveysought prenatal care only during their second trimester, and a small proportionwaited until the third trimester or just before birth (Table 45). Mothers reported that
96
maxwell chap07 5/9/0 8:28 PM Page 96
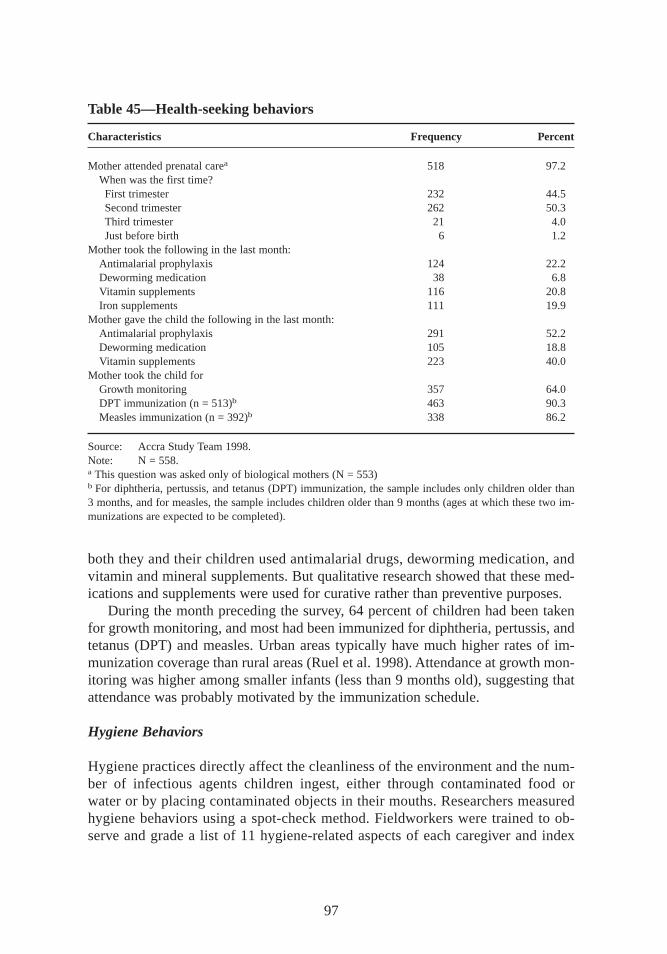
both they and their children used antimalarial drugs,deworming medication, andvitamin and mineral supplements. But qualitative research showed that these med-ications and supplements were used for curative rather than preventive purposes.
During the month preceding the survey, 64 percent of children had been takenfor growth monitoring, and most had been immunized for diphtheria, pertussis,andtetanus (DPT) and measles. Urban areas typically have much higher rates of im-munization coverage than rural areas (Ruel et al. 1998). Attendance at growth mon-itoring was higher among smaller infants (less than 9 months old),suggesting thatattendance was probably motivated by the immunization schedule.
Hygiene Behaviors
Hygiene practices directly affect the cleanliness of the environment and the num-ber of infectious agents children ingest, either through contaminated food orwater or by placing contaminated objects in their mouths. Researchers measuredhygiene behaviors using a spot-check method. Fieldworkers were trained to ob-serve and grade a list of 11 hygiene-related aspects of each caregiver and index
97
Table 45—Health-seeking behaviors
Characteristics Frequency Percent
Mother attended prenatal carea 518 97.2When was the first time?First trimester 232 44.5Second trimester 262 50.3Third trimester 21 4.0Just before birth 6 1.2
Mother took the following in the last month:Antimalarial prophylaxis 124 22.2Deworming medication 38 6.8Vitamin supplements 116 20.8Iron supplements 111 19.9
Mother gave the child the following in the last month:Antimalarial prophylaxis 291 52.2Deworming medication 105 18.8Vitamin supplements 223 40.0
Mother took the child forGrowth monitoring 357 64.0DPT immunization (n = 513)b 463 90.3Measles immunization (n = 392)b 338 86.2
Source: Accra Study Team 1998.Note: N = 558.a This question was asked only of biological mothers (N = 553)b For diphtheria, pertussis,and tetanus (DPT) immunization, the sample includes only children older than3 months,and for measles,the sample includes children older than 9 months (ages at which these two im-munizations are expected to be completed).
maxwell chap07 5/9/0 8:28 PM Page 97
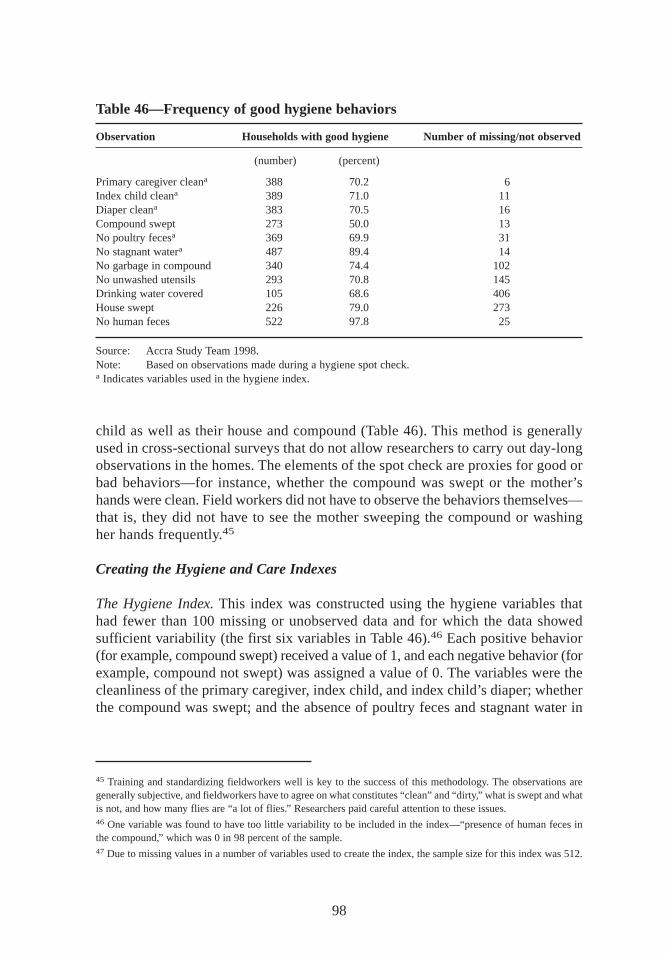
child as well as their house and compound (Table 46). This method is generallyused in cross-sectional surveys that do not allow researchers to carry out day-longobservations in the homes. The elements of the spot check are proxies for good orbad behaviors—for instance, whether the compound was swept or the mother’shands were clean. Field workers did not have to observe the behaviors themselves—that is, they did not have to see the mother sweeping the compound or washingher hands frequently.45
Creating the Hygiene and Care Indexes
The Hygiene Index. This index was constructed using the hygiene variables thathad fewer than 100 missing or unobserved data and for which the data showedsufficient variability (the first six variables in Table 46).46 Each positive behavior(for example, compound swept) received a value of 1,and each negative behavior (forexample, compound not swept) was assigned a value of 0. The variables were thecleanliness of the primary caregiver, index child, and index child’s diaper; whetherthe compound was swept; and the absence of poultry feces and stagnant water in
98
Table 46—Frequency of good hygiene behaviors
Observation Households with good hygiene Number of missing/not observed
(number) (percent)
Primary caregiver cleana 388 70.2 6Index child cleana 389 71.0 11Diaper cleana 383 70.5 16Compound swept 273 50.0 13No poultry fecesa 369 69.9 31No stagnant watera 487 89.4 14No garbage in compound 340 74.4 102No unwashed utensils 293 70.8 145Drinking water covered 105 68.6 406House swept 226 79.0 273No human feces 522 97.8 25
Source: Accra Study Team 1998.Note: Based on observations made during a hygiene spot check.a Indicates variables used in the hygiene index.
45 Training and standardizing fieldworkers well is key to the success of this methodology. The observations aregenerally subjective, and fieldworkers have to agree on what constitutes “clean”and “dir ty,” what is swept and whatis not,and how many flies are “a lot of flies.” Researchers paid careful attention to these issues.46 One variable was found to have too little variability to be included in the index—“presence of human feces inthe compound,” which was 0 in 98 percent of the sample.47 Due to missing values in a number of variables used to create the index, the sample size for this index was 512.
maxwell chap07 5/9/0 8:28 PM Page 98
the compound.47 The index was the sum of the six variables,and scores ranged from0 to 6.
Based on the frequency distribution of the index, three categories of hygienepractices were created:
1. Bad—those with scores of 0–3 (30.3 percent);2. Average—those with scores of 4–5 (39.5); and3. Good—those with the maximum score (6) (30.3).
The Care Index. No single indicator can capture the complex patterns of behaviorthat constitute good child care. Researchers therefore created a care index to reflectthe combination of factors measured in this study, using data on child feedingpractices and the use of preventive health care services (Table 47).48 The generalprinciple was to allocate a score of –1 for a practice believed to be harmful, 0 for apractice believed to be beneficial, and +1 for a particularly beneficial practice. Prac-tices were considered beneficial or harmful based on current child feeding recom-mendations (WHO 1995; WHO 1998) and on available scientific evidence about thebenefits or risks of these practices.
The index was made age specific so that both the variables and scoring systemcould vary by age as appropriate. Scores for the different practices were then addedup to create the index for each age group. The maximum possible score for eachgroup was +2,and the minimum was –11. The mean and standard deviations were–2.49 and 1.91,respectively. Terciles were created to form three categories of over-all caring practices—poor, average, and good.
Associations Between Care Resources and Care Practices
According to the conceptual model (Figure 2),care resources have a direct effect oncaring behaviors,which in turn are important determinants of children’s nutritionaland health status. This section uses bivariate analysis to examine how care resourcesare related to care practices in the sample.
Of all the factors studied at either level (individual primary caretaker or house-hold), only the formal education of the primary caregiver is associated positivelywith both the care and hygiene indexes (Table 48). Household expenditure levelsare not associated with the care index in these bivariate analyses,but they are pos-itively associated with good hygiene. Maternal working status,number of hoursworked, and use of alternate childcare are not significantly related to either index.The association found between place of work and the hygiene score probably re-flects differences in socioeconomic status between primary caregivers who work in
99
48 The index was created only for children 4 months or older, because only two variables (the first two in Table 47)were available to construct the index for infants below this age. This adjustment brought the sample size to 512 chil-dren. Owing to missing values in some of the variables included in the index, the final sample size was 475 children.
maxwell chap07 5/9/0 8:28 PM Page 99
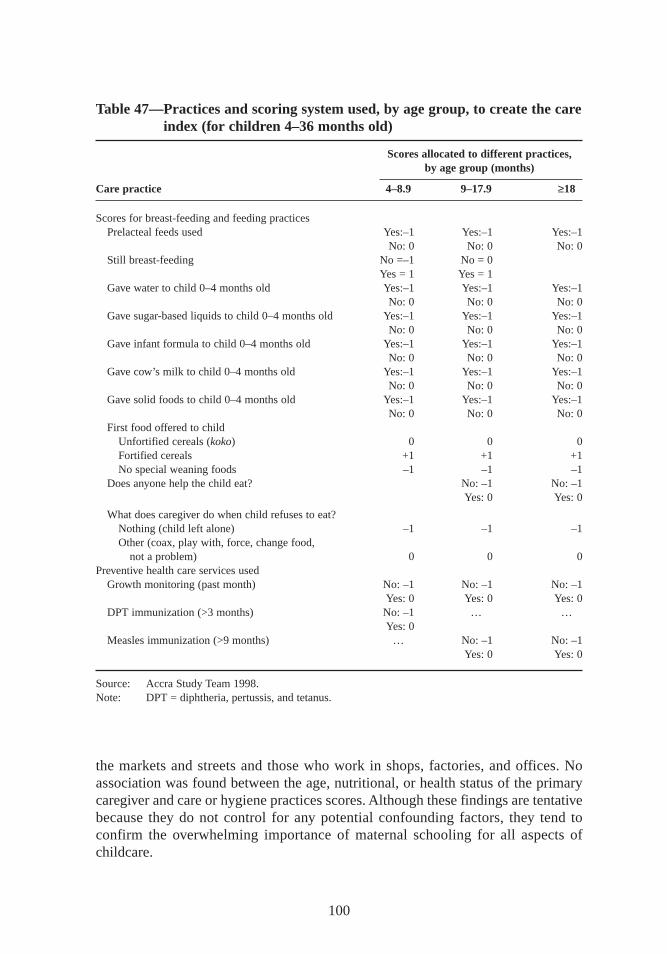
100
Table 47—Practices and scoring system used, by age group, to create the careindex (for childr en 4–36 months old)
Scores allocated to different practices,by age group (months)
Care practice 4–8.9 9–17.9 ≥18
Scores for breast-feeding and feeding practicesPrelacteal feeds used Yes:–1 Yes:–1 Yes:–1
No: 0 No: 0 No: 0Still breast-feeding No =–1 No = 0
Yes = 1 Yes = 1Gave water to child 0–4 months old Yes:–1 Yes:–1 Yes:–1
No: 0 No: 0 No: 0Gave sugar-based liquids to child 0–4 months old Yes:–1 Yes:–1 Yes:–1
No: 0 No: 0 No: 0Gave infant formula to child 0–4 months old Yes:–1 Yes:–1 Yes:–1
No: 0 No: 0 No: 0Gave cow’s milk to child 0–4 months old Yes:–1 Yes:–1 Yes:–1
No: 0 No: 0 No: 0Gave solid foods to child 0–4 months old Yes:–1 Yes:–1 Yes:–1
No: 0 No: 0 No: 0First food offered to child
Unfortif ied cereals (koko) 0 0 0Fortif ied cereals +1 +1 +1No special weaning foods –1 –1 –1
Does anyone help the child eat? No: –1 No: –1Yes:0 Yes:0
What does caregiver do when child refuses to eat?Nothing (child left alone) –1 –1 –1Other (coax,play with, force, change food,
not a problem) 0 0 0Preventive health care services used
Growth monitoring (past month) No: –1 No: –1 No: –1Yes:0 Yes:0 Yes:0
DPT immunization (>3 months) No: –1 … …Yes:0
Measles immunization (>9 months) … No: –1 No: –1Yes:0 Yes:0
Source: Accra Study Team 1998.Note: DPT = diphtheria, pertussis,and tetanus.
the markets and streets and those who work in shops,factories, and offices. Noassociation was found between the age, nutritional, or health status of the primarycaregiver and care or hygiene practices scores. Although these findings are tentativebecause they do not control for any potential confounding factors, they tend toconfirm the overwhelming importance of maternal schooling for all aspects ofchildcare.
maxwell chap07 5/9/0 8:28 PM Page 100
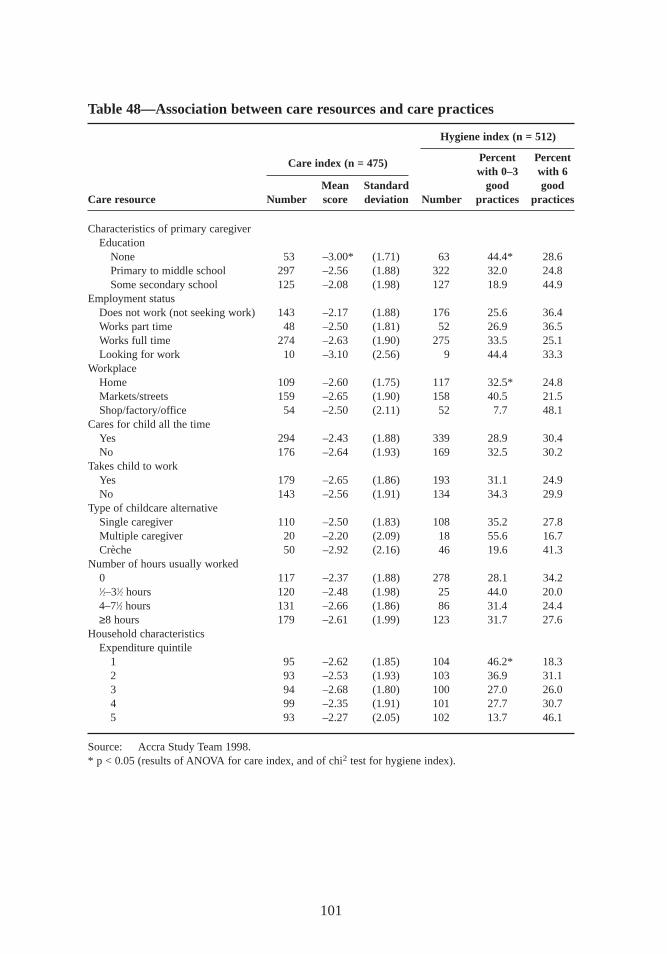
101
Table 48—Association between care resources and care practices
Care index (n = 475)
Hygiene index (n = 512)
Percent Percentwith 0–3 with 6
Mean Standard good goodCare resource Number score deviation Number practices practices
Characteristics of primary caregiverEducation
None 53 –3.00* (1.71) 63 44.4* 28.6Primary to middle school 297 –2.56 (1.88) 322 32.0 24.8Some secondary school 125 –2.08 (1.98) 127 18.9 44.9
Employment statusDoes not work (not seeking work) 143 –2.17 (1.88) 176 25.6 36.4Works part time 48 –2.50 (1.81) 52 26.9 36.5Works full time 274 –2.63 (1.90) 275 33.5 25.1Looking for work 10 –3.10 (2.56) 9 44.4 33.3
WorkplaceHome 109 –2.60 (1.75) 117 32.5* 24.8Markets/streets 159 –2.65 (1.90) 158 40.5 21.5Shop/factory/office 54 –2.50 (2.11) 52 7.7 48.1
Cares for child all the timeYes 294 –2.43 (1.88) 339 28.9 30.4No 176 –2.64 (1.93) 169 32.5 30.2
Takes child to workYes 179 –2.65 (1.86) 193 31.1 24.9No 143 –2.56 (1.91) 134 34.3 29.9
Type of childcare alternativeSingle caregiver 110 –2.50 (1.83) 108 35.2 27.8Multiple caregiver 20 –2.20 (2.09) 18 55.6 16.7Crèche 50 –2.92 (2.16) 46 19.6 41.3
Number of hours usually worked0 117 –2.37 (1.88) 278 28.1 34.21⁄2–31⁄2 hours 120 –2.48 (1.98) 25 44.0 20.04–71⁄2 hours 131 –2.66 (1.86) 86 31.4 24.4≥8 hours 179 –2.61 (1.99) 123 31.7 27.6
Household characteristicsExpenditure quintile
1 95 –2.62 (1.85) 104 46.2* 18.32 93 –2.53 (1.93) 103 36.9 31.13 94 –2.68 (1.80) 100 27.0 26.04 99 –2.35 (1.91) 101 27.7 30.75 93 –2.27 (2.05) 102 13.7 46.1
Source: Accra Study Team 1998.* p < 0.05 (results of ANOVA for care index, and of chi2 test for hygiene index).
maxwell chap07 5/9/0 8:28 PM Page 101
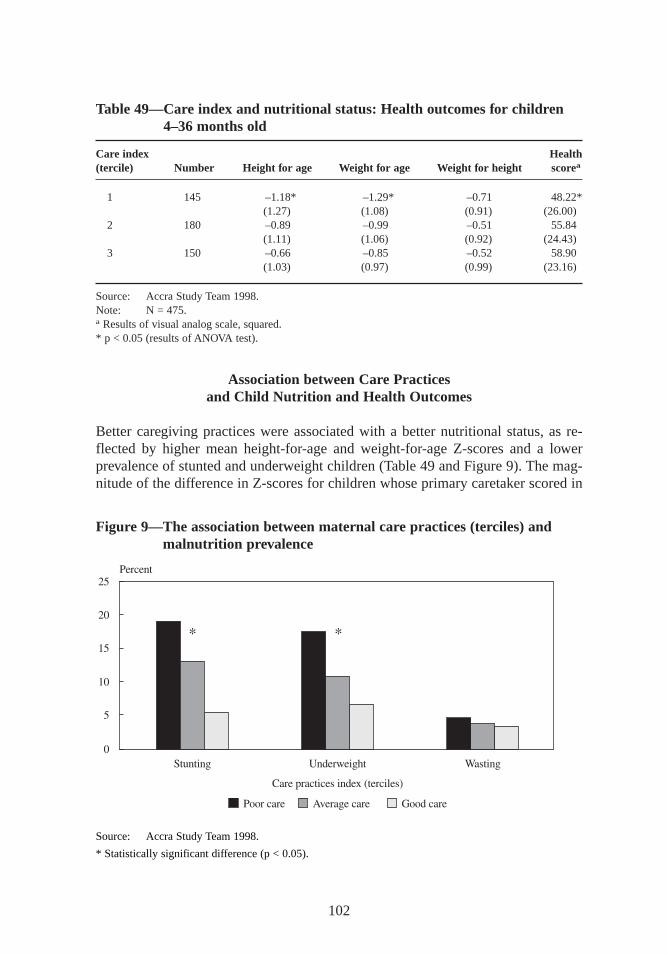
Association between Care Practicesand Child Nutr ition and Health Outcomes
Better caregiving practices were associated with a better nutritional status, as re-flected by higher mean height-for-age and weight-for-age Z-scores and a lowerprevalence of stunted and underweight children (Table 49 and Figure 9). The mag-nitude of the difference in Z-scores for children whose primary caretaker scored in
102
Table 49—Care index and nutr itional status: Health outcomes for childr en4–36 months old
Care index Health(tercile) Number Height for age Weight for age Weight for height scorea
1 145 –1.18* –1.29* –0.71 48.22*(1.27) (1.08) (0.91) (26.00)
2 180 –0.89 –0.99 –0.51 55.84(1.11) (1.06) (0.92) (24.43)
3 150 –0.66 –0.85 –0.52 58.90(1.03) (0.97) (0.99) (23.16)
Source: Accra Study Team 1998.Note: N = 475.a Results of visual analog scale, squared.* p < 0.05 (results of ANOVA test).
Figure 9—The association between maternal care practices (terciles) andmalnutr ition pr evalence
Source: Accra Study Team 1998.
* Statistically significant difference (p < 0.05).
maxwell chap07 5/9/0 8:28 PM Page 102
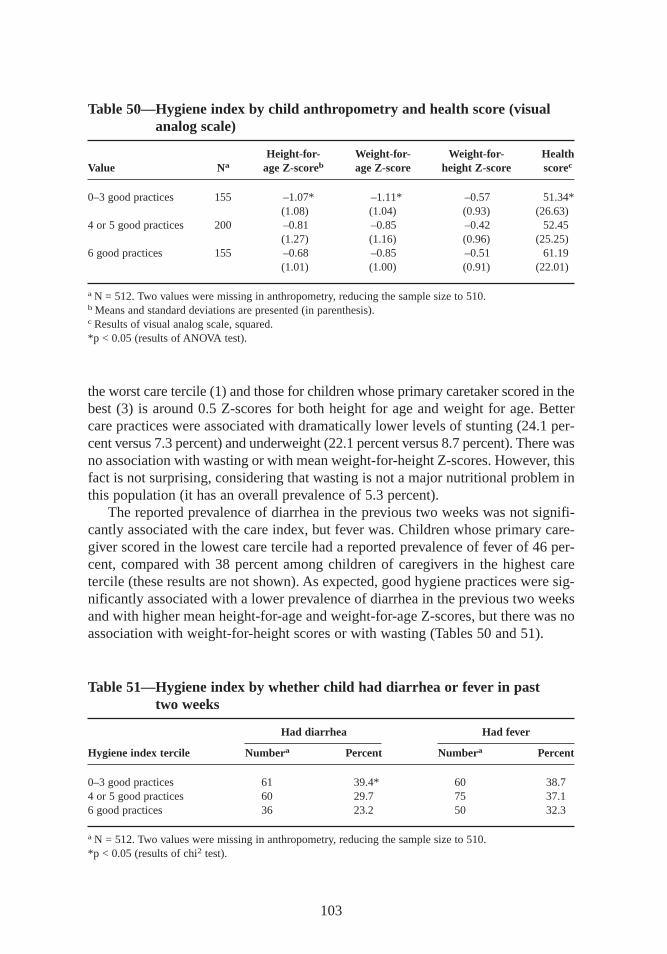
the worst care tercile (1) and those for children whose primary caretaker scored in thebest (3) is around 0.5 Z-scores for both height for age and weight for age. Bettercare practices were associated with dramatically lower levels of stunting (24.1 per-cent versus 7.3 percent) and underweight (22.1 percent versus 8.7 percent). There wasno association with wasting or with mean weight-for-height Z-scores. However, thisfact is not surprising, considering that wasting is not a major nutritional problem inthis population (it has an overall prevalence of 5.3 percent).
The reported prevalence of diarrhea in the previous two weeks was not signifi-cantly associated with the care index, but fever was. Children whose primary care-giver scored in the lowest care tercile had a reported prevalence of fever of 46 per-cent,compared with 38 percent among children of caregivers in the highest caretercile (these results are not shown). As expected, good hygiene practices were sig-nificantly associated with a lower prevalence of diarrhea in the previous two weeksand with higher mean height-for-age and weight-for-age Z-scores,but there was noassociation with weight-for-height scores or with wasting (Tables 50 and 51).
103
Table 50—Hygiene index by child anthr opometry and health score (visualanalog scale)
Height-for- Weight-for- Weight-for- HealthValue Na age Z-scoreb age Z-score height Z-score scorec
0–3 good practices 155 –1.07* –1.11* –0.57 51.34*(1.08) (1.04) (0.93) (26.63)
4 or 5 good practices 200 –0.81 –0.85 –0.42 52.45(1.27) (1.16) (0.96) (25.25)
6 good practices 155 –0.68 –0.85 –0.51 61.19(1.01) (1.00) (0.91) (22.01)
a N = 512. Two values were missing in anthropometry, reducing the sample size to 510.b Means and standard deviations are presented (in parenthesis).c Results of visual analog scale, squared.*p < 0.05 (results of ANOVA test).
Table 51—Hygiene index by whether child had diarrhea or fever in past two weeks
Had diarrhea Had fever
Hygiene index tercile Numbera Percent Numbera Percent
0–3 good practices 61 39.4* 60 38.74 or 5 good practices 60 29.7 75 37.16 good practices 36 23.2 50 32.3
a N = 512. Two values were missing in anthropometry, reducing the sample size to 510.*p < 0.05 (results of chi2 test).
maxwell chap07 5/9/0 8:28 PM Page 103
These findings confirm that care practices related to child feeding, use of pre-ventive health care, and hygiene are important to children’s nutritional status andhealth. Hygiene appears to have a more direct effect on infectious diseases and thusindirectly affects growth, especially in the long term. Feeding practices (at least thepractices studied) may have a more direct effect on nutritional status and growth, butthey may also have an effect on infectious diseases through appetite and immunity.Hygiene is strongly associated with the prevalence of diarrhea,but care is not. Hy-giene and care are associated with mean height-for-age and weight-for-age Z-scores.
Other Factors Af fecting Care
Lif e in urban areas is thought to present special challenges for the provision of ad-equate care, as noted earlier. The trade-offs women face between their productiveand reproductive roles are likely to be more acute in urban than rural areas. Womenin urban areas are often thought to be more likely than women in rural areas to workoutside the home, for instance. According to the 1993 DHS data,however, this no-tion does not hold true in Ghana,where 50.7 percent of women in rural areas and43.4 percent in urban areas work outside the home. But in this sample from Accra,about two-thirds of all primary caregivers of young children engaged in some kindof income-generating activity. The majority of them worked at a location away fromtheir homes,and a large plurality of them worked very long hours. In spite of theirapparently heavy workloads,up to two-thirds of primary caregivers cared for theirchildren at all times. Among those who worked, more than half still looked aftertheir child on a full-time basis. Only 35 percent of households reported using sometype of alternative childcare.
Bivariate analysis does not show any association between maternal work pat-terns and childcare practices. This finding may be due to the fact that mothers docontinue to take care of their child while they work and thus are able to breast-feedand take care of infants’special needs. Qualitative results,which Chapter 10 ex-plores in greater detail,reveal that mothers of young children perceive that work canlimit their ability to provide adequate childcare. At the same time, these womenknow that they must earn an income in order to provide food and other necessitiesfor their children. Results here suggest that many working women are able to copewith this dilemma (see Chapter 9).
The next chapter examines the possible links between health and nutrition andthe communities where people live, as well as the implications for targeting pro-grams if neighborhoods are found to be mixed rather than homogeneous (Morris etal. 1999).
104
maxwell chap07 5/9/0 8:28 PM Page 104
CHAPTER 8
Spatial Clustering of Outcomes
Earlier studies of Accra have characterized entire neighborhoods homoge-neously in terms of ethnicity, density, centrality, and income and have relied
on these characterizations for policy recommendations (Housing and Urban Devel-opment Associates 1990; Ghana—MLG 1992; Benneh et al. 1993; Songsore andMcGranahan 1993).49 Certainly, there are valid reasons for presuming some degreeof spatial homogeneity in terms of income and therefore in measures of human wel-fare in Accra. Findings from this study, however, suggest that neighborhoods inAccra are more mixed than was previously assumed. This finding has important im-plications for future studies and interventions in the city.
Accra’s neighborhoods have generally been perceived as homogeneous for sev-eral reasons. First, the underlying process of urbanization in Accra has resulted insharp contrasts between indigenous and migrant neighborhoods. These differencesgive rise to cultural singularities in household composition and structure, as well asin child-raising practices. In indigenous neighborhoods in particular, many peoplelive in family-compound houses and do not pay rent, as noted in Chapter 5—a fac-tor that tends to limit their ability to change residences.
Second, other patterns of residence tend to promote less mobility within the city.The cost of rent and the tendency of landlords to demand several years’ rent in ad-vance promote greater income differentiation at the neighborhood level and reduceshort-term mobility (in place of residence, at least). Third, there are major differencesin human capital and housing quality (including housing density)—factors known toaffect health and nutrition outcomes—in the city’s neighborhoods. And finally, neigh-borhood infrastructure, including services, programs, and community developmentprojects, may directly affect health and nutrition outcomes in certain areas of the city.
The presence or absence of significant spatial homogeneity in outcomes relatedto poverty and poor health and nutrition is an important factor in planning povertyalleviation programs or infrastructure projects. Beneficiaries must have a high
105
49 While the size of these neighborhoods varies considerably, on average they are 7–8 times larger than the enu-meration areas delineated by the GSS that were used for this survey.
maxwell chap08 5/9/0 8:27 PM Page 105
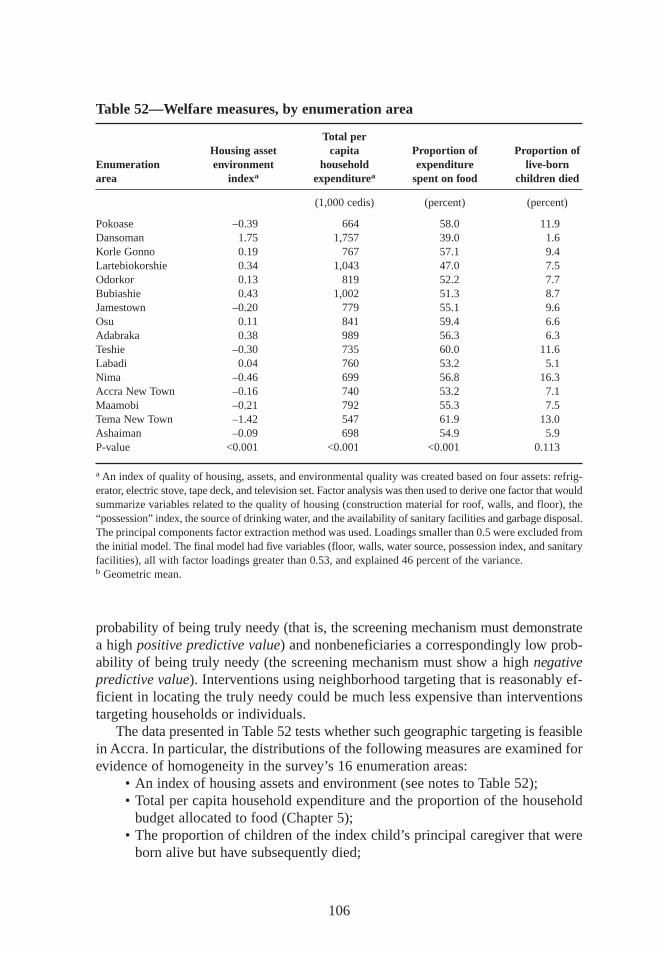
probability of being truly needy (that is, the screening mechanism must demonstratea high positive predictive value) and nonbeneficiaries a correspondingly low prob-ability of being truly needy (the screening mechanism must show a high negativepredictive value). Interventions using neighborhood targeting that is reasonably ef-ficient in locating the truly needy could be much less expensive than interventionstargeting households or individuals.
The data presented in Table 52 tests whether such geographic targeting is feasiblein Accra. In particular, the distributions of the following measures are examined forevidence of homogeneity in the survey’s 16 enumeration areas:
• An index of housing assets and environment (see notes to Table 52);• Total per capita household expenditure and the proportion of the household
budget allocated to food (Chapter 5);• The proportion of children of the index child’s principal caregiver that were
born alive but have subsequently died;
106
Table 52—Welfare measures,by enumeration area
Total perHousing asset capita Proportion of Proportion of
Enumeration envir onment household expenditure live-bornarea indexa expenditurea spent on food childr en died
(1,000 cedis) (percent) (percent)
Pokoase –0.39 664 58.0 11.9Dansoman 1.75 1,757 39.0 1.6Korle Gonno 0.19 767 57.1 9.4Lartebiokorshie 0.34 1,043 47.0 7.5Odorkor 0.13 819 52.2 7.7Bubiashie 0.43 1,002 51.3 8.7Jamestown –0.20 779 55.1 9.6Osu 0.11 841 59.4 6.6Adabraka 0.38 989 56.3 6.3Teshie –0.30 735 60.0 11.6Labadi 0.04 760 53.2 5.1Nima –0.46 699 56.8 16.3Accra New Town –0.16 740 53.2 7.1Maamobi –0.21 792 55.3 7.5Tema New Town –1.42 547 61.9 13.0Ashaiman –0.09 698 54.9 5.9P-value <0.001 <0.001 <0.001 0.113
a An index of quality of housing, assets,and environmental quality was created based on four assets:refrig-erator, electric stove, tape deck, and television set. Factor analysis was then used to derive one factor that wouldsummarize variables related to the quality of housing (construction material for roof, walls, and floor), the“possession”index, the source of drinking water, and the availability of sanitary facilities and garbage disposal.The principal components factor extraction method was used. Loadings smaller than 0.5 were excluded fromthe initial model. The final model had five variables (floor, walls,water source, possession index, and sanitaryfacilities),all with factor loadings greater than 0.53,and explained 46 percent of the variance.b Geometric mean.
maxwell chap08 5/9/0 8:27 PM Page 106
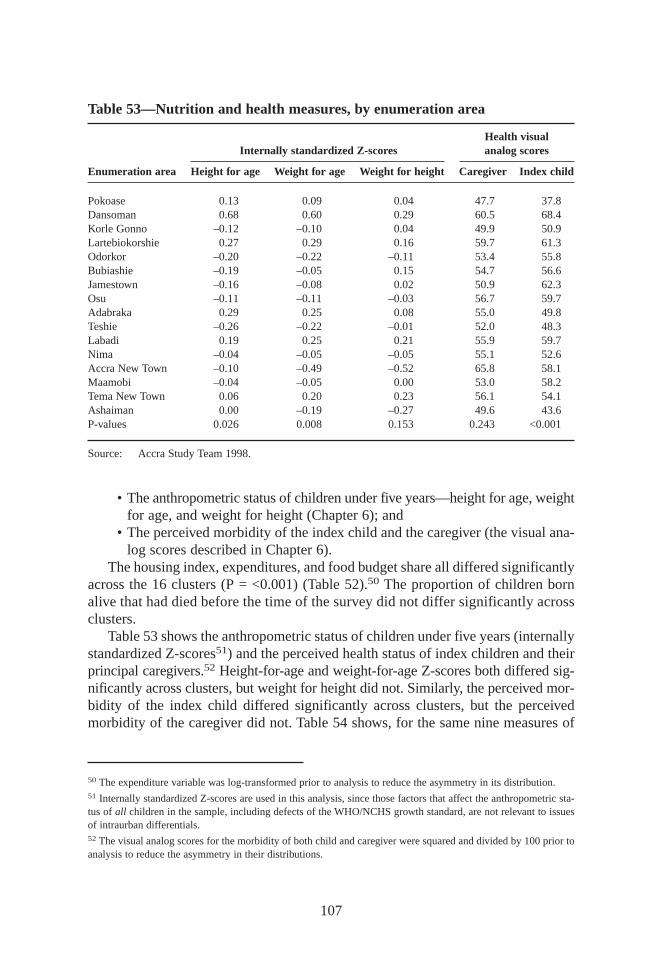
• The anthropometric status of children under five years—height for age, weightfor age, and weight for height (Chapter 6); and
• The perceived morbidity of the index child and the caregiver (the visual ana-log scores described in Chapter 6).
The housing index, expenditures,and food budget share all differed significantlyacross the 16 clusters (P = <0.001) (Table 52).50 The proportion of children bornalive that had died before the time of the survey did not differ significantly acrossclusters.
Table 53 shows the anthropometric status of children under five years (internallystandardized Z-scores51) and the perceived health status of index children and theirprincipal caregivers.52 Height-for-age and weight-for-age Z-scores both differed sig-nificantly across clusters,but weight for height did not. Similarly, the perceived mor-bidity of the index child differed significantly across clusters, but the perceivedmorbidity of the caregiver did not. Table 54 shows, for the same nine measures of
107
Table 53—Nutrition and health measures,by enumeration area
Health visualInter nally standardized Z-scores analog scores
Enumeration area Height for age Weight for age Weight for height Caregiver Index child
Pokoase 0.13 0.09 0.04 47.7 37.8Dansoman 0.68 0.60 0.29 60.5 68.4Korle Gonno –0.12 –0.10 0.04 49.9 50.9Lartebiokorshie 0.27 0.29 0.16 59.7 61.3Odorkor –0.20 –0.22 –0.11 53.4 55.8Bubiashie –0.19 –0.05 0.15 54.7 56.6Jamestown –0.16 –0.08 0.02 50.9 62.3Osu –0.11 –0.11 –0.03 56.7 59.7Adabraka 0.29 0.25 0.08 55.0 49.8Teshie –0.26 –0.22 –0.01 52.0 48.3Labadi 0.19 0.25 0.21 55.9 59.7Nima –0.04 –0.05 –0.05 55.1 52.6Accra New Town –0.10 –0.49 –0.52 65.8 58.1Maamobi –0.04 –0.05 0.00 53.0 58.2Tema New Town 0.06 0.20 0.23 56.1 54.1Ashaiman 0.00 –0.19 –0.27 49.6 43.6P-values 0.026 0.008 0.153 0.243 <0.001
Source: Accra Study Team 1998.
50 The expenditure variable was log-transformed prior to analysis to reduce the asymmetry in its distribution.51 Internally standardized Z-scores are used in this analysis,since those factors that affect the anthropometric sta-tus of all children in the sample, including defects of the WHO/NCHS growth standard, are not relevant to issuesof intraurban differentials.52 The visual analog scores for the morbidity of both child and caregiver were squared and divided by 100 prior toanalysis to reduce the asymmetry in their distributions.
maxwell chap08 5/9/0 8:27 PM Page 107
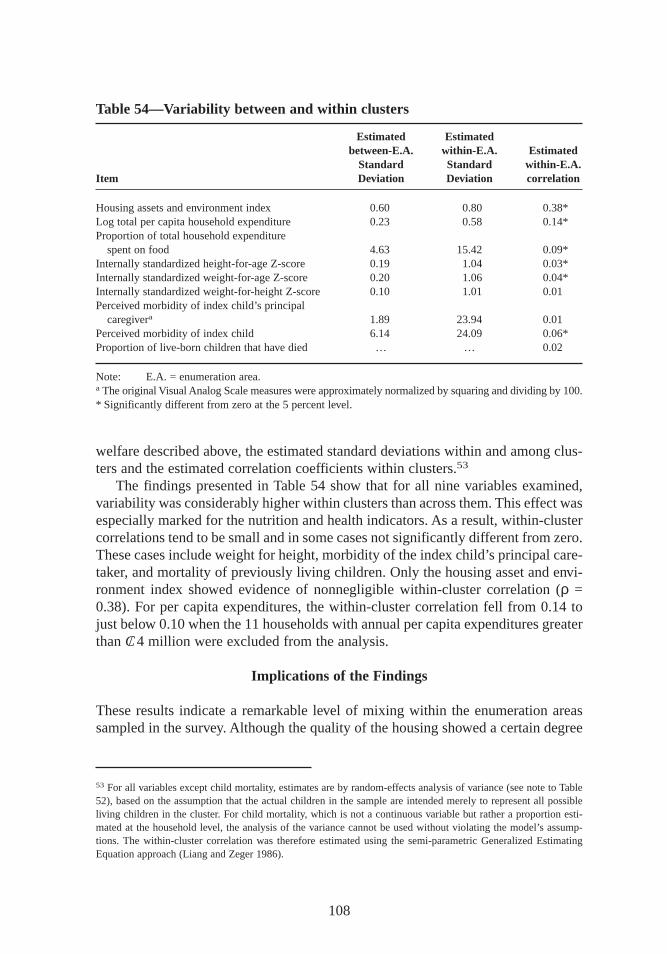
welfare described above, the estimated standard deviations within and among clus-ters and the estimated correlation coefficients within clusters.53
The findings presented in Table 54 show that for all nine variables examined,variability was considerably higher within clusters than across them. This effect wasespecially marked for the nutrition and health indicators. As a result,within-clustercorrelations tend to be small and in some cases not significantly different from zero.These cases include weight for height,morbidity of the index child’s principal care-taker, and mortality of previously living children. Only the housing asset and envi-ronment index showed evidence of nonnegligible within-cluster correlation (ρ =0.38). For per capita expenditures,the within-cluster correlation fell from 0.14 tojust below 0.10 when the 11 households with annual per capita expenditures greaterthan C/ 4 million were excluded from the analysis.
Implications of the Findings
These results indicate a remarkable level of mixing within the enumeration areassampled in the survey. Although the quality of the housing showed a certain degree
108
53 For all variables except child mortality, estimates are by random-effects analysis of variance (see note to Table52), based on the assumption that the actual children in the sample are intended merely to represent all possibleliving children in the cluster. For child mortality, which is not a continuous variable but rather a proportion esti-mated at the household level, the analysis of the variance cannot be used without violating the model’s assump-tions. The within-cluster correlation was therefore estimated using the semi-parametric Generalized EstimatingEquation approach (Liang and Zeger 1986).
Table 54—Variability between and within clusters
Estimated Estimatedbetween-E.A. within-E.A. Estimated
Standard Standard within-E.A.Item Deviation Deviation correlation
Housing assets and environment index 0.60 0.80 0.38*Log total per capita household expenditure 0.23 0.58 0.14*Proportion of total household expenditure
spent on food 4.63 15.42 0.09*Internally standardized height-for-age Z-score 0.19 1.04 0.03*Internally standardized weight-for-age Z-score 0.20 1.06 0.04*Internally standardized weight-for-height Z-score 0.10 1.01 0.01Perceived morbidity of index child’s principal
caregivera 1.89 23.94 0.01Perceived morbidity of index child 6.14 24.09 0.06*Proportion of live-born children that have died … … 0.02
Note: E.A. = enumeration area.a The original Visual Analog Scale measures were approximately normalized by squaring and dividing by 100.* Significantly different from zero at the 5 percent level.
maxwell chap08 5/9/0 8:27 PM Page 108
of uniformity at the cluster level, the families living in these houses had very dif-ferent income levels and health outcomes. For example, all 16 enumeration areas in-cluded at least one household in the highest income quintile, while 14 had at leastone household in the lowest quintile. The levels of homogeneity within clusters arecomparable to those found in previous studies of rural areas,at least for mortalityand general morbidity (Bennett et al. 1991). Deaton (1997) reports that rural areasof developing countries frequently show correlations for consumption in the rangeof 0.3–0.4.
Higher within-cluster correlations of welfare measures were expected in thisrepresentative sample of Accra because of the visible differences in low-income in-digenous,low-income migrant,and modern middle-class neighborhoods. The rela-tively small number of clusters sampled may have resulted in a low (but consistentand unbiased) estimate of the true variances among clusters and thus also the cor-relation coefficients within clusters. However, this underestimation would have tobe very substantial to reverse the conclusion that cluster-level effects are much lesssignificant than individual- and household-level effects for health and nutrition out-comes in Accra.
This finding suggests that virtually all of the variation in income in Accra, aswell as health and nutrition outcomes,is explained by factors that vary at the house-hold and individual levels and not by community-level effects. Therefore, analysisand intervention must focus primarily on households and individuals,although pos-sible interactions between variables at these levels and community-level variablesmust also be evaluated. The mixed nature of Accra’s neighborhoods also has majorimplications for targeting strategies. Large-scale programs aiming to reach the great-est number of people in need while excluding the better-off cannot do so by oper-ating in a few select neighborhoods. Rather, targeting strategies must be developedthat reach the poor or vulnerable wherever they may reside. The Appendix describessome of the alternative targeting indicators that grew out of this study.
109
maxwell chap08 5/9/0 8:27 PM Page 109
CHAPTER 9
Multivariate Determinantsof Food Security, Health, Care,
and Nutritional Status
The previous chapters have used a variety of qualitative and quantitative methodsto determine the main constraints to achieving good child nutrition in Accra.
This chapter complements those analyses with a multivariate regression investiga-tion of the determinants of child nutritional status.
As in previous chapters, the conceptual framework presented in Chapter 1 (Fig-ure 2) guides the multivariate analysis by identifying the multiple and complexpathways through which various factors affect nutritional status. Income followsone such pathway: high income provides household food security and high calorieintake, leading to good nutrition. Numerous studies have explored the link betweenincome and nutritional status (Sahn 1994; see Strauss and Thomas 1995 for a reviewof these).54 Income opens also a second important pathway, improving nutrition byraising the demand for nonfood inputs (goods and services) to health. Maternal ed-ucation follows a similar pathway, increasing women’s caregiving resources andimproving childcare practices. Few studies have looked at care practices as an inputinto nutritional status, however (Haddad et al. 1996; Kumar, Naved, and Bhattarai1997; Ruel et al. 1998). This investigation is unusual in that it does incorporate carepractices into an otherwise standard regression approach.
The analysis uses regression techniques to identify the key constraints to goodchild nutrition in Accra, building on the bivariate analysis of previous chapters. Theunderlying model described in this section examines the pathways suggested by theconceptual model to explore the factors associated with good nutritional outcomes.The inputs of primary interest are household food availability, care, and health. Since
110
54Alderman and Garcia (1993) and Strauss and Thomas (1995) review the debate on the responsiveness of calorieintake to changes in income. Many studies also use measures of illness, including the incidence of diarrhea or thenumber of days ill, as a predictor of nutritional status (Alderman 1990; Cebu Study Team 1992). See Haddad et al.(1996) for a review of other studies.
maxwell chap09 5/9/0 8:26 PM Page 110
each of these is also determined by a number of factors, each will be analyzed in-dividually and in relation to nutritional status.
The Basic Model for the Empir ical Approach
The theoretical model underpinning the econometric approach is the standard uni-tary household model. The data may reject this model because of the diversity ofhousehold types found during the qualitative analysis. However, it was difficult toidentify a particular nonunitary or collective model that would be appropriate forall households. Thus the model controls for the possibility of heterogeneity in in-trahousehold allocation rules by using ethnicity and headship variables.
The model for nutritional status is derived from the household production models.The household maximizes the joint utility function,which comprises the health andnutrition of each household member, goods purchased and produced at home, andleisure (Behrman and Deolalikar 1988; Strauss and Thomas 1995). Since the focusis on the index child’s nutritional status,the utility function is expressed as
U = U(Hi, Ci, Li ),
whereHi is the nutritional status of the index child i (measured by the standardized an-thropometric measurement of height for age),Ci is the consumption of goods,andLi is leisure.
Hi is an outcome of the height production function,
Hi = f (Xi, Xh, Xd, Xc, µ),
whereXi is a set of exogenous child-specific characteristics,Xh is a set of exogenous household-specific characteristics,Xd is a vector of endogenous household-specific inputs,Xc is a set of exogenous community-specific variables,andµ represents unobserved heterogeneity.The input vector Xd represents outcomes of livelihood security that are inputs
into nutritional status. A number of inputs were identified from the conceptual frame-work presented in Chapter 1 (Figure 2). Data limitations prevent the exploration ofall of these, so that the focus is on the three most important factors influencing nu-tritional status:food, care, and health. Each input demand function can be representedas follows:
Xd = g(Y, Z, µ),
where Y is a vector of exogenous household characteristics,and Z is a vector of en-dogenous variables.
111
maxwell chap09 5/9/0 8:26 PM Page 111
Econometric Specification and Issues
The focus on household food availability, care, and child health as proximate de-terminants of child nutrition status poses problems for the regression analysis.These inputs into nutritional status are also outcomes of a variety of factors,one ofwhich is income. An ordinary least squares (OLS) estimation of a regression withnutrition as an outcome and these three proximate variables as determinants couldbe biased for two reasons. First, there may be unobserved variables that are rele-gated to the error term but are correlated with the variables included on the rightside. Second, explanatory variables may exist that are endogenous to or codeterminedwith the outcome variable and hence are correlated with the error term.
The typical approach to dealing with the first problem is a fixed-effects estima-tion at the community, household, or individual level. Since the data are cross-sectional,only community fixed effects can be used. The second approach to ad-dressing these problems is to use instrumental variables (IV). The credibility of theIV approach rests on the ability to find variables that are correlated with the sus-pected endogenous explanatory variables but that do not affect the outcome variable(other than through the explanatory variable being instrumented). This approachrequires finding a variable that can affect household food consumption but notmalnutrition. The task is difficult and challenging, especially when there are threeexplanatory variables to instrument. Few other researchers have faced this challenge(Haddad et al. 1996).
The multivariate analysis estimates a system of four equations explaining1. household calorie availability,2. health of the index child,3. care behaviors and practices used by the primary caregiver of the index
child, and4. standardized height for age of the index child.
These equations are estimated using IV, employing the appropriate tests to deter-mine the credibility of the approach. In general, OLS estimates will be inconsistentin the presence of an endogenous variable on the right side. IV estimates are con-sistent but less efficient. However, they can be biased if the selected instruments areunable to explain the variance in the predicted endogenous variables on the right(Bound, Jaeger, and Baker 1995).
Three tests were used to evaluate the IVs:the relevance of the instruments (Bound,Jaeger, and Baker 1995),overidentification tests,and the Durbin-Hausman-Wu test.The relevance test determines whether the instruments selected can explain the vari-ation in the endogenous variable that is about to be instrumented. The test is an F-test on the joint significance of the instruments in each of the equations that predictincome, household food availability, care, and health. The bias in the IV estimatesin the nutrition equation will be approximated by (1/F)* (the bias from the OLS es-timation). Hence, if F is 1, then these estimates are as biased as the OLS estimates.
The overidentification test determines whether the selected instruments belongin the second-stage equation itself. The test involves regressing the IV residuals from
112
maxwell chap09 5/9/0 8:26 PM Page 112
the nutrition equation on the left side and the instruments on the right side. The nullhypothesis being tested posits that the instruments are uncorrelated with the errorterm from the nutrition equation and that the model is correctly specified. The teststatistic is distributed as chi-squared, with the degrees of freedom equal to the num-ber of instruments minus the number of endogenous variables on the right side.
The Durban-Hausman-Wu test determines whether the OLS and IV estimatesdiffer significantly. To test for endogeneity, the actual and predicted values of foodavailability, care, and health,as well as income, are included in the second-stageequation for nutritional status. A joint test of significance is applied for the coeffi-cients of the predicted variables. A rejection of the null hypothesis indicates that theIV estimates are significantly different from the OLS estimates.
Both OLS and IV results are presented so as to provide a range of estimates. Forcomparative purposes,each equation presents estimates from the structural and re-duced forms. OLS is used to estimate the structural equations for food availability,health of the index child, care resources and practices,and nutritional status. Thereis no correction for any possible endogeneity of income in the first three equationsor for income, calories,health,or care in the fourth equation. The IV method is usedto estimate the structural equations using the predicted values of income, calories,health,and care that have been instrumented as a function of exogenous variablesand a set of instruments to identify income, calories,care, and health.55
Finally, the estimates of the reduced-form equations for income, food availability,health of the index child, care resources and behaviors,and nutritional status are pre-sented. These equations are functions of only the exogenous variables in each respec-tive equation. To explore whether income has a direct effect on nutritional status (be-yond its indirect effect through food availability, care, and health),nutritional status isestimated with and without income for both the OLS and IV estimation methods.
Determinants of Household Food Availability
Two different measures capture the quantity and quality of household food availabil-ity as the dependent variable. The first is total calories per adult equivalent unit (aeu)per day. The second measure, the price per 1,000 calories per aeu each day (kcal/aeu/day), captures the quality and economies of scale associated with household foodavailability. Household food availability is a function of food prices,expenditures,household demographics,and household tastes and preferences. Food price data werecollected using market surveys at the community level,but a single-round survey overan eight-week period showed little temporal variation across markets in Accra. To ac-count for any spatial variation, mean cluster prices for 16 enumeration areas are in-cluded for maize, cassava,yam,plantain,rice, wheat, tomato, and fish.
113
55 Total per capita expenditure is used as a proxy for income. Household consumption expenditures are considereda more reliable indicator of permanent income than income itself, because they are less variable. Household ex-penditure data were easier to collect and tended to exhibit fewer measurement errors than income data.
maxwell chap09 5/9/0 8:26 PM Page 113
Household composition is captured through linear indicators of the number ofpeople in specified age and sex groups. To capture tastes and preferences related tobasic household structure and differences in allocation priorities,the analysis includesa dummy variable for the sex of the head of the household—1 if the head is female,0 if the head is male. The mother’s age, education, and migration status are alsoincluded, since they may influence expenditure patterns and dietary preferences.The two dummy variables for population density at the community level are ex-pected to capture any community-level effects that may influence household foodavailability. Each variable is equal to 1 if the community is classified as low densityand 0 if it is high density (the reference variable is communities with medium den-sity). The equations for food availability are
log of calories per aeuor = g (predicted expenditures per log of
price per 1,000 kcal/aeu/day aeu; household structure; sex ofhousehold head; mother’s age,education, and migration status;prices for maize, cassava, yam,plantain,rice, wheat, tomato, andfish; and community density).
The instruments for per capita expenditures are the age, education, and educa-tion squared of the head of the household; assets and assets squared; and homeownership. The age of the household head and assets are positive and significantlyrelated to per capita expenditures. The OLS equation for predicting per capita ex-penditures is presented in Table 55.56 The test results for the set of instruments usedto predict per capita expenditures for food availability, health,and care are pre-sented in each respective table. The instruments pass the relevance test and predictper capita expenditures well. The overidentification test in the food availabilityequation rejects the null hypothesis that the per capita expenditure instruments areuncorrelated with the error term and that the model is correctly specified. Similarly,the overidentification test rejects the null hypothesis for both the health equationand the care equation. For the Durbin-Hausman-Wu test,the OLS and IV estimatesfor household calorie availability are significantly different. For health and care,they are not.
The results of the calorie regressions using the log of household calories per aeuare presented in Table 56. As expected, per capita expenditure is positive and sig-nificantly related to household calorie availability. Increases in per capita income,
114
56 Since 2SLS was used to estimate all equations,the log of per capita expenditure is predicted as a function ofexogenous variables and instruments from the first stage (Table 55) and all the exogenous variables in the secondstage (Table 57). Per capita expenditures were predicted in this same way for the equations for health,care, and nu-tritional status.
maxwell chap09 5/9/0 8:26 PM Page 114
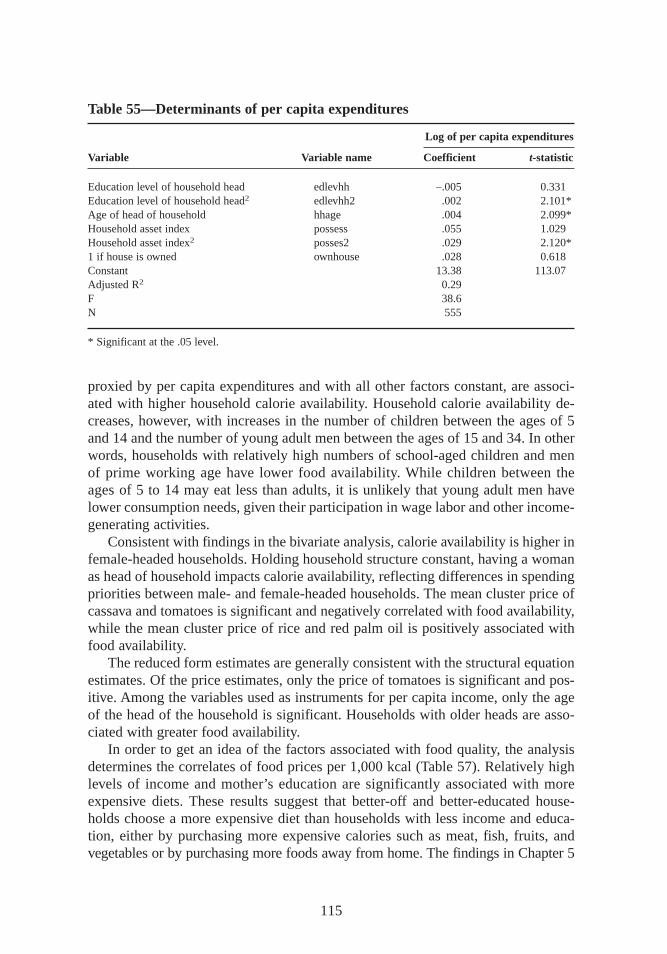
proxied by per capita expenditures and with all other factors constant,are associ-ated with higher household calorie availability. Household calorie availability de-creases,however, with increases in the number of children between the ages of 5and 14 and the number of young adult men between the ages of 15 and 34. In otherwords,households with relatively high numbers of school-aged children and menof prime working age have lower food availability. While children between theages of 5 to 14 may eat less than adults,it is unlikely that young adult men havelower consumption needs,given their participation in wage labor and other income-generating activities.
Consistent with findings in the bivariate analysis,calorie availability is higher infemale-headed households. Holding household structure constant,having a womanas head of household impacts calorie availability, reflecting differences in spendingpriorities between male- and female-headed households. The mean cluster price ofcassava and tomatoes is significant and negatively correlated with food availability,while the mean cluster price of rice and red palm oil is positively associated withfood availability.
The reduced form estimates are generally consistent with the structural equationestimates. Of the price estimates,only the price of tomatoes is significant and pos-itive. Among the variables used as instruments for per capita income, only the ageof the head of the household is significant. Households with older heads are asso-ciated with greater food availability.
In order to get an idea of the factors associated with food quality, the analysisdetermines the correlates of food prices per 1,000 kcal (Table 57). Relatively highlevels of income and mother’s education are significantly associated with moreexpensive diets. These results suggest that better-off and better-educated house-holds choose a more expensive diet than households with less income and educa-tion, either by purchasing more expensive calories such as meat, fish, fruits, andvegetables or by purchasing more foods away from home. The findings in Chapter 5
115
Table 55—Determinants of per capita expenditures
Log of per capita expenditures
Variable Variable name Coefficient t-statistic
Education level of household head edlevhh –.005 0.331Education level of household head2 edlevhh2 .002 2.101*Age of head of household hhage .004 2.099*Household asset index possess .055 1.029Household asset index2 posses2 .029 2.120*1 if house is owned ownhouse .028 0.618Constant 13.38 113.07Adjusted R2 0.29F 38.6N 555
* Significant at the .05 level.
maxwell chap09 5/9/0 8:26 PM Page 115
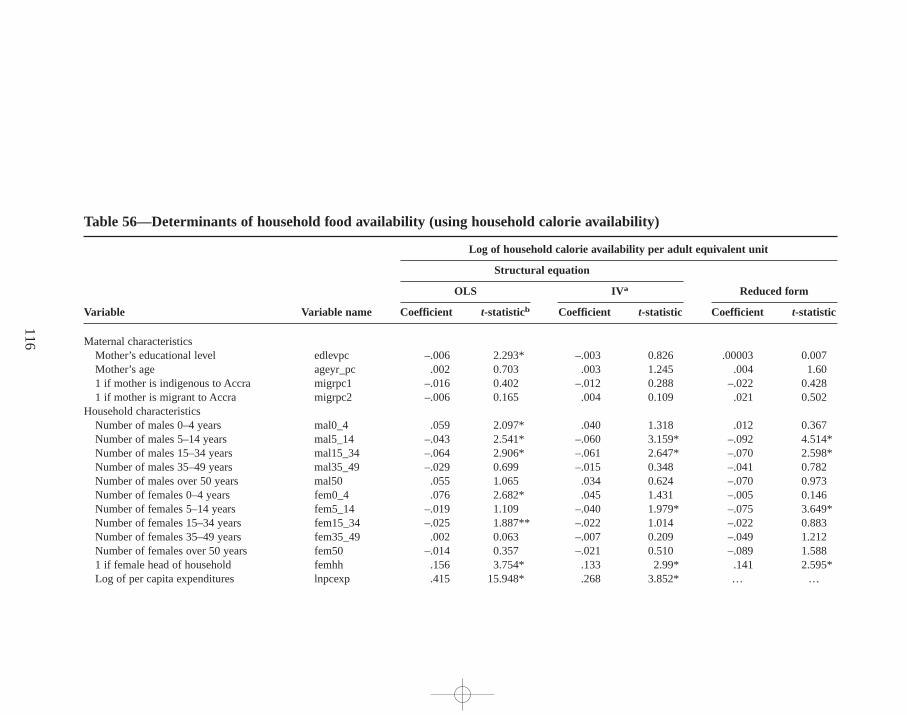
116
Table 56—Determinants of household food availability (using household calorie availability)
Log of household calorie availability per adult equivalent unit
Structural equation
Reduced formOLS IV a
Variable Variable name Coefficient t-statisticb Coefficient t-statistic Coefficient t-statistic
Maternal characteristics Mother’s educational level edlevpc –.006 2.293* –.003 0.826 .00003 0.007Mother’s age ageyr_pc .002 0.703 .003 1.245 .004 1.601 if mother is indigenous to Accra migrpc1 –.016 0.402 –.012 0.288 –.022 0.4281 if mother is migrant to Accra migrpc2 –.006 0.165 .004 0.109 .021 0.502
Household characteristicsNumber of males 0–4 years mal0_4 .059 2.097* .040 1.318 .012 0.367Number of males 5–14 years mal5_14 –.043 2.541* –.060 3.159* –.092 4.514*Number of males 15–34 years mal15_34 –.064 2.906* –.061 2.647* –.070 2.598*Number of males 35–49 years mal35_49 –.029 0.699 –.015 0.348 –.041 0.782Number of males over 50 years mal50 .055 1.065 .034 0.624 –.070 0.973Number of females 0–4 years fem0_4 .076 2.682* .045 1.431 –.005 0.146Number of females 5–14 years fem5_14 –.019 1.109 –.040 1.979* –.075 3.649*Number of females 15–34 years fem15_34 –.025 1.887** –.022 1.014 –.022 0.883Number of females 35–49 years fem35_49 .002 0.063 –.007 0.209 –.049 1.212Number of females over 50 years fem50 –.014 0.357 –.021 0.510 –.089 1.5881 if female head of household femhh .156 3.754* .133 2.99* .141 2.595*Log of per capita expenditures lnpcexp .415 15.948* .268 3.852* … …
maxw
ell ch
ap09 5
/9/0
8:2
6 P
M P
age 1
16
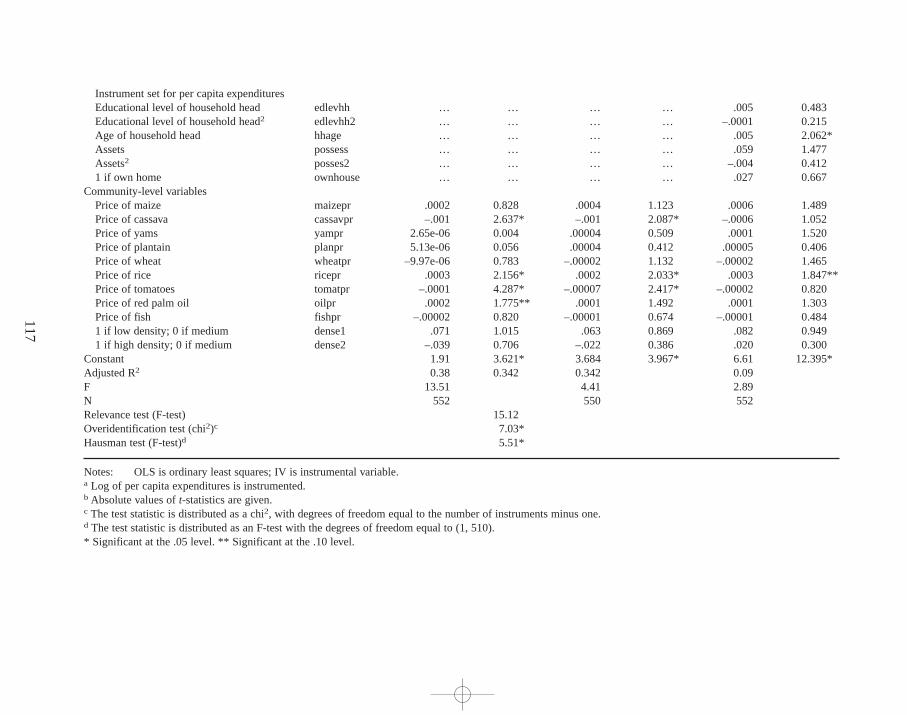
117
Instrument set for per capita expendituresEducational level of household head edlevhh … … … … .005 0.483Educational level of household head2 edlevhh2 … … … … –.0001 0.215Age of household head hhage … … … … .005 2.062*Assets possess … … … … .059 1.477Assets2 posses2 … … … … –.004 0.4121 if own home ownhouse … … … … .027 0.667
Community-level variablesPrice of maize maizepr .0002 0.828 .0004 1.123 .0006 1.489Price of cassava cassavpr –.001 2.637* –.001 2.087* –.0006 1.052Price of yams yampr 2.65e-06 0.004 .00004 0.509 .0001 1.520Price of plantain planpr 5.13e-06 0.056 .00004 0.412 .00005 0.406Price of wheat wheatpr –9.97e-06 0.783 –.00002 1.132 –.00002 1.465Price of rice ricepr .0003 2.156* .0002 2.033* .0003 1.847**Price of tomatoes tomatpr –.0001 4.287* –.00007 2.417* –.00002 0.820Price of red palm oil oilpr .0002 1.775** .0001 1.492 .0001 1.303Price of fish fishpr –.00002 0.820 –.00001 0.674 –.00001 0.4841 if low density; 0 if medium dense1 .071 1.015 .063 0.869 .082 0.9491 if high density; 0 if medium dense2 –.039 0.706 –.022 0.386 .020 0.300
Constant 1.91 3.621* 3.684 3.967* 6.61 12.395*Adjusted R2 0.38 0.342 0.342 0.09F 13.51 4.41 2.89N 552 550 552Relevance test (F-test) 15.12Overidentification test (chi2)c 7.03*Hausman test (F-test)d 5.51*
Notes: OLS is ordinary least squares; IV is instrumental variable.a Log of per capita expenditures is instrumented.b Absolute values of t-statistics are given.c The test statistic is distributed as a chi2, with degrees of freedom equal to the number of instruments minus one. d The test statistic is distributed as an F-test with the degrees of freedom equal to (1,510).* Significant at the .05 level. ** Significant at the .10 level.
maxw
ell ch
ap09 5
/9/0
8:2
6 P
M P
age 1
17
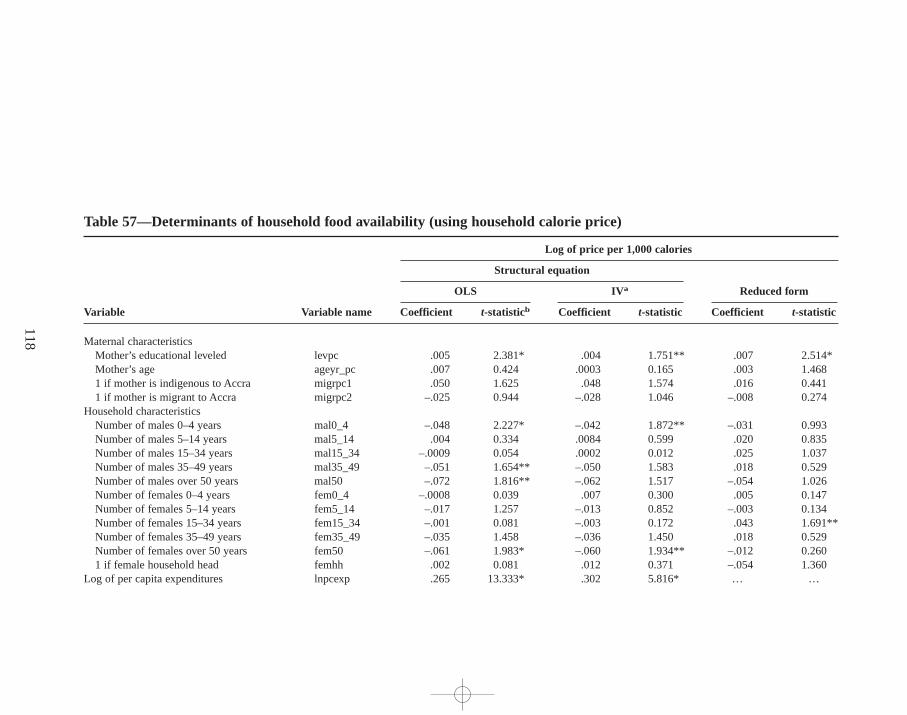
118
Table 57—Determinants of household food availability (using household calorie price)
Log of price per 1,000 calories
Structural equation
Reduced formOLS IV a
Variable Variable name Coefficient t-statisticb Coefficient t-statistic Coefficient t-statistic
Maternal characteristicsMother’s educational leveled levpc .005 2.381* .004 1.751** .007 2.514*Mother’s age ageyr_pc .007 0.424 .0003 0.165 .003 1.4681 if mother is indigenous to Accra migrpc1 .050 1.625 .048 1.574 .016 0.4411 if mother is migrant to Accra migrpc2 –.025 0.944 –.028 1.046 –.008 0.274
Household characteristicsNumber of males 0–4 years mal0_4 –.048 2.227* –.042 1.872** –.031 0.993Number of males 5–14 years mal5_14 .004 0.334 .0084 0.599 .020 0.835Number of males 15–34 years mal15_34 –.0009 0.054 .0002 0.012 .025 1.037Number of males 35–49 years mal35_49 –.051 1.654** –.050 1.583 .018 0.529Number of males over 50 years mal50 –.072 1.816** –.062 1.517 –.054 1.026Number of females 0–4 years fem0_4 –.0008 0.039 .007 0.300 .005 0.147Number of females 5–14 years fem5_14 –.017 1.257 –.013 0.852 –.003 0.134Number of females 15–34 years fem15_34 –.001 0.081 –.003 0.172 .043 1.691**Number of females 35–49 years fem35_49 –.035 1.458 –.036 1.450 .018 0.529Number of females over 50 years fem50 –.061 1.983* –.060 1.934** –.012 0.2601 if female household head femhh .002 0.081 .012 0.371 –.054 1.360
Log of per capita expenditures lnpcexp .265 13.333* .302 5.816* … …
maxw
ell ch
ap09 5
/9/0
8:2
6 P
M P
age 1
18
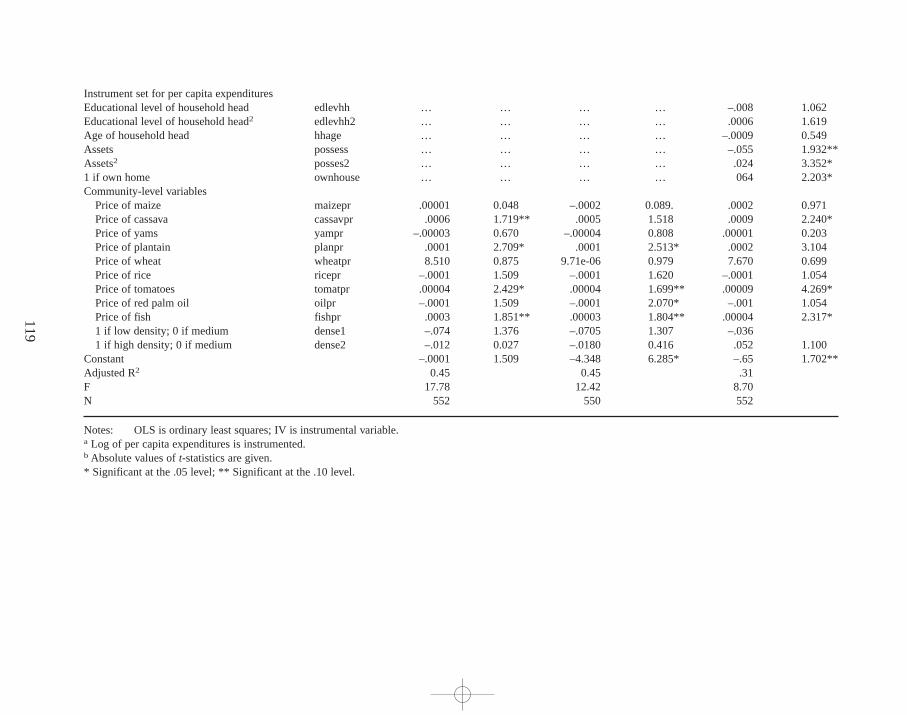
119
Instrument set for per capita expendituresEducational level of household head edlevhh … … … … –.008 1.062Educational level of household head2 edlevhh2 … … … … .0006 1.619Age of household head hhage … … … … –.0009 0.549Assets possess … … … … –.055 1.932**Assets2 posses2 … … … … .024 3.352*1 if own home ownhouse … … … … 064 2.203*Community-level variables
Price of maize maizepr .00001 0.048 –.0002 0.089. .0002 0.971Price of cassava cassavpr .0006 1.719** .0005 1.518 .0009 2.240*Price of yams yampr –.00003 0.670 –.00004 0.808 .00001 0.203Price of plantain planpr .0001 2.709* .0001 2.513* .0002 3.104Price of wheat wheatpr 8.510 0.875 9.71e-06 0.979 7.670 0.699Price of rice ricepr –.0001 1.509 –.0001 1.620 –.0001 1.054Price of tomatoes tomatpr .00004 2.429* .00004 1.699** .00009 4.269*Price of red palm oil oilpr –.0001 1.509 –.0001 2.070* –.001 1.054Price of fish fishpr .0003 1.851** .00003 1.804** .00004 2.317*1 if low density; 0 if medium dense1 –.074 1.376 –.0705 1.307 –.0361 if high density; 0 if medium dense2 –.012 0.027 –.0180 0.416 .052 1.100
Constant –.0001 1.509 –4.348 6.285* –.65 1.702**Adjusted R2 0.45 0.45 .31F 17.78 12.42 8.70N 552 550 552
Notes: OLS is ordinary least squares; IV is instrumental variable.a Log of per capita expenditures is instrumented.b Absolute values of t-statistics are given.* Significant at the .05 level; ** Significant at the .10 level.
maxw
ell ch
ap09 5
/9/0
8:2
6 P
M P
age 1
19
suggest that wealthier households do in fact select better-quality foods than low-income households. Although low-income households consume a larger percentageof more expensive street foods and meals purchased away from home, their calorielevels are lower. The mean price per 1,000 calories (regardless of the source) is alsosignificantly lower for poor households.57
Determinants of Child Health
Child health status is measured using a visual analog scale (described in Chapter 6).Child health is a function of the environment (healthy or unhealthy) and of suscep-tibility and exposure to illness. Individual characteristics,such as age and sex, cap-ture susceptibility to illness. Breast-feeding practices also capture susceptibility toillness,since children who are breast-fed exclusively for the first 4 to 6 months oftheir lives are exposed to fewer potentially pathogenic foods or liquids that cancause diarrhea. Exposure to pathogens can be captured as well by variables that af-fect children’s immediate environment,such as contact with other children,the levelof crowding in the household, the water source, sanitary conditions,and exposureto feces and to severe food contamination.
Other underlying determinants include maternal characteristics,household struc-ture, and assets,measured by predicted expenditure (described in the previous sectionand in Table 56). Community-level variables are used to control for environmentalsanitation, infrastructure, and the availability of health care. Because many of the vari-ables are inputs into child health and reflect recent choices made by the household onuse, they are endogenous to child health outcomes. These variables are not includedin this version of the model.58 The estimating structural equation for health is
Health visual analog scale squared/100 = h (child’s age, age squared, and sex;mother’s age, education, educationsquared; sex of household head;predicted income; crowding; numberof community toilets,hospitals,andclinics; and community density).
120
57 The log of household size was included in an alternative specification in the food availability equation when thelog of price per calories was the dependent variable. Households with larger families are associated with cheaperdiets,suggesting that economies of scale result from purchasing food in these households.58Another version of the model was estimated including endogenous variables such as the water source used in thehome, the type of toilet in the home, the presence of chicken feces in the compound, ownership of a refrigerator,the interaction between current breast-feeding and age group,and the interaction between measles immunizationand age group. With a few exceptions,most of these variables are not significant. The interaction terms betweenbreast-feeding and age are not significant for all age groups. However, the coefficients are positive for children whobreast-fed between the ages of 0 and 12 months and negative for children who breast-fed from 13 to 17 months.Children who breast-fed in the older age group (over 18 months) have significantly poorer health outcomes. Chil-dren over the age of 9 months who have been immunized against measles have significantly higher health outcomesthan children in that age group who have not been immunized.
maxwell chap09 5/9/0 8:26 PM Page 120
Unfortunately, the results of the health equation, presented in Table 58,reveallittle about the determinants of child health. Only a few coefficients are significant,indicating the difficulty of coming up with a set of regressors to explain child healthstatus. Behrman and Deolalikar (1988) have noted the difficulty of finding strongassociations,given the complex relationships between health outcomes and inputs.In the IV estimation,per capita expenditure is positively associated with better childhealth,and the result is significant. The age of the child and the age squared are sig-nificant and indicate that health improves as a child gets older.
Because of the poor results obtained using the visual analog health scale as thedependent variable, the same equation was estimated using probit on self-reported di-arrhea in the past two weeks as an alternative dependent variable to capture child mor-bidity. The probit results are briefly discussed but not presented, because the estimatesare not an improvement over those in Table 58. There is a negative and significantassociation between income and the child having had diarrhea once in the past twoweeks. Age and age squared showed that older children are significantly more likelyto get diarrhea. Children living in a compound household or in a community with oneor more government hospitals had a higher probability of being sick with diarrhea.
The coefficients from the reduced form for child’s health show a significant u-shaped relationship between maternal education and child health outcomes(Table 58, columns 5 and 6). Child health begins to improve only with a certainlevel of maternal education. The association between mothers’ education and childhealth is positive when the mother has approximately eight years of schooling (middleschool or junior high). In addition,a number of the demographic age and sex groupsare significant, indicating a negative association between households with morechildren between the ages of 0 and 4 years and the health of the index child.
Lastly (and as the structural equation estimates also found),the health of theindex child is significantly and negatively associated with the number of govern-ment hospitals in the community. The two communities in this sample that areclosest to government hospitals have some of the poorest children’s health out-comes in the sample. However, the economic status of the majority of householdsin the community, not the physical proximity to hospitals,explains the poor healthstatus of children in these areas.
Determinants of Care
This model treats care somewhat differently than previous models. Previous studieshave shown that maternal education is an important determinant of nutritional sta-tus (Behrman and Wolfe 1984). Typically, the pathway by which educational statusaffects nutritional status is not apparent in reduced form equations. The root ofthe difficulty lies in determining whether education improves nutrition through theeffects of increased productivity (and thus earnings) or through improved caringpractices (Sahn 1994). Some studies have tried to look at the impact of educationon nutrition independent of increased productivity and earnings,but few studies tryto include measures of care behaviors and practices (Strauss and Thomas 1995).
121
maxwell chap09 5/9/0 8:26 PM Page 121
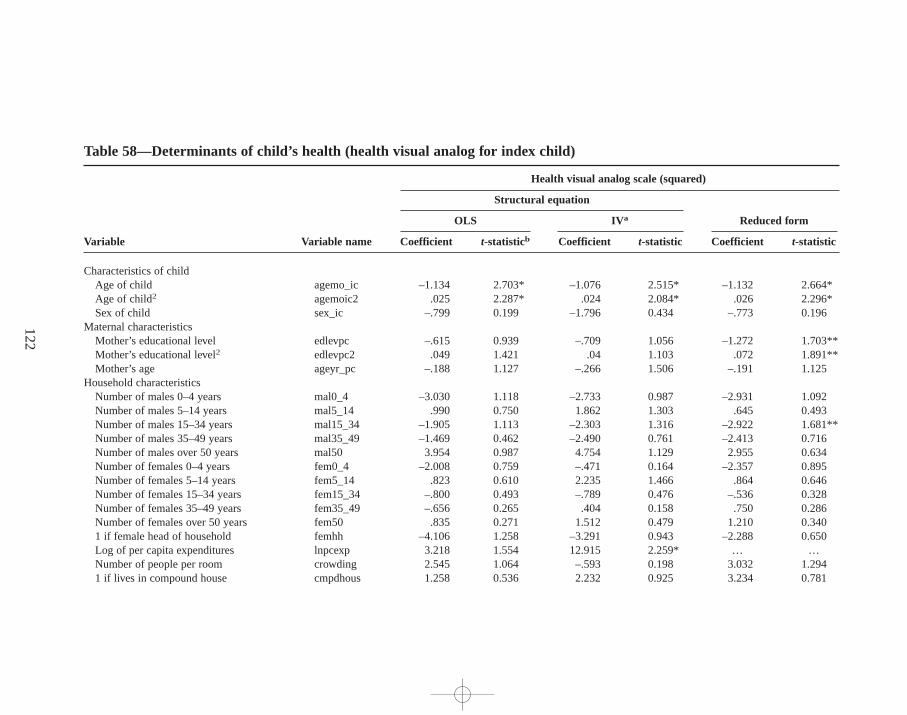
122
Table 58—Determinants of child’ s health (health visual analog for index child)
Health visual analog scale (squared)
Structural equation
Reduced formOLS IV a
Variable Variable name Coefficient t-statisticb Coefficient t-statistic Coefficient t-statistic
Characteristics of childAge of child agemo_ic –1.134 2.703* –1.076 2.515* –1.132 2.664*Age of child2 agemoic2 .025 2.287* .024 2.084* .026 2.296*Sex of child sex_ic –.799 0.199 –1.796 0.434 –.773 0.196
Maternal characteristicsMother’s educational level edlevpc –.615 0.939 –.709 1.056 –1.272 1.703**Mother’s educational level2 edlevpc2 .049 1.421 .04 1.103 .072 1.891**Mother’s age ageyr_pc –.188 1.127 –.266 1.506 –.191 1.125
Household characteristicsNumber of males 0–4 years mal0_4 –3.030 1.118 –2.733 0.987 –2.931 1.092Number of males 5–14 years mal5_14 .990 0.750 1.862 1.303 .645 0.493Number of males 15–34 years mal15_34 –1.905 1.113 –2.303 1.316 –2.922 1.681**Number of males 35–49 years mal35_49 –1.469 0.462 –2.490 0.761 –2.413 0.716Number of males over 50 years mal50 3.954 0.987 4.754 1.129 2.955 0.634Number of females 0–4 years fem0_4 –2.008 0.759 –.471 0.164 –2.357 0.895Number of females 5–14 years fem5_14 .823 0.610 2.235 1.466 .864 0.646Number of females 15–34 years fem15_34 –.800 0.493 –.789 0.476 –.536 0.328Number of females 35–49 years fem35_49 –.656 0.265 .404 0.158 .750 0.286Number of females over 50 years fem50 .835 0.271 1.512 0.479 1.210 0.3401 if female head of household femhh –4.106 1.258 –3.291 0.943 –2.288 0.650Log of per capita expenditures lnpcexp 3.218 1.554 12.915 2.259* … …Number of people per room crowding 2.545 1.064 –.593 0.198 3.032 1.2941 if lives in compound house cmpdhous 1.258 0.536 2.232 0.925 3.234 0.781
maxw
ell ch
ap09 5
/9/0
8:2
6 P
M P
age 1
22
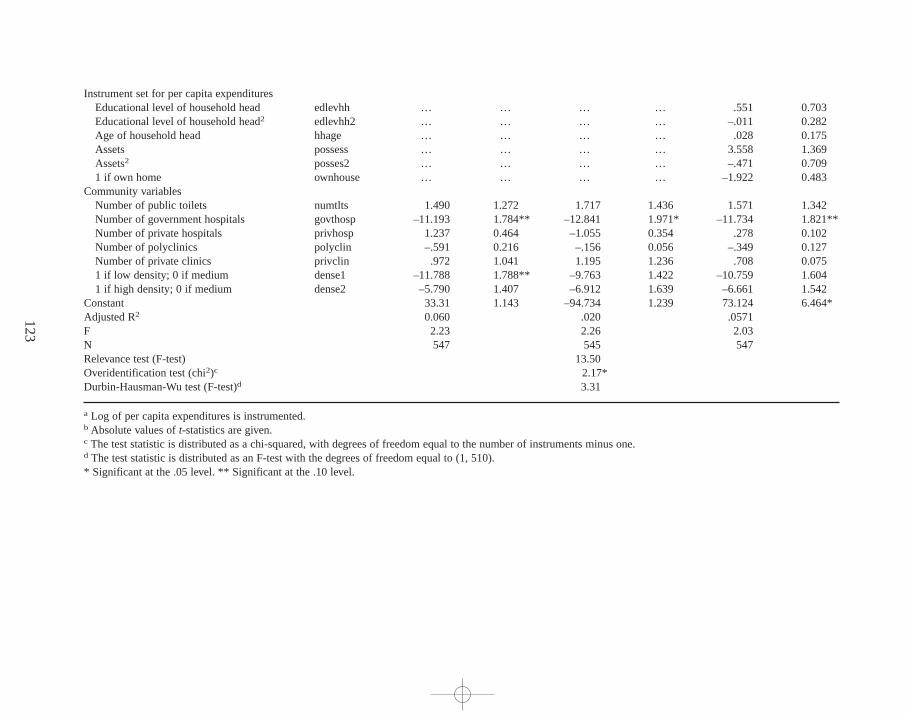
123
Instrument set for per capita expendituresEducational level of household head edlevhh … … … … .551 0.703Educational level of household head2 edlevhh2 … … … … –.011 0.282Age of household head hhage … … … … .028 0.175Assets possess … … … … 3.558 1.369Assets2 posses2 … … … … –.471 0.7091 if own home ownhouse … … … … –1.922 0.483
Community variablesNumber of public toilets numtlts 1.490 1.272 1.717 1.436 1.571 1.342Number of government hospitals govthosp –11.193 1.784** –12.841 1.971* –11.734 1.821**Number of private hospitals privhosp 1.237 0.464 –1.055 0.354 .278 0.102Number of polyclinics polyclin –.591 0.216 –.156 0.056 –.349 0.127Number of private clinics privclin .972 1.041 1.195 1.236 .708 0.0751 if low density; 0 if medium dense1 –11.788 1.788** –9.763 1.422 –10.759 1.6041 if high density; 0 if medium dense2 –5.790 1.407 –6.912 1.639 –6.661 1.542
Constant 33.31 1.143 –94.734 1.239 73.124 6.464*Adjusted R2 0.060 .020 .0571F 2.23 2.26 2.03N 547 545 547Relevance test (F-test) 13.50Overidentification test (chi2)c 2.17*Durbin-Hausman-Wu test (F-test)d 3.31
a Log of per capita expenditures is instrumented.b Absolute values of t-statistics are given.c The test statistic is distributed as a chi-squared, with degrees of freedom equal to the number of instruments minus one. d The test statistic is distributed as an F-test with the degrees of freedom equal to (1,510).* Significant at the .05 level. ** Significant at the .10 level.
maxw
ell ch
ap09 5
/9/0
8:2
6 P
M P
age 1
23
Care resources include human resources,as measured by maternal characteris-tics; economic resources at the household level; and organizational resources at boththe household and community levels (Chapter 7). Variables for maternal health,ma-ternal age and education level, mother’s ethnicity, household structure, predictedexpenditure, and type of house capture the presence or absence of these resources.Mother’s ethnicity is included as a proxy for cultural differences in maternal caringpractices.59 The dependent variable is the care index, standardized by the age ofthe child. The care index includes behaviors related to feeding practices and health-seeking practices (Chapter 7). The estimating equation for care is
Care index = c (child’s age, age squared, and sex; mother’s age,education, ethnicity; sex of the head of the household; predicted income; living space, such as a single room;number of community toilets; community density).
The age of the child is an important determinant of the type of care he or she re-ceives. Among children under the age of three, the care index is lower for olderchildren,indicating that caring behaviors and practices for preschoolers are subop-timal (Table 59).60 The care resource that has a positive and significant impact oncaring practices and behaviors is mother’s education. There is no significant asso-ciation between income and care, although the coefficient is positive. This result isconsistent with the findings from Chapter 7 (Table 48), which identify lack ofmaternal schooling as the main constraint to child feeding practices. Breast-feedingpractices were suboptimal across all households,however, regardless of socio-economic status.
Type of housing is associated with care practices and behaviors. Care practices arenegatively associated with households living in a single room compared with house-holds in other types of living arrangements. Communities that have more public toi-lets are associated with better care practices and behaviors,although this outcome issignificant only at the p < 0.1 levels. The reduced form estimates are in general agree-ment with the findings from the structural equations. Among the demographic vari-ables,the estimates show that households with more males are associated with highercare indexes. In particular, the coefficients for males between the ages of 0 to 4 years,15 to 34 years,and 35 to 49 years are positive and significant.
124
59 Many of the variables that make up the care index also belong in the health equation. However, because of theproblem of endogeneity of the care index in the health equation, variables reflecting care practices and resourcesare restricted to a select few, reflecting feeding practices,immunization, and hygiene.60 The care index used in the regression estimates differs slightly from the one described in Chapter 7,which is forchildren between the ages of 4 to 36 months. In order to keep as many index children in the sample as possible, theestimates use the care index for all children, including infants under the age of 4 months. Thus,the care indexfor children between 0 and 3.9 months is composed of two variables related to breast-feeding practices:whetherthe mother gave the child any food or liquid before initiating breast-feeding, and whether the mother is still breast-feeding the child.
maxwell chap09 5/9/0 8:26 PM Page 124
Determinants of Nutritional Status
The primary relationship of interest here is the association between nutritional sta-tus and food availability, health,and care. Nutritional status is measured by the stan-dardized height-for-age Z-scores. The effort to model the independent impact ofthe proximate determinants of child nutritional status amounts to an estimation of astructural equation for child nutrition. The estimating equation includes controls forthe individual characteristics of the index child and the characteristics of both theprimary caretaker and the household. A dummy variable captures the sex of the headof the household. The equation for nutritional status is
Height for age = f (child’s age, age squared, sex, and health; mother’seducation, age, and height; log of household size; sex ofhousehold head; log of food availability; and care index).
Table 60 presents the coefficients for height-for-age Z-scores using IVs to con-trol for the endogenous relationships among food availability, child health,and care(with and without income) and OLS (also with and without income). Table 61 pres-ents the reduced form estimates,which provide a sense of the robustness of the pa-rameter estimates on some exogenous variables. OLS estimates of height for age in-dicate that factors on the individual, maternal, and household levels are importantdeterminants of nutritional status. Child nutritional status has a u-shaped relation-ship with the child’s age, consistent with the descriptive statistics presented inChapter 6. The sex of the child is not significantly related to nutritional status, in-dicating that there is no bias toward either male or female children. A mother’seducation and height are positive and significantly related to her child’s height forage. The positive correlation between mother’s height and child nutritional statusis expected and has been noted in previous studies of malnutrition in Ghana (Al-derman 1990) and elsewhere (Kennedy and Cogill 1987; Cebu Study Team 1992;Haughton and Haughton 1997). Food availability is positive but not significant,whilecare and health are positively and significantly associated with better nutritionalstatus. When income is included, the coefficient on calorie availability becomesnegative, but it remains insignificant. Income is positively associated with nutritionalstatus, indicating that income might have other pathways to improved nutritionalstatus outside of its effect on food, care, and health. Mother’s education is not sig-nificant when controlling for income.
The IV estimation for height-for-age Z-scores includes predicted values forcalories,care, and health. In stage one, calories,care, and health were regressed onall exogenous variables for the given input,all exogenous variables from the equa-tion,and a set of instruments unique to each input. In the second stage, the predictedvalues for calories,health and care, and income were included in the regression.Table 62 lists the variables in the basic equation for estimating the nutritional statusof the index child, along with the instrumenting equations for the other endoge-nous variables.Table 63 summarizes the relevance test,overidentification test,and
125
maxwell chap09 5/9/0 8:26 PM Page 125
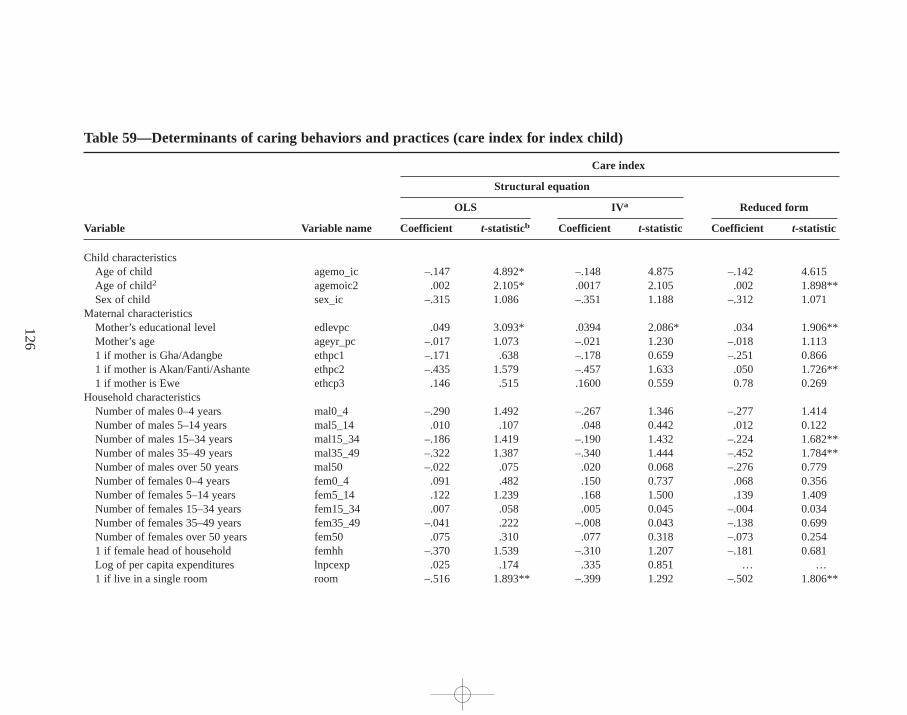
126
Table 59—Determinants of caring behaviors and practices (care index for index child)
Care index
Structural equation
Reduced formOLS IV a
Variable Variable name Coefficient t-statisticb Coefficient t-statistic Coefficient t-statistic
Child characteristicsAge of child agemo_ic –.147 4.892* –.148 4.875 –.142 4.615Age of child2 agemoic2 .002 2.105* .0017 2.105 .002 1.898**Sex of child sex_ic –.315 1.086 –.351 1.188 –.312 1.071
Maternal characteristicsMother’s educational level edlevpc .049 3.093* .0394 2.086* .034 1.906**Mother’s age ageyr_pc –.017 1.073 –.021 1.230 –.018 1.1131 if mother is Gha/Adangbe ethpc1 –.171 .638 –.178 0.659 –.251 0.8661 if mother is Akan/Fanti/Ashante ethpc2 –.435 1.579 –.457 1.633 .050 1.726**1 if mother is Ewe ethcp3 .146 .515 .1600 0.559 0.78 0.269
Household characteristicsNumber of males 0–4 years mal0_4 –.290 1.492 –.267 1.346 –.277 1.414Number of males 5–14 years mal5_14 .010 .107 .048 0.442 .012 0.122Number of males 15–34 years mal15_34 –.186 1.419 –.190 1.432 –.224 1.682**Number of males 35–49 years mal35_49 –.322 1.387 –.340 1.444 –.452 1.784**Number of males over 50 years mal50 –.022 .075 .020 0.068 –.276 0.779Number of females 0–4 years fem0_4 .091 .482 .150 0.737 .068 0.356Number of females 5–14 years fem5_14 .122 1.239 .168 1.500 .139 1.409Number of females 15–34 years fem15_34 .007 .058 .005 0.045 –.004 0.034Number of females 35–49 years fem35_49 –.041 .222 –.008 0.043 –.138 0.699Number of females over 50 years fem50 .075 .310 .077 0.318 –.073 0.2541 if female head of household femhh –.370 1.539 –.310 1.207 –.181 0.681Log of per capita expenditures lnpcexp .025 .174 .335 0.851 … … 1 if live in a single room room –.516 1.893** –.399 1.292 –.502 1.806**
maxw
ell ch
ap09 5
/9/0
8:2
6 P
M P
age 1
26
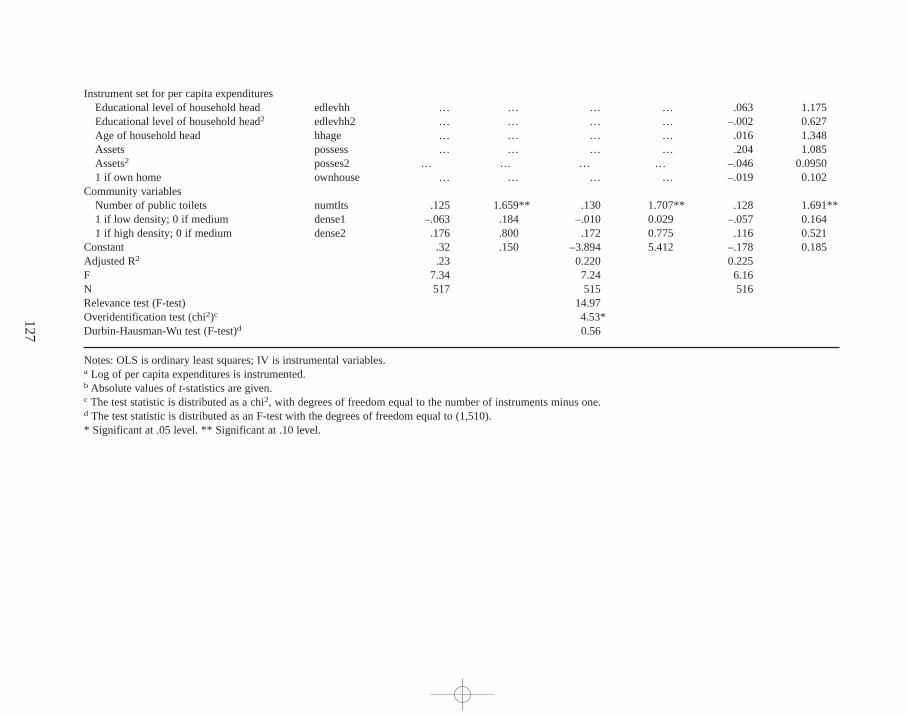
127
Instrument set for per capita expendituresEducational level of household head edlevhh … … … … .063 1.175Educational level of household head2 edlevhh2 … … … … –.002 0.627Age of household head hhage … … … … .016 1.348Assets possess … … … … .204 1.085Assets2 posses2 … … … … –.046 0.09501 if own home ownhouse … … … … –.019 0.102
Community variablesNumber of public toilets numtlts .125 1.659** .130 1.707** .128 1.691**1 if low density; 0 if medium dense1 –.063 .184 –.010 0.029 –.057 0.1641 if high density; 0 if medium dense2 .176 .800 .172 0.775 .116 0.521
Constant .32 .150 –3.894 5.412 –.178 0.185Adjusted R2 .23 0.220 0.225F 7.34 7.24 6.16N 517 515 516Relevance test (F-test) 14.97Overidentification test (chi2)c 4.53*Durbin-Hausman-Wu test (F-test)d 0.56
Notes:OLS is ordinary least squares; IV is instrumental variables.a Log of per capita expenditures is instrumented.b Absolute values of t-statistics are given.c The test statistic is distributed as a chi2, with degrees of freedom equal to the number of instruments minus one. d The test statistic is distributed as an F-test with the degrees of freedom equal to (1,510).* Significant at .05 level. ** Significant at .10 level.
maxw
ell ch
ap09 5
/9/0
8:2
6 P
M P
age 1
27
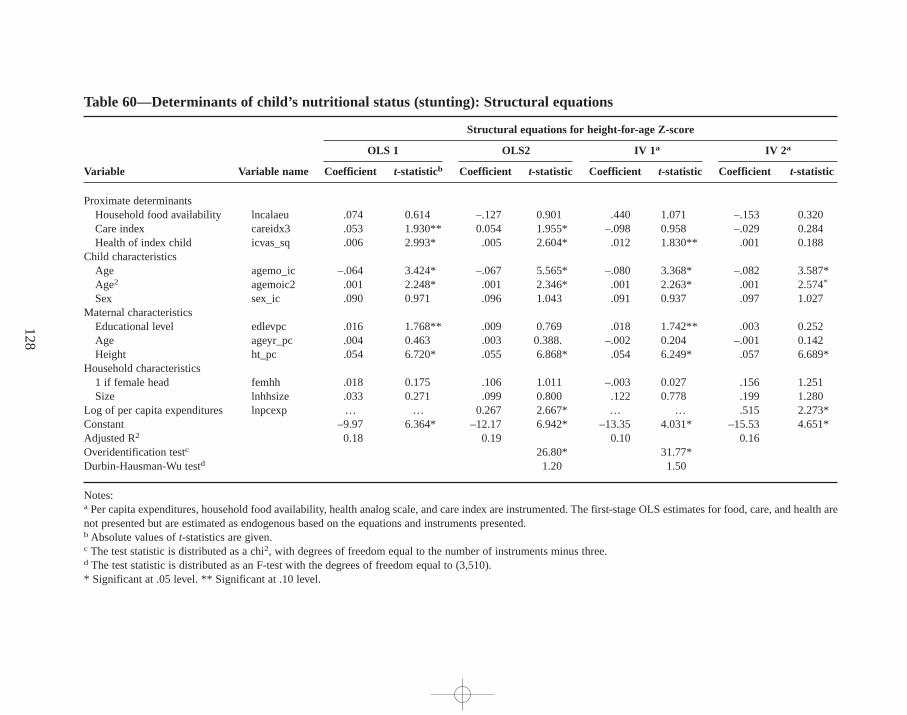
128
Table 60—Determinants of child’ s nutr itional status (stunting): Structural equations
Structural equations for height-for-age Z-score
OLS 1 OLS2 IV 1a IV 2a
Variable Variable name Coefficient t-statisticb Coefficient t-statistic Coefficient t-statistic Coefficient t-statistic
Proximate determinantsHousehold food availability lncalaeu .074 0.614 –.127 0.901 .440 1.071 –.153 0.320Care index careidx3 .053 1.930** 0.054 1.955* –.098 0.958 –.029 0.284Health of index child icvas_sq .006 2.993* .005 2.604* .012 1.830** .001 0.188
Child characteristicsAge agemo_ic –.064 3.424* –.067 5.565* –.080 3.368* –.082 3.587*Age2 agemoic2 .001 2.248* .001 2.346* .001 2.263* .001 2.574*
Sex sex_ic .090 0.971 .096 1.043 .091 0.937 .097 1.027Maternal characteristics
Educational level edlevpc .016 1.768** .009 0.769 .018 1.742** .003 0.252Age ageyr_pc .004 0.463 .003 0.388. –.002 0.204 –.001 0.142Height ht_pc .054 6.720* .055 6.868* .054 6.249* .057 6.689*
Household characteristics1 if female head femhh .018 0.175 .106 1.011 –.003 0.027 .156 1.251Size lnhhsize .033 0.271 .099 0.800 .122 0.778 .199 1.280
Log of per capita expenditures lnpcexp … … 0.267 2.667* … … .515 2.273*Constant –9.97 6.364* –12.17 6.942* –13.35 4.031* –15.53 4.651*Adjusted R2 0.18 0.19 0.10 0.16Overidentification testc 26.80* 31.77*Durbin-Hausman-Wu testd 1.20 1.50
Notes:a Per capita expenditures,household food availability, health analog scale, and care index are instrumented. The first-stage OLS estimates for food, care, and health arenot presented but are estimated as endogenous based on the equations and instruments presented. b Absolute values of t-statistics are given.c The test statistic is distributed as a chi2, with degrees of freedom equal to the number of instruments minus three.d The test statistic is distributed as an F-test with the degrees of freedom equal to (3,510).* Significant at .05 level. ** Significant at .10 level.
maxw
ell ch
ap09 5
/9/0
8:2
6 P
M P
age 1
28
Durbin-Hausman Wu test for the height-for-age Z-score regression using IVs. Therelevance test for food availability, health,and care indicates that these instrumentsdo not predict their respective endogenous variables very well. Because the F-testsare greater than one, the IV estimates are likely to be less biased than the OLS re-sults,but the F-values are not large enough to validate the instrument set. The over-identification test for the nutrition equation suggests that the instruments do notperform well, in that they are correlated with the nutrition error term. The Durbin-Hausman-Wu test cannot reject the null hypothesis that the IVs and OLS areidentical.
These results indicate that the instruments for food availability, care, and healthare not powerful and do not explain enough of the variations in the first-stage de-pendent variables for proper identification. (The exception is the set of instrumentsfor income.) Given the high number of potentially endogenous variables in theheight-for-age equation, it was difficult to find appropriate instruments that werecorrelated with the one endogenous variable but not the others. Thus,it is not sur-prising that in the second-stage equation, the set of instruments are correlated withthe error term, and the IV and OLS are not significantly different from one another.Given that the instruments in the equation are weak,OLS estimates are just as goodas IV estimates until better instruments can be identified.
In the IV estimates,neither food nor care is significantly associated with nutri-tional status. The weak relationship between household food consumption and nu-trition in cross-sectional analysis has been noted in a number of economic studies(Alderman 1989; Alderman 1990; Haddad et al. 1996). Household food availabilityis a poor proxy for individual food intake, since it does not take intrahousehold dis-tribution into account.
Given that this study models the intake of very young children (from 0 to 3 yearsof age), it is not unusual that the association between household-level food avail-ability and nutritional status is insignificant. Typically, children in this age groupderive a large proportion of their energy from breast milk. For instance, in develop-ing countries children age 1–2 obtain,on average, more than half their daily calo-ries from breast milk (WHO 1998). In this sample, 55 percent of the index childrenwere still breast-feeding, suggesting that breast milk was providing much of theirdietary energy intake. Complementary foods contributed a relatively small numberof calories. The difference between malnourished and well-nourished children,then, is the result not of extra calories from complementary foods but of factorssuch as the quality of these foods,the number of overall feedings per day, and othermaternal feeding choices.
The care index loses significance in both the IV estimates,with and withoutincome, while long-term child nutritional status (measured by height-for-age Z-scores) is positively associated with better health. From the IV estimates,it ap-pears that health is the factor that most affects child nutritional status—but withseveral important caveats. First,the visual analog scale is both highly subjective andcorrelated with nutritional status,reflecting a combination of poor growth and highmorbidity from the mother’s perspective. Therefore, many of the variables that are
129
maxwell chap09 5/9/0 8:26 PM Page 129
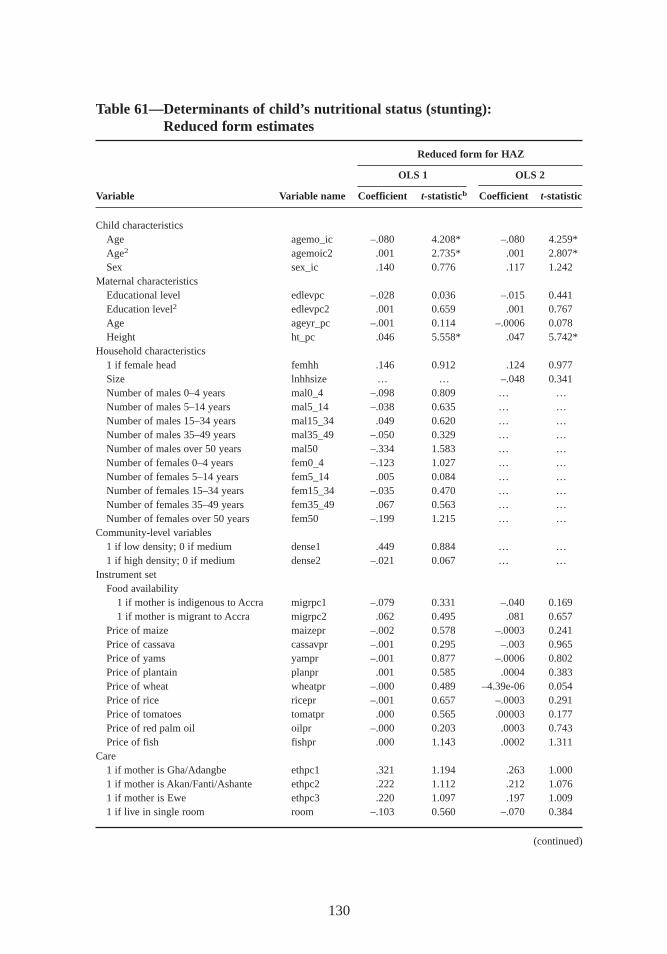
130
Table 61—Determinants of child’ s nutr itional status (stunting):Reduced form estimates
Reduced form for HAZ
OLS 1 OLS 2
Variable Variable name Coefficient t-statisticb Coefficient t-statistic
Child characteristicsAge agemo_ic –.080 4.208* –.080 4.259*Age2 agemoic2 .001 2.735* .001 2.807*Sex sex_ic .140 0.776 .117 1.242
Maternal characteristicsEducational level edlevpc –.028 0.036 –.015 0.441Education level2 edlevpc2 .001 0.659 .001 0.767Age ageyr_pc –.001 0.114 –.0006 0.078Height ht_pc .046 5.558* .047 5.742*
Household characteristics1 if female head femhh .146 0.912 .124 0.977Size lnhhsize … … –.048 0.341Number of males 0–4 years mal0_4 –.098 0.809 … …Number of males 5–14 years mal5_14 –.038 0.635 … …Number of males 15–34 years mal15_34 .049 0.620 … …Number of males 35–49 years mal35_49 –.050 0.329 … …Number of males over 50 years mal50 –.334 1.583 … …Number of females 0–4 years fem0_4 –.123 1.027 … …Number of females 5–14 years fem5_14 .005 0.084 … …Number of females 15–34 years fem15_34 –.035 0.470 … …Number of females 35–49 years fem35_49 .067 0.563 … …Number of females over 50 years fem50 –.199 1.215 … …
Community-level variables1 if low density; 0 if medium dense1 .449 0.884 … …1 if high density; 0 if medium dense2 –.021 0.067 … …
Instrument setFood availability
1 if mother is indigenous to Accra migrpc1 –.079 0.331 –.040 0.1691 if mother is migrant to Accra migrpc2 .062 0.495 .081 0.657
Price of maize maizepr –.002 0.578 –.0003 0.241Price of cassava cassavpr –.001 0.295 –.003 0.965Price of yams yampr –.001 0.877 –.0006 0.802Price of plantain planpr .001 0.585 .0004 0.383Price of wheat wheatpr –.000 0.489 –4.39e-06 0.054Price of rice ricepr –.001 0.657 –.0003 0.291Price of tomatoes tomatpr .000 0.565 .00003 0.177Price of red palm oil oilpr –.000 0.203 .0003 0.743Price of fish fishpr .000 1.143 .0002 1.311
Care1 if mother is Gha/Adangbe ethpc1 .321 1.194 .263 1.0001 if mother is Akan/Fanti/Ashante ethpc2 .222 1.112 .212 1.0761 if mother is Ewe ethpc3 .220 1.097 .197 1.0091 if live in single room room –.103 0.560 –.070 0.384
(continued)
maxwell chap09 5/9/0 8:26 PM Page 130
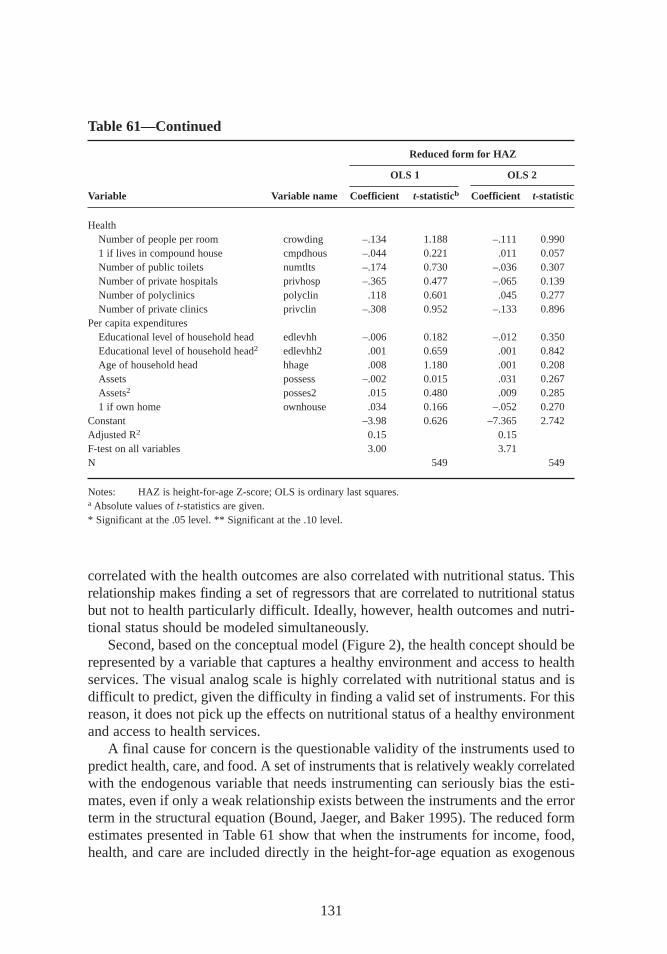
correlated with the health outcomes are also correlated with nutritional status. Thisrelationship makes finding a set of regressors that are correlated to nutritional statusbut not to health particularly difficult. Ideally, however, health outcomes and nutri-tional status should be modeled simultaneously.
Second, based on the conceptual model (Figure 2),the health concept should berepresented by a variable that captures a healthy environment and access to healthservices. The visual analog scale is highly correlated with nutritional status and isdifficult to predict,given the difficulty in finding a valid set of instruments. For thisreason,it does not pick up the effects on nutritional status of a healthy environmentand access to health services.
A final cause for concern is the questionable validity of the instruments used topredict health,care, and food. A set of instruments that is relatively weakly correlatedwith the endogenous variable that needs instrumenting can seriously bias the esti-mates,even if only a weak relationship exists between the instruments and the errorterm in the structural equation (Bound, Jaeger, and Baker 1995). The reduced formestimates presented in Table 61 show that when the instruments for income, food,health,and care are included directly in the height-for-age equation as exogenous
131
Table 61—Continued
Reduced form for HAZ
OLS 1 OLS 2
Variable Variable name Coefficient t-statisticb Coefficient t-statistic
HealthNumber of people per room crowding –.134 1.188 –.111 0.9901 if lives in compound house cmpdhous –.044 0.221 .011 0.057Number of public toilets numtlts –.174 0.730 –.036 0.307Number of private hospitals privhosp –.365 0.477 –.065 0.139Number of polyclinics polyclin .118 0.601 .045 0.277Number of private clinics privclin –.308 0.952 –.133 0.896
Per capita expendituresEducational level of household head edlevhh –.006 0.182 –.012 0.350Educational level of household head2 edlevhh2 .001 0.659 .001 0.842Age of household head hhage .008 1.180 .001 0.208Assets possess –.002 0.015 .031 0.267Assets2 posses2 .015 0.480 .009 0.2851 if own home ownhouse .034 0.166 –.052 0.270
Constant –3.98 0.626 –7.365 2.742Adjusted R2 0.15 0.15F-test on all variables 3.00 3.71N 549 549
Notes: HAZ is height-for-age Z-score; OLS is ordinary last squares.a Absolute values of t-statistics are given.* Significant at the .05 level. ** Significant at the .10 level.
maxwell chap09 5/9/0 8:26 PM Page 131
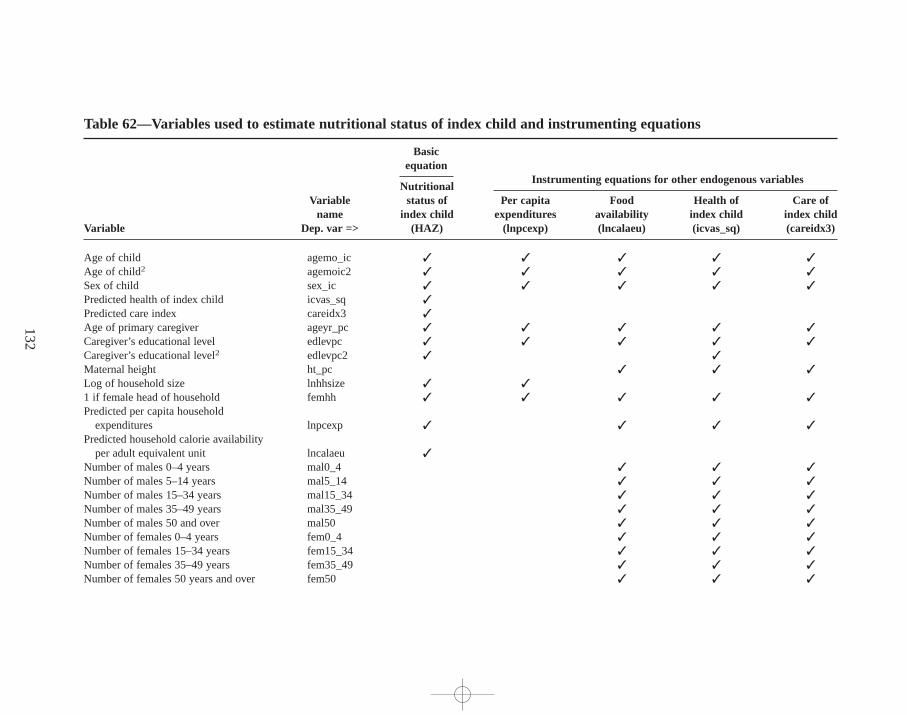
132
Table 62—Variables used to estimate nutr itional status of index child and instrumenting equations
Basicequation
Instr umenting equations for other endogenous variablesNutr itional
Variable status of Per capita Food Health of Care ofname index child expenditures availability index child index child
Variable Dep. var => (HAZ) (lnpcexp) (lncalaeu) (icvas_sq) (careidx3)
Age of child agemo_ic ✓ ✓ ✓ ✓ ✓
Age of child2 agemoic2 ✓ ✓ ✓ ✓ ✓
Sex of child sex_ic ✓ ✓ ✓ ✓ ✓
Predicted health of index child icvas_sq ✓
Predicted care index careidx3 ✓
Age of primary caregiver ageyr_pc ✓ ✓ ✓ ✓ ✓
Caregiver’s educational level edlevpc ✓ ✓ ✓ ✓ ✓
Caregiver’s educational level2 edlevpc2 ✓ ✓
Maternal height ht_pc ✓ ✓ ✓
Log of household size lnhhsize ✓ ✓
1 if female head of household femhh ✓ ✓ ✓ ✓ ✓
Predicted per capita householdexpenditures lnpcexp ✓ ✓ ✓ ✓
Predicted household calorie availability per adult equivalent unit lncalaeu ✓
Number of males 0–4 years mal0_4 ✓ ✓ ✓
Number of males 5–14 years mal5_14 ✓ ✓ ✓
Number of males 15–34 years mal15_34 ✓ ✓ ✓
Number of males 35–49 years mal35_49 ✓ ✓ ✓
Number of males 50 and over mal50 ✓ ✓ ✓
Number of females 0–4 years fem0_4 ✓ ✓ ✓
Number of females 15–34 years fem15_34 ✓ ✓ ✓
Number of females 35–49 years fem35_49 ✓ ✓ ✓
Number of females 50 years and over fem50 ✓ ✓ ✓
maxw
ell ch
ap09 5
/9/0
8:2
6 P
M P
age 1
32
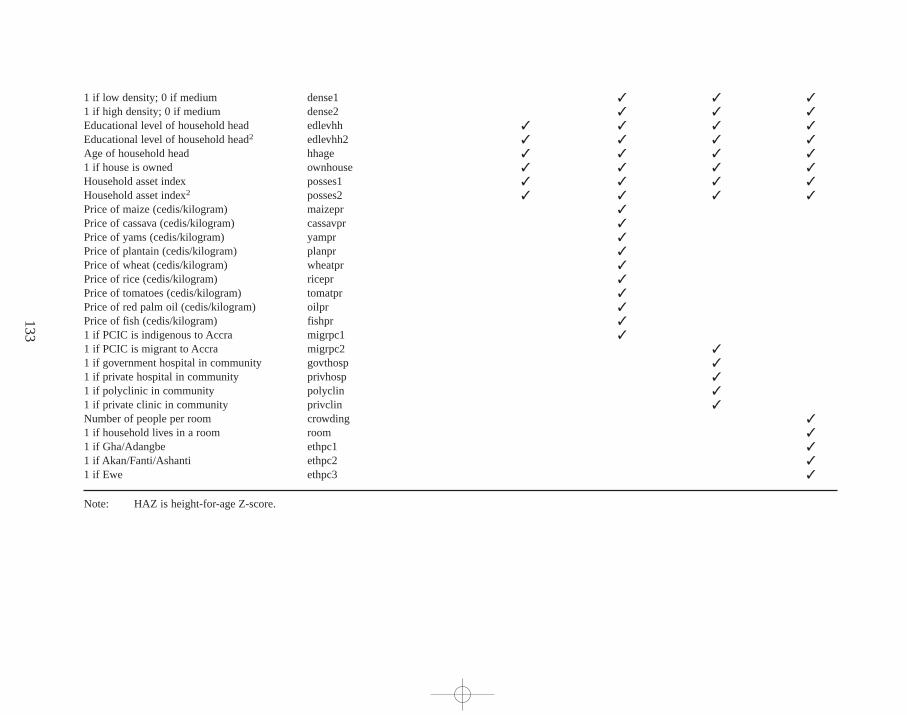
133
1 if low density; 0 if medium dense1 ✓ ✓ ✓
1 if high density; 0 if medium dense2 ✓ ✓ ✓
Educational level of household head edlevhh ✓ ✓ ✓ ✓
Educational level of household head2 edlevhh2 ✓ ✓ ✓ ✓
Age of household head hhage ✓ ✓ ✓ ✓
1 if house is owned ownhouse ✓ ✓ ✓ ✓
Household asset index posses1 ✓ ✓ ✓ ✓
Household asset index2 posses2 ✓ ✓ ✓ ✓
Price of maize (cedis/kilogram) maizepr ✓
Price of cassava (cedis/kilogram) cassavpr ✓
Price of yams (cedis/kilogram) yampr ✓
Price of plantain (cedis/kilogram) planpr ✓
Price of wheat (cedis/kilogram) wheatpr ✓
Price of rice (cedis/kilogram) ricepr ✓
Price of tomatoes (cedis/kilogram) tomatpr ✓
Price of red palm oil (cedis/kilogram) oilpr ✓
Price of fish (cedis/kilogram) fishpr ✓
1 if PCIC is indigenous to Accra migrpc1 ✓
1 if PCIC is migrant to Accra migrpc2 ✓
1 if government hospital in community govthosp ✓
1 if private hospital in community privhosp ✓
1 if polyclinic in community polyclin ✓
1 if private clinic in community privclin ✓
Number of people per room crowding ✓
1 if household lives in a room room ✓
1 if Gha/Adangbe ethpc1 ✓
1 if Akan/Fanti/Ashanti ethpc2 ✓
1 if Ewe ethpc3 ✓
Note: HAZ is height-for-age Z-score.
maxw
ell ch
ap09 5
/9/0
8:2
6 P
M P
age 1
33
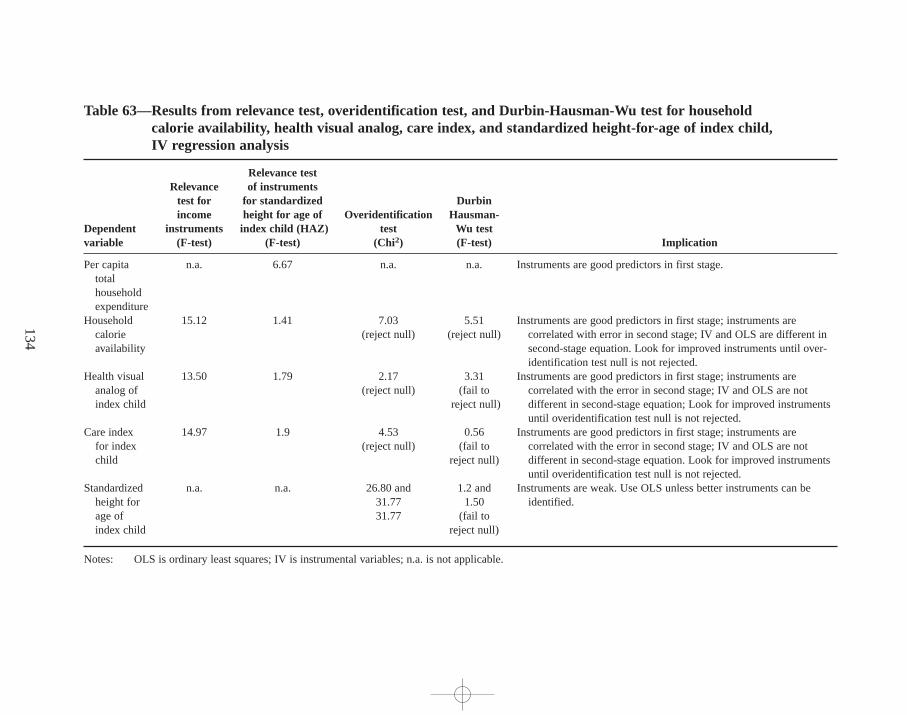
134
Table 63—Results from relevance test,overidentif ication test, and Durbin-Hausman-Wu test for household calorie availability , health visual analog, care index, and standardized height-for-age of index child ,IV r egression analysis
Relevance testRelevance of instruments
test for for standardized Durbinincome height for age of Overidentif ication Hausman-
Dependent instruments index child (HAZ) test Wu testvariable (F-test) (F-test) (Chi2) (F-test) Implication
Per capita n.a. 6.67 n.a. n.a. Instruments are good predictors in first stage.totalhouseholdexpenditure
Household 15.12 1.41 7.03 5.51 Instruments are good predictors in first stage; instruments are calorie (reject null) (reject null) correlated with error in second stage; IV and OLS are different in availability second-stage equation. Look for improved instruments until over-
identification test null is not rejected.Health visual 13.50 1.79 2.17 3.31 Instruments are good predictors in first stage; instruments are
analog of (reject null) (fail to correlated with the error in second stage; IV and OLS are not index child reject null) different in second-stage equation; Look for improved instruments
until overidentification test null is not rejected.Care index 14.97 1.9 4.53 0.56 Instruments are good predictors in first stage; instruments are
for index (reject null) (fail to correlated with the error in second stage; IV and OLS are not child reject null) different in second-stage equation. Look for improved instruments
until overidentification test null is not rejected.Standardized n.a. n.a. 26.80 and 1.2 and Instruments are weak. Use OLS unless better instruments can be
height for 31.77 1.50 identified.age of 31.77 (fail to index child reject null)
Notes: OLS is ordinary least squares; IV is instrumental variables; n.a. is not applicable.
maxw
ell ch
ap09 5
/9/0
8:2
6 P
M P
age 1
34
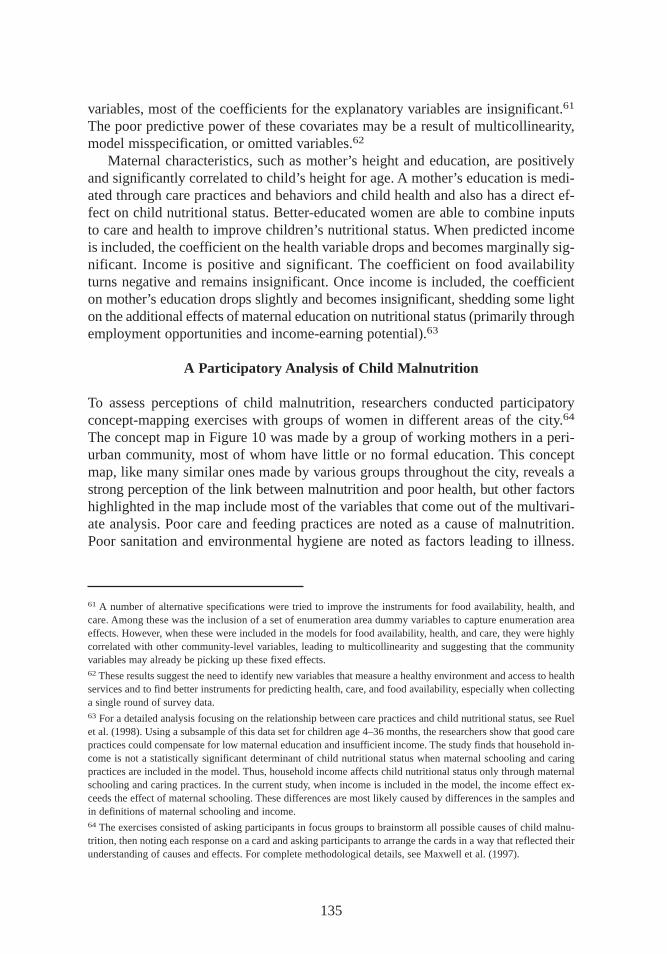
variables,most of the coefficients for the explanatory variables are insignificant.61
The poor predictive power of these covariates may be a result of multicollinearity,model misspecification, or omitted variables.62
Maternal characteristics, such as mother’s height and education, are positivelyand significantly correlated to child’s height for age. A mother’s education is medi-ated through care practices and behaviors and child health and also has a direct ef-fect on child nutritional status. Better-educated women are able to combine inputsto care and health to improve children’s nutritional status. When predicted incomeis included, the coefficient on the health variable drops and becomes marginally sig-nificant. Income is positive and significant. The coefficient on food availabilityturns negative and remains insignificant. Once income is included, the coefficienton mother’s education drops slightly and becomes insignificant,shedding some lighton the additional effects of maternal education on nutritional status (primarily throughemployment opportunities and income-earning potential).63
A Participatory Analysis of Child Malnutr ition
To assess perceptions of child malnutrition, researchers conducted participatoryconcept-mapping exercises with groups of women in different areas of the city.64
The concept map in Figure 10 was made by a group of working mothers in a peri-urban community, most of whom have little or no formal education. This conceptmap, like many similar ones made by various groups throughout the city, reveals astrong perception of the link between malnutrition and poor health,but other factorshighlighted in the map include most of the variables that come out of the multivari-ate analysis. Poor care and feeding practices are noted as a cause of malnutrition.Poor sanitation and environmental hygiene are noted as factors leading to illness.
135
61 A number of alternative specifications were tried to improve the instruments for food availability, health,andcare. Among these was the inclusion of a set of enumeration area dummy variables to capture enumeration areaeffects. However, when these were included in the models for food availability, health,and care, they were highlycorrelated with other community-level variables, leading to multicollinearity and suggesting that the communityvariables may already be picking up these fixed effects.62 These results suggest the need to identify new variables that measure a healthy environment and access to healthservices and to find better instruments for predicting health,care, and food availability, especially when collectinga single round of survey data.63 For a detailed analysis focusing on the relationship between care practices and child nutritional status,see Ruelet al. (1998). Using a subsample of this data set for children age 4–36 months,the researchers show that good carepractices could compensate for low maternal education and insufficient income. The study finds that household in-come is not a statistically significant determinant of child nutritional status when maternal schooling and caringpractices are included in the model. Thus,household income affects child nutritional status only through maternalschooling and caring practices. In the current study, when income is included in the model,the income effect ex-ceeds the effect of maternal schooling. These differences are most likely caused by differences in the samples andin definitions of maternal schooling and income.64 The exercises consisted of asking participants in focus groups to brainstorm all possible causes of child malnu-trition, then noting each response on a card and asking participants to arrange the cards in a way that reflected theirunderstanding of causes and effects. For complete methodological details,see Maxwell et al. (1997).
maxwell chap09 5/9/0 8:26 PM Page 135
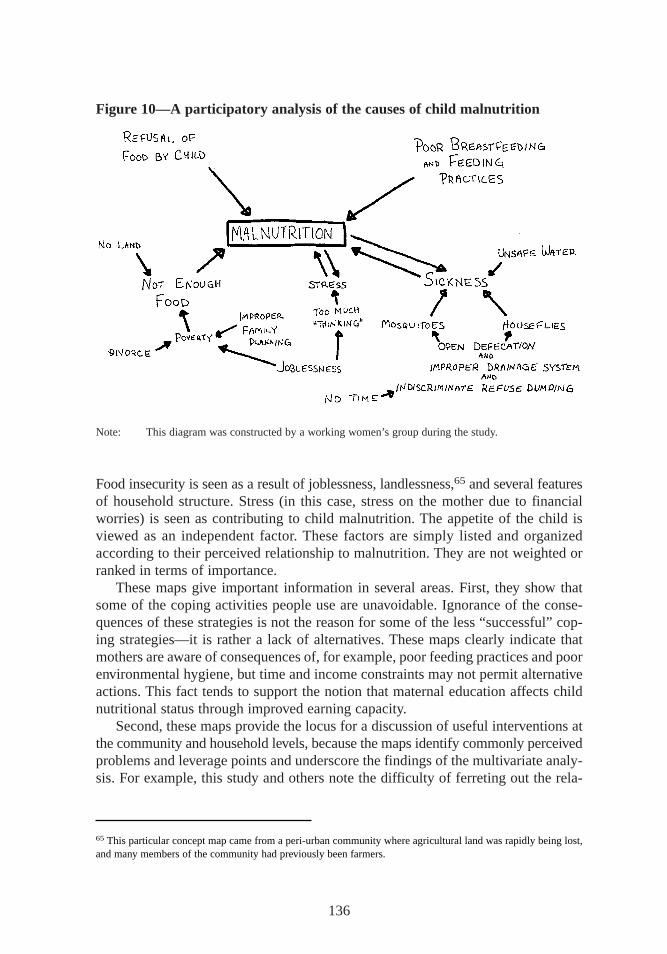
Food insecurity is seen as a result of joblessness,landlessness,65 and several featuresof household structure. Stress (in this case, stress on the mother due to financialworries) is seen as contributing to child malnutrition. The appetite of the child isviewed as an independent factor. These factors are simply listed and organizedaccording to their perceived relationship to malnutrition. They are not weighted orranked in terms of importance.
These maps give important information in several areas. First, they show thatsome of the coping activities people use are unavoidable. Ignorance of the conse-quences of these strategies is not the reason for some of the less “successful”cop-ing strategies—it is rather a lack of alternatives. These maps clearly indicate thatmothers are aware of consequences of, for example, poor feeding practices and poorenvironmental hygiene, but time and income constraints may not permit alternativeactions. This fact tends to support the notion that maternal education affects childnutritional status through improved earning capacity.
Second, these maps provide the locus for a discussion of useful interventions atthe community and household levels,because the maps identify commonly perceivedproblems and leverage points and underscore the findings of the multivariate analy-sis. For example, this study and others note the difficulty of ferreting out the rela-
136
Figure 10—A participatory analysis of the causes of child malnutr ition
Note: This diagram was constructed by a working women’s group during the study.
65 This particular concept map came from a peri-urban community where agricultural land was rapidly being lost,and many members of the community had previously been farmers.
maxwell chap09 5/9/0 8:26 PM Page 136
tionship between household food availability and nutritional status using cross-sectional data. Yet maternal perceptions of the link between food insecurity andchild malnutrition, and of the causes of food insecurity, are quite strong across all thegroups that constructed these maps. This participatory analysis indicates that pro-grams aimed at enhancing mothers’ ability to earn an income or to improve environ-mental sanitation and reduce illness would be broadly acceptable as interventionswhose real aim is to improve child nutrition. Clearly, maternal perceptions of thecauses of child malnutrition complement the quantitative findings.
What the Findings Show
Both the OLS and IVs indicate that the strongest determinants of child nutritionalstatus are the individual characteristics of the child and mother. Household foodavailability is not a significant determinant of the child’s nutritional status,whilethe OLS estimates indicate that care and health are important inputs. However, in-dividual energy intake, which is not measured here, may still be an important de-terminant of child’s nutritional status.
The findings from the multivariate analysis support many of the associations de-scribed in previous chapters. As expected, higher incomes do lead to increased house-hold food availability, higher-quality diets,and better health for the child, but not tosignificantly improved care practices and behaviors. These findings are consistentwith the bivariate analysis in Chapter 7,which shows that good care practices arenot associated with any socioeconomic factors, including income. Rather, maternalschooling is strongly associated with good care practices and positive behaviors.Mother’s education matters. Maternal schooling is associated with higher levels ofhousehold food availability, higher-quality diets,better care practices and behaviors,and better nutritional outcomes.
137
maxwell chap09 5/9/0 8:26 PM Page 137
CHAPTER 10
Urban Livelihood Security: Assets,Vulnerability, Trade-offs, and Coping
The challenge posed by the conceptual framework for livelihood security is tounderstand the ways people organize their assets, capabilities, and activities—
and their means of coping—to gain access to their basic requirements. Some of themajor pieces to this puzzle, described by Davies (1996) as “sources of entitlement,”were discussed in Chapter 4: household structure and organization, labor and income-generating activities, and coping and reciprocal exchange. Others, described as“calls on entitlement,” were analyzed in Chapters 5 and 7: resource allocation, par-ticularly patterns of expenditure; food consumption and acquisition of other basicneeds; and care. Still others—health and nutritional status—are outcomes, at leastin the short term, but in the long term they are also necessary inputs to the abilityto work and to cognitive ability. These chapters have also identified the majordeterminants of and constraints to the primary outcomes of interest—income, foodavailability, health, care, and nutritional status.
This chapter addresses several issues suggested by the analyses in foregoingchapters. First, it examines the trade-offs people have to make to survive in the city,given the constraints on people’s ability to earn sufficient income and the cost ofacquiring even basic needs in an urban environment. Second, it seeks to determinewhat the patterns of coping suggested by these trade-offs say about the range ofchoices available. In other words, it asks whether people’s coping strategies are“successful.” And third, it identifies those groups that are the most vulnerable in thecity.
Trade-offs and Coping: Are Coping Strategies Successful?
At least three major categories of trade-offs emerge from the analysis in Chapters 3to 7. These include the trade-off between consumption and savings (or investment);the trade-off between food and other basic necessities; and perhaps most important,the trade-off between maternal work and child care. People’s choices in each of thesecategories have important implications for all the outcomes of interest in this study.
138
maxwell chap10 5/9/0 8:25 PM Page 138
Consumption versus Savings
The analysis in Table 33 reveals a small but notable group of households (39 in all,or about 7 percent of the sample),mostly headed by male migrants,that are send-ing large amounts of money out of the city (or, in a few cases,to other householdswithin the city). None of the other expenditure categories are particularly unusualfor this group. The senders are clearly sacrif icing food consumption in the short runin order to be able to send these remittances and thus fall into the “questionable”category noted in Chapter 5. The remittances amounted to a mean of about $150 inthe previous year, with some as high as $1,000. The households are fairly evenlydistributed across per capita expenditure quintiles but have a higher-than-averagenumber of income-generating activities (2.3). None of them had sought assistancefrom another household in the form of a transfer of money or goods.66 This groupis clearly unique. Other net remitting households,for the most part, do not fall intothis “questionable” food security category. But indeed there is nothing “questionable”about this particular subgroup—its priorities are clear.
For the kayayoo—the migrant female market porters who come to Accra mostlyfrom northern Ghana in order to earn money and save for marriage—the majortrade-off is also between consumption and savings (Agarwal 1994). To savemoney, they often live in squalid conditions,and many of them have small children.Because of the children, they are a visibly vulnerable group, although one withclear objectives. Their stay in the city is usually limited. One young woman sum-marized the objectives of this group. She stated that she minimized all housingand consumption expenditures and used most of her money to buy the cloth, bowls,and cooking pots she needed for marriage. She added, “I am seriously saving tobuy a sewing machine and to get some capital, so when I go back home I can tradewith it.”
Food Consumption versus Other Basic Needs
Table 33 shows the proportion of households in the city with adequate levels ofcalorie availability but relatively high shares of food expenditures in the overallbudget. This group is considered vulnerable because a small price or income shockcould quickly undermine their consumption status. Table 34 shows that over half ofall female-headed households in the city fall into this category, as do a high pro-portion of the predominantly female occupational groups—especially petty tradersand street food vendors.
In conventional analysis of food security, the “f ood secure” and the “vulnerable”groups would be classified together (because they have adequate calorie availability),
139
66 Unfortunately, the questionnaire did not include a question asking how long respondents intended to stay in thecity, so it is not possible to speculate on whether this use of money amounts to urban-based investment in ruralareas or is simply a coping strategy based on urban-rural kinship linkages.
maxwell chap10 5/9/0 8:25 PM Page 139
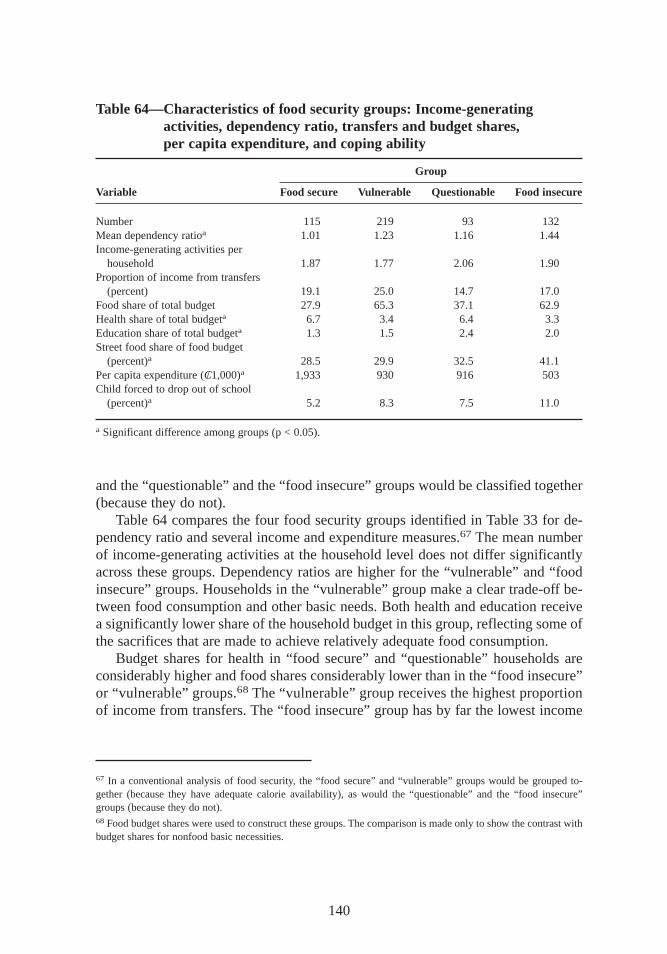
and the “questionable” and the “f ood insecure” groups would be classified together(because they do not).
Table 64 compares the four food security groups identified in Table 33 for de-pendency ratio and several income and expenditure measures.67 The mean numberof income-generating activities at the household level does not differ significantlyacross these groups. Dependency ratios are higher for the “vulnerable” and “f oodinsecure” groups. Households in the “vulnerable” group make a clear trade-off be-tween food consumption and other basic needs. Both health and education receivea significantly lower share of the household budget in this group,reflecting some ofthe sacrif ices that are made to achieve relatively adequate food consumption.
Budget shares for health in “f ood secure” and “questionable” households areconsiderably higher and food shares considerably lower than in the “f ood insecure”or “vulnerable” groups.68 The “vulnerable” group receives the highest proportionof income from transfers. The “f ood insecure” group has by far the lowest income
140
Table 64—Characteristics of food security groups: Income-generatingactivities, dependency ratio, tr ansfers and budget shares,per capita expenditure, and coping ability
Group
Variable Food secure Vulnerable Questionable Food insecure
Number 115 219 93 132Mean dependency ratioa 1.01 1.23 1.16 1.44Income-generating activities per
household 1.87 1.77 2.06 1.90Proportion of income from transfers
(percent) 19.1 25.0 14.7 17.0Food share of total budget 27.9 65.3 37.1 62.9Health share of total budgeta 6.7 3.4 6.4 3.3Education share of total budgeta 1.3 1.5 2.4 2.0Street food share of food budget
(percent)a 28.5 29.9 32.5 41.1Per capita expenditure (C/ 1,000)a 1,933 930 916 503Child forced to drop out of school
(percent)a 5.2 8.3 7.5 11.0
a Significant difference among groups (p < 0.05).
67 In a conventional analysis of food security, the “f ood secure” and “vulnerable” groups would be grouped to-gether (because they have adequate calorie availability), as would the “questionable” and the “f ood insecure”groups (because they do not).68 Food budget shares were used to construct these groups. The comparison is made only to show the contrast withbudget shares for nonfood basic necessities.
maxwell chap10 5/9/0 8:25 PM Page 140
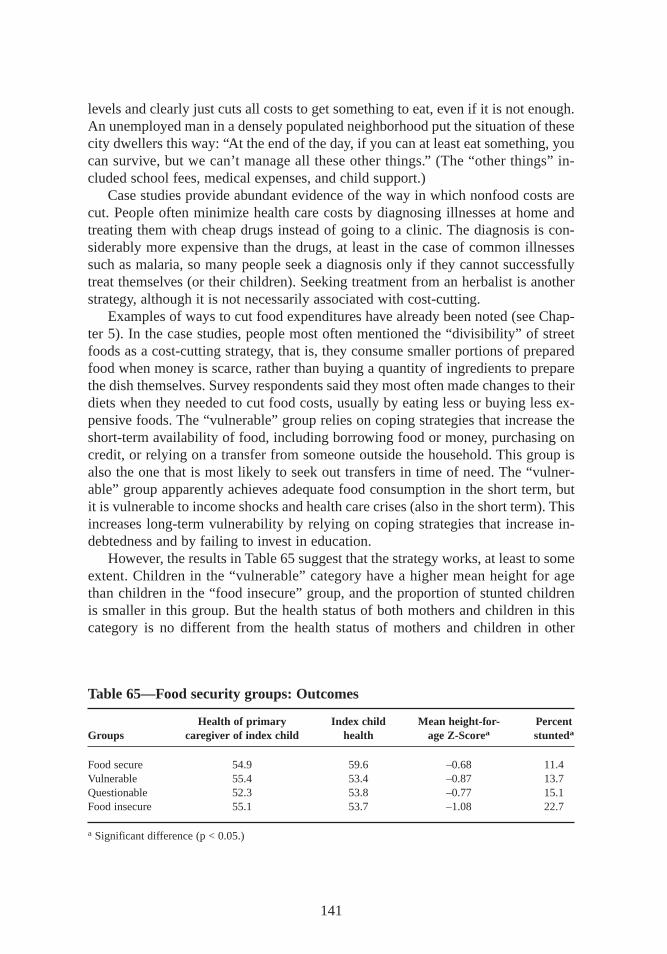
levels and clearly just cuts all costs to get something to eat, even if it is not enough.An unemployed man in a densely populated neighborhood put the situation of thesecity dwellers this way: “At the end of the day, if you can at least eat something, youcan survive, but we can’t manage all these other things.” (The “other things”in-cluded school fees,medical expenses,and child support.)
Case studies provide abundant evidence of the way in which nonfood costs arecut. People often minimize health care costs by diagnosing illnesses at home andtreating them with cheap drugs instead of going to a clinic. The diagnosis is con-siderably more expensive than the drugs,at least in the case of common illnessessuch as malaria, so many people seek a diagnosis only if they cannot successfullytreat themselves (or their children). Seeking treatment from an herbalist is anotherstrategy, although it is not necessarily associated with cost-cutting.
Examples of ways to cut food expenditures have already been noted (see Chap-ter 5). In the case studies,people most often mentioned the “divisibility” of streetfoods as a cost-cutting strategy, that is, they consume smaller portions of preparedfood when money is scarce, rather than buying a quantity of ingredients to preparethe dish themselves. Survey respondents said they most often made changes to theirdiets when they needed to cut food costs,usually by eating less or buying less ex-pensive foods. The “vulnerable” group relies on coping strategies that increase theshort-term availability of food, including borrowing food or money, purchasing oncredit, or relying on a transfer from someone outside the household. This group isalso the one that is most likely to seek out transfers in time of need. The “vulner-able” group apparently achieves adequate food consumption in the short term, butit is vulnerable to income shocks and health care crises (also in the short term). Thisincreases long-term vulnerability by relying on coping strategies that increase in-debtedness and by failing to invest in education.
However, the results in Table 65 suggest that the strategy works,at least to someextent. Children in the “vulnerable” category have a higher mean height for agethan children in the “f ood insecure” group,and the proportion of stunted childrenis smaller in this group. But the health status of both mothers and children in thiscategory is no different from the health status of mothers and children in other
141
Table 65—Food security groups: Outcomes
Health of primary Index child Mean height-for- PercentGroups caregiver of index child health age Z-Scorea stunteda
Food secure 54.9 59.6 –0.68 11.4Vulnerable 55.4 53.4 –0.87 13.7Questionable 52.3 53.8 –0.77 15.1Food insecure 55.1 53.7 –1.08 22.7
a Significant difference (p < 0.05.)
maxwell chap10 5/9/0 8:25 PM Page 141
groups,despite the fact that health expenditures seem to be sacrif iced for food. Thisstrategy may therefore be an example of successful coping.69
The “f ood insecure” group’s coping strategies tend to be oriented toward ra-tioning or getting by with the little that is already available. Although householdsseek out assistance, they do so less frequently. School children in this group tend todrop out of school at high rates,suggesting that these households sacrif ice long-terminvestments in education for short-term survival. Reliance on street foods is a par-ticularly important strategy for the food insecure group, with the share of streetfoods in the household food budget at over 40 percent of the total. But as noted inChapter 5,on a per calorie basis,street foods are among the most expensive foods.Relying on such foods,then,is an example of a coping strategy that is not success-ful. The group most dependent on street foods is the one that can least afford to bespending its limited money on more expensive calories.
Table 65 compares these groups in terms of outcomes. Despite the fact that house-holds in the “vulnerable” category spend significantly less on health care, mothersand children in these households do not seem to suffer because of it:there are nodifferences in health outcomes among all these groups. Figures are not shown forother measures of health,such as the frequency of diarrhea,fever, or other symp-toms in the index child, because they do not reveal any significant differences. Dif-ferences among groups show up more clearly for nutritional status. The prevalenceof stunting among the “f ood secure” group (11.4 percent) is half that of the “f oodinsecure” group (22.7 percent), though the mean per capita expenditure is fourtimes higher in the “f ood secure” group. These results are consistent with the multi-variate analysis presented in Chapter 9,which shows no significant relationshipbetween household food availability and height-for-age Z-scores.
Maternal Work versus Care
The third important trade-off is between maternal employment and childcare. Ma-ternal work is negatively related to nutritional status,and the relationship is clearlyconfounded by the age of the child.70 The age of the child—or, more precisely, thetime that has elapsed since birth—is clearly one factor in determining when themothergoes back to work. Case study and focus group evidence strongly suggeststhat two primary factors determine when mothers return to their income-generatingactivities: first, how “rested”the mother feels,and second, the imperative of earn-ing an income. Focus group discussions on this issue made clear that mothers know
142
69 It is impossible to determine whether relying on transfers as a coping strategy is “successful”or not,becausethese data give little information about the reciprocal obligation. Focus group participants tended to say they pre-ferred income that they had earned themselves to transfer income, because then they were free of such obligations.But such obligations are not an indication of coping “f ailure.”70 The results of the multivariate analysis in Chapter 8 confirm the positive relationship of care to nutritional sta-tus,but the relationship between maternal work and care (explored in Chapter 7) is less clear.
maxwell chap10 5/9/0 8:25 PM Page 142
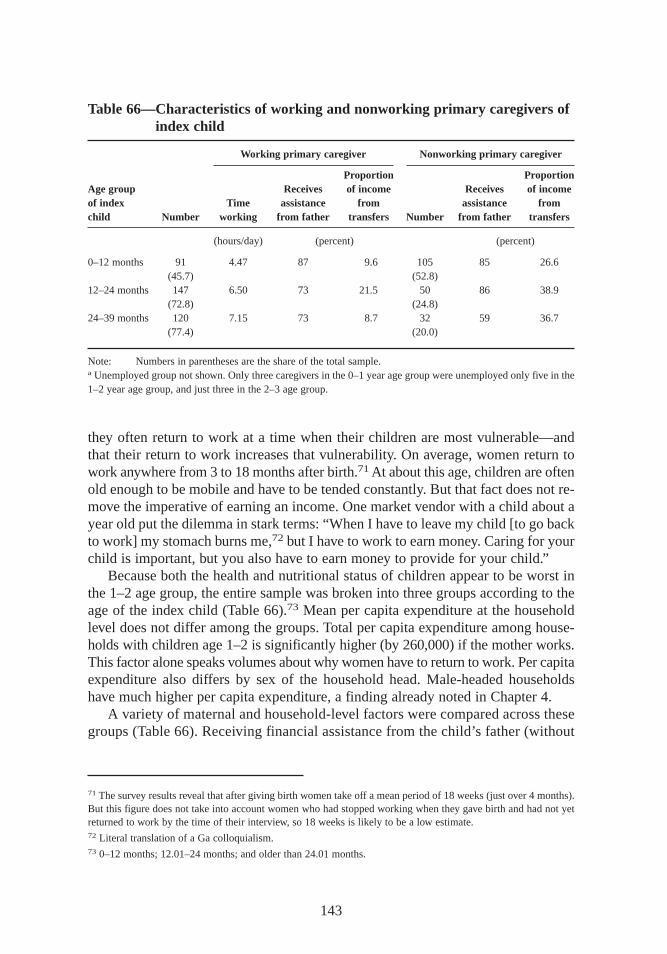
they often return to work at a time when their children are most vulnerable—andthat their return to work increases that vulnerability. On average, women return towork anywhere from 3 to 18 months after birth.71At about this age, children are oftenold enough to be mobile and have to be tended constantly. But that fact does not re-move the imperative of earning an income. One market vendor with a child about ayear old put the dilemma in stark terms:“When I have to leave my child [to go backto work] my stomach burns me,72 but I have to work to earn money. Caring for yourchild is important,but you also have to earn money to provide for your child.”
Because both the health and nutritional status of children appear to be worst inthe 1–2 age group,the entire sample was broken into three groups according to theage of the index child (Table 66).73 Mean per capita expenditure at the householdlevel does not differ among the groups. Total per capita expenditure among house-holds with children age 1–2 is significantly higher (by 260,000) if the mother works.This factor alone speaks volumes about why women have to return to work. Per capitaexpenditure also differs by sex of the household head. Male-headed householdshave much higher per capita expenditure, a finding already noted in Chapter 4.
A variety of maternal and household-level factors were compared across thesegroups (Table 66). Receiving financial assistance from the child’s father (without
143
71 The survey results reveal that after giving birth women take off a mean period of 18 weeks (just over 4 months).But this figure does not take into account women who had stopped working when they gave birth and had not yetreturned to work by the time of their interview, so 18 weeks is likely to be a low estimate.72 Literal translation of a Ga colloquialism.73 0–12 months; 12.01–24 months; and older than 24.01 months.
Table 66—Characteristics of working and nonworking pr imary caregivers ofindex child
Working pr imary caregiver Nonworking pr imary caregiver
Proportion ProportionAge group Receives of income Receives of incomeof index Time assistance fr om assistance fr omchild Number working fr om father tr ansfers Number fr om father tr ansfers
(hours/day) (percent) (percent)
0–12 months 91 4.47 87 9.6 105 85 26.6(45.7) (52.8)
12–24 months 147 6.50 73 21.5 50 86 38.9(72.8) (24.8)
24–39 months 120 7.15 73 8.7 32 59 36.7(77.4) (20.0)
Note: Numbers in parentheses are the share of the total sample.a Unemployed group not shown. Only three caregivers in the 0–1 year age group were unemployed only five in the1–2 year age group,and just three in the 2–3 age group.
maxwell chap10 5/9/0 8:25 PM Page 143
regard to marital status) is another important factor in the trade-off between workand care. The proportion of households reporting that they receive such assistancedrops from 87 percent in the first year to 73 percent in the second year for motherswho go back to work. The figure remains the same for nonworking mothers,however.The proportion of income from transfers is higher in the group with index childrenbetween 1 and 2 than it is for the group with children between 0 and 1—a some-what unexpected result. However, the proportions and actual amounts of transferincome are lower for households with working mothers than for households with non-working mothers. Given that the data are cross-sectional,identifying the cause andeffect relationship here is impossible. Either mothers go back to work because theyare getting less help from fathers and less transfer income, or help from fathers andtransfer income are lower because the mother is working (and presumed to be moreself-sufficient). Findings from women’s focus groups strongly suggest the former.
Many factors affect the trade-off between work, care, and nutritional status, in-cluding the place of work, the amount of time spent at work, and alternate sourcesof income, including assistance from the father of the child. But at root, the imper-ative of earning a livelihood is the deciding factor in whether and when a mother re-turns to work. One working mother with a year-old child summarized the situation:“If y ou are wealthy, or your husband is taking good care of you,you can even stay[off work] for three years. But things are now hard. I have to earn an income.”
Leverage Points for Inter vention
Constraints to livelihood security tend to fall into several categories: those relatedto household structure and assets,those related to income-generating activities,andthose related to the trade-offs just discussed. Some of these constraints suggestleverage points for intervention—either policy or programmatic. These are exploredfurther in Chapter 11. Constraints related to household structure revolve primarilyaround the availability of labor. Households with relatively limited labor resourcesor a high dependency ratio tend to have both low incomes and poor food securityand health and nutrition outcomes. Likewise, female-headed households (which tendto have fewer labor resources and higher dependency ratios) have relatively low in-comes and poor nutritional outcomes,although their spending priorities may protectfood security. Given these constraints,leverage points for either policy or programinterventions are limited, with a few exceptions,particularly interventions that in-creased labor productivity, especially those mentioned below.
Constraints related to income-generating activities revolve around education andskills, access to credit, the regulatory framework for work (especially informalwork), the availability of alternative forms of childcare, and the level of organiza-tion among independent microentrepreneurs. These constraints affect several groupsin particular: working mothers, the unemployed, unskilled laborers, petty traders,and street food vendors. Farmers in peri-urban areas are constrained by a separateset of factors—mainly rapid urban sprawl, environmental degradation, and land lawsregarding the loss of usufruct rights. These groups are among the most vulnerable
144
maxwell chap10 5/9/0 8:25 PM Page 144
identified during the study. With the exception of peri-urban farmers,many of themoverlap to a large degree with the groups identified with household structure con-straints—for example, female-headed households where the main occupational ac-tivity is petty trading and selling street foods. This set of constraints does lend itselfto intervention by either policy or programmatic means,or both,however. Education,skill training, credit for small enterprises,and creation of an enabling environmentfor small-scale trade are some examples.
The trade-offs discussed in this chapter also suggest leverage points for inter-vention. In terms of income generation, the strategy many mothers use—allocatingtime to work rather than to childcare—is clearly successful. In terms of child welfareoutcomes,however, it is not. But the trade-off is not straightforward: the relation-ship hinges not only on the mother’s work status,but on her workplace, the amountof financial assistance she receives from the father or from other sources,the avail-ability of alternative childcare, and on the child’s age. Most working mothers do notfeel they have any choice in the matter: the imperative to earn an income is para-mount. Without it, these women would be even less able to care for their children.This outcome has implications for women’s employment (and self-employment) andfor the provision of alternative childcare.
This analysis has shown that people deal with constraints to livelihoods in dif-ferent ways. Yet nearly every outcome analyzed here and many of the determinantsof these outcomes are related to poverty, income, employment,and the ability toearn a living. The links among poverty, food insecurity, and malnutrition are complexin the urban context, yet these relationships underpin much of urban life. This factwas underlined during one of the early community studies. After attempting to re-spond to the many questions posed about work, food security, care, and nutrition,one woman simply threw up her hands and said “shika, shika,shika!” (“[T he an-swer to all your questions is] money, money, money!”).
Clearly, the issues raised here can be addressed in many ways that do not relysolely on “money, money, money.” Policy-related interventions,for example, couldhelp create an environment that enables improved self-employment practices in thecity, without the injection of major amounts of money. But resources will be re-quired, both to operate programs and interventions and, given the findings about thedispersed and “hidden” nature of urban poverty, food insecurity, and malnutrition,to successfully identify deserving participants in those programs. The final chapterof this report makes recommendations and suggests priorities for policies andprograms.
145
maxwell chap10 5/9/0 8:25 PM Page 145
CHAPTER 11
Conclusions andPolicy Recommendations
The study sought to understand the nature of poverty, vulnerability, and food in-security in an urban setting, using both qualitative and quantitative research
methods. The preceding chapters have discussed the study’s methodology and pre-sented its findings. This concluding chapter addresses several questions presentedby the foregoing analysis. In the context of increasing urban poverty, who are par-ticularly vulnerable groups? What are the main sources of vulnerability? And, build-ing on the analysis in Chapter 9 and the leverage points noted in Chapter 10, whatcan be done to reduce vulnerability? These questions are applied to both policy andprogram interventions by the state, local government or municipality, and civil so-ciety organizations74 active in the urban context. The appendix builds on the analysisin Chapter 8 to create the indicators that are needed for effective targeting, moni-toring, and evaluation of the interventions suggested here.
Vulnerable Groups in Urban Settings
Previous research identified several groups that had been particularly hard hit by theeconomic changes that took place in Ghana during the 1980s and 1990s. The qual-itative research that preceded this study confirmed these findings. Four groups inparticular are considered to be highly vulnerable. The first group consists of low-income urban wage earners, who were hurt not only by the economic crisis but alsoby the reforms undertaken to counter it. Members of this group have seen their wageincome drop and their ability to earn a living through secondary self-employmentconstrained by high inflation, lack of access to credit, and a sometimes hostileregulatory environment (Ga Mashie Study Team 1996; Bortei-Doku Aryeetey andAryeetey 1996; Gayi 1995).
146
74 Civil society organizations include nongovernmental organizations (NGOs), community-based organizations,and the entire range of informal local organizations.
maxwell chap11 5/9/0 8:25 PM Page 146
The second group is the city’s indigenous Ga population. This group has beenidentified as vulnerable in part because of the loss of traditional livelihoods (fishingand farming),which are becoming increasingly difficult to maintain as the city ex-pands into formerly rural areas (Ngleshie-Amanfro Study Team 1996; Bortei-DokuAryeetey and Aryeetey 1996).75 The “new” urban poor make up the third group.This group emerged in the aftermath of the economic reforms and includes those re-cently “redeployed” (involuntarily retired or laid off) from the civil service (Gayi1995; Alderman,Canagarajah,and Younger 1994). The final group comprises house-holds headed by single women. This group is particularly vulnerable in terms ofincome, which tends to be low. It is also at serious risk in case of illness or injuryto the primary income earner, since such households are likely to have few wageearners (Bortei-Doku Aryeetey and Aryeetey 1996).
The results of the income analysis presented in this study confirm the vulnera-bility of these groups,with one exception. The number of households in the samplethat included a person redeployed within the past five years was very small—only26 households in the sample, or less than 5 percent of the total. The status of thisgroup cannot be adequately assessed with such a small number.76
This study has also suggested a number of other groups that must be consideredvulnerable. These include female-headed households; households with few assets,particularly labor; working women with children in the 0–2 age groups; and womenwith low educational levels. Households in all these groups are vulnerable largely be-causethey have so few assets,particularly human assets—that is, labor, education,and salable skills. For some groups,vulnerability is defined by the ability to earna livelihood (or, in the case of the unemployed, by the inability to do so). These cat-egories include farmers in the peri-urban areas of the city, where land is rapidly dis-appearing to nonagricultural uses; petty traders, particularly those in the centralbusiness district who are subject to harassment by city authorities; street food ven-dors; and unskilled laborers.77
Vulnerability f or still other livelihood groups revolves around the issues of pooremployment opportunities, lack of access to credit, and a regulatory environmentthat constrains the activities of the urban self-employed. One special group derivedfrom the analysis of household food security includes those who consume an ade-quate amount of food but spend a disproportionate part of their total income to ac-quire it. For this group,vulnerability is clearly the result of a low income combinedwith the trade-offs that accompany coping strategies. Several other categories not
147
75 Vulnerability is not simply a matter of ethnicity or place of birth, however. The indigenous population of Accrais evenly divided among all income groups (Table 60),yet the old indigenous communities are the locus of someof the worst poverty in the city. A complex combination of factors leads to this group’s vulnerability.76 This small number is almost certainly the result of the survey’s sampling strategy, which focused on householdsthat included a child under the age of three. The redeployment exercise has been running since the mid-1980s,andmany of those redeployed were middle-aged civil servants who were unlikely to have small children.77 Farmers in the peri-urban area constitute a special group,because their vulnerability revolves around the lossof usufruct land rights and the rapid expansion of the city.
maxwell chap11 5/9/0 8:25 PM Page 147
particularly identified by the survey but noted during qualitative fieldwork or by otherresearchers include street children (Apt van Ham,Blavo, and Opoku 1991),and atleast one other occupational group—the kayayoo or young migrant,female marketporters (Agarwal 1994).
Clearly, if an individual or household falls into more than one of these cate-gories,vulnerability increases. For example, a low-income female-headed indigenoushousehold in which the mother has to take a small child with her to work in the mar-ket is extremely vulnerable. Such combinations are unfortunately not uncommon inAccra.
Policy Interventions to Reduce Urban Vulnerability
Two preconditions must be met before governments,donor agencies,and others canbegin addressing vulnerability and poverty in urban areas. Results of interviews andworkshops with policymakers in Accra suggest that these preconditions may be moreimportant than the policy initiatives themselves. The first precondition is simplyaccepting that rapid urban growth is a fact of life in Sub-Saharan Afr ica. Neitheragriculture-led growth policies nor industrial decentralization policies have been suc-cessful in reversing the trend in urban growth,particularly of primary cities (Becker,Jamer, and Morrison 1994). The temptation to promote accelerated rural develop-ment to stem the tide of urban drift—and therefore the growth of urban poverty—remains strong. But the results of this study and others (OECD 1995) suggest thaturban problems cannot be dealt with by addressing rural issues.
The second precondition is recognizing that urban poverty exists. When this studybegan in 1996,poverty in Ghana was considered a predominantly rural problem.National governments must recognize that because of the rapid pace of urban pop-ulation growth and the increase in urban poverty, the problems this study has iden-tif ied are likely to intensify over time—both in Accra and in many other cities inSub-Saharan Afr ica. While urban areas are on average better off than rural areas,results of this and other studies show that cities are outpacing rural areas in popu-lation growth and that poverty, food insecurity, and malnutrition are increasing morerapidly. While rural-urban indicators of poverty may change only slowly, recognizingthe long-term trend is the first step in addressing this problem. Achieving a balancebetween rural and urban poverty alleviation initiatives is imperative.
For the foreseeable future, interventions aimed at reducing poverty throughtraditional measures such as food or cash transfers may be severely limited bybudgetary constraints. Therefore, interventions may need to incorporate indirectmeans of alleviating poverty, such as improving the capacity of the urban poor toearn a living. Designing these interventions requires an understanding of what isunique about urban livelihoods. This study has highlighted many singularities, in-cluding reliance on cash incomes,dependence on purchased foods,the importanceof labor and marketable skills as assets,and social relations among urban groups,among many others.
148
maxwell chap11 5/9/0 8:25 PM Page 148
Interventions at the National Level
To reduce overall poverty, a major national policy strategy must link urban growthand other economic issues. With adequate planning, urban population growth—which increases demand for many goods and services—can be a powerful force forspurring growth in agricultural production. The results of this study indicate, forinstance, that urban diets differ significantly from traditional rural diets. Urbanconsumption patterns have begun to favor predominantly imported rather than do-mestically grown staple foods. Some of the changes in consumption patterns are theresult of tastes and preferences associated with higher incomes. However, these pat-terns are also emerging among low-income households. As demands on women’stime increase, women are turning to time-saving foods that are relatively easy toprepare and cook.
To address this issue, Ghana needs to continue researching and developingprocessed foods derived from domestically produced foodstuffs—maize, yams,plan-tains,and cassava. Such foods are important if domestic food production is to meetthe majority of the country’s food needs in years to come. Similarly, domestic riceproduction,processing, and marketing must be expanded, and the quality of do-mestic rice will need to improve in order to compete with imports. This study did notinvestigate the policy trade-offs in national food security between increased do-mestic food production and exports plus increased food imports. This policy issuemust be addressed in light of the changes in urban dietary preferences noted here.
A second national poverty reduction strategy suggested by this study addresses theneeds of a range of vulnerable groups—female-headed households,working mothersand their children,and households short on labor. The study strongly indicates thatfor these groups,higher female educational levels are positively related both to in-creases in income and to improved child health and nutritional status. (The latterrelationship holds even after controlling for the effect of household income.) Theimplications of this result are clear: education for girls and women is a very goodinvestment because it reduces poverty in the future. Efforts to increase women’seducational levels can be accompanied by focused, relevant educational messageson childcare and child welfare—in particular, messages related to the importance ofbreast-feeding. These should include information about the importance of breast-feeding exclusively for a minimum of four months (and six if possible), avoidingprelacteal feedings,and not using water as a substitute for breast milk. These edu-cational messages need to be targeted to the health sector in general, not just toindividual mothers.
Policy Interventions at the City and Local Level
A special category of vulnerable groups in this study includes farmers and other in-habitants of peri-urban areas. In greater Accra, this group is composed largely butnot exclusively of indigenous people. The city’s rapid, uncontrolled expansion has
149
maxwell chap11 5/9/0 8:25 PM Page 149
resulted in landlessness,the loss of traditional livelihoods,and the creation of a newclass of urban poor from a group that was previously reasonably secure. Specificpolicy initiatives to address the problems these groups face include a land-use pol-icy for peri-urban areas; an environmental policy with enforcement capacity forquarrying, sand mining, and land reclamation; and compensation for displaced agri-cultural workers.
Virtually all the sprawl in Accra that leads to the rapid loss of farmland is causedby the construction of single-family dwellings on individual plots. Tax incentives forlow-cost,high-rise housing can slow this loss. For ecological and social reasons,some peri-urban land should be zoned for agricultural or greenbelt use in perpetu-ity. The construction boom in the city and the demand for building materials aredestroying large swathes of peri-urban land, because the mining of sand and eventopsoil is driven by an insatiable demand for construction and landscaping materi-als. The sand contractors rarely reclaim mined land, which is useless if it is notreclaimed. The peri-urban districts on their own are not able to control the practice,so the need for a firm national policy on licensing and land reclamation—withstrong enforcement mechanisms—is urgent. When land will inevitably be lost toagriculture because more space is required for urbanized land uses,farmers need tobe compensated for the loss of their livelihood. Current laws allow for compensationfor family land but make no provision for other categories of land or for nonindige-nous people.78 Compensation need not be in the form of cash. Other possibilitiesinclude retraining that will allow displaced farmers to enter other occupations andaccess to credit and technology that will allow them to stay in agriculture, but on amore commercial, intensified basis.
For other groups described above, the major forms of vulnerability revolve aroundpoor employment opportunities,lack of access to credit, and the regulatory environ-ment for self-employment. Both local government and civil society organizationshave roles to play in addressing these issues. For local governments,employmentand enhanced possibilities for self-employment are the first priorities for socialpolicy. Employment policies must take into account the attempts of low-incomeurban residents to diversify their incomes,gain access to credit, and work in a reg-ulatory environment where they are taxed at a fair rate and are free from harassmentby authorities.
The policy initiatives that will do most to enhance the potential for self-employment are in the regulatory sphere. Here again, certain preconditions apply.First, local governments must recognize the right of all Accra’s citizens to earn aliving, including in the informal economy. Historically, the municipal administra-tion in Accra (as in most other large Afr ican cities) has tended to view the informaleconomy as a problem to be solved rather than as a resource for dealing with theemployment problem. As a result,many informal entrepreneurs with few other ways
150
78 Family land is a special category of land tenure in the peri-urban area.
maxwell chap11 5/9/0 8:25 PM Page 150
to earn a living have been subjected to considerable harassment by municipalauthorities.
One of the major areas of contention is street vending. The streets are the bestplace for hawkers and vendors to sell their wares,but Accra’s city authorities blamethem for congestion in the central business district (see Chapter 4).79 The centralbusiness district, however, offers plentiful customers,relatively high prices,and rapidturnover. Traders must choose between a confrontation with the authorities there ortrading in their home neighborhood, where customers are fewer, turnover is slower,and profit margins are therefore lower. The trade-off between profits and relativesafety is one many traders are not willing to make. The government’s approach tothe problem—building new markets away from the city center (see Chapter 4)—hasthus far not been successful,since vendors are reluctant to move.
Several other possibilities for easing constraints on petty traders are available,however. One is to set aside certain areas of the central business district for pedes-trians and petty traders only—a possibility already under discussion. A second isstrengthening the capacity of nascent traders’ associations and working directly withtheir leaders. This approach would give political voice to the concerns of small-scale entrepreneurs and help develop self-regulatory mechanisms for informal tradeactivities. However, to date attempts to develop or strengthen such associations havecome almost exclusively from the top,and in some quarters the associations areviewed as the municipal administration in disguise.
Street foods are another source of regulatory concern. The metropolitan author-ities view street foods primarily as a source of food contamination and therefore asa threat to public health. But the issue of street foods is much more complex: streetfoods are also an important source of food for consumption,a key coping strategy,and a livelihood for a large number of women in Accra. The city cannot regulate thehygenic conditions of all street food vendors,as the number of vendors is too large.Further, there is no clear evidence that street foods should be singled out as a pub-lic health threat. Given the conditions under which some street foods are prepared,sold, and consumed, however, the authorities certainly have cause for concern. Localarea associations of street food vendors that can self-inspect and regulate hygienicconditions would be good for business and for public health,but forming such as-sociations will require the municipal authorities to take a different approach—onethat emphasizes participation and collaboration rather than control.
Promoting this type of approach requires a central body or roundtable where allparties can meet. In such a forum, policy issues can be raised, initiatives debated,and decisions taken openly and transparently with the participation of all stake-holders. This body should include not only the district assemblies but also occu-pational and consumer groups,organizations of civil society, and other interestedparties. While the local government has the final say over the regulatory environment,
151
79 The municipal police have other motives for harassing traders, including the extraction of petty payments.
maxwell chap11 5/9/0 8:25 PM Page 151
civil society organizations can complement government efforts to reduce poverty,primarily through programs that provide training, credit, assistance with managingmicrobusinesses,and alternative forms of childcare for working women. These or-ganizations also have an important role to play in advocating changes in the regu-latory environment and in the fundamental attitudes necessary to ensure the successof policy initiatives.
A final important component of poverty reduction in cities is the question ofsafety nets. This study did not directly address the issue of formal safety nets,al-though it did examine the informal safety net an enabling environment for self-employment would provide. However, important changes in other types of informalsafety nets—particularly interhousehold transfers—have implications for plannersof formal safety nets. And given the relatively low level of spatial clustering inhuman welfare outcomes in the city (including income, food security, health andnutritional status of children,and child mortality), any approach to safety nets shouldbe based on a household or occupational targeting approach, not geographic target-ing. This point has major implications for programming. Low-income areas willstill be a priority. But mechanisms are needed to identify the truly vulnerable wher-ever they live and work in the urban area. Such targeting and monitoring systemscan be very simple. This study developed a set of indicators that can be used todevelop both targeting and monitoring mechanisms (see the Appendix).
Accra, like many other cities in the West Afr ican region, is growing at a rapidpace and is experiencing a rapid increase in poverty levels and deterioration in indi-cators of nutritional status. Trends in poverty and malnutrition show that the problemsidentified by this study are likely to intensify over the coming two decades—con-clusions broadly echoed by the West Afr ica Long-Term Perspectives Study (OECD1995). These same trends can be observed in many cities, but the results of thisstudy indicate that governments and civil society organizations can act to reducepoverty in cities and to mitigate the worst impacts of rapid urbanization on the vul-nerable. Demographic trends alone will increasingly shift the locus of these problemsinto urban areas over the next 20 years. The time to begin to deal with the problemsof urban livelihoods,poverty, food insecurity, poor health,and malnutrition is now.
152
maxwell chap11 5/9/0 8:25 PM Page 152
APPENDIX
Indicators of Urban Vulnerabilityand Food and Nutrition Insecurity
This study used several categories of indicators that summarize a variety of fac-tors related to outcomes and that can be used to identify vulnerable groups.
Creating some of these indicators require expensive and time-consuming surveymethodology. But a number of proxy indicators were developed for this study thatrequire less time and expense. These indicators can help in identifying vulnerablegroups for targeting purposes and in monitoring the impact of interventions on suchgroups. They fall into several general categories: demographic, livelihood, incomeand expenditure, food security, and health and nutrition. They are briefly describedhere, but more complete descriptions can be found in Accra Study Team (1998) andin the various citations mentioned below.
Demographic Indicators
The major demographic indicators used here are household headship, age structureand the dependency ratio, available labor in the household, and education. These in-dicators all define significant factors in household vulnerability. For the most part,however, there is no simpler way to acquire the necessary information about thesecharacteristics than by using the standard survey methodology described in Chap-ter 2 and in Annex 1 of Accra Study Team (1998). For targeting purposes, however,the indicators are simple to use. For instance, monitoring who is dropping out ofschool and for what reasons is a good way to identify households in crisis, if mon-itoring can be done at the local primary school level.
Livelihood Indicators
The main outcome measure for livelihood security is income, which for the purposesof this study was taken as reported expenditure. Other indicators include assets(human, financial, physical, and social), measures of income diversification, theprimary income-generating activity of the head of household, and maternal work
153
maxwell appendix 5/9/0 8:24 PM Page 153
status and place of work. At a more aggregated level, the level of unemploymentand the ratio of workers in the formal and informal sectors of the urban economywere taken as indicators. Total per capita expenditure was the main proxy measureof income at the household level. (Gathering this information is time-consumingand expensive and thus is not useful for targeting or program monitoring purposes).
A simple index of housing environment and consumer durable possessions wasalso developed for this study (Accra Study Team 1998). This index is similar to theasset indexes used in many other studies. It worked reasonably well and is relativelyeasy to duplicate. Not only does it directly capture the issue of assets,it correlatesreasonably well with per capita income (r = 0.514) and can distinguish expendituregroups. Qualitative measures,particularly livelihood profiles,present an alternativeindicator. As noted in Chapter 4,however, in this study they sometimes gave resultsthat differed from the surveys.
Food, Security, Health, and Care
The traditional food security indicator of caloric availability outlined in Chapter 5requires an enormous amount of time and expense to construct, and it is furthercomplicated if combined with food budget shares. This study experimented with analternative measure of household food security that is based on the frequency andseverity of coping strategies. It worked reasonably well, particularly for ruling outcases—that is, for identifying households in vulnerable groups that are not food in-secure. This method is described in great detail in Maxwell et al. (1999).
A complete child and maternal health recall was beyond the means even of thisstudy, so only some information on recent episodes of illness was collected. How-ever, the study experimented with the health visual analog scale described in Chap-ter 6. In the absence of a complete morbidity recall,determining the accuracy of thisvery quick and inexpensive method for estimating longer-term health status is im-possible. However, it correlates well with expected determinants of health,categoriesof care, and health-seeking behaviors and is significantly related to nutritional status.Further trials of this method in other urban studies of care and nutrition are planned.The indicators of care are complex to compile, but on the whole, maternal educationwas the best predictor of children’s care status.
Nutr itional Status
There are no good measures of nutritional status other than child and maternalanthropometry—particularly child height for age. Although collecting the data in-volves extensive training and field supervision, the information is easy to compileand process. Maternal body mass index (BMI) is not a good indicator of child nu-tritional status and especially not of household food security outcomes. However,weight-for-age Z-scores are a reasonable proxy for height-for-age Z-scores (r =0.736; R2 = 0.541) when the score is the sole variable used to predict height for age.
154
maxwell appendix 5/9/0 8:24 PM Page 154

This point is important,for two reasons. First,measuring the weight of young chil-dren does not require the same high degree of staff training and supervision asmeasuring height or length. Second, the maternal and child health mobile clinics inthe city are already screening on the basis of weight for age, so some systems arealready in place.
155
maxwell appendix 5/9/0 8:24 PM Page 155
References
Accra Study Team. 1998. Promoting urban food and nutrition security for the vul-nerable in the greater Accra metropolitan area. Technical report to the WorldHealth Organization. International Food Policy Research Institute, Washington,D.C., and Noguchi Memorial Institute for Medical Research, Legon, Ghana.Photocopy.
Acquah, I. 1958. Accra survey: A social survey of the capital of Ghana (GoldCoast), 1953–1956.Accra: University of Ghana Press.
Aforo, A. 1997. Report of the miniconsultation on street trading and hawking inAccra. Accra Sustainable Programme, Accra. Photocopy.
Agarwal, S. 1994. Bearing the weight: The Kayayoo—Ghana’s working girl child.United Nations Children’s Fund, Accra. Photocopy.
Akpedonu, P. 1996. Persistent diarrhea in Ghana. Progress report to Japan Interna-tional Cooperation Agency. Noguchi Memorial Institute for Medical Research,Legon, Ghana. Photocopy.
———. 1998. Progress report: Food contamination study. Noguchi Memorial In-stitute for Medical Research, Legon, Ghana.
Alderman, H. 1989. New research on poverty and malnutrition: What are the impli-cations for research and policy? Paper presented at the World Bank–InternationalFood Policy Research Institute Conference on Poverty, Airlie House, October25–28. World Bank, Washington, D.C.
———. 1990. Nutritional status in Ghana and its determinants.Policy AnalysisWorking Paper 3. Washington, D.C.: World Bank.
———. 1994. Ghana: Adjustment’s star pupil? In Adjusting to policy failure inAfrican economies,ed. D. Sahn. Ithaca, N.Y., U.S.A.: Cornell University Press.
156
maxwell references 5/9/0 8:23 PM Page 156
Alderman,H., and M. Garcia. 1993. Poverty, household food security, and nutritionin rural Pakistan.Research Report 96. Washington,D.C.: International FoodPolicy Research Institute.
Alderman,H., and P. Higgins. 1992. Food and nutritional adequacy in Ghana.Work-ing Paper 27. Washington,D.C.: Cornell Food and Nutrition Policy Program.
Alderman,H., and G. Shively. 1996. Economic reform and food prices:Evidencefrom markets in Ghana. World Development24 (3):521–534.
Alderman,H., S. Canagarajah,and S. Younger. 1994. Consequences of permanentlayoff from the civil service: Results from a survey of retrenched workers inGhana. In Rehabilitating government:Pay and employment reform in Africa, ed.D. Lindauer and B. Nunberg. Washington,D.C.:World Bank.
Amis, P. 1995. Making sense of urban poverty. Environment and Urbanization 7(1): 145–157.
Amis, P., and C. Rakodi. 1994. Urban poverty: Issues for research and policy. Jour-nal of International Development6 (5):627–634.
Apt van Ham,N., E. Q. Blavo, and S. K. Opoku. 1991. Street children in Accra:A survey report. Department of Sociology Report, University of Ghana,Legon.Photocopy.
Armar, M. A. 1989. Maternal energy status, lactational capacity and infant growthin rural Ghana:A study of the interactions of cultural and biological factors.Ph.D. dissertation. University of London.
Armar-Klemesu,M. 1996. Nutrition and persistent diarrhoea in childhood:A studyof interactions and outcomes. Progress Report to the Japan International Coop-eration Agency. Noguchi Memorial Institute for Medical Research, Legon,Ghana. Photocopy.
Armar-Klemesu,M., and D. Maxwell. 1998. Urban agriculture in the Greater AccraMetropolitan Area. Technical report to the International Development ResearchCentre. Noguchi Memorial Institute for Medical Research, Legon, Ghana.
Asenso-Okyere, W. K., F. A. Asante, and M. Nubé. 1997. Understanding the healthand nutritional status of children in Ghana. Agricultural Economics17 (1):59–74.
Atkinson,S. 1992. Food for the cities:Urban nutrition policy in developing coun-tries. Urban Health Program,Health Policy Unit. Department of Public Healthand Policy, London School of Hygiene and Tropical Medicine, London.
157
maxwell references 5/9/0 8:23 PM Page 157
Atkinson, S. 1995. Approaches and actors in urban food security in developingcountries. Habitat International 19 (2):151–163.
Austin,J. E.,et al.1976. Urban malnutrition—Problem assessment and interventionguidelines.Washington,D.C.:World Bank.
Baah-Nuakoh,A. 1996. Enhancing the role of the informal sector in the Ghanaianeconomy. FASS Bulletin:Faculty of Social Studies1 (1):1–17.
Baker, J., and P. Ove Pedersen. 1992. The rural-urban interface in Africa. Uppsala:The Scandinavian Institute of Afr ican Studies.
Barker, D. J. P. 1994. Mothers,babies,and disease in later life. London:British Med-ical Journal Publishing Group.
Bates,R. 1981. Markets and states in tropical Africa. Berkeley, Calif., U.S.A.: Uni-versity of California Press.
Beaton, G. H. 1983. Energy in human nutrition: Perspectives and problems. Nutri-tion Review 41 (11):325–340.
———. 1993. Which age group should be targeted for supplementary feeding? InNutritional issues in foreign aid. ACC/SCN Symposium Report Nutrition PolicyDiscussion Paper No. 12. Geneva:ACC/SCN.
Becker, C., A. Jamer, and A. Morrison. 1994. Beyond urban bias in Africa. Ports-mouth,N.H., U.S.A.: Heinemann.
Behrman,J. R., and A. B. Deolalikar. 1988. Health and nutrition. In Handbook ofdevelopment economics,vol. 1,ed. H. Chenery and T. N. Srinivasan. Amsterdam:Elsevier.
Behrman,J., and B. L. Wolfe. 1984. More evidence on nutrition demand. Journalof Development Economics14 (1–2):105–128.
———. 1997. How does mother’s schooling affect the family’s health,nutrition,medical care usage and household sanitation? Journal of Econometrics 36:185–204.
Benneh,G., J. Songsore, J. Nabila, A. T. Amuzu, K. A. Tutu,Y. Yangyuoru, andG. McGranahan. 1993. Environmental problems and the urban household in theGreater Accra Metropolitan Area,Ghana.Stockholm: Stockholm EnvironmentInstitute.
158
maxwell references 5/9/0 8:23 PM Page 158
Bennett S., T. Woods,W. M. Liyanage, and D. L. Smith. 1991. A simplified generalmethod for cluster-sample surveys of health in developing countries. World HealthStatistics Quarterly 44 (1):98–106.
Bentley, M. E., M. M. Black, and E. Hurtado. 1995. Child-feeding and appetite:What can programmes do? Food and Nutrition Bulletin16 (4):340–348.
Bicego, T. G., and J. T. Boerma. 1993. Maternal education and child survival: Acomparative study of survey data from 17 countries. Social Science and Medicine36: 1207–1227.
Blau, D. M., D. K. Guilkey, and B. M. Popkin. 1996. Infant health and the laboursupply of mothers. Journal of Human Resources31 (1):90–139.
Boateng, E. Oti, K. Ewusi,R. Kanbur, and A. McKay. 1992. A poverty profile forGhana,1987–88. Journal of African Economies1 (1):25–58.
Bortei-Doku Aryeetey, E., and E. Aryeetey. 1996. An urban perspective on povertyin Ghana:A case study of Accra. Report commissioned by the Canadian Inter-national Development Agency, Accra.
Boughton,D., and T. Reardon. 1997. Will promotion of coarse grain processing turnthe tide for traditional cereals in the Sahel? Recent empirical evidence fromMali. Food Policy 22 (4):307–316.
Bound, J., D. Jaeger, and R. Baker. 1995. Problems with instrumental variablesestimation when the correlation between the instruments and the endogenousexplanatory variable is weak. Journal of the American Statistical Association 90(430):443–450.
Braun,J. von, J. McComb, B. Fred-Mensah,and R. Pandya-Lorch. 1993. Urbanfood insecurity and malnutrition in developing countries: Trends,policies,andresearch implications. Washington,D.C.: International Food Policy ResearchInstitute.
Brown, L. R., and J. Kerr. 1997. Ghana:Structural adjustment’s star pupil? In Thegender dimensions of economic reforms in Ghana,Mali and Zambia,ed. L. Brownand J. Kerr. Ottawa,Ontario, Canada:North-South Institute.
Brown , L. R., and J. Kerr, eds. 1997. The gender dimensions of economic reformin Ghana,Mali, and Zambia.Ottawa,Ontario, Canada:North–South Institute.
Bruce, J., and C. B. Lloyd. 1997. Finding the ties that bind: Beyond headship and household. In Intrahousehold resource allocation in developing countries:
159
maxwell references 5/9/0 8:23 PM Page 159
Models,methods,and policy, ed. L. Haddad, J. Hoddinott, and H. Alderman.Baltimore, Maryland, U.S.A.: Johns Hopkins University Press for the Interna-tional Food Policy Research Institute.
Brydon,L., and K. Legge. 1996. Adjusting society:The World Bank,the IMF, andGhana.London:Taurus Academic Studies.
Burch, T. K., et al. 1987. Measures of household composition and headship basedon aggregate routine census data. In Family demography: Methods and their ap-plication, ed. J. Bongaarts,T. K. Burch, and K. W. Wachter. Oxford: ClarendonPress.
Caldwell, J. C.,and P. McDonald. 1982. Influence of maternal education on infantand child mortality: Levels and causes. Health Policy and Education 2: 251–267.
Cebu Study Team. 1992. A child health production function estimated from longi-tudinal data. Journal of Development Economics38 (2):323–351.
CENCOSAD (Centre for Community Studies,Action, and Development). 1994.Urban market gardens in Accra.Accra.
Chambers, R. 1989. Sustainable rural livelihoods:A key strategy for people, envi-ronment and development. In The greening of aid, ed. C. Conroy and M. Litvi-noff. London:Earthscan.
Chambers,R., and G. Conway. 1992. Sustainable rural livelihoods:Practical con-cepts for the 21st century. Institute of Development Studies Discussion Paper296. Brighton,U.K.: Institute of Development Studies,University of Sussex.
Chaudhri, R., and C. Timmer. 1986. The impact of changing affluence on diet anddemand patterns for agricultural commodities.World Bank Staff Working Paper785. Washington,D.C.:World Bank.
Christiansen,G. 1993. Sensitive information: Collecting data on livestock and in-formal credit. In Fieldwork in developing countries,ed. S. Devereux and J. Hod-dinott. Boulder, Colo.,U.S.A.: Lynne Rienner Publishers.
Chung, K., L. Haddad, J. Ramakrishna,and F. Riely. 1997. Identifying the food in-secure. The application of mixed-method approaches in India.Washington,D.C.:International Food Policy Research Institute.
Cohen,R., K. H. Brown, J. Canahuati, L. L. Rivera, and K. G. Dewey. 1995. De-terminants of growth from birth to 12 months among breast-fed Honduran in-fants in relation to age of introduction of complementary foods. Pediatrics 96(3): 504–510.
160
maxwell references 5/9/0 8:23 PM Page 160
Commander, S., J. Howell, and W. Seini. 1989. Ghana. In Structural adjustment andagriculture: Theory and practice in Africa and Latin America,ed. S. Commander.London:Overseas Development Institute.
Cornia, G., R. Jolly, and F. Stewart. 1987. Adjustment with a human face. Oxford:Clarendon Press.
Coulomb, H., and A. McKay. 1995. An assessment of trends in poverty in Ghana:1988-92.PSP Discussion Paper 81. Washington,D.C.:World Bank.
Cox, D., and E. Jimenez. 1990. Achieving social objectives through private trans-fers:A review. The World Bank Research Observer 5 (2):205–218.
———. 1998. Risk sharing and private transfers: What about urban households?Economic Development and Cultural Change 46 (3):621–637.
Davies,S. 1996. Adaptable livelihoods.New York: St. Martins Press.
Deaton,A. 1997. The analysis of household surveys:A microeconometric approachto development policy. Washington,D.C.:World Bank.
de Haan,A. 1997. Urban poverty and its alleviation: Introduction. IDS Bulletin28(2): 1–8.
de Waal,A. 1989. Famine that kills: Darfur, Sudan,1984-1985.Oxford: ClarendonPress.
Delgado,C., and T. Reardon. 1987. Policy issues raised by changing food patternsin the Sahel. In Cereal policies in Sahel countries: Acts of the Mindelo Confer-ence, ed. CILSS/Club du Sahel. Paris: CILSS/Club du Sahel/OECD.
Demery, L., and L. Squire. 1996. Macroeconomic adjustment and poverty in Afr ica:An emerging picture. World Bank Research Observer 11 (1):39–59.
Drakakis-Smith,D. 1991. Urban food distribution in Afr ica and Asia. Geographi-cal Journal 157 (1):51–61.
Dugdale, A. E.,and P. Payne. 1987. A model of seasonal changes in energy balance.Ecology of Food and Nutrition 19: 231–245.
Duncan C.,K. Jones,and G. Moon. 1993. Do places matter? A multilevel analysisof regional variations in health-related behaviour in Britain. Social Science andMedicine37 (6):725–733.
161
maxwell references 5/9/0 8:23 PM Page 161
Edmundson,W. C.,and P. V. Sukhatme. 1990. Food and work: Poverty and hunger.Economic Development and Cultural Change 38 (2):263–280.
Engle, P. 1986. The intersecting needs of working mothers and their children:1980to 1985. Department of Psychology and Human Development,California Poly-technic State University, San Luis Obispo,Calif., U.S.A.
———. 1989. Childcare strategies of working and nonworking women in ruraland urbanGuatemala. In Women’s work and child welfare in the Third World,ed. M. Paolisso and M. Buvinic. Boulder, Colo.,U.S.A.; Westview.
———. 1992. Care and child nutrition. Theme paper for the International Nutri-tion Conference. New York: United Nations Children’s Fund.
Engle, P. L., P. Menon,and L. Haddad. 1996. Care and nutrition: Concepts andmeasurement. Food Consumption and Nutrition Division Discussion Paper 18.International Food Policy Research Institute, Washington,D.C.
———. 1997.Care and nutrition: Concepts and measurements.Washington,D.C.:International Food Policy Research Institute.
Engle, P., P. Menon,J. L. Garrett,and A. Slack. 1997. Urbanization and caregiving:A framework for analysis and examples from southern and eastern Afr ica. Envi-ronment and Urbanization 9 (2):253–270.
———. FAO (Food and Agriculture Organization of the United Nations). 1996.Street food situation in Ghana.Accra/Rome.
———. 1997. Street foods.Food and Nutrition Paper 63. Report of an FAO Tech-nical Meeting on Street Foods,Calcutta,India,November 6–9. Rome.
Fayorsey, C. 1995. Ga women’s autonomy: A critique of the concepts and economyof the household and family. African Anthropology 2 (1):91–130.
Frankenberger, T. 1996. Measuring household livelihood security: An approach forreducing absolute poverty. Paper presented to the Applied Anthropology Meet-ings,Baltimore, Md.
Freeman,D. 1991. A city of farmers: Informal urban agriculture in the open spacesof Nairobi, Kenya. Toronto,Canada:McGill University Press.
Ga Mashie Study Team. 1996. Ga Mashie:A participatory rapid appraisal of foodsecurity in a densely populated urban community. Noguchi Memorial Institute
162
maxwell references 5/9/0 8:23 PM Page 162
for Medical Research/CENCOSAD/International Food Policy Research Insti-tute, Accra.
García,M., and P. Pinstrup-Andersen. 1987. The pilot food price subsidy schemein the Philippines:Its impact on income, food consumption,and nutritional sta-tus.Research Report 61. Washington,D.C.: International Food Policy ResearchInstitute.
Gayi, S. 1995. Adjusting to the social costs of adjustment in Ghana:Problems andprospects. European Journal of Development Research 7 (2):77–100.
Gebre, S. 1993. Urban poverty and food insecurity: The case of Addis Ababa.Famine and Food Policy Discussion Paper 8. International Food Policy ResearchInstitute, Washington,D.C.
Ghana,Government of. 1996. The national plan of action on food and nutrition.Accra.
Ghana,MLG (Ministry of Local Government). 1992. Strategic plan for the GreaterAccra Metropolitan Area.Volume 1. Context report.Accra:Department of Townand Country Planning.
Ghana,MOH (Ministry of Health). 1989. Improving young child feeding practicesin Ghana. Assessment and strategy design:A summary of activities. Accra.
GSS (Ghana Statistical Service). 1989. Demographic and health survey 1988.Accra: Government of Ghana.
———. 1994. Demographic and health survey 1993.Accra:Government of Ghana.
Gibson,R. S. 1990. Principles of nutritional assessment.New York and Oxford:Oxford University Press.
Goldstein H. 1995. Multilevel statistical models,2d ed. London:Edward Arnold.
Habicht, J. P., and D. L. Pelletier. 1990. The importance of context in choosing nu-tritional indicators. Journal of Nutrition 120 (11):1519–1524.
Haddad, L. 1992. The impact of women’s employment status on household food se-curity at different income levels in Ghana. Food and Nutrition Bulletin14 (No. 4):341–344.
Haddad, L., E. Kennedy, and J. Sullivan. 1994. Choice of indicators for food secu-rity and nutrition monitoring. Food Policy 19 (3):329–343.
163
maxwell references 5/9/0 8:23 PM Page 163
Haddad, L., M. Ruel, and J. Garrett. 1999. Are urban poverty and undernutritiongrowing? Some newly assembled evidence. Food Consumption and NutritionDivision Discussion Paper 63. International Food Policy Research Institute,Washington,D.C.
Haddad, L., S. Bhattarai, M. Immink, and S. Kumar. 1996. Managing interactionsbetween household food security and preschooler health.Food, Agriculture, andthe Environment Discussion Paper 16. Washington,D.C.: International FoodPolicy Research Institute.
Hammer, J. 1986. Population growth and savings in LDCs:A survey. World Devel-opment14: 579–591.
Handa,S. 1996. Expenditure behavior and children’s welfare:An analysis of female-headed households in Jamaica. Journal of Development Economics50 (1):165–187.
Hardoy, J., and D. Satterthwaite. 1986. The illegal and the reasonable. Development:Seeds of Change 14 (1):61–64.
Harriss,J., K. P. Kannan,and G. Rodgers. 1990. Urban labour market structure andjob access in India:A study of Coimbatore. Geneva: International Institute forLabour Studies.
Hart, K. 1973. Informal income opportunities and urban employment in Ghana.Journal of Modern African Studies2 (1):61–89.
Haughton,D., and J. Haughton. 1997. Explaining child nutrition in Vietnam. Eco-nomic Development and Cultural Change 45 (3):541–556.
Housing and Urban Development Associates. 1990. Housing needs assessmentstudy. Study prepared for Accra Planning and Development Programme. Accra.Photocopy.
Huffman, S. L. 1987. Women’s activities and impacts on child nutrition. In Foodpolicy: Integrating supply, distribution and consumption,ed. J. Price Gittinger,J. Leslie, and C. Hoisington. Economic Development Institute Series in Eco-nomic Development. Washington D.C.:World Bank.
ICN (International Conference on Nutrition). 1993. Plan of action for nutrition.Rome:Food and Agriculture Organization of the United Nations/World HealthOrganization.
IDECG (International Dietary Energy Consultative Group). 1994. Energy and pro-tein requirements.Proceedings of a workshop held at the London School of
164
maxwell references 5/9/0 8:23 PM Page 164
Hygiene and Tropical Medicine, London,ed., N. S. Scrimshaw, J. C. Waterlow,and B. S. Church. European Journal of Clinical Nutrition 50 (February 1996).
ILO (International Labour Organization). 1972. Employment,income, and inequality:A strategy for increasing productive employment in Kenya. Geneva.
———. 1990a. Strategies for employment creation in Africa. Geneva.
———. 1990b. Employment crisis and prospects in Africa: Strategies and optionsfor the future. Addis Ababa:Jobs and Skills Programme for Afr ica.
ISSER (Institute of Statistical, Social and Economic Research). 1995. The state ofthe Ghanaian economy, 1994.Legon,Ghana.
———. 1996. The state of the Ghanaian economy, 1995.Legon,Ghana.
———. 1997. The state of the Ghanaian economy, 1996.Legon,Ghana.
Jonsson,U. 1995. Ethics and child nutrition. Food and Nutrition Bulletin 16 (4):293–312.
Jonsson,U., and D. Toole. 1991. Household food security and nutrition: A concep-tual analysis.New York: United Nations Children’s Fund.
Kennedy, E., and B. Cogill. 1987. Income and nutritional effects of the commercial-ization of agriculture in Southwestern Kenya. Research Report 63. Washington,D.C.: International Food Policy Research Institute.
Kennedy, E., and T. Reardon. 1994. Shift to non-traditional grains in the diets ofEast and West Afr ica:Role of women’s opportunity cost of time. Food Policy 19(1): 45–56.
Kennedy, E., E. Payongayong, L. Haddad, T. Tshibaka,R. Agble, and R. Tetebo.1994. Impacts of credit programs on food security and nutrition in Ghana. In-ternational Food Policy Research Institute, Washington,D.C. Photocopy.
Kilson, M. 1974. African urban kinsmen:The Ga of Central Accra. London:HurstPublishers.
Kraus,J. 1988. The political economy for food in Ghana. In Coping with Africa’sfood crisis, ed. N. Chazan and T. Shaw. Boulder, Colo., U.S.A., and London:Lynne Rienner.
Kumar, S., R. Naved, and S. Bhattarai. 1997. Childcare practices associated with pos-itive and negative nutritional outcomes for children in Bangladesh:A descriptive
165
maxwell references 5/9/0 8:23 PM Page 165
analysis. Food Consumption and Nutrition Division Discussion Paper 24. Inter-national Food Policy Research Institute, Washington,D.C.
Larbi,W. O. 1995. The urban land development process and urban land policies inGhana.London:Royal Institute of Chartered Surveyors.
Leslie, J. 1989. Women’s work and child nutrition and the Third World. In Women’swork and child welfare in the Third World, ed. M. Paolisso and M. Buvinic. Boul-der, Colo. U.S.A.: Westview.
Levin, C. E.,D. G. Maxwell, M. Armar-Klemesu,M. T. Ruel,S. S. Morris, andC. Ahiadeke. 1999. Working women in an urban setting:Traders, vendors, andfood security in Accra. World Development27 (11):1977–1991.
Leys, C. 1975. Underdevelopment in Kenya. Los Angeles,Calif.: University ofCalifornia Press.
Liang, K.-Y., and S. L. Zeger. 1986. Longitudinal data analysis using generalizedlinear models. Biometrika 73 (1):13–22.
Lipton, M. 1977. Why poor people stay poor. Cambridge, Mass.,U.S.A.: HarvardUniversity Press.
Lipton, M., and S. Maxwell. 1992. The new poverty agenda:An overview. IDS Dis-cussion Paper 306. Brighton,U.K.: Institute of Development Studies,Universityof Sussex.
Lloyd, C. B., and A. J. Gage-Brandon. 1993. Women’s role in maintaining house-holds:Family welfare and sexual inequality in Ghana. Population Studies47 (1):115–131.
Loxley, J. 1990. Structural adjustment in Afr ica:Reflections on Ghana and Zambia.Review of African Political Economy 47: 8–27.
Lund, S., and M. Fafchamps. 1997. Risk sharing networks in rural Philippines.Stanford University, Stanford, Calif., U.S.A. Photocopy.
Mabogunje, A. 1994. Overview of research priorities in Afr ica. In Urban researchin the developing world, ed. R. Stren,vol. 2: Africa. Toronto:Centre for Urbanand Community Studies,University of Toronto.
Maxwell, D. 1995. Alternative food security strategy: A household analysis ofurban agriculture in Kampala. World Development23 (10):1669–1681.
166
maxwell references 5/9/0 8:23 PM Page 166
———. 1996. Methodological supplement to the PRA reports: Ga Mashie andNgleshie-Amanfro. Legon, Ghana:Noguchi Memorial Institute for MedicalResearch.
———. 1998a. Can qualitative and quantitative methods serve complementary pur-poses for policy research? Evidence from Accra. Food Consumption and Nutri-tion Division Discussion Paper 40. International Food Policy Research Institute,Washington,D.C.
———. 1998b. The political economy of urban food security in Sub-Saharan Afr ica.Food Consumption and Nutrition Division Discussion Paper 41. InternationalFood Policy Research Institute, Washington,D.C..
———. 1999. Livelihoods and vulnerability: How different is the urban case? Paperpresented to the Annual Meeting of the Society for Applied Anthropology, Tuc-son,Arizona,April 20–24.
Maxwell D, C. Levin, and J. Csete. 1999. Does urban agriculture help preventmalnutrition? Evidence from Kampala.Food Policy 23 (5).:411–424
Maxwell, D., M. Armar-Klemesu,L. Brakohiapa, and J. Annorbah-Sarpei. 1997.Participatory concept mapping to understand perceptions of urban malnutrition.PLA Notes 30 (October):11–16.
Maxwell, D., W. O. Larbi, S. Zakariah, G. M. Lamptey, and M. Armar-Klemesu.1998. Farming in the shadow of the city:Changes in land rights and livelihoodsin peri-urban Accra. Cities Feeding People Programme Paper 23. Ottawa,Canada:International Development Research Centre.
Maxwell, D., C. Ahiadeke, C. Levin, M. Armar-Klemesu,S. Zakariah, and G. M.Lamptey. 1999. Alternative food security indicators: Revisiting the frequencyand severity of ‘coping strategies’. Food Policy 24 (4):411–424.
Maxwell, S. 1996. Food security: A postmodern perspective. Food Policy 21 (2):155–170.
Maxwell, S., and T. R. Frankenberger. 1992. Household food security: Concepts,in-dicators,measurements:A technical review. New York and Rome:United NationsChildrens Fund and International Fund for Agricultural Development.
Mensah,P., M. Armar-Klemesu, D. Yeboah-Many, A. Ablordey, K. Rikimaru,K. Taniguchi, F. Nkrumah,and H. Kamiya. 1995. Microbial quality of infant foodsfrom peri-urban Ghana. African Journal of Health Sciences2 (2):277–280.
167
maxwell references 5/9/0 8:23 PM Page 167
Mingione, E. 1991. Fragmented societies.Oxford: Basil Blackwell.
Morris, S. S., S. N. Cousens,B. R. Kirkwood, P. Arthur, and D. A. Ross. 1996. Isdiarrhea prevalence a better predictor of subsequent mortality and weight gainthan diarrhea incidence? American Journal of Epidemiology 144 (6):582–588.
Morris, S. S., C. E. Levin, M. Armar-Klemesu,D. Maxwell, and M. T. Ruel. 1999.Does geographic targeting of nutrition intervention make sense in cities? Evi-dence from Abidjan and Accra. World Development21 (11):2011–2019.
Moser, C. 1995. Urban social policy and poverty reduction. Environment and Ur-banization (7) 1:159–171.
———. 1996. Confronting crisis. A comparative study of household responses topoverty and vulnerability in four poor urban communities. EnvironmentallySustainable Development Studies and Monographs Series 8. Washington,D.C.:World Bank.
Mosley, W. H., and L. C. Chen. 1984. An analytical framework for the study of childsurvival in developing countries. In Child survival: Strategies for research, ed.W. H. Mosley and L. C. Chen. Population and Development Review 10 (Supple-ment):25–45.
Mougeot,L. 1994. Afr ican city farming from a world perspective. In Cities feedingpeople:An examination of urban agriculture in East Africa, ed. A. Egziabher.Ottawa: IDRC Books.
Multicountry Program 14 Team. 1997. Urban challenges to food and nutrition se-curity. Research proposal and issues. Food Consumption and Nutrition Division,International Food Policy Research Institute, Washington,D.C. Photocopy.
Mwangi, A. 1995. The role of urban agriculture for food security in low-incomeareas in Nairobi. Leiden:Afr ican Studies Centre.
Nago, M. C.,J. D. Hounhouigan,F. de Koning, and R. Gross. 1996. La situation al-imentaire et nutritionnelle dans les zones urbaines en Afrique. Actes du Semi-naire-Atelier tenu a Cotonou (Bénin) du 14 au 18 juin 1993. Cotonou,Bénin:Centre National de Production de Manuels Scolaires.
Naylor, R., and W. Falcon. 1995. Is the locus of poverty changing?Food Policy 20(6): 501–518.
Ngleshie-Amanfro Study Team. 1996. Ngleshie Amanfro: A participatory rapid ap-praisal of food security in a peri-urban community. Noguchi Memorial Institutefor Medical Research/International Food Policy Research Institute, Accra.
168
maxwell references 5/9/0 8:23 PM Page 168
Norton,A., E. Bortei-Doku Aryeetey, D. Korboe, and D. K. T. Dogbe. 1995. Povertyassessment in Ghana using qualitative and participatory research methods.World Bank Poverty and Social Policy Department. Discussion Paper Series 83.Washington,D.C.:World Bank
O’Connor, A. 1983. The African city. London:Hutchinson.
OECD (Organisation for Economic Co-operation and Development). 1995. WestAfrican long-term perspectives study. Paris: OECD/Club du Sahel.
Onibokun,A. 1994. Urban research in Anglophone West Afr ica:Towards an agendafor the 1990s. In Urban research in the developing world, ed. R. Stren,vol. 2:Africa. Toronto,Canada:Centre for Urban and Community Studies,Universityof Toronto.
Payne, P. 1990. Themes in food security: Measuring malnutrition. IDS Bulletin21(3): 14–30.
Portes,A., M. Castells,and L. A. Benton. 1989. The informal economy. Baltimore,Md., U.S.A.: Johns Hopkins University Press.
Randolph,T. 1997. Rice demand in the Sahel. In Ir rigated rice in the Sahel:Prospectsfor sustainable development,ed. Miezan et al. Bouarke, Côte d’ Ivoire: WestAfr ican Rice Development Association.
Robertson,C. 1984. Sharing the same bowl: A socioeconomic history of women andclass in Accra, Ghana.Bloomington,Ind., U.S.A.: University of Indiana Press.
Rogerson,C. M. 1993. Urban agriculture in South Afr ica: Scope, issues,and po-tential. Geojournal 30 (1).
Rozelle, S. 1991. Rural household data collection in developing countries:Designinginstruments and methods for collecting farm production data. Working Paper inAgricultural Economics 91-117. Ithaca,N.Y., U.S.A.: Cornell University.
Ruel,M. T., C. E. Levin, M. Armar-Klemesu,D. Maxwell, and S. S. Morris. 1999.Good care practices can mitigate the negative effects of poverty and low maternalschooling on children’s nutritional status: Evidence from Accra. World Devel-opment27 (11):1993–2009
Ruel,M. T., J. L. Garrett,P. Engle, L. Haddad, D. Maxwell, P. Menon,S. Morris, andA. Oshaug. 1998. Urban challenges to nutrition security: A review of food secu-rity, health and care in the cities. Food Consumption and Nutrition Division Dis-cussion Paper 51. International Food Policy Research Institute, Washington,D.C.
169
maxwell references 5/9/0 8:23 PM Page 169
Sahn,D. 1994. The contribution of income to improved nutrition in Côte d’Ivoire.Journal of African Economies3 (1).
Sahn,D., and H. Alderman. 1997. On the determinants of nutrition in Mozambique:The importance of age-specific effects. World Development25 (4):577–588.
Sahn,D., P. Dorosh,and S. Younger. 1996. Exchange rates,fiscal and agriculturalpolicies in Afr ica: Does adjustment hurt the poor? World Development24 (4):719–747.
Sarris,A. 1993. Household welfare during crisis and adjustment in Ghana. Journalof African Economies2 (2):194–233.
Satterthwaite, D. 1995. The underestimation and misrepresentation of urbanpoverty. Environment and Urbanization (7) 1:3–10.
Sawio, C. 1993. Feeding the urban masses? Towards an understanding of the dy-namics of urban agriculture in Dar es Salaam,Tanzania. Ph.D. dissertation. ClarkUniversity, Worchester, Mass.,U.S.A.
Sawyerr, A., and E. Bortei-Doku Aryeetey. 1997. Ghana national human develop-ment report. Accra: United Nations Development Program.
Sen,A. K. 1981. Poverty and famines:An essay on entitlements and deprivation.Oxford: Clarendon Press.
Smit, J., J. Nasr, and A. Ratta. 1996. Urban agriculture: A neglected resource forfood, jobs and sustainable cities. New York: United Nations DevelopmentProgram.
Sommerfelt, A. E., and M. K. Stewart. 1994. Children’s nutritional status.Demo-graphic and Health Surveys Comparative Studies 12. Calverton, Md., U.S.A.:Macro International Inc.
Songsore, J., and G. McGranahan. 1993. Environment,wealth,and health:Towardsan analysis of intra-urban differentials within the Greater Accra MetropolitanArea,Ghana. Environment and Urbanization 5: 10–34.
———. 1996. Women and household environmental care in the Greater Accra Met-ropolitan Area, Ghana.Urban Environment Series, Report No. 2. Stockholm:Stockholm Environment Institute.
Stratton,R. J., R. J. Stubbs,D. Hughes,N. King, J. E. Blundell,and M. Elia. 1998.Comparison of the traditional paper visual analog scale questionnaire with an
170
maxwell references 5/9/0 8:23 PM Page 170
Apple Newton electronic appetite rating system (EARS) in free living subjectsfeeding ad libitum.European Journal of Clinical Nutrition 52 (10):737–741.
Strauss,J., and D. Thomas. 1995. Human resources:Empirical modeling of house-hold and family decisions. In Handbook of development economics,vol. 3, ed.J. Behrman and T. N. Srinivasan,. Amsterdam:Elsevier.
Stren,R., R. White, and J. Whitney. 1992. Sustainable cities:Urbanization and theenvironment in international perspective. Boulder, Colo.,U.S.A.: Westview.
Subramanian,S., and A. Deaton. 1996. The demand for food and calories. Journalof Political Economy 104 (1):133–162.
Swift, J. 1989. Why are rural people vulnerable to famine? IDS Bulletin20 (2):8–15.
Tabatabai,H. 1988. Agricultural decline and access to food in Ghana. InternationalLabour Review 127 (6):703–734.
———. 1993. Poverty and food consumption in urban Zaire. Cornell Food and Nu-trition Policy Program Working Paper 46. Ithaca,N.Y., U.S.A.: Cornell Foodand Nutrition Policy Program.
Tienda,M., and S. O. Salazar. 1980. Female-headed households and extended fam-ily formations in rural and urban Peru. Madison,Wis., U.S.A.: Center for De-mography and Ecology, University of Wisconsin.
Tinker, I. 1997. Street foods:Urban food and employment in developing countries.Oxford: Oxford University Press.
Todaro. M. 1977. Economic development in the Third World. New York: LongmansPress.
UN ACC/SCN (United Nations Administrative Committee on Coordination—Sub-committee on Nutrition). 1992. Second report on the world nutrition situation.vol. 1,Global and regional results.Geneva.
UNCHS (United Nations Center for Human Settlement). 1996. An urbanizing world:Global report on human settlements,1996. Oxford: Oxford University Press.
UNICEF (United Nations Childrens Fund). 1990. Strategy for improved nutrition ofchildren and women in developing countries. UNICEF Policy Review Paper.New York.
United Nations. 1995. World urbanization prospects. 1994.New York.
171
maxwell references 5/9/0 8:23 PM Page 171
Victora,C. G. 1992. The association between wasting and stunting:An internationalperspective. Journal of Nutrition 122 (5):1105–1110.
Watts, M., and H. Bohle. 1993. Hunger, famine, and the space of vulnerability.GeoJournal 30 (2):117–125.
Wester, A., and T. K. Burch. 1983. Fertility and household status of older women inCanada,1971. Canadian Studies in Population 10 (1):1–13.
WHO (World Health Organization). 1979. Measurement of nutritional impact. Aguideline for the measurement of nutritional impact of supplementary feedingprogrammes aimed at vulnerable groups.FAP/79.1. Geneva.
———. 1995. Physical status:The use and interpretation of anthropometry. Reportof a WHO Expert Committee. WHO Technical Report Series 854. Geneva.
———. 1997. Prevention and management of the global epidemic of obesity. Re-port of the WHO Consultation on Obesity. Geneva,3-5 June 1997. Photocopy.
———. 1998. Complementary feeding of young children in developing countries:A review of current scientific knowledge. WHO/NUT/98. Geneva.
Williams,C. D. 1933. A nutritional disease of childhood associated with a maize diet.Archive of Diseases in Childhood8: 423–433.
World Bank. 1981. Accelerated development in Sub-Saharan Africa.Washington,D.C.
———. 1986. Poverty and hunger: Issues and options for food security in devel-oping countries.Washington,D.C.
———. 1995. Ghana:Poverty past,present and future. Report 14504-GH. Wash-ington,D.C.
———. 1997. World development report 1997.Washington,D.C.
Daniel Maxwell, formerly of IFPRI, is the regional food security advisor for EastAfr ica for CARE International. Carol Levin, Marie Ruel,and Saul Morris are re-search fellows in the Food Consumption and Nutrition Division at IFPRI. MargaretArmar-Klemesu is a research fellow in the Nutrition Unit of the Noguchi Memor-ial Institute for Medical Research at the University of Ghana. Clement Ahiadeke isa demographer at the Institute of Statistical, Social,and Economic Research at theUniversity of Ghana.
172
maxwell references 5/9/0 8:23 PM Page 172