Embed Size (px)
Citation preview
Urban LandMark Land Release Assessment Tool: Cosmo City Case Study Report
July 2011
Prepared by: Commissioned by:

List of abbreviations
al+hdc Affordable Land and Housing Data Centre
BNG Breaking New Ground
CBA Cost Benefit Analysis
CODEVCO Developer of Cosmo City – fully owned by Basil Read Holdings
FLISP Finance-linked Institutional Subsidy Programme
IRR Internal Rate of Return
JFS Johannesburg Financial Services
JHC Johannesburg Housing Company
LRA Land Release Assessment
MIG Municipal Infrastructure Grant
NPV Net Present Value
PPP Public-Private Partnership
Financial figures are best estimates given available data.
Should new data become available these may change.
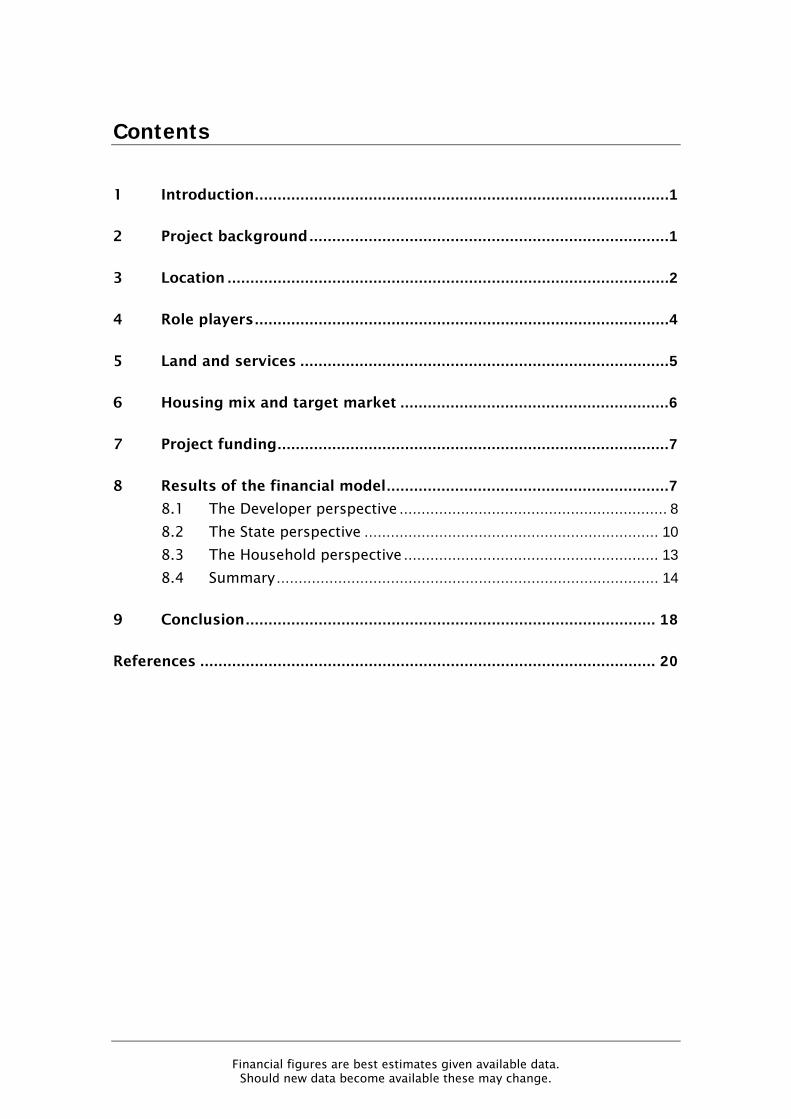
Contents
1 Introduction ...........................................................................................1
2 Project background ...............................................................................1
3 Location .................................................................................................2
4 Role players ...........................................................................................4
5 Land and services .................................................................................5
6 Housing mix and target market ...........................................................6
7 Project funding ......................................................................................7
8 Results of the financial model ..............................................................7 8.1 The Developer perspective ............................................................. 8
8.2 The State perspective ................................................................... 10
8.3 The Household perspective .......................................................... 13
8.4 Summary ....................................................................................... 14
9 Conclusion .......................................................................................... 18
References .................................................................................................... 20
Financial figures are best estimates given available data.
Should new data become available these may change.
List of figures
Figure 1: Housing typologies in Cosmo City ....................................................... 2 Figure 2: Location of Cosmo City in relation to the Johannesburg CBD .............. 3 Figure 3: Site plan of Cosmo City ......................................................................... 3 Figure 4: Role players in Cosmo City ................................................................... 4 Figure 5: Hlanganani Gardens rental units at Cosmo City ................................... 7 Figure 6: Explicit and implicit subsidies by housing type ................................. 12 Figure 7: Developer’s overall waterfall chart (average per unit) ........................ 16 Figure 8: State’s overall waterfall chart (average per unit) ................................ 16 Figure 9: Household waterfall chart for subsidy phase 1 units ......................... 17 Figure 10: Household waterfall chart for credit-linked phase 2 units ............... 17 Figure 11: Household waterfall chart for market-linked phase 1 units ............. 18 Figure 12: Household waterfall chart for three-bed rental units ....................... 18
List of tables
Table 1: Developer performance .......................................................................... 9 Table 2: Inflows and outflows per unit from the Developer’s perspective .......... 9 Table 3: State performance ................................................................................ 11 Table 4: Split of up-front and ongoing costs and benefits to the State ............ 11 Table 5: Subsidies per unit paid by the State .................................................... 12 Table 6: Inflows and outflows from the Household perspective ....................... 13 Table 8: NPV and ROI for households (2011 Rands) ......................................... 14 Table 9: Summary of NPV and ROI for all actors and unit types ....................... 15
Urban LandMark Land Release Assessment Tool: Cosmo City Case Study
Financial figures are best estimates given available data. Should new data become available these may change.
1
1 Introduction
In co-operation with the Western Cape Department of Human Settlements and the City of Cape Town, Urban LandMark commissioned 80/20 and PDG to develop an approach to evaluate the cost effectiveness of public land release. A Land Release Assessment (LRA) model was developed and used to assess the cost effectiveness of the case-studies in the Western Cape. The model is an Excel-based financial model which undertakes a cost benefit analysis (CBA) from the perspectives of the State, developer and resident households. PDG has been commissioned to apply the LRA model in two Gauteng case studies, namely Cosmo City and Pennyville in order to a) increase the case study application to generate a database of model inputs and outputs, b) to test the model, and c) to compare the Gauteng experience with that of the Western Cape.
This report covers the Cosmo City case study and provides background information to the projects, as well as the results of the LRA model and an analysis of the results. Separate reports cover the Pennyville case study, a comparison between the Western Cape and Gauteng case studies and an assessment of the model itself.
2 Project background
Cosmo City is a mixed-use, integrated housing development of approximately 12 300 units on a 1105 ha site in the north-west of Johannesburg. The project was conceived out of the need to accommodate the residents of the Zevenfontein and Riverbend informal settlements, and is described as a joint venture between the City of Johannesburg and the Gauteng Provincial Department of Local Government and Housing. The project includes fully subsidised, credit-linked and bonded housing, as well as social rental housing and incorporates institutional and social facilities throughout the development.
CODEVCO, a joint venture between Basil Read Developments and Kopano Ke Matla, was appointed to act as the City’s agent to undertake the development in a public-private partnership. A Land Availability Agreement was signed between the City and CODEVCO in 2000, but the project was delayed for four years, largely due to objections from surrounding land owners.
The installation of services began in January 2005. Subsidised and bonded houses were constructed in overlapping phases between 2006 and 2011, with the first transfers taking place in November 2005. The credit-linked houses were constructed in two discreet phases in 2006/7 and 2010/11. The final units are expected to be complete by the end of 2012. On completion, Cosmo City is expected to house between 65 000 and 70 000 people.
Urban LandMark Land Release Assessment Tool: Cosmo City Case Study
Financial figures are best estimates given available data. Should new data become available these may change.
2
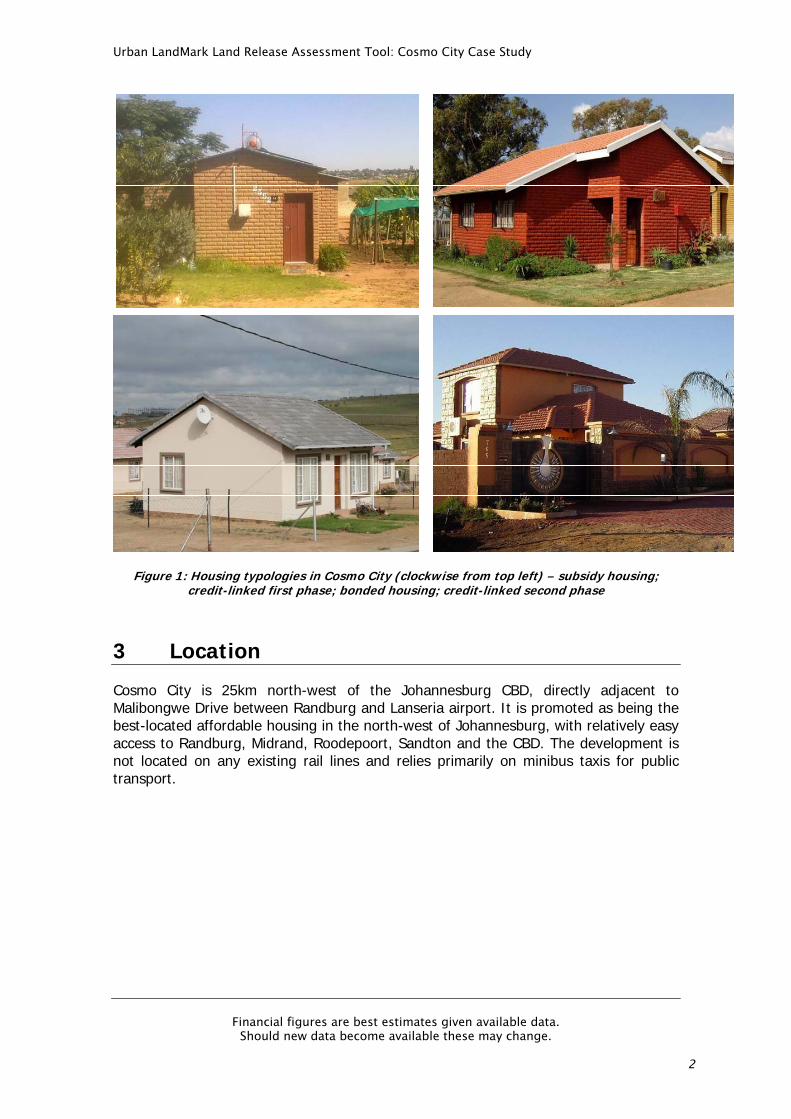
Figure 1: Housing typologies in Cosmo City (clockwise from top left) – subsidy housing; credit-linked first phase; bonded housing; credit-linked second phase
3 Location
Cosmo City is 25km north-west of the Johannesburg CBD, directly adjacent to Malibongwe Drive between Randburg and Lanseria airport. It is promoted as being the best-located affordable housing in the north-west of Johannesburg, with relatively easy access to Randburg, Midrand, Roodepoort, Sandton and the CBD. The development is not located on any existing rail lines and relies primarily on minibus taxis for public transport.
Urban LandMark Land Release Assessment Tool: Cosmo City Case Study
Financial figures are best estimates given available data. Should new data become available these may change.
3
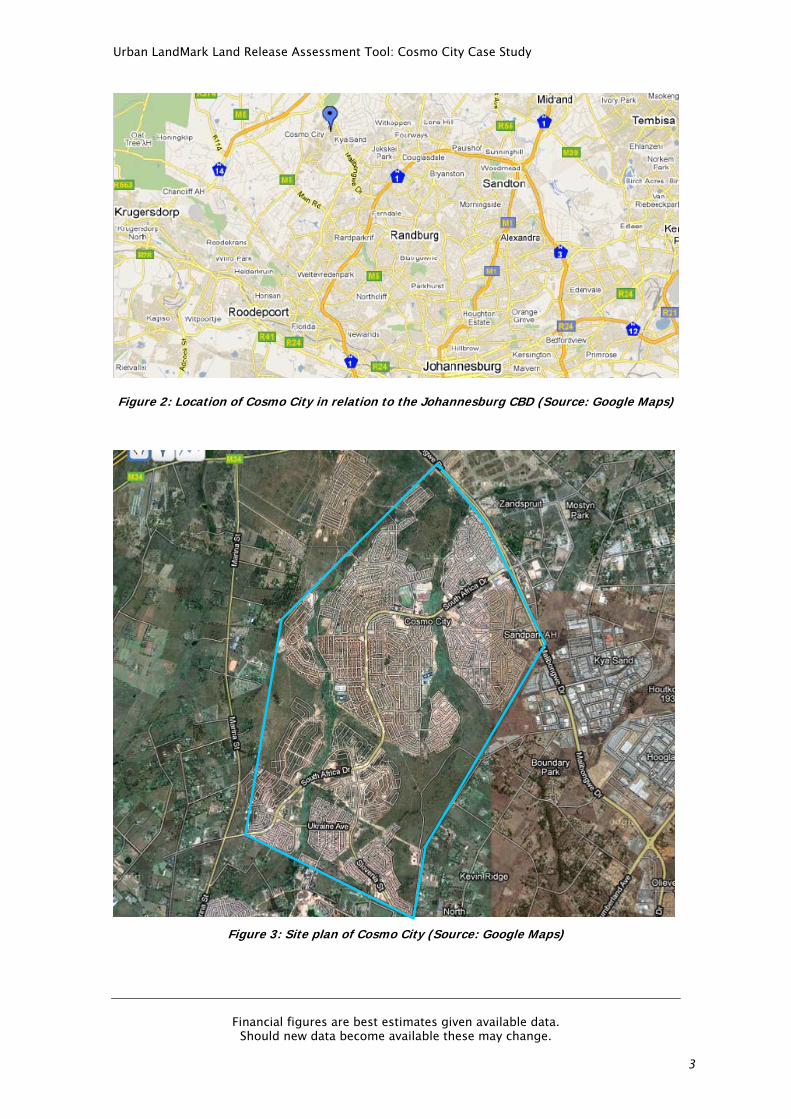
Figure 2: Location of Cosmo City in relation to the Johannesburg CBD (Source: Google Maps)
Figure 3: Site plan of Cosmo City (Source: Google Maps)
Urban LandMark Land Release Assessment Tool: Cosmo City Case Study
Financial figures are best estimates given available data. Should new data become available these may change.
4
4 Role players
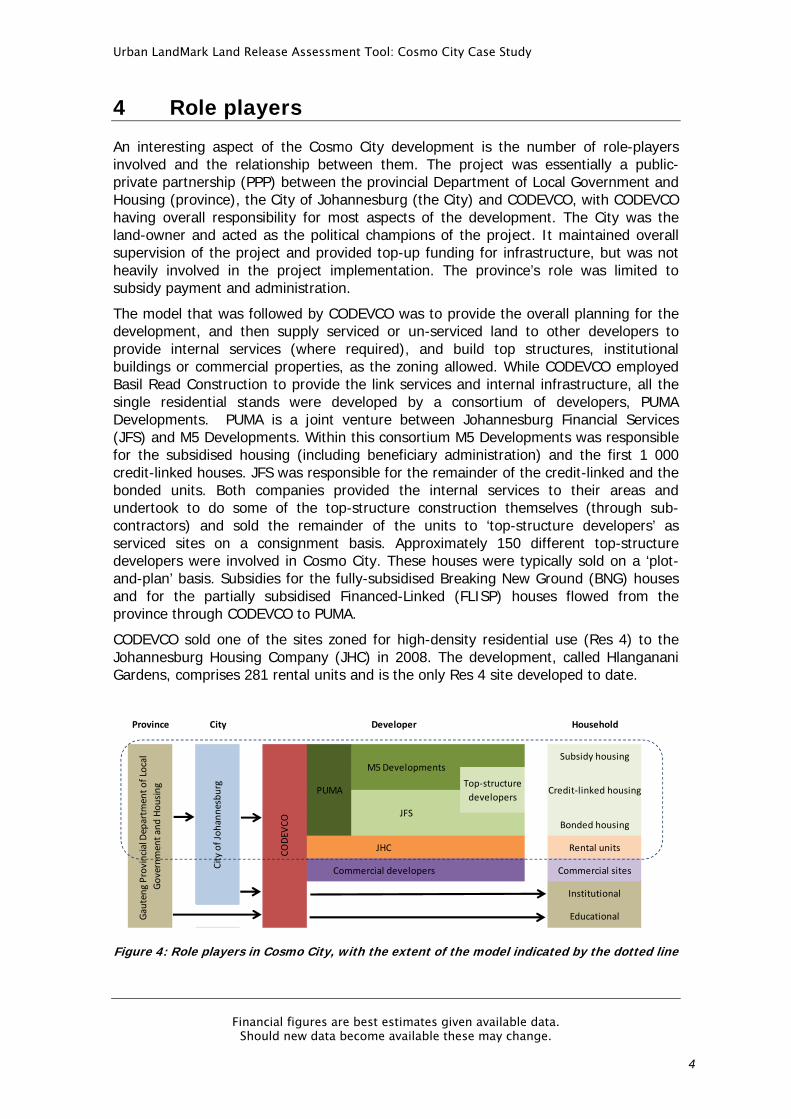
An interesting aspect of the Cosmo City development is the number of role-players involved and the relationship between them. The project was essentially a public-private partnership (PPP) between the provincial Department of Local Government and Housing (province), the City of Johannesburg (the City) and CODEVCO, with CODEVCO having overall responsibility for most aspects of the development. The City was the land-owner and acted as the political champions of the project. It maintained overall supervision of the project and provided top-up funding for infrastructure, but was not heavily involved in the project implementation. The province’s role was limited to subsidy payment and administration.
The model that was followed by CODEVCO was to provide the overall planning for the development, and then supply serviced or un-serviced land to other developers to provide internal services (where required), and build top structures, institutional buildings or commercial properties, as the zoning allowed. While CODEVCO employed Basil Read Construction to provide the link services and internal infrastructure, all the single residential stands were developed by a consortium of developers, PUMA Developments. PUMA is a joint venture between Johannesburg Financial Services (JFS) and M5 Developments. Within this consortium M5 Developments was responsible for the subsidised housing (including beneficiary administration) and the first 1 000 credit-linked houses. JFS was responsible for the remainder of the credit-linked and the bonded units. Both companies provided the internal services to their areas and undertook to do some of the top-structure construction themselves (through sub-contractors) and sold the remainder of the units to ‘top-structure developers’ as serviced sites on a consignment basis. Approximately 150 different top-structure developers were involved in Cosmo City. These houses were typically sold on a ‘plot-and-plan’ basis. Subsidies for the fully-subsidised Breaking New Ground (BNG) houses and for the partially subsidised Financed-Linked (FLISP) houses flowed from the province through CODEVCO to PUMA.
CODEVCO sold one of the sites zoned for high-density residential use (Res 4) to the Johannesburg Housing Company (JHC) in 2008. The development, called Hlanganani Gardens, comprises 281 rental units and is the only Res 4 site developed to date.
Province City Household
Subsidy housing
Bonded housing
Rental units
Commercial sites
Institutional
Educational
City of Johannesburg
Gauteng Provincial Departm
ent of Local
Government and Housing
Commercial developers
Top‐structure
developers
Developer
Credit‐linked housing
M5 Developments
JFS
PUMA
JHC
CODEV
CO
Figure 4: Role players in Cosmo City, with the extent of the model indicated by the dotted line
Urban LandMark Land Release Assessment Tool: Cosmo City Case Study
Financial figures are best estimates given available data. Should new data become available these may change.
5
The relationships between role-players in Cosmo City are thus complex, with the responsibility for various components of the development split multiple ways. This complexity cannot be accommodated in the LRA model, as no single ‘developer’ can be identified. This problem has been dealt with by grouping all the private sector interests together into a single, conceptual ‘developer’. The principle here is that any costs incurred, or profits realised, in the process accrue to the private sector (as opposed to the other stakeholders in the model – the State and households) irrespective of which developer incurred the costs or accrued the profits. This is a gross generalisation of the actual financial arrangements involved in the project, but as these relationships are not the focus of the model, it is not believed to have a significant effect on the model results.
5 Land and services
The site was bought up by the City of Johannesburg at a total cost of approximately R30 million. A Land Availability Agreement was signed by the developers under the following terms:
The developers will pay the City R2 per m² (net density) for every residential site sold
50% of the net profit of the non-subsidised residential sites and the commercial and institutional sites will be paid to the City
The developer pays the City for the land when the land is transferred to the new owner. As the City owned the land up to the point of transfer, the holding costs on the property for the developer were negligible.
Although Cosmo City is a greenfield development, the site was adequately serviced with bulk infrastructure, so no additional infrastructure was required specifically for the development, which helped keep the development costs low. However, ‘link services’ to the value of R497 million were required, which comprised the arterial roads and associated infrastructure, which was paid for by the City of Johannesburg. In addition, Gautrans upgraded Malibongwe Drive in 2008, but this investment has been excluded from the analysis.
A high standard of services has been provided in Cosmo City. All roads are tarred and all sites have in-house water supply, water-borne sanitation and pre-paid electricity. Solar geysers have been fitted in approximately 170 homes in a pilot project in Extension 2, funded by the City of Johannesburg at a cost of approximately R2 million.
Urban LandMark Land Release Assessment Tool: Cosmo City Case Study
Financial figures are best estimates given available data. Should new data become available these may change.
6
6 Housing mix and target market
Cosmo City was planned to provide the following residential mix:
5000 low-income BNG houses (R0 – R 3 500 per hh per month)
3 000 credit-linked FLISP houses (R3 500 – R16 000 per hh per month)
1 000 social rental units
3 300 bonded houses
To date, almost all of the BNG houses have been completed. The first phase of 1 000 credit-linked houses is complete and approximately 600 of the second phase are completed with the remainder due to be completed by the end of 2012. Only 281 social rental units have been provided in the Hlanganani Gardens development, with the other sites zoned for high-density units yet to be developed. By the end of March 2011, 3 000 of the planned 3 300 bonded houses were complete.
The development is mixed-use and includes planning for 12 schools, 40 sites for churches, clinics and crèches, 43 parks and recreational sites and 30 commercial and retail sites. A 40ha industrial park has been developed on the opposite side of Malibongwe Drive and a 300ha environmental area cuts through the development. Six of the schools are operational and a number of the parks have been developed by City Parks. A multi-use community centre has also been constructed by the City of Johannesburg and is about to be inaugurated.
Beneficiaries for the BNG houses were identified from the two targeted settlements and co-ordinated through a careful beneficiary administration programme. The bonded houses were sold on the open market and demand was initially very high. Prices in 2006 averaged approximately R440 000 (but with variation due to stand and house size), and some of the houses are currently valued at over R1 million. The first tranche of credit-linked houses were also sold soon after they were placed on the market. However, at the end of 2008 and early 2009, the slump in the market affected the demand for the credit-linked houses. The package was re-structured to provide an improved product for a higher income bracket (R10 000 – R16 000 per hh per m), which pushes the product out of the range of FLISP beneficiaries and into the range of the Financial Sector Charter. These houses were put on the market at R238 000 in 2009 and have increased to a current price of R269 000. The credit-linked houses have been the most problematic for developers, the challenge being to develop a bankable product within the affordability range of the target market, yet sufficiently different from the fully-subsidised units.
The rental units are being let for amounts ranging between R1 500 per month for a one-bedroom unit to R3 300 for a three-bedroom unit. Demand for the rental units was initially slow, but JHC now reports 96% occupancy. The low initial demand is probably reflected in the fact that JHC has not applied any rental escalation since the units were first let.
Urban LandMark Land Release Assessment Tool: Cosmo City Case Study
Financial figures are best estimates given available data. Should new data become available these may change.
7
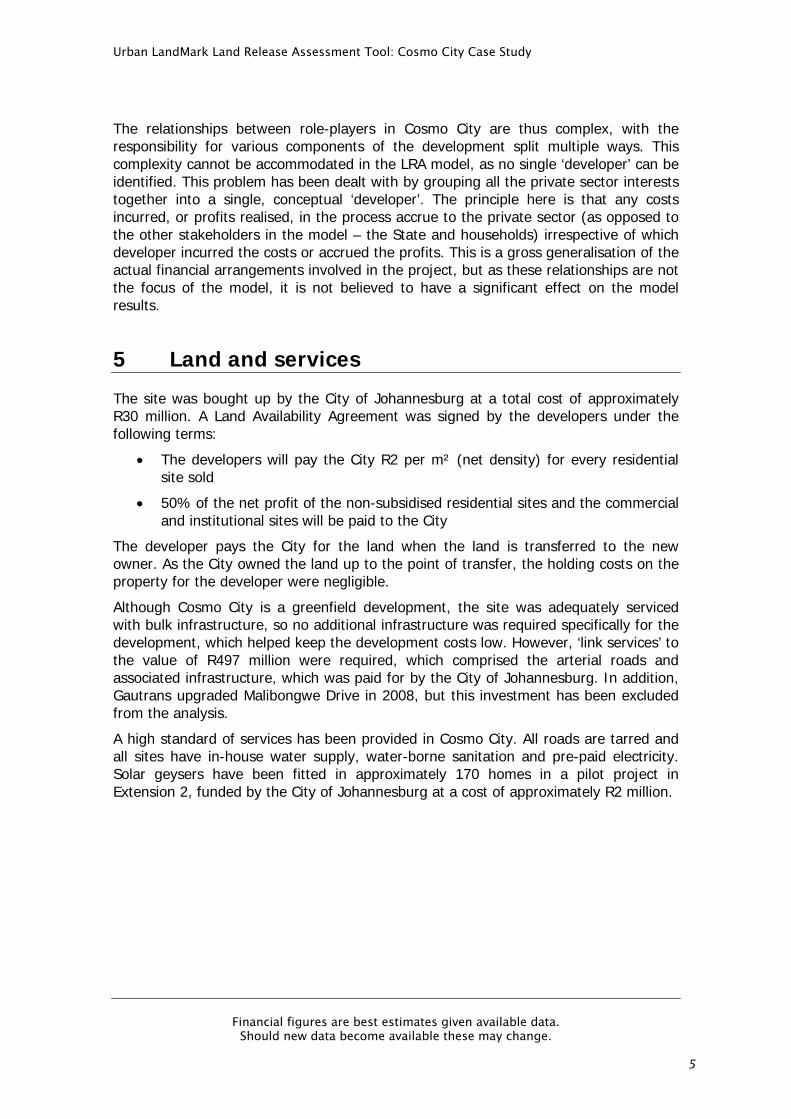
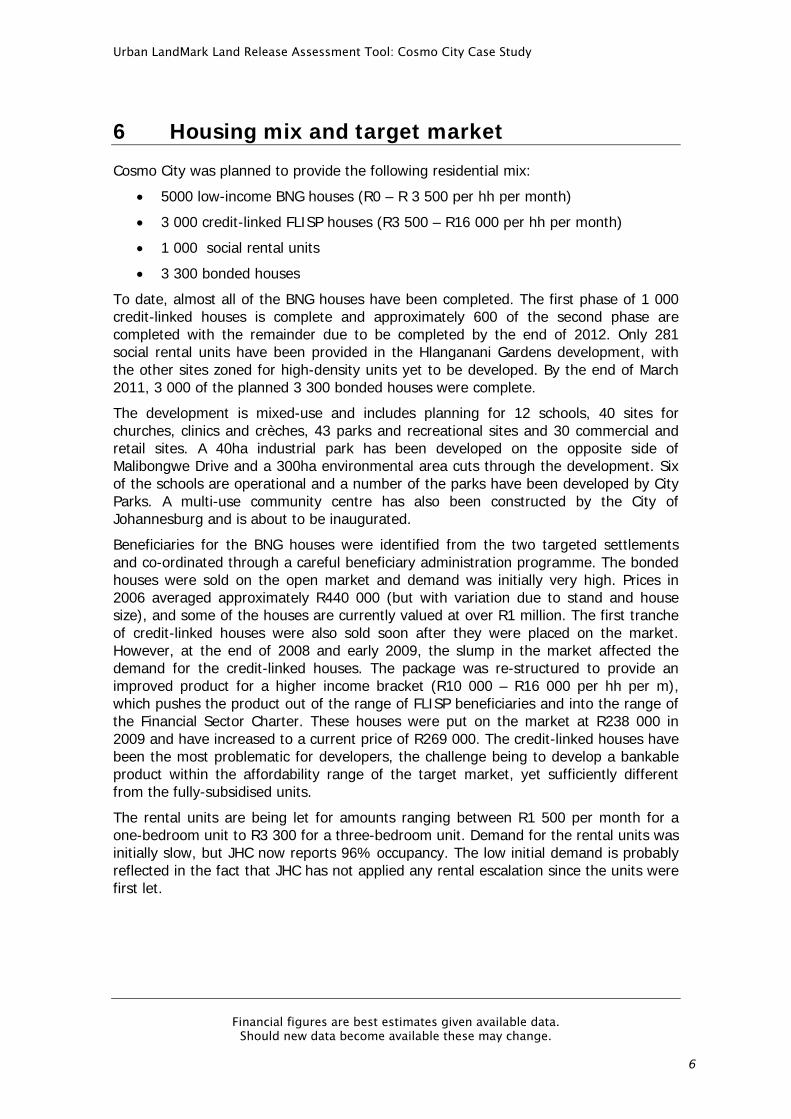
Figure 5: Hlanganani Gardens rental units at Cosmo City
The Affordable Land and Housing Data Centre (al+hdc) reports that the average sales price between individuals was R378 786 in 2009, and that 77% of these properties were bonded. This includes bonded and credit-linked housing, as well as subsidised houses on which the sales moratorium has expired.
7 Project funding
The provincial housing subsidies covered the cost of the BNG top structures and basic servicing, but were insufficient to cover the higher levels of service (e.g. tarred roads and underground electrical connections to all units) required in an integrated development. Thus the higher levels of service were funded by the City of Johannesburg. Project timing was dictated to some extent by the City’s annual budget for housing.
First National Bank (FNB) provided a commercial loan to the developers to build the internal services and top structures for the first phase of the credit-linked and bonded housing, which were then recovered through sales and the minimal amount of FLISP subsidies. In the first phase of credit-linked housing, approximately 50% of the households purchasing the properties obtained the FLISP subsidy. It is assumed that the remainder of purchasers did not qualify for the subsidy. For the latter phases, NURCHA provided finance for the internal services and the top structures were funded through pre-sales. FNB Housing Finance provided end-user finance to the majority (60%) of the buyers of the credit-linked and bonded units.
JHC borrowed R20 million from the Gauteng Partnership Fund and an undisclosed amount from JPMorgan Chase as a ‘soft loan’ to finance the construction of Hlanganani Gardens.
8 Results of the financial model
As for the Western Cape case studies, the results of the financial model are discussed from the perspectives of the developer, the State and the beneficiary households. Commentary is also provided on the source and reliability of the model input data. PDG has attempted to use the Urban LandMark Land Release Assessment Tool ‘as is’,
Urban LandMark Land Release Assessment Tool: Cosmo City Case Study
Financial figures are best estimates given available data. Should new data become available these may change.
8
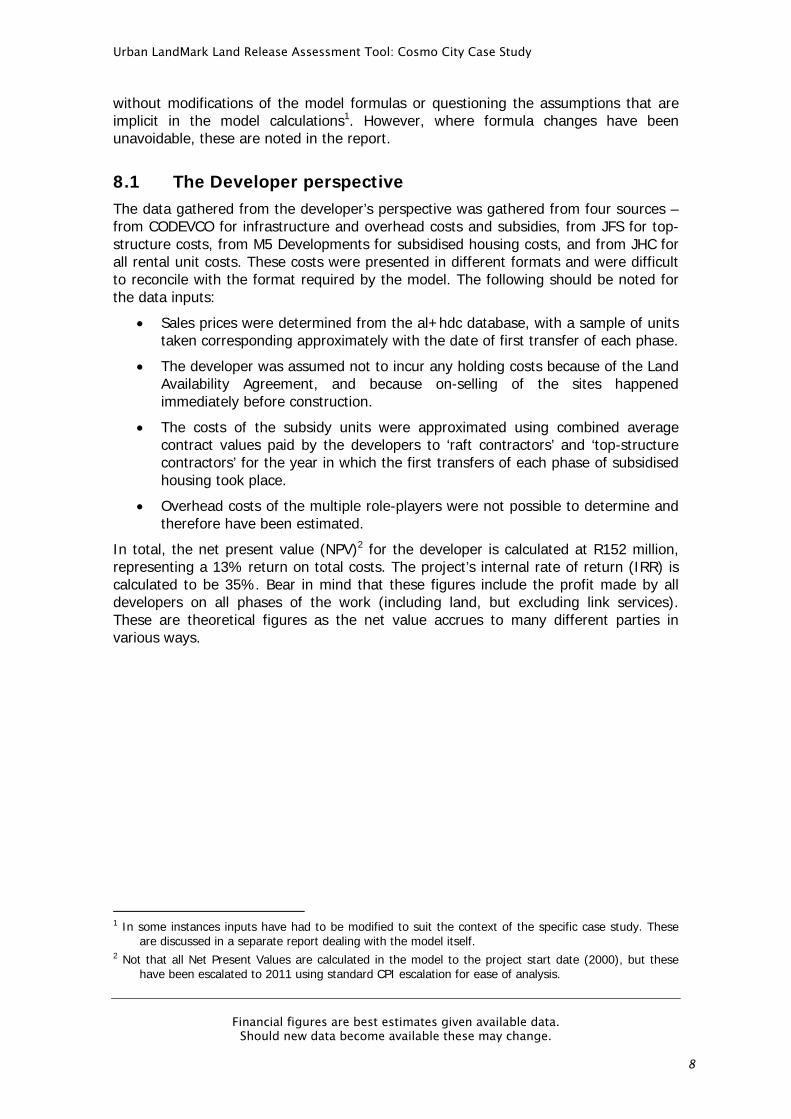
without modifications of the model formulas or questioning the assumptions that are implicit in the model calculations1. However, where formula changes have been unavoidable, these are noted in the report.
8.1 The Developer perspective The data gathered from the developer’s perspective was gathered from four sources – from CODEVCO for infrastructure and overhead costs and subsidies, from JFS for top- structure costs, from M5 Developments for subsidised housing costs, and from JHC for all rental unit costs. These costs were presented in different formats and were difficult to reconcile with the format required by the model. The following should be noted for the data inputs:
Sales prices were determined from the al+hdc database, with a sample of units taken corresponding approximately with the date of first transfer of each phase.
The developer was assumed not to incur any holding costs because of the Land Availability Agreement, and because on-selling of the sites happened immediately before construction.
The costs of the subsidy units were approximated using combined average contract values paid by the developers to ‘raft contractors’ and ‘top-structure contractors’ for the year in which the first transfers of each phase of subsidised housing took place.
Overhead costs of the multiple role-players were not possible to determine and therefore have been estimated.
In total, the net present value (NPV)2 for the developer is calculated at R152 million, representing a 13% return on total costs. The project’s internal rate of return (IRR) is calculated to be 35%. Bear in mind that these figures include the profit made by all developers on all phases of the work (including land, but excluding link services). These are theoretical figures as the net value accrues to many different parties in various ways.
1 In some instances inputs have had to be modified to suit the context of the specific case study. These
are discussed in a separate report dealing with the model itself. 2 Not that all Net Present Values are calculated in the model to the project start date (2000), but these
have been escalated to 2011 using standard CPI escalation for ease of analysis.
Urban LandMark Land Release Assessment Tool: Cosmo City Case Study
Financial figures are best estimates given available data. Should new data become available these may change.
9
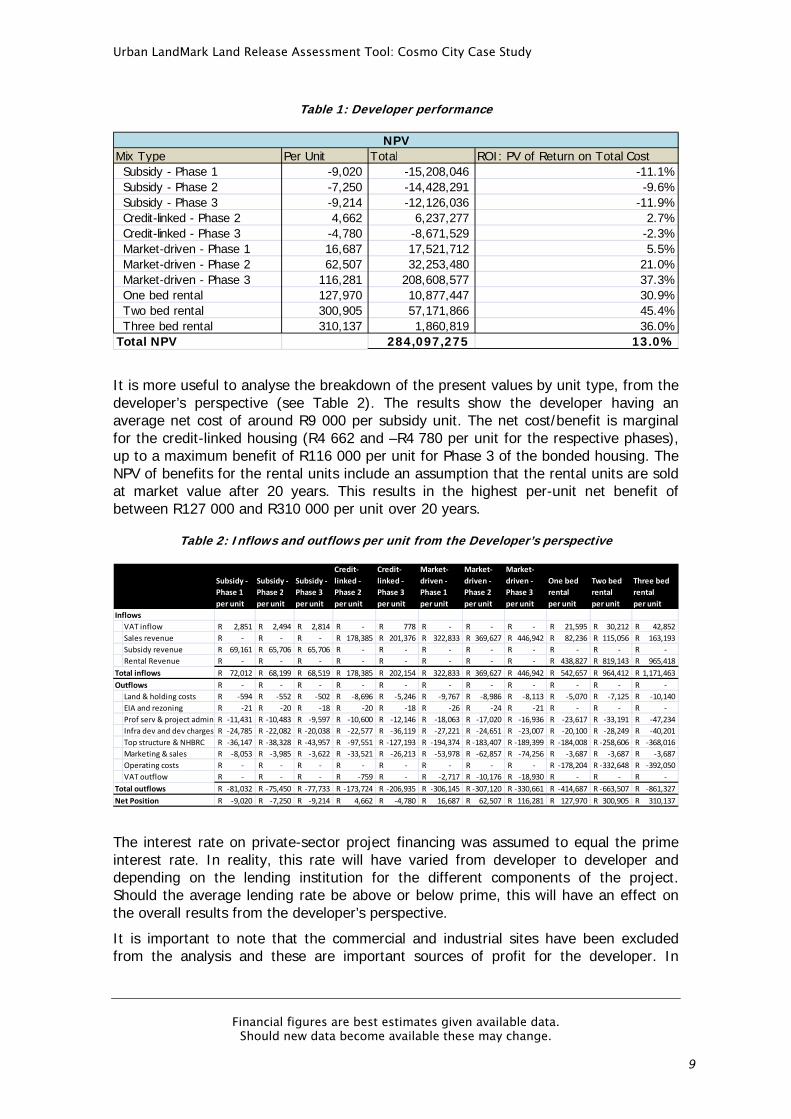
Table 1: Developer performance
Mix Type Per Unit Total ROI: PV of Return on Total CostSubsidy - Phase 1 -9,020 -15,208,046 -11.1%Subsidy - Phase 2 -7,250 -14,428,291 -9.6%Subsidy - Phase 3 -9,214 -12,126,036 -11.9%Credit-linked - Phase 2 4,662 6,237,277 2.7%Credit-linked - Phase 3 -4,780 -8,671,529 -2.3%Market-driven - Phase 1 16,687 17,521,712 5.5%Market-driven - Phase 2 62,507 32,253,480 21.0%Market-driven - Phase 3 116,281 208,608,577 37.3%One bed rental 127,970 10,877,447 30.9%Two bed rental 300,905 57,171,866 45.4%Three bed rental 310,137 1,860,819 36.0%
Total NPV 284,097,275 13.0%
NPV
It is more useful to analyse the breakdown of the present values by unit type, from the developer’s perspective (see Table 2). The results show the developer having an average net cost of around R9 000 per subsidy unit. The net cost/benefit is marginal for the credit-linked housing (R4 662 and –R4 780 per unit for the respective phases), up to a maximum benefit of R116 000 per unit for Phase 3 of the bonded housing. The NPV of benefits for the rental units include an assumption that the rental units are sold at market value after 20 years. This results in the highest per-unit net benefit of between R127 000 and R310 000 per unit over 20 years.
Table 2: Inflows and outflows per unit from the Developer’s perspective
Subsidy ‐
Phase 1
Subsidy ‐
Phase 2
Subsidy ‐
Phase 3
Credit‐
linked ‐
Phase 2
Credit‐
linked ‐
Phase 3
Market‐
driven ‐
Phase 1
Market‐
driven ‐
Phase 2
Market‐
driven ‐
Phase 3
One bed
rental
Two bed
rental
Three bed
rental
per unit per unit per unit per unit per unit per unit per unit per unit per unit per unit per unit
Inflows
VAT inflow 2,851R 2,494R 2,814R ‐R 778R ‐R ‐R ‐R 21,595R 30,212R 42,852R
Sales revenue ‐R ‐R ‐R 178,385R 201,376R 322,833R 369,627R 446,942R 82,236R 115,056R 163,193R
Subsidy revenue 69,161R 65,706R 65,706R ‐R ‐R ‐R ‐R ‐R ‐R ‐R ‐R
Rental Revenue ‐R ‐R ‐R ‐R ‐R ‐R ‐R ‐R 438,827R 819,143R 965,418R
Total inflows 72,012R 68,199R 68,519R 178,385R 202,154R 322,833R 369,627R 446,942R 542,657R 964,412R 1,171,463R
Outflows ‐R ‐R ‐R ‐R ‐R ‐R ‐R ‐R ‐R ‐R ‐R
Land & holding costs ‐594R ‐552R ‐502R ‐8,696R ‐5,246R ‐9,767R ‐8,986R ‐8,113R ‐5,070R ‐7,125R ‐10,140R
EIA and rezoning ‐21R ‐20R ‐18R ‐20R ‐18R ‐26R ‐24R ‐21R ‐R ‐R ‐R
Prof serv & project admin ‐11,431R ‐10,483R ‐9,597R ‐10,600R ‐12,146R ‐18,063R ‐17,020R ‐16,936R ‐23,617R ‐33,191R ‐47,234R
Infra dev and dev charges ‐24,785R ‐22,082R ‐20,038R ‐22,577R ‐36,119R ‐27,221R ‐24,651R ‐23,007R ‐20,100R ‐28,249R ‐40,201R
Top structure & NHBRC ‐36,147R ‐38,328R ‐43,957R ‐97,551R ‐127,193R ‐194,374R ‐183,407R ‐189,399R ‐184,008R ‐258,606R ‐368,016R
Marketing & sales ‐8,053R ‐3,985R ‐3,622R ‐33,521R ‐26,213R ‐53,978R ‐62,857R ‐74,256R ‐3,687R ‐3,687R ‐3,687R
Operating costs ‐R ‐R ‐R ‐R ‐R ‐R ‐R ‐R ‐178,204R ‐332,648R ‐392,050R
VAT outflow ‐R ‐R ‐R ‐759R ‐R ‐2,717R ‐10,176R ‐18,930R ‐R ‐R ‐R
Total outflows ‐81,032R ‐75,450R ‐77,733R ‐173,724R ‐206,935R ‐306,145R ‐307,120R ‐330,661R ‐414,687R ‐663,507R ‐861,327R
Net Position ‐9,020R ‐7,250R ‐9,214R 4,662R ‐4,780R 16,687R 62,507R 116,281R 127,970R 300,905R 310,137R
The interest rate on private-sector project financing was assumed to equal the prime interest rate. In reality, this rate will have varied from developer to developer and depending on the lending institution for the different components of the project. Should the average lending rate be above or below prime, this will have an effect on the overall results from the developer’s perspective.
It is important to note that the commercial and industrial sites have been excluded from the analysis and these are important sources of profit for the developer. In
Urban LandMark Land Release Assessment Tool: Cosmo City Case Study
Financial figures are best estimates given available data. Should new data become available these may change.
10
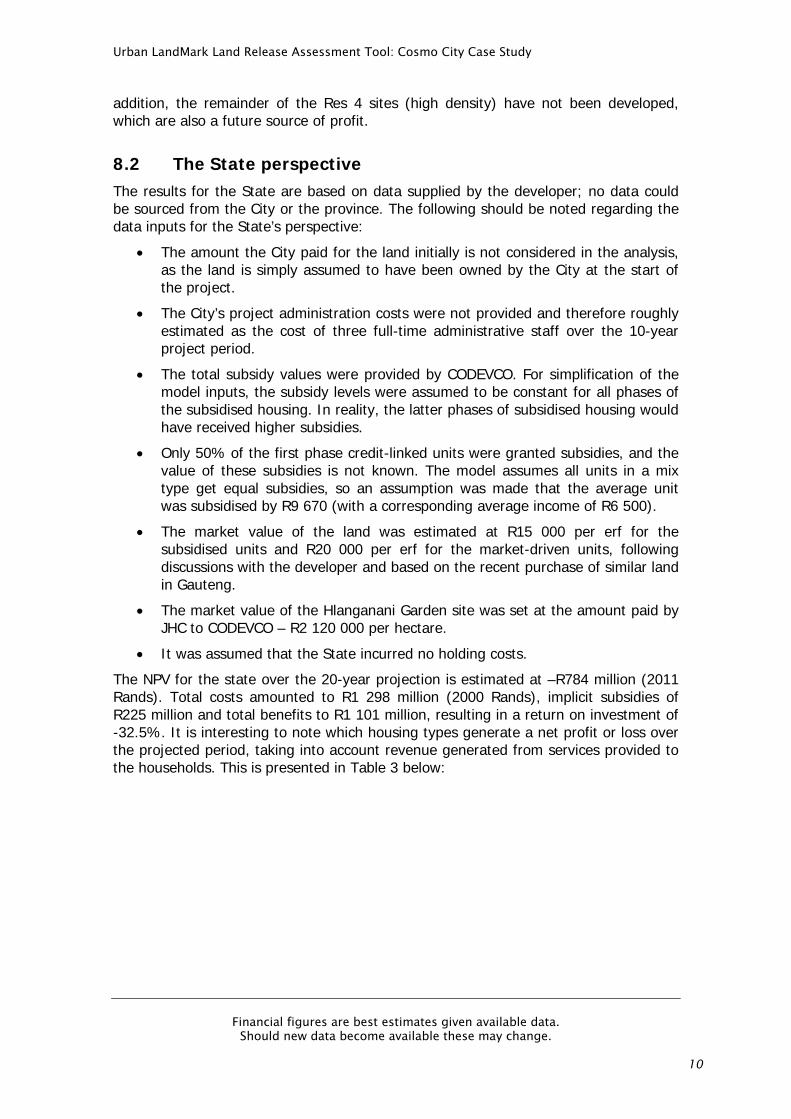
addition, the remainder of the Res 4 sites (high density) have not been developed, which are also a future source of profit.
8.2 The State perspective The results for the State are based on data supplied by the developer; no data could be sourced from the City or the province. The following should be noted regarding the data inputs for the State’s perspective:
The amount the City paid for the land initially is not considered in the analysis, as the land is simply assumed to have been owned by the City at the start of the project.
The City’s project administration costs were not provided and therefore roughly estimated as the cost of three full-time administrative staff over the 10-year project period.
The total subsidy values were provided by CODEVCO. For simplification of the model inputs, the subsidy levels were assumed to be constant for all phases of the subsidised housing. In reality, the latter phases of subsidised housing would have received higher subsidies.
Only 50% of the first phase credit-linked units were granted subsidies, and the value of these subsidies is not known. The model assumes all units in a mix type get equal subsidies, so an assumption was made that the average unit was subsidised by R9 670 (with a corresponding average income of R6 500).
The market value of the land was estimated at R15 000 per erf for the subsidised units and R20 000 per erf for the market-driven units, following discussions with the developer and based on the recent purchase of similar land in Gauteng.
The market value of the Hlanganani Garden site was set at the amount paid by JHC to CODEVCO – R2 120 000 per hectare.
It was assumed that the State incurred no holding costs.
The NPV for the state over the 20-year projection is estimated at –R784 million (2011 Rands). Total costs amounted to R1 298 million (2000 Rands), implicit subsidies of R225 million and total benefits to R1 101 million, resulting in a return on investment of -32.5%. It is interesting to note which housing types generate a net profit or loss over the projected period, taking into account revenue generated from services provided to the households. This is presented in Table 3 below:
Urban LandMark Land Release Assessment Tool: Cosmo City Case Study
Financial figures are best estimates given available data. Should new data become available these may change.
11
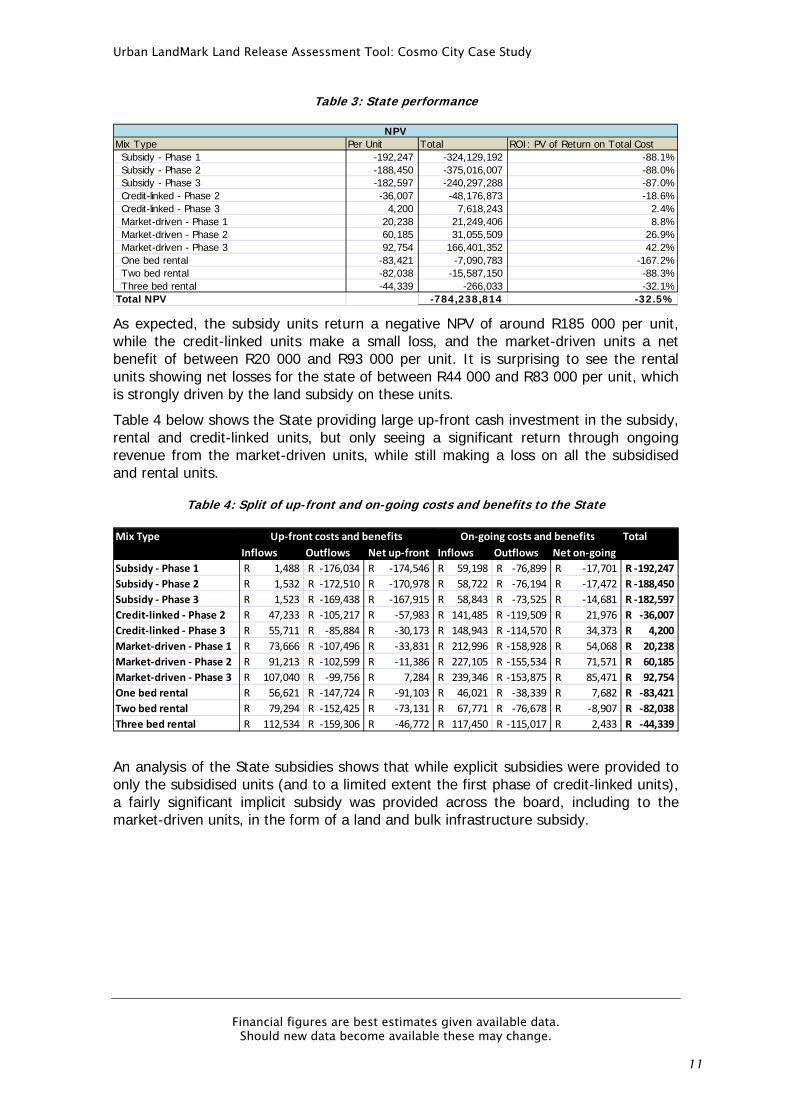
Table 3: State performance
Mix Type Per Unit Total ROI: PV of Return on Total CostSubsidy - Phase 1 -192,247 -324,129,192 -88.1%Subsidy - Phase 2 -188,450 -375,016,007 -88.0%Subsidy - Phase 3 -182,597 -240,297,288 -87.0%Credit-linked - Phase 2 -36,007 -48,176,873 -18.6%Credit-linked - Phase 3 4,200 7,618,243 2.4%Market-driven - Phase 1 20,238 21,249,406 8.8%Market-driven - Phase 2 60,185 31,055,509 26.9%Market-driven - Phase 3 92,754 166,401,352 42.2%One bed rental -83,421 -7,090,783 -167.2%Two bed rental -82,038 -15,587,150 -88.3%Three bed rental -44,339 -266,033 -32.1%
Total NPV -784,238,814 -32.5%
NPV
As expected, the subsidy units return a negative NPV of around R185 000 per unit, while the credit-linked units make a small loss, and the market-driven units a net benefit of between R20 000 and R93 000 per unit. It is surprising to see the rental units showing net losses for the state of between R44 000 and R83 000 per unit, which is strongly driven by the land subsidy on these units.
Table 4 below shows the State providing large up-front cash investment in the subsidy, rental and credit-linked units, but only seeing a significant return through ongoing revenue from the market-driven units, while still making a loss on all the subsidised and rental units.
Table 4: Split of up-front and on-going costs and benefits to the State
Mix Type Total
Inflows Outflows Net up‐front Inflows Outflows Net on‐going
Subsidy ‐ Phase 1 1,488R ‐176,034R ‐174,546R 59,198R ‐76,899R ‐17,701R ‐192,247R
Subsidy ‐ Phase 2 1,532R ‐172,510R ‐170,978R 58,722R ‐76,194R ‐17,472R ‐188,450R
Subsidy ‐ Phase 3 1,523R ‐169,438R ‐167,915R 58,843R ‐73,525R ‐14,681R ‐182,597R
Credit‐linked ‐ Phase 2 47,233R ‐105,217R ‐57,983R 141,485R ‐119,509R 21,976R ‐36,007R
Credit‐linked ‐ Phase 3 55,711R ‐85,884R ‐30,173R 148,943R ‐114,570R 34,373R 4,200R
Market‐driven ‐ Phase 1 73,666R ‐107,496R ‐33,831R 212,996R ‐158,928R 54,068R 20,238R
Market‐driven ‐ Phase 2 91,213R ‐102,599R ‐11,386R 227,105R ‐155,534R 71,571R 60,185R
Market‐driven ‐ Phase 3 107,040R ‐99,756R 7,284R 239,346R ‐153,875R 85,471R 92,754R
One bed rental 56,621R ‐147,724R ‐91,103R 46,021R ‐38,339R 7,682R ‐83,421R
Two bed rental 79,294R ‐152,425R ‐73,131R 67,771R ‐76,678R ‐8,907R ‐82,038R
Three bed rental 112,534R ‐159,306R ‐46,772R 117,450R ‐115,017R 2,433R ‐44,339R
Up‐front costs and benefits On‐going costs and benefits
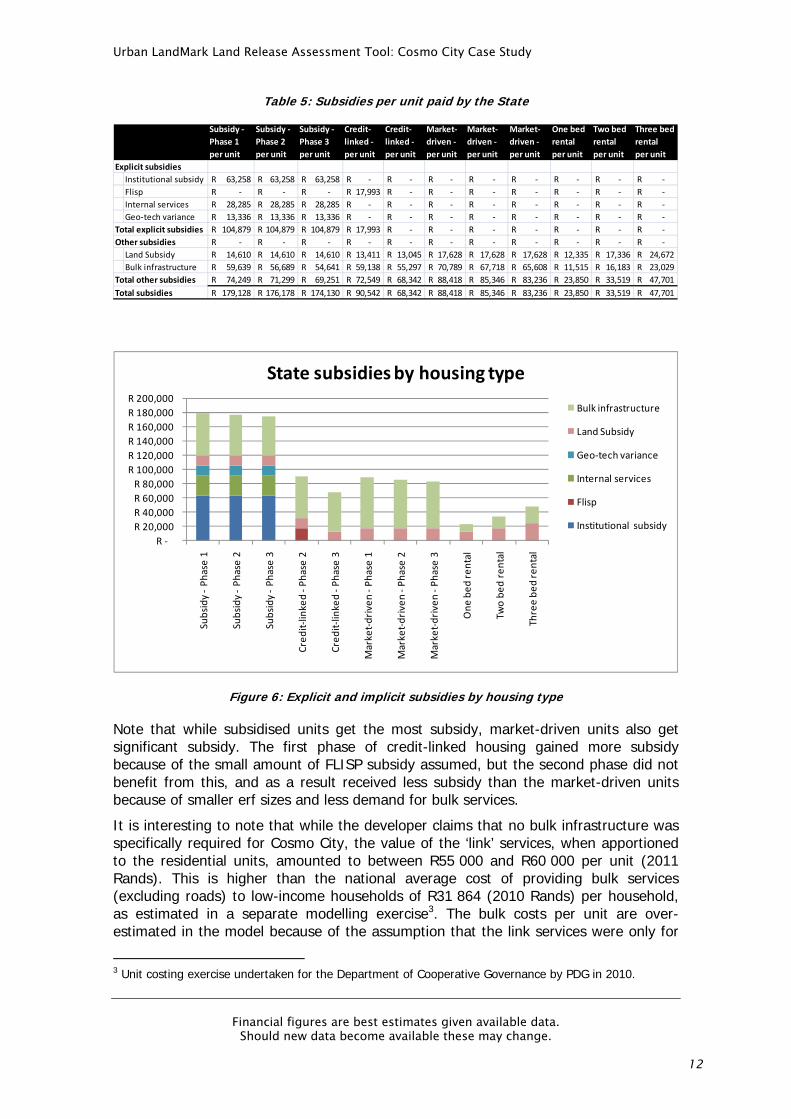
An analysis of the State subsidies shows that while explicit subsidies were provided to only the subsidised units (and to a limited extent the first phase of credit-linked units), a fairly significant implicit subsidy was provided across the board, including to the market-driven units, in the form of a land and bulk infrastructure subsidy.
Urban LandMark Land Release Assessment Tool: Cosmo City Case Study
Financial figures are best estimates given available data. Should new data become available these may change.
12
Table 5: Subsidies per unit paid by the State
Subsidy ‐
Phase 1
Subsidy ‐
Phase 2
Subsidy ‐
Phase 3
Credit‐
linked ‐
Credit‐
linked ‐
Market‐
driven ‐
Market‐
driven ‐
Market‐
driven ‐
One bed
rental
Two bed
rental
Three bed
rental
per unit per unit per unit per unit per unit per unit per unit per unit per unit per unit per unit
Explicit subsidies
Institutional subsidy 63,258R 63,258R 63,258R ‐R ‐R ‐R ‐R ‐R ‐R ‐R ‐R
Flisp ‐R ‐R ‐R 17,993R ‐R ‐R ‐R ‐R ‐R ‐R ‐R
Internal services 28,285R 28,285R 28,285R ‐R ‐R ‐R ‐R ‐R ‐R ‐R ‐R
Geo‐tech variance 13,336R 13,336R 13,336R ‐R ‐R ‐R ‐R ‐R ‐R ‐R ‐R
Total explicit subsidies 104,879R 104,879R 104,879R 17,993R ‐R ‐R ‐R ‐R ‐R ‐R ‐R
Other subsidies ‐R ‐R ‐R ‐R ‐R ‐R ‐R ‐R ‐R ‐R ‐R
Land Subsidy 14,610R 14,610R 14,610R 13,411R 13,045R 17,628R 17,628R 17,628R 12,335R 17,336R 24,672R
Bulk infrastructure 59,639R 56,689R 54,641R 59,138R 55,297R 70,789R 67,718R 65,608R 11,515R 16,183R 23,029R
Total other subsidies 74,249R 71,299R 69,251R 72,549R 68,342R 88,418R 85,346R 83,236R 23,850R 33,519R 47,701R
Total subsidies 179,128R 176,178R 174,130R 90,542R 68,342R 88,418R 85,346R 83,236R 23,850R 33,519R 47,701R
R ‐
R 20,000
R 40,000
R 60,000
R 80,000
R 100,000
R 120,000
R 140,000
R 160,000
R 180,000
R 200,000
Subsidy ‐Phase 1
Subsidy ‐Phase 2
Subsidy ‐Phase 3
Credit‐linked ‐Phase 2
Credit‐linked ‐Phase 3
Market‐driven ‐Phase 1
Market‐driven ‐Phase 2
Market‐driven ‐Phase 3
One bed rental
Two bed rental
Three bed rental
State subsidies by housing type
Bulk infrastructure
Land Subsidy
Geo‐tech variance
Internal services
Flisp
Institutional subsidy
Figure 6: Explicit and implicit subsidies by housing type
Note that while subsidised units get the most subsidy, market-driven units also get significant subsidy. The first phase of credit-linked housing gained more subsidy because of the small amount of FLISP subsidy assumed, but the second phase did not benefit from this, and as a result received less subsidy than the market-driven units because of smaller erf sizes and less demand for bulk services.
It is interesting to note that while the developer claims that no bulk infrastructure was specifically required for Cosmo City, the value of the ‘link’ services, when apportioned to the residential units, amounted to between R55 000 and R60 000 per unit (2011 Rands). This is higher than the national average cost of providing bulk services (excluding roads) to low-income households of R31 864 (2010 Rands) per household, as estimated in a separate modelling exercise3. The bulk costs per unit are over-estimated in the model because of the assumption that the link services were only for
3 Unit costing exercise undertaken for the Department of Cooperative Governance by PDG in 2010.
Urban LandMark Land Release Assessment Tool: Cosmo City Case Study
Financial figures are best estimates given available data. Should new data become available these may change.
13
the residential units, when in actual fact they were provided for all the erven in Cosmo City, including institutional and commercial. However, other bulk costs to the city (such as the impact on wastewater treatment works and bulk electricity infrastructure) were not included in the model.
The total amount of implicit and explicit subsidy provided by the State for Cosmo City is estimated at R1.421 billion (2011 Rands).
8.3 The Household perspective Costs and benefits for households are discounted to the first date of occupation in the model. This is problematic when considering multiple housing types with multiple dates of occupation. For this reason, the costs and benefits have been de-escalated to 2000 Rand values and then re-escalated to 2011 Rand values.
Recipients of the fully subsidised houses were not required to contribute toward their houses (even the R2 479 ‘top-up’ required in later housing policies was foregone) and thus did not incur any finance charges. The discount rate that has been used for the buyers of the credit-linked and market-driven units is prime + 1, which is the same as for the Western Cape case studies. It is noted, however, that Rust estimates that lending in the affordable market is around prime + 2. In the current lending market, interest rates for the high-risk customers at the lowest end of the income spectrum is likely to be at an even higher rate than this, but given that the discount rate entered in the model is an average figure, and that some of the households in Cosmo City are middle-income, prime + 2 is probably a reasonable estimate. Property value escalation on all the units is estimated at 10% per annum, which is approximately what the increase in sales prices for the bonded units has shown. The final NPV for each of the unit types is shown in Table 6 below.
Table 6: Inflows and outflows from the Household perspective
Subsidy ‐
Phase 1
Subsidy ‐
Phase 2
Subsidy ‐
Phase 3
Credit‐
linked ‐
Credit‐
linked ‐
Market‐
driven ‐
Market‐
driven ‐
Market‐
driven ‐
One bed
rental
Two bed
rental
Three bed
rental
per unit per unit per unit per unit per unit per unit per unit per unit per unit per unit per unit
Inflows
Net Purchase 63,991R 60,152R 50,845R ‐R ‐R ‐R ‐R ‐R ‐R ‐R ‐R
Imputed Rent* 145,056R 141,009R 127,255R 356,865R 398,302R 572,984R 742,361R 862,028R 438,982R 819,433R 965,761R
Subsidy ‐R ‐R ‐R 12,568R ‐R ‐R ‐R ‐R ‐R ‐R ‐R
Total inflows 209,047R 201,161R 178,101R 369,434R 398,302R 572,984R 742,361R 862,028R 438,982R 819,433R 965,761R
Outflows ‐R ‐R ‐R ‐R ‐R ‐R ‐R ‐R ‐R ‐R ‐R
Electricity ‐37,650R ‐36,489R ‐32,593R ‐79,252R ‐66,004R ‐108,959R ‐104,541R ‐95,895R ‐29,570R ‐39,435R ‐66,022R
Water ‐3,821R ‐3,633R ‐2,992R ‐10,352R ‐7,857R ‐18,760R ‐16,285R ‐14,517R ‐266R ‐3,609R ‐7,881R
Property Tax ‐282R ‐206R ‐226R ‐8,885R ‐12,330R ‐21,865R ‐28,896R ‐35,184R ‐R ‐R ‐R
Sewage ‐1,160R ‐1,103R ‐908R ‐2,858R ‐2,169R ‐4,134R ‐3,588R ‐3,199R ‐306R ‐1,359R ‐3,058R
Refuse Removal ‐3,227R ‐2,870R ‐2,643R ‐7,730R ‐7,247R ‐11,476R ‐13,650R ‐12,168R ‐R ‐R ‐R
Maintenance ‐6,226R ‐5,919R ‐4,875R ‐6,492R ‐6,340R ‐11,101R ‐12,848R ‐14,317R ‐R ‐R ‐R
Insurance ‐R ‐R ‐R ‐15,582R ‐15,215R ‐26,643R ‐30,836R ‐34,361R ‐R ‐R ‐R
Rent ‐R ‐R ‐R ‐R ‐R ‐R ‐R ‐R ‐438,982R ‐819,433R ‐965,761R
Net Purchase ‐R ‐R ‐R ‐93,345R ‐93,341R ‐159,851R ‐199,618R ‐227,414R ‐R ‐R ‐R
Total outflows ‐52,365R ‐50,220R ‐44,237R ‐224,496R ‐210,502R ‐362,788R ‐410,262R ‐437,056R ‐469,124R ‐863,837R ‐1,042,722R
Net Position 156,682R 150,941R 133,864R 144,938R 187,800R 210,197R 332,098R 424,972R ‐30,142R ‐44,403R ‐76,961R
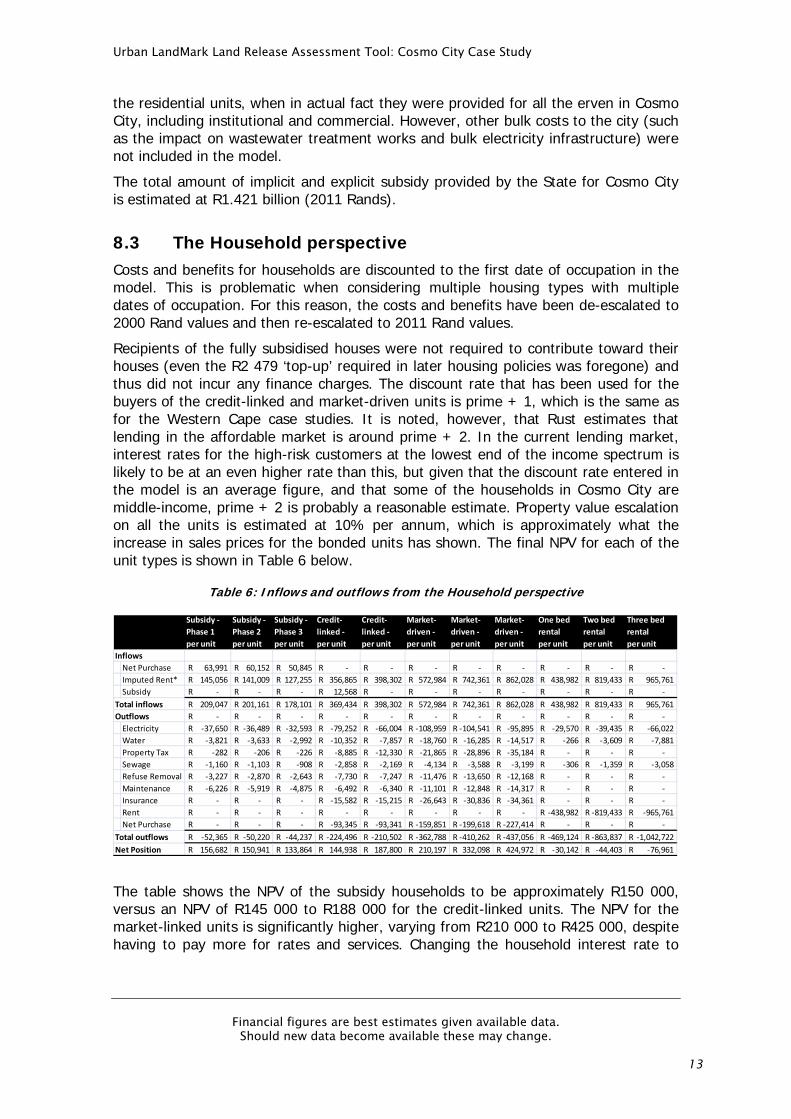
The table shows the NPV of the subsidy households to be approximately R150 000, versus an NPV of R145 000 to R188 000 for the credit-linked units. The NPV for the market-linked units is significantly higher, varying from R210 000 to R425 000, despite having to pay more for rates and services. Changing the household interest rate to
Urban LandMark Land Release Assessment Tool: Cosmo City Case Study
Financial figures are best estimates given available data. Should new data become available these may change.
14
prime+2 lowered the NPV for the credit-linked units by 27% and the market-driven units by 28%.
The Eighty20 report notes that the ”Net Purchase variable represents the present value of the proceeds from the sale of the unit in 20 years, less the cost of purchase including financing charges and transfer taxes”. The net purchase is positive only for the subsidy units, but is a net loss for the other ownership units, despite assuming a 10% property price escalation. The Eighty20 report concludes that this variable is highly sensitive to property price escalation assumptions.
The higher NPV for the credit-linked and market-driven units is largely related to the imputed rent that is generated from the higher-value properties. Imputed rent4 has been assumed to be 7%, in line with the Western Cape models and the Stats SA CPI estimate. However, the NPV is highly sensitive to this variable.
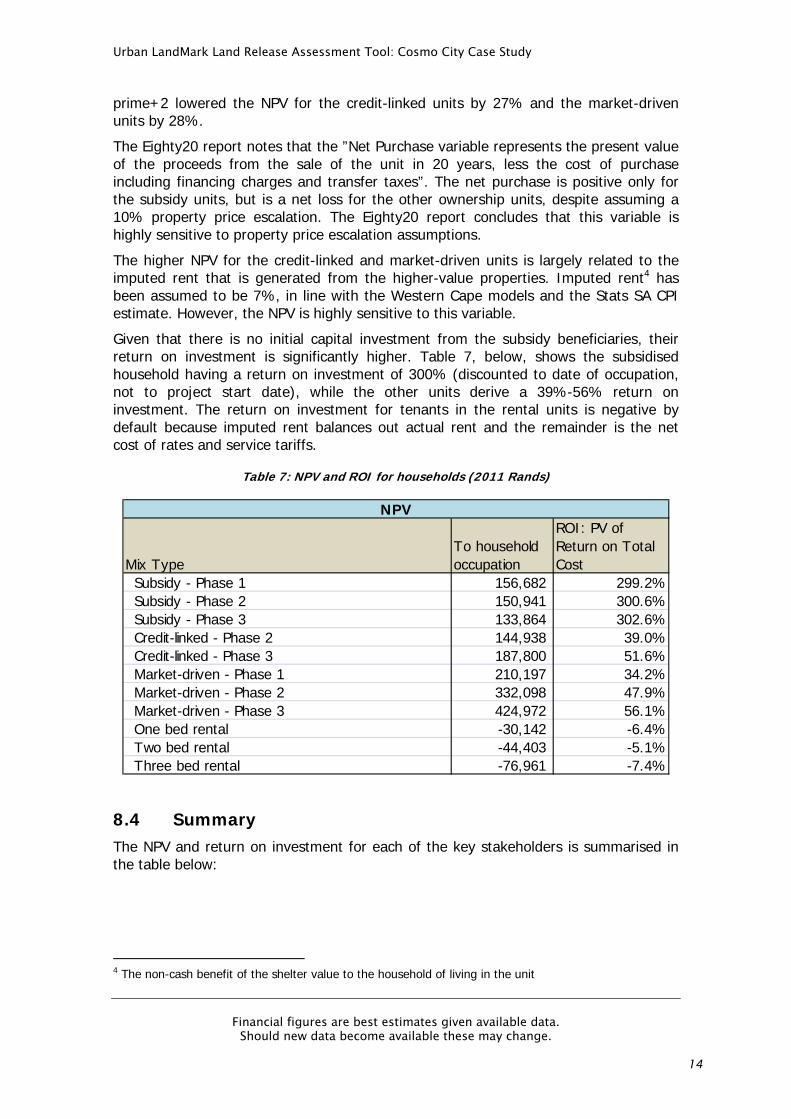
Given that there is no initial capital investment from the subsidy beneficiaries, their return on investment is significantly higher. Table 7, below, shows the subsidised household having a return on investment of 300% (discounted to date of occupation, not to project start date), while the other units derive a 39%-56% return on investment. The return on investment for tenants in the rental units is negative by default because imputed rent balances out actual rent and the remainder is the net cost of rates and service tariffs.
Table 7: NPV and ROI for households (2011 Rands)
Mix TypeTo household occupation
ROI: PV of Return on Total Cost
Subsidy - Phase 1 156,682 299.2%Subsidy - Phase 2 150,941 300.6%Subsidy - Phase 3 133,864 302.6%Credit-linked - Phase 2 144,938 39.0%Credit-linked - Phase 3 187,800 51.6%Market-driven - Phase 1 210,197 34.2%Market-driven - Phase 2 332,098 47.9%Market-driven - Phase 3 424,972 56.1%One bed rental -30,142 -6.4%Two bed rental -44,403 -5.1%Three bed rental -76,961 -7.4%
NPV
8.4 Summary The NPV and return on investment for each of the key stakeholders is summarised in the table below:
4 The non-cash benefit of the shelter value to the household of living in the unit

Urban LandMark Land Release Assessment Tool: Cosmo City Case Study
Financial figures are best estimates given available data. Should new data become available these may change.
15
Table 8: Summary of NPV and ROI for all actors and unit types
NPV and ROI State Developer Household
Total NPV Subsidy ‐ Phase 1 ‐324,129,192R ‐15,208,046R
Subsidy ‐ Phase 2 ‐375,016,007R ‐14,428,291R
Subsidy ‐ Phase 3 ‐240,297,288R ‐12,126,036R
Credit‐linked ‐ Phase 2 ‐48,176,873R 6,237,277R
Credit‐linked ‐ Phase 3 7,618,243R ‐8,671,529R
Market‐driven ‐ Phase 1 21,249,406R 17,521,712R
Market‐driven ‐ Phase 2 31,055,509R 32,253,480R
Market‐driven ‐ Phase 3 166,401,352R 208,608,577R
One bed rental ‐7,090,783R 10,877,447R
Two bed rental ‐15,587,150R 57,171,866R
Three bed rental ‐266,033R 1,860,819R
Total ‐784,238,814R 284,097,275R
NPV per Unit Subsidy ‐ Phase 1 ‐192,247R ‐9,020R 156,682R
Subsidy ‐ Phase 2 ‐188,450R ‐7,250R 150,941R
Subsidy ‐ Phase 3 ‐182,597R ‐9,214R 133,864R
Credit‐linked ‐ Phase 2 ‐36,007R 4,662R 144,938R
Credit‐linked ‐ Phase 3 4,200R ‐4,780R 187,800R
Market‐driven ‐ Phase 1 20,238R 16,687R 210,197R
Market‐driven ‐ Phase 2 60,185R 62,507R 332,098R
Market‐driven ‐ Phase 3 92,754R 116,281R 424,972R
One bed rental ‐83,421R 127,970R ‐30,142R
Two bed rental ‐82,038R 300,905R ‐44,403R
Three bed rental ‐44,339R 310,137R ‐76,961R
ROI: PV of RetuSubsidy ‐ Phase 1 ‐164% ‐21% 557%
Subsidy ‐ Phase 2 ‐164% ‐18% 559%
Subsidy ‐ Phase 3 ‐162% ‐22% 563%
Credit‐linked ‐ Phase 2 ‐35% 5% 73%
Credit‐linked ‐ Phase 3 5% ‐4% 96%
Market‐driven ‐ Phase 1 16% 10% 64%
Market‐driven ‐ Phase 2 50% 39% 89%
Market‐driven ‐ Phase 3 79% 69% 104%
One bed rental ‐311% 57% ‐12%
Two bed rental ‐164% 84% ‐10%
Three bed rental ‐60% 67% ‐14%
Total ‐60% 24%
Urban LandMark Land Release Assessment Tool: Cosmo City Case Study
Financial figures are best estimates given available data. Should new data become available these may change.
16
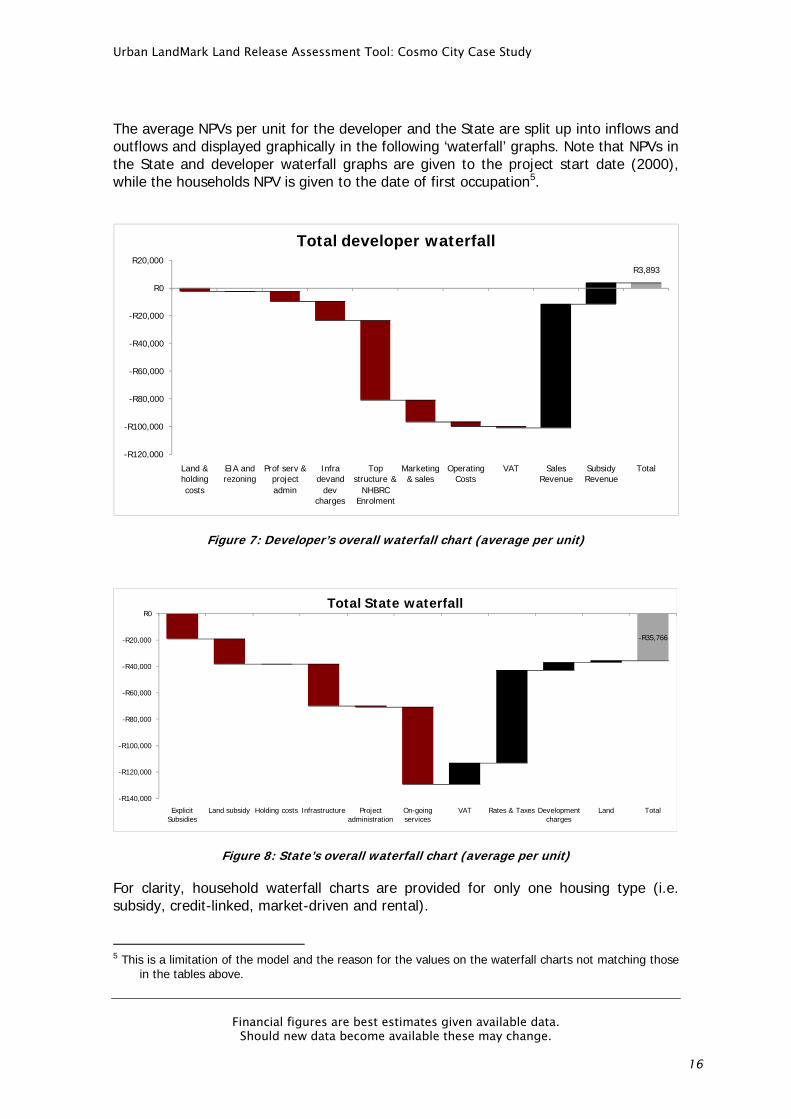
The average NPVs per unit for the developer and the State are split up into inflows and outflows and displayed graphically in the following ‘waterfall’ graphs. Note that NPVs in the State and developer waterfall graphs are given to the project start date (2000), while the households NPV is given to the date of first occupation5.
R3,893
-R120,000
-R100,000
-R80,000
-R60,000
-R40,000
-R20,000
R0
R20,000
Land & holding costs
EIA and rezoning
Prof serv & project admin
Infra devand
dev charges
Top structure &
NHBRC Enrolment
Marketing & sales
Operating Costs
VAT Sales Revenue
Subsidy Revenue
Total
Total developer waterfall
Figure 7: Developer’s overall waterfall chart (average per unit)
-R35,766
-R140,000
-R120,000
-R100,000
-R80,000
-R60,000
-R40,000
-R20,000
R0
Explicit Subsidies
Land subsidy Holding costs Infrastructure Project administration
On-going services
VAT Rates & Taxes Development charges
Land Total
Total State waterfall
Figure 8: State’s overall waterfall chart (average per unit)
For clarity, household waterfall charts are provided for only one housing type (i.e. subsidy, credit-linked, market-driven and rental). 5 This is a limitation of the model and the reason for the values on the waterfall charts not matching those
in the tables above.

Urban LandMark Land Release Assessment Tool: Cosmo City Case Study
Financial figures are best estimates given available data. Should new data become available these may change.
17
R0
R114,379
‐R60,000
‐R40,000
‐R20,000
R0
R20,000
R40,000
R60,000
R80,000
R100,000
R120,000
R140,000
Electricity Water Property Tax Sewage Refuse Removal
Maintenance Insurance Rent Net Purchase Imputed Rent*
Subsidy Total
Subsidy Phase 1
Figure 9: Household waterfall chart for subsidy phase 1 units
R0
R111,519
‐R200,000
‐R150,000
‐R100,000
‐R50,000
R0
R50,000
R100,000
R150,000
Electricity Water Property Tax Sewage Refuse Removal
Maintenance Insurance Rent Net Purchase Imputed Rent*
Subsidy Total
Credit-linked Phase 2
Figure 10: Household waterfall chart for credit-linked phase 2 units

Urban LandMark Land Release Assessment Tool: Cosmo City Case Study
Financial figures are best estimates given available data. Should new data become available these may change.
18
R0
R153,445
‐R300,000
‐R250,000
‐R200,000
‐R150,000
‐R100,000
‐R50,000
R0
R50,000
R100,000
R150,000
R200,000
Electricity Water Property Tax Sewage Refuse Removal
Maintenance Insurance Rent Net Purchase
Imputed Rent*
Subsidy Total
Market-linked Phase 1
Figure 11: Household waterfall chart for market-linked phase 1 units
R0‐R74,287
‐R1,200,000
‐R1,000,000
‐R800,000
‐R600,000
‐R400,000
‐R200,000
R0
Electricity Water Property Tax Sewage Refuse Removal
Maintenance Insurance Rent Net Purchase
Imputed Rent*
Subsidy Total
Three bed rental
Figure 12: Household waterfall chart for three-bed rental units
9 Conclusion
Cosmo City is a complex case study to model because of the scale of the project, both in terms of the multiple housing typologies and the long timeframe of project construction. A further complication is caused by the number of role-players involved in the development. As such, it is difficult to compile financial figures with any degree of accuracy.
However, some provisional conclusions can be drawn:
Cosmo City involved heavy subsidies from both the State and the province. Large implicit subsidies exist in the land and bulk infrastructure provided for all housing typologies. The State makes a large net loss on the subsidy units and a small net loss on the credit-linked units. However, the State makes a significant return on investment
Urban LandMark Land Release Assessment Tool: Cosmo City Case Study
Financial figures are best estimates given available data. Should new data become available these may change.
19
on the market-driven and rental units, but insufficient to offset the losses from the subsidy units, resulting in a net return on investment of -32.5%.
The developer has been treated monolithically in the model and the results are highly speculative. The model shows a net return on investment of 13%, which seems reasonable, despite the fact that this represents the aggregated benefit to all developers. As would be expected, the return on investment is positive for the market-driven units. The net cost/benefit is marginal for the credit-linked units, and negative for the subsidised units, indicating a level of internal cross-subsidy within the project. The net benefit is highest for the rental units because of the rental revenue and the assumed property value escalation and sale after 20 years.
The net benefit for all owner households is positive, with the general trend of increasing net benefit with property value. This is counter to the findings of the Western Cape case studies, where the subsidy households were shown to have the highest net benefit because of not having to purchase the property. However, the findings of this model are strongly driven by the imputed rent percentage. This is a variable that needs further investigation. Rental households are shown to be in the worst position after 20 years.
Urban LandMark Land Release Assessment Tool: Cosmo City Case Study
Financial figures are best estimates given available data. Should new data become available these may change.
20
References
Affordable Land and Housing Data Centre (2011) On-line housing and land resource, developed by FinMark Trust, Urban LandMark, Eighty20 and Lightstone. . http://www.alhdc.org.za/ Accessed on 04 April 2011.
Rust (2009) Gap Housing: The Next Property Boom - A conference on innovative funding and delivery. Input to the I H S Conference (16 September 2009): What is the gap market?