Embed Size (px)
Citation preview
HAL Id: hal-01710641https://hal.archives-ouvertes.fr/hal-01710641
Submitted on 26 Feb 2018
HAL is a multi-disciplinary open accessarchive for the deposit and dissemination of sci-entific research documents, whether they are pub-lished or not. The documents may come fromteaching and research institutions in France orabroad, or from public or private research centers.
L’archive ouverte pluridisciplinaire HAL, estdestinée au dépôt et à la diffusion de documentsscientifiques de niveau recherche, publiés ou non,émanant des établissements d’enseignement et derecherche français ou étrangers, des laboratoirespublics ou privés.
Urban hydrologic trend analysis based on rainfall andrunoff data analysis and conceptual model calibration
S. Sun, S. Barraud, F. Branger, Isabelle Braud, H. Castebrunet
To cite this version:S. Sun, S. Barraud, F. Branger, Isabelle Braud, H. Castebrunet. Urban hydrologic trend analysisbased on rainfall and runoff data analysis and conceptual model calibration. Hydrological Processes,Wiley, 2017, 31 (6), pp.1349-1359. �10.1002/hyp.11109�. �hal-01710641�
Manuscript accepted for publication in Hydrological Processes, December 2016, doi: 10.1002/hyp.11109
1
Urban hydrologic trend analysis based on rainfall and runoff data analysis and conceptual 1
model calibration 2
1*
Siao Sun; 2Sylvie Barraud;
3Flora Branger;
3Isabelle Braud;
2Hélène Castebrunet 3
*Corresponding author: [email protected] 4
1 Key laboratory of Regional Sustainable Development Modeling, Institute of Geographical 5
Sciences and Natural Resource Research, Chinese Academy of Sciences, Beijing, 100101, 6
People’s Republic of China 7
2University of Lyon, INSA Lyon, DEEP, F-69621 Villeurbanne CEDEX, France. 8
3Irstea, UR HHLY, Hydrology-Hydraulics, 5 rue de La Doua, BP 32108,F-69616 9
Villeurbanne CEDEX, France. 10
11
Keywords 12
Urban hydrology; urbanization; conceptual rainfall-runoff model; trend analysis; Mann-13
Kendall test 14
Abstract 15
16
Urban stormwater is a major cause of urban flooding and natural water pollution. It is 17
therefore important to assess any hydrologic trends in urban catchments for stormwater 18
management and planning. This study addresses urban hydrological trend analysis by 19
examining trends in variables that characterize hydrological processes. The original and 20
modified Mann-Kendall methods are applied to trend detection in two French catchments, i.e., 21
Chassieu and La Lechere, based on approximately one decade of data from local monitoring 22
programs. In both catchments, no trend is found in the major hydrological process driver (i.e., 23
rainfall variables), whereas increasing trends are detected in runoff flow rates. As a 24
consequence, the runoff coefficients tend to increase during the study period, probably due to 25
growing imperviousness with the local urbanization process. In addition, conceptual urban 26
rainfall-runoff model parameters, which are identified via model calibration with an event 27
Author-produced version of the article published in Hydrological Processes, Volume 31, Issue 6, 15 March 2017, Pages 1349–1359 The original publication is available at http://onlinelibrary.wiley.com/doi/10.1002/hyp.11109/abstract
Manuscript accepted for publication in Hydrological Processes, December 2016, doi: 10.1002/hyp.11109
2
based approach, are examined. Trend detection results indicate that there is no trend in the 28
time of concentration in Chassieu, whereas a decreasing trend is present in La Lechere, which, 29
however, needs to be validated with additional data. Sensitivity analysis indicates that the 30
original Mann-Kendall method is not sensitive to a few noisy values in the data series. 31
1. Introduction 32
Urban stormwater is a major cause of urban flooding and water pollution, which can lead to 33
serious economic and social consequences. Currently, it is widely recognized that effects that 34
are closely related to human activities, such as climate change and urbanization can result in 35
significant alteration of stormwater quantity and quality (e.g., Astaraie-Imani et al., 2012). 36
The design and operation of urban storm water projects that aim to reduce the adverse impact 37
of stormwater should take possible changes in urban hydrology patterns into account. It is 38
therefore important to assess any hydrologic trend (if one exists) in urban catchments. 39
Considerable attention has been paid to trend analysis in research areas in climatology, 40
hydrology and water quality in recent years. Examples of trend detection applications in water 41
resources studies include trend studies of precipitation (e.g., Xu et al., 2003; Partal and Kahya, 42
2006; Gocic and Trajkovic, 2013), streamflow (e.g., Douglas et al., 2000; Zhang et al., 2001; 43
Burn and Elnur, 2002; Yue et al., 2002; Aziz and Burn, 2006), and river and drainage water 44
quality (Hirsch et al., 1982; Awadallah et al., 2011; Sun et al., 2015). A number of trend 45
detection methods including parametric and non-parametric tests have been applied (Hess et 46
al. 2001). A non-parametric test is generally more suitable for non-normally distributed and 47
censored data, which are frequently encountered in water resources data (Yue et al., 2002). 48
The Mann-Kendall method (Mann, 1945; Kendall, 1955) is one of the most commonly used 49
non-parametric trend detection tests (e.g., Omar et al., 2006). Because the Mann-Kendall 50
method generally requires serial independence, some previous studies have modified the 51
Author-produced version of the article published in Hydrological Processes, Volume 31, Issue 6, 15 March 2017, Pages 1349–1359 The original publication is available at http://onlinelibrary.wiley.com/doi/10.1002/hyp.11109/abstract
Manuscript accepted for publication in Hydrological Processes, December 2016, doi: 10.1002/hyp.11109
3
Mann-Kendall Method to apply it to data presenting seasonality or serial correlations (e.g., 52
Hirsch and Slack, 1984; Hamed and Rao, 1998; Yue et al., 2002). 53
A rainfall-runoff model that transforms the meteorological forcing (rainfall) into the 54
hydrological response of a catchment (runoff) is an important tool for theoretical and applied 55
research in hydrology. A simple conceptual rainfall-runoff model can sometimes serve as a 56
powerful tool for aiding in understanding local hydrological processes. For instance, the 57
hydrological response can be linked to landscape attributes by deriving the relationship 58
between hydrological model parameters and landscape attributes (e.g., Post and Jakeman, 59
1999). Statistically significant correlations between some parameters of a conceptual daily 60
rainfall-runoff model and the catchment physical and climatic characteristics were found 61
(Chiew et al., 2002). Hence, the interpretability of the rainfall-runoff model parameters can 62
possibly shed some light on the hydrologic behaviour of a catchment (Maneta et al., 2007). 63
Given the importance of assessing hydrologic trend in urban catchments, the main objective 64
of this paper is to present a methodology that identifies and quantifies hydrologic trend. The 65
hydrological trend analysis is addressed using a dual approach, i.e., by analysing both rainfall 66
and runoff data and model parameters identified from the calibration of a conceptual 67
hydrological model. The rationale of examining possible hydrological trends via calibrated 68
hydrological model parameters is that if there is any change in the local hydrologic process, 69
non-stationarity will probably be present in model parameters characterizing the temporal 70
hydrological process. In addition to direct analysis of rainfall and runoff data, a conceptual 71
urban hydrological model helps investigate more characteristics of local hydrology (e.g., 72
initial precipitation losses and the time of concentration), which cannot be measured directly. 73
However, it should be noted that the evolution of hydrological processes is an aggregate result 74
of changes of many distributed factors and processes on smaller scales (than the catchment 75
scale) in local hydrology (e.g., changes in distributed land uses and hydrological properties), 76
Author-produced version of the article published in Hydrological Processes, Volume 31, Issue 6, 15 March 2017, Pages 1349–1359 The original publication is available at http://onlinelibrary.wiley.com/doi/10.1002/hyp.11109/abstract
Manuscript accepted for publication in Hydrological Processes, December 2016, doi: 10.1002/hyp.11109
4
using a conceptual rainfall-runoff model, this study only addresses the evolution of model 77
parameters that are highly lumped on the catchment scale which reveal the general 78
hydrological responses of urban/peri-urban catchments. The evolution of the hydrological 79
trend provides the most direct evidence of changes in local hydrology and the quantification 80
of the trends in relevant parameters is useful in urban stormwater management. The evolution 81
of processes, factors and properties on smaller scales than the catchment scale is beyond the 82
discussion of this study. This study also provides guidance for analysing long-term 83
hydrological trends by applying temporal calibration of a conceptual hydrological model. The 84
effectiveness of such an approach is demonstrated via applications of the methodology to two 85
French catchments. 86
2. Case studies and data 87
Two urban catchments in the suburbs of Lyon, France, i.e., the Chassieu catchment and the La 88
Lechere catchment, are studied in this paper. Both catchments are monitoring sites under the 89
OTHU program (www.othu.org), which has been operating for over a decade to improve our 90
knowledge on urban water system management by acquiring reliable data of both wet and dry 91
weather flows and their impacts on the receiving environment. 92
The Chassieu catchment is located in the east of the Greater Lyon area. It covers an industrial 93
area of 185 ha with an imperviousness coefficient of approximately 0.72. The catchment is 94
drained by a separate stormwater sewer system, which also receives dry weather flows from 95
cooling of industrial processes (that can be assumed clean). The pervious area is not 96
connected to the sewer system. Rainfall in Chassieu was measured by a tipping-bucket rain 97
gauge installed in the catchment, and a six-minute rainfall time series is available. The 98
catchment runoff flow rate was computed from water depth measurements in the 1.6 m 99
circular concrete pipe at the outlet of the catchment using the Manning equation (calibrated 100
and validated using measured water depth and velocity data in the pipe) with a two-minute 101
Author-produced version of the article published in Hydrological Processes, Volume 31, Issue 6, 15 March 2017, Pages 1349–1359 The original publication is available at http://onlinelibrary.wiley.com/doi/10.1002/hyp.11109/abstract
Manuscript accepted for publication in Hydrological Processes, December 2016, doi: 10.1002/hyp.11109
5
interval from 2004 to 2011. The rainfall and runoff time series suffer from 7.4% and 13.1% 102
missing data, respectively. 103
La Lechere catchment is located to the west of Lyon. The catchment covers a maximum area 104
of 410ha when all of the combined sewer overflows (CSOs) are activated. The land in the 105
catchment is mainly composed of urban areas (53%), agricultural fields (45%) and forests 106
(3%) (Braud et al., 2013). The urban areas are drained by combined sewer networks, with 107
several CSOs connected to the Chaudanne River. The contributing area of stormwater to the 108
combined sewer system is approximately 120 ha (stormwater from other areas are not 109
connected to the sewers). In addition to the CSOs, the Chaudanne River also receives natural 110
flows from rural areas. More details about the catchment can be found in Jankowfsky et al. 111
(2014). Rainfall was measured by a tipping-bucket rain gauge located in the catchment. A 112
one-minute rainfall time series is available with approximately 13.7% missing data. The 113
runoff flow in the Chaudanne River, mainly composed of CSOs from urban areas and natural 114
streamflow from rural areas, was computed from water depth measurements in the calibrated 115
Parshall flume at a gauge station. The runoff flow data are registered with varied time steps, 116
typically from two minutes to one hour. A two-minute time series was created using a linear 117
interpolation method. 2.8% of the runoff flow data is missing. Rainfall and flow data are both 118
available from June 2005 to December 2014. 119
3. Methodology 120
3.1 Mann-Kendal test and modified Mann-Kendall test 121
The Mann-Kendall method is a rank-based nonparametric trend detection test extensively 122
applied in climatology and hydrology. The null hypothesis of the Mann-Kendall test H0 states 123
that the data are a sample of n independent and identically distributed random variables, 124
whereas the alternative hypothesis H1 is that xk and xj are not from identical distributions (k, j 125
<= n and k ≠ j). The test statistic S is defined as: 126
Author-produced version of the article published in Hydrological Processes, Volume 31, Issue 6, 15 March 2017, Pages 1349–1359 The original publication is available at http://onlinelibrary.wiley.com/doi/10.1002/hyp.11109/abstract
Manuscript accepted for publication in Hydrological Processes, December 2016, doi: 10.1002/hyp.11109
6
1
1 1
sgnn
k
n
kj
kj xxS (1)
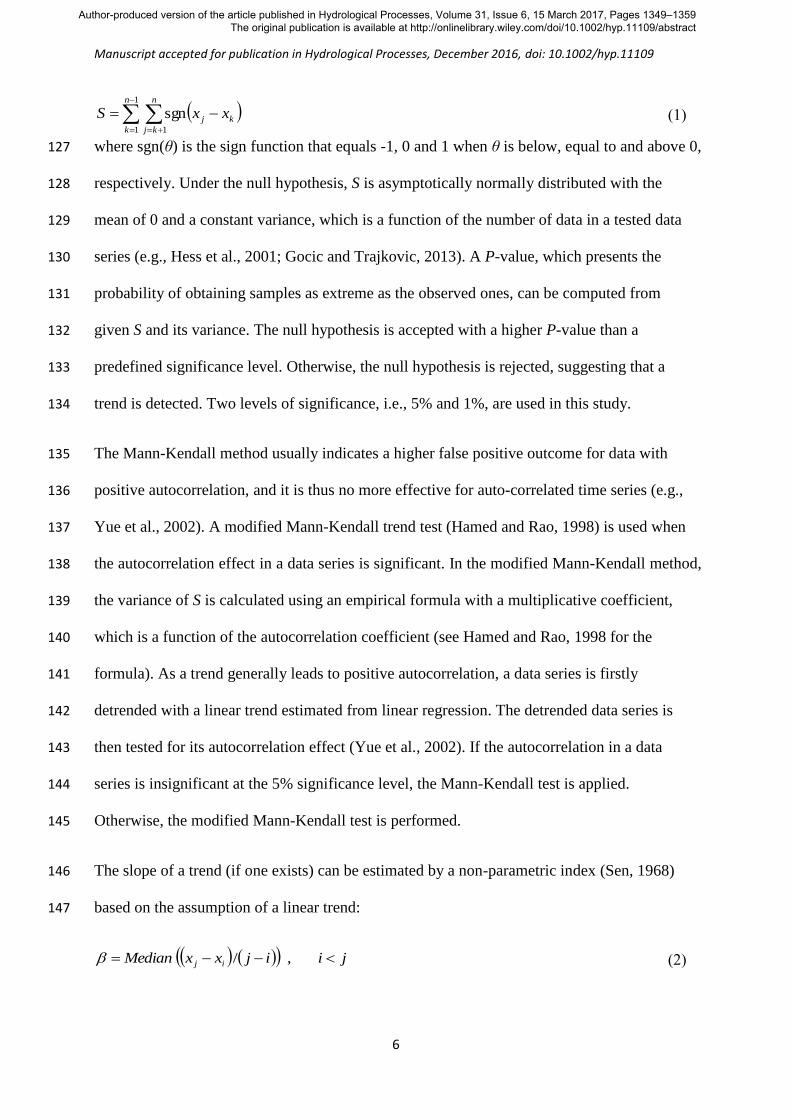
where sgn(θ) is the sign function that equals -1, 0 and 1 when θ is below, equal to and above 0, 127
respectively. Under the null hypothesis, S is asymptotically normally distributed with the 128
mean of 0 and a constant variance, which is a function of the number of data in a tested data 129
series (e.g., Hess et al., 2001; Gocic and Trajkovic, 2013). A P-value, which presents the 130
probability of obtaining samples as extreme as the observed ones, can be computed from 131
given S and its variance. The null hypothesis is accepted with a higher P-value than a 132
predefined significance level. Otherwise, the null hypothesis is rejected, suggesting that a 133
trend is detected. Two levels of significance, i.e., 5% and 1%, are used in this study. 134
The Mann-Kendall method usually indicates a higher false positive outcome for data with 135
positive autocorrelation, and it is thus no more effective for auto-correlated time series (e.g., 136
Yue et al., 2002). A modified Mann-Kendall trend test (Hamed and Rao, 1998) is used when 137
the autocorrelation effect in a data series is significant. In the modified Mann-Kendall method, 138
the variance of S is calculated using an empirical formula with a multiplicative coefficient, 139
which is a function of the autocorrelation coefficient (see Hamed and Rao, 1998 for the 140
formula). As a trend generally leads to positive autocorrelation, a data series is firstly 141
detrended with a linear trend estimated from linear regression. The detrended data series is 142
then tested for its autocorrelation effect (Yue et al., 2002). If the autocorrelation in a data 143
series is insignificant at the 5% significance level, the Mann-Kendall test is applied. 144
Otherwise, the modified Mann-Kendall test is performed. 145
The slope of a trend (if one exists) can be estimated by a non-parametric index (Sen, 1968) 146
based on the assumption of a linear trend: 147
jiijxxMedian ij ,/ (2)
Author-produced version of the article published in Hydrological Processes, Volume 31, Issue 6, 15 March 2017, Pages 1349–1359 The original publication is available at http://onlinelibrary.wiley.com/doi/10.1002/hyp.11109/abstract
Manuscript accepted for publication in Hydrological Processes, December 2016, doi: 10.1002/hyp.11109
7
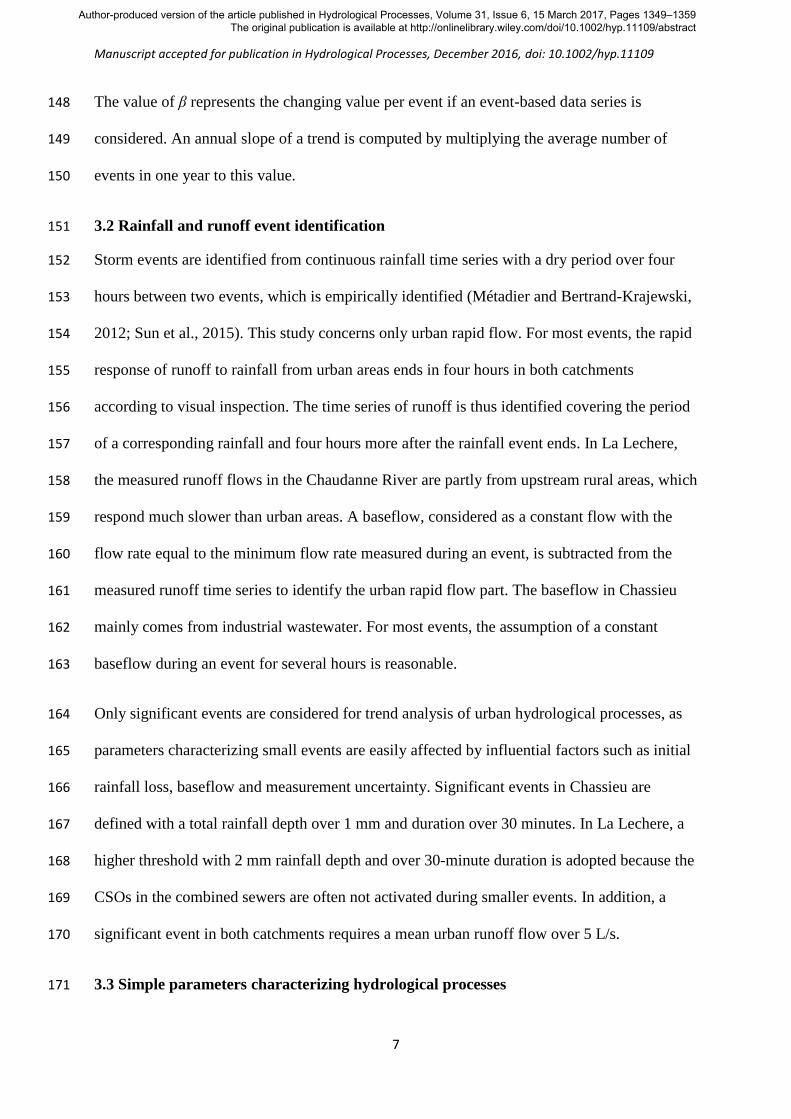
The value of β represents the changing value per event if an event-based data series is 148
considered. An annual slope of a trend is computed by multiplying the average number of 149
events in one year to this value. 150
3.2 Rainfall and runoff event identification 151
Storm events are identified from continuous rainfall time series with a dry period over four 152
hours between two events, which is empirically identified (Métadier and Bertrand-Krajewski, 153
2012; Sun et al., 2015). This study concerns only urban rapid flow. For most events, the rapid 154
response of runoff to rainfall from urban areas ends in four hours in both catchments 155
according to visual inspection. The time series of runoff is thus identified covering the period 156
of a corresponding rainfall and four hours more after the rainfall event ends. In La Lechere, 157
the measured runoff flows in the Chaudanne River are partly from upstream rural areas, which 158
respond much slower than urban areas. A baseflow, considered as a constant flow with the 159
flow rate equal to the minimum flow rate measured during an event, is subtracted from the 160
measured runoff time series to identify the urban rapid flow part. The baseflow in Chassieu 161
mainly comes from industrial wastewater. For most events, the assumption of a constant 162
baseflow during an event for several hours is reasonable. 163
Only significant events are considered for trend analysis of urban hydrological processes, as 164
parameters characterizing small events are easily affected by influential factors such as initial 165
rainfall loss, baseflow and measurement uncertainty. Significant events in Chassieu are 166
defined with a total rainfall depth over 1 mm and duration over 30 minutes. In La Lechere, a 167
higher threshold with 2 mm rainfall depth and over 30-minute duration is adopted because the 168
CSOs in the combined sewers are often not activated during smaller events. In addition, a 169
significant event in both catchments requires a mean urban runoff flow over 5 L/s. 170
3.3 Simple parameters characterizing hydrological processes 171
Author-produced version of the article published in Hydrological Processes, Volume 31, Issue 6, 15 March 2017, Pages 1349–1359 The original publication is available at http://onlinelibrary.wiley.com/doi/10.1002/hyp.11109/abstract
Manuscript accepted for publication in Hydrological Processes, December 2016, doi: 10.1002/hyp.11109
8
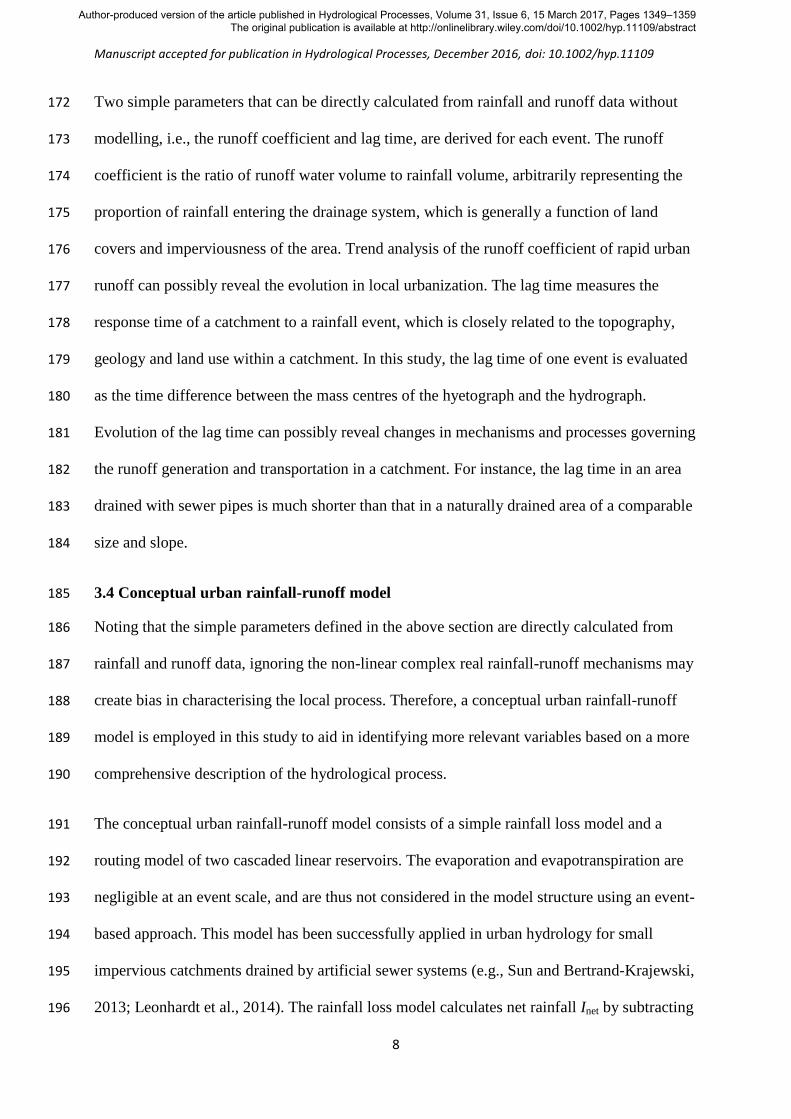
Two simple parameters that can be directly calculated from rainfall and runoff data without 172
modelling, i.e., the runoff coefficient and lag time, are derived for each event. The runoff 173
coefficient is the ratio of runoff water volume to rainfall volume, arbitrarily representing the 174
proportion of rainfall entering the drainage system, which is generally a function of land 175
covers and imperviousness of the area. Trend analysis of the runoff coefficient of rapid urban 176
runoff can possibly reveal the evolution in local urbanization. The lag time measures the 177
response time of a catchment to a rainfall event, which is closely related to the topography, 178
geology and land use within a catchment. In this study, the lag time of one event is evaluated 179
as the time difference between the mass centres of the hyetograph and the hydrograph. 180
Evolution of the lag time can possibly reveal changes in mechanisms and processes governing 181
the runoff generation and transportation in a catchment. For instance, the lag time in an area 182
drained with sewer pipes is much shorter than that in a naturally drained area of a comparable 183
size and slope. 184
3.4 Conceptual urban rainfall-runoff model 185
Noting that the simple parameters defined in the above section are directly calculated from 186
rainfall and runoff data, ignoring the non-linear complex real rainfall-runoff mechanisms may 187
create bias in characterising the local process. Therefore, a conceptual urban rainfall-runoff 188
model is employed in this study to aid in identifying more relevant variables based on a more 189
comprehensive description of the hydrological process. 190
The conceptual urban rainfall-runoff model consists of a simple rainfall loss model and a 191
routing model of two cascaded linear reservoirs. The evaporation and evapotranspiration are 192
negligible at an event scale, and are thus not considered in the model structure using an event-193
based approach. This model has been successfully applied in urban hydrology for small 194
impervious catchments drained by artificial sewer systems (e.g., Sun and Bertrand-Krajewski, 195
2013; Leonhardt et al., 2014). The rainfall loss model calculates net rainfall Inet by subtracting 196
Author-produced version of the article published in Hydrological Processes, Volume 31, Issue 6, 15 March 2017, Pages 1349–1359 The original publication is available at http://onlinelibrary.wiley.com/doi/10.1002/hyp.11109/abstract
Manuscript accepted for publication in Hydrological Processes, December 2016, doi: 10.1002/hyp.11109
9
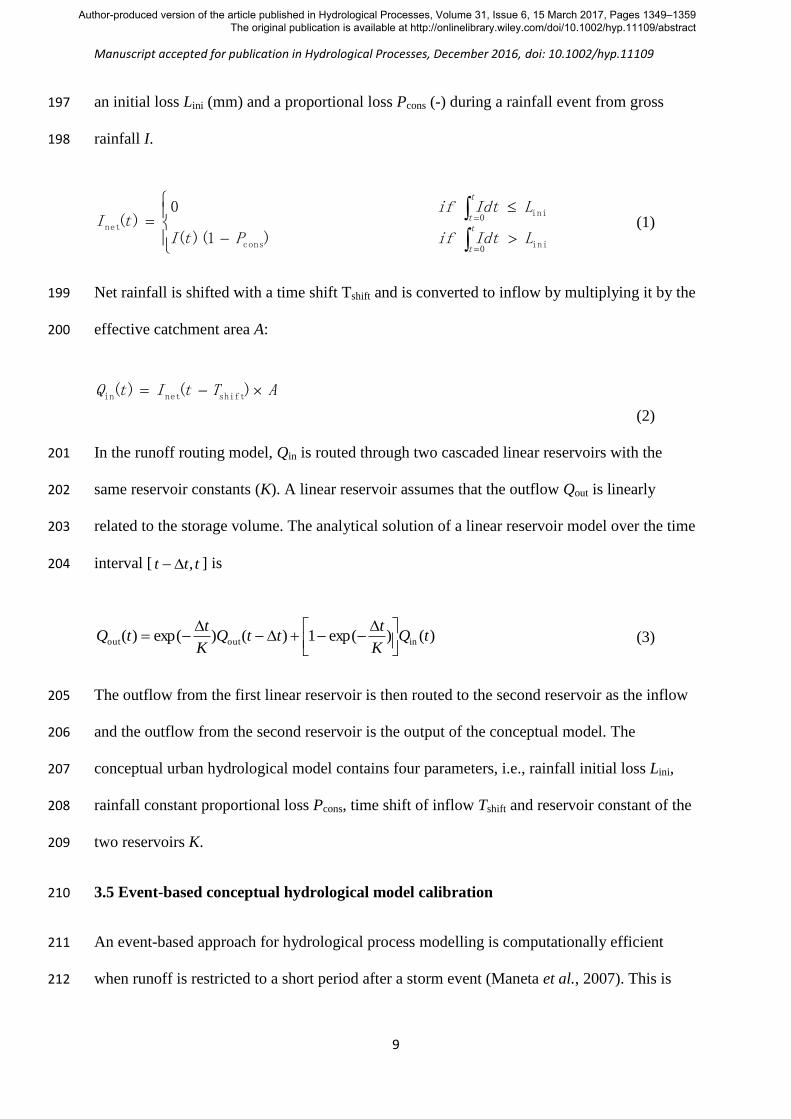
an initial loss Lini (mm) and a proportional loss Pcons (-) during a rainfall event from gross 197
rainfall I. 198
ini0
cons
ini0
net
)1)((
0)(
LIdtifPtI
LIdtiftI
t
t
t
t (1)
Net rainfall is shifted with a time shift Tshift and is converted to inflow by multiplying it by the 199
effective catchment area A: 200
ATtItQ )()( shiftnetin
(2)
In the runoff routing model, Qin is routed through two cascaded linear reservoirs with the 201
same reservoir constants (K). A linear reservoir assumes that the outflow Qout is linearly 202
related to the storage volume. The analytical solution of a linear reservoir model over the time 203
interval [ ttt , ] is 204
)()exp(1)()exp()( inoutout tQK
tttQ
K
ttQ
(3)
The outflow from the first linear reservoir is then routed to the second reservoir as the inflow 205
and the outflow from the second reservoir is the output of the conceptual model. The 206
conceptual urban hydrological model contains four parameters, i.e., rainfall initial loss Lini, 207
rainfall constant proportional loss Pcons, time shift of inflow Tshift and reservoir constant of the 208
two reservoirs K. 209
3.5 Event-based conceptual hydrological model calibration 210
An event-based approach for hydrological process modelling is computationally efficient 211
when runoff is restricted to a short period after a storm event (Maneta et al., 2007). This is 212
Author-produced version of the article published in Hydrological Processes, Volume 31, Issue 6, 15 March 2017, Pages 1349–1359 The original publication is available at http://onlinelibrary.wiley.com/doi/10.1002/hyp.11109/abstract
Manuscript accepted for publication in Hydrological Processes, December 2016, doi: 10.1002/hyp.11109
10
often the case in urban catchments equipped with storm sewer systems. A conceptual 213
hydrological model is often too simple to cover all conditions of the catchment and it has to 214
adjust itself (by adjusting model parameters) to represent different conditions. As a 215
consequence, model parameters are usually temporally different for varied rainfall-runoff 216
events. The dynamics of model parameters identified from event-based model calibration 217
using measured rainfall and runoff data thus possibly represent temporal catchment 218
characteristics and conditions. For instance, in our urban rainfall-runoff conceptual model, the 219
initial loss roughly indicates the antecedent weather condition of an event; the proportional 220
loss is probably an indicator of imperviousness; the time shift and reservoir constant are 221
related to the time of the catchment responding to rainfall. These model parameters can 222
further be used to study the evolution of long-term catchment properties. 223
The model is calibrated using the DREAM algorithm (Vrugt et al., 2008), which searches for 224
optimal parameters based on the Monte Carlo Markov Chain method. The effectiveness of 225
DREAM in calibrating hydrological models has been demonstrated by many studies in the 226
literature (e.g., Schoups et al., 2010). 227
3.6 Time of concentration estimated from conceptual rainfall-runoff model parameters 228
The time of concentration, which is usually defined as the time of water flowing from the 229
point with the longest temporal flow path within a catchment to the catchment outlet, also 230
measures the response time of a catchment to a rain event. The time of concentration is an 231
important concept in hydrology because many practical designs and operation strategies rely 232
on the prediction of the catchment response time. The most common method to estimate the 233
time of concentration is via the identification of the flow path and the time of concentration is 234
the travel time of flows through the flow path. In this study, the time of concentration is 235
computed as the length of a unit hydrograph, which is the response of a watershed (in terms of 236
Author-produced version of the article published in Hydrological Processes, Volume 31, Issue 6, 15 March 2017, Pages 1349–1359 The original publication is available at http://onlinelibrary.wiley.com/doi/10.1002/hyp.11109/abstract
Manuscript accepted for publication in Hydrological Processes, December 2016, doi: 10.1002/hyp.11109
11
runoff volume and timing) to the input of a unit of rainfall. Once the urban hydrological 237
model is calibrated for a specific event, its unit hydrograph can be determined as a function of 238
two calibrated model parameters (i.e., the time shift and reservoir constant). More specifically, 239
a unit depth of net rainfall is input into the urban rainfall-runoff model (Eqs. (2) and (3)) with 240
the two calibrated model parameters, and the model output is its corresponding unit 241
hydrograph. Because a unit hydrograph from the linear reservoir model has a very long 242
recession limb, the time of concentration is estimated as the duration when 95% water volume 243
reaches the watershed outlet (a higher percentage of volume generally does not change the 244
relative magnitudes of the time of concentration from different hydrographs). 245
3.7 Uncertainty in trend analysis due to noisy events 246
Due to various reasons (e.g., measurement uncertainty, data errors and uncertainty in model 247
calibration), there might be erroneous values (from a noisy event) in data series. To study the 248
influence of the erroneous values on the trend detection results, uncertainty in trend detection 249
results due to erroneous values in data series is examined. One synthetic noisy value is 250
introduced into a data series at different positions. A noisy value is assumed to be extremely 251
big, small or median. An extremely big (small) value is even bigger (smaller) than the 252
maximum (minimum) value in the data series. The sensitivity of the trend detection results to 253
the magnitude and position of noisy values is then investigated by comparing the results of the 254
data series without and with an erroneous value. 255
4 Results and discussion 256
4.1 Rainfall-Runoff event characteristics 257
A total number of 692 significant events in Chassieu and 584 significant events in La Lechere 258
have been identified with complete one-minute or two-minute rainfall time series. A total 259
number of 584 and 442 runoff events are identified with complete runoff data with mean flow 260
Author-produced version of the article published in Hydrological Processes, Volume 31, Issue 6, 15 March 2017, Pages 1349–1359 The original publication is available at http://onlinelibrary.wiley.com/doi/10.1002/hyp.11109/abstract
Manuscript accepted for publication in Hydrological Processes, December 2016, doi: 10.1002/hyp.11109
12
over 5 L/s in Chassieu and La Lechere, respectively. The conceptual urban hydrological 261
model described above is calibrated to fit the rainfall and runoff data for each specific event 262
(see Section 4.3 for more details on the model calibration results). Most events (477 events in 263
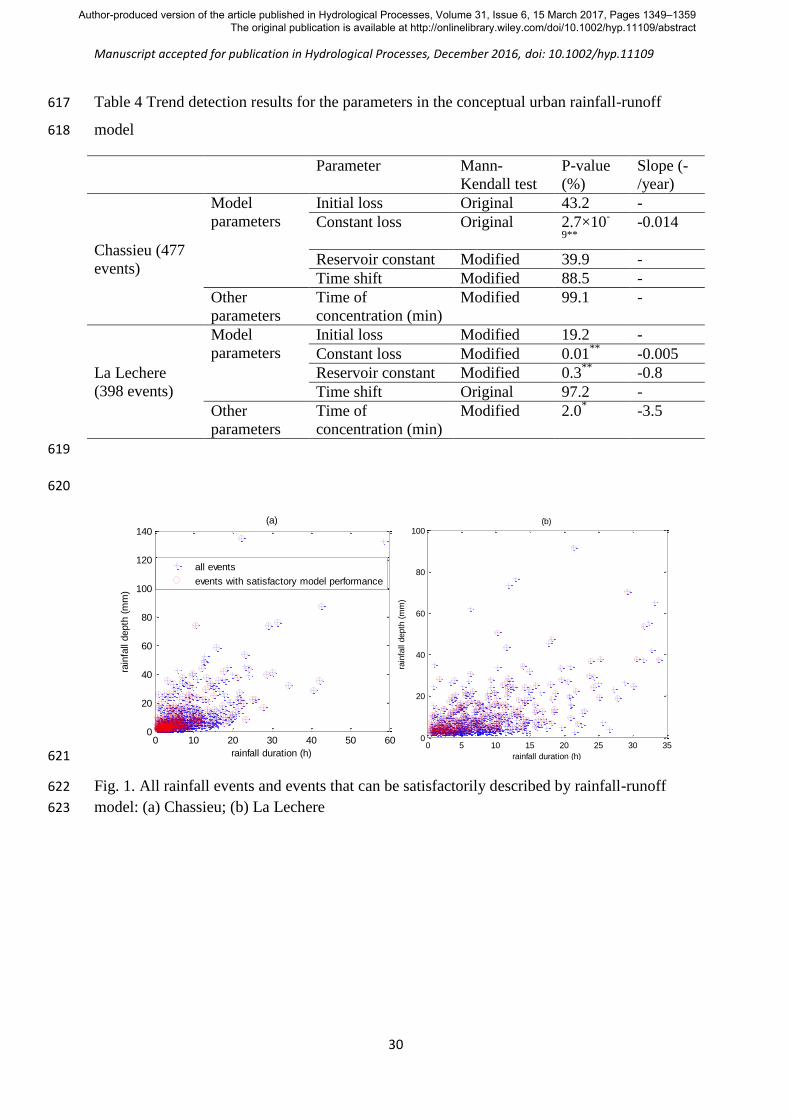
Chassieu and 398 events in La Lechere) can be satisfactorily described by the conceptual 264
urban rainfall-runoff model with a Nash-Sutcliffe (NS) model efficiency coefficient over 0.7. 265
However, for a small number of events, the conceptual urban rainfall-runoff model produces 266
outputs with significant discrepancies from the measured data. This is likely due to errors 267
either in rainfall or runoff measurements (e.g., catchment areal rainfall not captured by point 268
measurement, Leonhardt et al., 2014) or the simple assumption of a constant baseflow. Only 269
events that can be satisfactorily described by the conceptual urban rainfall-runoff model are 270
considered for the following trend analysis. Fig. 1 shows the rainfall depth and duration of all 271
rainfall events and selected events that can be satisfactorily described by the conceptual urban 272
rainfall-runoff model. 273
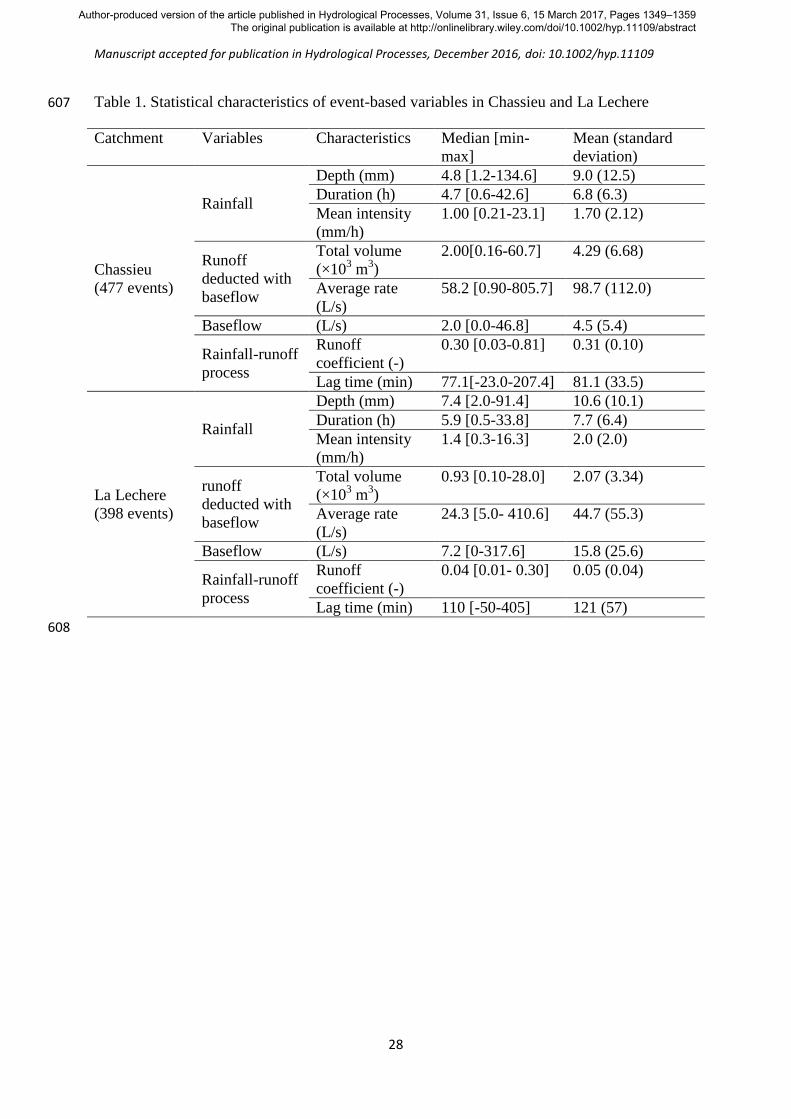
Table 1 summarizes some statistical characteristics of the rainfall and runoff variables of the 274
selected events in the two catchments. The runoff-based variables are considered after 275
subtracting the baseflow, because this study is only concerned with the fast response of the 276
urban areas to rainfall. Big rainfall events were observed with a maximum rainfall depth of 277
134.6 mm in Chassieu and 91.4 mm in La Lechere. The rainfall and runoff variables were 278
generally distributed over wide ranges, with relative standard deviations typically over 1, 279
indicating positively skewed distributions of the variables, which are consistent with previous 280
findings (Brezonik and Stadelmann, 2002). 281
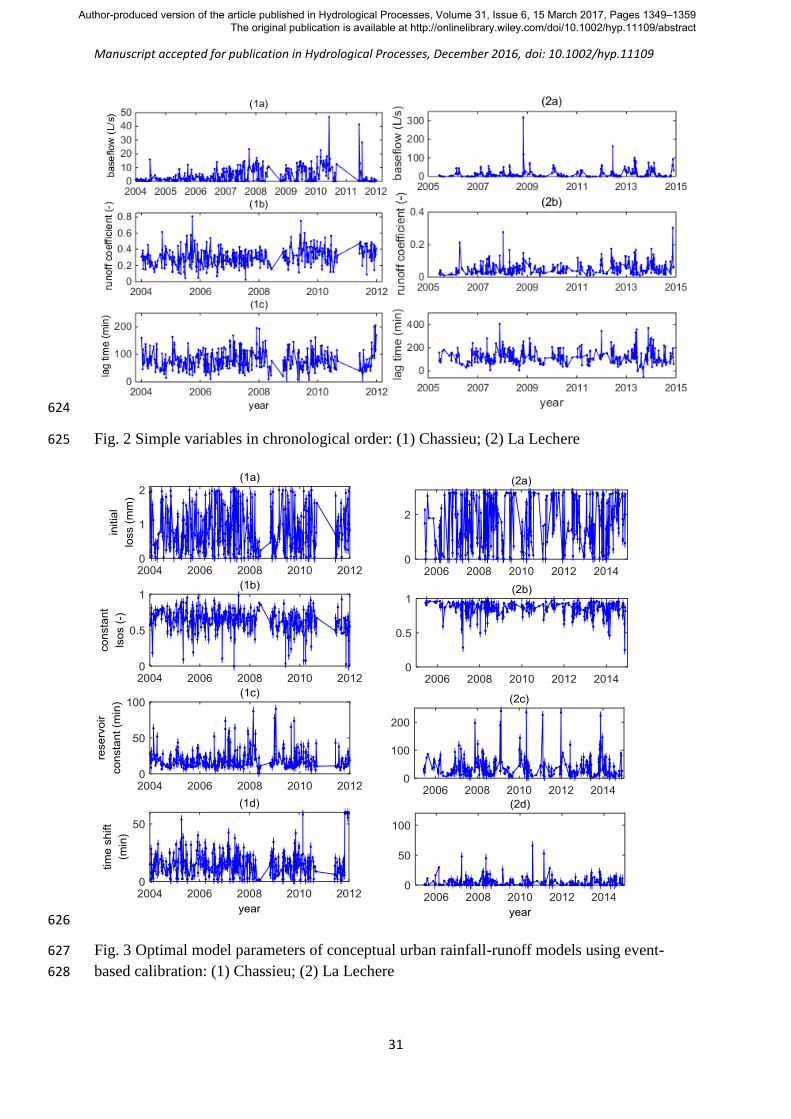
4.2 Trend analysis of simple variables without modelling 282
Variables of the selected events based on simple data analysis, i.e., baseflow, runoff 283
coefficient and lag time, are shown in Fig. 2 for the two catchments. Their statistical 284
characteristics are also summarized in Table 1. 285
Author-produced version of the article published in Hydrological Processes, Volume 31, Issue 6, 15 March 2017, Pages 1349–1359 The original publication is available at http://onlinelibrary.wiley.com/doi/10.1002/hyp.11109/abstract
Manuscript accepted for publication in Hydrological Processes, December 2016, doi: 10.1002/hyp.11109
13
In Chassieu, the baseflow values are mostly under 25 L/s with a median value of 2.0 L/s. Only 286
a few values in the latter years are over 25 L/s. Values of the runoff coefficient are between 287
0.03 and 0.81, with a median value of 0.30. The wide range of the runoff coefficient can be 288
explained by influential factors such as initial loss and dry weather flows, which are event-289
specific. The lag time also covers a large range, mostly between 20 and 200 minutes with a 290
median of 77 minutes and with two negative values. The negative lag time of one event is 291
likely due to errors in rainfall and runoff measurements and the assumption of a constant 292
baseflow. The lag time varies depending on the profiles of the hyetograph and hydrograph, 293
due to the non-linear relationship between rainfall and runoff and possibly varied temporal 294
hydrological regimes. 295
In La Lechere, the median baseflow is 7.2 L/s and most values are in the interval of [0, 100]. 296
One event with an extreme baseflow (over 300 L/s) occurred at the end of 2008, which can be 297
explained by a rainfall event of 73.4 mm ending only 15 hours before it, discharging high 298
natural flow from rural areas. The runoff coefficient is distributed across a range of [0.01, 0.3], 299
with a median value of 0.04. The generally low runoff coefficient (in comparison with that of 300
Chassieu) is found because only CSOs contribute to the considered runoff in La Lechere. The 301
median lag time is 110 minutes, with the range in [-50, 405] minutes. 302
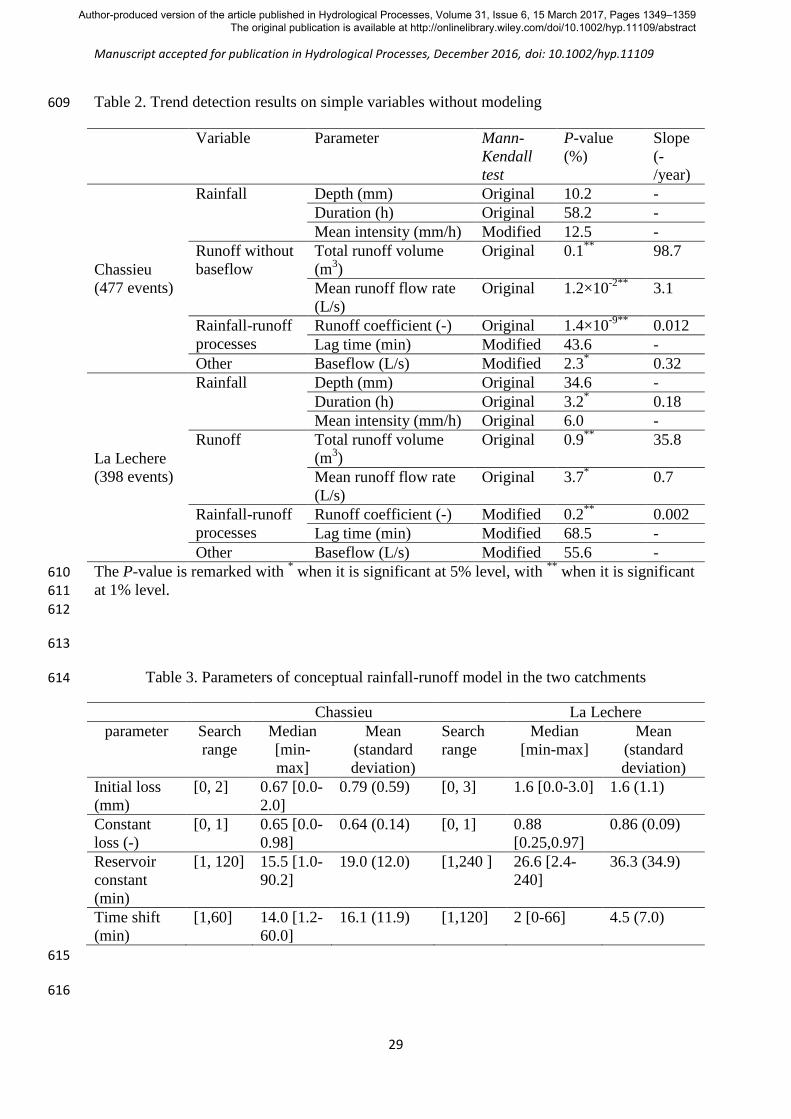
Table 2 lists trend detection results for different rainfall and runoff variables. The original or 303
modified Mann-Kendall test is applied according to the significance of the autocorrelation test. 304
For both catchments, no trend is found for most rainfall-based variables, including depth, 305
duration and mean intensity. A relatively low P-value of 3.2% is obtained for the rainfall 306
duration in La Lechere, which is significant at the 5% significance level, but is still above the 307
less strict 1% significance level. In addition, the trend test is performed on many other rainfall 308
variables in addition to those listed in Table 2 (e.g., rainfall depth and intensity in a specific 309
Author-produced version of the article published in Hydrological Processes, Volume 31, Issue 6, 15 March 2017, Pages 1349–1359 The original publication is available at http://onlinelibrary.wiley.com/doi/10.1002/hyp.11109/abstract
Manuscript accepted for publication in Hydrological Processes, December 2016, doi: 10.1002/hyp.11109
14
duration). The results indicate no trend in any rainfall-based variables. There is likely no trend 310
in the rainfall variables (the driver of the hydrological process) for the study period. 311
For the urban runoff-based variables, data series of the runoff volume and mean runoff flow 312
are investigated. According to the original or modified Mann-Kendall test, all variables 313
present an increasing trend with P-values on the order of 1% or lower. The mean urban runoff 314
flow rate increases by 3.1 L/s in Chassieu and 0.7 L/s in La Lechere on average per year. 315
As a result of the relatively stable rainfall and increasing runoff, an increasing trend is 316
detected in the runoff coefficient in both catchments with very low P-values (on the order of 317
10-11
in Chassieu and 10-3
in La Lechere). The overall increasing rates of the runoff 318
coefficient are evaluated as 0.012 and 0.002 per year in Chassieu and La Lechere, respectively. 319
The increasing runoff coefficient is likely due to growing imperviousness caused by 320
urbanization in both catchments. In Chassieu, a comparison of aerial views at the beginning 321
and end of the study period shows more buildings being constructed, which led to increasing 322
imperviousness during the study period (Sun et al., 2015). However, it is worth noting that 323
urbanization can only be regarded indicative to runoff coefficient changes, because 324
urbanization does not always lead to higher runoff volumes, particularly with the 325
implementation of low urban development (LID) techniques such as porous pavement, 326
infiltration trenches and green roofs. In contrast, the lag time seems not to present a trend, 327
indicating no significant change in the travel time of flows in the catchments. 328
An increasing trend in the baseflow is confirmed in Chassieu with a P-value of 2.3%, 329
indicating more industrial wastewater draining into the system, whereas no trend is detected 330
in the baseflow in La Lechere, implying a relatively stable rural flow in this area. 331
4.3 Conceptual urban rainfall-runoff model based analysis 332
Author-produced version of the article published in Hydrological Processes, Volume 31, Issue 6, 15 March 2017, Pages 1349–1359 The original publication is available at http://onlinelibrary.wiley.com/doi/10.1002/hyp.11109/abstract
Manuscript accepted for publication in Hydrological Processes, December 2016, doi: 10.1002/hyp.11109
15
An event-based calibration is implemented for all of the available rainfall-runoff events in the 333
two catchments based on measured rainfall and runoff data. The optimal model parameters for 334
each event are identified using the DREAM algorithm based on 104 model evaluations. The 335
search ranges of the model parameters, which are determined based on catchment properties, 336
are given in Table 3. Only events that are satisfactorily described by the conceptual rainfall-337
runoff model with an NS value over 0.7 are considered. Table 3 also lists the summary 338
statistics of the optimal model parameters. Fig. 3 shows the optimal model parameters. The 339
parameter of initial loss is broadly distributed in the search range of [0-2mm] or [0-3mm] in 340
the two catchments, with several events reaching the limits. However, the limits are not 341
extended to reflect the physical reality in the catchments. The proportional loss is also event-342
dependent and distributed in a wide range with a median of 0.65 in Chassieu and 0.88 in La 343
Lechere. This parameter can be roughly linked to the runoff coefficient, with the absolute 344
values of the correlation coefficients of 0.73 in Chassiu and 0.83 in La Lechere. The reservoir 345
constant and time shift reveal the response time of the catchments to rainfall events. These 346
two parameters also show great variability. 347
The temporal variability of the model parameters implies that the lumped conceptual urban 348
rainfall-runoff model is too simple to cover all conditions encountered by all of the events in 349
the urban catchments, which is consistent with previous findings (Maneta et al., 2007). The 350
calibrated parameters reveal the temporal hydrological regime/conditions during one specific 351
event. However, the variability of optimal model parameters may also result from other 352
reasons, leading to bias in some model parameter estimates in the lumped conceptual urban 353
rainfall-runoff model. For instance, errors in areal rainfall (represented by point measurements) 354
and runoff measurements lead to biased calibration results, as in calibration, the model 355
parameters are adjusted to make the lumped model outputs match the measurements. 356
Additionally, the model parameters are correlated (e.g., Sun and Bertrand-Krajewski, 2013). 357
Author-produced version of the article published in Hydrological Processes, Volume 31, Issue 6, 15 March 2017, Pages 1349–1359 The original publication is available at http://onlinelibrary.wiley.com/doi/10.1002/hyp.11109/abstract
Manuscript accepted for publication in Hydrological Processes, December 2016, doi: 10.1002/hyp.11109
16
The initial loss and proportional loss are negatively correlated; the reservoir constant and the 358
time shift are also negatively correlated. Simultaneously adjusting correlated parameters gives 359
equivalent model performances. 360
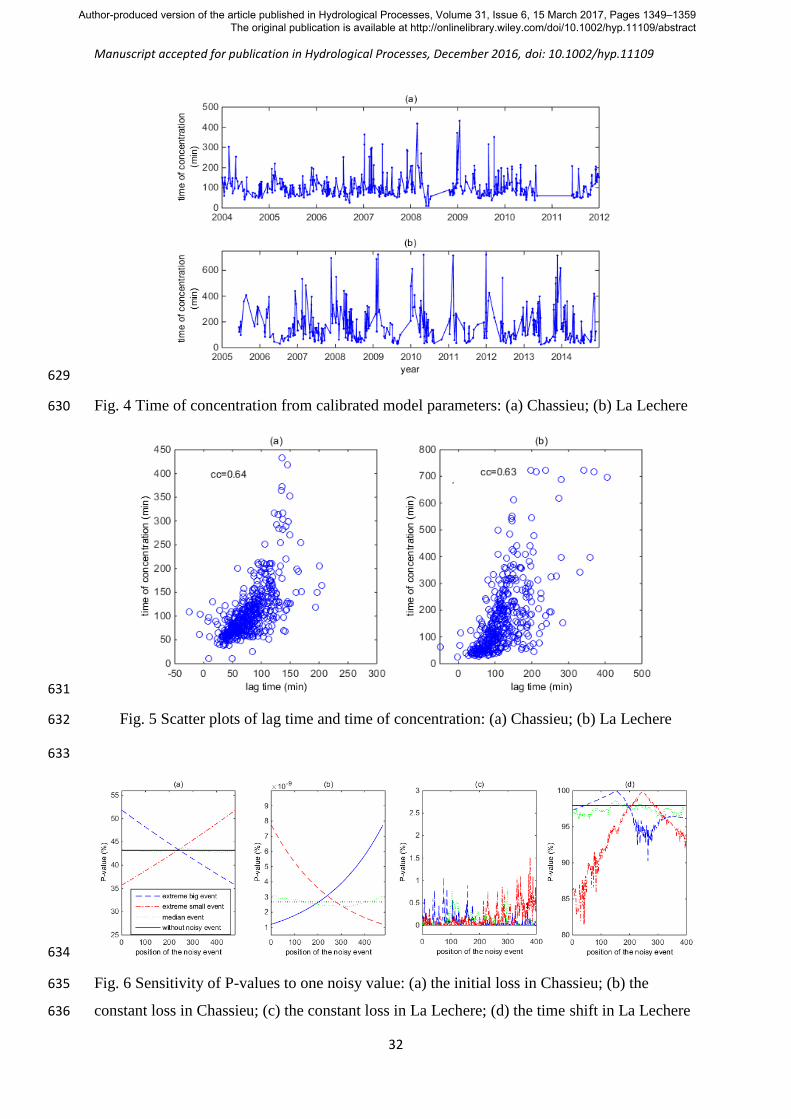
The time of concentration for each event is evaluated from the calibrated reservoir constant 361
and time shift (Fig. 4). The median time of concentration in Chassieu is 92 minutes and most 362
values are in the range of [10-400]. The time of concentration in La Lechere covers a range of 363
[24, 724] minutes and the median is 132 minutes. 364
Fig. 5 shows the scatter points of the lag time directly derived from the data and the time of 365
concentration estimated from calibrated urban rainfall-runoff model parameters. These two 366
quantities both indicating the response time of the urban catchments to rainfall events are 367
highly correlated. However, the relation between these two variables also shows some 368
randomness, resulting from the non-linear relation between rainfall and runoff and the 369
different methods with which the two parameters are calculated. 370
Assuming that other factors listed above (e.g., errors in rainfall and runoff data, uncertainty in 371
calibration and parameter correlation) leading to temporal variation of model parameters are 372
random without a trend, trend analysis of model parameters can still provide useful 373
information on hydrological regime evolution in the two catchments. Table 4 lists the trend 374
detection results of optimal model parameters along with the time of concentration. The initial 375
loss does not present a trend in both catchments, indicating stable initial conditions of rainfall 376
events, which are linked to antecedent dry periods and precedent events. A decreasing trend is 377
found in the constant loss in both catchments with low P-values, which is consistent with the 378
detected increasing trend in the runoff coefficient in the above analysis due to urban 379
development in the catchments. The constant loss is evaluated with a decreasing rate of 380
approximately 0.014 per year in Chassieu and 0.005 in La Lechere. These figures are close to 381
Author-produced version of the article published in Hydrological Processes, Volume 31, Issue 6, 15 March 2017, Pages 1349–1359 The original publication is available at http://onlinelibrary.wiley.com/doi/10.1002/hyp.11109/abstract
Manuscript accepted for publication in Hydrological Processes, December 2016, doi: 10.1002/hyp.11109
17
the values of the increasing rates in the runoff coefficient estimated using the simple data 382
analysis method (see Table 2). 383
The reservoir constant and lag time in Chassieu seem to not contain a trend according to the 384
Mann-Kendall method, suggesting that the routing function governing runoff generation does 385
not have a significant change in Chassieu. In contrast, the reservoir constant possibly presents 386
a decreasing tendency in La Lechere with a P-value under 5%. Consequently, the time of 387
concentration evaluated based on this parameter in La Lechere is also detected with a 388
declining trend of approximately 3.5 minutes per year. This is consistent with the common 389
sense notion that urbanization leads to a shorter time of concentration because an artificial 390
drainage system often transports stormwater much faster than a natural water course. In the 391
study period of ten years, a decrease of 35 minutes in the concentration time is expected, 392
which is non-negligible in comparison with the median time of concentration of 132 minutes. 393
However, the trends in both variables are rejected with the stricter 1% significance level. 394
Further data are required in order to confirm the trend in these variables. 395
4.4 Sensitivity of noisy events to trend detection results 396
Due to the various reasons presented above (e.g., the lumped and simplified model 397
representing the complex rainfall-runoff process, errors in rainfall and runoff measurements 398
and the correlation between model parameters in calibration), parameters characterizing local 399
hydrology obtained from data analysis and model calibration for some events may be 400
erroneous. For instance, the negative lag time and the reservoir constant of three events in La 401
Lechere close to 240 minutes (which is the search limit) are likely to be erroneous. This 402
section investigates the influence of the presence of noisy events (with erroneous values) in 403
the data series on the trend detection results using the Mann-Kendall test. 404
Author-produced version of the article published in Hydrological Processes, Volume 31, Issue 6, 15 March 2017, Pages 1349–1359 The original publication is available at http://onlinelibrary.wiley.com/doi/10.1002/hyp.11109/abstract
Manuscript accepted for publication in Hydrological Processes, December 2016, doi: 10.1002/hyp.11109
18
Four data series of optimal model parameters are used to study the sensitivity of trend 405
detection results to noisy values. The original data series are considered as the comparison 406
benchmarks, assuming that they do not contain any erroneous data. Fig. 6 shows the P-values 407
of different cases with one noisy value together with the P-value of the original data series. It 408
is clear that the influence of a noisy event depends both on the magnitude and the position of 409
the noisy event. 410
In Fig. 6 (a), the data series of the initial loss in Chassieu, which does not present a trend is 411
studied. The original Mann-Kendall method is used because the autocorrelation effect in the 412
data series is insignificant. An extreme noisy value introduced at the two sides of the data 413
series leads to the most significant change in the P-value. The influence of a noisy value is 414
negligible when it is in a middle position in the data series. A noisy median value does not 415
significantly affect the P-value at any position in the data series. The P-value changes 416
gradually as a noisy event moves in the data series. 417
In Fig. 6(b), the data series of the constant loss in Chassieu, which presents a decreasing trend 418
as indicated by the original Mann-Kendall method, is studied. An extremely high noisy value 419
located at the beginning of the data series leads to a lower P-Value, as expected. An extreme 420
noisy value in the middle positions of the data series and a noisy median value at any position 421
do not have significant impacts on the P-value. 422
In Fig. 6 (c) and (d), data series of the constant loss and time shift in La Lechere with 423
significant autocorrelation are studied using the modified Mann-Kendall method. Different 424
from those in Fig. 6 (a) and (b), the P-values do not change monotonously as the position of a 425
noisy value changes gradually in a data series, due to the influence of the autocorrelation 426
coefficients incorporated in the modified Mann-Kendall test. The relation between the P-427
value and the position of an erroneous value is rather random. The most significant change in 428
Author-produced version of the article published in Hydrological Processes, Volume 31, Issue 6, 15 March 2017, Pages 1349–1359 The original publication is available at http://onlinelibrary.wiley.com/doi/10.1002/hyp.11109/abstract
Manuscript accepted for publication in Hydrological Processes, December 2016, doi: 10.1002/hyp.11109
19
a P-value due to an extreme noisy value does not necessarily occur when it is located at the 429
two sides of the data series. In both cases, the introduction of one erroneous value does not 430
change the trend detection results. 431
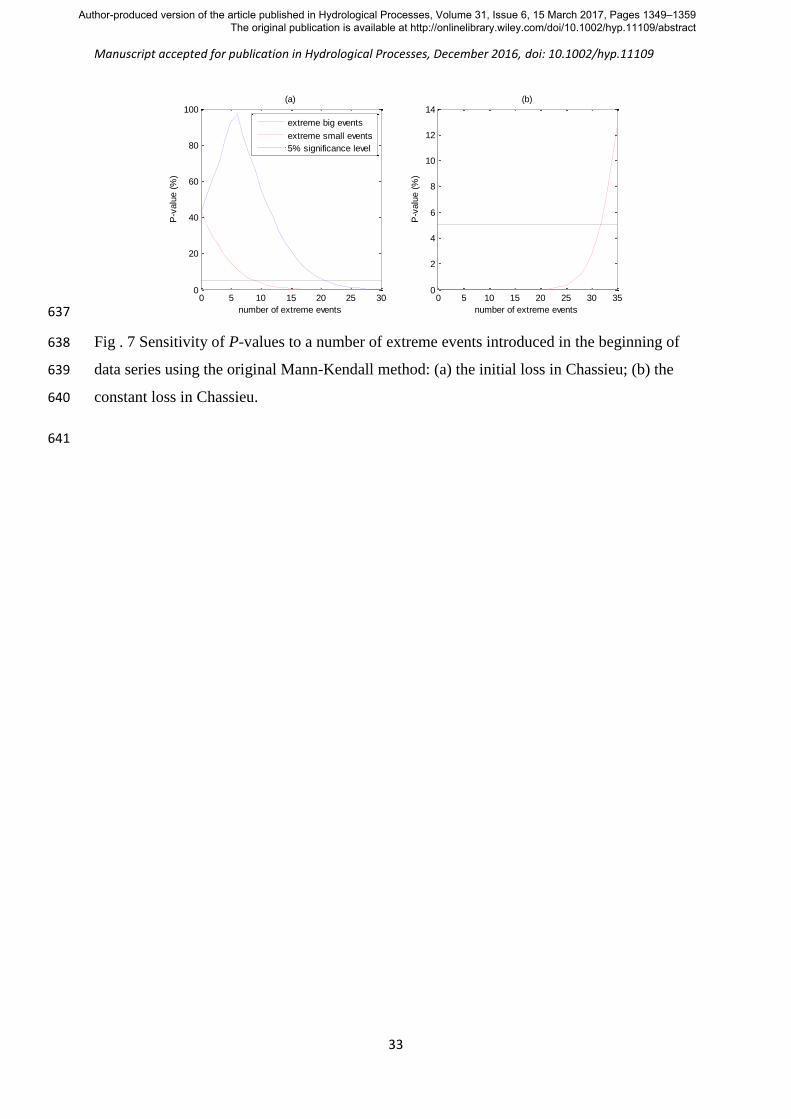
Furthermore, the impact of the number of noisy values on the trend detection results using the 432
original Mann-Kendall method is also studied. The trend detection results from the original 433
Mann-Kendall method are most sensitive to extreme erroneous values at the two sides of the 434
data series. Therefore, the impact of the number of noisy values is studied here by examining 435
cases with extreme noisy values introduced in the beginning of data series. Fig. 7 shows the 436
results. In Fig. 7(a), for the data series of the initial loss (containing 477 events) in Chassieu, 437
which does not present a trend, a trend will only be detected with more than 9 extremely small 438
noisy events or 21 extremely large events introduced in the beginning of the data series. In Fig. 439
7(b), for the constant loss data series in Chassieu presenting a significantly decreasing trend 440
with a P-value of 2.7×10⁻⁹
%, the Mann-Kendall test only gives a different indication of trend 441
absence when over 32 extremely small noisy values are introduced. 442
Based on the above analysis, a different trend result generally requires a number of extreme 443
erroneous values at one side of a data series. The Mann-Kendall method, which is a function 444
of the ranks of the observations rather than their actual values, is not sensitive to a few noisy 445
values. Therefore, in this study, the trend detection results using the original Mann-Kendall 446
method are probably reliable regardless of a few possible noisy values in the data series. 447
However, the sensitivity of the trend detection results from the modified Mann-Kendall 448
method seems to be more complicated due to the altered autocorrelation coefficients. 449
5. Conclusions 450
It is important to assess any hydrological trend (if one exists) in urban catchments because the 451
design and operation of urban stormwater projects aiming to reduce the adverse impact of 452
Author-produced version of the article published in Hydrological Processes, Volume 31, Issue 6, 15 March 2017, Pages 1349–1359 The original publication is available at http://onlinelibrary.wiley.com/doi/10.1002/hyp.11109/abstract
Manuscript accepted for publication in Hydrological Processes, December 2016, doi: 10.1002/hyp.11109
20
stormwater should take into account possible changes in urban hydrology patterns. This paper 453
addresses hydrological trend analysis in urban catchments. Using rainfall and runoff data and 454
a conceptual rainfall-runoff model, lumped parameters that aggregate distributed spatial 455
information in the urban/peri-urban catchments are analysed to reveal the global evolution of 456
the hydrological responses (noting that distributed processes, factors and properties on smaller 457
scales in local hydrology are beyond the discussion). The evolution of aggregate hydrologic 458
relevant parameters is useful in indicating changes in local hydrology and needs to be 459
considered in urban stormwater management. The original and modified Mann-Kendall 460
methods are applied for trend detection in data series in two catchments in France, i.e., 461
Chassieu and La Lechere, and there seems to be no difficulty of applying the methodology to 462
other urban catchments. Based on the application results for approximately one decade of data, 463
the following conclusions can be drawn: 464
1. A trend is absent in the driving force (precipitation) of the rainfall-runoff processes in both 465
catchments in the suburbs of Lyon for the study period. 466
2. An increasing trend is found in the urban runoff variables. On average, the mean runoff 467
flow rate increases by 3.1 L/s in Chassieu and 0.7 L/s in La Lechere per year. 468
3. As a result of the relatively stable rainfall and increasing urban runoff volumes, the runoff 469
coefficient presents an increasing trend in both catchments, probably due to growing 470
imperviousness caused by urbanization, even in Chassieu, where the catchment is already 471
very densely urbanized, rather than climate change factors. However, it is worth noting that 472
nowadays urbanization does not automatically lead to more imperviousness and increasing 473
catchment outflow. The influence of urbanization development on the local hydrological 474
processes is much more complicated than simple imperviousness evolution because it is 475
highly dependent on the detailed changes and processes. For instance, in the LID context, 476
Author-produced version of the article published in Hydrological Processes, Volume 31, Issue 6, 15 March 2017, Pages 1349–1359 The original publication is available at http://onlinelibrary.wiley.com/doi/10.1002/hyp.11109/abstract
Manuscript accepted for publication in Hydrological Processes, December 2016, doi: 10.1002/hyp.11109
21
when urban areas expand, water on the impervious surface can be connected to vegetated 477
areas or infiltration devices; some rain can be retained via green roofs. In addition, the 478
efficiency of an LID device may decline over time (e.g., when an infiltration system is 479
clogged), leading to a part of stormwater back to catchment outflow. Therefore, the evolution 480
of stormwater quantities is difficult to be precisely inferred only from urbanization 481
information. The methodology developed in this study provides the most direct evidence of 482
the elevated runoff coefficient in urban/peri-urban catchments. 483
484
4. Optimal parameters of a conceptual urban rainfall –runoff model obtained from calibration 485
using an event-based approach are used to represent the temporal hydrological regime. 486
Though temporal variation of optimal model parameters is also affected by other factors such 487
as errors in rainfall and runoff measurements, uncertainty in calibration and parameter 488
correlation, the variance due to these factors is assumed to be random. The trend analysis 489
results of these model parameters therefore reveal local hydrology evolution. No trend is 490
present in the initial loss. A decreasing trend is found in the constant proportional loss in both 491
catchments, which is consistent with the increasing runoff coefficient. The time of 492
concentration in Chassieu does not exhibit a trend, whereas it seems to decrease by 3.5 493
minutes per year in La Lechere. The trend in the time of concentration in La Lechere needs to 494
be confirmed with further data. 495
5. The sensitivity analysis indicates that the original Mann-Kendall method is not sensitive to 496
a few noisy values in the data series. Therefore, the trend detection results from the original 497
Mann-Kendall method are reliable, regardless of a few possible erroneous data. However, the 498
relation between trend detection results and noisy values using the modified Mann-Kendall 499
method is rather complicated and difficult to quantify. 500
Author-produced version of the article published in Hydrological Processes, Volume 31, Issue 6, 15 March 2017, Pages 1349–1359 The original publication is available at http://onlinelibrary.wiley.com/doi/10.1002/hyp.11109/abstract

Manuscript accepted for publication in Hydrological Processes, December 2016, doi: 10.1002/hyp.11109
22
Acknowledgements 501
The authors wish to acknowledge the Rhone-Mediterranean and Corsica Water Agency for 502
the financial support of the CHRONOTHU project, under which the presented study was 503
conducted. The authors also acknowledge the Greater Lyon for providing technical and 504
financial support to OTHU (www.othu.org) for the monitoring database. 505
506
Author-produced version of the article published in Hydrological Processes, Volume 31, Issue 6, 15 March 2017, Pages 1349–1359 The original publication is available at http://onlinelibrary.wiley.com/doi/10.1002/hyp.11109/abstract
Manuscript accepted for publication in Hydrological Processes, December 2016, doi: 10.1002/hyp.11109
23
References 507
Astaraie-Imani, M., Kapelan, Z., Fu, G., Butler, D. (2012). Assessing the combined effects of 508
urbanization and climate change on the river water quality in an integrated urban wastewater 509
system in the UK. Journal of Environmental Management. 112: 1-9. 510
Aziz, O.I.A., Burn, D.H. (2006). Trends and variability in the hydrological regime of the 511
Mackenzie revier basin. Journal of Hydrology. 319: 282-294. 512
Awadallah, A.G., Fahmy, H., Karaman, H.G. (2011). Trend detection in water quality data 513
using time series seasonal adjustment and statistical tests. Irrigation and Drainage. 60(2): 253-514
262. 515
Braud, I., Breil, P., Thollet, F., Lagouy, M., Branger, F., Jacqueminet, C., Kermadi, S., Michel, 516
K. (2013). Evidence of the impact of urbanization on the hydrological regime of a medium-517
sized periurban catchment in France, Journal of Hydrology, 485: 5-23 518
Brezonik, P.L., Stadelmann, T.H. (2002). Analysis and predictive models of stormwater 519
runoff volumes, loads and pollutant concentrations from watersheds in the Twin Cities 520
metropolitan area, Minnesota, USA. Water Research. 36: 1743-1757. 521
Burn, D.H., Elnur, M.A.H. (2002). Detection of hydrologic trends and variability. Journal of 522
Hydrology. 255: 107-122. 523
Chiew, FHS., Peel, MC., Western, AW. (2002). Application and testing of the simple rainfall-524
runoff model SIMHYD. In book: Mathematical models of small watershed hydrology and 525
applications. pp 335-367. 526
Douglas, E.M., Vogel, R.M., Kroll, C.N. (2000). Trends in floods and low flows in the United 527
States; impact of spatial correlation. Journal of Hydrology. 240: 90-105. 528
Gocic, M., Trajkovic, S. (2013). Analysis of changes in meteorological variables using Mann-529
Kendall and Sen’s slope estimator statistical tests in Serbia. Global and Planetary Change. 100: 530
172-182. 531
Hamed, K.H., Rao, A.R. (1998). A modified Mann-Kendall trend test for autocorrelated data. 532
Journal of Hydrology. 204: 182-196. 533
Hess, A., Iyer, H., Malm, W. (2001). Linear trend analysis: a comparison of methods. 534
Atmospheric Environment. 35: 5211-5222. 535
Hirsch, R.M., Slack, J.R. & Smith, R.A. (1982). Techniques of trend analysis for monthly 536
water quality analysis. Water Resource Research. 18(1): 107–121 537
Hirsch, R.M., Slack, J.R. (1984). Non-parametric trend test for seasonal data with serial 538
dependence. Water Resources Research. 20: 727-732. 539
Author-produced version of the article published in Hydrological Processes, Volume 31, Issue 6, 15 March 2017, Pages 1349–1359 The original publication is available at http://onlinelibrary.wiley.com/doi/10.1002/hyp.11109/abstract
Manuscript accepted for publication in Hydrological Processes, December 2016, doi: 10.1002/hyp.11109
24
Métadier, M., Bertrand-Krajewski J.-L. (2012). Pollutographs, concentrations, loads and intra-540
event mass distributions of pollutants in urban wet weather discharges calculated from long 541
term on turbidity measurements. Water Research. 46(20): 6836-6856. 542
Jankowsky, S., Branger, F., Braud, I., Rodriguez, F., Debionne, S., Viallet, P. (2014). 543
Assessing anthropogenic influence on the hydrology of small peri-urban catchments: 544
development of the object-oriented PUMMA model by integrating urban and rural 545
hydrological models, Journal of Hydrology. 517: 1056-1071 546
Kendall, M.G. (1955). Rank Correlation Methods. Griffin, London. 547
Leonhardt, G., Sun, S., Rauch, W., Bertrand-Krajewski J.-L. (2014). Comparison of two 548
model based approaches for areal rainfall estimation in urban hydrology. Journal of 549
Hydrology. 511: 880-890. 550
Maneta, M.P., Pasternack, G.B., Wallender, W.W., Jetten, V., Schnabel, S. (2007). Temporal 551
instability of parameters in an event-based distributed hydrologic model applied to a small 552
semiarid catchment Journal of Hydrology. 341: 207-221. 553
Mann, H.B., (1945). Nonparametric tests against trend, Econometrica, 13, 245-259. 554
Omar, I, Aziz, A., Burn, DH. (2006). Trends and variability in the hydrological regime of the 555
Mackenzie River Basin. Journal of Hydrology. 319: 282-294. 556
Partal, T., Kahya, E. (2006). Trend analysis in Turkish precipitation data. Hydrological 557
Processes. 20: 2011-2026. 558
Post, D., Jakeman, A.J. (1999). Predicting the daily streamflow of ungauged catchments in 559
S.E. Australia by regionalizing the parameters of a lumped conceptual rainfall-runoff model. 560
Ecological Modelling. 23(2-3): 91-104. 561
Schoups, G., Vrugt, J.A., Fenicia, F., and Giesen, N.C.van de. (2010). Corruption of accuracy 562
and efficiency of Markov chain Monte Carlo simulation by inaccurate numerical 563
implementation of conceptual hydrologic models. Water Resources Research. 46, W10530. 564
doi:10.1029/2009WR008648. 565
Sun, S., Bertrand-Krajewski, J.-L. (2013). Separately accounting for uncertainties in rainfall 566
and runoff: Calibration of event based conceptual hydrological models in small urban 567
catchments using Bayesian method. Water Resources Research, 49: 1-14. 568
Sun, S., Barraud, S., Castebrunet, H., Aubin, J.-B., Marmonier, P. (2015). Long-term 569
stormwater quantity and quality analysis using continuous measurements in a French Urban 570
Catchment. Water Research. 85:432-442. 571
Sen, P. K. (1968). Estimates of the regression coefficient based on Kendall's Tau, Journal of 572
the American Statistical Association. 63: 1379-1389. 573
Vrugt, J.A., Ter Braak C.J.K., Clark M.P. Hyman J.M., and Robinson B.A. (2008). Treatment 574
of input uncertainty in hydrologic modeling: doing hydrology backward with Markov chain 575
Author-produced version of the article published in Hydrological Processes, Volume 31, Issue 6, 15 March 2017, Pages 1349–1359 The original publication is available at http://onlinelibrary.wiley.com/doi/10.1002/hyp.11109/abstract

Manuscript accepted for publication in Hydrological Processes, December 2016, doi: 10.1002/hyp.11109
25
Monte Carlo simuation. Water Resources Research, 44, W00B09, 576
doi:10.1029/2007WR006720 577
Xu, Z.X., Takeuchi, K., Ishidaira, H. (2003). Monotonic trend and step changes in Japanese 578
Precipitation. Journal of Hydrology. 279 (1-4): 144-150. 579
Yue, S., Pilon, P., Phinney, B., Cavadias, G. (2002). The influence of autocorrelation on the 580
ability to detect trend in hydrological series. Hydrological Processes. 16: 1807-1829. 581
Zhang, X., Harvey, K.D., Kogg, W.D., Yuzyk, T.R. (2001). Trends in Canadian streamflow. 582
Water Resources Research. 37(4): 987-998. 583
584
Author-produced version of the article published in Hydrological Processes, Volume 31, Issue 6, 15 March 2017, Pages 1349–1359 The original publication is available at http://onlinelibrary.wiley.com/doi/10.1002/hyp.11109/abstract
Manuscript accepted for publication in Hydrological Processes, December 2016, doi: 10.1002/hyp.11109
26
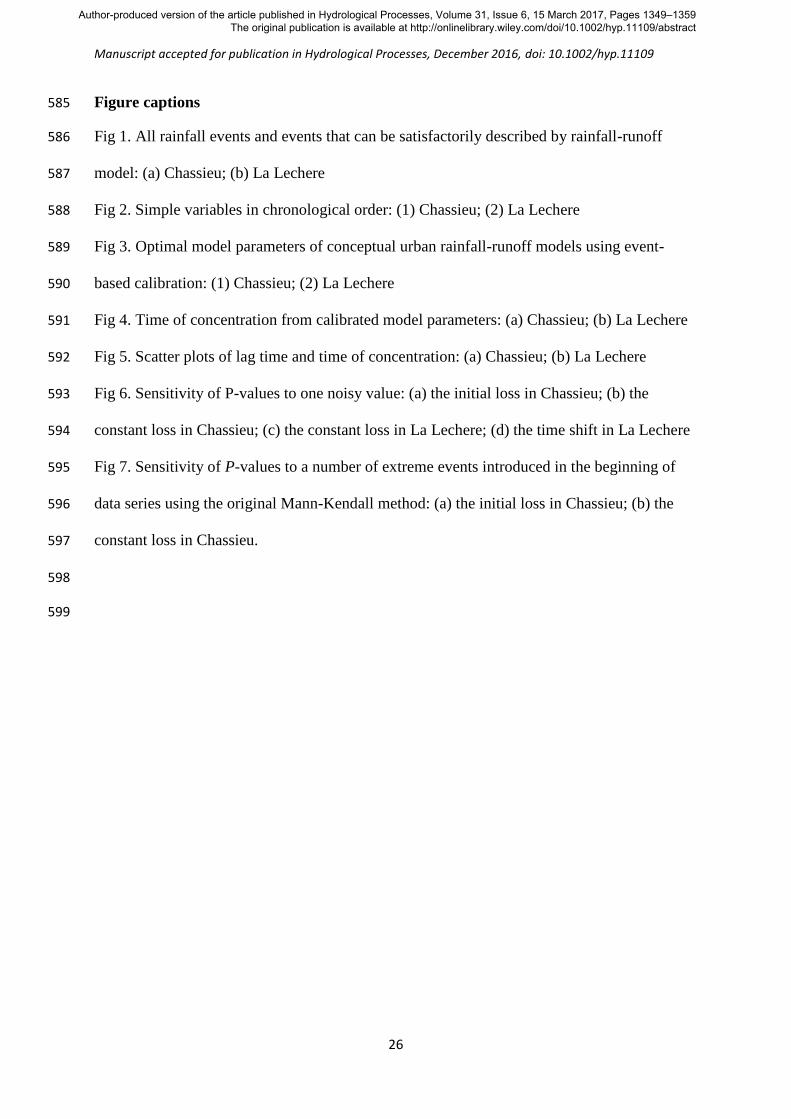
Figure captions 585
Fig 1. All rainfall events and events that can be satisfactorily described by rainfall-runoff 586
model: (a) Chassieu; (b) La Lechere 587
Fig 2. Simple variables in chronological order: (1) Chassieu; (2) La Lechere 588
Fig 3. Optimal model parameters of conceptual urban rainfall-runoff models using event-589
based calibration: (1) Chassieu; (2) La Lechere 590
Fig 4. Time of concentration from calibrated model parameters: (a) Chassieu; (b) La Lechere 591
Fig 5. Scatter plots of lag time and time of concentration: (a) Chassieu; (b) La Lechere 592
Fig 6. Sensitivity of P-values to one noisy value: (a) the initial loss in Chassieu; (b) the 593
constant loss in Chassieu; (c) the constant loss in La Lechere; (d) the time shift in La Lechere 594
Fig 7. Sensitivity of P-values to a number of extreme events introduced in the beginning of 595
data series using the original Mann-Kendall method: (a) the initial loss in Chassieu; (b) the 596
constant loss in Chassieu. 597
598
599
Author-produced version of the article published in Hydrological Processes, Volume 31, Issue 6, 15 March 2017, Pages 1349–1359 The original publication is available at http://onlinelibrary.wiley.com/doi/10.1002/hyp.11109/abstract

Manuscript accepted for publication in Hydrological Processes, December 2016, doi: 10.1002/hyp.11109
27
Table captions 600
Table 1. Statistical characteristics of event-based variables in Chassieu and La Lechere 601
Table 2. Trend detection results on simple variables without modeling 602
Table 3. Parameters of conceptual rainfall-runoff model in the two catchments 603
Table 4. Trend detection results for the parameters in the conceptual urban rainfall-runoff 604
model 605
606
Author-produced version of the article published in Hydrological Processes, Volume 31, Issue 6, 15 March 2017, Pages 1349–1359 The original publication is available at http://onlinelibrary.wiley.com/doi/10.1002/hyp.11109/abstract
Manuscript accepted for publication in Hydrological Processes, December 2016, doi: 10.1002/hyp.11109
28
Table 1. Statistical characteristics of event-based variables in Chassieu and La Lechere 607
Catchment Variables Characteristics Median [min-
max]
Mean (standard
deviation)
Chassieu
(477 events)
Rainfall
Depth (mm) 4.8 [1.2-134.6] 9.0 (12.5)
Duration (h) 4.7 [0.6-42.6] 6.8 (6.3)
Mean intensity
(mm/h)
1.00 [0.21-23.1] 1.70 (2.12)
Runoff
deducted with
baseflow
Total volume
(×103 m
3)
2.00[0.16-60.7] 4.29 (6.68)
Average rate
(L/s)
58.2 [0.90-805.7] 98.7 (112.0)
Baseflow (L/s) 2.0 [0.0-46.8] 4.5 (5.4)
Rainfall-runoff
process
Runoff
coefficient (-)
0.30 [0.03-0.81] 0.31 (0.10)
Lag time (min) 77.1[-23.0-207.4] 81.1 (33.5)
La Lechere
(398 events)
Rainfall
Depth (mm) 7.4 [2.0-91.4] 10.6 (10.1)
Duration (h) 5.9 [0.5-33.8] 7.7 (6.4)
Mean intensity
(mm/h)
1.4 [0.3-16.3] 2.0 (2.0)
runoff
deducted with
baseflow
Total volume
(×103 m
3)
0.93 [0.10-28.0] 2.07 (3.34)
Average rate
(L/s)
24.3 [5.0- 410.6] 44.7 (55.3)
Baseflow (L/s) 7.2 [0-317.6] 15.8 (25.6)
Rainfall-runoff
process
Runoff
coefficient (-)
0.04 [0.01- 0.30] 0.05 (0.04)
Lag time (min) 110 [-50-405] 121 (57)
608
Author-produced version of the article published in Hydrological Processes, Volume 31, Issue 6, 15 March 2017, Pages 1349–1359 The original publication is available at http://onlinelibrary.wiley.com/doi/10.1002/hyp.11109/abstract
Manuscript accepted for publication in Hydrological Processes, December 2016, doi: 10.1002/hyp.11109
29
Table 2. Trend detection results on simple variables without modeling 609
Variable Parameter Mann-
Kendall
test
P-value
(%)
Slope
(-
/year)
Chassieu
(477 events)
Rainfall Depth (mm) Original 10.2 -
Duration (h) Original 58.2 -
Mean intensity (mm/h) Modified 12.5 -
Runoff without
baseflow
Total runoff volume
(m3)
Original 0.1**
98.7
Mean runoff flow rate
(L/s)
Original 1.2×10⁻²**
3.1
Rainfall-runoff
processes
Runoff coefficient (-) Original 1.4×10⁻⁹**
0.012
Lag time (min) Modified 43.6 -
Other Baseflow (L/s) Modified 2.3* 0.32
La Lechere
(398 events)
Rainfall Depth (mm) Original 34.6 -
Duration (h) Original 3.2* 0.18
Mean intensity (mm/h) Original 6.0 -
Runoff Total runoff volume
(m3)
Original 0.9**
35.8
Mean runoff flow rate
(L/s)
Original 3.7* 0.7
Rainfall-runoff
processes
Runoff coefficient (-) Modified 0.2**
0.002
Lag time (min) Modified 68.5 -
Other Baseflow (L/s) Modified 55.6 -
The P-value is remarked with * when it is significant at 5% level, with
** when it is significant 610
at 1% level. 611
612
613
Table 3. Parameters of conceptual rainfall-runoff model in the two catchments 614
Chassieu La Lechere
parameter Search
range
Median
[min-
max]
Mean
(standard
deviation)
Search
range
Median
[min-max]
Mean
(standard
deviation)
Initial loss
(mm)
[0, 2] 0.67 [0.0-
2.0]
0.79 (0.59) [0, 3] 1.6 [0.0-3.0] 1.6 (1.1)
Constant
loss (-)
[0, 1] 0.65 [0.0-
0.98]
0.64 (0.14) [0, 1] 0.88
[0.25,0.97]
0.86 (0.09)
Reservoir
constant
(min)
[1, 120] 15.5 [1.0-
90.2]
19.0 (12.0) [1,240 ] 26.6 [2.4-
240]
36.3 (34.9)
Time shift
(min)
[1,60] 14.0 [1.2-
60.0]
16.1 (11.9) [1,120] 2 [0-66] 4.5 (7.0)
615
616
Author-produced version of the article published in Hydrological Processes, Volume 31, Issue 6, 15 March 2017, Pages 1349–1359 The original publication is available at http://onlinelibrary.wiley.com/doi/10.1002/hyp.11109/abstract
Manuscript accepted for publication in Hydrological Processes, December 2016, doi: 10.1002/hyp.11109
30
Table 4 Trend detection results for the parameters in the conceptual urban rainfall-runoff 617
model 618
Parameter Mann-
Kendall test
P-value
(%)
Slope (-
/year)
Chassieu (477
events)
Model
parameters
Initial loss Original 43.2 -
Constant loss Original 2.7×10-
9**
-0.014
Reservoir constant Modified 39.9 -
Time shift Modified 88.5 -
Other
parameters
Time of
concentration (min)
Modified 99.1 -
La Lechere
(398 events)
Model
parameters
Initial loss Modified 19.2 -
Constant loss Modified 0.01**
-0.005
Reservoir constant Modified 0.3**
-0.8
Time shift Original 97.2 -
Other
parameters
Time of
concentration (min)
Modified 2.0* -3.5
619
620
621
Fig. 1. All rainfall events and events that can be satisfactorily described by rainfall-runoff 622
model: (a) Chassieu; (b) La Lechere 623
0 10 20 30 40 50 600
20
40
60
80
100
120
140
rainfall duration (h)
rain
fall
depth
(m
m)
(a)
all events
events with satisfactory model performance
0 5 10 15 20 25 30 350
20
40
60
80
100
rainfall duration (h)
rain
fall
depth
(m
m)
(b)
Author-produced version of the article published in Hydrological Processes, Volume 31, Issue 6, 15 March 2017, Pages 1349–1359 The original publication is available at http://onlinelibrary.wiley.com/doi/10.1002/hyp.11109/abstract
Manuscript accepted for publication in Hydrological Processes, December 2016, doi: 10.1002/hyp.11109
31
624
Fig. 2 Simple variables in chronological order: (1) Chassieu; (2) La Lechere 625
626
Fig. 3 Optimal model parameters of conceptual urban rainfall-runoff models using event-627
based calibration: (1) Chassieu; (2) La Lechere 628
Author-produced version of the article published in Hydrological Processes, Volume 31, Issue 6, 15 March 2017, Pages 1349–1359 The original publication is available at http://onlinelibrary.wiley.com/doi/10.1002/hyp.11109/abstract
Manuscript accepted for publication in Hydrological Processes, December 2016, doi: 10.1002/hyp.11109
32
629
Fig. 4 Time of concentration from calibrated model parameters: (a) Chassieu; (b) La Lechere 630
631
Fig. 5 Scatter plots of lag time and time of concentration: (a) Chassieu; (b) La Lechere 632
633
634
Fig. 6 Sensitivity of P-values to one noisy value: (a) the initial loss in Chassieu; (b) the 635
constant loss in Chassieu; (c) the constant loss in La Lechere; (d) the time shift in La Lechere 636
Author-produced version of the article published in Hydrological Processes, Volume 31, Issue 6, 15 March 2017, Pages 1349–1359 The original publication is available at http://onlinelibrary.wiley.com/doi/10.1002/hyp.11109/abstract
Manuscript accepted for publication in Hydrological Processes, December 2016, doi: 10.1002/hyp.11109
33
637
Fig . 7 Sensitivity of P-values to a number of extreme events introduced in the beginning of 638
data series using the original Mann-Kendall method: (a) the initial loss in Chassieu; (b) the 639
constant loss in Chassieu. 640
641
0 5 10 15 20 25 300
20
40
60
80
100
number of extreme events
P-v
alu
e (
%)
(a)
0 5 10 15 20 25 30 350
2
4
6
8
10
12
14
number of extreme events
P-v
alu
e (
%)
(b)
extreme big events
extreme small events
5% significance level
Author-produced version of the article published in Hydrological Processes, Volume 31, Issue 6, 15 March 2017, Pages 1349–1359 The original publication is available at http://onlinelibrary.wiley.com/doi/10.1002/hyp.11109/abstract