Embed Size (px)
Citation preview

Urban Green Network Mappingin Brighton and Hove

Policy Base
PPS 9 paragraph 12:
“ Networks of natural habitats provide a valuable resource. They can link sites of biodiversity importance and provide routes or stepping stones for the migration, dispersal and genetic exchange of species in the wider environment. Local authorities should aim to maintain networks by avoiding or repairing the fragmentation and isolation of natural habitats through policies in plans. Such networks should be protected from development, and, where possible, strengthened by or integrated within it. This may be done as part of a wider strategy for the protection and extension of open space . . .”

Policy Base
PPG 17 paragraph 3:
“Local authorities should also recognise that most areas of open space can perform multiple functions. . . . These include:
iii. promoting health and well-being: providing opportunities to people of all ages for informal recreation, or to walk, cycle or ride within parks and open spaces or along paths . . .
iv. havens and habitats for flora and fauna: sites may also have potential to be corridors or stepping stones from one habitat to another and may contribute towards achieving objectives set out in local biodiversity action plans;

Wider context
SE Regional Biodiversity Strategy:
‘Biodiversity
Opportunity
Areas’
- rural areas only

Work on the Brighton and Hove network began in Spring 2007
• Partnership between:
Sussex Wildlife Trust
Brighton & Hove Council
Geospec (GIS consultancy based at Brighton University)

The study was divided into four tasks:
A) Define the functions of the network
B) Define the existing baseline of information for the network
C) Identify the additional areas required to complete the network
D) Peer review

The Functions of the Network
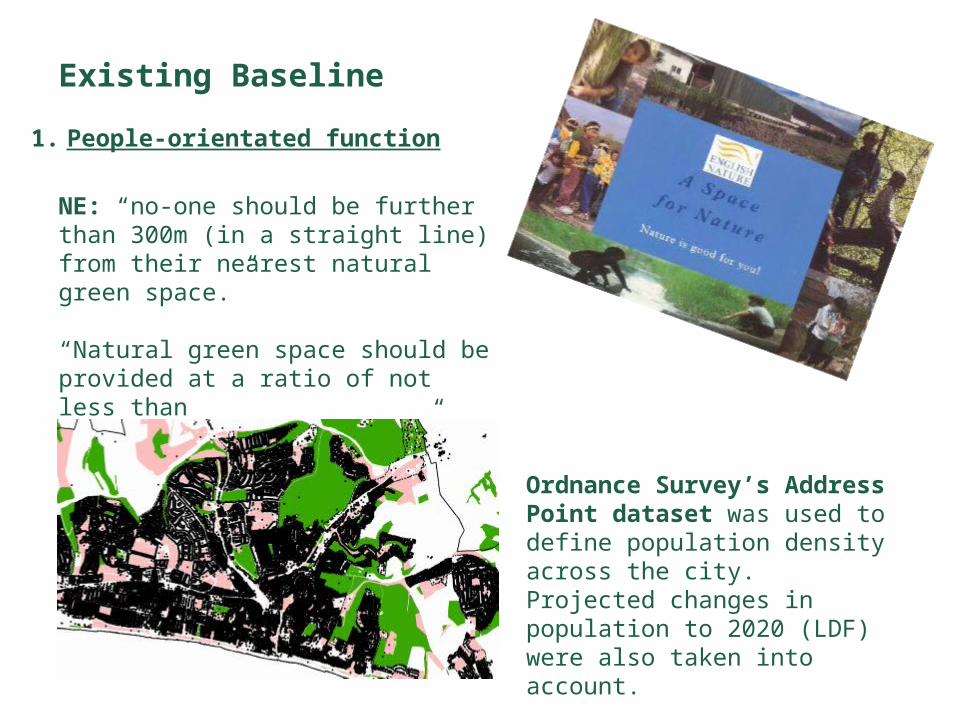
1. People-orientated function
- To take account of access to natural green space by people.
2. Species-orientated function
- To improve connectivity between habitats
3. Ecological services function
To promote air quality and ameliorate the effects of Climate Change (reduce storm water runoff, urban heat island effect, etc.)
- 3. Could not be progressed
Existing Baseline
NE: “no-one should be further than 300m (in a straight line) from their nearest natural green space.”
“Natural green space should be provided at a ratio of not less than 2 ha per thousand people.”
1. People-orientated function
Ordnance Survey’s Address Point dataset was used to define population density across the city. Projected changes in population to 2020 (LDF) were also taken into account.

1. People-orientated function (cont/d)
- Brighton & Hove Open Space Audit 2007:
Existing Baseline
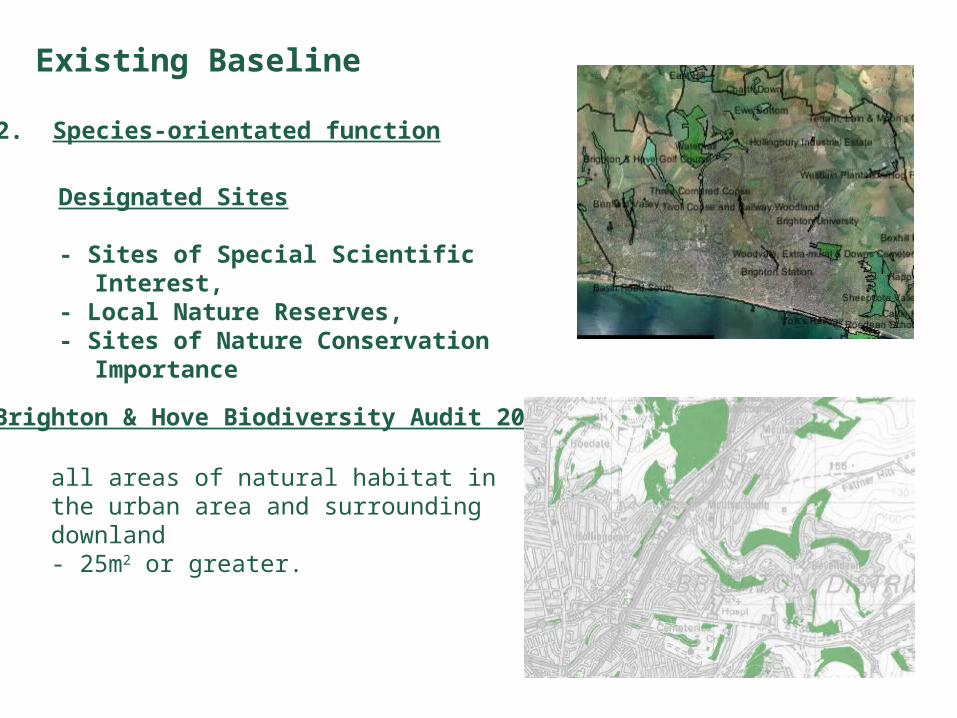
Designated Sites
- Sites of Special Scientific Interest, - Local Nature Reserves, - Sites of Nature Conservation Importance
2. Species-orientated function
Brighton & Hove Biodiversity Audit 2007
all areas of natural habitat in the urban area and surrounding downland - 25m2 or greater.
Existing Baseline

Additional areas
1. People-orientated function: Assumes land within 300m of natural green space is the most appropriate for connecting spaces. Did not take account of ‘areas of deficiency’

Projected OS address point data then used to calculate future ‘population pressure’. -300m buffer areas reduced to meet 2 ha /thousand people standard.
Additional areas

2. Species-orientated function:
Assumptions: Expert opinion used to define hypothetical ‘generic species’.
‘Generic reptile’: maximum dispersal distance of 1km
‘Generic butterfly’: maximum dispersal distance of 3km.
These generic species were designed to move progressively less easily through increasingly urbanised habitats and features.
The species were not able to move through private gardens or over wholly urban features (such as buildings and roads)
Additional areas

Generic butterfly(used a logarithmic series ranging from 10 to 10,000,000 to assign permeability values to different urban features)
Additional areas

The ‘final potential network’ was defined by overlaying:
- All areas of natural habitat identified by the Biodiversity Audit 2008 (the ‘Accessible Natural Greenspace’ layer)
+ ‘population pressure’ buffer areas
+ areas where the generic species maps overlapped with the buffer areas

Overlays of NSN + population pressure buffer + ‘Generic species’ networks

‘Final potential network’ (red – light green areas from previous slide)
- overlaid onto a Brighton & Hove Open Spaces base map
Some interpretation required, using aerial photography and local knowledge, to create ‘hard line boundaries’

Interpreted map – draft 1 (with thanks to the SBRC + Andrew Motley)

Map Detail
Green = protected wildlife sites + existing natural habitat (‘core areas’)Purple = ‘potential core areas’Brown = ‘connection zones’Turquoise = other open space where biodiversity enhancement possible

Brown = ‘connection zones’
Purple = ‘potential core areas’
• Account for an additional 543.22 ha
• Amount of ‘NSN’ required by PMP study: 119 ha
- 4.5x as much!
– BUT:• Most of the purple is beyond 15 minutes walk time
from the urban area• Doesn’t address ‘areas of deficiency’ in NSN• Hasn’t taken account of other potential land uses
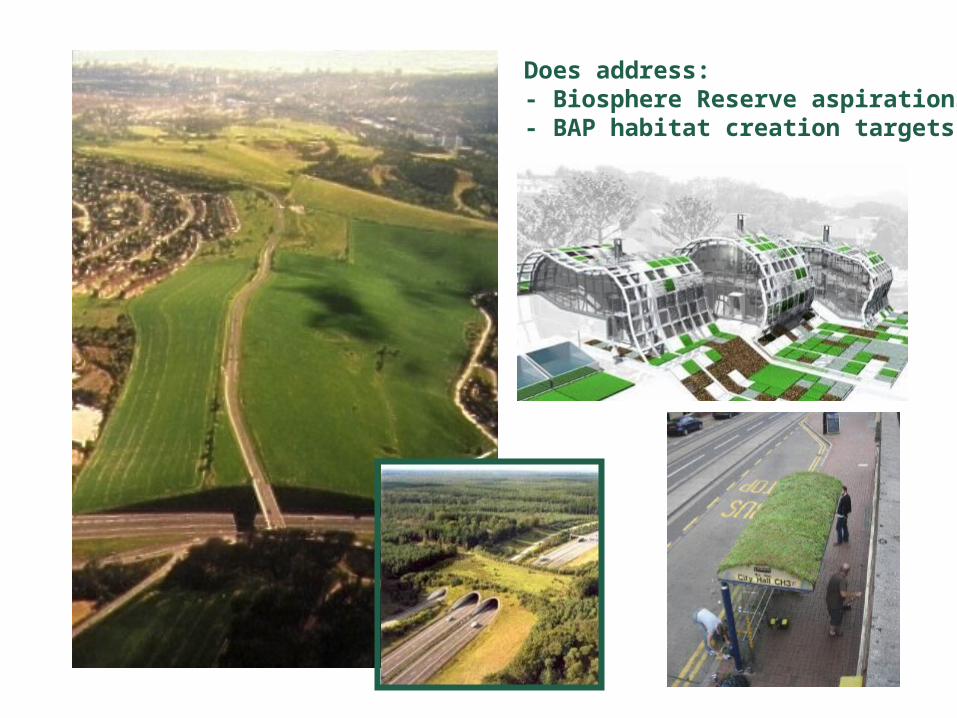
Does address: - Biosphere Reserve aspirations- BAP habitat creation targets
Peer Review: Ongoing:
- BOA definition in Sussex
- WAG
- SEEBF & Regional Biodiversity Strategy
- LDF consultation