Embed Size (px)
Citation preview
175VATTEN · 3 · 12
Urban Flooding in gothenbUrg – a MiKe21 StUdy
Urban översvämning i göteborg – en studie med MiKe21
by Valeriya FilipoVa 1, arun rana 1 and prasoon singh 2
1 Department of Water resources engineering, lTh, lund university, Box no. 118, lund 221 00, swedene-mail: [email protected], e-mail: [email protected]
2 Department of natural resources, Teri university, 10 institutional area, Vasant Kunj, new Delhi, 110070, india e-mail: [email protected]
abstractClimate change has affected the extreme weather throughout the world. Studies have shown an increase of extreme precipitation in Gothenburg, Sweden. A two dimensional (2-D) hydrodynamic simulation model using MIKE 21 was developed as a tool to simulate stormwater related flooding in the central part of Gothen-burg. The model was developed using topographical data and high temporal resolution precipitation data. The topography data is first processed in ArcGIS so that it can be further used in MIKE 21. A bathymetry for the area is created in MIKE 21 considering boundary layers and other parameters including land value. For the Manning number, two cases were considered: in the first case, a constant value of 14 for Manning number was assumed over the entire computational grid and in the second case, a land use map was used with different Manning numbers for buildings, roads, parks and water. The model simulates unsteady flooding and drying processes over the urban areas. The developed two-dimensional model shows that the parts of the study area including the canals, the streets and the space in between the residential buildings would be flooded if the drainage system is blocked due to extreme precipitation. Flood maps with maximum water level have been generated and presented in the study. The findings from this model can be used for development of compre-hensive urban flood management plan of Gothenburg.
Key words – Gothenburg, two-dimensional hydrodynamic model, DHI MIKE 21, flood maps
SammanfattningKlimatförändringar har påverkat extrema väderhändelser runt om i världen. Studier har påvisat en ökning av extrem nederbörd i Göteborg. I denna studie utvecklades en tvådimensionell hydrodynamisk modell med MIKE21 som grund för att undersöka översvämningsrisker i centrala Göteborg. I modellen användes topogra-fisk data och nederbördsdata med hög tidsupplösning. Två olika fall modellerades, det första med ett konstant Mannings tal och det andra med ett Mannings tal beroende på landanvändning. Modellen simulerar icke sta-tionär översvämning och upptorkning. Modellen visar att stora områden mellan byggnader kommer översväm-mas om ledningsnätet blockeras av extrem nederbörd. Översvämningskartor med maximala vattennivåer har genererats. Dessa kan användas som ett verktyg vid planering av översvämningsrisker i Göteborg.
VATTEN – Journal of Water Management and Research 68:175–184. Lund 2012
introductionFlooding is a major problem across the world because of the high number of fatalities and the enormous amount of economic damage that this natural disaster causes. Between 1980 and 2008, 2 887 flood events have
occurred, 195 843 people have been killed and the eco-nomic damage was over US $397 billion (Prevention-Web, 2011). Sweden has less destructive floods but flooding is still a problem for some cities like Karlstad, Gothenburg and Mariestad. Similarly to other cities in Sweden, flooding frequency in Gothenburg has been in-
176 VATTEN · 3 · 12
creasing in recent years (MSB, 2011). A flood was caused by extreme sea levels in 2005, the Mölndalsån river and other tributaries of Göta river were flooded in 2006 and 2008 and, in 2010, flash floods due to heavy rainfall caused flooding of several basements (Moback, et al, 2011). Another flood in 2011 occurred on December 10 in the areas of Stampen, Norra Gårda, Göta tunnel, Marieholm and Säveån. The purpose of this study is to develop flood risk maps of the Central part of Gothenburg using the DHI model MIKE 21, topography and precipitation data. By using measured data for three precipitation events, the water level and flood velocity in the area are determined. These flood risk maps can be further used in city plan-ning for the analysis of the flood management practices. The proximity of Gothenburg to the Göta River and the North Sea and the possibility of extreme precipitation are factors that increase the risk of flooding. In this study only flooding due to high amount of precipitation is considered. Furthermore, it is assumed that due to the high amount of rainfall, the drainage system is blocked and is excluded from the model. The model also does not include infiltration. The water level and velocity in Göta river and the two canals Rosenlund and Stora Hamn could not be accurately analyzed because no hydrograph data was available and also because one- dimensional flow is better simulated in MIKE11.
dataelevation data
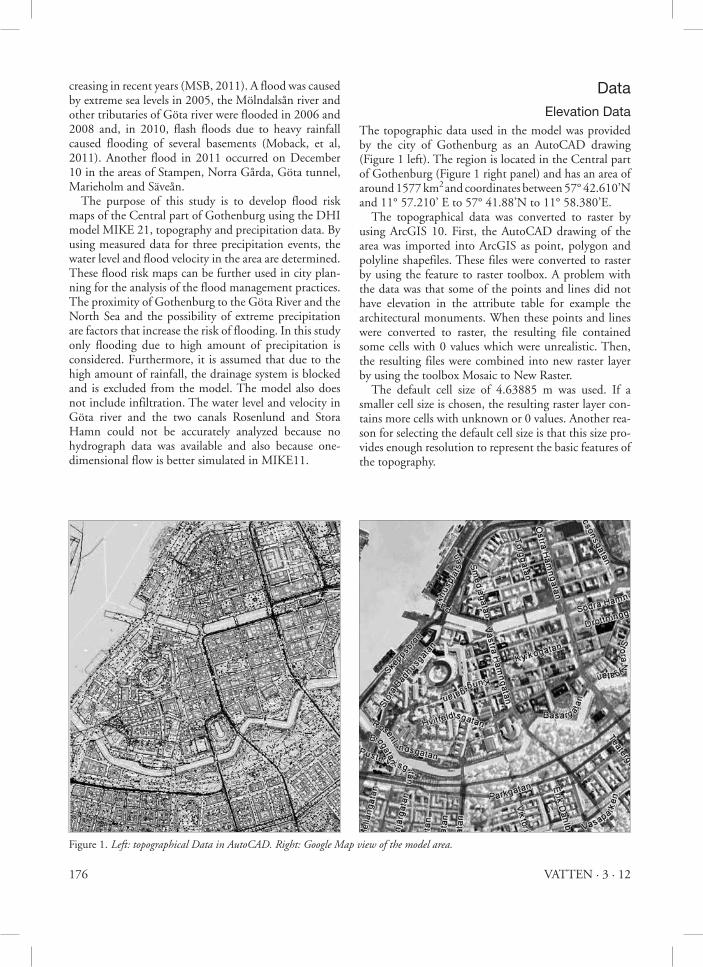
The topographic data used in the model was provided by the city of Gothenburg as an AutoCAD drawing (Figure 1 left). The region is located in the Central part of Gothenburg (Figure 1 right panel) and has an area of around 1577 km2 and coordinates between 57° 42.610’N and 11° 57.210’ E to 57° 41.88’N to 11° 58.380’E. The topographical data was converted to raster by using ArcGIS 10. First, the AutoCAD drawing of the area was imported into ArcGIS as point, polygon and polyline shapefiles. These files were converted to raster by using the feature to raster toolbox. A problem with the data was that some of the points and lines did not have elevation in the attribute table for example the architectural monuments. When these points and lines were converted to raster, the resulting file contained some cells with 0 values which were unrealistic. Then, the resulting files were combined into new raster layer by using the toolbox Mosaic to New Raster. The default cell size of 4.63885 m was used. If a smaller cell size is chosen, the resulting raster layer con-tains more cells with unknown or 0 values. Another rea-son for selecting the default cell size is that this size pro-vides enough resolution to represent the basic features of the topography.
Figure 1. left: topographical Data in autoCaD. right: google Map view of the model area.
177VATTEN · 3 · 12
The raster file was converted to ASCII text file using the toolbox Raster to ASCII. In the text file all no value cells represented by -9999 were changed to 0. The rea-son was that most of these cells were located in the river or the two canals and for this project there are consid-ered to have 0 elevation.
land Use data By converting the AutoCAD data to raster, a land use map was obtained. The same procedure was followed as for the elevation data. The difference was that when the vector data was converted, instead of elevation the field value for conversion was set to color. The description in the layer field in the attribute table of the vector layers was used to reclassify the resulting raster to land, buildings and parks. The no data values were classified as water.
rainfall dataThe rainfall data was provided by Claes Hernebring from DHI Sweden. The data contained measurements from the Barlastplatsen weather station in Gothenburg for rain events from 2000 to 2010. Three rainfall events were selected in 2002, 2003 and 2010 due to different nature of these events in terms of total precipitation, re-turn period and data availibility. By using data for the return period of block rain from the report “Rain In-tensity in Sweden-Climate Analysis” (Regnintensitet i Sverige – en klimatologisk analys) by Dahlström (2006), the return period of the events could be estimated. Refer to table 1 for details of precipitation data. The three events which were selected are therefore representative of rainfall that can frequently occur in Gothenburg. The data had fine resolution with measurements every minute.
Model Setupbathymetry
The bathymetry file was created in MIKE21 using the Mike Zero toolbox. The tool Grd2MIKE was used to convert the raster in ASCII file format to dfs2 file which
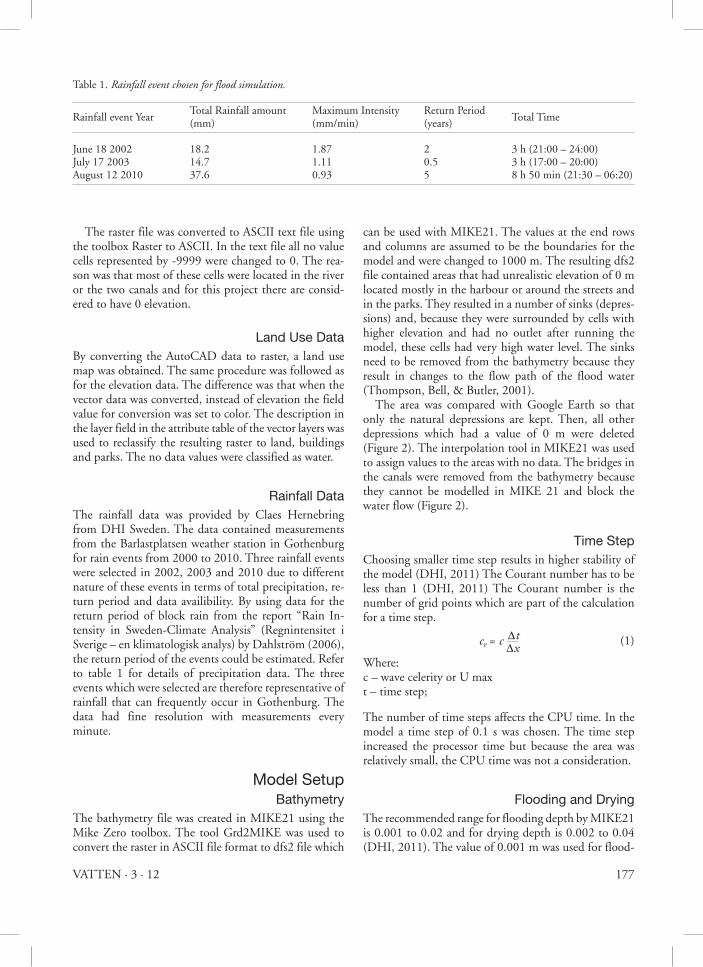
can be used with MIKE21. The values at the end rows and columns are assumed to be the boundaries for the model and were changed to 1000 m. The resulting dfs2 file contained areas that had unrealistic elevation of 0 m located mostly in the harbour or around the streets and in the parks. They resulted in a number of sinks (depres-sions) and, because they were surrounded by cells with higher elevation and had no outlet after running the model, these cells had very high water level. The sinks need to be removed from the bathymetry because they result in changes to the flow path of the flood water (Thompson, Bell, & Butler, 2001). The area was compared with Google Earth so that only the natural depressions are kept. Then, all other depressions which had a value of 0 m were deleted (Figure 2). The interpolation tool in MIKE21 was used to assign values to the areas with no data. The bridges in the canals were removed from the bathymetry because they cannot be modelled in MIKE 21 and block the water flow (Figure 2).
time StepChoosing smaller time step results in higher stability of the model (DHI, 2011) The Courant number has to be less than 1 (DHI, 2011) The Courant number is the number of grid points which are part of the calculation for a time step.
Dtcr = c Dx
(1)
Where:c – wave celerity or U maxt – time step;
The number of time steps affects the CPU time. In the model a time step of 0.1 s was chosen. The time step increased the processor time but because the area was relatively small, the CPU time was not a consideration.
Flooding and dryingThe recommended range for flooding depth by MIKE21 is 0.001 to 0.02 and for drying depth is 0.002 to 0.04 (DHI, 2011). The value of 0.001 m was used for flood-
Table 1. rainfall event chosen for flood simulation.
Rainfall event Year Total Rainfall amount Maximum Intensity Return Period
Total Time (mm) (mm/min) (years)
June 18 2002 18.2 1.87 2 3 h (21:00 – 24:00)July 17 2003 14.7 1.11 0.5 3 h (17:00 – 20:00)August 12 2010 37.6 0.93 5 8 h 50 min (21:30 – 06:20)
178 VATTEN · 3 · 12
ing depth. Different values were used for the drying depth for the three rainfall events to obtain more realis-tic water depths. For the rain events in 2002 and 2010, the value of 0.017 was used and for the rain event in 2003, 0.014 was used. The drying depth is the mini-mum value at which the cell is taken out of the calcula-tions. To make the flood and dry algorithm more effi-cient, this occurs when the cell is surrounded by other cells that are dry. If the water level in the cell is between the drying and flooding depth or borders wet cells, the grid cell is partially dry and only the mass balance equa-tion is solved (DHI, 2011). The point re-enters the computational grid when it is at the flooding depth. If drying occurs immediately after flooding, this can result in instability of the model (DHI, 2011). The difference between the flooding and drying depth was chosen to be larger as recommended by MIKE 21.
eddy ViscosityThe eddy viscosity is defined as:
t0 = h ∂û (2) ∂zWhere:t0– wall shear stressh – eddy viscosity∂û∂z
– change of the mean horizontal velocity along depth
The eddy viscosity would affect the model if there is a change in the velocity. The change would be around the buildings and near the harbour and when the flow path changes. In MIKE21, the eddy viscosity can be as con-stant value or expressed by the Smagorinsky formula. If the eddy viscosity is set to 0, then oscillatory eddies can form and if the value is high than there would be no ef-fect on the flow (Syme, 2008). Syme 2008 recommend-ed the value for the eddy viscosity to be a maximum of 0.5 in urban areas so, in the model, the value of 0.5 was used. The recommendation by MIKE21 for using con-stant and flux based value was also followed (DHI, 2011).
Manning numberThe Manning number affects mostly the flow path and the peak time and almost does not have effect on the flood area and depth (Wang and Hartnack, 2006). A DHI study in Germany showed that most appropriate values for the Manning number are 15 to 25 in urban areas (Wang and Hartnack, 2006). The model is in ur-ban area with some parks around the canals. Two simu-lations for each rainfall event were done: first, a constant Manning number of 14 was used for the entire area be-cause of the high number of buildings and the second time, a land use map with different values was used. The land use map classified the area into buildings, roads,
Figure 2. Bathymetry of study area.
179VATTEN · 3 · 12
parks and water. Using a land use map gives better ap-proximation of the friction which would affect especially the areas in the canal because water was set to M=76, the parks which have values of M=20 and the roads of M= 71 (Table 2). The buildings which have a value of M=3 are represented by their real elevation and obstruct the flow so that no significant change would occur in the flow direction. The approximation of the values for the Manning number was based on referring to values used in other studies (Baldwin Hills Dam-Break Flood). Often, the values for the Manning number are obtained during calibration. However, for the chosen flood events there was no available data for calibration.
rainfall The rainfall data was converted from mm/min to mm/day. The values were imported to MIKE21 using new time series file in dfs0 format. Three rainfall events were simulated. The precipitation event in June 18, 2002 between 21:00 and 24:00 had the highest maxi-mum value from the three events of 1.87 mm/min and the total rainfall is 18.2 mm. The event in July 17, 2003 had lower maximum value 1.11 mm/min and the total amount of rainfall was lower 14.7 mm. The rainfall in 2010, on August 12, has the lowest maximum value of 0.93 mm/ min but the largest total volume of 37.6 mm.
resultsrainfall event in 2002
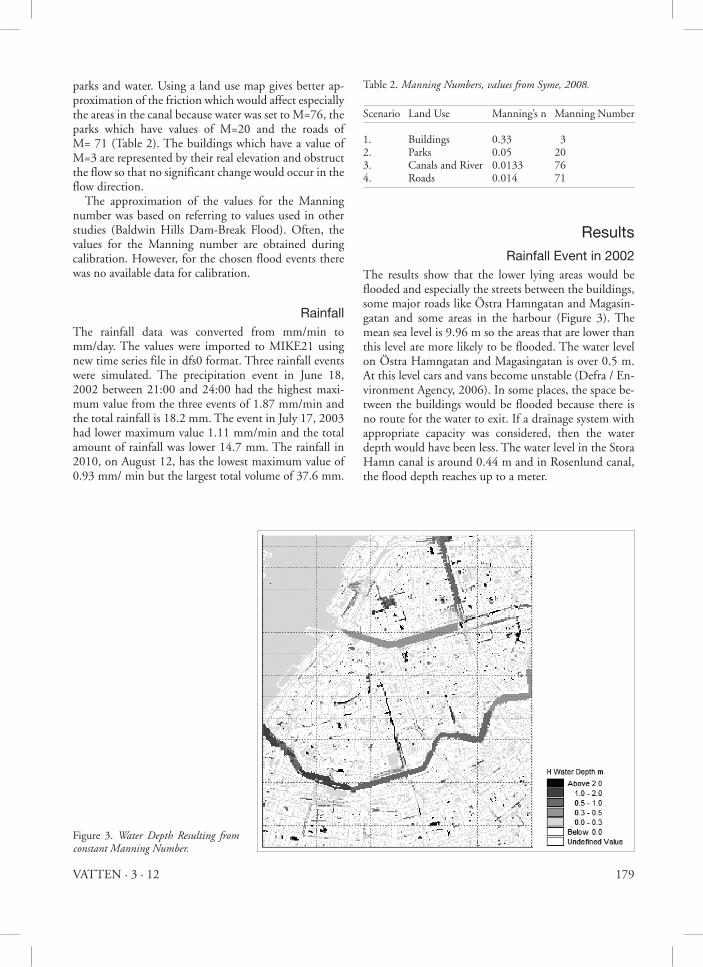
The results show that the lower lying areas would be flooded and especially the streets between the buildings, some major roads like Östra Hamngatan and Magasin-gatan and some areas in the harbour (Figure 3). The mean sea level is 9.96 m so the areas that are lower than this level are more likely to be flooded. The water level on Östra Hamngatan and Magasingatan is over 0.5 m. At this level cars and vans become unstable (Defra / En-vironment Agency, 2006). In some places, the space be-tween the buildings would be flooded because there is no route for the water to exit. If a drainage system with appropriate capacity was considered, then the water depth would have been less. The water level in the Stora Hamn canal is around 0.44 m and in Rosenlund canal, the flood depth reaches up to a meter.
Table 2. Manning numbers, values from syme, 2008.
Scenario Land Use Manning’s n Manning Number
1. Buildings 0.33 32. Parks 0.05 203. Canals and River 0.0133 764. Roads 0.014 71
Figure 3. Water Depth resulting from constant Manning number.
180 VATTEN · 3 · 12
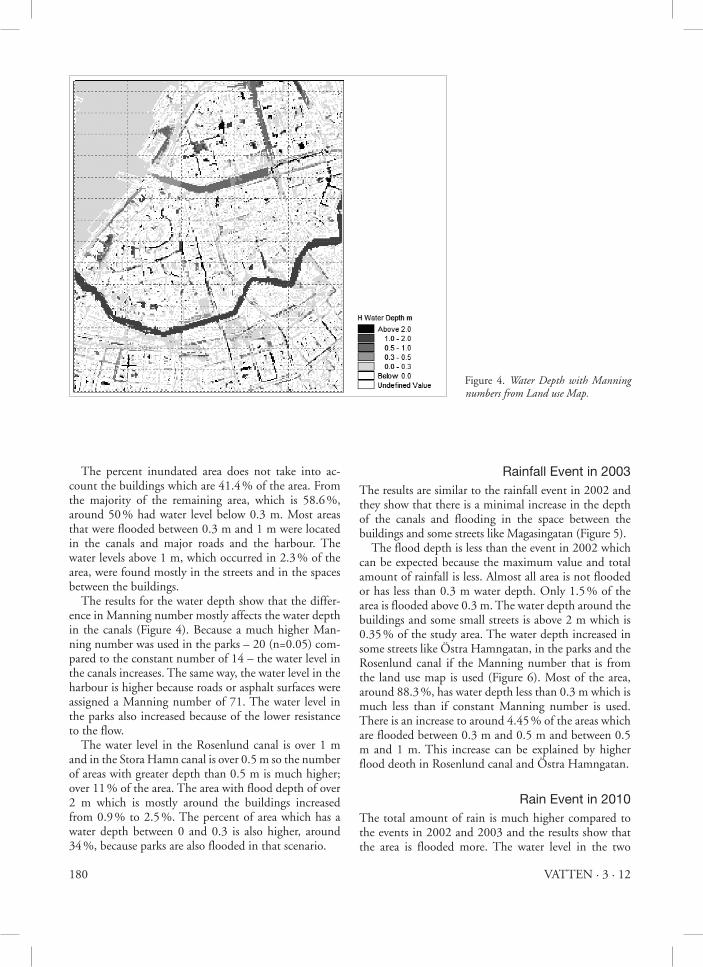
The percent inundated area does not take into ac-count the buildings which are 41.4 % of the area. From the majority of the remaining area, which is 58.6 %, around 50 % had water level below 0.3 m. Most areas that were flooded between 0.3 m and 1 m were located in the canals and major roads and the harbour. The water levels above 1 m, which occurred in 2.3 % of the area, were found mostly in the streets and in the spaces between the buildings. The results for the water depth show that the differ-ence in Manning number mostly affects the water depth in the canals (Figure 4). Because a much higher Man-ning number was used in the parks – 20 (n=0.05) com-pared to the constant number of 14 – the water level in the canals increases. The same way, the water level in the harbour is higher because roads or asphalt surfaces were assigned a Manning number of 71. The water level in the parks also increased because of the lower resistance to the flow. The water level in the Rosenlund canal is over 1 m and in the Stora Hamn canal is over 0.5 m so the number of areas with greater depth than 0.5 m is much higher; over 11 % of the area. The area with flood depth of over 2 m which is mostly around the buildings increased from 0.9 % to 2.5 %. The percent of area which has a water depth between 0 and 0.3 is also higher, around 34 %, because parks are also flooded in that scenario.
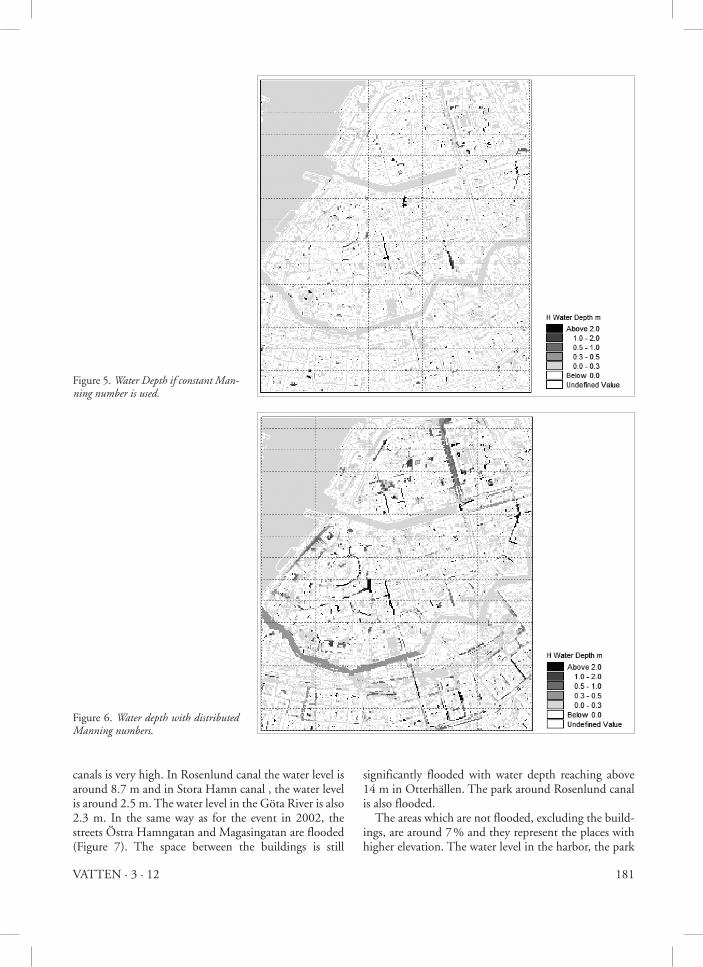
rainfall event in 2003The results are similar to the rainfall event in 2002 and they show that there is a minimal increase in the depth of the canals and flooding in the space between the buildings and some streets like Magasingatan (Figure 5). The flood depth is less than the event in 2002 which can be expected because the maximum value and total amount of rainfall is less. Almost all area is not flooded or has less than 0.3 m water depth. Only 1.5 % of the area is flooded above 0.3 m. The water depth around the buildings and some small streets is above 2 m which is 0.35 % of the study area. The water depth increased in some streets like Östra Hamngatan, in the parks and the Rosenlund canal if the Manning number that is from the land use map is used (Figure 6). Most of the area, around 88.3 %, has water depth less than 0.3 m which is much less than if constant Manning number is used. There is an increase to around 4.45 % of the areas which are flooded between 0.3 m and 0.5 m and between 0.5 m and 1 m. This increase can be explained by higher flood deoth in Rosenlund canal and Östra Hamngatan.
rain event in 2010The total amount of rain is much higher compared to the events in 2002 and 2003 and the results show that the area is flooded more. The water level in the two
Figure 4. Water Depth with Manning numbers from land use Map.
181VATTEN · 3 · 12
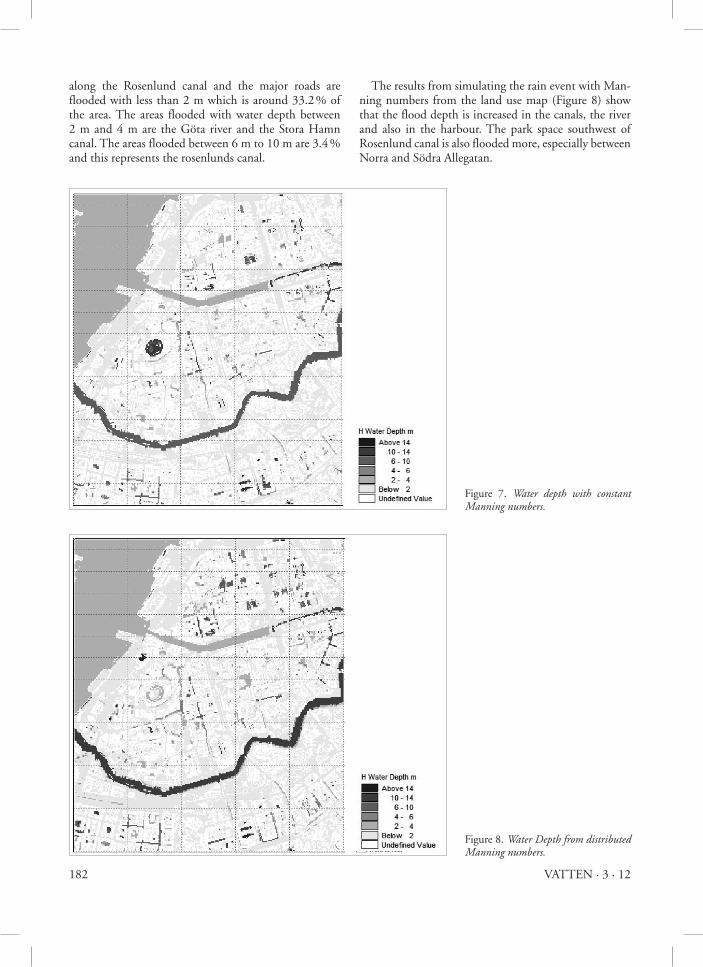
canals is very high. In Rosenlund canal the water level is around 8.7 m and in Stora Hamn canal , the water level is around 2.5 m. The water level in the Göta River is also 2.3 m. In the same way as for the event in 2002, the streets Östra Hamngatan and Magasingatan are flooded (Figure 7). The space between the buildings is still
significantly flooded with water depth reaching above 14 m in Otterhällen. The park around Rosenlund canal is also flooded. The areas which are not flooded, excluding the build-ings, are around 7 % and they represent the places with higher elevation. The water level in the harbor, the park
Figure 5. Water Depth if constant Man-ning number is used.
Figure 6. Water depth with distributed Manning numbers.
182 VATTEN · 3 · 12
along the Rosenlund canal and the major roads are flooded with less than 2 m which is around 33.2 % of the area. The areas flooded with water depth between 2 m and 4 m are the Göta river and the Stora Hamn canal. The areas flooded between 6 m to 10 m are 3.4 % and this represents the rosenlunds canal.
The results from simulating the rain event with Man-ning numbers from the land use map (Figure 8) show that the flood depth is increased in the canals, the river and also in the harbour. The park space southwest of Rosenlund canal is also flooded more, especially between Norra and Södra Allegatan.
Figure 7. Water depth with constant Manning numbers.
Figure 8. Water Depth from distributed Manning numbers.
183VATTEN · 3 · 12
The percent of areas which are not flooded is lower; 0.3 % excluding the buildings. The areas that are flooded with water level below 2 m are around 38 %, compared to 33.2 % with constant Manning numbers. This in-crease is because more low-lying areas between Norra and Södra Allegatan are flooded. The percent of areas which are flooded between 10 m and 14 m is higher – 3.4 % – because the water level in Rosenlund canal is higher; around 13 m .
discussion and ConclusionThe results show the areas that can be flooded if the drainage system is overloaded. The model was not cali-brated because no accurate historic data was found for the runoff from the three events that were simulated. However, during other flood events, flooding also oc-curred in the canals and the central part of Gothenburg. In the rainfall event in 2011 on December 10, all the canals within the city were flooded (Sydvik, 2011). By analysing the results of the model, the following conclusions can be made:
• A rainfall that has higher total volume and longer du-ration would cause more flooding in the area than a short rainfall with higher intensity if the drainage sys-tem is blocked. Then, if the drainage system is not working, the rain water will accumulate and cause very high water levels. This accumulation of water also causes increase in the flood velocity due to the higher total volume of water compared to a rainfall with higher intensity but shorter duration.
• The highest flood depth is in the small streets or spaces between the buildings. The highest velocities are on Magasingatan and Östra Hamngatan and along Rosenlund canal. Special attention is also needed for the areas in which the flood velocity is very low be-cause if the drainage system is not working, the time of inundation would be very long.
• There is a difference in the water depth and velocity depending upon whether constant or distributed Manning numbers were used. In general, the velocity and water depth increase if the coefficients for the Manning number are based on land use map. The area is very heterogeneous with many buildings which are acting as obstructions to the flow and at the same time roads and parks which have smaller n value. Us-ing distributed Manning numbers would give more realistic results especially when the model cannot be calibrated.
• Alternatives to the combined sewer system or SUDs (Sustainable Urban Drainage Systems) need to be used to supplement the handling of stormwater.
This study identifies the areas for which the city should use further measures to improve the drainage in large stormwater events. Similar conclusions were made by the project, “Plan B – dealing with floods in densely populated cities with extreme rain.” (Ahlman, 2011). In densely populated areas, the areas for infiltration and delay of the stormwater are limited and therefore plan-ning needs to be done in advance. The sewer system in the central part of Gothenburg is combined and, espe-cially if there is an increase in the rainfall, the sewer sys-tem would not be able to handle the stormwater. Other alternatives to drainage in the streets and in the space between the buildings have to be in place in case the drainage system is blocked. These alternatives have to also be included in a flood management plan. Methods for local treatment of the stormwater have to also be in-vestigated. The stormwater has to be managed as close to the source as possible. The runoff from impervious sur-faces needs to be delayed and treated. The stormwater delay decreases the peak which is especially important to prevent combined sewer overflow. If there are suitable conditions, some or all water has to be infiltrated. How-ever, the groundwater level has to be kept normal so the house foundations and the trees are not damaged. In the planning of new subdivisions, the natural water courses and the low points need to be considered. The use of green roofs and using permeable surfaces is also recom-mended. The used of open stormwater system sludge has to be maintained by the construction company (Stadsbyggnadskontoret, 2003). Open stormwater sys-tems require more space and this has to be taken into account. The central part of Gothenburg is the area that has the highest risk of floods. However, a flood study is needed for the entire city. The future increase in extreme precipitation, the rise in the sea level and the flooding from the river have to be simulated in a detailed flood study so that the areas with risk of flooding for Gothen-burg can be identified. Then, a cost-benefit analysis needs to be done for finding the best set of solutions for flood protection.
referencesAhlman, S., DHI (2011) Plan B – hantering av översväm-
ningar i tätorter vid extrema regn. Växjö: Svenskt Vatten. [online] Available at: http://vav.griffel.net/filer/Rapport_2011-03.pdf [Accessed 15 Feb 2012].
Aguilar, F., Agüera, F., Aguilar, M. and Carvajal, F.(2005) Effects of Terrain Morphology, Sampling Density, and In-terpolation Methods on Grid DEM Accuracy. Photogram-metric Engineering and Remote Sensing, 71(7), 805–816.
Dahlström, B. (2006) Regnintensitet i Sverige – en klimatisk analys. SMHI.
Defra / Environment Agency (2006) R&D OUTPUTS: Flood
184 VATTEN · 3 · 12
Risks to People. London. Available at: < http://www.rpaltd.co.uk/documents/J429-RiskstoPeoplePh2-Guidance.pdf> [Accessed 11 May 2012].
DHI (2011) MIKE 21 & MIKE 3 Flow Model Hydrodynam-ic and Transport Module Scientific Document. Manual. Horsholm: DHI.
DHI (2011) MIKE 21 Flow Model Hydrodynamic Module Scientific Documentation.
DHI (2011) MIKE 21 Flow Model Hydrodynamic Module User Guide.
Dhun, K. (2011) Application Of LIDAR DEMS to the Mod-elling of Surface Drainage Patterns in Human Modified Landscapes. MSc. The University of Guelph. Available at < http://dspace.lib.uoguelph.ca/xmlui/handle/10214/2969 > [Accessessed 23 Apr 2012]
Moback, U., Andreasson, M., Petzén, M. and Elfving, R. (2011) Integrated flood model for the City of Gothenburg. In Cities of the Future – Sustainable Urban Planning and Water Management. Stockholm, Sweden, 2011. [online] Available at <http://www.cof2011stockholm.se/?type=static &id=50> [Accessed 15 Feb 2012].
MSB (2011) Identifiering av områden med betydande över-svämningsrisk. MSB. [online] Available at: <https://www.msb.se/Upload/Nyheter_press/Pressmeddelanden/Slutrap-port_PFRA_MSB.pdf> [Accessed 15 Feb 2012].
PreventionWeb (2011) [online] Available at: <http://www.pre-ventionweb.net/english/hazards/statistics/?hid=62>. [Ac-cessed 1 Dec 2011].
Stadsbyggnadskontoret (2003) Vatten – så klart. Vattenplan för Göteborg. Göteborg: Stadsbyggnadskontoret.
Sydvik, P. (2011) Översvämning stoppar trafiken. GP, [online]. Available at:http://www.gp.se/nyheter/goteborg/1.697964-oversvamning-stoppar-trafiken.
Syme, W. (2008) Flooding in Urban Areas – 2D Modelling Approaches for. Engineers Australia, 9th National Confer-ence on Hydraulics in Water Engineering.
Thompson, J., Bell, J. and Butler, C. (2001) Digital elevation model resolution: effects on terrain attribute calculation and quantitative soil-landscape modeling. geoderma, (100), 67 – 89.
Wang, F. and Hartnack, J. (2006) Simulation of Flood Inunda-tion in Jilin City, Songhua River Project.