Embed Size (px)
Citation preview
URBAN DYNAMICS AND REAL-ESTATE SPECULATION: THE IMPACT
ON THE URBAN AREAS OF THE ATLANTIC AXIS (GALICIA, SPAIN)1.
Alejandro López-González
University of Leon (Spain)
Maria-José Piñeira-Mantiñán
University of Santiago de Compostela (Spain)
Abstract:
In this paper we will discuss the urban development that Galician cities have experienced since the
early 1990’s, one period in which the neoliberal urban model glorified and encouraged private
development planning strategies that were not consistent with the governance recommendations
dictated by Europe. This was a model in which building growth was not consistent with population
growth. That is why throughout this paper we will try to analyze the relationship between the
housing market in the Atlantic Urban Axis and the current capacity of absorption of the demand for
housing. Our work will be based on the analysis of the main Galician cities, limiting
their metropolitan areas through a gravitational model and studying the relational flows in each of
them. Through the subsequent interpolation of demographic and building variables (housing starts,
municipal licenses) we will be able to estimate the evolution of construction activity and compare it
with the real demand. At the same time, we will study the impact the construction effort has had on
the anarchic growth of the cities, speculation processes, social segregation and real estate,
characterized by an oversupply of houses which will remain empty because of the economic crisis.
Key words: urban growth, neoliberal city, governance, metropolitan areas, real estate.
1 Research financed by the National Plan for R&D, reference CS02010-16298.
Introduction
During the last few years there is a real preoccupation in Spain about knowing how the real estate
market is doing, in that it has been one of the principal vehicles of capital accumulation of
neoliberal town planning: it generates employment, allows for tax increases and propels tourist
activity (Smith, 2004). The construction sector has undoubtedly been a profitable business directed
principally by large private urban development agents, and that has turned out to be favoured by a
set of factors among which it is necessary to emphasize the transformation of homes (increase of
the mononuclear and individual type) (González Rodríguez, 2008), the increase of the demand for
secondary residences (used during the weekends or holiday periods) and of empty houses (as a
result both of the processes of depopulation which some localities suffered, and of the processes of
inheritance and speculation).
During the period 1997-2006 the entire volume of houses initiated in Spain has been superior to 5
and a half million, almost double that of the decade 1987-1996. A number that supposes an average
annual ratio during ten years of 13.3 houses for every 1,000 inhabitants (more than double the 5-7
houses for every 1,000 inhabitants registered in Europe) and that undoubtedly outnumbers the ones
reached in the two previous real estate booms: the annual average of houses initiated in 2002-2006
was 666,885, almost triple the 245,000 annual ones registered between 1986-1991, and almost
double the 345,000 annual ones of the period 1970-1974 (development epoch) in which it was
necessary to provide housing for the massive wave of population proceeding from the rural exodus
and in which the first massive tourist development took place. (Burriel, 2008).
The laws by the System of Land and Urban Arrangement, or the Territorial Plans promoted by the
Autonomous Regions (that according to the Spanish Constitution are those who have the authority
on the subjects of territorial distribution, city planning and housing) are useless, as are the General
Plans of Municipal Distribution promoted by every municipality. The benefits generated by
construction activity have happened to occupy the main role and have relegated to the background
factors such as the population increase or the role of the public powers as guarantors of municipal
planning and the defense of general interests:
Town-planning politics were promoted whereby the entire space was building land, except
ones under special legislation (coast) or considered protected heritage. Nevertheless, the
protective figure of the aforementioned spaces was not always respected and in Galicia the
classification of the land into something denominated rural building land was even
included.
If during the development epoch the public administrations were those that were controlling
the urban growth and the companies intervening in it, in this new stage the companies are
those who control and use the public administrations for their own benefit. They see in the
real estate sector the ideal route to prosper, especially in those cases in which only one
developer develops in only one unit of execution and in only one phase thousands of houses
in millions of m2. The power of the private sector is so high that it favors the proliferation of
town-planning agreements through which the town halls promise to pass a proposed
development in exchange for compensations in other works or money. The serious aspect is
the fact is that in areas with a strong decrease of agrarian income the population legitimized
the aforementioned processes and regarded them as an unexpected blessing that was going
to bring them income for the sale of their lands.
The building land was bought by financial institutions, which benefited from a policy of
"accessible" mortgages to realize sales of land at highly speculative prices and to extend
their clientele.
The healthy economic situation of the country and low interest rates encouraged the
purchase of apartments by the population, even people who had an average salary would
risk applying for loans to pay the "down payment" on an apartment. Mortgage loans
increased sixfold in ten years, going from 100,000 million Euros in 1997 to almost 600,000
million in 2007. Likewise, many foreigners wanted to establish in our country their
permanent or secondary residence, attracted by the quality of life and the climate. Groups
such as the Tourist Real Estate Developers were favoring the investment of foreign tourists
in buying houses. In the year 2003, between 800,000 - 1,700,000 European families were
ready to buy a house in Spain (Diaz Orueta, 2006).
To these it is necessary to add important changes in infrastructure, transport, and
information technologies and communication, which gave a new character to the cities and
created a new logic of territorial arrangement. People were fleeing from the chaos of the
cities towards suburban belts to establish their principal or secondary residence. Natural
environments and small traditional areas were becoming suitable places to receive the new
residents. As a result, in a few years the aforementioned spaces saw their population
increase, their fields developed and their landscapes altered.
Finally, it is necessary to point out that the citizens have not taken part in the design of the
city, since the dialogue with the authorities is excessively complicated and a lot of effort is
needed to change decisions made in advance.
We have before us a panorama in which a model of neoliberal town planning predominates (N.
Smith 2009) over and is very distant from the urban guidelines of the 21st century promoted by
Europe. These speak to us about the need to develop new formulas of governing that provide the
cities with the best conditions to achieve "success" in the world urban network, very much a
hierarchy and marked by competitiveness. To obtain this we need to apply several of the basic
community principles: that of economic and social cohesion which allows public action to solve the
imbalances between territories; that of balanced competitiveness of the territories, in the face of
new challenges that increasing competition imposes; of sustainability, not only environmental but
also economic and social, to modify the current patterns of the human activity; and finally, of
subsidiary, that attributes management to the level nearest the citizen (Ortega, 2001). It is
fundamental that the new forms of urban government encourage the cooperation and participation
of all the agents – and this means including the citizens - and an integrated vision of city planning,
linked to other sectors of politics like the environment, infrastructures or natural and cultural
resources management.
The evolution of the housing market in the urban areas of the Galician Atlantic
Axis
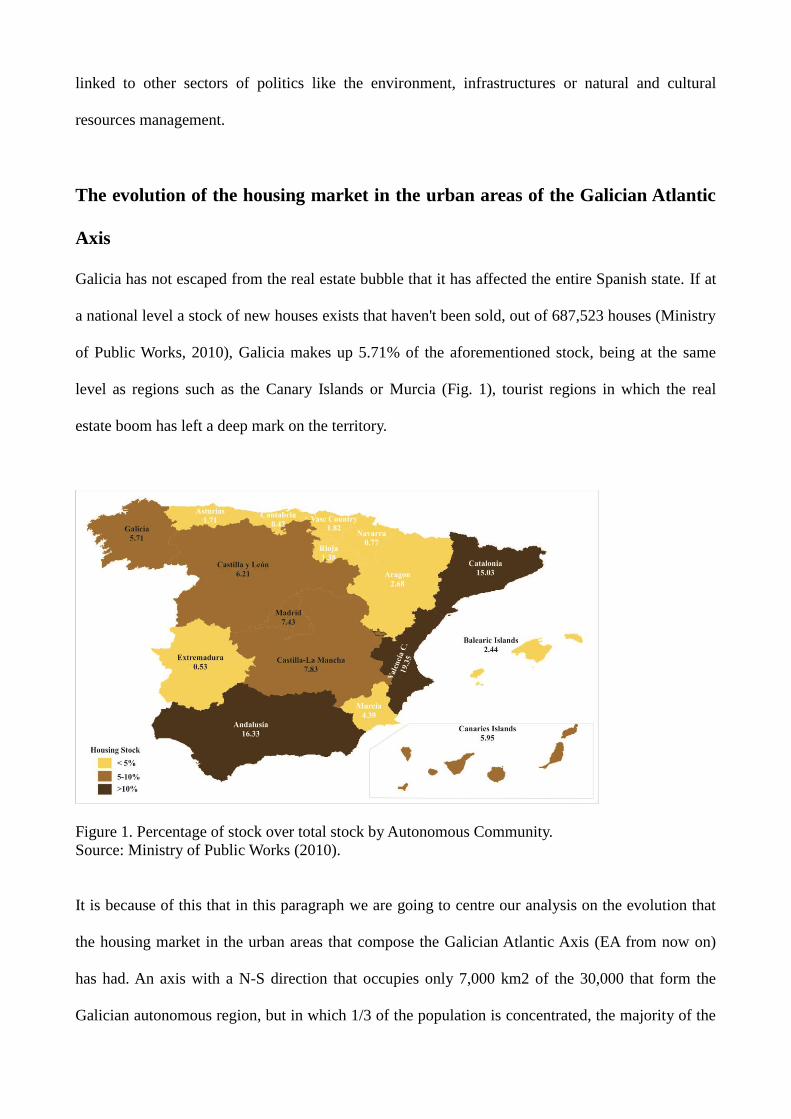
Galicia has not escaped from the real estate bubble that it has affected the entire Spanish state. If at
a national level a stock of new houses exists that haven't been sold, out of 687,523 houses (Ministry
of Public Works, 2010), Galicia makes up 5.71% of the aforementioned stock, being at the same
level as regions such as the Canary Islands or Murcia (Fig. 1), tourist regions in which the real
estate boom has left a deep mark on the territory.
Figure 1. Percentage of stock over total stock by Autonomous Community.
Source: Ministry of Public Works (2010).
It is because of this that in this paragraph we are going to centre our analysis on the evolution that
the housing market in the urban areas that compose the Galician Atlantic Axis (EA from now on)
has had. An axis with a N-S direction that occupies only 7,000 km2 of the 30,000 that form the
Galician autonomous region, but in which 1/3 of the population is concentrated, the majority of the
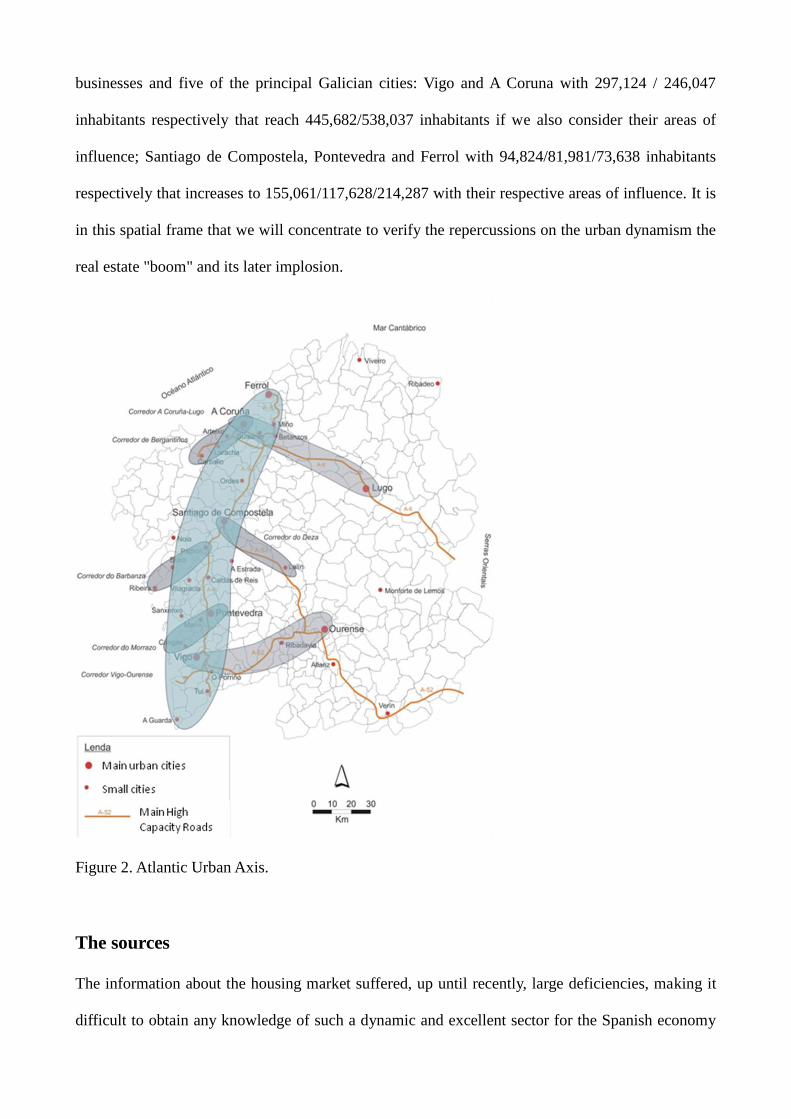
businesses and five of the principal Galician cities: Vigo and A Coruna with 297,124 / 246,047
inhabitants respectively that reach 445,682/538,037 inhabitants if we also consider their areas of
influence; Santiago de Compostela, Pontevedra and Ferrol with 94,824/81,981/73,638 inhabitants
respectively that increases to 155,061/117,628/214,287 with their respective areas of influence. It is
in this spatial frame that we will concentrate to verify the repercussions on the urban dynamism the
real estate "boom" and its later implosion.
Figure 2. Atlantic Urban Axis.
The sources
The information about the housing market suffered, up until recently, large deficiencies, making it
difficult to obtain any knowledge of such a dynamic and excellent sector for the Spanish economy
and society (García Montalvo, 2001 and 2007; Palacios García, 2008; Vinuesa Angulo, J, 2008). In
the study of real estate activity two basic variables exist: prices and quantities. The first one turns
out to be vague due to the confluence of the values of use and change in this type of product, as
well as for the incidence of speculative processes (vid. Cuadrado Roura, J. R., 2011: 46-68; García
Montalvo, J, 2007 and 2009; Garriga, C., 2010; Vergés, R., 2009)
On the other hand, the variable quantity is less controversial and easily comparable, and so will be
used in this paper. The information used is based on information about stocks (housing censuses)
and on three series of flow information (housing starts, work licenses and housing transactions):
1. 2001 Housing Census. It constitutes the principal basis for the series of facts that represent
the changes in the number of houses this year, distinguishing between principal and non-
principal residences (secondary and empty).
2. The work project starts. It is a procedure previous to administrative authorization or work
licenses: it consists of monitoring the veracity of the identity and authorization as architect
the editor of a work project. The Architects' School publishes this series annually.
3. The work license. It is an administrative document by which the builder obtains
authorization to build on the part of the corresponding local administration. The Galician
Institute of Statistics publishes this information annually from surveys sent to the Galician
municipalities.
4. New housing transactions. This series began in 2004, gathering information on the
registered houses and, consequently, acquired from the housing developers. The information
is compiled by the Ministry of Public Works, originally in the Notaries' Schools. It is
quarterly.
The facts described above allow us to construct variables that will describe the existing housing
stocks in 2001 in the five urban areas studied, and the evolution of supply (starts and licenses, from
2001) and the demand of housing (transactions, from 2004).
A last aspect related to sources is associated with the chronological relationship between affairs
relative to housing. In other words, housing is started, object to administrative licenses and
registered in different moments: there are delays that determine the supply and demand analysis; it
is suggested that they are chronologically adjusted to fit the series that are the object of comparison,
for this we resort to applying a model of simple regression.
it itk itkT L u (1)
it itk itkL V u (2)
Where T is the number of transactions, L that of housings as a consequence of work licenses
granted and V starts, all of them in a municipality i and in one year t, and k the delays (that can
acquire the value 0 if both series are simultaneous, 1 if the explanatory variable precedes by one
year the explained one and 2 if the delay is two years), while and are regression parameters
and u is the residual variable not explained by the model. The results of the regression analyses
show that the determination coefficients acquire higher values for delays of two years in the case of
the relation between licenses and transactions (the values of R2 vary between 0.379 and 0.741 for
k=0, between 0.309 and 0.823 for k=1 and between 0.525 and 0.915 for k=2). In the case of the
relation between licenses and starts we obtain less consistent results, the best adjustment happens
when the delay is within the current year (R2 ranges between 0.631 and 0.870 for k=0, between
0.435 and 0.852 for k=1 and between 0.201 and 0.742 for k=2).
The evolution of housing stock from 2001
The analysis of the existing housing developments in the urban areas studied forces us to depart
from the information contained in the 2001 housing census (table 1). In it we reproduce the
following items: principal, secondary, empty and entire residences; in addition to an evaluation that
relates the entire number of houses to the population to facilitate the comparison between the
different areas.
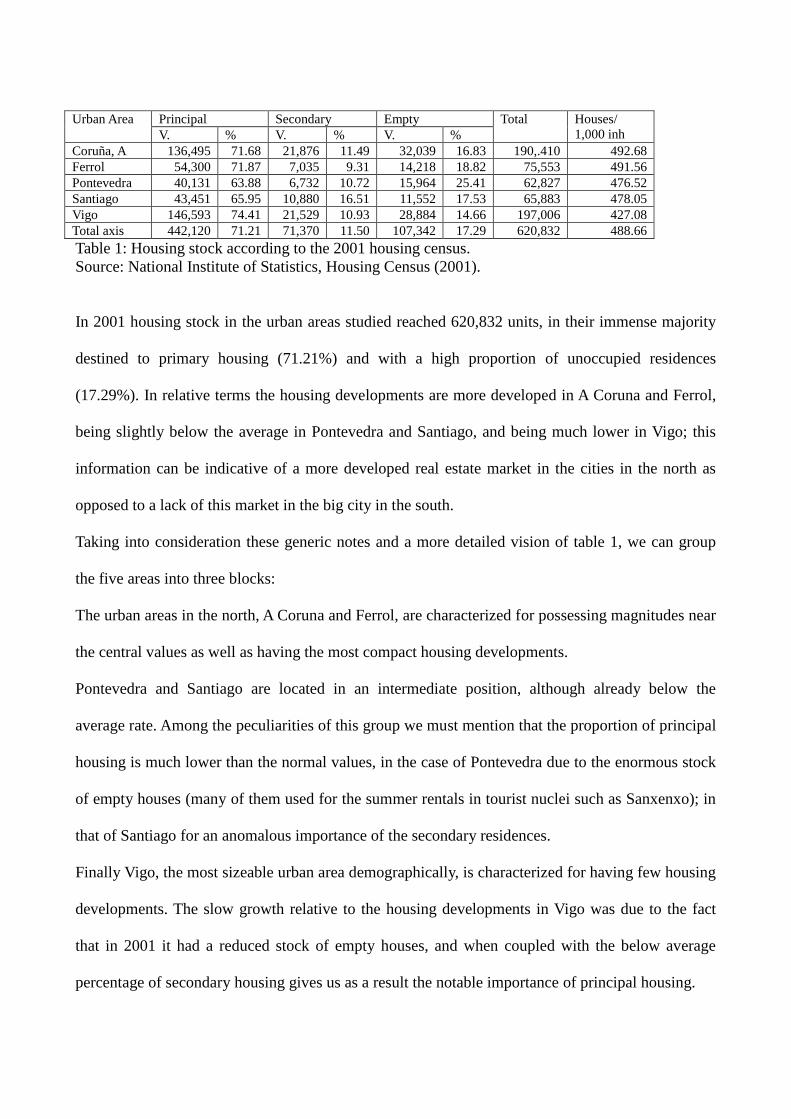
Urban Area Principal Secondary Empty Total Houses/
1,000 inh V. % V. % V. %
Coruña, A 136,495 71.68 21,876 11.49 32,039 16.83 190,.410 492.68
Ferrol 54,300 71.87 7,035 9.31 14,218 18.82 75,553 491.56
Pontevedra 40,131 63.88 6,732 10.72 15,964 25.41 62,827 476.52
Santiago 43,451 65.95 10,880 16.51 11,552 17.53 65,883 478.05
Vigo 146,593 74.41 21,529 10.93 28,884 14.66 197,006 427.08
Total axis 442,120 71.21 71,370 11.50 107,342 17.29 620,832 488.66
Table 1: Housing stock according to the 2001 housing census.
Source: National Institute of Statistics, Housing Census (2001).
In 2001 housing stock in the urban areas studied reached 620,832 units, in their immense majority
destined to primary housing (71.21%) and with a high proportion of unoccupied residences
(17.29%). In relative terms the housing developments are more developed in A Coruna and Ferrol,
being slightly below the average in Pontevedra and Santiago, and being much lower in Vigo; this
information can be indicative of a more developed real estate market in the cities in the north as
opposed to a lack of this market in the big city in the south.
Taking into consideration these generic notes and a more detailed vision of table 1, we can group
the five areas into three blocks:
The urban areas in the north, A Coruna and Ferrol, are characterized for possessing magnitudes near
the central values as well as having the most compact housing developments.
Pontevedra and Santiago are located in an intermediate position, although already below the
average rate. Among the peculiarities of this group we must mention that the proportion of principal
housing is much lower than the normal values, in the case of Pontevedra due to the enormous stock
of empty houses (many of them used for the summer rentals in tourist nuclei such as Sanxenxo); in
that of Santiago for an anomalous importance of the secondary residences.
Finally Vigo, the most sizeable urban area demographically, is characterized for having few housing
developments. The slow growth relative to the housing developments in Vigo was due to the fact
that in 2001 it had a reduced stock of empty houses, and when coupled with the below average
percentage of secondary housing gives us as a result the notable importance of principal housing.
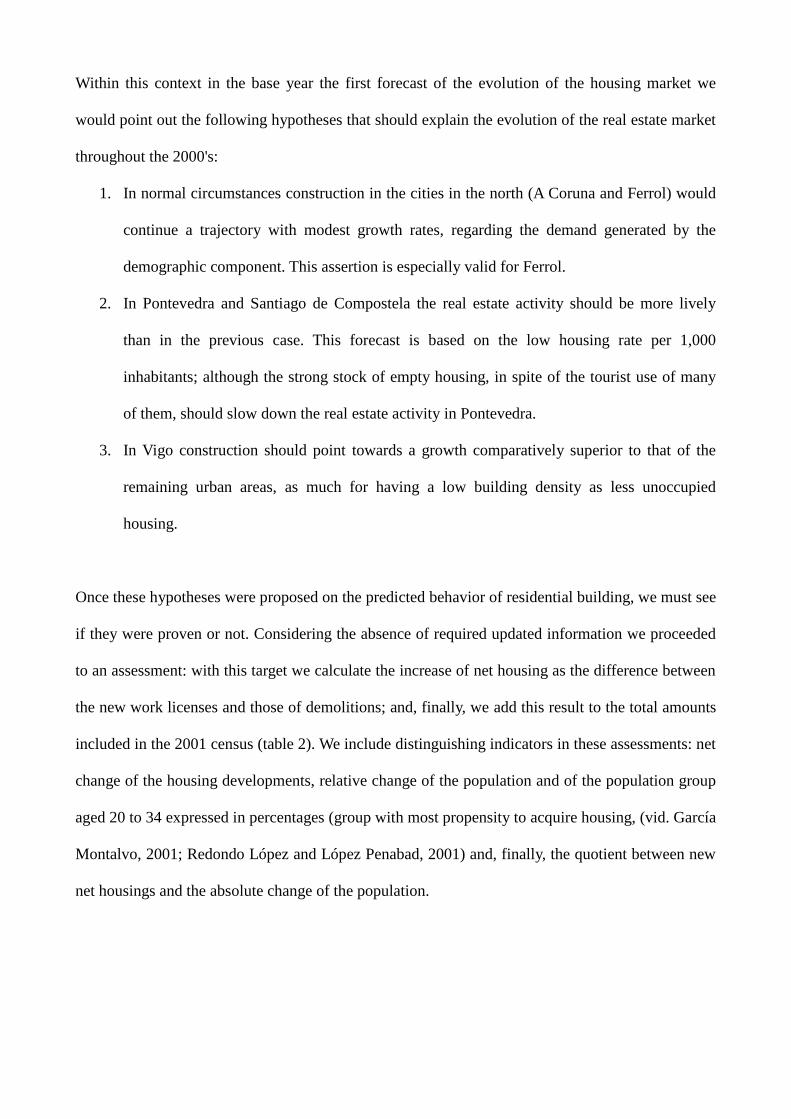
Within this context in the base year the first forecast of the evolution of the housing market we
would point out the following hypotheses that should explain the evolution of the real estate market
throughout the 2000's:
1. In normal circumstances construction in the cities in the north (A Coruna and Ferrol) would
continue a trajectory with modest growth rates, regarding the demand generated by the
demographic component. This assertion is especially valid for Ferrol.
2. In Pontevedra and Santiago de Compostela the real estate activity should be more lively
than in the previous case. This forecast is based on the low housing rate per 1,000
inhabitants; although the strong stock of empty housing, in spite of the tourist use of many
of them, should slow down the real estate activity in Pontevedra.
3. In Vigo construction should point towards a growth comparatively superior to that of the
remaining urban areas, as much for having a low building density as less unoccupied
housing.
Once these hypotheses were proposed on the predicted behavior of residential building, we must see
if they were proven or not. Considering the absence of required updated information we proceeded
to an assessment: with this target we calculate the increase of net housing as the difference between
the new work licenses and those of demolitions; and, finally, we add this result to the total amounts
included in the 2001 census (table 2). We include distinguishing indicators in these assessments: net
change of the housing developments, relative change of the population and of the population group
aged 20 to 34 expressed in percentages (group with most propensity to acquire housing, (vid. García
Montalvo, 2001; Redondo López and López Penabad, 2001) and, finally, the quotient between new
net housings and the absolute change of the population.
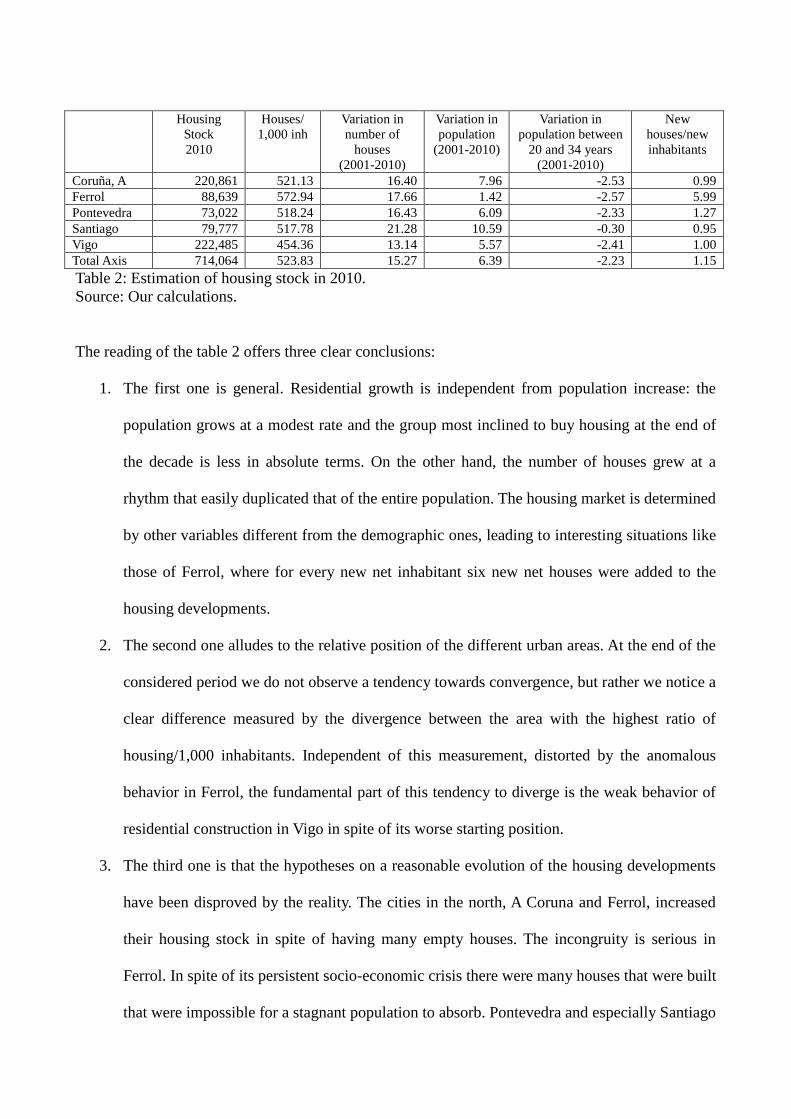
Housing
Stock
2010
Houses/
1,000 inh
Variation in
number of
houses
(2001-2010)
Variation in
population
(2001-2010)
Variation in
population between
20 and 34 years
(2001-2010)
New
houses/new
inhabitants
Coruña, A 220,861 521.13 16.40 7.96 -2.53 0.99
Ferrol 88,639 572.94 17.66 1.42 -2.57 5.99
Pontevedra 73,022 518.24 16.43 6.09 -2.33 1.27
Santiago 79,777 517.78 21.28 10.59 -0.30 0.95
Vigo 222,485 454.36 13.14 5.57 -2.41 1.00
Total Axis 714,064 523.83 15.27 6.39 -2.23 1.15
Table 2: Estimation of housing stock in 2010.
Source: Our calculations.
The reading of the table 2 offers three clear conclusions:
1. The first one is general. Residential growth is independent from population increase: the
population grows at a modest rate and the group most inclined to buy housing at the end of
the decade is less in absolute terms. On the other hand, the number of houses grew at a
rhythm that easily duplicated that of the entire population. The housing market is determined
by other variables different from the demographic ones, leading to interesting situations like
those of Ferrol, where for every new net inhabitant six new net houses were added to the
housing developments.
2. The second one alludes to the relative position of the different urban areas. At the end of the
considered period we do not observe a tendency towards convergence, but rather we notice a
clear difference measured by the divergence between the area with the highest ratio of
housing/1,000 inhabitants. Independent of this measurement, distorted by the anomalous
behavior in Ferrol, the fundamental part of this tendency to diverge is the weak behavior of
residential construction in Vigo in spite of its worse starting position.
3. The third one is that the hypotheses on a reasonable evolution of the housing developments
have been disproved by the reality. The cities in the north, A Coruna and Ferrol, increased
their housing stock in spite of having many empty houses. The incongruity is serious in
Ferrol. In spite of its persistent socio-economic crisis there were many houses that were built
that were impossible for a stagnant population to absorb. Pontevedra and especially Santiago

de Compostela offer a more exact trajectory of the forecasts; building growth is rapid, and in
Pontevedra the incidence of the abundance of unoccupied housing is minimal (confirming
the tourist effect on the majority of housing not occupied permanently). The results for Vigo
were far from those predicted, the change of net new housing is much lower than the entire
EA; and although the population increase in the Vigo area is also less, the lack of
unoccupied housing and the actual propensity to invest in housing should be sufficient to
cause major growth.
The dynamism of the urban areas in the Atlantic Axis
Until now we have had the opportunity to evaluate the initial and final stages of the housing market
in the cities in the Atlantic Axis; but the evidence of the development and posterior bursting of the
huge real estate bubble in Spain (García Montalvo, 2009) suggests analyzing the trajectory of the
housing market throughout the first years of the twenty-first century. With this objective we
represent the corresponding curves to housing starts, work licenses and transactions (discontinuous,
continuous, and dotted lines, respectively), indicated in relation to the base year of 2001 for the first
two and 2004 for the third (Figure 3).
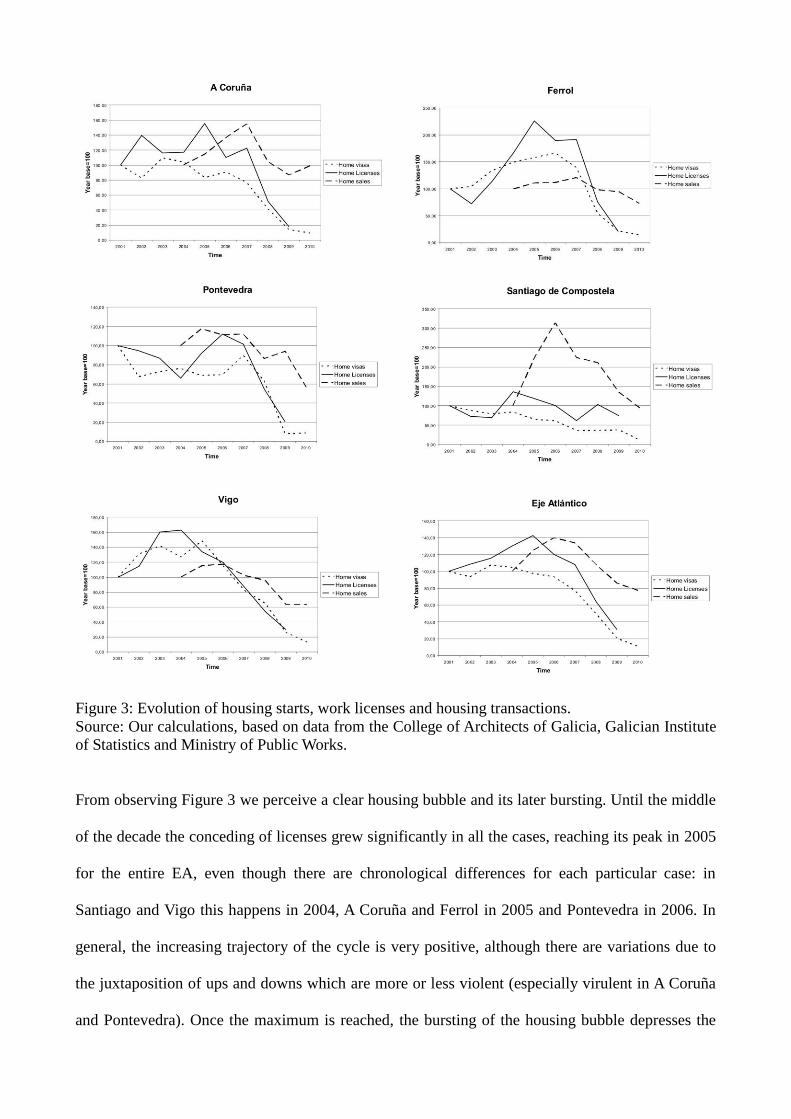
Figure 3: Evolution of housing starts, work licenses and housing transactions.
Source: Our calculations, based on data from the College of Architects of Galicia, Galician Institute
of Statistics and Ministry of Public Works.
From observing Figure 3 we perceive a clear housing bubble and its later bursting. Until the middle
of the decade the conceding of licenses grew significantly in all the cases, reaching its peak in 2005
for the entire EA, even though there are chronological differences for each particular case: in
Santiago and Vigo this happens in 2004, A Coruña and Ferrol in 2005 and Pontevedra in 2006. In
general, the increasing trajectory of the cycle is very positive, although there are variations due to
the juxtaposition of ups and downs which are more or less violent (especially virulent in A Coruña
and Pontevedra). Once the maximum is reached, the bursting of the housing bubble depresses the
conceding of licenses with strong decreases in all cases, with the exception of Santiago de
Compostela.
However, for the housing starts, and without refuting the general idea of the rise and later fall of the
real estate market, the contrasts are less pronounced due to the fact that they include categories that
did not suffer the consequences of the crisis so drastically (restored houses); and that even point to a
certain recuperation of this market (A Coruña, Pontevedra and Vigo registered in 2010 a rate of
decline less than previous years), that could anticipate an incipient recuperation of the housing
sector.
The information relative to demand, the housing transaction curve, reflects the new formation of a
real estate bubble: on a general scale we contemplate a maximum around 2006, initiating a clearly
descending trajectory, although it slowed down in 2010.
With regard to cities, Santiago de Compostela and Vigo reached the culminating moment when
referring to buying and selling in the same year as the whole of the urban areas; conversely the rest
were delayed until 2007. We can see, individually, except in Ferrol and Pontevedra, the easing of
the crisis in the 2010 sales, which in the case of A Coruña are turned into growth and in that of Vigo
the stagnation of this variable.
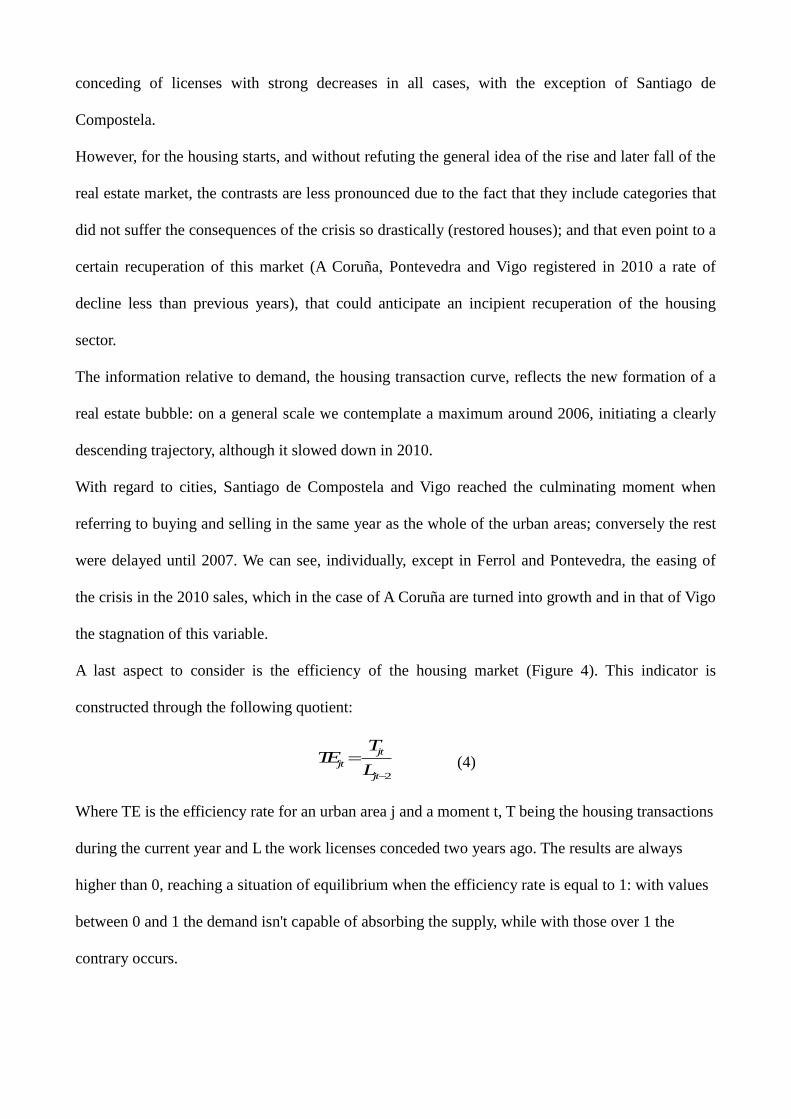
A last aspect to consider is the efficiency of the housing market (Figure 4). This indicator is
constructed through the following quotient:
2
jt
jt
jt
TTE
L
(4)
Where TE is the efficiency rate for an urban area j and a moment t, T being the housing transactions
during the current year and L the work licenses conceded two years ago. The results are always
higher than 0, reaching a situation of equilibrium when the efficiency rate is equal to 1: with values
between 0 and 1 the demand isn't capable of absorbing the supply, while with those over 1 the
contrary occurs.
Figure 4: Evolution of the efficiency rate in Galician urban areas.
The efficiency of real estate development has been characterized by the continuous accumulation of
surplus. For the total of these five urban areas in no year between 2004 and 2010 has the entire
number of houses finished in each exercise been sold, except in 2010, with the construction sector
completely depressed, the level where supply and demand are equal was approached. Along with
2010 the best years were 2005 and 2006, in clear effervescence of the housing bubble, 2008 and
2009 being the years in which the number of sales hardly made up two-thirds of the finished
houses.
In the urban areas the ones that maintained a higher grade of efficiency were Pontevedra and
Santiago de Compostela, accumulating in both cases the highest number of years with rates higher
or near to one. On the other hand, Coruña and Vigo accumulated large housing stocks, apart from
the exceptional 2010; offering between the two associated discrepancies the procyclical behavior in
A Coruña as opposed to the countercyclical behavior shown by Vigo.
Ferrol is a different case. In the preceding pages we refer to the persistent incongruity between an
urban area in marked socio-economic crisis and dynamic real estate activity. The series of the
efficiency evaluation plays deeper into this paradox: since 2004, a moment in which the supply was
incapable of satisfying the demand, the efficiency level did not stop becoming worse, being unable
to absorb since 2007 even half of the houses put up for sale.
Conclusions
The urban areas of the Atlantic Axis have undergone the formation of a strong construction boom in
the first decade of this century, until 2007 housing reached unprecedented figures, but it has also
undergone a serious recession that has left the estate sector in an unprecedented crisis.
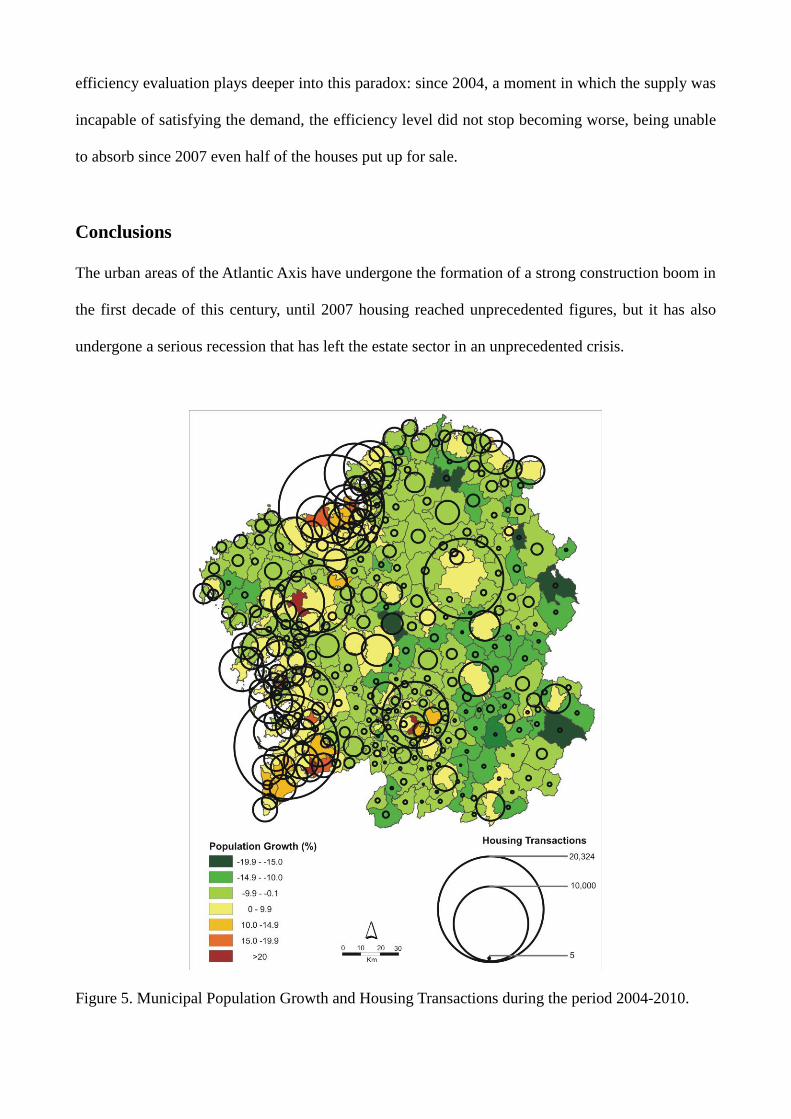
Figure 5. Municipal Population Growth and Housing Transactions during the period 2004-2010.
However, this rise and fall in housing has not been homogeneous in all urban areas on the Galician
Atlantic coast. In some cities the real estate market has been extremely dynamic (A Coruña,
Pontevedra, Santiago de Compostela), strengthening its economic dynamism throughout this
decade. In turn, others have taken different paths and with varying consequences: In Ferrol, in long-
term crisis, the sector initially remained disconnected from the urban reality, but it has ended up
converging with its socioeconomic context, leaving in its wake a large stock of unwanted housing.
The other exception is Vigo, the biggest city in Galicia and the one in need of new housing, yet
however, with the lowest dynamism in residential edification.
On the other hand, there are municipalities in Galicia that are not outstanding areas in the urban
hierarchy but can be seen to be taking a leading role due to their development in urban contribution.
They are usually coastal areas where building has increased by 100% and even 200%, so that, in
2007 the building of 800,000 homes on the coast was planned (Greenpeace, 2010). Among the most
affected municipalities from this urban boom stand out Foz, Ribadeo and Barreiros (in the northeast
of Galicia). In 2009 in Barreiros there were more constructions on hold than running. Also, if there
were 2,797 homes in 2001, 1,327 were taken as a second home. It must also be added that in the last
ten years the council has given licenses to 6,000 homes to be built when the council holds 283 less
inhabitants.
We can conclude that Galicia is not excluded from the urban boom the country is involved in, the
profit made by the construction sector is of the utmost importance and the planning, harmonious
growth and protection of natural and scenic areas take a back seat and are therefore relegated to a
second level.
Bibliography
BURRIEL DE ORUETA, E. (2008), “La “Década Prodigiosa” del urbanismo español (1997-
2006)”. Scripta Nova. Revista Electrónica de Geografía y Ciencias Sociales, vol. XII (270).
Available at http://www.ub.edu/geocrit/sn/sn-270/sn-270-64.htm.
CUADRADO ROURA, J. R. –Dir.- (2011), “El sector construcción en España. Proyecciones 2011-
2012”. Madrid, Colegio Libre de Eméritos. Available at
http://www.colegiodeemeritos.es/docs/repositorio//es_ES//cuadernos del colegio/el sector
construcción en España (final).pdf.
DÍAZ ORUETA, F. (2006), “Urbanismo neoliberal: el ejemplo valeenciano”. Pensamiento Crítico.
Available at http://www.pensamientocritico.org
GARCÍA MONTALVO, J. (2001), “Un análisis empírico del crecimiento del precio de la vivienda
en las comunidades autónomas españolas”. Revista del Instituto Valenciano de Economía, 2: 117-
136.
GARCÍA MONTALVO, J. (2007), Algunas consideraciones sobre el problema de la vivienda en
España. Papeles de economía española, 113: 138-155.
GARCÍA MONTALVO, J. (2009), Financiación inmobiliaria, burbuja crediticia y crisis financiera:
lecciones a partir de la recesión de 2008-2009. Papeles de economía española, 122: 66-87.
GARRIGA, C. (2010), “El papel de la construcción en el auge y la caída de los precios de la
vivienda en España”. In Bentolila, C., Boldrin, M., Díaz-Giménez, J. y Dolado, J. J. (Coords.), La
crisis de la economía española, 274-301. Madrid, Fedea.
GONZÁLEZ RODRÍGUEZ, J. J. (2008), Tres décadas de cambio social en España. Madrid,
Alianza Editorial.
MINISTRY OF PUBLICS WORK (2010), Informe sobre el stock de vivienda nueva. Madrid.
ORTEGA DELGADO, M. (2001), “Las ciudades y los sistemas urbanos. Una visión transnacional”.
In Ordenación del territorio, política regional, medio ambiente y urbanismo. Congreso
Internacional de ordenación del Territorio. Gijón.
NAREDO PÉREZ, J. M. (2004), “Perspectivas de la vivienda”. Información Comercial Española,
815: 143-154.
PALACIOS GARCÍA, A. J. (2008), “Fuentes estadísticas para la vivienda en España: un obstáculo
para el diseño de la política de vivienda”. Scripta Nova. Revista Electrónica de Geografía y
Ciencias Sociales, vol. XII (270). Available at http://www.ub.es/geocrit/sn/sn-270/sn-270-38.htm.
REDONDO LÓPEZ, J. A. y LÓPEZ PENABAD, Mª. C. (2001), “A demanda de crédito
hipotecario en España: especial referencia á situación galega”. Revista de Economía Galega, 10 (2):
107-124.
SMITH, N. (2009), ¿Ciudades después del Neoliberalismo?. Barcelona, MACBA.
VÉRGES, R. (2007), “Burbujas inmobiliarias en EEUU y SO de Europa”. Available at
http://www.ricardoverges.com/pdf/Articulo2007Verges.pdf
VINUESA ANGULO, J. (2008), “La vivienda vacía en España: un despilfarro social y territorial
insostenible”. Scripta Nova. Revista Electrónica de Geografía y Ciencias Sociales, vol. XII (270).
Available at http://www.ub.es/geocrit/sn/sn-270/sn-270-39.htm.